Article

Experimental Investigation and Modeling of High Ductile FRP-Confined Rectangular Short Concrete Columns Under Axial Compression

1
School of Mechanics and Engineering Science, Shanghai University, Shanghai 200444, China
2
School of Civil Engineering and Mechanics, Yanshan University, Qinhuangdao 066004, China
*
Authors to whom correspondence should be addressed.
Buildings 2026, 16(10), 1942; https://doi.org/10.3390/buildings16101942
Submission received: 5 April 2026 / Revised: 8 May 2026 / Accepted: 12 May 2026 / Published: 13 May 2026
(This article belongs to the Section Building Structures)

Abstract

When conventional FRP composites are applied to confine rectangular concrete columns, strength enhancement is often limited due to the highly non-uniform lateral expansion of sections with a large aspect ratio (e.g., 2.0). High ductile FRP (HDFRP), a composite of glass fibers and polypropylene (PP) fibers, improves column strength while alleviating corner stress concentration in square sections, demonstrating its promising application potential for strengthening members with rectangular cross-sections. Yet existing studies on HDFRP have primarily focused on circular and square sections. To explore its applicability to rectangular cross-sections, this study conducted axial compression tests on HDFRP-confined rectangular short concrete columns (HDFRP-CRCC), investigating the effects of aspect ratio, corner radius, and FRP thickness on their mechanical behavior. The test results demonstrate that the HDFRP composite material can significantly enhance the overall strength and axial deformability of rectangular concrete columns, thereby effectively overcoming the limited strength enhancement associated with conventional FRP systems. Based on the experimental results, a design-oriented model is developed to offer theoretical support for the application of HDFRP in strengthening rectangular frame structures.

1. Introduction

Fiber-reinforced polymer (FRP) confinement has emerged as a prominent technique for strengthening and enhancing the performance of existing concrete structures, due to its exceptional effectiveness and practicality [1,2,3,4,5,6,7,8]. In areas prone to earthquakes, this technology can prevent the brittle failure of reinforced concrete structures that do not meet current seismic safety standards, thereby significantly enhancing the seismic performance and safety of the structures. To date, extensive systematic research has been conducted on FRP-confined concrete columns. The results indicate that FRP confinement significantly enhances the mechanical properties of both circular and square concrete columns [9,10,11,12,13,14]. For square columns, the strength enhancement ranges from approximately 54% to 108% [15,16,17], while for circular columns, it ranges from 66% to 189% [18,19,20]. In the context of structural retrofitting, the load-bearing capacity and ductility of columns are critical to the overall seismic behavior of buildings. This is particularly relevant for rectangular cross-section columns, which are widely present in existing infrastructure, and therefore research on their strengthening is of significant practical importance [21]. However, the use of conventional FRP (such as carbon FRP and glass FRP) to strengthen rectangular concrete columns leads to only a very limited increase in strength. Especially when the cross-sectional aspect ratio reaches 2.0, no significant strength gain is observed in FRP-CRCC [22,23]. Even with the application of large-rupture-strain FRP (e.g., polyethylene terephthalate FRP), after a certain strength increase is achieved, adding more FRP layers yields only a limited improvement in column strength (about 40%) [24]. Moreover, this issue is further exacerbated by an increase in concrete strength grade, as conventional FRP provides virtually no strength gain for high-strength concrete specimens with an aspect ratio of 2.0 [25], thereby restricting its broad adoption in engineering strengthening applications.
Hitherto, relatively few experimental studies have been reported on FRP-confined rectangular short concrete columns. Notable contributions in this area include Hany [26], Youssef [27], and Lam and Teng [28], who have conducted axial compression tests on conventional FRP-confined rectangular concrete columns. However, the number of rectangular specimens in these studies was relatively limited, and to highlight the strengthening effects, researchers have generally restricted the cross-sectional aspect ratio to within 1.5. In contrast, studies on specimens with an aspect ratio of 2.0 are relatively scarce, and the corresponding strength improvements tend to be modest [29]. For instance, Wu and Wei [22] conducted axial compression tests on CFRP-confined rectangular columns and discovered that when one or two layers of CFRP were employed to reinforce rectangles with an aspect ratio of 2.0, strength enhancements were recorded at 10% and 37%, respectively—significantly lower than the gains observed in circular or square cross-sectioned columns. Shehata et al. [23] conducted reinforcement tests using CFRP on four rectangular short concrete columns with an aspect ratio of 2.0, reporting that the strength increase was only 9% with a single layer. Using PET FRP, Saleem et al. [24] reinforced nine rectangular short concrete columns having an aspect ratio of 2.0 and performed axial compression tests to evaluate the influence of chamfer radius and the number of FRP layers on mechanical performance. The results demonstrated that while the strength enhancement from large-rupture-strain FRP was slightly superior to that of CFRP, further increases in FRP layers led to limited improvements—specifically, a 38% strength increase was obtained with three layers of PET FRP.
To overcome the insufficient strength gain provided by conventional FRP for rectangular short concrete columns, especially those with an aspect ratio of 2.0, modified confinement approaches have been investigated by several researchers. Tan et al. [30], for instance, introduced two semi-circular segments at the short ends of the rectangular cross-section to create a capsule-shaped geometry before FRP wrapping. Although this method effectively improved the confinement effect and increased the strength of rectangular specimens, its practical application is hampered by a complex construction process and a significant alteration of the original cross-sectional dimensions. Subsequent studies [31,32,33] adopted a method of evenly distributing FRP anchor rods along the height direction on the long sides of rectangular cross-sections to enhance the confinement effect of FRP sheets on rectangular columns. Although this approach significantly increases the strength gain of FRP-reinforced rectangular concrete columns with an aspect ratio of 2.0, construction requires careful drilling to avoid the internal steel reinforcement of the column. Following the installation of FRP anchor rods, epoxy resin injection and end treatment of the rods are required to secure the anchoring effect. This inevitably leads to a substantial increase in construction difficulty and overall strengthening cost.
To address the above issues, this study adopts the HDFRP material developed in reference [34] to improve the insufficient mechanical performance enhancement of rectangular short concrete columns. This is attributed to the fact that previous studies have thoroughly investigated the mechanical properties and durability of this composite material and have also applied it to the development of strengthening techniques for circular and square concrete columns [34,35,36,37,38]. In those applications, the HDFRP system significantly improved load-bearing capacity and ductility. Furthermore, it mitigated the sensitivity to corner radius and reduced stress concentration at sectional corners—issues that commonly impair the effectiveness of conventional FRP in square columns. For rectangular short concrete columns, the difficulty in achieving significant strength enhancement is primarily attributed to the non-uniform lateral expansion of the column under compression, which induces non-uniform confinement from the FRP material. The HDFRP composite is expected to alleviate this non-uniform confinement issue typically observed in conventional FRP-strengthened rectangular columns.
In summary, through both experimental and theoretical analyses, this paper systematically studies the mechanical properties of HDFRP-confined rectangular short concrete columns and assesses the impact of three variables—cross-sectional aspect ratio, corner radius, and HDFRP thickness—on the strengthening performance. The results indicate that, compared with conventional FRP-strengthened rectangular short concrete columns, the HDFRP system significantly enhances the load-bearing capacity of rectangular short concrete columns with an aspect ratio of 2.0 (by up to 109%), while also improving specimen ductility (with an ultimate strain of approximately 0.19). Subsequently, a constitutive model was developed based on the experimental data of this study, capable of accurately describing the complete stress–strain curve behavior of HDFRP-confined rectangular short concrete columns. In addition to its significance in advancing low-cost, high-performance, and easy-to-construct fiber-reinforced concrete technology, this research provides a new technical approach for sustainable infrastructure construction. It is especially suitable for strengthening structures in resource-limited regions and carries important theoretical value and broad engineering application prospects.

2. Experimental Program

2.1. Specimen Preparation and Design

This study aims to investigate the influence of three key parameters—cross-sectional aspect ratio, corner radius, and thickness of HDFRP—on the compressive behavior of HDFRP-confined rectangular short concrete columns. Accordingly, the specimen design was systematically structured around these variables. Two primary specimen dimensions were adopted, with length, width and height measuring 150 mm × 100 mm × 300 mm and 200 mm × 100 mm × 300 mm, corresponding to aspect ratios of 1.5 and 2.0, respectively (marked as A1.5 and A2.0, where “A” represents the aspect ratio of the specimen’s cross-section). To examine the effect of corner radius on compressive performance, each group was further divided into three subcategories with corner radii of 0 mm, 20 mm and 30 mm, labeled as r0, r20 and r30 (where “r” indicates the corner radius). This resulted in six distinct basic specimen types, the detailed dimensions of which are summarized in Table 1. Each basic specimen type was confined using two different thicknesses of HDFRP composites, designated as 6PP6G6PP and 10PP8G10PP, leading to a total of 12 specimen configurations—combinations of geometry and HDFRP thickness. Two duplicate specimens were fabricated for each configuration, resulting in a total of 24 HDFRP-confined rectangular columns. For unconfined control specimens, considering that the axial compressive strength of unconfined concrete is not significantly influenced by corner radius [24], two plain concrete rectangular columns were prepared for each cross-sectional aspect ratio group, yielding four unconfined control specimens in total. Additionally, to expand the horizontal comparative analysis between different cross-sectional aspect ratios, four square concrete specimens with dimensions of 150 mm × 150 mm × 300 mm (aspect ratio 1.0, labeled A1.0) were fabricated. Among these, two were confined with 10PP8G10PP hybrid HDFRP jackets, and the remaining two served as unconfined controls. A complete list of specimen label codes and detailed information is provided in Table 1.
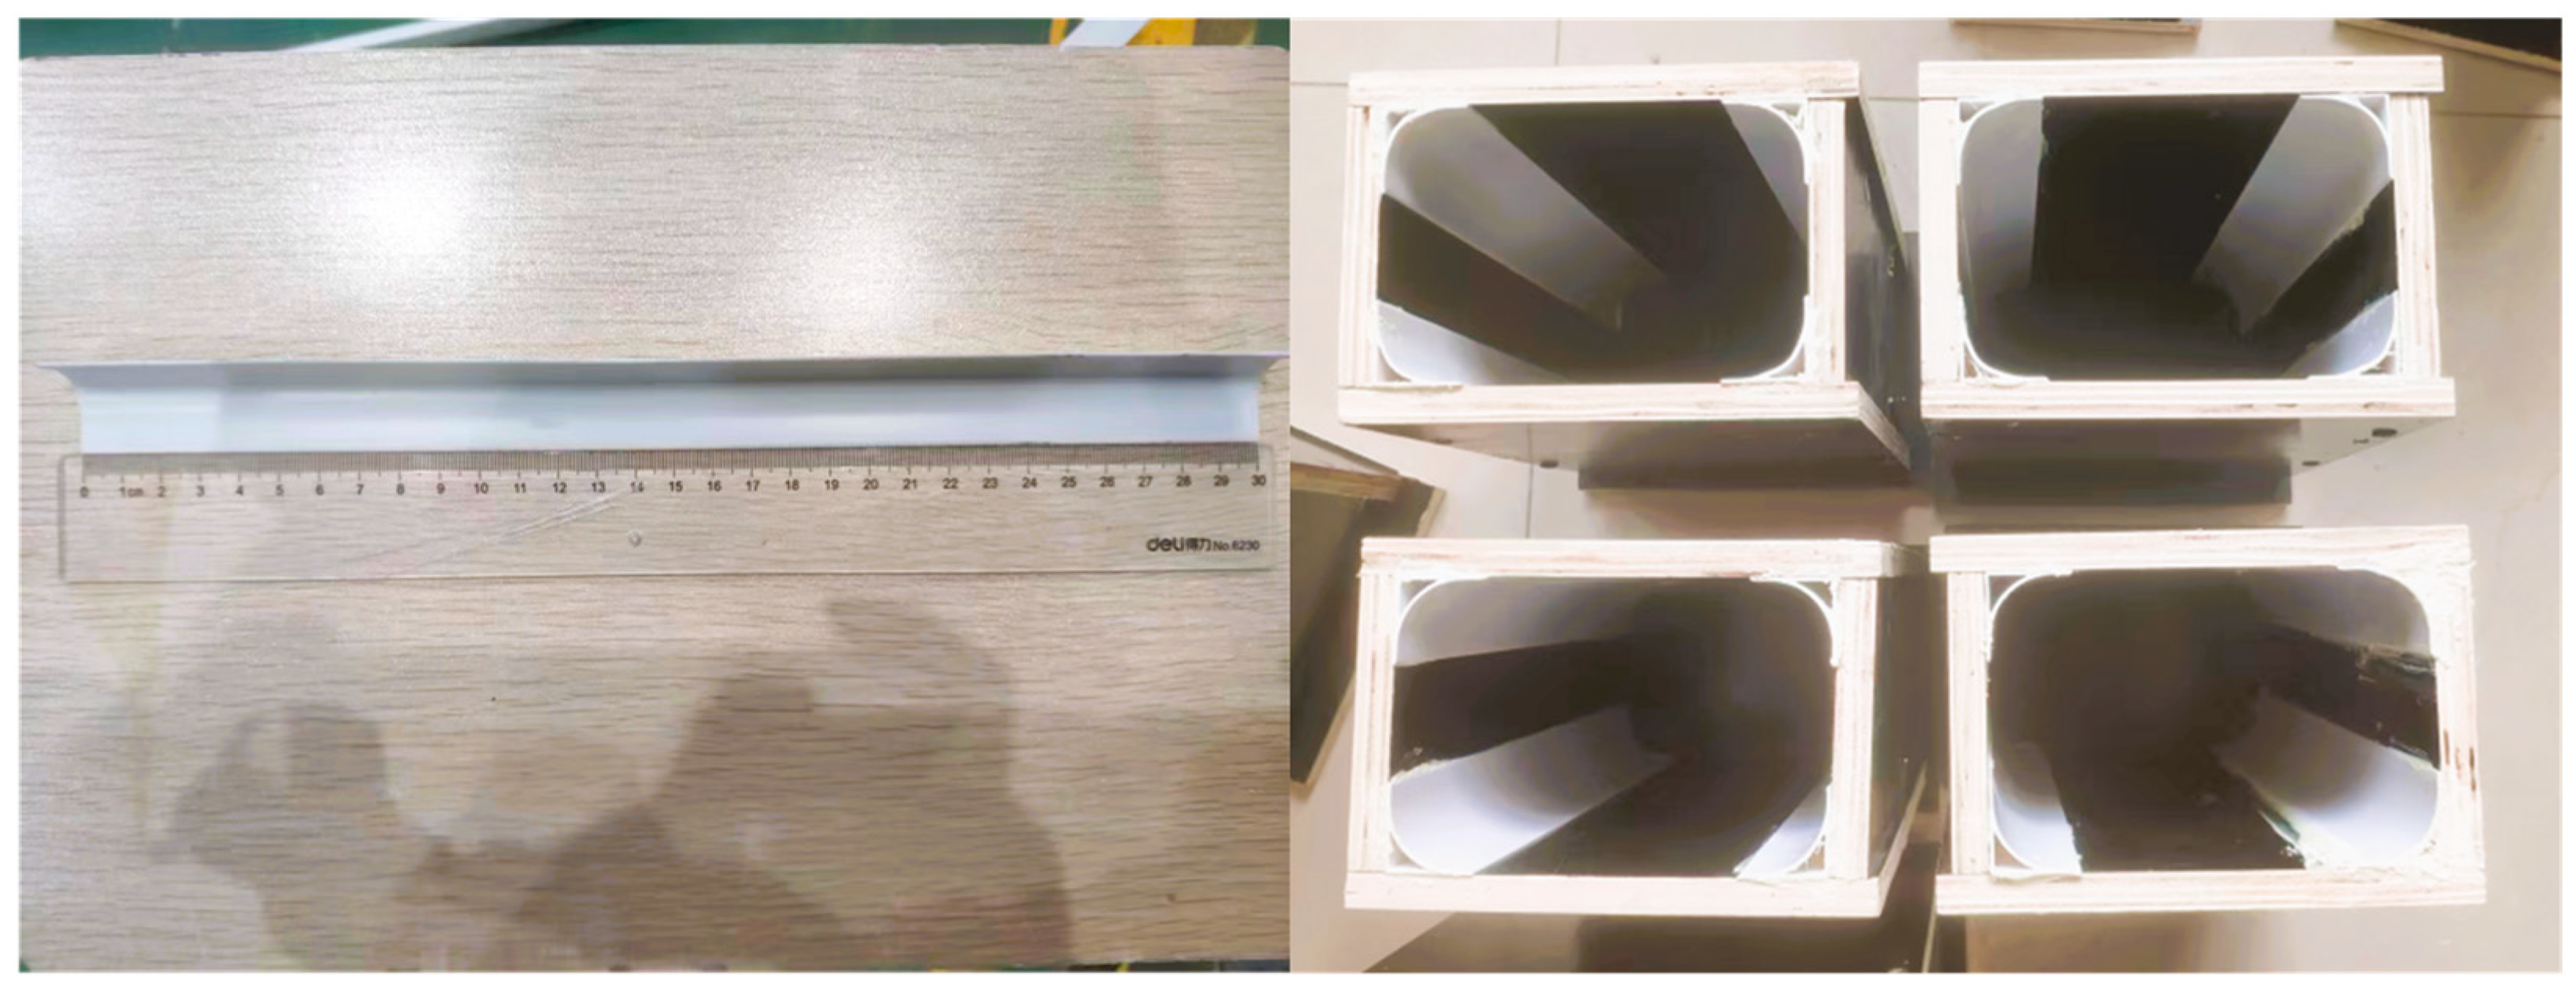
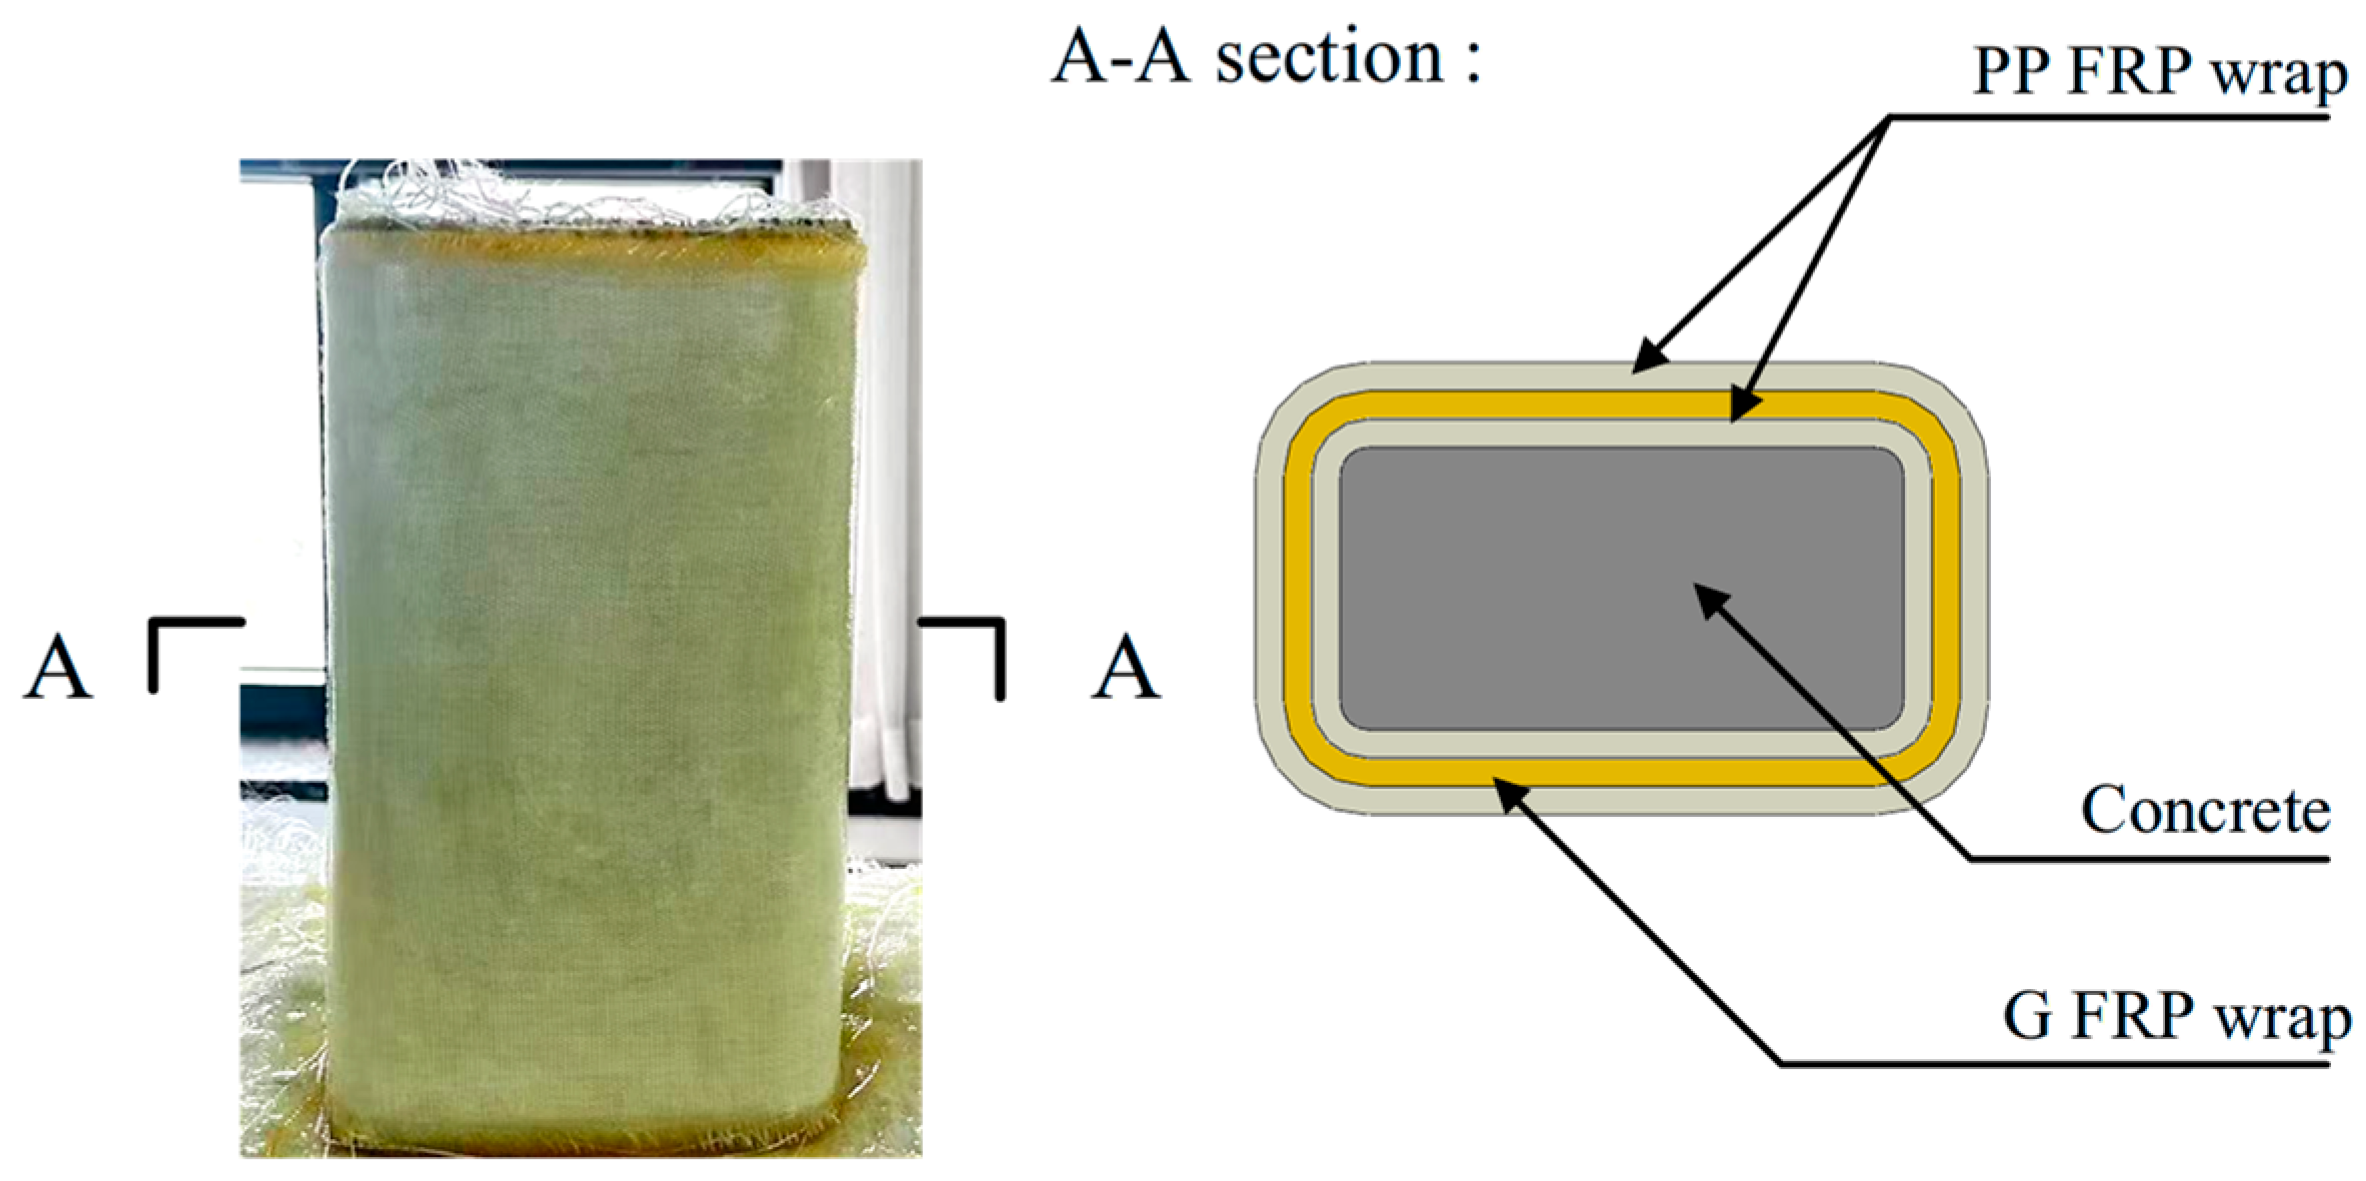
The molds were fabricated using wooden formwork, with internal clear dimensions tailored to the design dimensions of the concrete columns. Chamfer strips corresponding to the specified corner radii were cut to the same height as the mold and subsequently bonded to the four inner corners of the mold cavity using high-strength woodworking adhesive. The completed physical mold is shown in Figure 1. Prior to specimen fabrication, the outer surface of each rectangular short concrete column was smoothed with sandpaper, rinsed with clean water to remove loose dust, and allowed to air-dry. Subsequently, the columns was wrapped with a hybrid composite consisting of interlayer-mixed polypropylene (PP) fibers and glass fibers [34]. A well-established wet lay-up process was adopted for the wrapping procedure, with detailed steps available in reference [36]. To ensure the mechanical performance of the HDFRP, the epoxy resin should fully impregnate the fiber fabrics and be uniformly distributed over their surfaces during the wrapping process [39]. The lap lengths of the glass fiber fabric and the PP fiber fabric were set at 150 mm and 200 mm, respectively [40]. This manufacturing strategy significantly enhances the interfacial bond strength between the GFRP and PP FRP layers, thereby forming an integrated and synergistic composite system that functions both as a protective shell and as an effective confinement mechanism for the column. The prepared specimen is presented in Figure 2. In addition, all specimens were reinforced at both top and bottom ends with a 26 mm-wide strip of glass fiber sheet to mitigate potential stress concentration during axial compression testing [41].
The naming rule for specimens is as follows: The specimen label consists of four parts (separated by “-”): The first part describes the designation of the HDFRP used for external wrapping; the second denotes the cross-sectional aspect ratio; the third specifies the corner radius dimension; and the fourth uses Roman numerals “I” and “II” to distinguish between parallel specimens. For example, the label “6PP6G6PP-A1.5-r20-I” refers to a HDFRP-confined rectangular concrete column with an aspect ratio of 1.5, a corner radius of 20 mm, and an external wrap formed by an interlayered hybrid of 12 layers of PP fiber and 6 layers of glass fiber. The suffix “I” identifies it as the first replicate in a set of two parallel specimens.

2.2. Material Properties

Ordinary Portland cement (P.O 32.5) was used as the binder in the concrete mix, with river sand as fine aggregate and natural crushed stone as coarse aggregate. The mix proportions are provided in Table 2. During casting, concrete was placed into the specimen molds and compacted using a vibrating table to ensure proper densification. All specimens were cured under standard conditions for 28 days before subsequent testing. The compressive strength of the concrete was determined in accordance with GB/T 50081–2019 [42], using three 150 mm cubes for testing. The results are summarized in Table 2. To ensure comparability, both unconfined and confined specimens of the same dimensions were tested within the same batch.
Both the glass fiber and PP fiber used in this study are biaxial plain-woven fabrics, with areal densities of 400 g/m2 and 230 g/m2, respectively. The tensile stress–strain behavior of the HDFRP composite, which incorporates the above two fibers, was modeled in accordance with the theoretical framework established in Ref. [34]—which was developed from test results in accordance with ASTM D638-08 [43]. The elastic moduli of the 6PP6G6PP and 10PP8G10PP composites are 29.11 GPa and 24.45 GPa respectively, with corresponding second moduli of 1.24 GPa and 1.31 GPa. Further details regarding the material properties are provided in Ref. [34].

2.3. Instrumentation and Test Set-Up

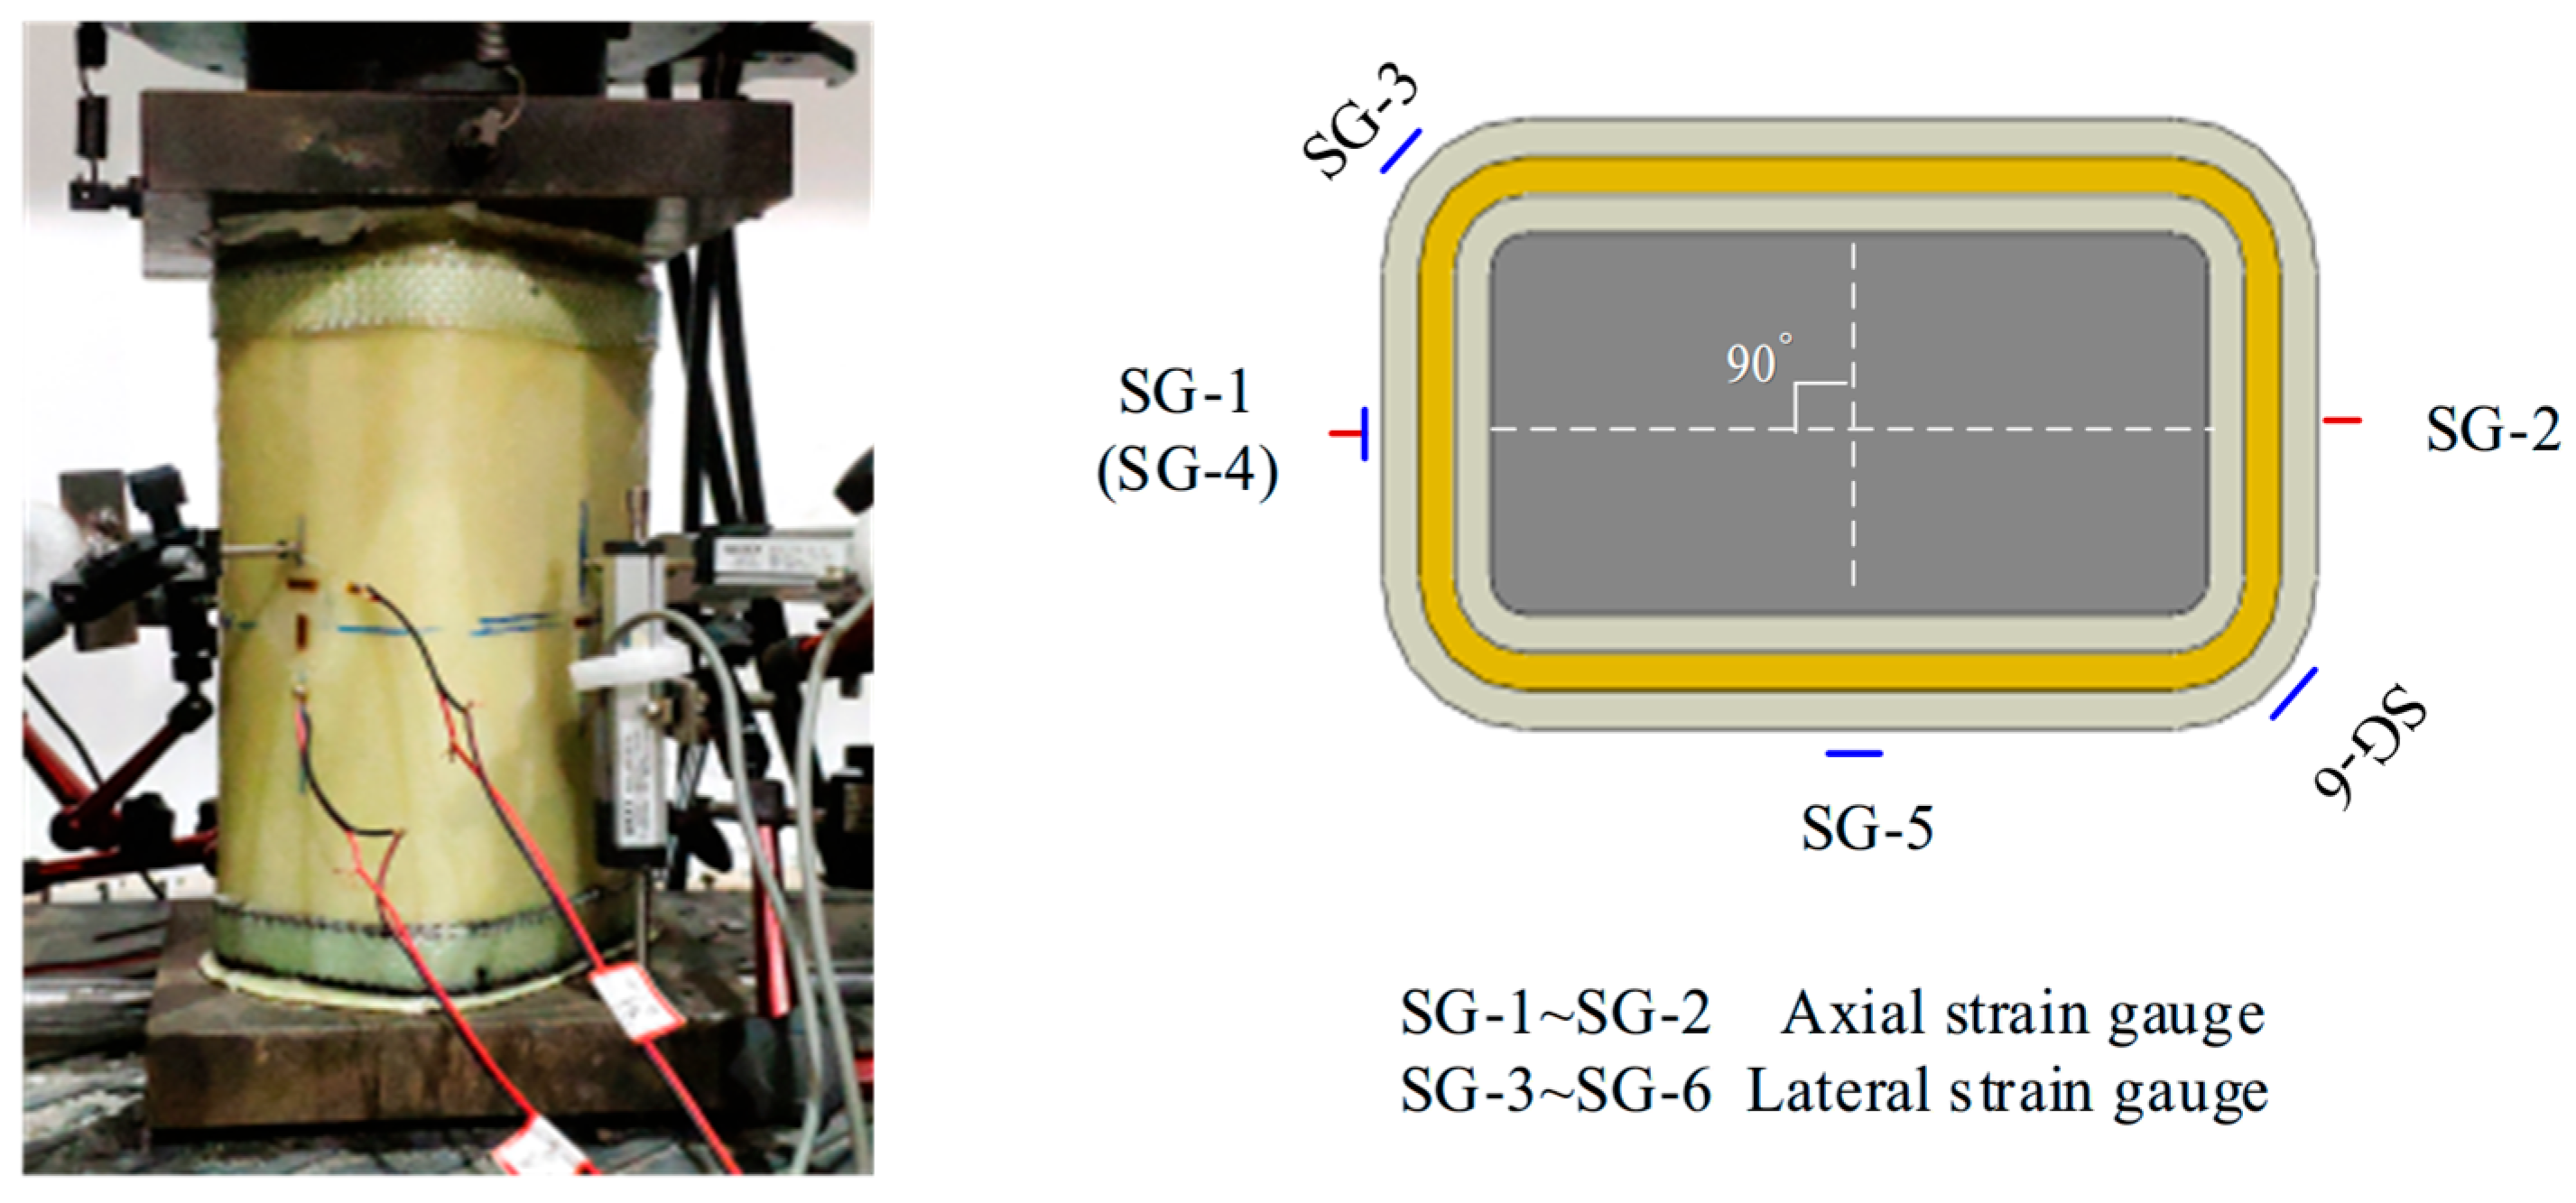
To accurately measure deformation, six strain gauges were mounted at mid-height of each specimen prior to testing. Two strain gauges (SG-1 and SG-2) were vertically bonded on the two shorter side faces of the specimen to monitor the axial strain, and their averaged reading was taken as the axial strain. Meanwhile, to monitor the non-uniform lateral expansion of the rectangular columns, four additional strain gauges were mounted horizontally: two were placed at the corners (SG-3 and SG-6), and the remaining two were positioned at the midpoints of the short and long flat sides (SG-4 and SG-5). The averaged readings of each pair were taken as the lateral strain at the corner and at the flat side, respectively. The specific positions and corresponding identification numbers of these strain gauges are illustrated in Figure 3. All strain gauges used were of identical specification to minimize measurement error, with a base dimension of 14 mm × 4.5 mm, a resistance of 120 Ω, and a sensitivity coefficient of 2.0%. When the strain gauge is damaged, in order to supplement the horizontal and vertical deformation data, six linear variable differential transformers (LVDTS) are arranged around each specimen. Among them, two LVDTS are symmetrically and vertically arranged between the loading plates with the specimen’s centerpiece as the center to measure the total axial deformation of the specimen, while the remaining four LVDTS are horizontally arranged around the specimen. The four LVDTS were oriented perpendicular to each side face and positioned at the center of the respective face to capture the lateral deformation of the specimen. (Due to a subsequent instrument replacement necessitated by scheduling constraints, the limited clearance of the new setup prevented the use of horizontal LVDTs on all sides. Consequently, in later tests, only two LVDTs were retained on the long-side planes to monitor the more pronounced expansion deformation in that direction.)
Prior to testing, the upper surfaces of all specimens were leveled using high-strength gypsum to ensure uniform load distribution. Axial compression tests were conducted using a 200 t servo-hydraulic testing machine (TAW-2000, manufactured by Changchun City Chaoyang Test Instrument Co., Ltd., Changchun, China). The test commenced under force control with an initial preload of 5 kN applied at a rate of 3 kN/s to ensure rapid and secure contact between the specimen and the loading plates. Following this, the control mode was switched to displacement control, and loading continued at 1 mm/min until reaching 100 kN (corresponding to an axial stress of 4–6.6 MPa). Throughout this phase, strain gauge readings were monitored in real-time. Should significant deviations be detected, the specimen surfaces were releveled with thin cardboard shims. Subsequently, loading was resumed under displacement control at 1 mm/min until specimen failure. During the test, a data acquisition system was used to record load and deformation data synchronously at a frequency of 1 Hz throughout the test. The schematic diagram of the compression test setup is shown in Figure 3.

3. Results and Discussion

3.1. Failure Modes

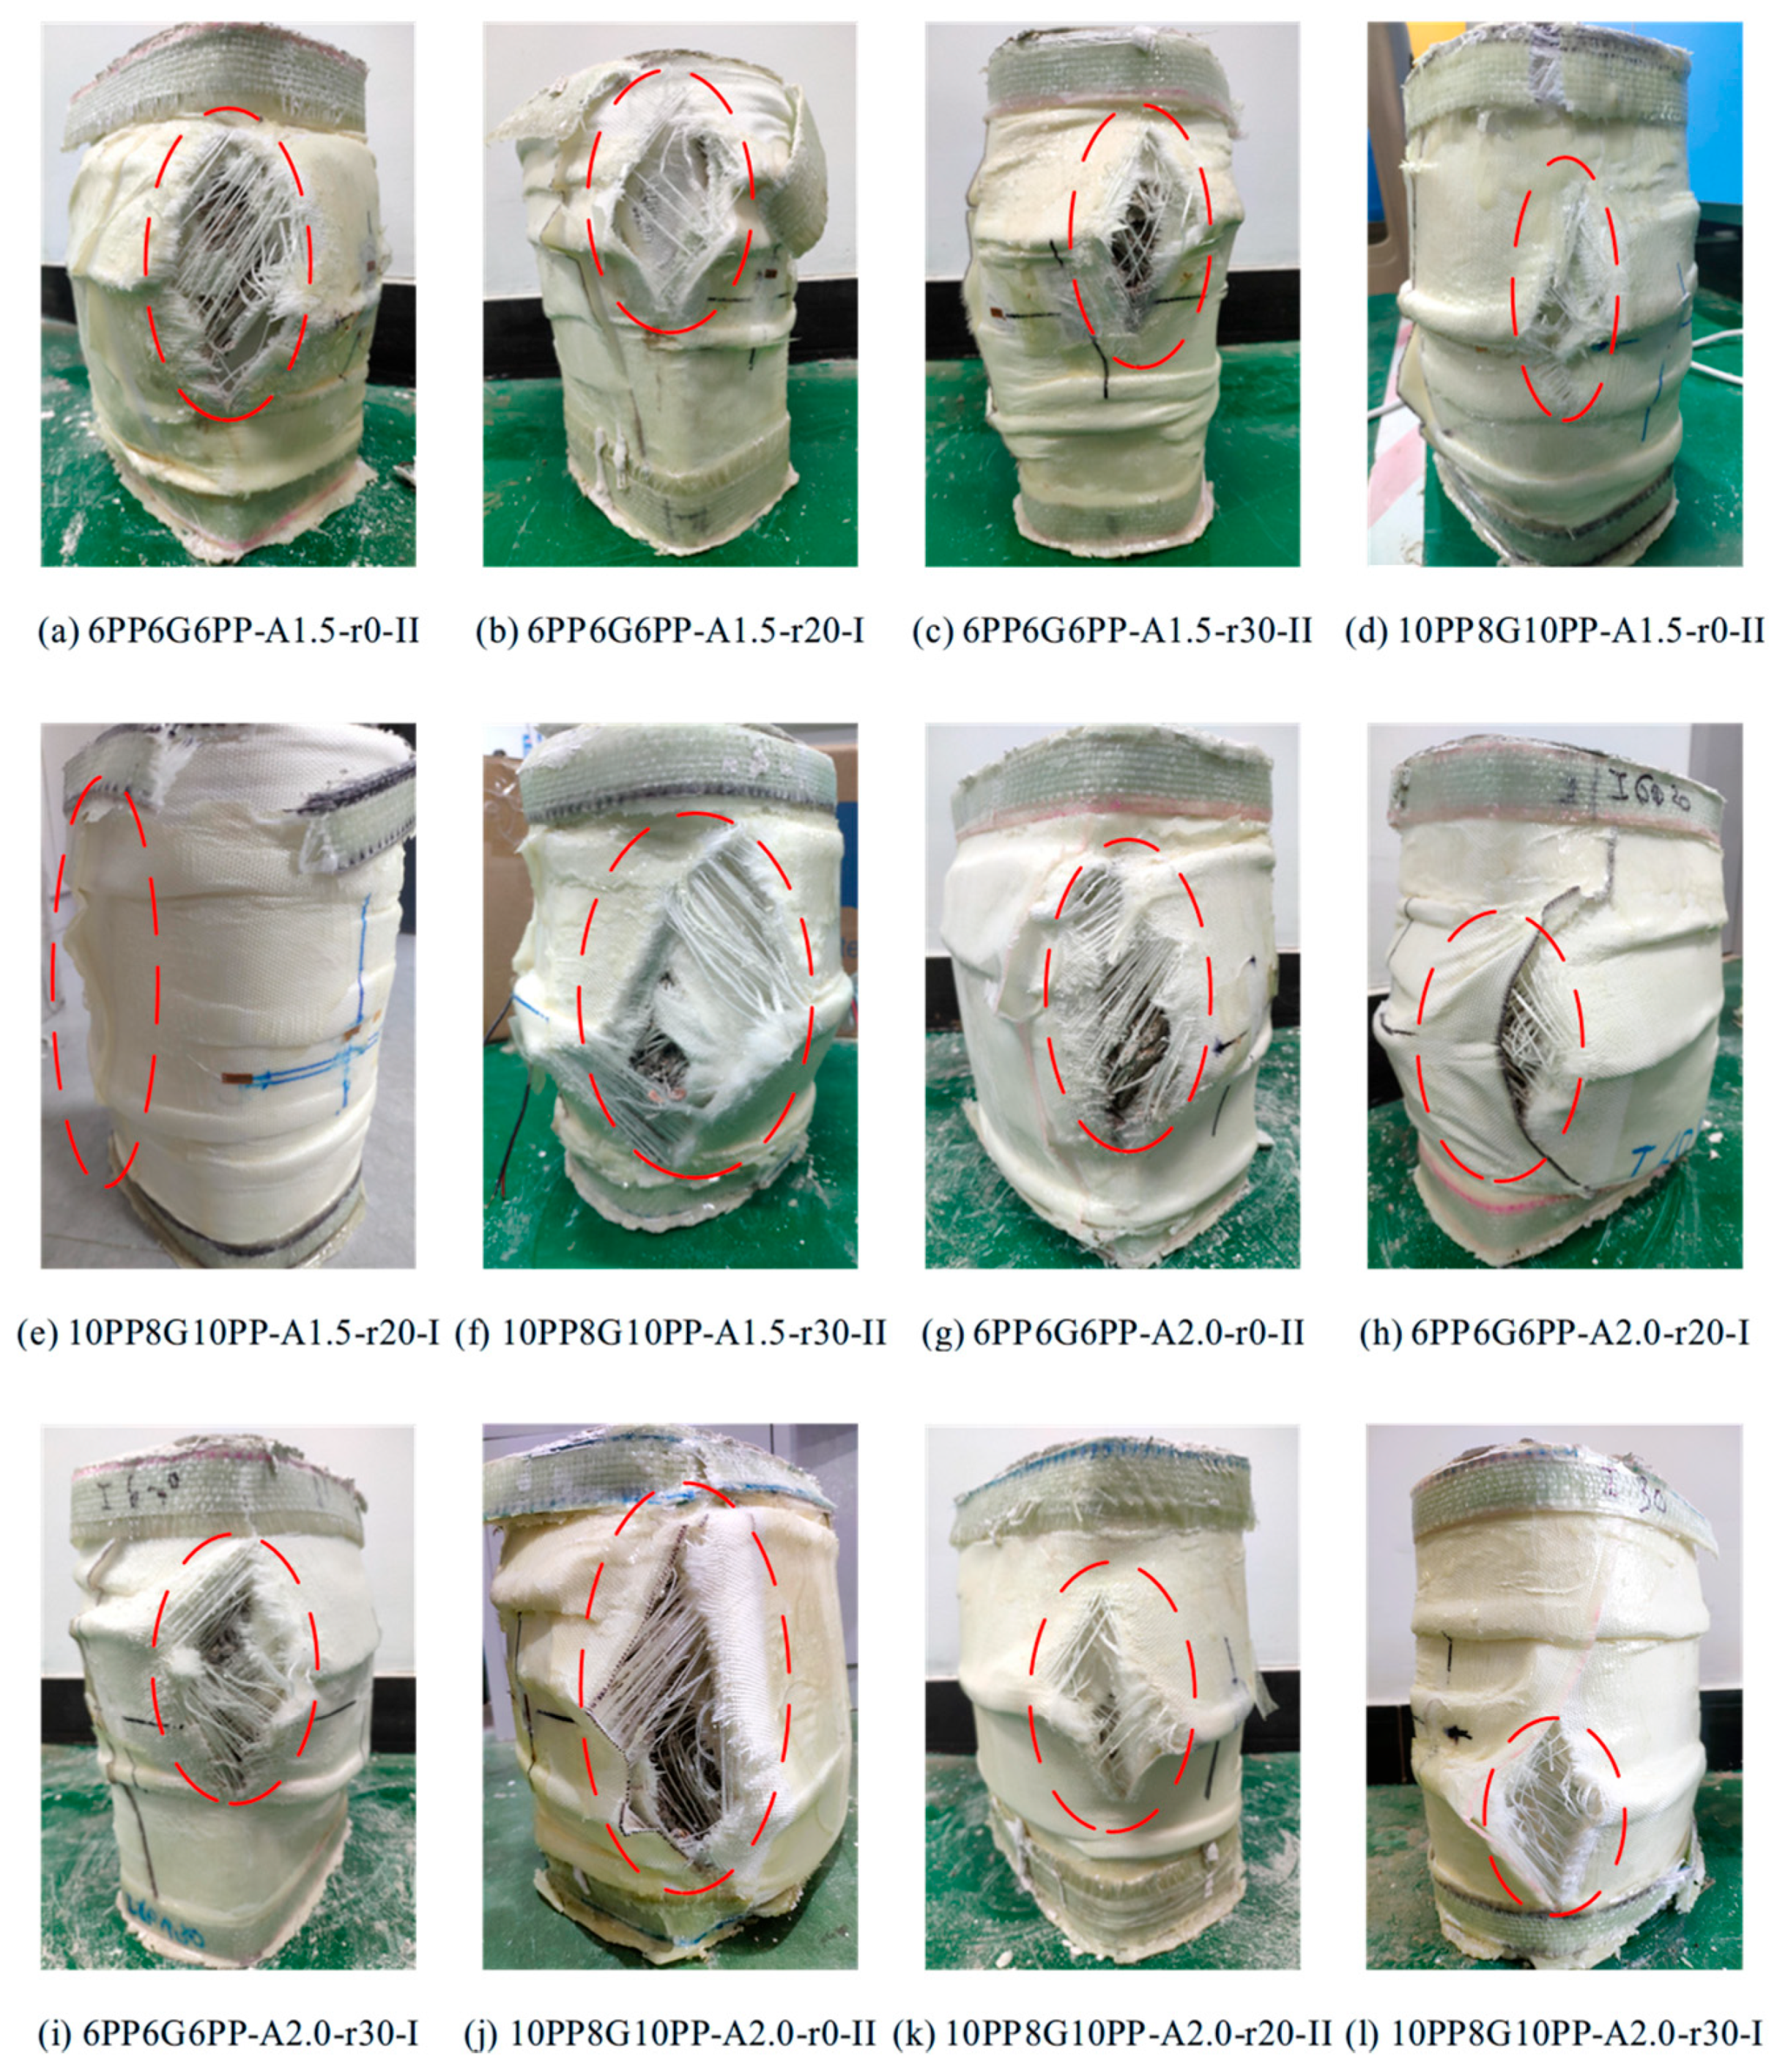
Figure 4 shows the typical failure modes of HDFRP-confined rectangular concrete column specimens, with the final failure points marked by red dashed circles. During the test, as the load increased, the resin matrix on the surface of the specimens continuously cracked and peeled off, accompanied by a slight cracking sound. When the load reached the peak force, a transverse whitish fold suddenly appeared on the specimen surface, accompanied by a loud cracking sound (glass fiber fracture), after which the load began to decrease. As the test proceeded, the load stabilized at a certain level, until the fiber jacket wrapped on the specimen surface was torn into diamond-shaped openings and the internal concrete was crushed, at which point the specimens completely lost their load-bearing capacity.
As shown in Figure 4, HDFRP-confined rectangular concrete column specimens with different aspect ratios (1.5 and 2.0), corner radii (0 mm, 20 mm and 30 mm), and HDFRP thicknesses all failed at the corners (except for specimens 10PP8G10PP-A1.5-r20-I). This pattern confirms significant stress concentration at the corners, aligning with existing studies on non-circular sections reporting pronounced non-uniform expansion in these regions [44]. In the figure, specimens 10PP8G10PP-A1.5-r20-I did not show fiber tearing. This is because in the early stage of the axial loading test, there was concern that if the instrument was subjected to excessive load for a long time and the travel of the loading plate was relatively large, it might cause the instrument to malfunction. Therefore, when loading this group of specimens, the test was stopped whenever the load no longer increased. At this point, debonding occurred at the end of the fiber lap area of the specimen, but the subsequent tests were all loaded until the specimen failed. During the test, some specimens also showed debonding at the end of the lap area, such as 6PP6G6PP-A1.5-r20-I and 10PP8G10PP-A1.5-r0-II, etc. This is because the uneven expansion in the thickness variation area of the constraint layer will cause bending on the fibers at the beginning and end of the fiber lap. This may cause stress concentration at this location [24,45]. All specimens sustained extreme axial deformations at failure. The high-elongation capacity of the fiber reinforcement permitted substantial lateral expansion, leading to a pronounced rounding of the originally rectangular sections. Overall, each specimen demonstrated an ability to withstand high stress concentrations at the corners while exhibiting robust ductile failure performance.

3.2. Axial Compressive Stress–Strain Curves

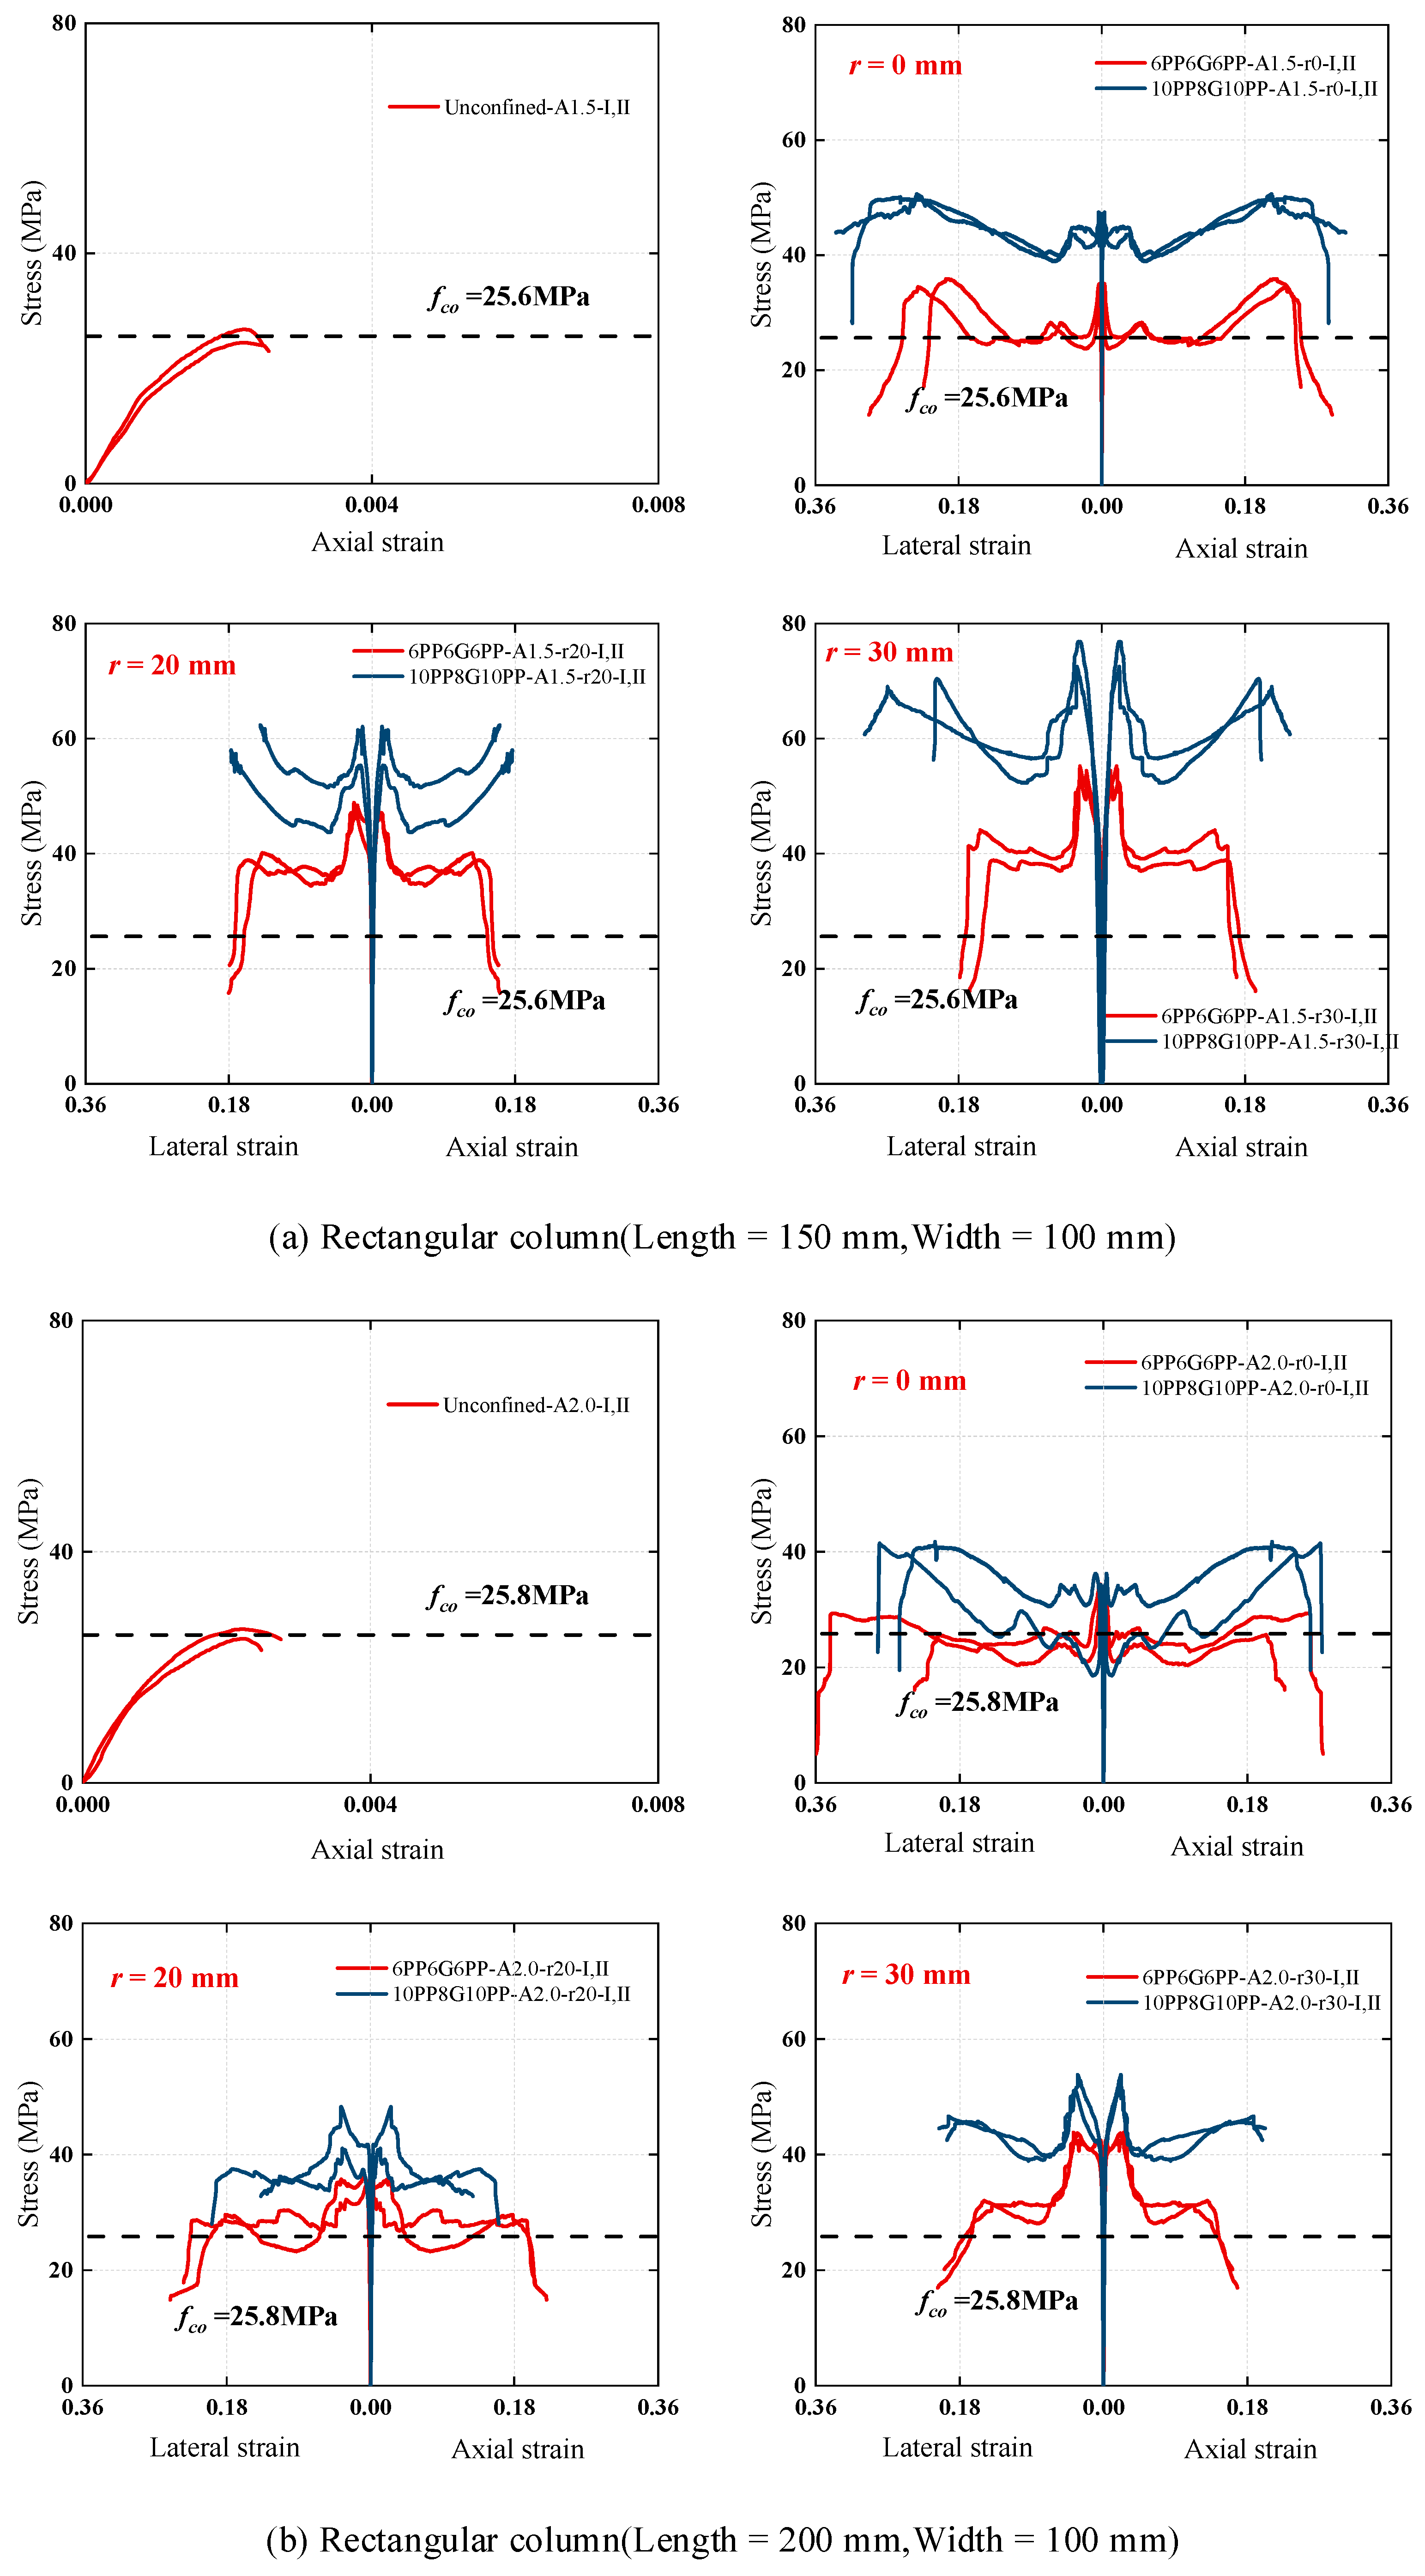
Figure 5 presents the typical axial compressive stress–strain responses of the HDFRP-confined rectangular concrete column and the companion unconfined rectangular concrete column of the same batch and identical dimensions. In this figure, axial and lateral stresses and strains are defined as positive in the compressive and dilational directions, respectively. As the contribution of HDFRP hybrid materials to the axial compressive strength is relatively minor [37], their effect can be neglected in calculating the axial stress of HDFRP-confined rectangular short concrete columns. The axial and lateral strains presented in the curves are derived from combined measurements obtained from electrical strain gauges and linear variable differential transformers (LVDTs). To facilitate the observation of the stress enhancement effect of high ductility FRP composite materials on the specimens, the strength fco of unconfined concrete of the same size as the specimens is marked with black dashed lines in each figure.
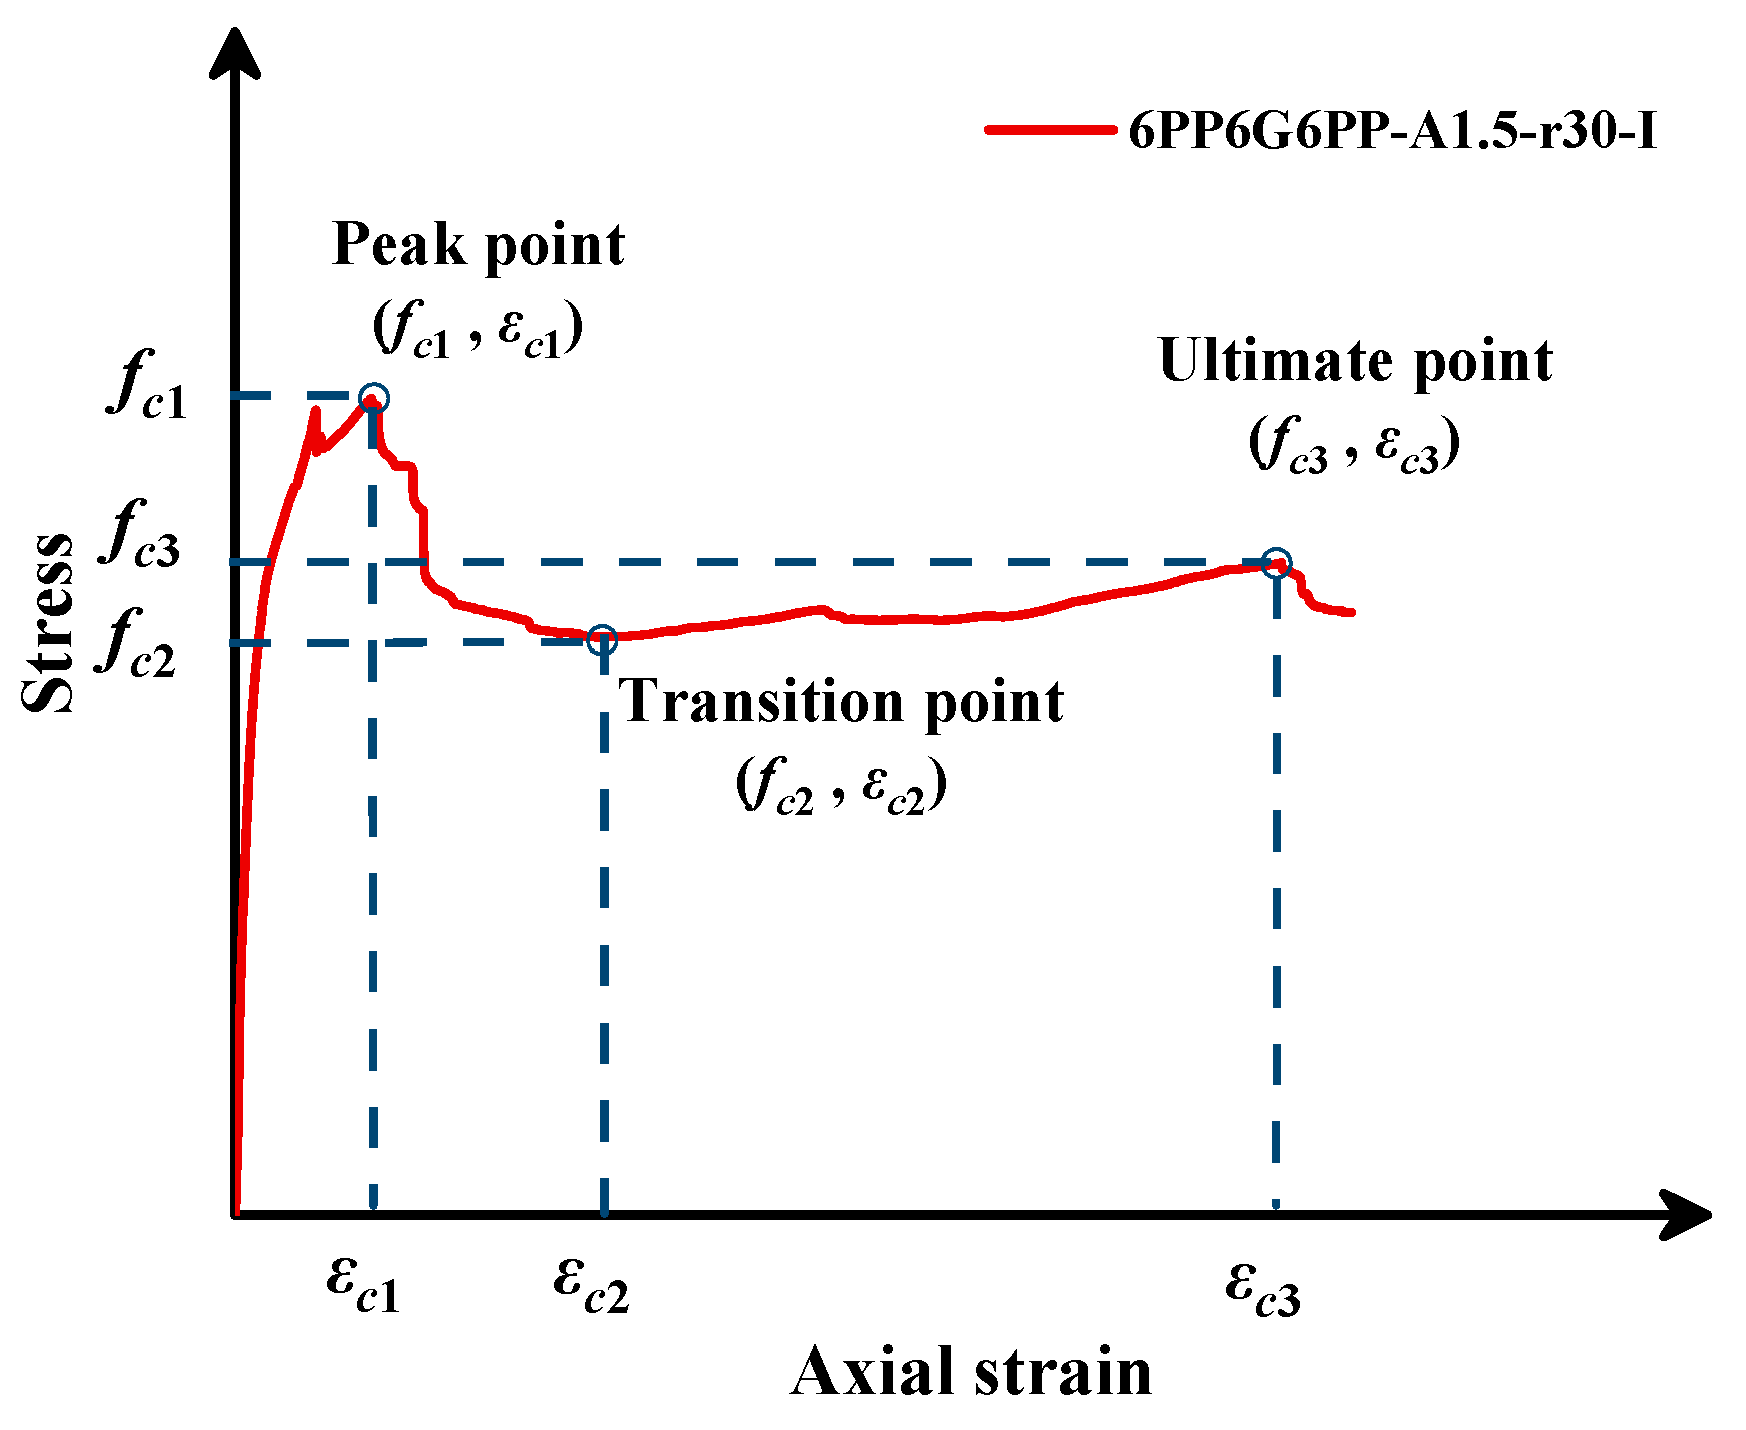
As illustrated in Figure 5, the stress–strain curves reveal close agreement between the two parallel specimens in each test group, which indicates that the specimens have good repeatability. The stress–strain curves of the tested specimens are comparable to those of HDFRP-confined square concrete columns documented in reference [37], and the axial stress–strain response of rectangular short concrete columns comprises three stages: (i) Initial ascending portion. The restraint effect of HDFRP is gradually activated with the increase in lateral strain until the initial peak stress point (fc1, εc1). (ii) Post-peak descending portion: The stress–strain curve exhibits a significant drop, transitioning from the initial peak stress point (fc1, εc1) to a transition point (fc2, εc2). (iii) Secondary ascending portion: With continued increase in lateral deformation, the confinement effect of the HDFRP is re-activated, leading to a linear stress increase until final failure at (fc3, εc3). For ease and clarity of description, the stress–strain curve of specimen 6PP6G6PP-A1.5-r30-I is presented separately in Figure 6, in which the locations of the key characteristic points and their corresponding stresses and strains are explicitly labeled.
As shown in Figure 5, the stress drop in the transition portion is pronounced. For specimens with an aspect ratio of 2.0, the stress retention ratio (fc2/fc1) ranges from approximately 0.63 to 0.77, corresponding to a stress attenuation of 23% to 37%. In existing studies, the stress reduction in PET FRP-confined rectangular concrete column (50–60%) [29] is significantly greater than that of square columns (30–40%) [46] and that of conventional FRP-confined circular concrete columns (20%) [47,48]. Compared with square and circular concrete columns, there is a height non-uniformity in the FRP constraints of rectangular short concrete columns, which limits the effectiveness of conventional FRP materials in sustaining strength enhancement. The stress reduction rates observed in this study for rectangular columns (23–37%) align closely with those previously reported for HDFRP-confined circular columns (18–46%) and square columns (30–47%) [37]. This indicates that HDFRP can address the inferior strength enhancement of conventional FRP when applied to rectangular short concrete columns relative to that achieved for square or circular columns.

3.3. Parameter Research

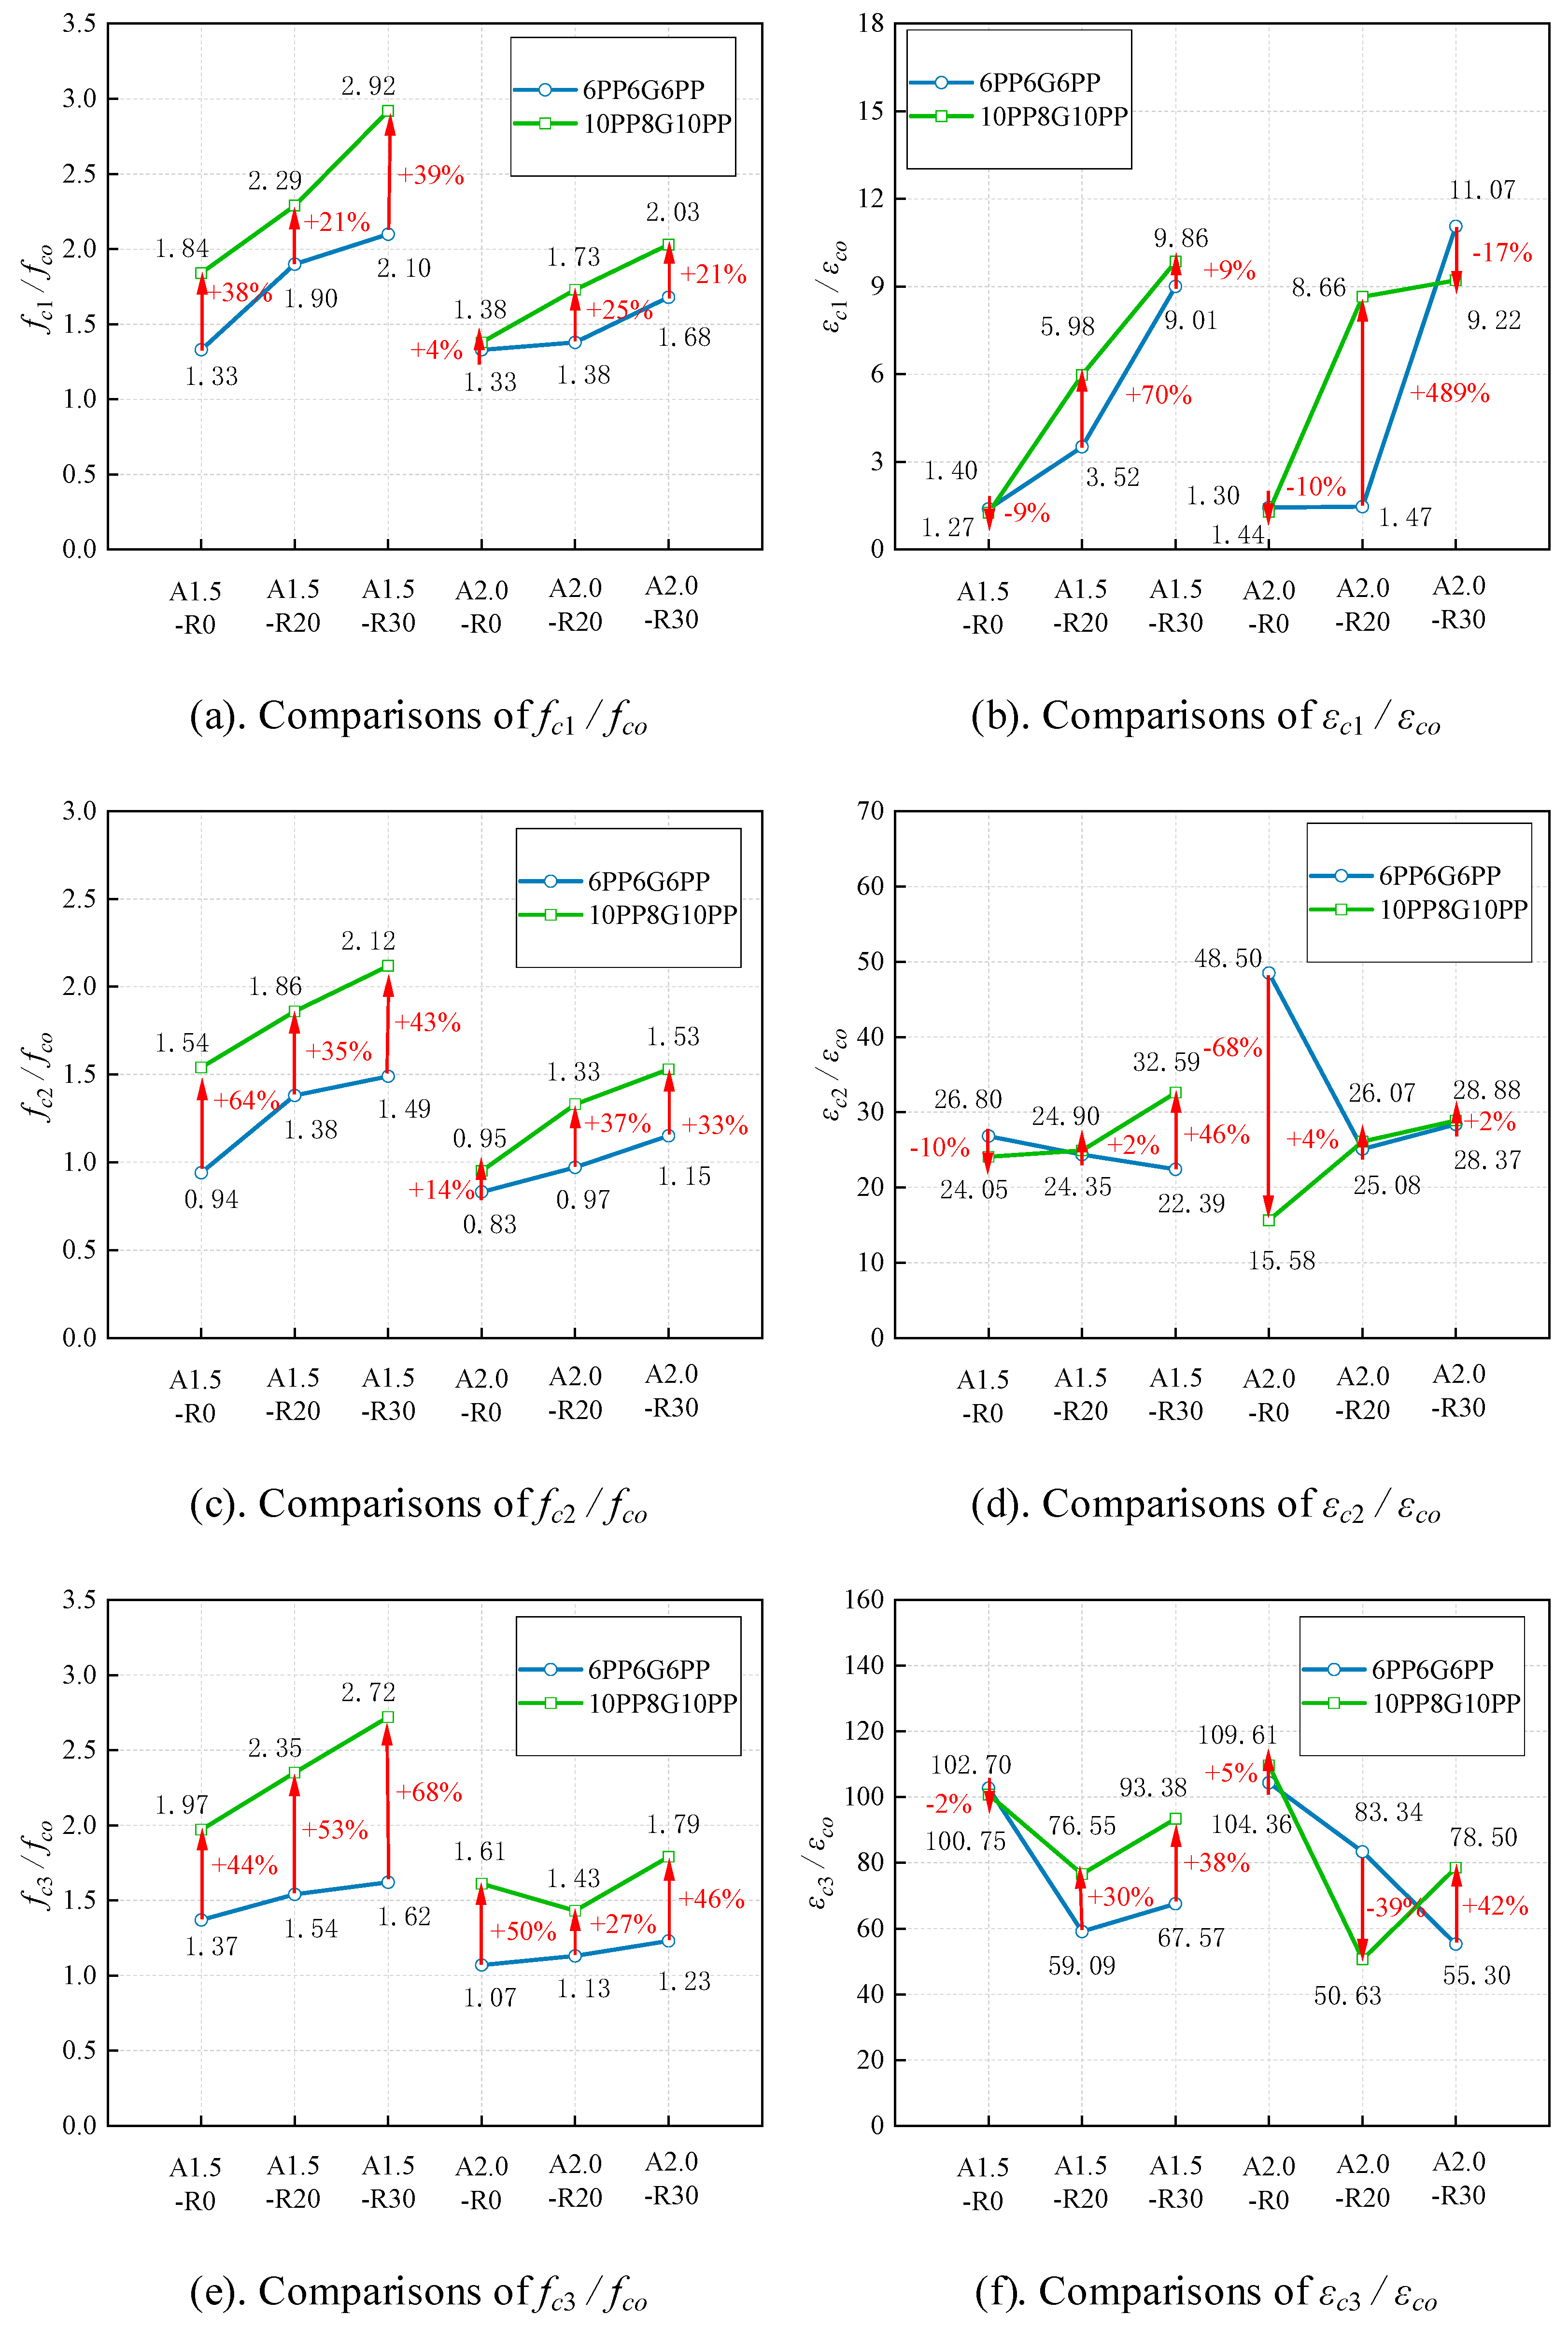
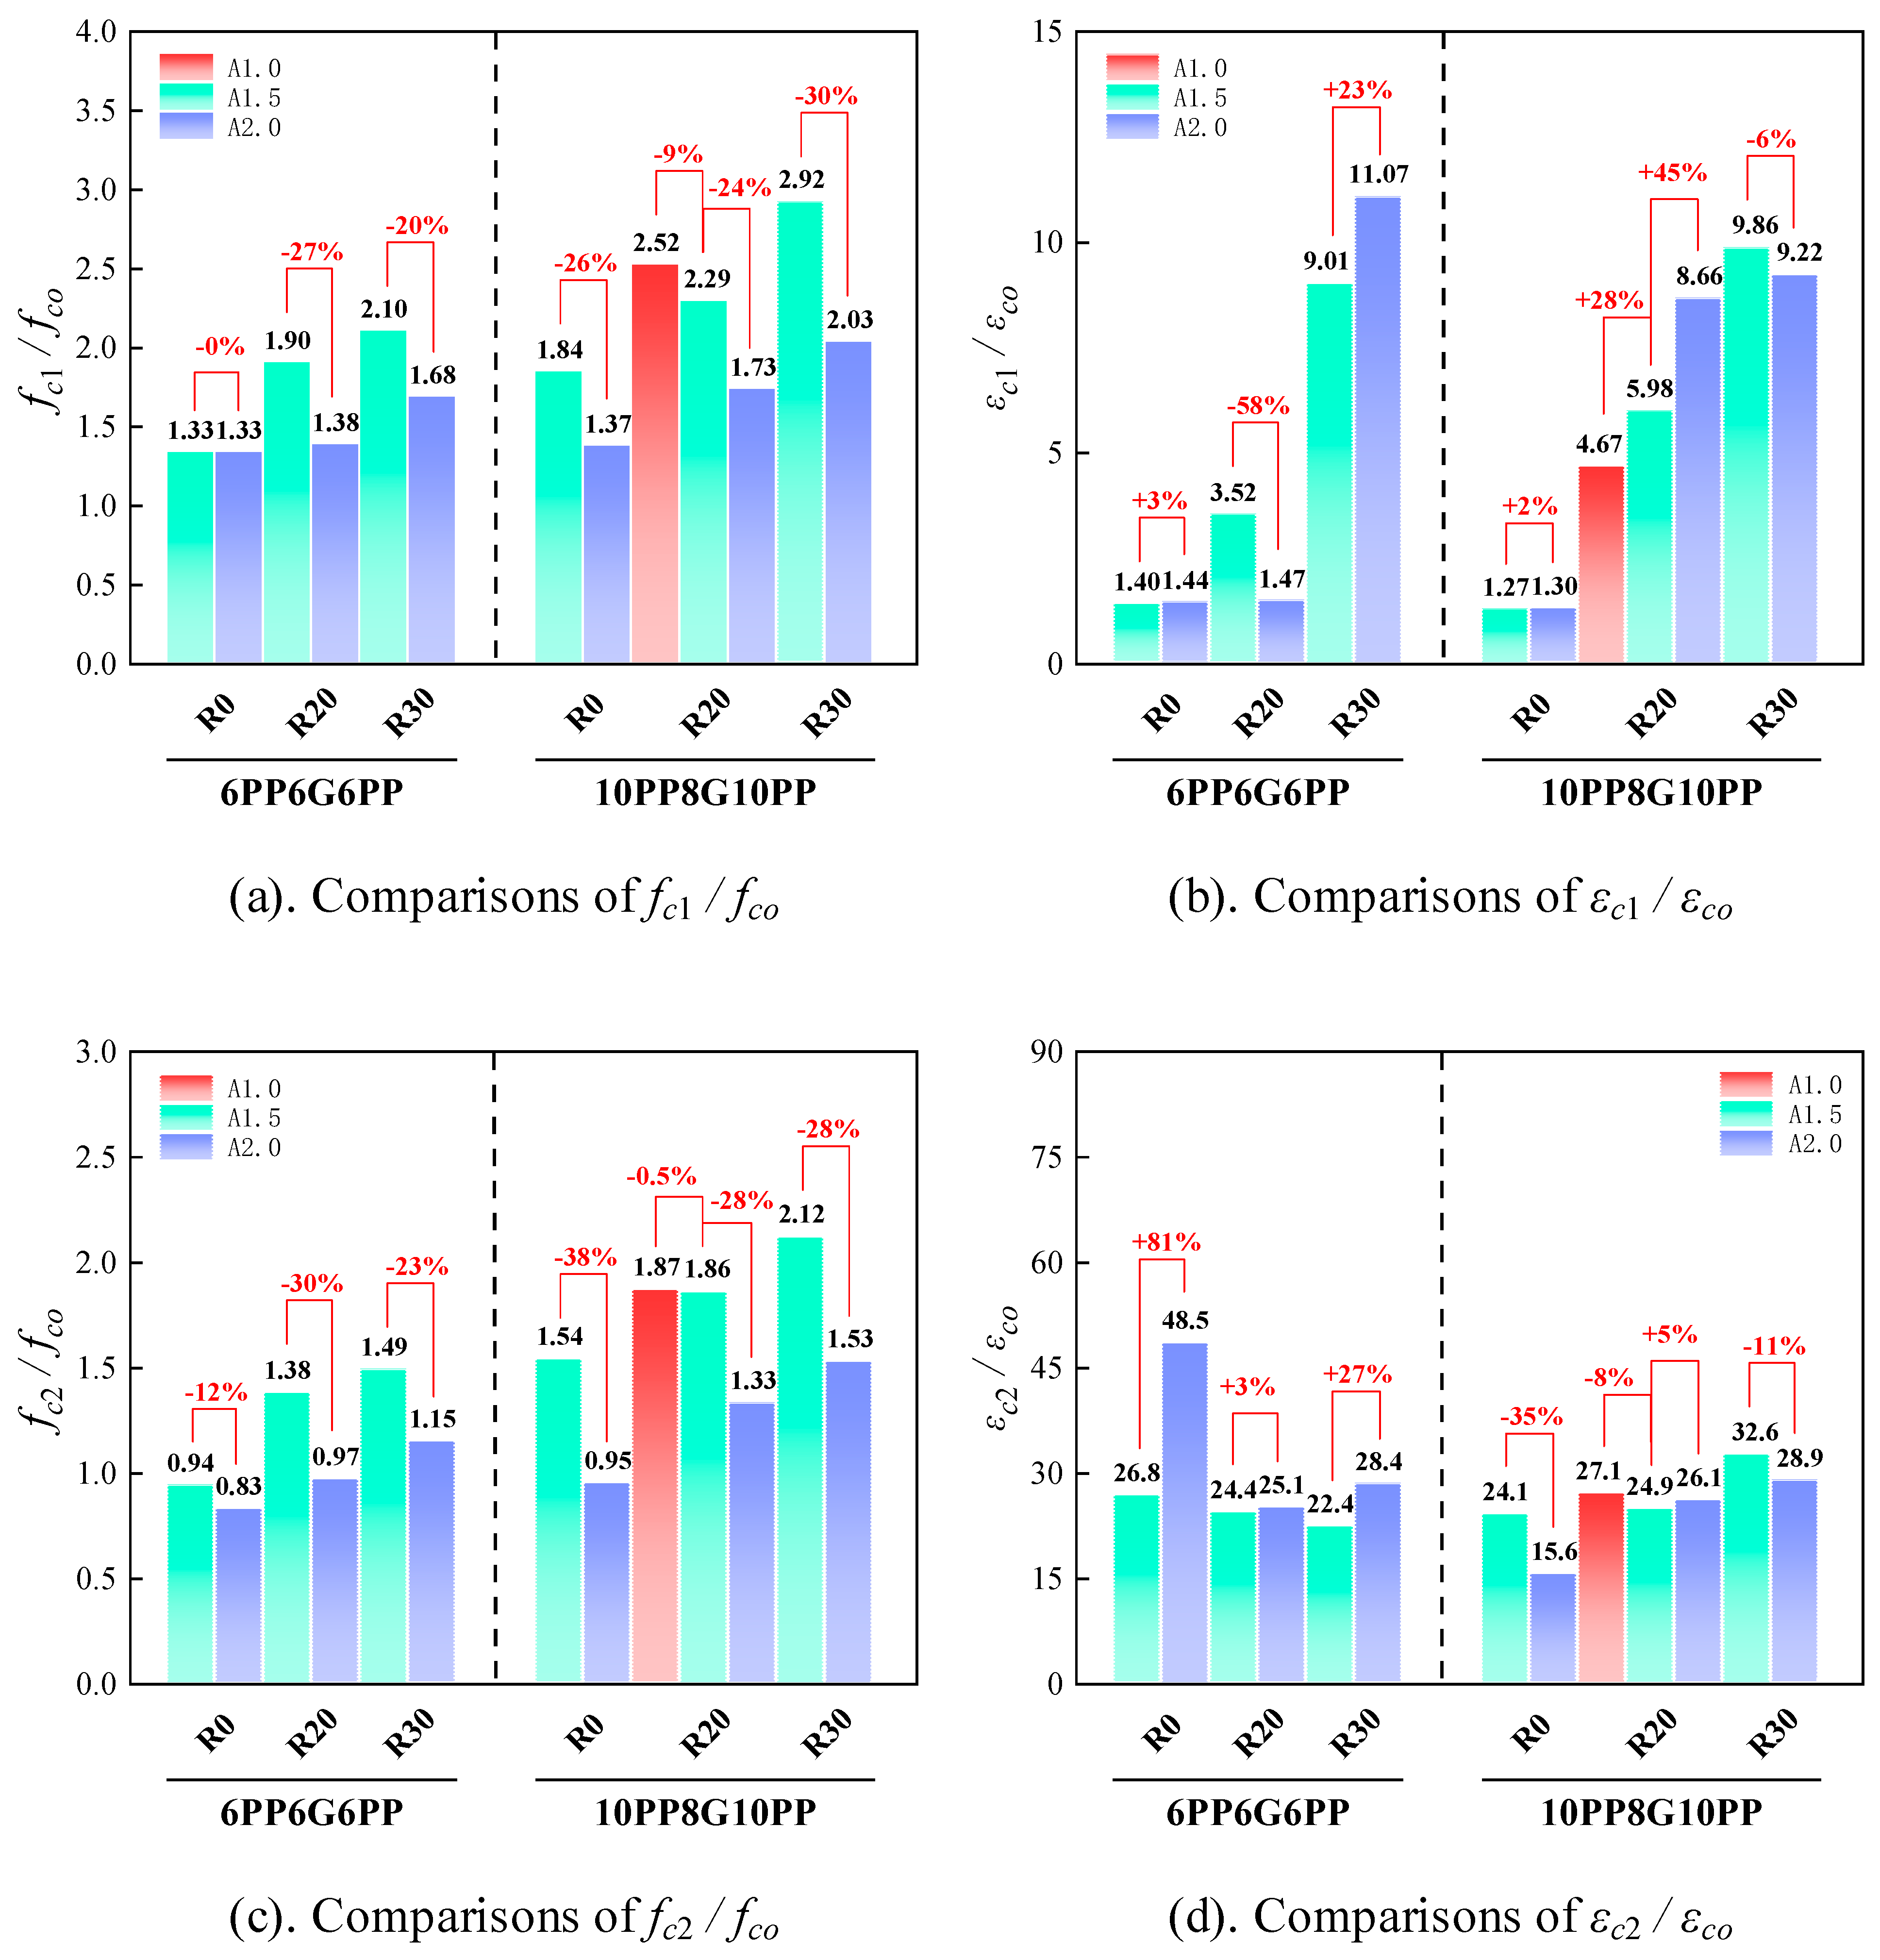
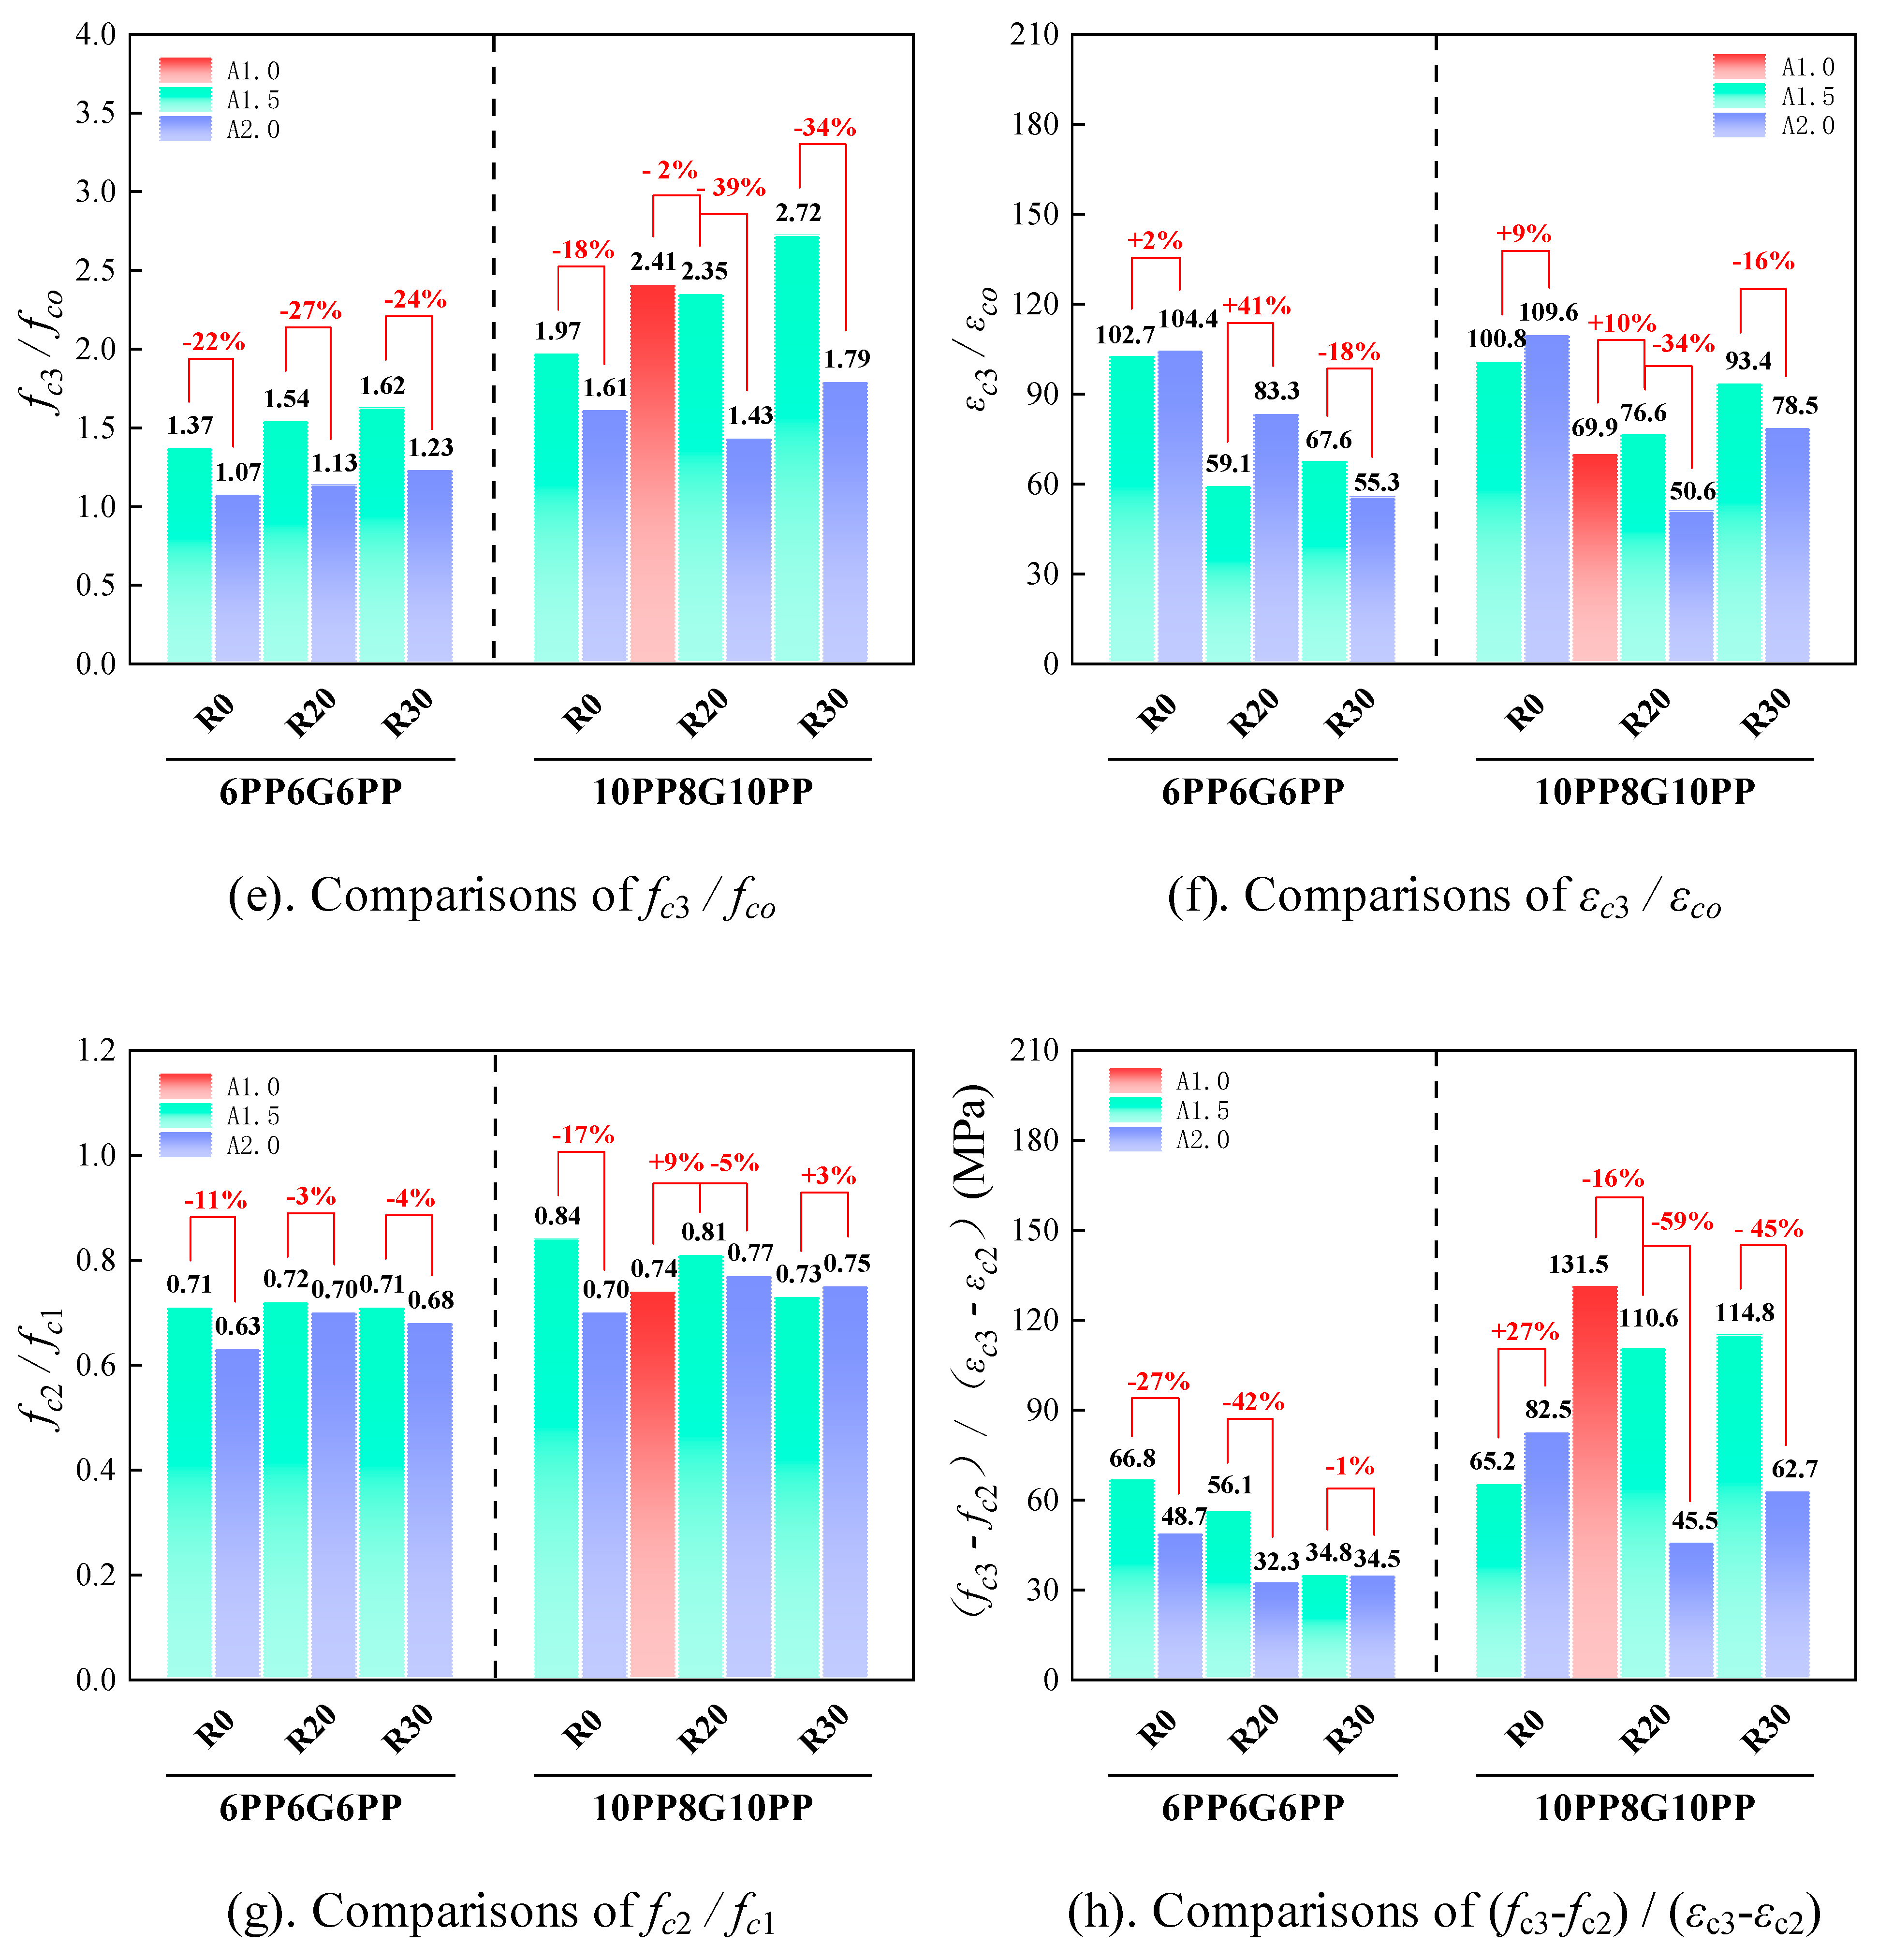
To systematically investigate the effects of cross-sectional aspect ratio, corner radius, and thickness of HDFRP on the compressive behavior of HDFRP-confined rectangular short concrete columns, this study presents in Figure 7 and Figure 8 the quantified effects of the aforementioned variables on the stress ratios and corresponding strain ratios at key characteristic points of the stress–strain curves of HDFRP-confined rectangular concrete specimens. Table 3 summarizes the mechanical parameters of all tested specimens.

3.3.1. Influence of Cross-Sectional Aspect Ratio

This section discusses the influence of the aspect ratio on the compressive response of HDRRP-confined rectangular short concrete columns (as shown in Figure 5 and Figure 7). Figure 7 quantifies the impact of the cross-sectional aspect ratio on the stress ratios (fc1/fco; fc2/fco; fc3/fco) and corresponding strain ratios (εc1/εco; εc2/εco; εc3/εco) at the peak point, transition point, and extreme point of the axial stress–strain curves of the specimens, as well as the stress retention ratio (fc2/fc1) and the slope of the re-hardening segment (fc3fc2)/(εc3εc2). It can be seen that under the given thickness of HDRRP and corner radius conditions, an increase in the aspect ratio leads to a decrease in the overall strength of the specimens, which is consistent with the conclusions drawn from previous studies [29]. As illustrated in the stress–strain curves of specimens with varying aspect ratios, the initial ascending branch remains largely unaffected by the aspect ratio. However, the peak strength exhibits a pronounced decrease as the aspect ratio increases. For instance, Table 3 indicates that in 10PP8G10PP-confined specimens with a corner radius of 20 mm, the enhancement in peak strength (fc1) declines from 152% to 129% and 73% as the aspect ratio rises from 1 to 1.5 and 2, respectively.
Figure 7a shows the influence of the aspect ratio on the stress ratio at the peak point (fc1/fco). The stress ratio at the peak point decreases as the aspect ratio increases from 1.5 to 2.0. For the 10PP8G10PP-confined specimens, the average reduction in the stress ratio reaches 27%, exceeding the 23% reduction observed in the 6PP6G6PP-confined specimens. The maximum reduction in the stress ratio at the peak point reached 30% for the 10PP8G10PP-confined specimen with a 30 mm corner radius. This trend indicates that a higher aspect ratio reduces the effective confinement, and this effect becomes more pronounced with thicker HDFRP due to its greater confinement. Nevertheless, a peak strength enhancement of 103% was still achieved for columns with an aspect ratio of 2.0. This enhancement significantly exceeds the values reported for CFRP-confined rectangular short concrete columns. Shehata [23], for instance, tested specimens with comparable dimensions and an unconfined strength (29.5 MPa) similar to those in the present study, yet achieved only a 31% increase in peak strength using two CFRP layers. Even with a lower concrete strength of 23.7 MPa, the strength improvement reached merely 40%. Subsequently, Wei and Wu [22] employed CFRP to confine rectangular short concrete columns with an unconfined strength of 35.3 MPa, observing a peak strength enhancement of merely 10%. This difficulty in strength enhancement intensifies with higher concrete strength, and a similar trend is observed for LRS FRP-confined rectangular short concrete columns. Zeng [29] confined rectangular short concrete columns (A= 2.0, fco = 33 MPa) with one and two layers of PET FRP, achieving strength enhancements of only 9% and 4%, respectively. Even when Saleem [24] reduced the specimen strength to 24 MPa and used three layers of PETFRP for reinforcement, the maximum strength increase attained was merely 46%.
To enhance FRP confinement effectiveness, alternative approaches have been explored. Tan [30] transformed a rectangular cross-section (A = 2.0) into a capsule-shaped profile, achieving a strength increase of approximately 70%. Hany [33] combined FRP wrapping with FRP anchor rods for columns with an aspect ratio of 1.9, resulting in a strength improvement of about 44%. In contrast, the HDFRP-confined rectangular columns in this study attained a strength increase of up to 103% (specimens 10PP8G10PP-A2.0-r30-I, II), markedly exceeding the enhancements reported above. This demonstrates that HDFRP can effectively overcome the insufficient strength improvement typical of conventional FRP systems, without introducing complex construction procedures, offering significant practical value for engineering applications. As shown in Figure 7b, the aspect ratio also influences the strain ratio at the peak (εc1/εco), although no clear trend is discernible.
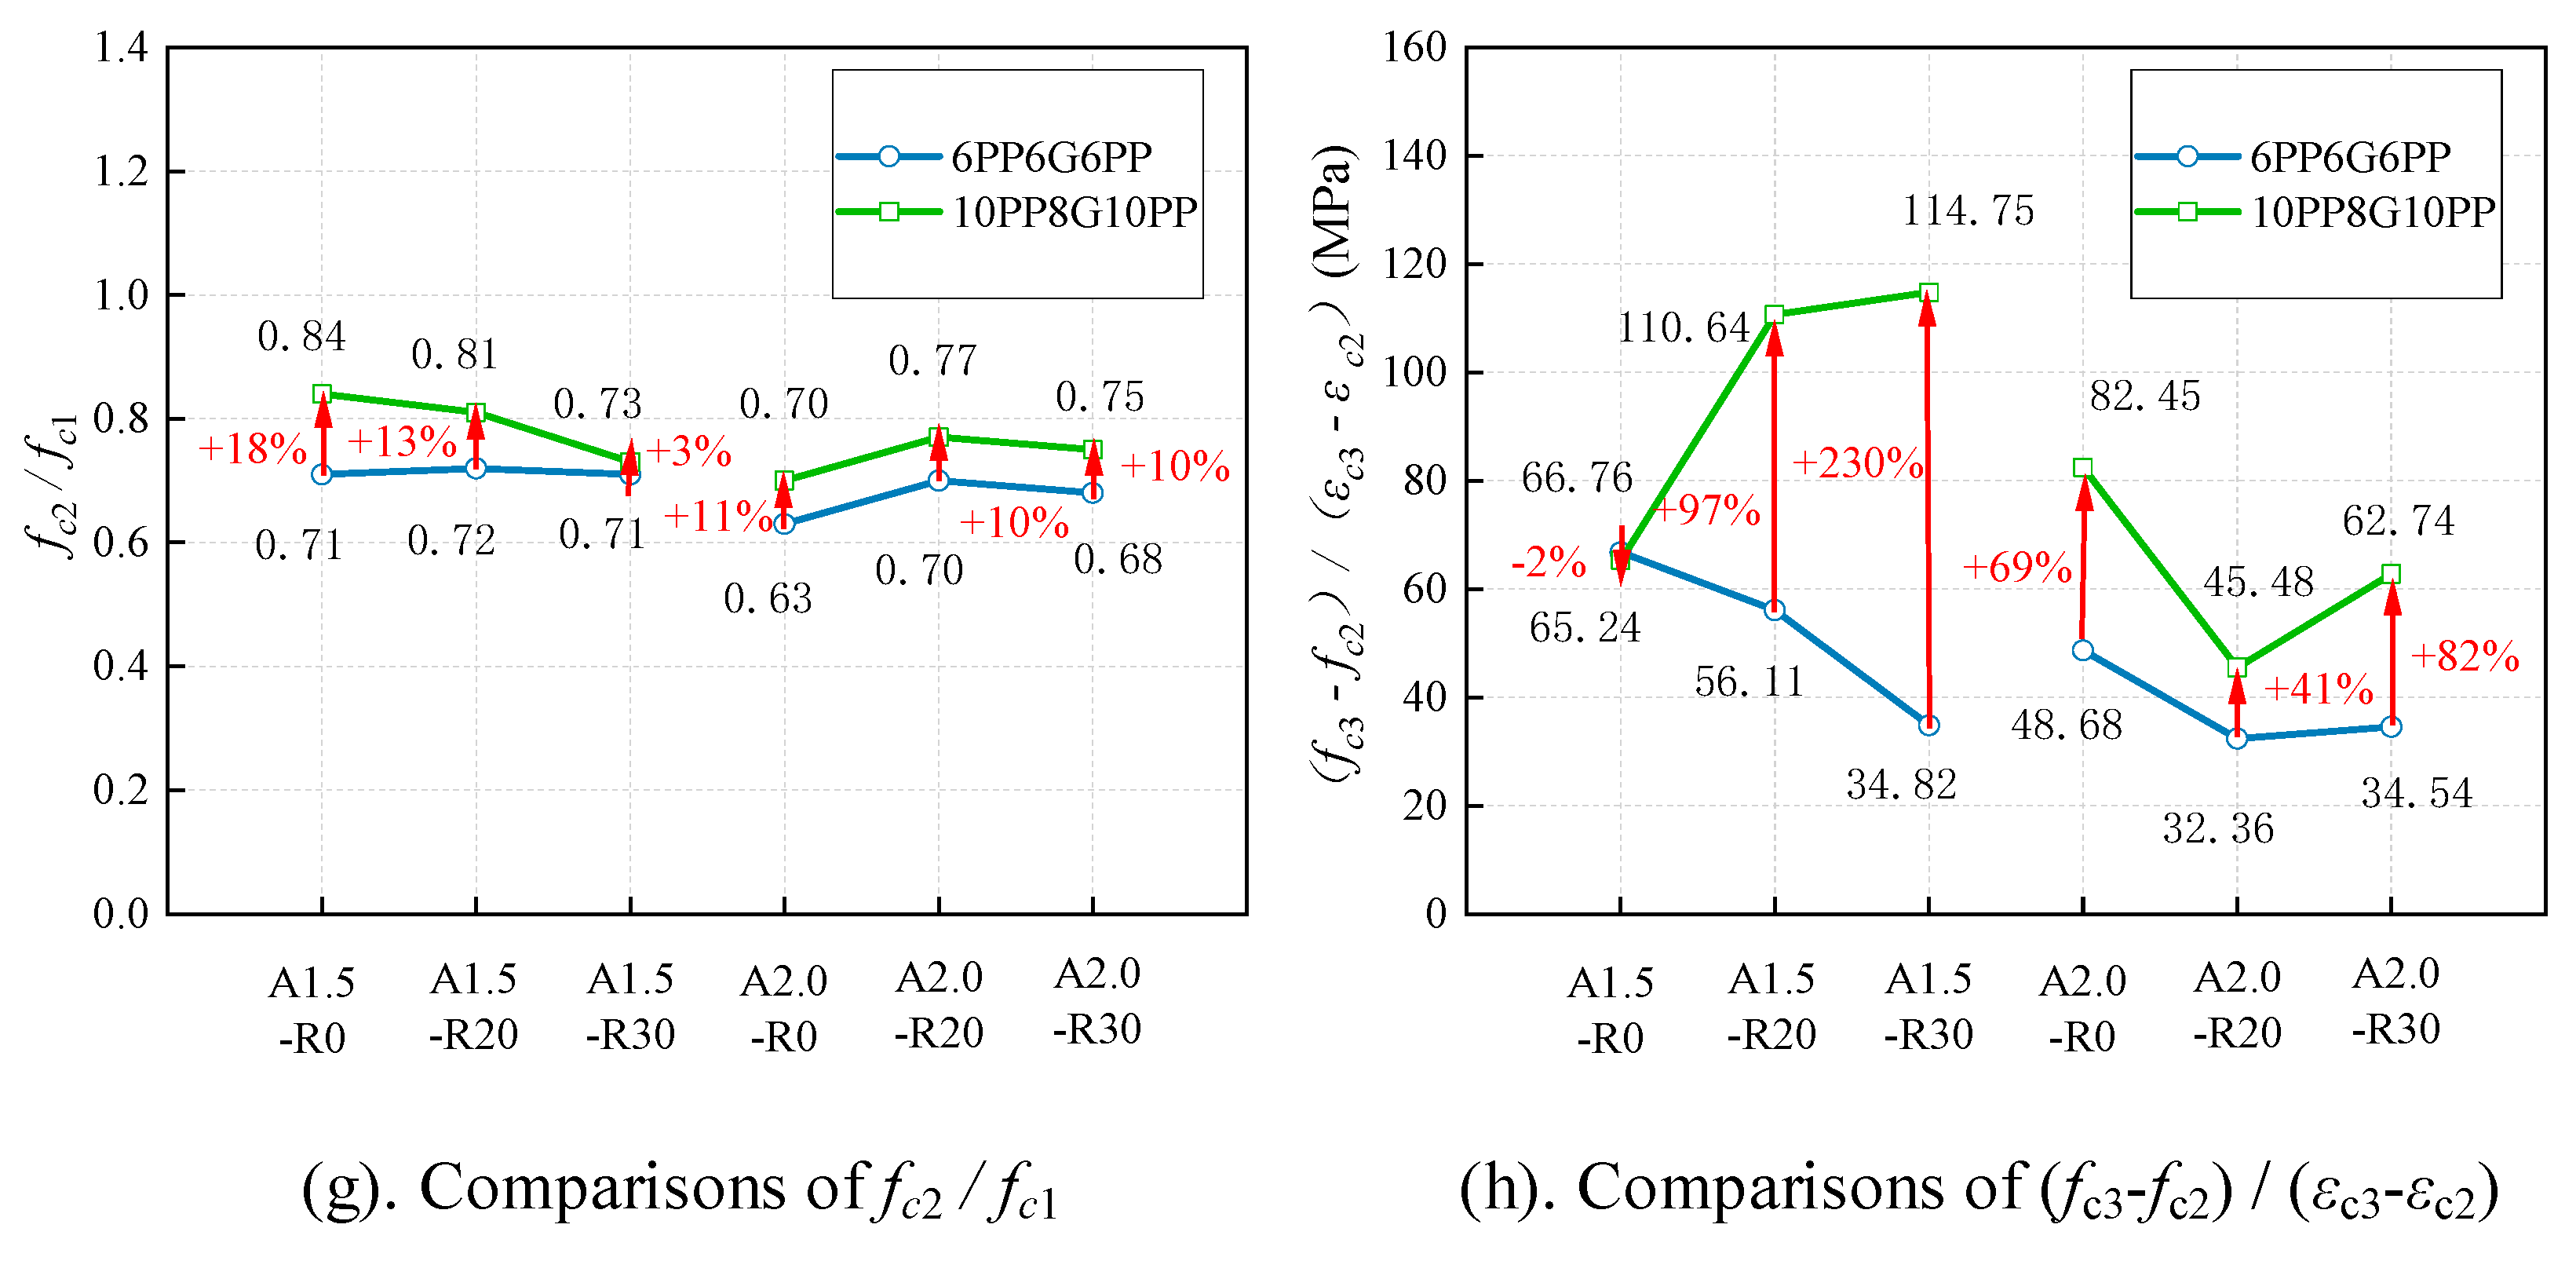
The transition point stress also decreases with increasing cross-sectional aspect ratio. For instance, in 10PP8G10PP-confined rectangular specimens with a 20 mm corner radius, the transition point stress relative to the unconfined concrete strength declines from 87% to 86% and further to 33% as the aspect ratio increases from 1.0 to 1.5 and 2.0, respectively. Figure 7c,d,g present the quantitative effects of cross-sectional aspect ratio on the transition point stress ratio (fc2/fco), strain ratio (εc2/εco), and stress-retention ratio (fc2/fc1), respectively. For specimens with a given corner radius and thickness of HDFRP, increasing the aspect ratio from 1.5 to 2.0 results in a pronounced decrease in the transition point stress ratio, with reductions ranging from 12% to 38%. In contrast, the stress-retention ratio shows a comparatively smaller decline, averaging approximately 6%. This behavior occurs because both the peak point stress and transition point stress decrease approximately proportionally as the aspect ratio increases, yielding similar stress-retention ratios across different aspect ratios. Meanwhile, the transition point strain varies with aspect ratio, though no clear trend is discernible.
In the ultimate stage, although the aspect ratio significantly influences the slope of the re-hardening segment, all HDFRP-confined rectangular columns maintained a relatively high load-carrying capacity. The ultimate point stress exhibited a decreasing trend as the aspect ratio increased. For example, in 10PP8G10PP-confined specimens with a 20 mm corner radius, the enhancement in ultimate strength relative to the unconfined concrete strength fco declined from 141% to 135% and then to 43% as the aspect ratio increased from 1.0 to 1.5 and 2.0, respectively. Figure 7e,f,h present the effects of aspect ratio on the ultimate point stress ratio (fc3/fco), strain ratio (εc3/εco), and slope of the re hardening segment (fc3fc2)/(εc3εc2). For specimens with a given corner radius and thickness of HDFRP, increasing the aspect ratio from 1.5 to 2.0 leads to a pronounced reduction in (fc3/fco), ranging from 18% to 39%. The slope of the re hardening segment shows a more pronounced decrease, with reductions between 1% and 59%. Notably, the ultimate strain shows no clear dependence on the aspect ratio. Conventional FRP systems typically achieve ultimate strains ranging from 0.5% to 1.3% for SRS FRP [15,23,28] and from 4.5% to 13.2% for LRS FRP [21,29]. In comparison, HDFRP-confined rectangular columns achieve ultimate strains up to 18%, indicating markedly greater ductility.
In summary, for HDFRP-CRCCs, the stresses at the peak, transition, and ultimate points—together with the corresponding stress ratios, stress-retention ratios, and slopes of the re-hardening segments—all decrease with increasing cross-sectional aspect ratio. This trend is consistent with earlier observations on conventional FRP-confined rectangular short concrete columns [22,29]. The reduction in specimen strength is attributable to the differing confinement efficiencies provided by HDFRP in rectangular and circular columns. Unlike circular columns, the lateral confinement exerted by HDFRP on the long sides of rectangular sections exhibits a delayed onset: it becomes effective only after sufficient lateral dilation of the concrete causes the HDFRP to arch outward, thereby mobilizing its tensile capacity and generating the confining action. As the cross-sectional aspect ratio increases, the specimen requires greater outward bulging deformation for the HDFRP to achieve the same curvature and mobilize its confining effect, which leads to more severe concrete fragmentation and stress loss, and thus the strength reduction is more significant. Nevertheless, even for rectangular short concrete columns with an aspect ratio of 2.0, the use of the 10PP8G10PP hybrid fiber system still provides a substantial improvement in strength.

3.3.2. Influence of Corner Radius

The influence of the corner radius on the axial compressive response of HDFRP-CRCCs is illustrated in Figure 5, while its quantitative effects on key point characteristic parameters are summarized in Figure 7. As shown, increasing the corner radius leads to a notable improvement in the overall structural response. A direct comparison of the stress–strain curves further reveals that the peak strength rises markedly with larger corner radii. For example, Table 3 shows that in 6PP6G6PP-confined specimens with a cross-sectional aspect ratio of 1.5, the peak strength enhancement (fc1) increased from 33% to 90% and further to 110% as the corner radius rose from 0 mm to 20 mm and 30 mm, respectively. Corner rounding significantly enhances the confinement effectiveness of HDFRP on rectangular columns. The stress ratio at the peak point increases approximately linearly with increasing corner radius.
After peak strength, the descending portion of the stress–strain curve becomes notably gentler for specimens with rounded corners compared with those having sharp corners (Figure 5). The transition stress also exhibits an increase with larger corner radii. For instance, in 6PP6G6PP- confined specimens with an aspect ratio of 1.5, the enhancement in transition point stress relative to the unconfined strength (fco) rises from –6% to 38% and further to 49% as the corner radius increases from 0 mm to 20 mm and 30 mm, respectively. In sharp-corner specimens, the transition stress falls below that of the unconfined specimens due to insufficient confinement—an effect that can be mitigated by increasing the thickness of HDFRP. Figure 7c,d,g present the influence of corner radius on the transition point stress ratio (fc2/fco), strain ratio (εc2/εco), and stress retention ratio (fc2/fc1). The stress retention ratio exhibits relatively smaller variation with increasing corner radius. When the corner radius increases from 0 mm to 20 mm, (fc2/fc1) increases by an average of 4.5%; however, a further increase from 20 mm to 30 mm results in an average decrease of 4.5%. This reversal occurs because the growth in the peak point stress ratio significantly exceeds that of the transition point stress ratio when the corner radius is raised from 20 mm to 30 mm.
The ultimate stage of the stress–strain response is also influenced by the corner radius (Figure 5). Larger corner radii lead to higher ultimate strength. For example, in 10PP8G10PP confined specimens with an aspect ratio of 1.5, the enhancement in ultimate strength relative to fco increases from 97% to 135% and further to 172% as the corner radius rises from 0 mm to 20 mm and 30 mm, respectively. For specimens with the same HDFRP thickness and an aspect ratio of 2.0, the corresponding enhancements reach 61%, 43%, and 79%. These results indicate that increasing the corner radius significantly improves the ultimate strength of HDFRP CRCCs, whereas a larger aspect ratio reduces the confinement effectiveness of the HDFRP system. Figure 7e,f,h show the influence of corner radius on the ultimate point stress ratio (fc3/fco), strain ratio (εc3/εco), and slope of the re hardening segment (fc3fc2)/(εc3εc2). For 10PP8G10PP confined specimens, the variation in this slope with corner radius differs with aspect ratio. In contrast, specimens confined with 6PP6G6PP exhibit a consistent decreasing trend: the slope decreases by 16% as the radius increases from 0 mm to 20 mm, and by a further 38% when the radius increases from 20 mm to 30 mm. This reduction is attributed to the greater increase in the transition point stress ratio than in the ultimate point stress ratio with increasing corner radius.
It should be noted that the strain values at the peak and transition points show no clear trend as the corner radius increases. However, the ultimate point strain ratio (εc3/εco) decreases significantly—by 2% to 54% relative to sharp-corner specimens (R = 0 mm). This indicates that rounding the corners increases the effectively confined area of the concrete section and activates the effective confinement mechanism earlier, whereas sharp-corner specimens require greater axial deformation to achieve effective confinement. Consequently, increasing the corner radius enhances the overall axial compressive strength of HDFRP-CRCCs, a finding consistent with earlier studies [24]. The preset corner curvature enables the confinement effect of the long side HDFRP to be activated with smaller lateral dilation, which reduces concrete damage and consequently enhances the specimen strength.

3.3.3. Influence of the HDFRP Thickness

The quantitative results of the influence of HDFRP thickness on the stress ratio (fc1/fco) and strain ratio (εc1/εco) at the peak point are shown in Figure 8a,b. The specimens with a given aspect ratio and corner radius, increasing the HDFRP thickness results in a significant enhancement in the overall strength relative to the unconfined specimens. Increasing the HDFRP thickness (from 6PP6G6PP to 10PP8G10PP) leads to a marked rise in the peak point stress ratio (fc1/fco), with enhancements ranging from 4% to 39%. The thickness of HDFRP also exerts a notable influence on the peak strain (εc1), although no consistent trend is observed. This may be attributed to the fact that the peak strength in rectangular specimens represents a transient response, and the onset of post-peak softening is primarily governed by the distribution of internal concrete cracks and the effectiveness of confinement.
Increasing the thickness of HDFRP raises the stress at the transition point, while the corresponding strain remains scattered without a clear trend. The quantitative results of the influence of HDFRP thickness on the stress ratio (fc2/fco), strain ratio (εc2/εco), and stress retention ratio (fc2/fc1) at the transition point are shown in Figure 8c,d,g. As the thickness of HDFRP increases from 6PP6G6PP to 10PP8G10PP, (fc2/fco) and (fc2/fc1) can be significantly enhanced (with increases ranging from 14% to 64% and 3% to 18%, respectively). Increasing the thickness of HDFRP contributes to raising the minimum post-peak strength of the specimen and shortening the transitional descending portion. Although the slope of the descending portion from the peak to the transition point does not decrease markedly. This shift stabilizes the descending portion of the curve at a higher stress level, promotes earlier activation of the confinement mechanism, and thus helps to prevent further strength loss in the specimen.
With continued loading, progressive lateral deformation reactivated the confinement effect of the HDFRP, causing the stress–strain curve to ascend again until the ultimate load was reached. The quantitative results of the influence of the thickness of HDFRP on the stress ratio (fc3/fco) and strain ratio (εc3/εco) at the ultimate points are shown in Figure 8e,f. Increasing the thickness of HDFRP raises (fc3/fco) by 27% to 68%, indicating that greater HDFRP thickness substantially enhances the ultimate load-carrying capacity—a finding of practical significance for structural strengthening. During this stage, after the glass fibers have fractured, the gain in ultimate strength derives from the increased number of PP fiber layers, whereas the variation in ultimate strain relates to the rupture of the PP fibers. Figure 8h presents the effect of HDFRP thickness on the slope of the re-hardening segment, (fc3fc2)/(εc3εc2). This slope also increases with greater HDFRP thickness; for some specimens (e.g., A1.5-r20-I, II and A1.5-r30-I, II) it nearly doubles. The enhancement stems from the strong dependence of the slope of re-hardening segment on the effective confining pressure, which rises significantly when the HDFRP thickness are increased from 6PP6G6PP to 10PP8G10PP.

3.4. Lateral Rupture Strain of Glass Fiber and PP Fiber

The measured lateral strain data at the peak point and the ultimate point of the stress–strain curves for rectangular specimens are listed in Table 4 and Table 5, respectively. These two key points correspond to the failure of either the glass fiber layer or the PP fiber layer. Each table lists the average lateral strains at the mid-height of the longer and shorter sides (εhl), the average lateral strain at the corners (εhs), and the minimum.
(εmin) and maximum (εmax) lateral strains obtained from monitoring the flat sides. It should be noted that, in the calculation of the overall lateral strain for the specimens, the value was taken directly as the average lateral strain at the mid-height of the longer and shorter sides (εhe = εhl), and the lateral strain at the corners was not taken into account. The reason lies in the analysis of the lateral strain data at the specimen corners: at the early stage of testing, the corners were in tension. As the sides bulged outward, the corner strain changed from tension to compression. Upon final failure, however, the corner fibers were found to rupture, suggesting that the fiber layer at the corners became tensioned again in the later stage. Nevertheless, a portion of the strain recorded by the strain gauge at the corner still indicated a compressive state, and this strain value was much smaller than εhl.
Table 4 presents the lateral strain data of the column when glass fiber fracture occurs. To evaluate the actual utilization ratio of the glass fiber material, the strain efficiency coefficient is introduced in this paper. This coefficient is calculated by dividing the measured lateral strain at each monitoring position by the corresponding rupture strain of the fiber material (glass or PP), as obtained from standard coupon tests (see reference [34]). The test results show that the measured efficiency coefficients for glass fibers in HDFRP-confined square and rectangular short concrete columns are 0.99 and 1.08, respectively. It is worth noting that the efficiency coefficient of glass fibers in HDFRP-confined square concrete composite columns reported in the reference [37] is 1.012. Although this value is not significantly different from the result of the present study, its calculation of lateral strain incorporates the strain at the corners. This discrepancy may be attributed to the limited sample size of square specimens (only two), which could introduce some variation in the measured efficiency coefficient.
Table 5 presents the lateral strain data of the specimens at PP fiber fracture, along with the corresponding strain efficiency coefficients. From the data in Table 5, it can be observed that the lateral strain of specimens with chamfered corners generally decreases, but it does not show a clear pattern as the chamfer radius increases. Furthermore, the cross-sectional aspect ratio of the specimens has no significant influence on the efficiency coefficient of the PP fiber fabric. Therefore, following the suggestion of Lam and Teng [49], this study takes this coefficient as a constant. The experimental results indicate that upon reaching the final failure state, the efficiency coefficient of PP fibers in square and rectangular HDFRP-confined concrete specimens are 0.662 and 0.792, respectively. To ensure a sufficient safety margin in design, the efficiency coefficient of both glass fibers and PP fibers in the HDFRP-confined rectangular short concrete columns in this study are taken as a constant value of 0.6.
In summary, as the cross-sectional aspect ratio of the rectangular concrete column increases, the overall strength of the HDFRP-confined specimens decreases. Increasing the corner radius and the HDFRP thickness can enlarge the effectively confined area of the concrete section and enhance the effective confining stress, thereby improving the overall strength of the specimens and mitigating the weakening of the strengthening effect caused by a larger aspect ratio. The failure mode, however, is largely unaffected by the aspect ratio, corner radius, and HDFRP thickness: all specimens failed at the corners, with the failure characterized by tearing of the HDFRP material. Meanwhile, the axial strain and lateral strain did not exhibit any clear variation trend with the changes in the above factors.

4. Design-Oriented Stress–Strain Model

4.1. The Lateral Confinement Pressure

Previous studies have demonstrated that FRP-confined circular concrete columns can provide relatively uniform confinement throughout their cross-section, whereas rectangular columns exhibit a different behavior. During axial compression, the FRP is unable to deliver a comparable degree of uniform lateral pressure. Consequently, when formulating the lateral confinement pressure for FRP-confined rectangular short concrete columns, it is essential to account for the influence of the cross-sectional aspect ratio and the corner radius. The widely accepted approach accounts for the influence of the arching effect on the effectively confined area by introducing a cross-sectional shape coefficient ks and appropriately modifying the lateral confinement formulation originally developed for circular columns [28,29]. Based on the preceding analysis, the calculation formula for the lateral confinement pressure of HDFRP-confined rectangular short concrete columns defined in this study is as follows:
f l = k s 2 f FRP t D
where fl denotes the lateral confinement pressure exerted by HDFRP-confined rectangular concrete column; fFRP refers to the tensile stress generated by the external wrapping of HDFRP sheets, and its value can be calculated according to the formula in Ref. [34]; The stress–strain curve of the material is constructed by connecting four key characteristic points with straight line segments, and the detailed expressions are provided in Table 6; t is the nominal thickness of the HDFRP adopted; ks is the cross-sectional shape coefficient, and D is the equivalent diameter of the rectangular cross-section, which are calculated respectively by the following formulas:
k s = 1 b / h h 2 r 2 + h / b b 2 r 2 3 b h 4 π r 2
D = b 2 + h 2
where b and h are the width and length of the rectangular cross-section, respectively, and r is the corner radius.
In the above model, σpa, εpa, σpb, εpb, σpc, εpc, σpd and εpd denote the stresses and the corresponding strains at the four key points, respectively. EG and εG represent the elastic modulus and the rupture strain of the glass fiber layer, respectively. vg is the volume fraction of glass fibers. tG and tPP denote the nominal thicknesses of the glass fiber layer and the PP fiber layer, respectively. EPP, εPP, and fPP denote the second modulus, rupture strain, and tensile strength of the PP fiber, respectively. VPP represents the volume of PP fibers in the HDFRP specimen, α is the modulus adjustment coefficient, J represents the interfacial fracture energy, K1 is the stress concentration factor, and w is the Weibull shape parameter.

4.2. Unified Design-Oriented Stress–Strain Model

As illustrated in Figure 5, the axial stress–strain response of HDFRP-confined rectangular short concrete columns follows a trend similar to that previously reported for circular columns [37]. However, the magnitudes of stress and strain at key points differ. Consequently, the design-oriented model originally developed for HDFRP-confined circular concrete columns is adopted here and recalibrated using the present test data to refit the mechanical parameters at the characteristic points. The model consists of three parts, as presented in Table 7. For further details, refer to reference [37].
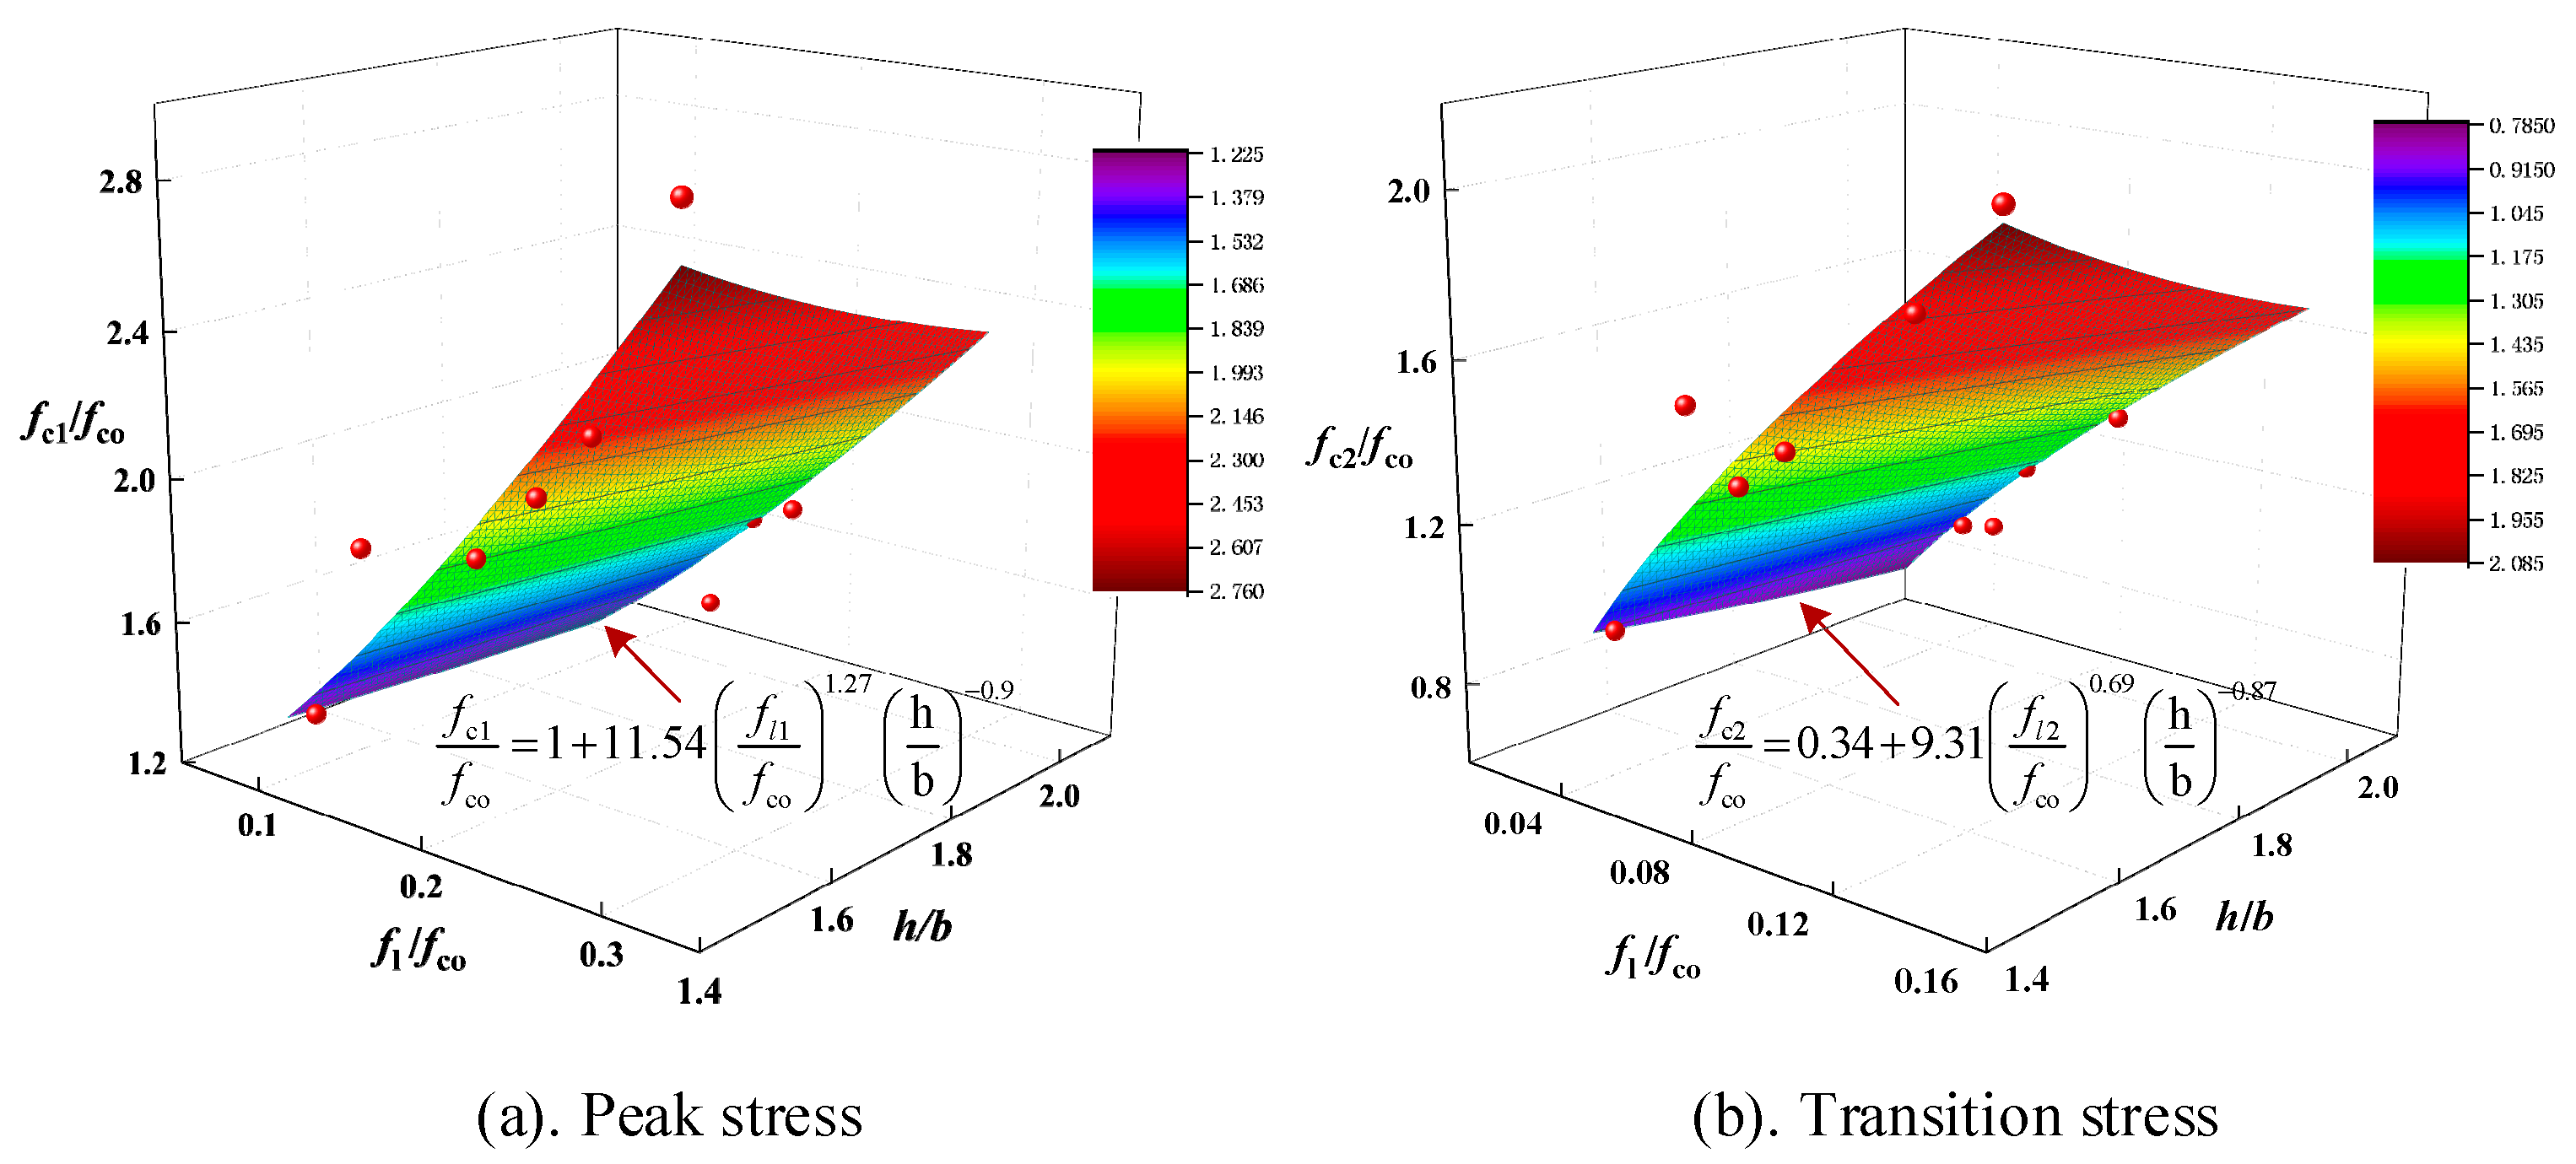
In the above stress–strain model, the mechanical parameters such as fc1 and εc1, fc2 and εc2, and fc3 and εc3 are the stress and corresponding strain values at the peak, transition and ultimate points respectively; Em represents the elastic modulus of unconfined concrete columns. As shown in Figure 7 and Figure 8, the cross-sectional aspect ratio, corner radius, and the thickness of HDFRP exert a pronounced influence on the mechanical parameters at the key points of the stress-strain curves of HDFRP-confined rectangular short concrete columns. To comprehensively account for these effects, the aspect ratio (h/b) and the corner-radius ratio (2r/b) are introduced in this study. Regression analyses are then performed to establish the relationships between the stress ratio and strain ratio at each key point and the confinement stress ratio (fl/fco). Figure 9 shows the schematic diagram of the relationship between the stress ratio at the peak and transition point of the HDFRP-CRCCs and the confinement stress ratio. This relationship is expressed by Equation (4):
f c 1 f co = 1 + 11.54 f l 1 f co 1.27 h b 0.9
ε c 1 ε co = 1 + 1.17 f l 1 f co 0.57 h b 0.82 2 r b + 1 5.1
where fl1 represents the lateral confinement pressure at the rupture of the glass-fiber layer. It should be noted that in calculating this confinement pressure, the rupture strain of the glass fibers is taken as the product of the rupture strain obtained from single-layer glass-fiber fabric coupon tests and the corresponding efficiency coefficient.
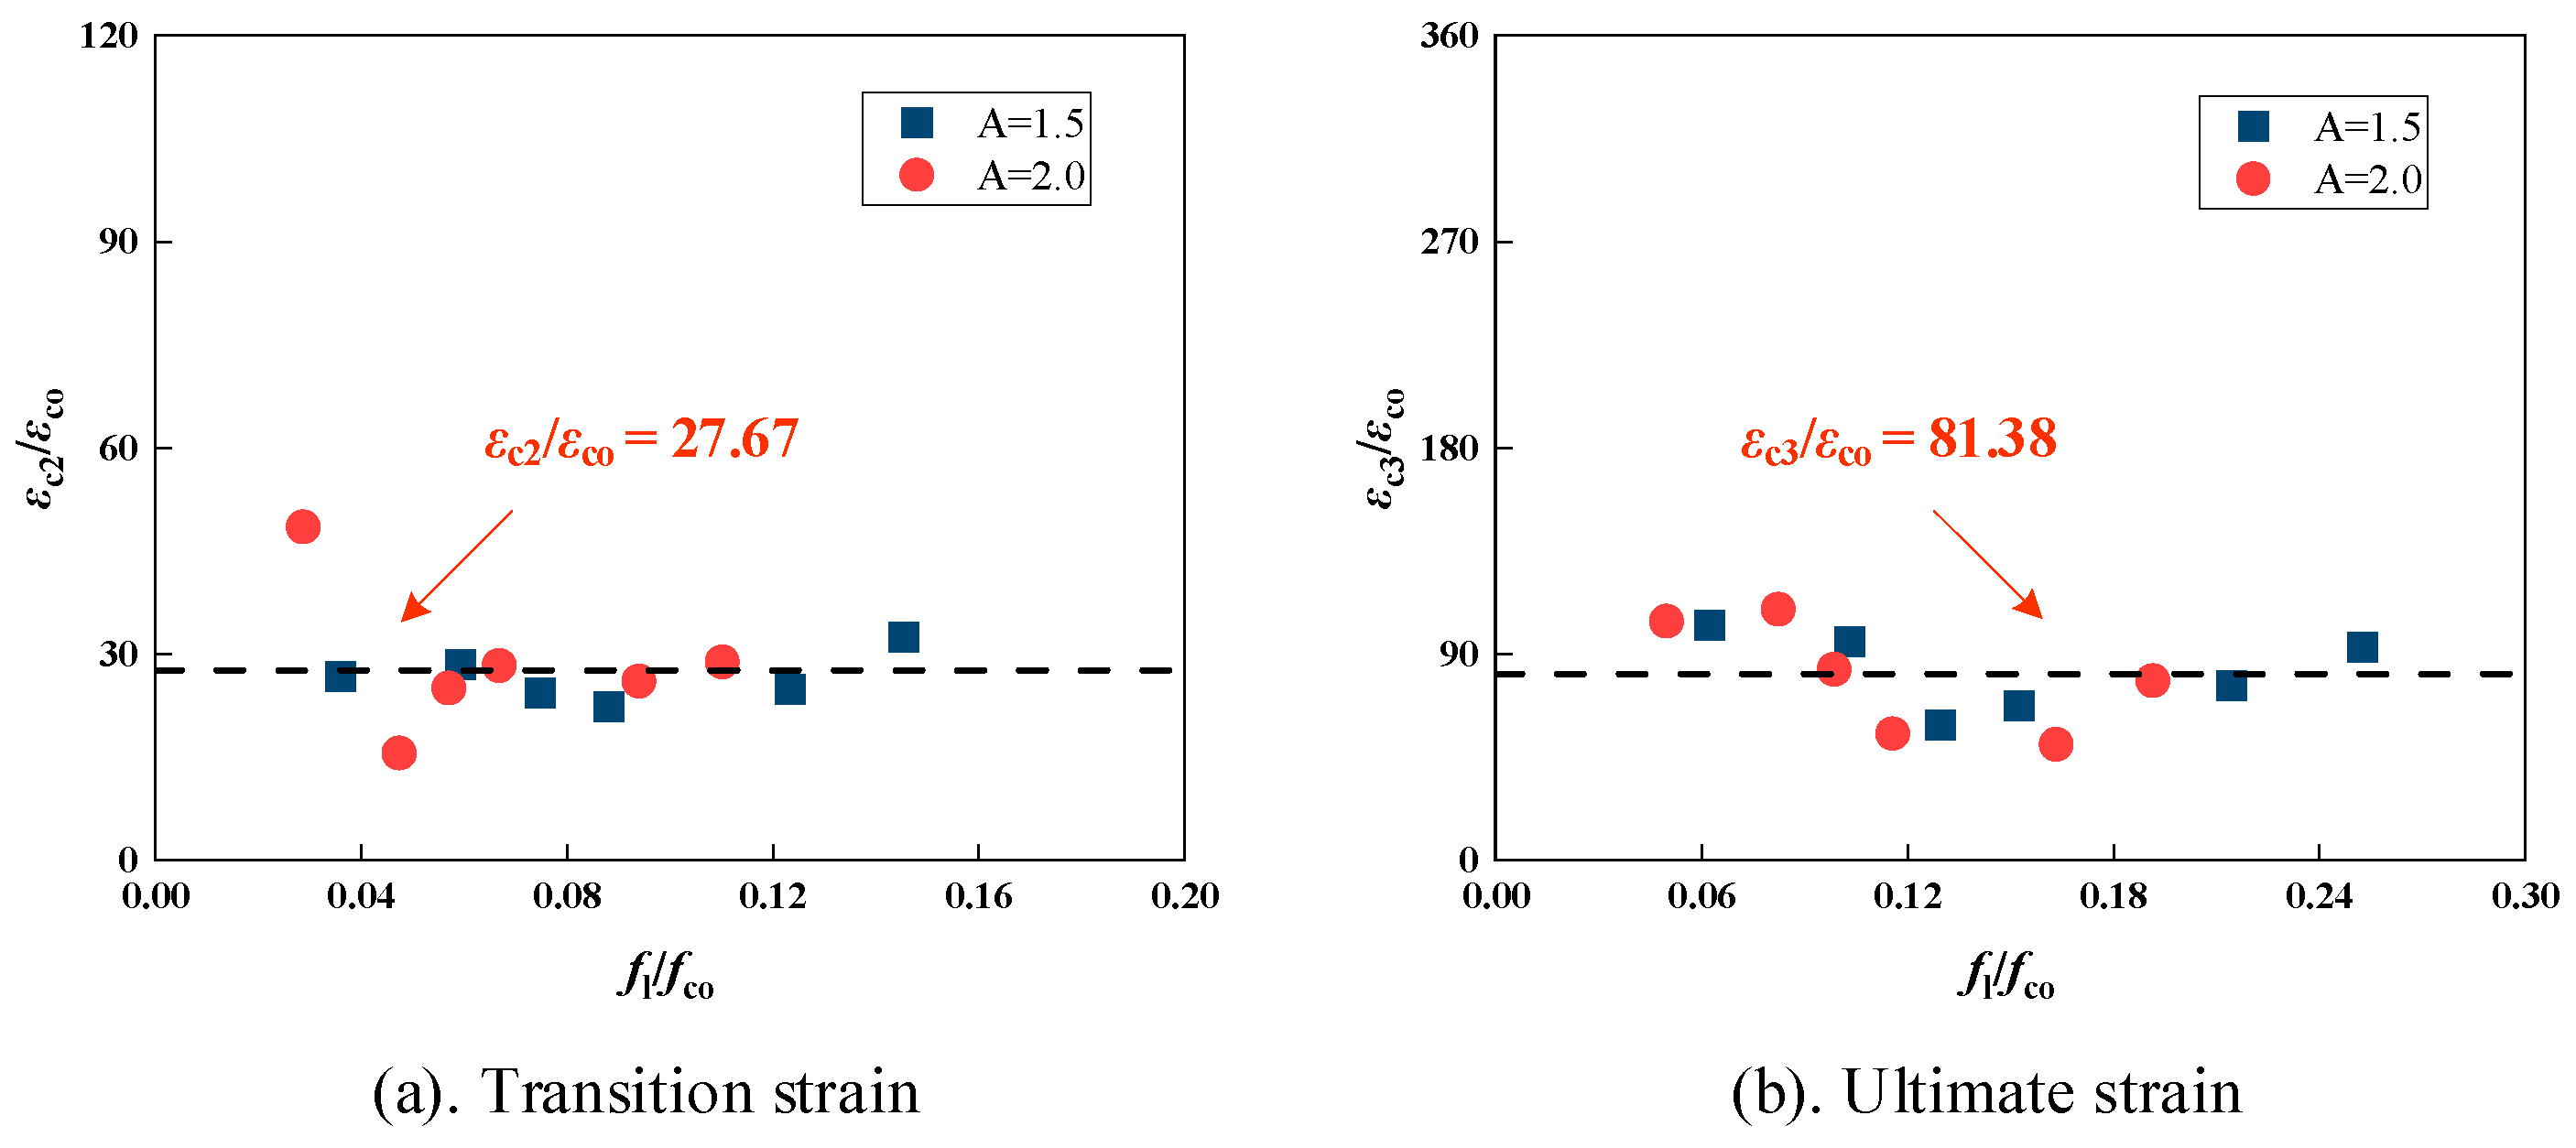
Figure 10 shows the schematic diagram of the relationship between the strain ratio at the transition and ultimate point of the HDFRP-CRCCs and the confinement stress ratio. This relationship is expressed by Equation (5):
f c 2 f co = 0.34 + 9.31 f l 2 f co 0.69 h b 0.87
ε c 2 ε co = 27.67
where fl2 denotes the lateral confinement pressure at the transition point. For its calculation, the lateral strain is adopted as the experimentally determined mean value of 0.09, obtained from the measured strains at the transition point of all specimens.
Equation (6) presents the functional relationship between the stress ratio and strain ratio at the ultimate point of the HDFRP-CRCCs and the confinement stress ratio.
f c 3 f co = 0.79 + 45.44 f l 3 f co 1.44 h b 1.04 2 r b + 1 1.85
ε c 3 ε co = 81.38
where fl3 denotes the lateral confinement pressure at the rupture of the PP fiber layer. For its calculation, the lateral strain is taken as the product of the rupture strain obtained from single-layer PP-fiber fabric coupon tests and the corresponding efficiency coefficient.

4.3. Model Validation

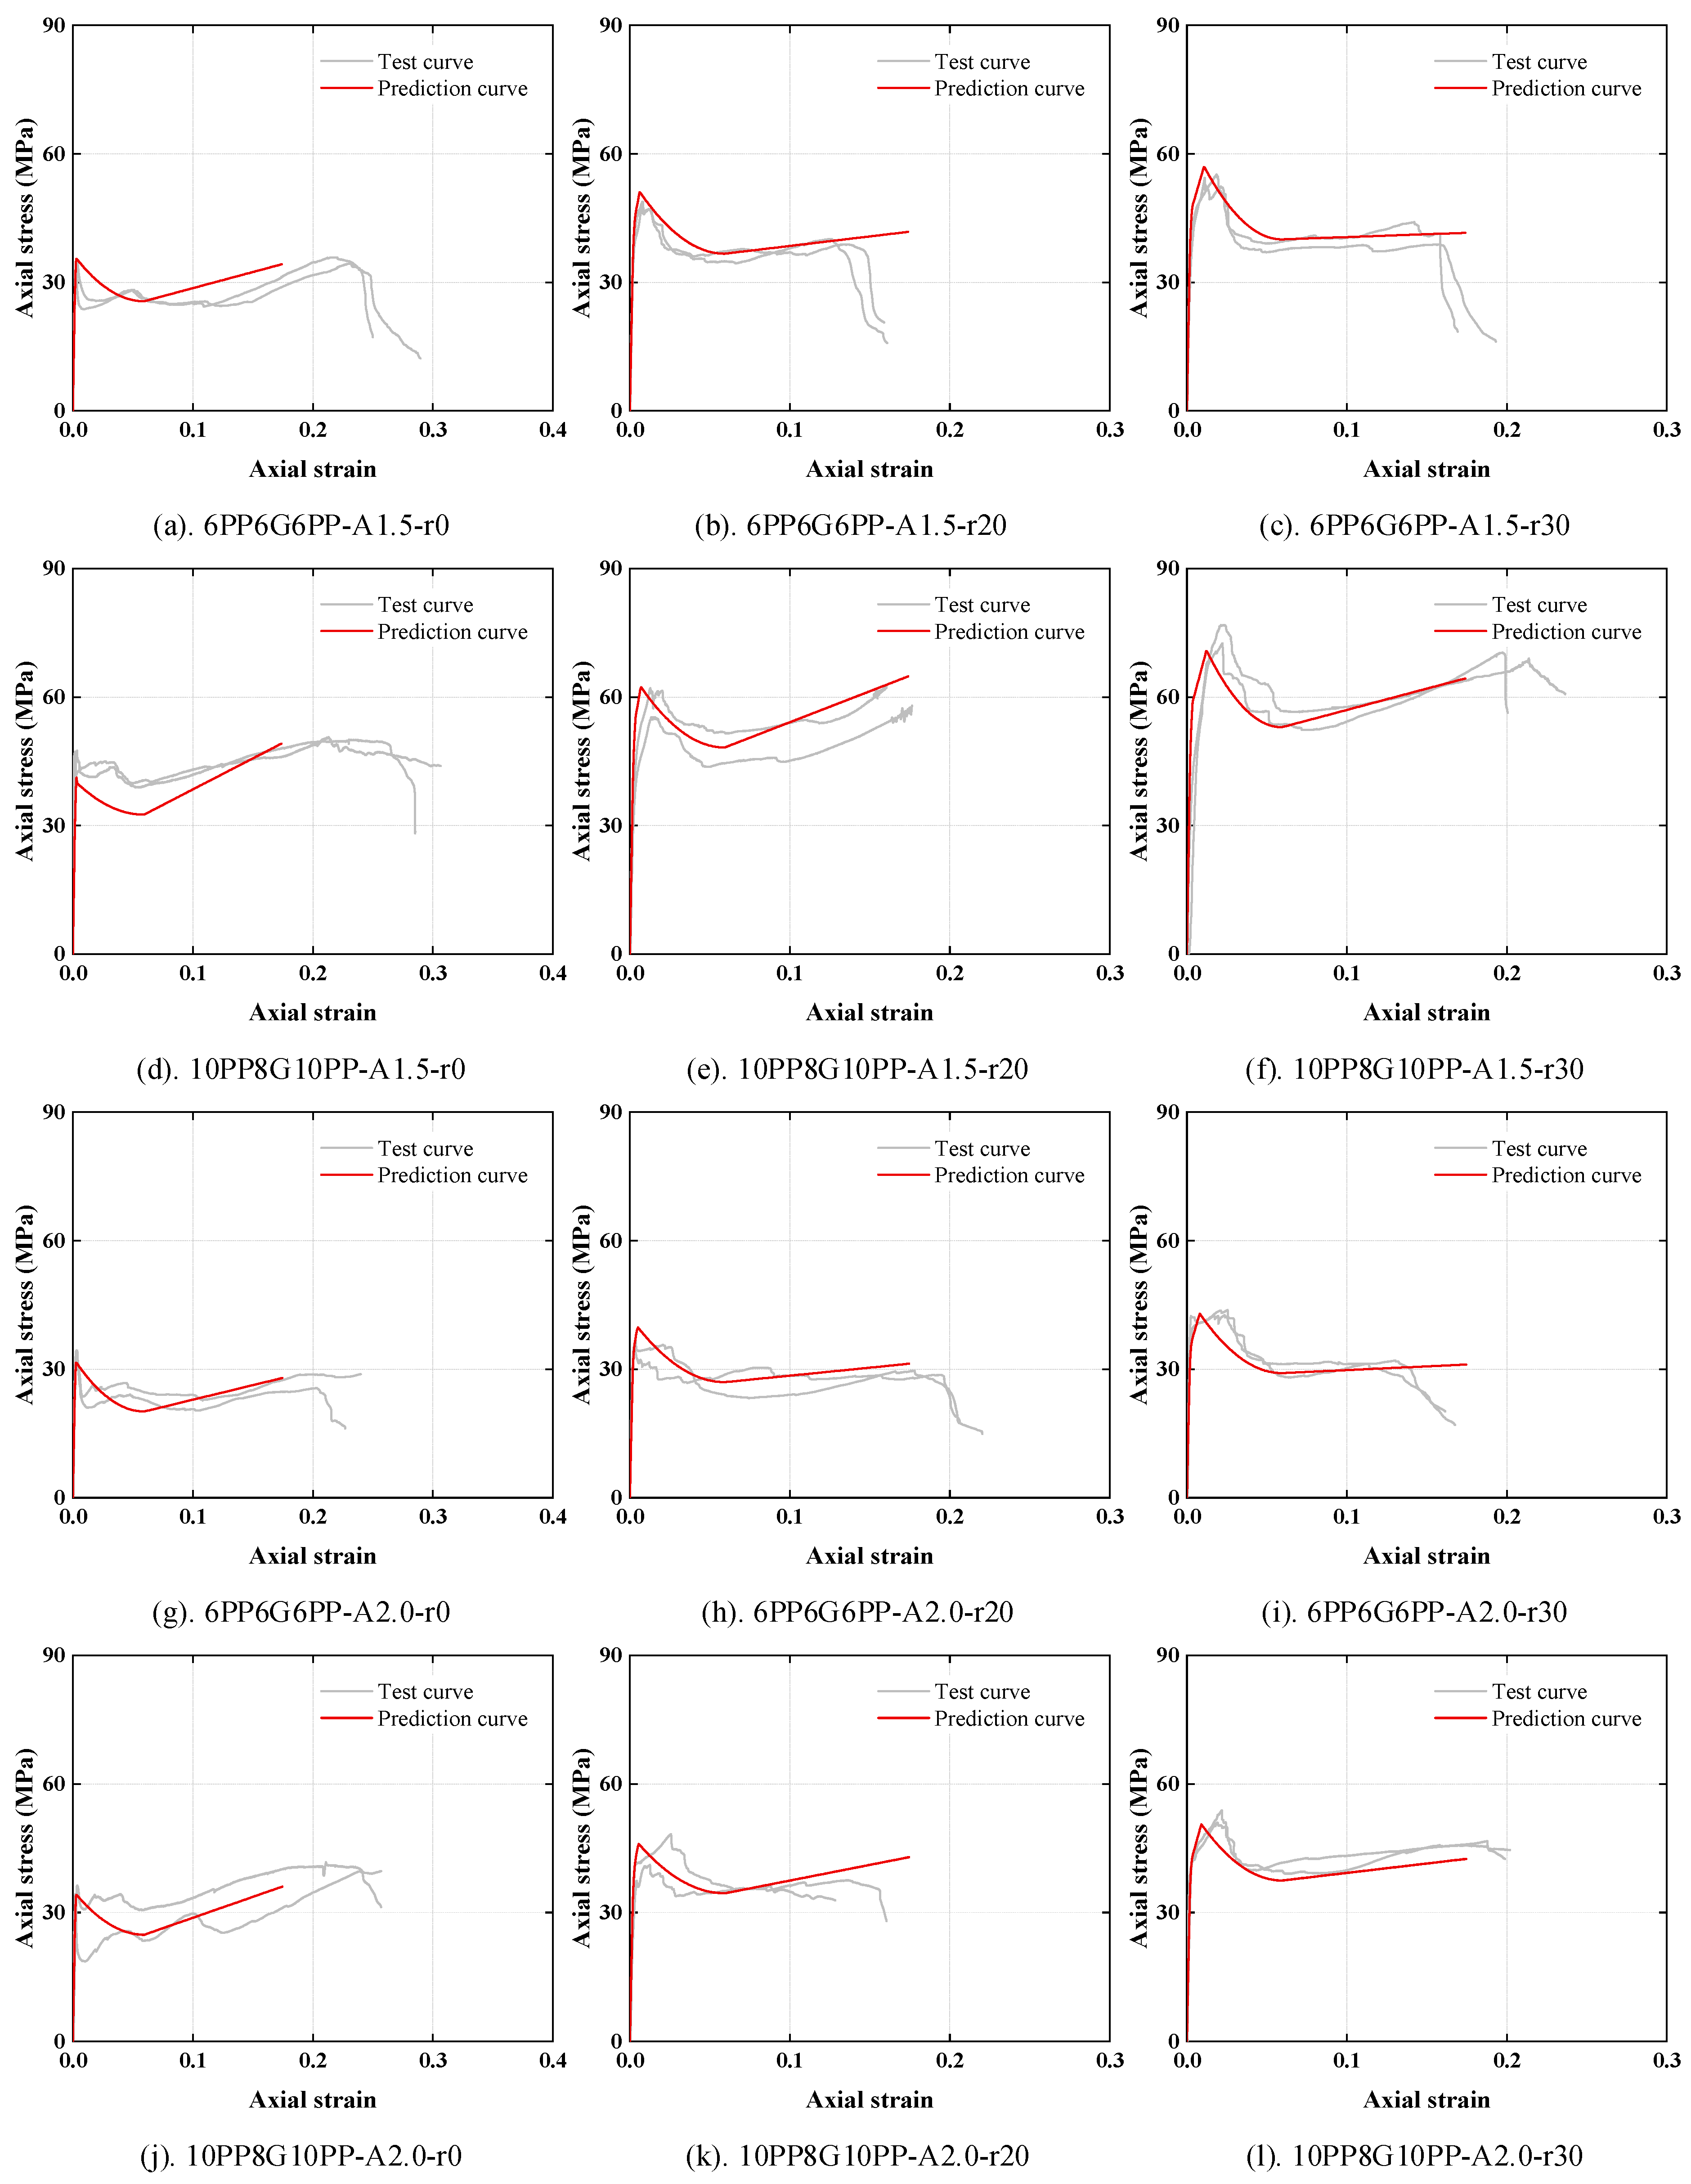
Figure 11 displays the complete axial compressive stress–strain response of HDFRP-CRCCs and compares the experimental measurements with the predictions of the proposed model. As can be seen from the figure, the prediction curves are in good agreement with the experimental curves throughout the entire process, which intuitively verifies the fundamental reliability of the proposed model. To more accurately quantify the predictive capability of the proposed model for the complete stress–strain relationship, the Absolute Average Error (AAE) was introduced as an evaluation indicator to systematically assess the prediction performance of the axial stress model. Specifically, the experimental and predicted axial stress values were extracted at equal strain intervals from the stress–strain curves of each specimen group, yielding a total of 262 sets of comparative data. On this basis, the AAE value was calculated using Equation (7). Following the classification criteria in reference [50], the prediction results were categorized into three accuracy levels:
AAE ≤ 15% indicates high accuracy, 15% < AAE ≤ 30% indicates medium accuracy, and AAE > 30% indicates low accuracy. The calculated average absolute error (AAE) for all specimens is 8.2%, meeting the high-accuracy standard. Based on the foregoing analysis, it can be concluded that the model developed in this study accurately captures the mechanical behavior of HDFRP-CRCCs under axial compression.
AAE = i = 1 n m p r e , i t t e s t , i / t t e s t , i n
where mpre,i and ttest,i represent the predicted value and the test value respectively; n denotes the number of specimens used for predicting the mechanical parameters.

5. Conclusions

In this study, axial compression tests were performed on HDFRP-confined rectangular short concrete columns to systematically investigate the effects of cross-sectional aspect ratio, corner radius, and the thickness of HDFRP on their axial compressive behavior. Compared with previously reported strength enhancements of FRP-confined rectangular short concrete columns, the superiority of the HDFRP hybrid system is clearly demonstrated: the HDFRP strengthening method can significantly improve the strength and axial deformability of rectangular short concrete columns without altering the cross-sectional dimensions of the structure or introducing additional complex procedures. The main findings of this study are summarized as follows:
  • Compared with conventional FRP-confined rectangular short concrete columns reported in earlier studies, the HDFRP-confined system delivers a pronounced enhancement in the peak strength of columns with a larger cross-sectional aspect ratio (2.0). Moreover, it extends the post-peak portion of the stress–strain curve, substantially improving the ductility of rectangular short concrete columns. This reinforcement method can solve the problem of the difficulty in enhancing the strength of rectangular short concrete columns with a larger aspect ratio without increasing the cross-sectional area and construction complexity.
  • Unlike HDFRP-confined square concrete columns, the peak stress of HDFRP-confined rectangular short concrete columns increases notably with larger corner radii. Sharp corners require greater axial deformation to activate the effective confinement of HDFRP. Although the overall strength of HDFRP-CRCCs is significantly influenced by corner radius, even sharp-corner specimens exhibit improved strength—addressing the difficulty in enhancing strength due to non-uniform lateral dilation in FRP-confined rectangular short concrete columns.
  • Increasing the thickness of HDFRP significantly enhances the strength of rectangular short concrete columns. Based on the test results, it is recommended that for strengthening concrete members with a larger cross-sectional aspect ratio, HDFRP with a greater thickness of layers (e.g., 10PP8G10PP) be employed, and the corners be rounded (it is recommended that r ≥ 20 mm).
  • To ensure the safety redundancy of the strengthening project, the efficiency coefficients of both glass fibers and PP fibers in the HDFRP-confined rectangular concrete column specimens are taken as a constant value of 0.6 in this study.
  • Based on the axial compression tests, a design-oriented stress–strain model applicable to HDFRP-confined rectangular short concrete columns is established in this paper. The model explicitly incorporates the effects of the cross-sectional aspect ratio, corner radius, and HDFRP thickness, and can accurately describe the axial compressive behavior of the specimens.
  • This study provides a theoretical basis for the application of HDFRP materials in the strengthening of rectangular concrete structures, while also holding considerable significance for advancing the development of low-cost, high-performance, and easy-to-construct fiber-reinforced concrete strengthening techniques.

Author Contributions

Conceptualization, Y.J.; Methodology, Y.J.; Software, Y.J.; Validation, Y.J.; Formal analysis, Y.J., C.W., and W.H.; Investigation, Y.J.; Resources, Y.J. and C.W.; Data curation, Y.J.; Writing—review and editing, Y.J.; Supervision, C.W. and W.H. All authors have read and agreed to the published version of the manuscript.

Funding

This work was supported by the National Natural Science Foundation of China (Grant No. 52378521) and the Hebei Province Education Science “14th Five-Year Plan” Research Project (Grant No. 2402064).

Data Availability Statement

The data presented in this study are available on request from the corresponding author.

Conflicts of Interest

The authors declare no conflicts of interest.

References

  1. Shayanfar, J.; Barros, J.A.O.; Rezazadeh, M. Generalized Analysis-oriented model of FRP confined concrete circular columns. Compos. Struct. 2021, 270, 114026. [Google Scholar] [CrossRef] [Scilit]
  2. Jiang, C.; Yu, Q.-Q.; Gu, X.-L. A unified bond-slip model for the interface between FRP and steel. Compos. Part B Eng. 2021, 227, 109380. [Google Scholar] [CrossRef] [Scilit]
  3. Tran, D.T.; Pham, T.M.; Hao, H.; Chen, W. Numerical investigation of flexural behaviours of precast segmental concrete beams internally post-tensioned with unbonded FRP tendons under monotonic loading. Eng. Struct. 2021, 249, 113341. [Google Scholar] [CrossRef] [Scilit]
  4. Jirawattanasomkul, T.; Likitlersuang, S.; Wuttiwannasak, N.; Ueda, T.; Zhang, D.; Shono, M. Structural behaviour of pre-damaged reinforced concrete beams strengthened with natural fibre reinforced polymer composites. Compos. Struct. 2020, 244, 112309. [Google Scholar] [CrossRef] [Scilit]
  5. Isleem, H.F.; Peng, F.; Tayeh, B.A. Confinement model for LRS FRP-confined concrete using conventional regression and artificial neural network techniques. Compos. Struct. 2022, 279, 114779. [Google Scholar] [CrossRef] [Scilit]
  6. Zeng, J.-J.; Zeng, W.-B.; Ye, Y.-Y.; Liao, J.; Zhuge, Y.; Fan, T.-H. Flexural behavior of FRP grid reinforced ultra-high-performance concrete composite plates with different types of fibers. Eng. Struct. 2022, 272, 115020. [Google Scholar] [CrossRef] [Scilit]
  7. Nguyen, T.T.; Selvaraj, S.; Chan, T.M.; Mottram, J.T. Influence of combined imperfections on lateral-torsional buckling behaviour of pultruded FRP beams. Compos. Struct. 2023, 304, 116385. [Google Scholar] [CrossRef] [Scilit]
  8. Maras, M.M.; Kantarci, F. Structural behavior of RC beams strengthened using fiber-reinforced polymer U-jackets. Struct. Concr. 2023, 24, 2384–2401. [Google Scholar] [CrossRef] [Scilit]
  9. Liao, J.; Zeng, J.-J.; Quach, W.-M.; Zhou, J.-K. Axial compressive behavior and model assessment of FRP-confined seawater sea-sand concrete-filled stainless steel tubular stub columns. Compos. Struct. 2023, 311, 116782. [Google Scholar] [CrossRef] [Scilit]
  10. Zhang, Y.; Wei, Y.; Li, B.; Wang, G.; Huang, L. A novel seawater and sea sand concrete-filled CFRP-carbon steel composite tube column: Seismic behavior and finite element analysis. Eng. Struct. 2022, 270, 114872. [Google Scholar] [CrossRef] [Scilit]
  11. Zhou, J.-K.; Zeng, J.-J.; Liang, Q.-J.; Dai, H.-S.; Fan, T.-H. Compressive behavior of PET FRP-confined concrete encased CFST columns. J. Constr. Steel Res. 2023, 202, 107732. [Google Scholar] [CrossRef] [Scilit]
  12. Zeng, J.-J.; Pan, B.-Z.; Fan, T.-H.; Zhuge, Y.; Liu, F.; Li, L.-J. Shear behavior of FRP-UHPC tubular beams. Compos. Struct. 2023, 307, 116576. [Google Scholar] [CrossRef] [Scilit]
  13. Dong, Z.; Han, T.; Zhang, B.; Zhu, H.; Wu, G.; Wei, Y.; Zhang, P. A review of the research and application progress of new types of concrete-filled FRP tubular members. Constr. Build. Mater. 2021, 312, 125353. [Google Scholar] [CrossRef] [Scilit]
  14. Hassanli, R.; Youssf, O.; Vincent, T.; Mills Julie, E.; Manalo, A.; Gravina, R. Experimental Study on Compressive Behavior of FRP-Confined Expansive Rubberized Concrete. J. Compos. Constr. 2020, 24, 04020034. [Google Scholar] [CrossRef] [Scilit]
  15. Rochette, P.; Labossière, P. Axial Testing of Rectangular Column Models Confined with Composites. J. Compos. Constr. 2000, 4, 129–136. [Google Scholar] [CrossRef] [Scilit]
  16. Pessiki, S.; Harries Kent, A.; Kestner Justin, T.; Sause, R.; Ricles James, M. Axial Behavior of Reinforced Concrete Columns Confined with FRP Jackets. J. Compos. Constr. 2001, 5, 237–245. [Google Scholar] [CrossRef] [Scilit]
  17. Parvin, A.; Wang, W. Behaviour of FRP Jacked Concrete Columns under Eccentric Loading. J. Compos. Constr. 2001, 5, 146–152. [Google Scholar] [CrossRef] [Scilit]
  18. Lam, L.; Teng, J.G.; Cheung, C.H.; Xiao, Y. FRP-confined concrete under axial cyclic compression. Cem. Concr. Compos. 2006, 28, 949–958. [Google Scholar] [CrossRef] [Scilit]
  19. Teng, J.G.; Yu, T.; Wong, Y.L.; Dong, S.L. Hybrid FRP–concrete–steel tubular columns: Concept and behavior. Constr. Build. Mater. 2007, 21, 846–854. [Google Scholar] [CrossRef] [Scilit]
  20. Jiang, T.; Teng, J.G. Analysis-oriented stress–strain models for FRP–confined concrete. Eng. Struct. 2007, 29, 2968–2986. [Google Scholar] [CrossRef] [Scilit]
  21. Saleem, S.; Shah, O.H.; Jirawattanasomkul, T.; Dawei, Z.; Pimanmas, A.; Kunawisarut, A.; Srivaranun, S. Evaluating natural and synthetic fibers in strengthening concrete column specimens with varying corner radii and aspect ratios. J. Build. Eng. 2025, 103, 112095. [Google Scholar] [CrossRef] [Scilit]
  22. Wu, Y.-F.; Wei, Y.-Y. Effect of cross-sectional aspect ratio on the strength of CFRP-confined rectangular concrete columns. Eng. Struct. 2010, 32, 32–45. [Google Scholar] [CrossRef] [Scilit]
  23. Shehata, I.; Carneiro, L.; Shehata, L. Strength of short concrete columns confined with CFRP sheets. Mater. Struct. 2002, 35, 50–58. [Google Scholar] [CrossRef] [Scilit]
  24. Saleem, S.; Hussain, Q.; Pimanmas, A. Compressive Behavior of PET FRP–Confined Circular, Square, and Rectangular Concrete Columns. J. Compos. Constr. 2017, 21, 04016097. [Google Scholar] [CrossRef] [Scilit]
  25. Wang, Y.; Liu, P.; Cao, Q.; Chen, G.; Wan, B.; Wei, Z.; Bai, Y.-L. Comparison of monotonic axial compressive behavior of rectangular concrete confined by FRP with different rupture strains. Constr. Build. Mater. 2021, 299, 124241. [Google Scholar] [CrossRef] [Scilit]
  26. Hany Najwa, F.; Hantouche Elie, G.; Harajli Mohamed, H. Axial Stress-Strain Model of CFRP-Confined Concrete under Monotonic and Cyclic Loading. J. Compos. Constr. 2015, 19, 04015004. [Google Scholar] [CrossRef] [Scilit]
  27. Youssef, M.N.; Feng, M.Q.; Mosallam, A.S. Stress–strain model for concrete confined by FRP composites. Compos. Part B Eng. 2007, 38, 614–628. [Google Scholar] [CrossRef] [Scilit]
  28. Lam, L.; Teng, J.G. Design-oriented stress–strain model for FRP-confined concrete. Constr. Build. Mater. 2003, 17, 471–489. [Google Scholar] [CrossRef] [Scilit]
  29. Zeng, J.-J.; Liao, J.; Zhu, D.-H.; Li, P.-D. Axial compressive behavior and design-oriented model for large-rupture-strain (LRS) FRP-confined concrete in rectangular columns. J. Build. Eng. 2023, 75, 106925. [Google Scholar] [CrossRef] [Scilit]
  30. Tan, K.H.; Bhowmik, T.; Balendra, T. Confinement model for FRP-bonded capsule-shaped concrete columns. Eng. Struct. 2013, 51, 51–59. [Google Scholar] [CrossRef] [Scilit]
  31. Triantafillou, T.C.; Choutopoulou, E.; Fotaki, E.; Skorda, M.; Stathopoulou, M.; Karlos, K. FRP confinement of wall-like reinforced concrete columns. Mater. Struct. 2016, 49, 651–664. [Google Scholar] [CrossRef] [Scilit]
  32. Li, X.; Lu, J.; Ding, D.-D.; Wang, W. Axial strength of FRP-confined rectangular RC columns with different cross-sectional aspect ratios. Mag. Concr. Res. 2017, 69, 1011–1026. [Google Scholar] [CrossRef] [Scilit]
  33. Hany Najwa, F.; Hantouche Elie, G.; Harajli Mohamed, H. Generalized Axial Stress-Strain Response of Rectangular Columns Confined Using CFRP Jackets and Anchors. J. Compos. Constr. 2017, 21, 04016063. [Google Scholar] [CrossRef] [Scilit]
  34. Shen, Z.; Liu, W.; Zhang, Q. Tensile behavior of high-performance interlayer hybrid composites of polypropylene and glass fiber for civil engineering. Constr. Build. Mater. 2023, 403, 133017. [Google Scholar] [CrossRef] [Scilit]
  35. Shen, Z.; Liu, W. Tensile properties of PP and PET fiber bundles in outdoor thermal environment. ACI Mater. J. 2025, 122, 15–24. [Google Scholar]
  36. Liu, W.G.; Shen, Z.H.; Zhang, Q.; Li, Z.J. High ductile-FRP confined concrete in compression: A novel design concept for ductile column in seismic retrofit. Struct. Concr. 2025, 26, 1027–1040. [Google Scholar] [CrossRef] [Scilit]
  37. Shen, Z.; Li, Z.; Zhang, J.; Meng, F. Enhanced strength and ductile of high ductile FRP-concrete composite columns: Compressive behavior and mechanism. Compos. Struct. 2025, 372, 119548. [Google Scholar] [CrossRef] [Scilit]
  38. Shen, Z.; Liu, W.; Zhong, M.; Zhang, Q. Long-term performance of interlayer hybrid composites of polypropylene and glass fiber exposed to salt solution and deionized water at elevated temperatures. Constr. Build. Mater. 2024, 438, 136879. [Google Scholar] [CrossRef] [Scilit]
  39. Ozdemir, M.F.; Maras, M.M.; Yurtseven, H.B. Flexural Behavior of Laminated Wood Beams Strengthened with Novel Hybrid Composite Systems: An Experimental Study. J. Korean Wood Sci. Technol. 2023, 51, 526–541. [Google Scholar] [CrossRef] [Scilit]
  40. Dai, J.-G.; Bai, Y.-L.; Teng, J.G. Behavior and Modeling of Concrete Confined with FRP Composites of Large Deformability. J. Compos. Constr. 2011, 15, 963–973. [Google Scholar] [CrossRef] [Scilit]
  41. Yu, T.; Chan, C.; Teh, L.; Teng, J.G. Hybrid FRP-Concrete-Steel Multitube Concrete Columns: Concept and Behavior. J. Compos. Constr. 2017, 21, 04017044. [Google Scholar] [CrossRef] [Scilit]
  42. 50081 GT; Standard Test Methods for Physical and Mechanical Properties of Concrete. Ministry of Construction of the People’s Republic of China: Beijing, China, 2019.
  43. D638-08 A; Standard Test Method for Tensile Properties of Plastics. ASTM International: West Conshohocken, PA, USA, 2022.
  44. Abbasnia, R.; Ziaadiny, H. Experimental investigation and strength modeling of CFRP-confined concrete rectangular prisms under axial monotonic compression. Mater. Struct. 2013, 48, 485–500. [Google Scholar] [CrossRef] [Scilit]
  45. Chen, J.F.; Li, S.Q.; Bisby, L.A. Factors Affecting the Ultimate Condition of FRP-Wrapped Concrete Columns. J. Compos. Constr. 2013, 17, 67–78. [Google Scholar] [CrossRef] [Scilit]
  46. Zeng, J.-J.; Zhu, D.-H.; Liao, J.; Zhuge, Y.; Bai, Y.-L.; Zhang, L. Large-rupture-strain (LRS) FRP-confined concrete in square stub columns: Effects of specimen size and assessments of existing models. Constr. Build. Mater. 2022, 326, 126869. [Google Scholar] [CrossRef] [Scilit]
  47. Liao, J.; Yang, K.Y.; Zeng, J.-J.; Quach, W.-M.; Ye, Y.-Y.; Zhang, L. Compressive behavior of FRP-confined ultra-high performance concrete (UHPC) in circular columns. Eng. Struct. 2021, 249, 113246. [Google Scholar] [CrossRef] [Scilit]
  48. Liao, J.; Zeng, J.-J.; Gong, Q.-M.; Quach, W.-M.; Gao, W.-Y.; Zhang, L. Design-oriented stress-strain model for FRP-confined ultra-high performance concrete (UHPC). Constr. Build. Mater. 2022, 318, 126200. [Google Scholar] [CrossRef] [Scilit]
  49. Lam, L.; Teng, J.G. Ultimate Condition of Fiber Reinforced Polymer-Confined Concrete. J. Compos. Constr. 2004, 8, 539–548. [Google Scholar] [CrossRef] [Scilit]
  50. Wu, Y.-F.; Zhou, Y.-W. Unified Strength Model Based on Hoek-Brown Failure Criterion for Circular and Square Concrete Columns Confined by FRP. J. Compos. Constr. 2010, 14, 175–184. [Google Scholar] [CrossRef] [Scilit]
Figure 1. Schematic diagram of chamfer strips and mold.
Buildings 16 01942 g001
Figure 2. Schematic diagram of HDFRP-confined rectangular concrete column.
Buildings 16 01942 g002
Figure 3. Test setup and instrumentation layout for HDFRP-CRCC specimens under axial compression.
Buildings 16 01942 g003
Figure 4. HDFRP-CRCC specimens: typical failure modes (The final failure points marked by red dashed circles).
Buildings 16 01942 g004
Figure 5. Axial compressive stress–strain curves of HDFRP-CRCCs and unconfined specimens.
Buildings 16 01942 g005
Figure 6. Key characteristic points and mechanical parameters on the axial compressive stress–strain curve of specimen 6PP6G6PP-A1.5-r30-I.
Buildings 16 01942 g006
Figure 7. Influence of aspect ratio and corner radius.
Buildings 16 01942 g007aBuildings 16 01942 g007b
Figure 8. Influence of HDFRP thickness on key point parameters.
Buildings 16 01942 g008aBuildings 16 01942 g008b
Figure 9. The relationship between the stress ratio at the peak and transition point of the HDFRP-CRCCs and the confinement stress ratio (Each red ball in the figure represents a corresponding data set.).
Buildings 16 01942 g009
Figure 10. The relationship between the strain ratio at the transition and ultimate point of the HDFRP-CRCCs and the confinement stress ratio.
Buildings 16 01942 g010
Figure 11. Comparison of experimental and predicted full axial stress–strain curves.
Buildings 16 01942 g011
Table 1. Detailed parameters of the tested specimens.
Specimen LabelCross-Section
h (mm) × b (mm)
Height
(mm)
Corner Radius (mm)Glass Fiber Layer Thickness (mm)PP Fiber Layer Thickness (mm)
6PP6G6PP-A1.5-r0-I, II150 × 10030000.4921.572
6PP6G6PP-A1.5-r20-I, II150 × 100300200.4921.572
6PP6G6PP-A1.5-r30-I, II150 × 100300300.4921.572
6PP6G6PP-A2.0-r0-I, II200 × 10030000.4921.572
6PP6G6PP-A2.0-r20-I, II200 × 100300200.4921.572
6PP6G6PP-A2.0-r30-I, II200 × 100300300.4921.572
10PP8G10PP-A1.0-r20-I, II150 × 150300200.6562.620
10PP8G10PP-A1.5-r0-I, II150 × 10030000.6562.620
10PP8G10PP-A1.5-r20-I, II150 × 100300200.6562.620
10PP8G10PP-A1.5-r30-I, II150 × 100300300.6562.620
10PP8G10PP-A2.0-r0-I, II200 × 10030000.6562.620
10PP8G10PP-A2.0-r20-I, II200 × 100300200.6562.620
10PP8G10PP-A2.0-r30-I, II200 × 100300300.6562.620
Table 2. Mix properties of the concrete.
W/CCement (kg/m3)Coarse Aggregate (kg/m3)Fine Aggregate (kg/m3)Compressive Strength (MPa)
0.56370721112728.09
Table 3. Axial compressive mechanical properties of the tested specimens.
Specimen Labelr (mm)fco (MPa)fc1 (MPa)fc1/fcofc2 (MPa)fc2/fcofc3 (MPa)fc3/fcoεc1εc1/εcoεc2εc2/εcoεc3εc3/εco
6PP6G6PP-A1.5-r0-I025.633.031.29 23.700.93 34.471.35 0.0027 1.220.0089 4.03 0.2320 105.44
6PP6G6PP-A1.5-r0-II025.635.011.37 24.320.95 35.841.40 0.0035 1.590.1090 49.56 0.2199 99.96
6PP6G6PP-A1.5-r20-I2025.648.821.91 36.041.41 38.891.52 0.0077 3.510.0405 18.39 0.1340 60.91
6PP6G6PP-A1.5-r20-II2025.648.411.89 34.411.34 40.141.57 0.0078 3.540.0667 30.31 0.1260 57.27
6PP6G6PP-A1.5-r30-I3025.655.222.16 39.071.53 44.091.72 0.0185 8.430.0491 22.31 0.1422 64.62
6PP6G6PP-A1.5-r30-II3025.652.392.05 36.971.44 38.881.52 0.0211 9.580.0495 22.48 0.1552 70.52
6PP6G6PP-A2.0-r0-I025.834.391.33 22.700.88 29.381.14 0.0029 1.320.1080 49.11 0.2560 116.36
6PP6G6PP-A2.0-r0-II025.834.351.33 20.360.79 25.640.99 0.003 1.560.1054 47.89 0.2032 92.36
6PP6G6PP-A2.0-r20-I2025.836.831.43 23.230.90 29.631.15 0.0034 1.540.0743 33.78 0.1767 80.33
6PP6G6PP-A2.0-r20-II2025.834.571.34 26.801.04 28.691.11 0.0031 1.410.0361 16.39 0.1900 86.34
6PP6G6PP-A2.0-r30-I3025.842.641.65 28.071.09 31.281.21 0.0235 10.60.0635 28.88 0.1133 51.49
6PP6G6PP-A2.0-r30-II3025.843.831.70 31.141.21 32.021.24 0.0252 11.40.0613 27.86 0.1300 59.11
10PP8G10PP-A1.0-r20-I2022.157.822.62 41.931.90 52.272.37 0.0098 4.650.0535 25.48 0.1374 65.41
10PP8G10PP-A1.0-r20-II2022.153.642.43 40.761.84 54.032.44 0.0099 4.700.0604 28.76 0.1561 74.33
10PP8G10PP-A1.5-r0-I025.646.681.82 38.841.52 50.091.96 0.0021 0.950.0557 25.30 0.2301 104.61
10PP8G10PP-A1.5-r0-II025.647.461.85 39.851.56 50.621.98 0.0035 1.590.0501 22.79 0.2132 96.90
10PP8G10PP-A1.5-r20-I2025.662.062.42 51.492.01 62.342.44 0.0127 5.770.0617 28.05 0.1604 72.93
10PP8G10PP-A1.5-r20-II2025.655.332.16 43.671.71 57.972.26 0.0136 6.190.0479 21.77 0.1764 80.17
10PP8G10PP-A1.5-r30-I3025.676.833.00 56.452.21 69.022.70 0.0212 9.640.0705 32.03 0.2137 97.13
10PP8G10PP-A1.5-r30-II3025.672.512.83 52.272.04 70.402.75 0.0222 10.070.0729 33.14 0.1972 89.63
10PP8G10PP-A2.0-r0-I025.834.281.33 18.570.72 41.461.61 0.0021 0.940.0103 4.70 0.2714 123.37
10PP8G10PP-A2.0-r0-II025.836.271.41 30.511.18 41.731.62 0.0037 1.670.0582 26.47 0.2109 95.84
10PP8G10PP-A2.0-r20-I2025.841.101.59 33.781.31 36.241.40 0.0125 5.670.0287 13.04 0.0870 39.54
10PP8G10PP-A2.0-r20-II2025.848.261.87 35.071.36 37.521.45 0.0256 11.650.0860 39.10 0.1358 61.72
10PP8G10PP-A2.0-r30-I3025.850.971.98 38.881.51 45.741.77 0.0189 8.610.0838 38.11 0.1578 71.75
10PP8G10PP-A2.0-r30-II3025.853.822.09 39.821.54 46.651.81 0.0216 9.820.0432 19.65 0.1876 85.25
Note: fco and εco = Strength and corresponding strain of unconfined concrete; fc1 and εc1 = Peak stress and corresponding strain of HDFRP-CRCC; fc2 and εc2 = Transition stress and corresponding strain of HDFRP-CRCC; fc3 and εc3 = Ultimate stress and corresponding strain of HDFRP-CRCC.
Table 4. Observed lateral strains in the tested specimens upon glass fiber layer rupture.
Specimen Labelr (mm)εhlεhsεheεminεmaxkεlkεskεekε,minkε,maxkε
6PP6G6PP-A1.5-r0-I00.0034 0.0005 0.0034 0.0010 0.0065 0.19 0.03 0.19 0.06 0.36 0.912
6PP6G6PP-A1.5-r0-II00.0032 0.0005 0.0032 0.0023 0.0048 0.18 0.03 0.18 0.13 0.27
6PP6G6PP-A1.5-r20-I200.0224 −0.0006 0.0224 0.0214 0.0247 1.25 −0.03 1.25 1.20 1.38
6PP6G6PP-A1.5-r20-II200.0184 −0.0037 0.0184 0.0120 0.0334 1.03 −0.20 1.03 0.67 1.86
6PP6G6PP-A1.5-r30-I300.0274 0.0010 0.0274 0.0225 0.0333 1.53 0.05 1.53 1.26 1.86
6PP6G6PP-A1.5-r30-II300.0267 −0.0040 0.0267 0.0219 0.0332 1.49 −0.22 1.49 1.22 1.86
6PP6G6PP-A2.0-r0-I00.0039 −0.0003 0.0039 0.0020 0.0060 0.22 −0.02 0.22 0.11 0.33
6PP6G6PP-A2.0-r0-II00.0035 −0.0005 0.0035 0.0015 0.0069 0.20 −0.03 0.20 0.08 0.39
6PP6G6PP-A2.0-r20-I200.0086 −0.0001 0.0086 0.0034 0.0152 0.48 −0.01 0.48 0.19 0.85
6PP6G6PP-A2.0-r20-II200.0056 0.0007 0.0056 0.0026 0.0087 0.31 0.04 0.31 0.15 0.49
6PP6G6PP-A2.0-r30-I300.0351 --0.0351 0.0276 0.0478 1.96 --1.96 1.54 2.67
6PP6G6PP-A2.0-r30-II300.0375 --0.0375 0.0285 0.0476 2.10 --2.10 1.59 2.66
10PP8G10PP-A1.0-r20-I200.0167 −0.0024 0.0167 0.0166 0.0169 0.93 −0.13 0.93 0.93 0.94 0.927
10PP8G10PP-A1.0-r20-II200.0165 −0.0041 0.0165 0.0162 0.0168 0.92 −0.23 0.92 0.90 0.94
10PP8G10PP-A1.5-r0-I00.0023 --0.0023 0.0015 0.0031 0.13 --0.13 0.08 0.17 1.136
10PP8G10PP-A1.5-r0-II00.0038 --0.0038 0.0025 0.0052 0.21 --0.21 0.14 0.29
10PP8G10PP-A1.5-r20-I200.0118 0.0005 0.0118 0.0106 0.0130 0.66 0.03 0.66 0.59 0.73
10PP8G10PP-A1.5-r20-II200.0143 −0.0018 0.0143 0.0137 0.0149 0.80 −0.10 0.80 0.77 0.83
10PP8G10PP-A1.5-r30-I300.0267 0.0003 0.0267 0.0134 0.0374 1.49 0.02 1.49 0.75 2.09
10PP8G10PP-A1.5-r30-II300.0313 −0.0011 0.0313 0.0192 0.0437 1.75 −0.06 1.75 1.07 2.44
10PP8G10PP-A2.0-r0-I00.0031 0.0003 0.0031 0.0011 0.0062 0.17 0.01 0.17 0.06 0.34
10PP8G10PP-A2.0-r0-II00.0100 −0.0025 0.0100 0.0037 0.0176 0.56 −0.14 0.56 0.21 0.99
10PP8G10PP-A2.0-r20-I200.0354 --0.0354 0.0145 0.0790 1.98 --1.98 0.81 4.42
10PP8G10PP-A2.0-r20-II200.0368 --0.0368 0.0258 0.0463 2.06 --2.06 1.44 2.59
10PP8G10PP-A2.0-r30-I300.0361 --0.0361 0.0297 0.0515 2.02 --2.02 1.66 2.88
10PP8G10PP-A2.0-r30-II300.0323 --0.0323 0.0226 0.0420 1.80 --1.80 1.26 2.34
Note: εhl and kεl = Mean lateral strains at the mid-points of the sides and the corresponding efficiency coefficients for the rectangular columns.; εhs and kεs = Mean lateral strain at the corner of the rectangular column and corresponding efficiency factor; εhe and kεe = Mean lateral strain and corresponding efficiency factor of rectangular specimens; εmin and εmax = Minimum and maximum lateral strain; kε,min and kε,max = Minimum and maximum strain efficiency factor; kε = Mean strain efficiency factor of specimens; “--" indicates that no corresponding reading was recorded due to strain gauge failure during testing.
Table 5. Observed lateral strains in the tested specimens upon PP fiber layer rupture.
Specimen Labelr (mm)εhlεhsεheεminεmaxkεlkεskεekε,minkε,maxkε
6PP6G6PP-A1.5-r0-I00.2312 --0.2312 0.0896 0.3512 0.95 --0.95 0.37 1.45 0.768
6PP6G6PP-A1.5-r0-II00.1958 --0.1958 0.1434 0.2442 0.81 --0.81 0.59 1.00
6PP6G6PP-A1.5-r20-I200.1550 --0.1550 0.1327 0.1653 0.64 --0.64 0.55 0.68
6PP6G6PP-A1.5-r20-II200.1379 --0.1379 0.1058 0.1823 0.57 --0.57 0.44 0.75
6PP6G6PP-A1.5-r30-I300.1528 --0.1528 0.1200 0.2136 0.63 --0.63 0.49 0.88
6PP6G6PP-A1.5-r30-II300.1362 --0.1362 0.0906 0.1665 0.56 --0.56 0.37 0.69
6PP6G6PP-A2.0-r0-I00.3382 --0.3382 0.3196 0.3552 1.39 --1.39 1.32 1.46
6PP6G6PP-A2.0-r0-II00.2059 --0.2059 0.1047 0.2416 0.85 --0.85 0.43 0.99
6PP6G6PP-A2.0-r20-I200.1802 --0.1802 0.1285 0.2414 0.74 --0.74 0.53 0.99
6PP6G6PP-A2.0-r20-II200.2179 --0.2179 0.1673 0.2989 0.90 --0.90 0.69 1.23
6PP6G6PP-A2.0-r30-I300.1388 --0.1388 0.1097 0.1638 0.57 --0.57 0.45 0.67
6PP6G6PP-A2.0-r30-II300.1494 --0.1494 0.1316 0.1795 0.61 --0.61 0.54 0.74
10PP8G10PP-A1.0-r20-I200.1648 --0.1648 0.1558 0.1738 0.68 --0.68 0.64 0.72 0.662
10PP8G10PP-A1.0-r20-II200.1567 --0.1567 0.1525 0.1609 0.64 --0.64 0.63 0.66
10PP8G10PP-A1.5-r0-I00.2531 --0.2531 0.1645 0.3418 1.04 --1.04 0.68 1.41 0.825
10PP8G10PP-A1.5-r0-II00.2324 --0.2324 0.1543 0.3105 0.96 --0.96 0.63 1.28
10PP8G10PP-A1.5-r20-I200.1405 --0.1405 0.1299 0.1511 0.58 --0.58 0.53 0.62
10PP8G10PP-A1.5-r20-II200.1772 --0.1772 0.1731 0.1813 0.73 --0.73 0.71 0.75
10PP8G10PP-A1.5-r30-I300.2693 --0.2693 0.1778 0.3609 1.11 --1.11 0.73 1.49
10PP8G10PP-A1.5-r30-II300.2074 --0.2074 0.1883 0.2318 0.85 --0.85 0.77 0.95
10PP8G10PP-A2.0-r0-I00.2803 --0.2803 0.2097 0.3500 1.15 --1.15 0.86 1.44
10PP8G10PP-A2.0-r0-II00.2107 --0.2107 0.1254 0.3199 0.87 --0.87 0.52 1.32
10PP8G10PP-A2.0-r20-I200.1132 --0.1132 0.0687 0.1975 0.47 --0.47 0.28 0.81
10PP8G10PP-A2.0-r20-II200.1717 --0.1717 0.1148 0.2882 0.71 --0.71 0.47 1.19
10PP8G10PP-A2.0-r30-I300.1571 --0.1571 0.1451 0.1848 0.65 --0.65 0.60 0.76
10PP8G10PP-A2.0-r30-II300.1940 --0.1940 0.1358 0.2522 0.80 --0.80 0.56 1.04
Note: εhl and kεl = Mean lateral strains at the mid-points of the sides and the corresponding efficiency coefficients for the rectangular columns.; εhs and kεs = Mean lateral strain at the corner of the rectangular column and corresponding efficiency factor; εhe and kεe = Mean lateral strain and corresponding efficiency coefficients of rectangular specimens; εmin and εmax = Minimum and maximum lateral strain; kε,min and kε,max = Minimum and maximum strain efficiency factor; kε = Mean strain efficiency coefficients of specimens; “--" indicates that no corresponding reading was recorded due to strain gauge failure during testing.
Table 6. Stress–strain model of HDFRP.
Characteristic PointsFormulation
Point A σ Pa = E G ε G v g , v g 30 % E G ε G v g 1.31 1.04 v g , v g > 30 % ;   ε Pb = ε G , v g 30 % ε G 1.31 1.04 v g , v g > 30 %
Point B σ Pb = 2 J E PP t PP 1 v g 1 + 2 E PP t PP E G t G ;   ε Pb = ε G , v g 30 % ε G 1.31 1.04 v g , v g > 30 %
Point C σ Pc = 2 J E PP t PP 1 v g 1 + 2 E PP t PP E G t G ;   ε Pc = ε PP K 1 V PP w + 2 J E PP t PP 1 + 2 E PP t PP E G t G f PP K 1 V PP w α E PP
Point D σ Pd = f PP K 1 V PP w 1 v g ;   ε Pd = ε PP K 1 V PP w
Table 7. Stress–strain model.
Curve PortionModel Formulation
Ascending portion σ c = E m ε c E m E q 2 3.04 f c 1 ε c 2 , 0 ε c ε n 0.76 f c 1 + E q ε c , ε n < ε c ε c 1 ;  where
ε n = 1.52 f c 1 E m E q ;   E q = 0.24 f c 1 ε c 1 , f l f co 0.07 0 , f l f co < 0.07
Softening descending portion σ c = A ε c 2 + B ε c + c ;  where
A = f c 1 f c 2 ε c 1 ε c 2 2 ;   B = 2 f c 2 f c 1 ε c 1 ε c 2 2 ε c 2 ;   c = f c 2 + f c 1 f c 2 ε c 1 ε c 2 2 ε c 2 2
Second ascending portion σ c = f c 3 f c 2 ε c 3 ε c 2 ε c ε c 3 + f c 3
Disclaimer/Publisher’s Note: The statements, opinions and data contained in all publications are solely those of the individual author(s) and contributor(s) and not of MDPI and/or the editor(s). MDPI and/or the editor(s) disclaim responsibility for any injury to people or property resulting from any ideas, methods, instructions or products referred to in the content.