Article

Heterogeneous Effects of Road Network Structure Characteristics on Household Carbon Emissions for the Western Valley Cities in China

1
School of Architecture and Art Design, Lanzhou University of Technology, Lanzhou 730050, China
2
College of Geography and Environmental Science, Northwest Normal University, Lanzhou 730070, China
*
Author to whom correspondence should be addressed.
Buildings 2026, 16(10), 1906; https://doi.org/10.3390/buildings16101906
Submission received: 21 February 2026 / Revised: 11 April 2026 / Accepted: 17 April 2026 / Published: 11 May 2026

Abstract

Understanding how urban road network structures influence household carbon emissions is fundamental to developing low-carbon urban environments. This study examines China’s Western Valley cities (WVCs), which have distinct structural characteristics, to analyze the heterogeneous effects of road network structures on household carbon emissions. Using 2020 household carbon emissions and road network data, we employed stepwise regression and curve estimation regression models to clarify these relationships based on the distribution patterns of both variables. The following are the key findings of this study: (1) Substantial differences exist between cities in terms of total household carbon emissions, per capita emissions, and per capita land use. (2) Regarding road network structure, cities can be categorized into three types—clusters, fingers, and belts—based on the distribution of high and low values of closeness centrality (CC), with four, five, and six cities falling into each category, respectively. While compactness differences between cities are relatively small, variability exhibits large disparities, leading to different city rankings and highlighting the complexity of road network organization. (3) The three structural characteristics show significant correlations with household carbon emissions not only in terms of direction but also magnitude and influence mechanisms. (4) CC follows an inverse function pattern, initially declining sharply before gradually stabilizing. Compactness follows a positive linear growth pattern, consistently promoting household carbon emissions. Variability exhibits a positive power-law growth pattern, showing a sharp initial increase that weakens over time.

1. Introduction

Cities are the primary geographical units for human socio-economic activities and serve as major centers of energy consumption and carbon emissions. Moreover, they play a pivotal role in national efforts toward energy conservation, emission reduction, and low-carbon development [1,2]. In the context of China’s active and steady implementation of the Dual Carbon strategy, the 14th Five-Year Plan New-Type Urbanization Implementation Plan explicitly outlines key initiatives for “promoting the low-carbon transition of production and lifestyles” within its policy framework for advancing new urban development models. As urbanization progresses and living standards steadily improve, domestic research on urban carbon emission reduction has gradually shifted its focus from industrial household carbon emissions to household emissions related to daily living [3,4]. The Sixth Assessment Report (AR6) of the Intergovernmental Panel on Climate Change (IPCC) highlights that household consumption accounts for 40–50% of China’s total carbon footprint, making it the second-largest source of emissions after industrial activities. This underscores the critical importance and substantial mitigation potential of addressing lifestyle-related emissions in China’s decarbonization efforts [5]. Urban road networks, as fundamental physical infrastructures that support socio-economic activities such as production and daily living, play a crucial role in shaping urban spatial structures by influencing the spatial distribution of urban elements and land-use patterns [6,7,8]. Recognized as both a key component of urban composition and a driving force behind spatial expansion [9], road networks exert profound and path-dependent effects on urban land utilization and spatial organization. Additionally, they are inherently linked to energy consumption and carbon emissions [10].
While research on the factors influencing household carbon emissions has made some progress, most studies have primarily focused on socio-economic indicators, such as household income levels [11,12], residential consumption patterns [13], population density [4], economic development level and industrial structure [14], and land-use scale [15]. Other studies have integrated multiple socio-economic and spatial indicators into comprehensive metrics, such as the sprawl index [16] and agglomeration degree [17], but have paid little attention to road network structures as a critical influencing factor.
Regarding transportation carbon emissions research, most studies have focused on vehicle-related parameters [18,19], transport turnover volume [20], and travel time [21]. However, these studies fail to systematically incorporate road network structural attributes into their analytical models. Although substantial progress has been made in urban carbon emission studies, research on the relationship between emissions and road networks has predominantly centered on quantitative metrics such as road length [22], network density [22,23,24,25], intersection density [26], and per capita road area [27]. These indicators primarily reflect infrastructure quantity while overlooking the qualitative structural attributes that define road network organization. Consequently, studies on citywide emissions, transportation-related emissions, and household carbon footprints have rarely incorporated measures capturing the structural quality of urban road networks. Moreover, existing case studies seldom address the unique spatial configurations of Western Valley cities (WVCs), where topographic constraints and development patterns differ significantly from those of cities in plains or coastal regions. To bridge these research gaps, this study selects 15 representative WVCs as case studies. By quantifying household carbon emissions and analyzing urban road network structures, including proximity centrality, compactness, and variability, we employ stepwise regression and curvilinear regression analyses to uncover the mechanisms through which road network structures influence residential carbon footprints. The objectives of this study were to (1) fill critical knowledge gaps regarding urban carbon emission drivers, particularly the underexplored link between spatial structures and carbon outputs; (2) establish a methodological framework for assessing road network quality in topographically constrained cities; and (3) provide a theoretical foundation for optimizing road networks, designing low-carbon urban spatial structures, and guiding sustainable urban planning in western valley regions.

2. Study Area, Methods, and Steps

2.1. Study Area

Valley cities are urban settlements primarily developed within river valleys, where their expansion is constrained by surrounding mountainous or hilly terrain [28]. Predominantly located in western China, these cities exhibit distinct spatial characteristics, often adopting cluster-based configurations due to topographical limitations [29]. More than 30 prefecture-level cities, including Lanzhou, Xining, Baoji, Chongqing, Guiyang, and Guangyuan, along with numerous county-level settlements such as Zhouqu, Yongdeng, Wenchuan, Beichuan, Lushan, and Wangmo, are geographically dispersed across western provinces and municipalities [30]. As key components of western China’s urban system, valley cities have experienced rapid socio-economic development under the western development strategy over the past two decades. This has driven population and industrial agglomeration, urban land expansion, and continuous road network proliferation. The diverse construction phases have resulted in significant structural variations in road networks across these cities, both spatially and temporally. Taking Lanzhou as a representative example, urban planning since 2000, guided by its third and fourth urban plans, has transformed valley floodplains (e.g., Yantan, Matan, Yingmentan, Cuijiatan) and elevated terraces (e.g., Pengjiaping, Jiuzhoutai) into developed urban areas. The resulting road networks differ markedly from older urban cores: the Pengjiaping district follows a regular grid pattern, whereas the adjacent Gongjiawan area features irregular layouts shaped by historical industrial planning, mountain barriers, and flood control infrastructure. This fragmented road network exacerbates land use and transportation mismatches, increasing residential energy consumption. Given China’s national strategic focus on new urbanization, ecological urbanization, and carbon neutrality goals, understanding the structural impact of road networks on carbon emissions in valley cities is crucial. To this end, this study selects 15 representative cities across Gansu, Qinghai, Shaanxi, Sichuan, Guizhou, and Guangxi provinces, including Lanzhou, Xining, Baoji, Mianyang, Guiyang, and Nanning, based on spatial environment, road network configuration, city scale, and regional distribution.

2.2. Methods

To analyze the relationship between road network structure and household carbon emissions, the study employs the following methods:
(1)
Bivariate correlation analysis was conducted using Kendall’s tau coefficient to assess the strength of associations between road network structural characteristics and household carbon emissions. Higher absolute values indicate stronger statistical relationships. This analysis is conducted using the bivariate correlation module in SPSS 19.0, following pre-test validation of data normality and variance homogeneity to ensure methodological rigor in identifying non-parametric associations across the selected cities.
(2)
Stepwise regression analysis was conducted to determine the directional influence and magnitude of impact of three key road network structural metrics, both individually and in combination, on household carbon emissions. The analysis is executed using Stata 17.0.
(3)
Curve estimation regression analysis was employed to address scenarios where the optimal functional relationship between variables is unknown. Eleven candidate models, including linear, quadratic, power, inverse, and growth functions [31], were systematically compared to determine the best statistical fit [32]. This analysis, implemented through the curve estimation module in SPSS 19.0, provides insights into the mechanisms by which road network structures influence household carbon emissions.

2.3. Empirical Steps

2.3.1. Calculation of Household Carbon Emissions

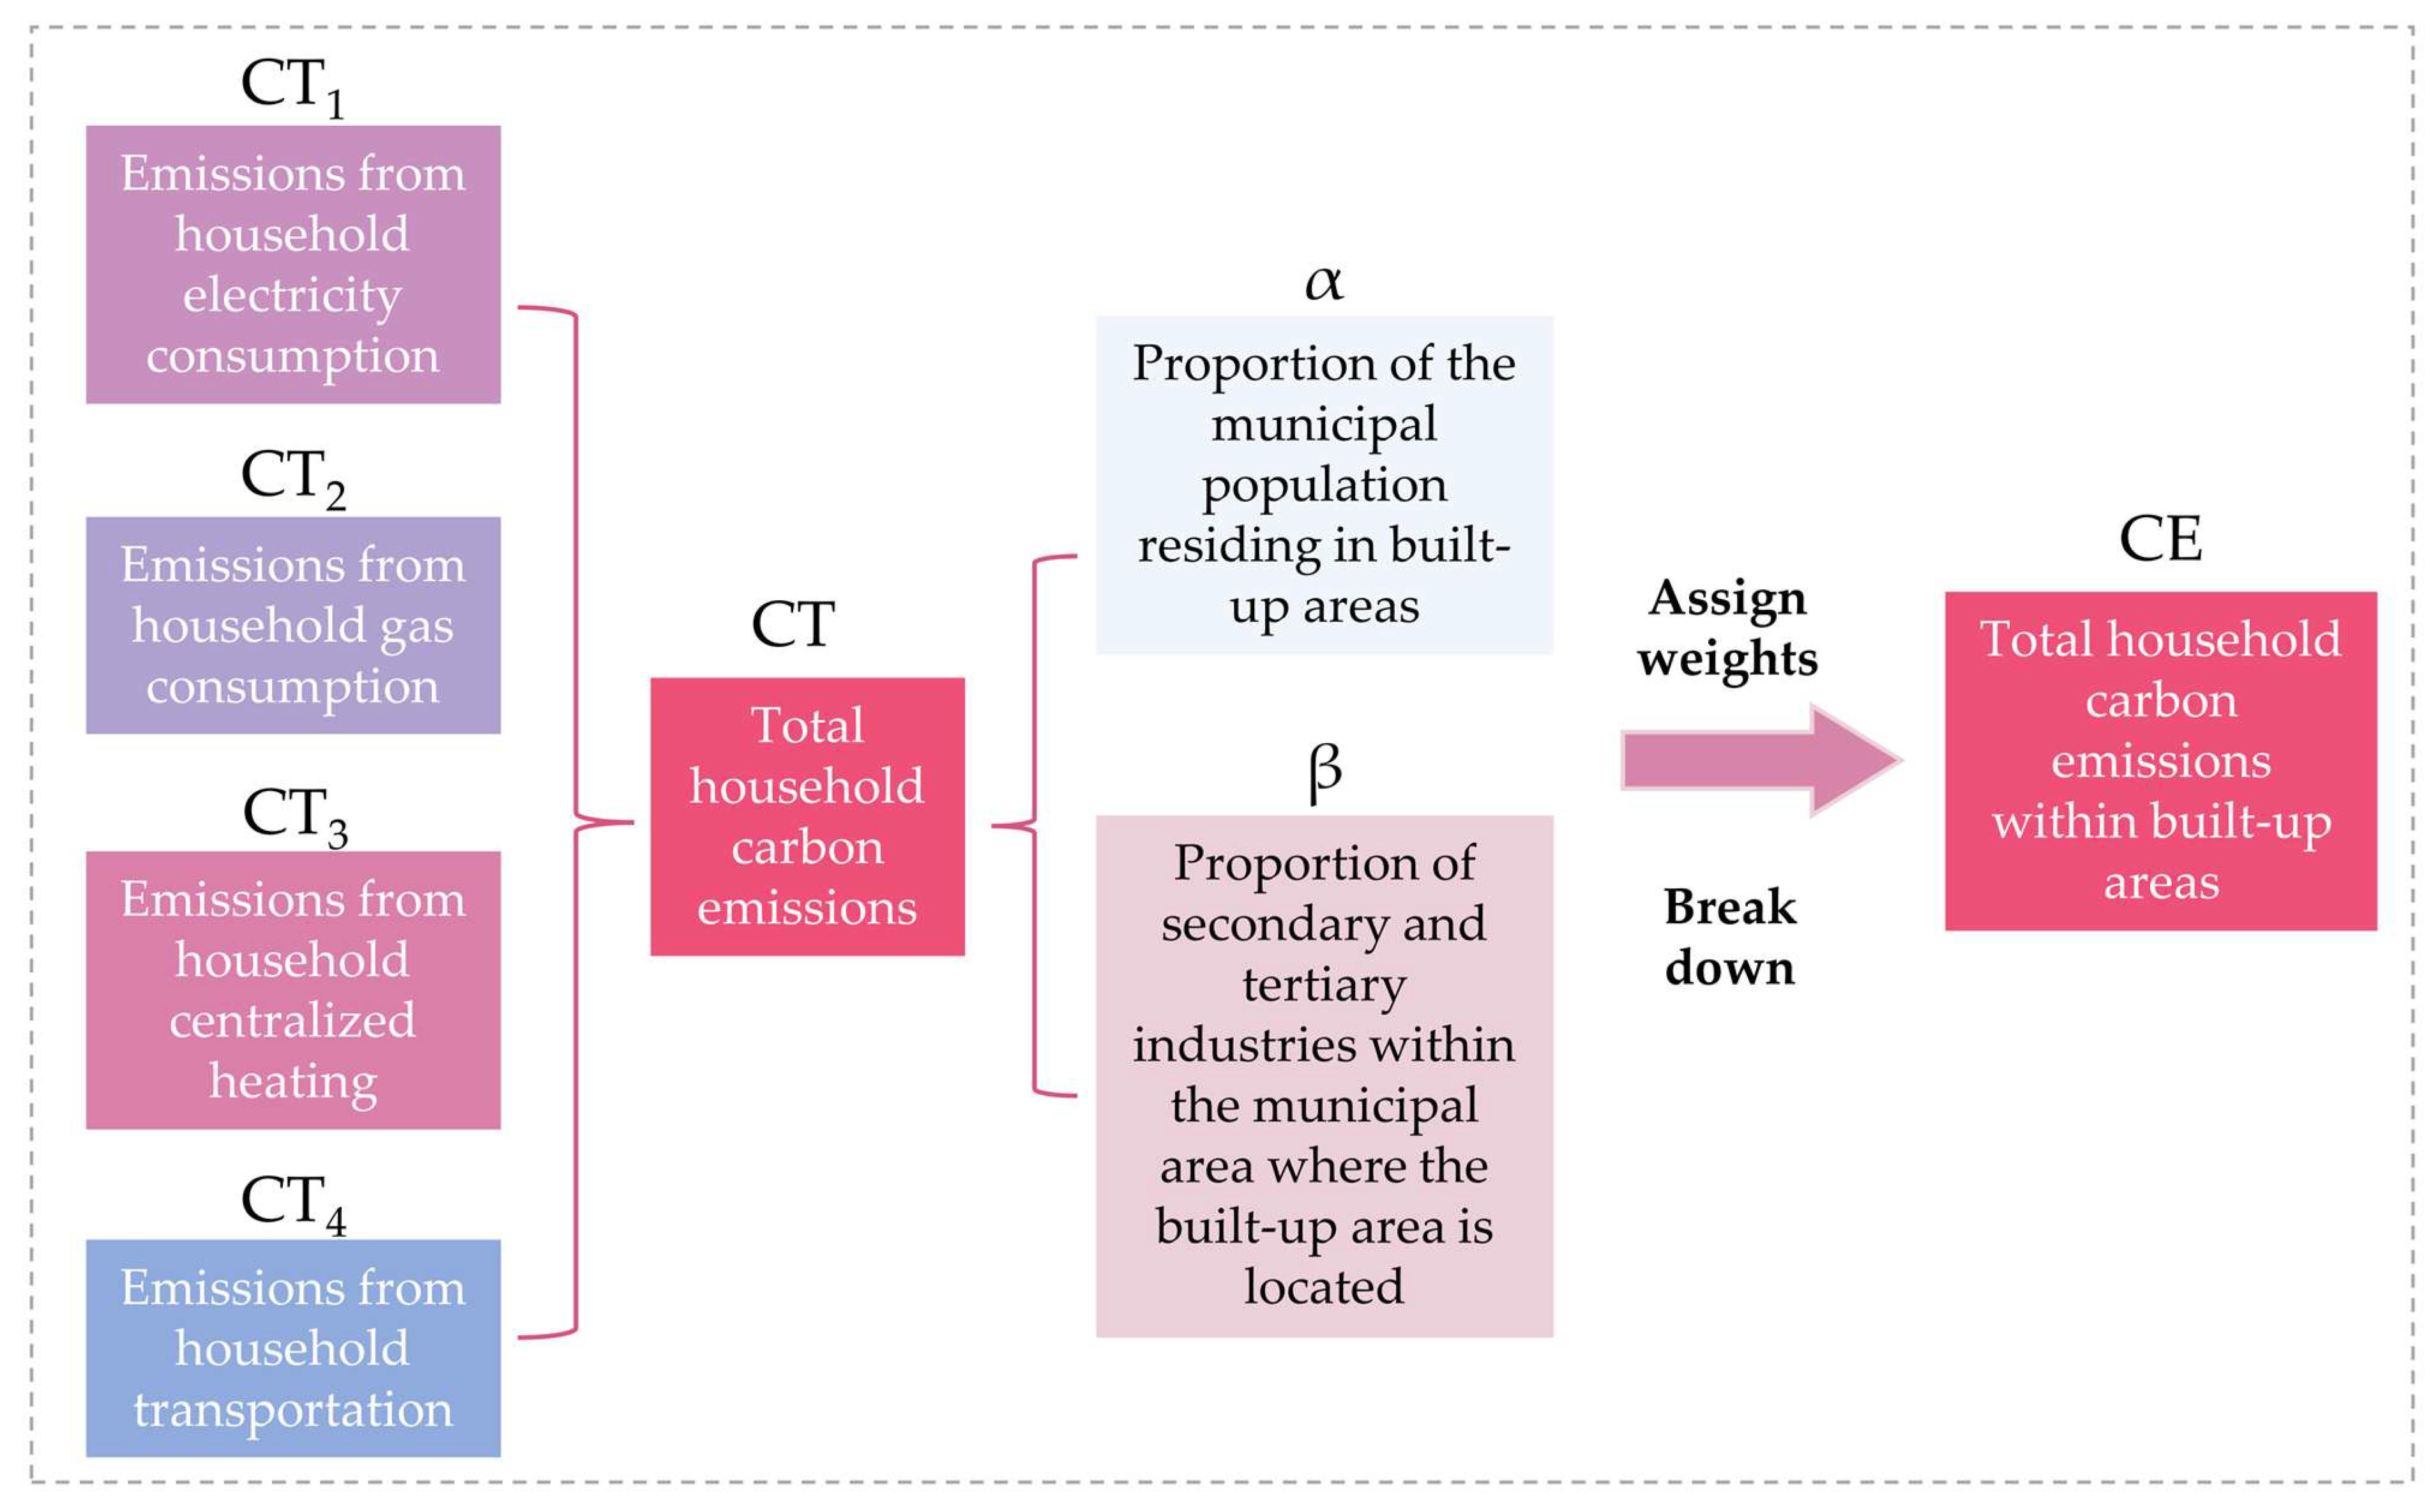
Due to a lack of officially disclosed residential carbon footprint data for the case study cities, this study adopts the Emission Factor Method outlined in the IPCC Guidelines for National Greenhouse Gas Inventories as the primary quantification framework. Building on established carbon accounting methodologies from Xu et al. [4], Tian et al. [17], and Cao and Gao [33], we estimated city-scale residential emissions across four key domains: household electricity consumption, natural gas usage, centralized heating systems, and transportation activities. To further refine the spatial distribution of emissions, we integrated the spatial allocation framework proposed by Guo et al. [34], incorporating the population distribution index of built-up areas and the economic structure index (measured by the secondary/tertiary industry output ratio). This approach enables a systematic decomposition of emissions at the urban built-environment scale (Figure 1). The technical workflow proceeds as follows:
C T = C T 1 + C T 2 + C T 3 + C T 4
where CT represents the total household carbon emissions within the municipal area; CT1 is the emissions from residential electricity use; CT2 is the emissions from residential gas use; CT3 is the emissions from centralized heating; and CT4 is the emissions from residential transportation. The calculation of each component follows these equations:
C T 1 = E C × E F a
where CT1 represents household carbon emissions from electricity consumption; EC is the total residential electricity consumption; and EFa is the carbon emission factor of the respective power grid. Given that the study covers cities within the Central, Northwest, and Southern China power grids, a ranges from 1 to 3. The emission factor values are derived using the average operating margin (OM) and build margin (BM) obtained from the Emission Factors of the Baseline of the Electricity Grids in China.
C T 2 = G C n g × N C V n g × ρ n g × E F n g + G C l p g × N C V l p g × E F l p g
where CT2 represents emissions from household gas consumption; GCng and GClpg are the residential consumption of natural gas and liquefied petroleum gas (LPG), respectively; NCVng and NCVlpg are the respective net calorific values; ρng is the density of natural gas; and EFng and EFlpg are the emission factors for natural gas and LPG, respectively.
C T 3 = H n g × N C V n g × ρ n g × E F n g
where CT3 represents emissions from residential centralized heating; Hng is the quantity of natural gas used for heating; NCVng is the net calorific value of natural gas; ρng is the density of natural gas; and EFng is the carbon emission factor for natural gas.
C T 4 = Q b × L b × λ b × E F b i + Q t × L t × λ t × E F t i + Q p c × L p c × λ p c × E F g
where CT4 represents emissions from household transportation; Qb is the number of city buses, with primary energy types including gasoline, natural gas, and electric; Qt is the number of city taxis, with primary energy types including gasoline, natural gas, methanol, dual-fuel, and electric; Qpc is the number of private cars; Lb, Lt, and Lpc are their respective average annual mileage; λb, λt, and λpc are the fuel consumption coefficients per 100 km for buses, taxis, and private cars, respectively; EFbi and EFti are the carbon emission factors for the energy types used by buses and taxis, respectively; and EFg is the emission factor for gasoline used by private cars. Finally, the total household carbon emissions within built-up areas are calculated as follows:
C E = C T × α + C T × β 2
where CE represents total household carbon emissions within built-up areas; CT represents the total household carbon emissions within the municipal area; α is the proportion of the municipal population residing in built-up areas; and β is the proportion of secondary and tertiary industries within the municipal area where the built-up area is located.

2.3.2. Selection of Indicators of Road Network Structural Characteristics

Road networks influence urban land use and spatial organization while also determining traffic distribution and transport efficiency [8,35]. These networks are shaped by both quantitative metrics (e.g., per capita road area and network density) and structural attributes (e.g., network variability and centrality). As spatial systems composed of intersections (nodes), street segments (edges), and urban blocks (polygons), road networks have been extensively analyzed using complex network theory to quantify their structural configurations [36,37,38]. Based on a synthesis of previous studies [9,39,40,41], our study categorizes the structural metrics of urban road networks into three dimensions (scale, layout, and functional characteristics) or classifies them based on geometric morphology versus topological structure. Grounded in complex network theory and tailored to the distinct characteristics and data availability of road networks in WVCs, this study characterizes road network structures using three key indicators: proximity centrality, compactness, and variability. These are quantified using the global closeness centrality kernel density estimation (GCC-KDE), compactness information entropy (CIE), and variability information entropy (VIE) metrics, respectively.
Specifically, GCC-KDE captures network density, spatial arrangement, and connectivity across multiple dimensions, including scale, layout, function, and geometric morphology. The entropy-based metrics (CIE and VIE) reflect road alignment patterns, connectivity levels, dead-end distributions, and topological complexity in terms of layout, function, and geometry, though they do not inherently account for scale. To address inter-city disparities in population, land use, and network size, regression analysis employs normalized predictors: mean GCC-KDE, CIE multiplied by road density length (CIE × RDL), and VIE multiplied by road density length (VIE × RDL). Road network length data were min–max normalized to eliminate dimensional heterogeneity and enhance comparability.
(1) The GCC-KDE metric not only quantifies the global positional significance of road networks but also captures localized density characteristics. Higher values indicate greater strategic importance of road segments in urban spatial configurations and increased network density in corresponding areas. Based on established methodologies [42,43], this metric was implemented through spatial analysis using the ArcGIS 10.6 platform and the Urban Network Analysis toolbox. This approach enables precise computation of network centrality indices while maintaining the spatial continuity of kernel density estimation.
(2) The CIE and VIE metrics, grounded in cartographic information entropy and Shannon’s information theory principles [44,45,46,47], quantify the structural complexity of road networks from distinct perspectives. To operationalize these metrics, topological extraction and characterization were first performed by defining street segments as the fundamental spatial units. This transformation converted physical road networks into dual graphs, where street segments serve as nodes and intersections define edges. CIE is derived from node compactness parameters (Equations (7) and (8)), with higher values indicating stronger inter-node connectivity and, consequently, greater network cohesion. The metric is computed using the following equations:
C i = k i N 1
I c = i = 1 N l o g 2 ( C i + 1 )
where Ci represents the structural compactness parameter of node i; ki is the degree value of node i; N is the number of nodes in the network; and Ic represents the compactness information entropy (in bits).
In contrast, VIE is calculated based on node variability parameters (Equations (9) and (10)), where higher entropy values reflect increased diversity in nodal connection patterns and intensities, indicating greater network irregularity and combinatorial complexity. This metric is computed as follows:
V i = j = 1 k i | k i k j | ( k m a x k m i n ) k i
I V = i = 1 N l o g 2 ( H i + 1 )
where Vi represents the structural variability parameter of node i; ki is the degree value of node i; kj is the degree value of nodes directly connected to i; kmax and kmin are the maximum and minimum node degree values in the network; N is the total number of nodes in the network; and Iv represents the variability information entropy (in bits).

2.3.3. Data Sources

(1)
Household carbon emissions
The calculation of household carbon emissions incorporates multiple data sources, including household electricity consumption, domestic gas usage, transportation activities, and centralized heating systems. To ensure data reliability and accessibility, this study consistently employs 2020 energy consumption and socio-economic datasets. Household electricity consumption data were extracted from municipal or provincial statistical yearbooks, while grid emission factors were obtained from the Baseline Emission Factors for China’s Regional Power Grids in 2020. Residential gas and centralized heating energy data were sourced from the China Urban Construction Statistical Yearbook. Public transportation data, including the number of buses and taxis categorized by energy type, were compiled from municipal statistical yearbooks, statistical communiqués on national economic and social development, and government portals. Annual vehicle mileage and energy consumption coefficients per 100 km were derived from reports issued by municipal State-owned Assets Supervision and Administration Commissions, Transportation Bureaus, official government portals, and sanctioned news reports. Net calorific values and carbon emission factors for various energy types were obtained from the Carbon Emission Trading and Accounting Network (http://www.tanpaifang.com/) and IPCC-published coefficients. Additionally, demographic data and secondary/tertiary industry outputs were collected from municipal and provincial statistical yearbooks.
(2)
Urban road network data
Urban road network data for 2020 were sourced from the OpenStreetMap platform. To ensure compliance with computational requirements for the three road network structural characteristic metrics, the dataset underwent topological inspection and correction using ArcGIS 10.6 software.
(3)
Built-up area delineation
Built-up area boundaries were delineated following established methodologies [48,49] using 2020 remote sensing imagery, impervious surface data, and point of interest data. These datasets were processed with ArcGIS 10.6 to ensure accuracy. Remote sensing imagery was acquired from the National Geomatics Center Public Service Platform (https://www.tianditu.gov.cn/), while impervious surface data, with a 30 m spatial resolution, were obtained from the National Earth System Science Data Center (https://www.geodata.cn). Point of interest data, covering residential, commercial, catering, financial, and scientific/educational categories, were sourced from the Bigemap geographic information platform. This multi-source integration ensured precise boundary delineation, aligning with both urban morphological and functional characteristics.
(4)
Annual average temperature data
Given the significant variations in latitude across all cities and the substantial impact of temperature on energy consumption, the annual average temperature (Temp) for each city was selected as a control variable to better account for environmental factors influencing carbon emissions. This data was also sourced from the 2020 statistical yearbooks of each city or its respective province.

3. Distribution of Household Carbon Emissions and Road Network Structural Characteristics

3.1. Household Carbon Emissions

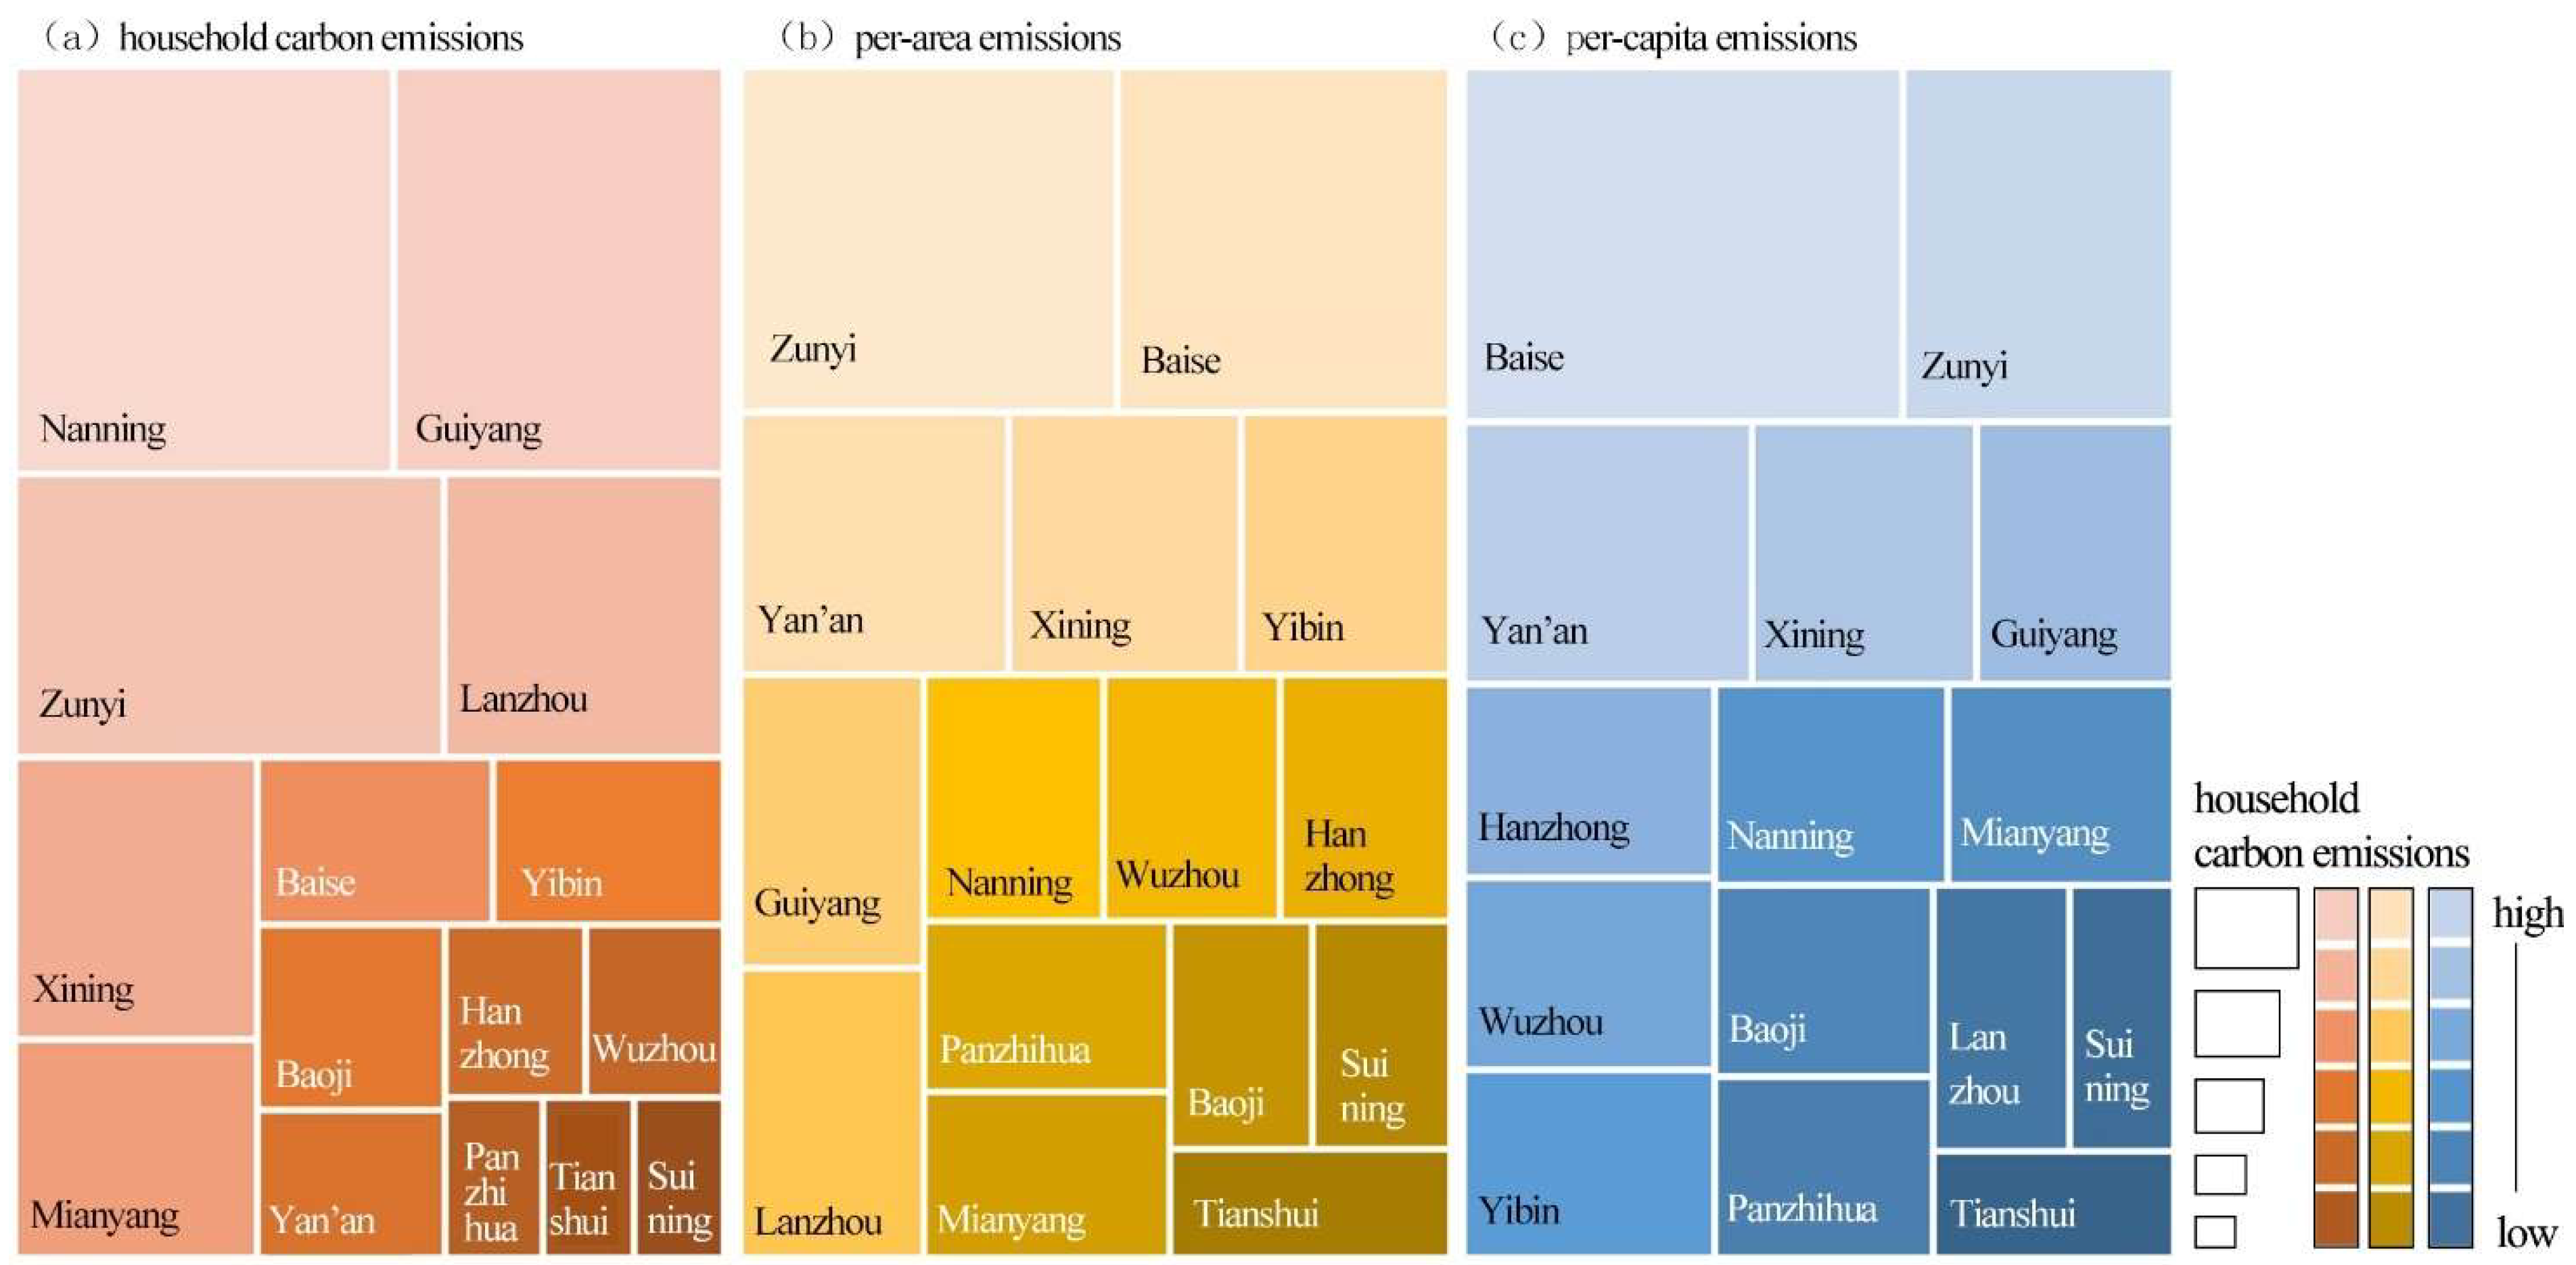
In 2020, Nanning recorded the highest household carbon emissions at 6.03 million tons, followed by Guiyang, Zunyi, Lanzhou, and Xining, which together accounted for 66.09% of total emissions across all case cities. Among these top five emitters, all except Zunyi are large, multi-functional provincial capitals. In contrast, the lowest emissions were observed in non-provincial capital cities, with Panzhihua (613,400 t), Tianshui (566,800 t), and Suining (562,900 t) collectively contributing only 5.29% of total emissions (Figure 2a). In terms of per-area emissions, Zunyi and Baise exhibited the highest intensities, at 39,310.59 t/km2 and 34,864.53 t/km2, respectively. These were followed by Yan’an, Xining, and Yibin, with their values being approximately 47.66% of Zunyi’s. In contrast, Baoji, Suining, and Tianshui recorded the lowest per-area emissions, at 9,805.42, 9,561.85, and 9,191.71 t/km2, respectively, each below one-quarter of Zunyi’s levels (Figure 2b).
Per capita emissions were highest in Baise at 4.56 t/person, followed by Zunyi, Yan’an, Xining, and Guiyang, exhibiting values of approximately 45.38% of Baise’s. In contrast, Lanzhou, Suining, and Tianshui had the lowest per capita emissions, at 1.06, 0.81, and 0.75 t/person, respectively (Figure 2c). Compared to total emissions, per-area emissions displayed smaller inter-city variability, with a more balanced gradient between the highest and lowest values.
Overall, Zunyi and Xining ranked among the top five cities in total, per-area, and per capita emissions, with Zunyi consistently exceeding Xining across all three metrics. Conversely, Suining and Tianshui exhibited the lowest emissions across all categories, reflecting their relative advantages in green lifestyles and low-carbon spatial configurations. Notably, cities such as Lanzhou, Baise, and Yibin showed significant disparities in rankings across different emission metrics, highlighting the heterogeneous characteristics of WVCs and the complex interplay of factors influencing household carbon footprints. These variations underscore the necessity for context-specific decarbonization strategies tailored to distinct geomorphological and socio-economic conditions.

3.2. Urban Road Network Structural Characteristics

3.2.1. Closeness Centrality

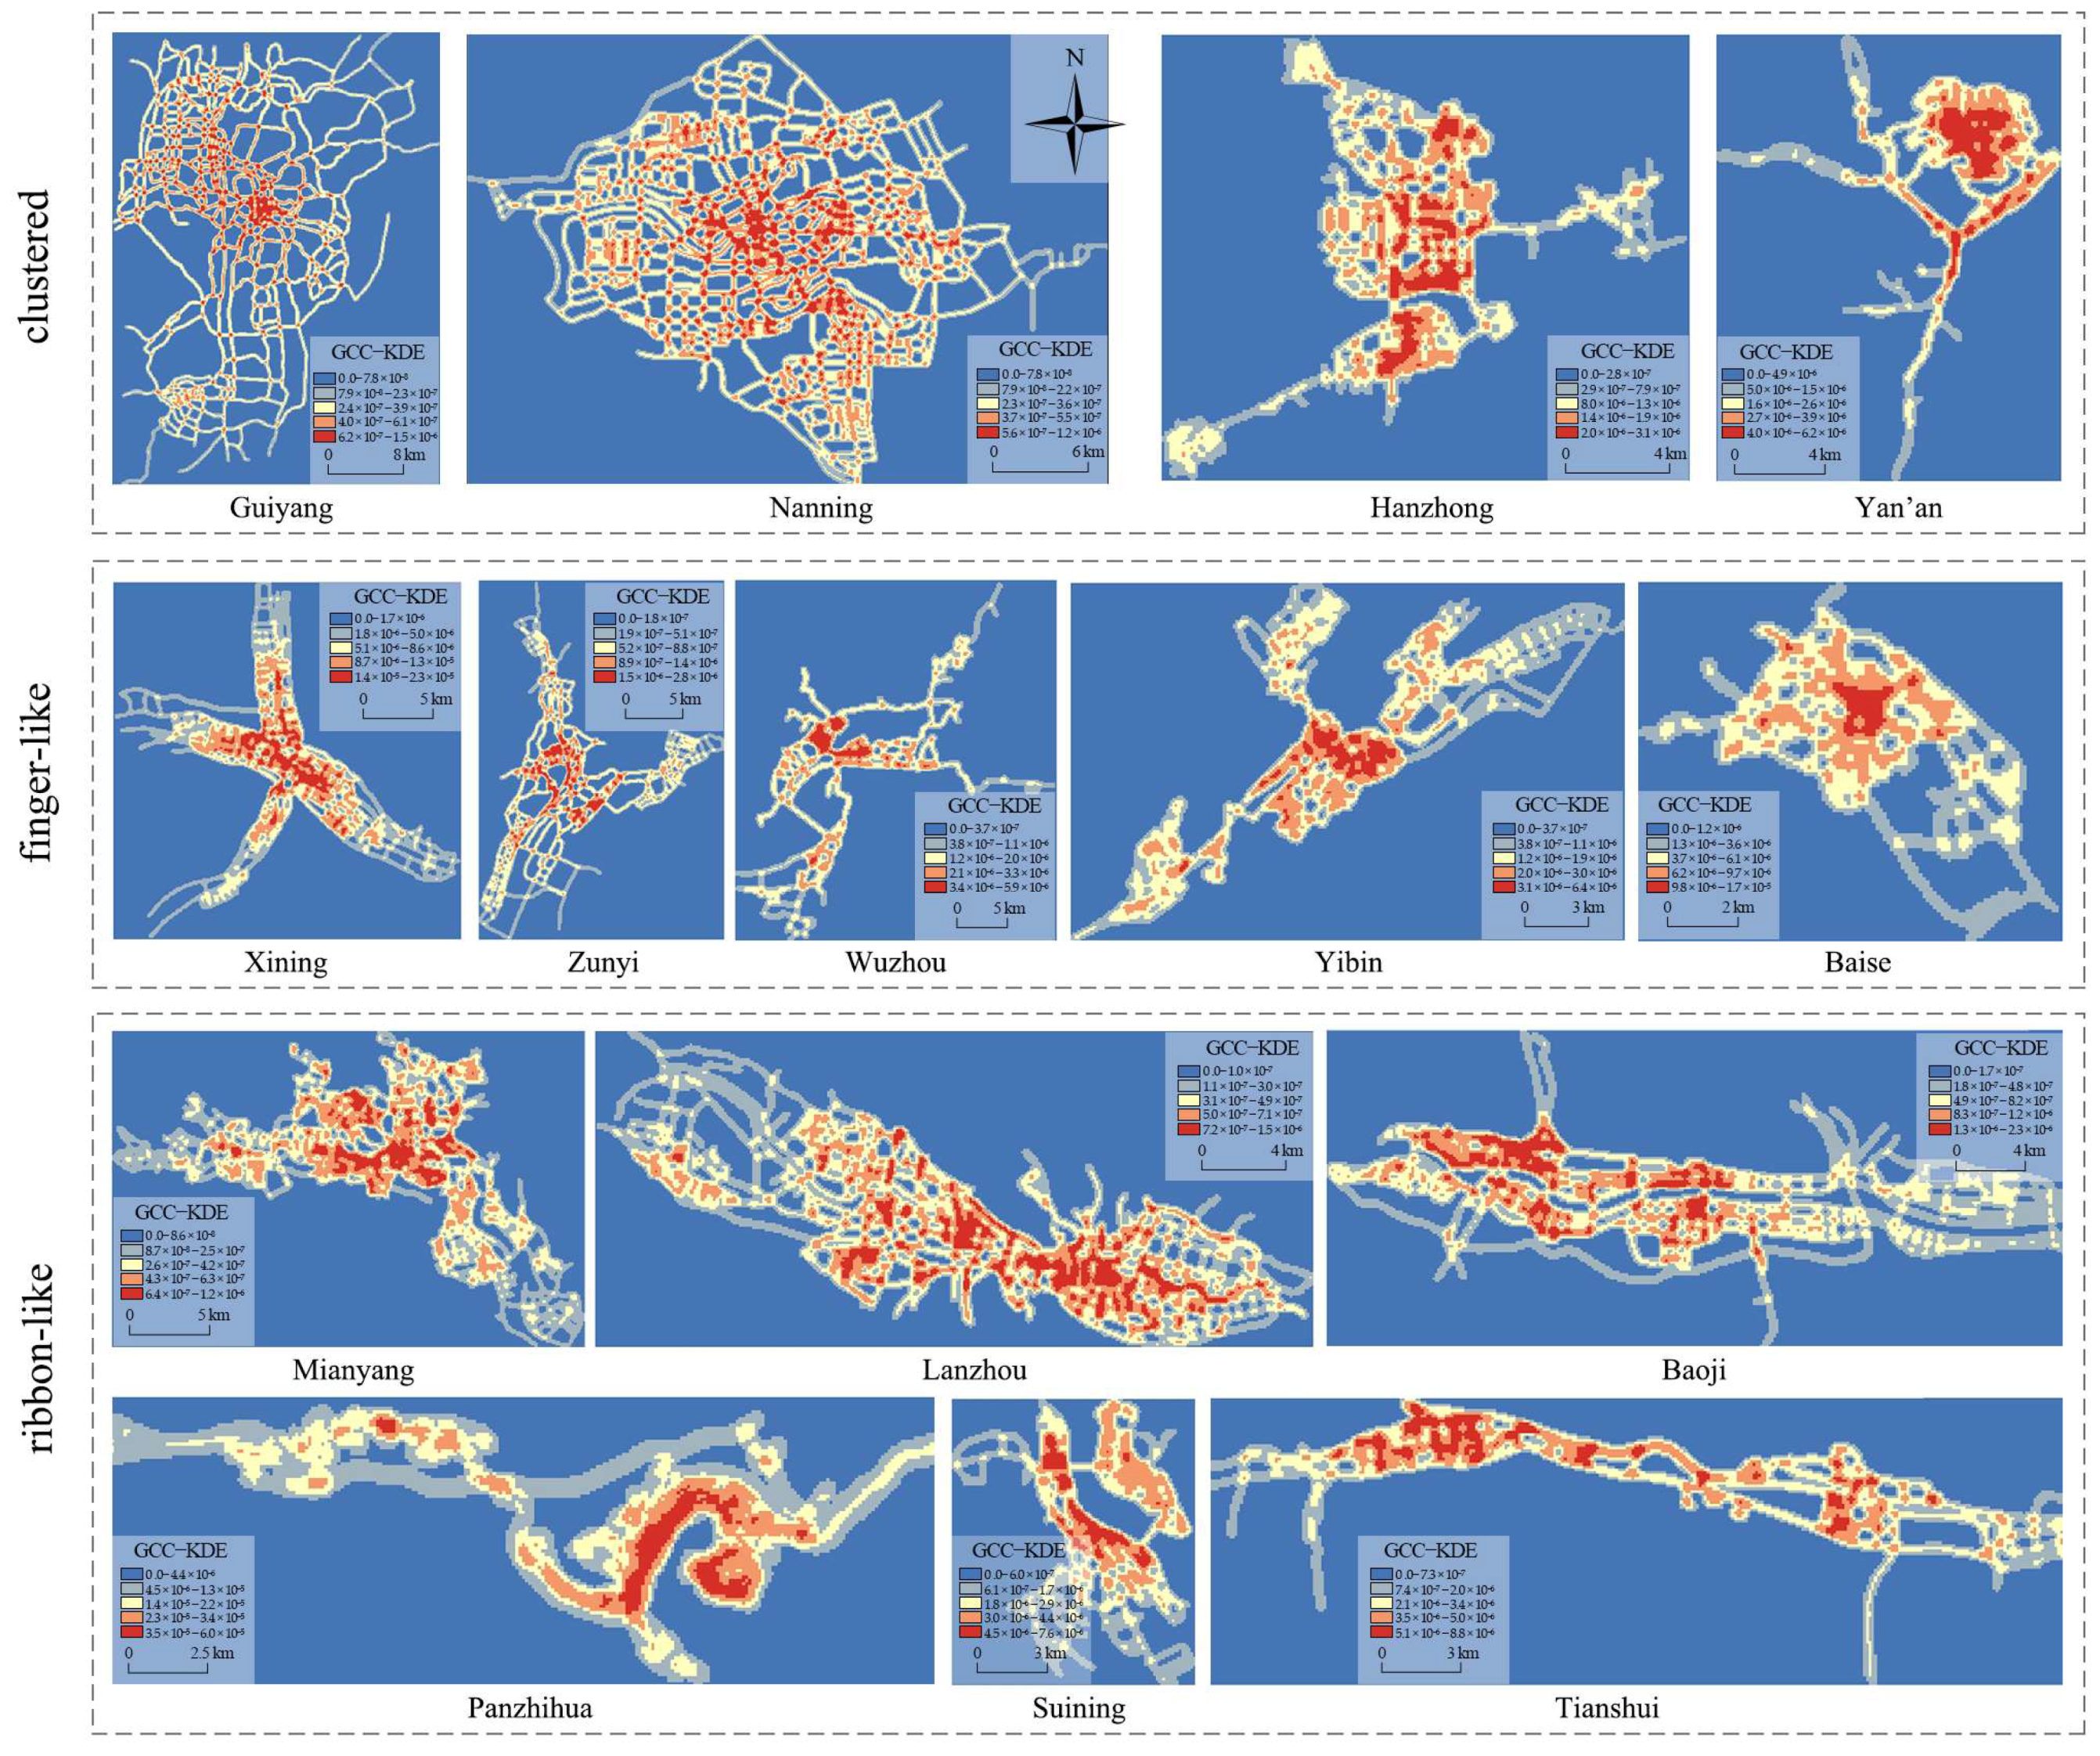
Visualization of GCC-KDE across the selected cities reveals a consistent pattern: high centrality in urban cores that gradually diminishes toward peripheral areas. Cities with lower mean GCC-KDE values, such as Guiyang, Nanning, and Mianyang, exhibit superior network accessibility. This reflects urban morphologies that are less constrained by topographical features (e.g., mountains, rivers) and tend to form compact clusters or broad ribbon-like distributions. In contrast, cities with higher mean GCC-KDE values, such as Yan’an, Tianshui, and Baise, show reduced accessibility, as their urban forms are fragmented into discrete clusters by topographic barriers. Based on the spatial distribution patterns of GCC-KDE values, road networks can be categorized into three morphotypes: clustered, finger-like, and ribbon-like (Figure 3). Clustered cities, such as Guiyang and Nanning, feature contiguous high-value GCC-KDE zones with minimal core–periphery gradients, reflecting their compact urban forms. In contrast, topographically constrained cities such as Hanzhong and Yan’an display polycentric clusters with spatially segregated high-value zones. Finger-like morphologies, observed primarily in Xining, Zunyi, and Wuzhou, manifest as intersecting high-value corridors, while Yibin and Baise exhibit radial extensions of medium-value zones from central high-value cores. Ribbon-like configurations, identified in six cities (Mianyang, Lanzhou, Baoji, Panzhihua, Suining, and Tianshui), are characterized by linear high-value GCC-KDE belts aligned with major transportation corridors, closely following valley geomorphologies or built-up area contours.

3.2.2. Compactness and Variability

In terms of compactness, CIE values exhibited limited variability among cities (Table 1). The top five cities, Yan’an, Guiyang, Nanning, Xining, and Zunyi, exhibited high network cohesion, offering residents diverse route options. Notably, three of these cities (excluding Yan’an and Zunyi) are provincial capitals with extensive and complex road networks. In contrast, the five cities with the lowest CIE values, Lanzhou, Baise, Tianshui, Wuzhou, and Panzhihua, had fewer nodes and lower maximum degree values, indicating sparse inter-node connectivity and reduced network cohesion. Variability patterns showed greater divergence, with VIE values displaying pronounced inter-city disparities and distinct ranking distributions (Table 1). The highest VIE values were observed in Mianyang, Lanzhou, Nanning, Xining, and Hanzhong, reflecting irregular and highly diversified network configurations. Conversely, Wuzhou, Yan’an, Tianshui, Baise, and Panzhihua exhibited the lowest VIE values, indicative of monotonous or overly regular network structures.
When RDL was incorporated into the analysis, the adjusted metrics (CIE × RDL and VIE × RDL) exhibited subtle variations while maintaining overall ranking stability (Table 1). This adjustment provided a more comprehensive representation of network complexity by integrating urban development scale. Among the analyzed cities, Panzhihua exhibited the lowest values in both compactness and variability metrics, highlighting its simplistic and loosely connected road network. In contrast, Nanning demonstrated superior network complexity and cohesion, emphasizing its intricate spatial organization.

4. Heterogeneous Impact of Road Network Structure on Household Carbon Emissions

The preceding analysis underscores the multifaceted relationship between household carbon emissions and road network structures in WVCs. To further elucidate the impact mechanisms, this study employs a tripartite analytical framework: (1) bivariate correlation analysis to quantify association strengths between variables; (2) stepwise regression analysis to determine the direction and magnitude of impacts exerted by proximity centrality, compactness, and variability; and (3) curve estimation regression analysis to identify optimal functional relationships that characterize how these structural attributes influence emission patterns. This sequential approach progresses from correlation detection to causal inference, systematically unraveling the spatial–structural determinants of urban carbon metabolism.

4.1. Correlation Between Road Network Structure and Household Carbon Emissions

Given the non-normal distribution of sample data across all four variables and the limited sample size, Kendall’s tau coefficient was employed to assess variable correlations, with results detailed in Table 2. The analysis revealed a statistically significant negative correlation between GCC-KDE and household carbon emissions at the 0.01 level, indicating that enhanced proximity centrality, characterized by lower network accessibility or polycentric cluster configurations, effectively reduces household carbon footprints. Conversely, CIE × RDL and VIE × RDL exhibited significant positive correlations with emissions at the 0.01 and 0.05 levels, respectively. This indicates that increased network compactness (stronger inter-node connectivity) and heightened variability (diversified linkage patterns) amplify carbon outputs, suggesting that tightly integrated road networks with heterogeneous connection modalities inadvertently elevate urban energy consumption intensities.

4.2. Impact Magnitude of Road Network Structure on Household Carbon Emissions

To detect potential multicollinearity among the independent variables, we performed a variance inflation factor (VIF) test. As shown in the results, all VIF values are below the conventional threshold of 5, suggesting that multicollinearity is not a concern in our model. Table 3 presents the results of Models 1–3, which assess the univariate relationships between GCC-KDE, CIE × RDL, VIE × RDL, and household carbon emissions. GCC-KDE exhibits a statistically significant negative effect, whereas both CIE × RDL and VIE × RDL show significant positive effects, aligning with the correlation analysis. Notably, standardized coefficients indicate that compactness has a greater impact on emission increases than variability, suggesting that network connectivity intensity plays a more substantial role in driving carbon output than connection pattern diversity in the spatially constrained environments of WVCs.
Models 4–6 extend these univariate frameworks (Models 1–3) by sequentially incorporating additional explanatory variables. In Model 4, the inclusion of CIE × RDL causes GCC-KDE to lose statistical significance, while CIE × RDL remains significantly positive. This suggests that reduced network connectivity lowers emissions, but the combined effects of proximity centrality and compactness on emissions remain unclear. Model 5 adds VIE × RDL to Model 2, revealing that CIE × RDL retains its strong positive influence, while VIE × RDL weakens, indicating that emissions may be reduced when low connectivity is accompanied by diverse linkage patterns. In Model 6, which introduces GCC-KDE to Model 3, both variables lose statistical significance. The comprehensive Model 7, incorporating all predictors, confirms GCC-KDE’s persistent non-significance. Conversely, CIE × RDL exhibits an even stronger positive effect than in prior models, and VIE × RDL transitions to a moderate negative effect. This aligns with the findings in Models 4 and 5, suggesting that a balance between controlled compactness and moderate variability can optimize carbon reduction in topographically constrained urban areas.
Overall, proximity centrality exhibited a statistically significant negative effect in univariate regression but became insignificant when additional variables were included. In contrast, compactness consistently exerted a strong positive influence across both univariate and multivariate stepwise regressions, with its effect size peaking in the full model. Variability initially showed a strong positive association in univariate analysis but shifted to a moderately negative effect in multivariate models. These findings highlight the distinct influences of road network structure on residential carbon emissions in WVCs, with compactness emerging as the dominant factor and variability displaying context-dependent directional shifts.

4.3. Impact Patterns of Road Network Structure on Household Carbon Emissions

To further elucidate how different road network structural characteristics influence household carbon emissions, iterative simulation experiments identified inverse, linear, and power function models as optimal for curve estimation regression. As shown in Table 4, all three models yielded statistically significant F-test and t-test results, rejecting the null hypothesis and confirming their robustness in capturing the nonlinear relationships between structural metrics and carbon emissions in WVCs.
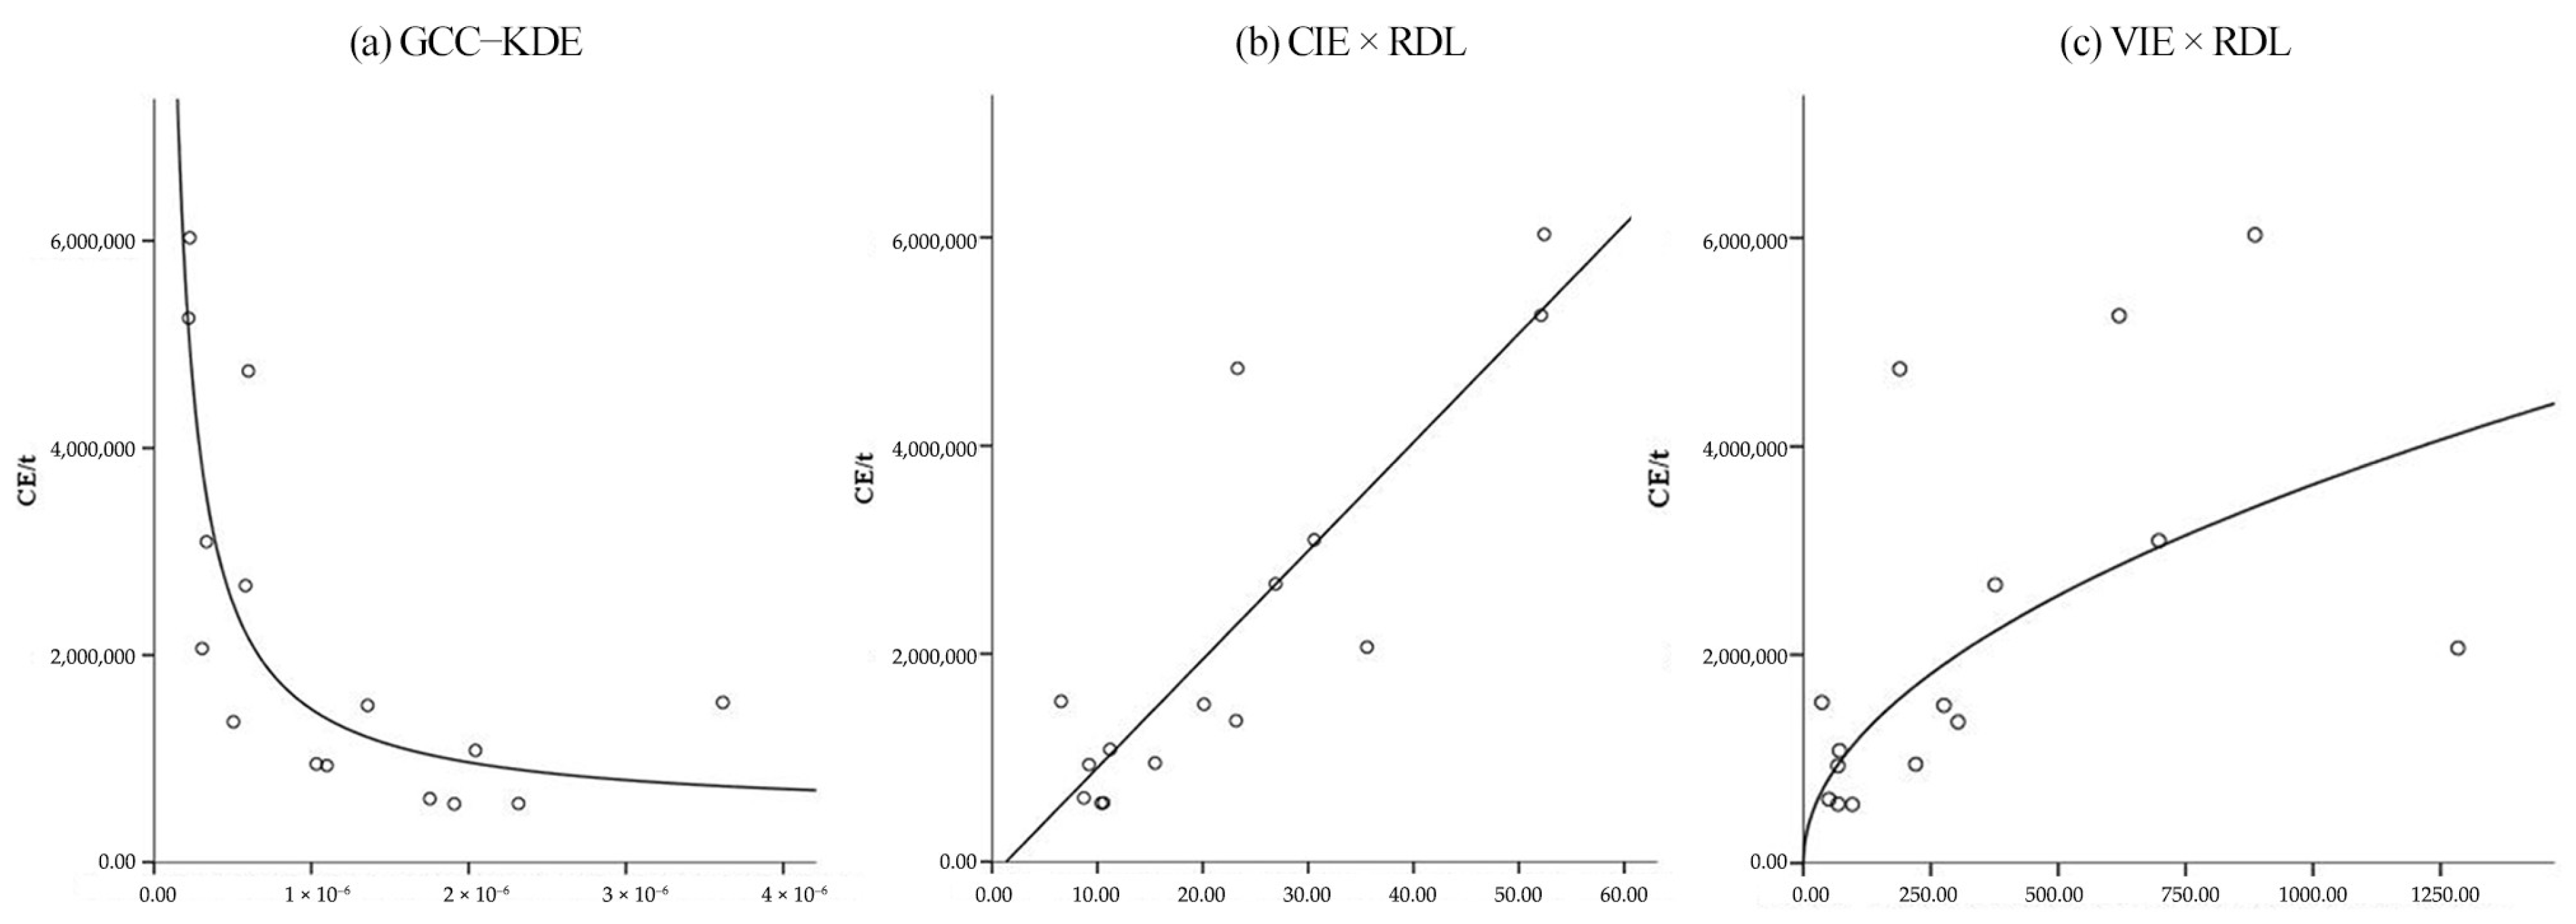
Proximity centrality exhibited an inverse-function negative growth pattern, explaining approximately 66.4% of emission variability. The regression equation and Figure 4a indicate a diminishing marginal reduction effect: at lower GCC-KDE values, emissions decrease nearly linearly, but the rate of decline slows as GCC-KDE increases. This suggests that fragmented road networks, which lower proximity centrality, exert stronger inhibitory effects on household carbon emissions, particularly in topographically constrained urban areas where polycentric forms enhance energy efficiency by reducing mobility demands. In contrast, compactness followed a linear positive growth pattern, with CIE × RDL explaining approximately 72.9% of emission variability. The regression equation and Figure 4b reveal a direct correlation, with each unit increase in CIE × RDL corresponding to a 104,324.612-unit rise in carbon output. This indicates that greater network connectivity in WVCs paradoxically increases energy consumption. However, moderated compactness, achieved through strategically fragmented networks, can enhance mobility efficiency and reduce emissions by approximately 18–22% per standard deviation decrease in CIE × RDL.
Variability also exhibited a positive association with emissions, following a power-law growth pattern. Although VIE × RDL demonstrated a lower explanatory power (R2 = 0.504, adjusted R2 = 0.466) compared to the proximity centrality and compactness metrics, it remained within acceptable thresholds, accounting for 46.6% of emission variability. The regression equation and Figure 4c suggest that as VIE × RDL increases, the corresponding emission rise diminishes in magnitude. This also shows that the increase in street segment connection diversity in western valley cities does not reduce the carbon emissions, and moderately low variability or relatively regular road network patterns (such as grid, circular radial) can effectively reduce carbon emissions.
In summary, road network structure in the WVCs influences household carbon emissions through distinct mechanisms: proximity centrality follows an inverse-function negative growth pattern, where emissions decrease steeply at low values but taper off at higher levels; compactness exhibits a linear growth pattern, consistently increasing emissions as connectivity intensifies; and variability follows a power-law growth pattern, with emissions rising at a decreasing rate as network diversity expands.

5. Discussion

This study pioneers the use of western valley cities (WVCs) as research cases. It confirms the differentiated effects and mechanisms of road network structure characteristics on household carbon emissions. Road networks in WVCs differ from those in plains and coastal cities. Significant internal variations also exist due to rivers, mountains, and past state policies. As the physical carrier of urban spatial organization, the topology and spatial configuration of road networks influence residents’ production, living behaviors, energy consumption, and carbon emissions through multidimensional, systemic interactions. Accordingly, this paper develops a logical framework entitled “characteristic coupling–behavioral feedback–carbon emissions–policy response” for further exploration.
First, road network proximity centrality reflects the macro-level spatial distribution of urban functions, integrating node centrality and spatial agglomeration. High-proximity areas may enhance residents’ dependence on local living circles, potentially reducing long-distance motorized travel and associated carbon emissions. However, these carbon reduction benefits follow a nonlinear pattern. Excessive agglomeration can cause congestion and conflicts due to functional overlap, which is not conducive to lowering household carbon emissions. Road network compactness captures the complex “emergence” phenomenon arising from interactions between urban spatial organization and the road system. As network closure increases, alternative paths grow exponentially, creating “hyper-connectivity” that reshapes accessibility. Consequently, previously constrained travel demands become activated [50,51], leading to a linear increase in household carbon emissions. Road network variability characterizes the internal spatial organization and accessibility heterogeneity of a city. Although its influence varies in direction and magnitude—both independently and in combination with other features—its core mechanism likely operates through three pathways: restructuring network hierarchy, inducing travel demand differentiation, and triggering systemic phase transitions. For example, high variability increases detour needs in fringe areas due to poor road connections. Slow-mode transport and public transit cannot easily alleviate this, resulting in rigid private vehicle dependence and higher household carbon emissions.
Second, for optimization: cities with low proximity centrality can add secondary hub nodes at central urban edges to establish multi-level, functionally complete urban units. Within each unit, housing, employment, and services should be systematically integrated to meet cross-regional commuting demand locally. Restructuring the network topology can transform a single radial system into a multi-center, coordinated composite network, enhancing interaction efficiency across unit levels. In high-compactness cities, policies should focus on hierarchical optimization and travel cost restructuring. The network should be divided into three tiers: inter-district arterial roads, collector–commuter corridors, and slow-traffic networks, each with distinct functions. This allows residents to select suitable routes and modes based on travel needs, curbing potential motorized travel. In high-variability cities, core and fringe network functions and structures should be moderately optimized. Core main roads need to disperse traffic pressure; fringe secondary networks should improve accessibility; and local branch roads in both areas should enhance permeability to better connect housing, employment, and service clusters. These strategies do not pursue mechanical uniformity but rather reshape network structural order to achieve self-organized equilibrium within the urban system.
Third, this study has two key contributions. (1) Using a western valley city with unique spatial structure as a case study, filling a gap in research on urban spatial structure and household carbon emissions. (2) Examining heterogeneous effects of road network characteristics on household carbon emissions at the built-up area scale, addressing a prior spatial-scale limitation. Limitations remain due to data availability and case city characteristics, including sample city selection, indicator construction, and quantification of influence levels. Future research should examine other city types (e.g., plains, coastal, oasis) and enrich network indicators using real-time traffic data—both static (road primacy index, circuitousness) and dynamic (congestion delay index, speed deviation rate). This would enable more comprehensive analysis of influence mechanisms, providing theoretical references for planning low-carbon, efficient road networks, promoting green urban development, and achieving carbon peak and neutrality goals.

6. Conclusions

As China advances its ecological civilization initiatives, with a strong emphasis on carbon reduction and pollution control, alongside the ongoing western development strategy, understanding the impact of urban road network structures on household carbon emissions is crucial. A scientific approach to optimizing spatial patterns and designing low-carbon urban units in western cities is essential. This study focuses on WVCs, analyzing household carbon emissions in relation to road network characteristics to uncover their extent and mechanisms of influence. The key findings are as follows: (1) Due to variations in scale, function, and morphology among WVCs, significant intercity disparities exist in total, per capita, and per unit area household carbon emissions. (2) Based on proximity centrality values, the road networks of the case cities can be categorized into three spatial patterns: clustered, finger-like, and linear. While compactness shows minimal variation across cities, variability exhibits substantial differences, with distinct city rankings for these two characteristics, underscoring the complexity of road network organization. (3) Proximity centrality has a significant negative effect on household carbon emissions in univariate regression but loses significance in multivariate analyses. Variability demonstrates divergent effects depending on the regression model, whereas compactness consistently exhibits a highly significant positive impact on emissions. These findings highlight differences in both the magnitude and mechanisms of influence among the three structural characteristics. (4) The influence of proximity centrality follows an inverse-function negative growth pattern, where reductions in emissions diminish over time. In contrast, compactness displays a linear growth pattern, steadily increasing emissions, while variability follows a power-law growth pattern, promoting emissions but with progressively weakening intensity. (5) The three road network structural characteristics affect household carbon emissions through distinct transmission mechanisms. Effective low-carbon strategies should prioritize the development of multi-level urban units, rational division of road network hierarchies, and optimization of different road classes. Decarbonization measures must be tailored to specific structural features, with city-specific implementations that account for local conditions, including residents’ travel behaviors and geographical constraints.

Author Contributions

Conceptualization, X.Z. and S.W.; Methodology, X.Z., S.W. and J.D.; Software, S.W., J.D., W.L. and N.Z.; Validation, X.Z., S.W. and J.D.; Formal analysis, S.W. and N.Z.; Investigation, S.W., W.L. and N.Z.; Resources, X.Z., S.W. and J.D.; Data curation, X.Z. and S.W.; Writing—original draft, S.W.; Writing—review & editing, X.Z. and S.W.; Visualization, S.W. and W.L.; Supervision, X.Z.; Project administration, X.Z.; Funding acquisition, X.Z. All authors have read and agreed to the published version of the manuscript.

Funding

This paper is funded by National Natural Science Foundation of China (42261034).

Data Availability Statement

Some or all data, models, or code that support the findings of this study are available from the corresponding author upon reasonable request.

Conflicts of Interest

The authors declare no conflicts of interest.

References

  1. Cai, B.; Zhang, L. Urban CO2 emissions in China: Spatial boundary and performance comparison. Energy Policy 2014, 66, 557–567. [Google Scholar] [CrossRef] [Scilit]
  2. Wang, K.; Chen, M. The Epistemology of China’s Green Urbanization. Urban Plan. Forum 2021, 1, 10–17. [Google Scholar] [CrossRef]
  3. Ge, Y.J.; Qu, J.S.; Gao, X.Y.; Liu, C.S.; Tang, J.X.; Song, X.Y.; Zhang, C.; Liu, L.N. Simulation of Chinese Household Carbon Emission Based on System Dynamics. Sci. Technol. Manag. Res. 2022, 42, 239–246. [Google Scholar] [CrossRef]
  4. Xu, J.J.; Yang, X.J.; Li, R. The spatial and temporal heterogeneity of carbon emission and it striving forces in urban households. China Environ. Sci. 2024, 44, 1732–1742. [Google Scholar] [CrossRef]
  5. Luo, G.; Baležentis, T.; Zeng, S. Per capital CO2 emission inequality of China’s urban and rural residential energy consumption: A Kaya-Theil decomposition. J. Environ. Manag. 2023, 331, 117265. [Google Scholar] [CrossRef] [Scilit]
  6. Li, D.R.; Li, Q.Q.; Yang, B.S.; Yu, J.W. Techniques of GIS, GPS and RS for the Development of Intelligent Transportation. Geomat. Inf. Sci. Wuhan Univ. 2008, 3, 331–336. [Google Scholar]
  7. Shi, F.; Wang, W. Urban Road network structure analysis. City Plan. Rev. 2007, 31, 68–73. [Google Scholar]
  8. Gao, H.; Feng, S.M.; Guo, C.X. Characteristic Analysis of Structural Types of Urban Road Network. For. Eng. 2006, 22, 28–31. [Google Scholar] [CrossRef]
  9. Han, B.R.; Pu, H.J.; Ding, Z.X.; Song, W.L. Quantitative Analysis of Urban Road Network Structure Based on Geometric Topology. For. Eng. 2021, 37, 126–134. [Google Scholar] [CrossRef]
  10. Ewing, R.; Cervero, R. Travel and the built environment: A meta-analysis. J. Am. Plan. Assoc. 2010, 76, 265–294. [Google Scholar] [CrossRef] [Scilit]
  11. Jiang, Y. Modelling Household Travel Carbon Emissions Based on Urban Form: A Case of Jinan, China. Ph.D. Thesis, Tsinghua University, Beijing, China, 2016. [Google Scholar]
  12. Wang, Y.N.; Xie, Y.Q.; Xie, L.Q.; Chen, W. Factor Decomposition of Chinese Urban Household Carbon Emissions-Empirical Analysis based on LMDI Model and Q-Clustering. Res. Environ. Sci. 2019, 32, 539–546. [Google Scholar] [CrossRef]
  13. Tong, J.P.; Chen, G.D.; Yang, Z.Y.; Bo, C. Threshold effects of household consumption level on residential carbon emissions. J. Arid. Land. Resour. Environ. 2017, 31, 38–43. [Google Scholar] [CrossRef]
  14. Cao, X.; Gao, Y.; Liu, Z.Q. The impact of Urbanization of Rural Residents on Carbon Emissions from Household Energy Consumption. Chin. Rural. Econ. 2021, 10, 64–83. [Google Scholar] [CrossRef]
  15. Wang, R.; Zhang, H.; Feng, L.M. Impact of China’s County Scale and Structure on Household Carbon Emissions: Key Elements and Representative Indicators. Mod. Urban Res. 2021, 2, 126–132. [Google Scholar] [CrossRef]
  16. Liu, X.Y.; Wang, L.M.; Zhu, S.W. Urban sprawl and residential carbon emission: Panel data on southern cities in China. J. Southeast Univ. (Philos. Soc. Sci.) 2016, 18, 101–108+148. [Google Scholar] [CrossRef]
  17. Tian, D.R.; Yang, S.; Guan, C.; Li, Y. Correlation between urban spatial agglomeration and residents’ household carbon emissions: An analysis based on the data of 110 Chinese cities. City Plan. Rev. 2023, 47, 76–85. [Google Scholar]
  18. Chen, J.; Chen, J.G.; Chen, Q.; Liu, K.L.; Dai, X.Y. Nonlinear Relationship Model of Factors Influencing Carbon Emissions in Mountainous Urban Road Transportation. J. Transp. Syst. Eng. Inf. Technol. 2024, 24, 237–245. [Google Scholar] [CrossRef]
  19. Wang, R.; Ke, J.; Zhang, H. The Carbon Emission Mechanism of Traffic Congestion in Mega Cities Caused by Job-housing imbalance: A Case Study of Commuting Behavior from Suburban Housing to Urban Workplaces in Tianjin. Shanghai Urban Plan. Rev. 2023, 6, 33–39. [Google Scholar] [CrossRef]
  20. Song, D.Y.; Song, Q.Y.; Zhang, Q. An Analysis of the Driving Factors of China’s Transportation Carbon Emissions: Based on Decoupling Theory and Generalized Fisher Index Decomposition. Sci. Technol. Manag. Res. 2022, 42, 216–228. [Google Scholar] [CrossRef]
  21. Ma, S.H.; Chen, X.F.; Yang, L.; Zhao, Y.Z.; Zeng, Y. Impacts of Accessibility on Spatial Heterogeneity of Multimodal Transportation Carbon Emissions in an Urban Agglomeration. J. Transp. Syst. Eng. Inf. Technol. 2024, 24, 64–74. [Google Scholar] [CrossRef]
  22. Yu, Y. Exploring the Impact of Built Environment on Commuting Emissions Based on Spatiotemporal Big Data-Taking Wuhan Metropolitan Area as an Example. Master’s Thesis, Wuhan University, Wuhan, China, 2022. [Google Scholar] [CrossRef]
  23. Ji, Q.F.; Li, C.C.; Makvadndi, M.; Zhou, X. Impacts of urban form on integrated energy demands of buildings and transport at the community level: A comparison and analysis from an empirical study. Sustain. Cities Soc. 2022, 79, 103680. [Google Scholar] [CrossRef] [Scilit]
  24. Wang, Y. Impacts of Different Urban Spatial Forms on Carbon Emissions. Master’s Thesis, Chongqing University, Chongqing, China, 2022. [Google Scholar] [CrossRef]
  25. Yang, W.Y.; Liang, F.W. CAOXS Examining the effects of the multi-scale built environment on residents CO2 emissions from commuting: An empirical study of Guangzhou. Geogr. Res. 2020, 39, 1625–1639. [Google Scholar] [CrossRef]
  26. Sharifi, A. Resilient urban forms: A review of literature on streets and street networks. Build. Environ. 2019, 147, 171–187. [Google Scholar] [CrossRef] [Scilit]
  27. Liang, J.Y. Study on the Spatial-Temporal Interaction Between Urban Compactness and Carbon Emissions in the Yangtze River Delta Region. Master’s Thesis, Zhejiang University, Hangzhou, China, 2022. [Google Scholar] [CrossRef]
  28. Yang, Y.C.; Wang, Y.M. The Research on Territory Structure of Valley-city in the Western China. Areal Res. Dev. 2000, 4, 58–61. [Google Scholar]
  29. Yang, Y.C. On the Urban Development and Urban Spatial Structure of Valley Cities in the Western China; Nanjing University: Nanjing, China, 2003. [Google Scholar]
  30. Zhang, X.H.; Lei, C.F.; Li, H.F.; Chen, Q. Study on urban planning of answering to climate change for western valley cites. In Proceedings of the 8th Urban Development and Planning Conference, Putrajaya, Malaysia, 3–5 December 2013. [Google Scholar]
  31. Zhang, X.Q.; Li, H.R. The Relationship between the Development of the Tertiary Industry and Labor Employment and Its Forecast. Stat. Decis. 2016, 13, 109–112. [Google Scholar] [CrossRef]
  32. Bai, Y.X.; Shi, P.Y.; Yang, C.C.; Jia, M.; Wang, G.; Yang, H.W.; Xu, Z.L. Analysis of accumulation characteristics of phenolic acids and their interactions in tobacco planted soil with different continuous cropping years. Soil Fertil. Sci. China 2019, 3, 22–28. [Google Scholar] [CrossRef]
  33. Cao, X.; Gao, Y. Has the policy of low carbon city pilot led to a green life? China Popul. Resour. Environ. 2021, 31, 93–103. [Google Scholar] [CrossRef]
  34. Guo, R.; Wu, X.C.; Rui, F. Research on the Impact of Town Space Compactness on Carbon Emissions: Taking Changxing County as an Example. J. Hum. Settl. West China 2023, 38, 122–128. [Google Scholar] [CrossRef]
  35. Wu, F.; Shi, F.; Xiao, P.Y.; Yu, P.Y. Effects of urban road network layout structure on public transportation trips. J. Nanjing Tech Univ. (Nat. Sci. Ed.) 2019, 41, 520–528. [Google Scholar] [CrossRef]
  36. Zhao, Z.; Zeng, C.; Cheng, Y.J. The Spillover Effect of Traffic Network on Intensive Land Use: A Case Study in Beijing-Tianjin-Hebei Urban Agglomeration. Econ. Geogr. 2020, 40, 174–183. [Google Scholar] [CrossRef]
  37. Zhou, K.; Jing, D.F.; Jing, L.L. An Approach for Selecting Guidance Route of High-density Road Network Based on Node Capacity. J. Highw. Transp. Res. Dev. 2021, 38, 124–130. [Google Scholar] [CrossRef]
  38. Ou, J.S. Traffic Congestion Propagation Pattern Recognition and Visualization for Heterogeneous Urban Networks. Ph.D. Thesis, Southeast University, Nanjing, China, 2019. [Google Scholar] [CrossRef]
  39. Kou, S.H.; Yao, Y.; Zheng, H.; Zhou, J.F.; Zhang, J.Q.; Ren, S.L.; Wang, R.F.; Guan, Q.F. Delineating China’s urban traffic layout by integrating complex graph theory and road network data. J. Geo-Inf. Sci. 2021, 23, 812–824. [Google Scholar] [CrossRef]
  40. Porta, S.; Latora, V.; Wang, F.; Rueda, S.; Strano, E.; Scellato, S.; Cardillo, A.; Belli, E.; Càrdenas, F.; Cormenzana, B.; et al. Street centrality and the location of economic activities in Barcelona. Urban Stud. 2012, 49, 1471–1488. [Google Scholar] [CrossRef] [Scilit]
  41. Chen, W.; Huang, H.; Liao, S.; Gao, F.; Biljecki, F. Global urban road network patterns: Unveiling multi scale planning paradigms of 144 cities with a novel deep learning approach. Landsc. Urban Plan. 2024, 241, 104901. [Google Scholar] [CrossRef] [Scilit]
  42. Wang, Y.L.; Gao, S.; Liu, Y. Exploration into urban street closeness centrality and its application methods: A case study of Qingdao. Geogr. Res. 2013, 32, 452–464. [Google Scholar]
  43. Chen, Y.Y.; Chen, Y.B.; Yin, G.W.; Song, C.Z.; Hou, Y.M. The influence of road network centrality on the spatial distribution of catering: A case study of Qingdao main urban area. Sci. Geogr. Sin. 2022, 42, 1609–16181. [Google Scholar] [CrossRef]
  44. Neumann, J. The topological information content of a map: An attempt at a rehabilitation of information theory in cartography. Cartography 1994, 31, 26–34. [Google Scholar] [CrossRef] [Scilit]
  45. Li, Z.; Huang, P. Quantitative measures for spatial information of maps. Int. J. Geogr. Inf. Syst. 2002, 16, 699–709. [Google Scholar] [CrossRef] [Scilit]
  46. Liu, H.M.; Deng, M.; Fan, Z.D. An Overview on the Methods of Measuring Map Information Content and Their Applications. Geogr. Geo-Inf. Sci. 2012, 28, 1–6. [Google Scholar]
  47. He, J. On Quantitative Measurements of the Structural Complexity of Road Networks. Master’s Thesis, Southwest Jiaotong University, Chengdu, China, 2016. [Google Scholar]
  48. Zhang, Y.; Zheng, F.J.; Liu, Y.F.; Liu, Y.; Hu, H.P.; Xu, P.F. Extracting Urban Built-up Area Based on Impervious Surface Area and POI Data. Sci. Geogr. Sin. 2022, 42, 506–514. [Google Scholar] [CrossRef]
  49. Li, J.C.; Qi, X.X.; Yuan, W.H. Spatial differentiation of multi-functional mixed use of construction land based on points of interest. Prog. Geogr. 2022, 41, 239–250. [Google Scholar] [CrossRef] [Scilit]
  50. Nagurney, A. The negation of the Braess paradox as demand increases: The wisdom of crowds in transportation networks. EPL 2010, 91, 48002. [Google Scholar] [CrossRef] [Scilit]
  51. Kennedy, C.; Cuddihy, J.; Engel-Yan, J. The Changing Metabolism of Cities. J. Ind. Ecol. 2007, 11, 43–59. [Google Scholar] [CrossRef] [Scilit]
Figure 1. The process of calculating household carbon emissions.
Buildings 16 01906 g001
Figure 2. Total and average scale of household carbon emissions.
Buildings 16 01906 g002
Figure 3. GCC-KDE of the WVCs.
Buildings 16 01906 g003
Figure 4. Curve Estimation for road network structure indicators and household carbon emissions.
Buildings 16 01906 g004
Table 1. Characteristics of road network compactness and variability.
CityNKmaxKminCIEVIECIE × RDLVIE × RDL
Panzhihua203616.06034.8838.71236.238
Wuzhou313726.32546.4549.20967.642
Tianshui300626.53942.07910.58268.090
Baise298626.54536.2396.54436.238
Lanzhu1242726.683152.44130.578697.475
Baoji893826.73688.32223.152303.573
Mianyang1925716.786244.89735.5851284.144
Suining480726.78763.06710.36296.292
Hanzhong709716.86797.89515.469220.508
Yibin1006826.90894.69920.112275.712
Zunyi6401026.91656.11623.299189.059
Xining1020927.05998.75626.909376.480
Nanning1185817.136120.68052.398886.140
Guiyang717827.13984.87052.105619.395
Yan’an439727.17745.47511.19870.949
Table 2. Analysis of correlation between road network structure indicators and household carbon emissions.
Indicators of Urban Road Network Structural CharacteristicsGCC-KDECIE × RDLVIE × RDL
Household
carbon emissions
Correlation Coefficient (Kendall)−0.543 ***0.638 ***0.486 **
Significance (two-tailed)0.0050.0010.012
Ob151515
Note: *** and ** indicate significance at the 0.01 and 0.05 levels, respectively.
Table 3. Regression model for road network structure indicators and household carbon emissions.
1234567
VariablesCECECECECECECE
GCC-KDE−0.634 ** 0.123 −0.4610.046
(430,382,153,345.46) (437,204,092,143.68) (609,384,698,657.61)(399,230,515,007.99)
CIE * × RDL 0.871 *** 0.964 ***1.244 *** 1.271 ***
(17,339.33) (27,928.06)(26,474.68) (31,652.48)
VIE × RDL 0.555 ** −0.455 *0.243−0.446 *
(1176.23) (1071.02)(1574.76)(1140.60)
Temp0.1500.0770.0160.0570.0990.1150.09
(84,082.82)(51,793.35)(86,560.15)(55,306.17)(45,972.84)(87,193.37)(50,029.43)
Constant2,725,314.94 *−606,347.131,156,932.93−1,008,786.23−958,515.132,127,715.10−1,102,687.05
(1,392,151)(982,676)(1,522,312)(1,274,797)(885,712)(1,622,726)(1,144,834)
Ob15151515151515
R20.3810.7540.3080.7600.8230.4120.824
Note: ***, **, and * indicate significance at the 0.01, 0.05, and 0.1 levels, respectively.
Table 4. Curve fitting result of road network structure indicators and household carbon emissions.
ModelRN Structure CharacteristicsModel ExpressionsR2Ad R2F-Testt-Test
InverseGCC-KDECE = 449859.852 + 1.028/(GCC-KDE)0.6880.6640.0000.000
LinearCIE × RDLCE = −140021.220 + 104324.612(CIE × RDL)0.7480.7290.0000.000
PowerVIE × RDLlnCE = ln114291.647 + 0.501ln(VIE × RDL)0.5040.4660.0030.003
Disclaimer/Publisher’s Note: The statements, opinions and data contained in all publications are solely those of the individual author(s) and contributor(s) and not of MDPI and/or the editor(s). MDPI and/or the editor(s) disclaim responsibility for any injury to people or property resulting from any ideas, methods, instructions or products referred to in the content.