Article

Experimental Study on the Flexural Performance of Geogrid-Reinforced Foamed Lightweight Soil

1
School of Transportation and Civil Engineering, Shandong Jiaotong University, Jinan 250357, China
2
School of Qilu Transportation, Shandong University, Jinan 250061, China
*
Author to whom correspondence should be addressed.
Buildings 2025, 15(3), 461; https://doi.org/10.3390/buildings15030461
Submission received: 25 December 2024 / Revised: 27 January 2025 / Accepted: 30 January 2025 / Published: 2 February 2025
(This article belongs to the Section Building Structures)

Abstract

The flexural behavior of geogrid-reinforced foamed lightweight soil (GRFL soil) is investigated in this study using unconfined compressive and four-point bending tests. The effects of wet density and reinforcement layers on flexural performance are analyzed using load–displacement curves, damage patterns, load characteristics, unconfined compressive strength, and flexural strength. A variance study demonstrates that increasing the wet density significantly increases unconfined compressive strength. Bond stress mechanisms enable geogrid integration, efficiently reroute stresses internally, and greatly increase flexural strength. With a maximum unconfined compressive strength of 3.16 MPa and a peak flexural strength increase of 166%, this reinforcement increases both strength and ductility by changing the damage pattern from brittle to ductile. The principal load is initially supported by the foamed lightweight soil, and in later phases, geogrids take over load-bearing responsibilities. Additionally, the work correlates the ratio of unconfined compressive to flexural strength with wet density and informs the development of predictive models for unconfined compressive strength as a function of reinforcing layers and wet density.

1. Introduction

With its many closed air pores, foamed lightweight soil is a lightweight material with high fluidity [1], light weight, and high strength [2], and has the properties of thermal insulation [3,4], fire resistance [5], sound insulation [6,7], seismic resistance, and durability [8,9,10]. It is frequently used for abutment backfill [11,12], subgrade filling [13,14], and wall filling [15], and has a wide range of potential applications in the engineering field. While conventional backfill can withstand certain pressure and shear force in real-world applications such as subgrade widening [16], road reconstruction and expansion, and sloping areas, it is challenging to meet higher criteria in terms of bearing capacity. Foamed lightweight soil backfill exhibits lower toughness and poorer flexural performance during the stress process, is prone to brittle damage under the ultimate load, and has a significantly reduced bearing capacity because of the articulation difference between the new and old subgrade, the material’s own compression difference, and terrain space limitations [17]. Foamed lightweight soil is susceptible to stress concentration, excessive strain, and displacement when subjected to the repeated impacts of pavement structure static stresses and vehicle dynamic loads. These circumstances have the potential to cause shearing, tensile failure, and crushing, among other forms of damage [18]. As a result, there may be serious problems such as stepped or staircase cracking, uneven subgrade settlement, and overall sliding. These elements may shorten the road’s service life and jeopardize its structural soundness. Therefore, to fulfill the increasingly demanding requirements of engineering applications, the ductility and flexural capabilities of foamed lightweight soil can be greatly improved by adding appropriate geosynthetics as part of its modification treatment.
Fibrous materials including glass fibers [19], basalt fibers [20], carbon fibers, and polypropylene fibers [21] have been added by numerous researchers to foamed lightweight soils to increase their strength, toughness, stiffness, and ductility—all of which can lower the likelihood of brittle breakage. However, because the size and distribution of the fibrous material restrict its capacity to enhance overall performance, brittle degradation may still occur under excessive pressure or adverse building conditions. To efficiently increase the bearing capacity and improve the overall stability in engineering applications, cheap and flexible plastic geogrids are incorporated into foamed lightweight soils. Their special mesh structure interlocks with the foamed lightweight soils. Furthermore, the plastic geogrid system is essential in preventing cracks from forming in foamed lightweight soils, greatly enhancing the material’s durability and resistance to cracks, particularly in the areas of road construction, slope stability, and foundation reinforcement [22], all of which have a wide range of potential uses.
While there are fewer studies on the combination of geogrids and cementitious materials [23], particularly concentrating on materials like glass fiber grids [19], basalt fiber grids, and carbon fiber grids [24], there are currently more studies on the interfacial interaction with the soil body. However, there are fewer studies on plastic geogrids, which are more flexible, cost-effective, and efficient. Research on the flexural characteristics and macroscopic damage mechanisms of foamed lightweight soils with various geogrid layers is particularly lacking. To close this gap, this work intends to provide a theoretical foundation and technical assistance for engineering practice by examining the impact of varying numbers of reinforcement layers and wet density on the flexural properties of foamed lightweight soil.
Thus, the primary goal of this study is to examine the flexural performance of GRFL soil using the four-point bending test and unconfined compressive strength test. Additionally, the study will examine the material’s macroscopic damage mechanism by analyzing the load–displacement curves, combining them with the damage morphology, and performing strength characterization. The findings show that the geogrid’s reinforcing impact greatly increased the foamed lightweight soil’s flexural strength. This aids in developing novel lightweight road-building materials with high flexural performance and environmental and financial protection.

2. Materials and Methods
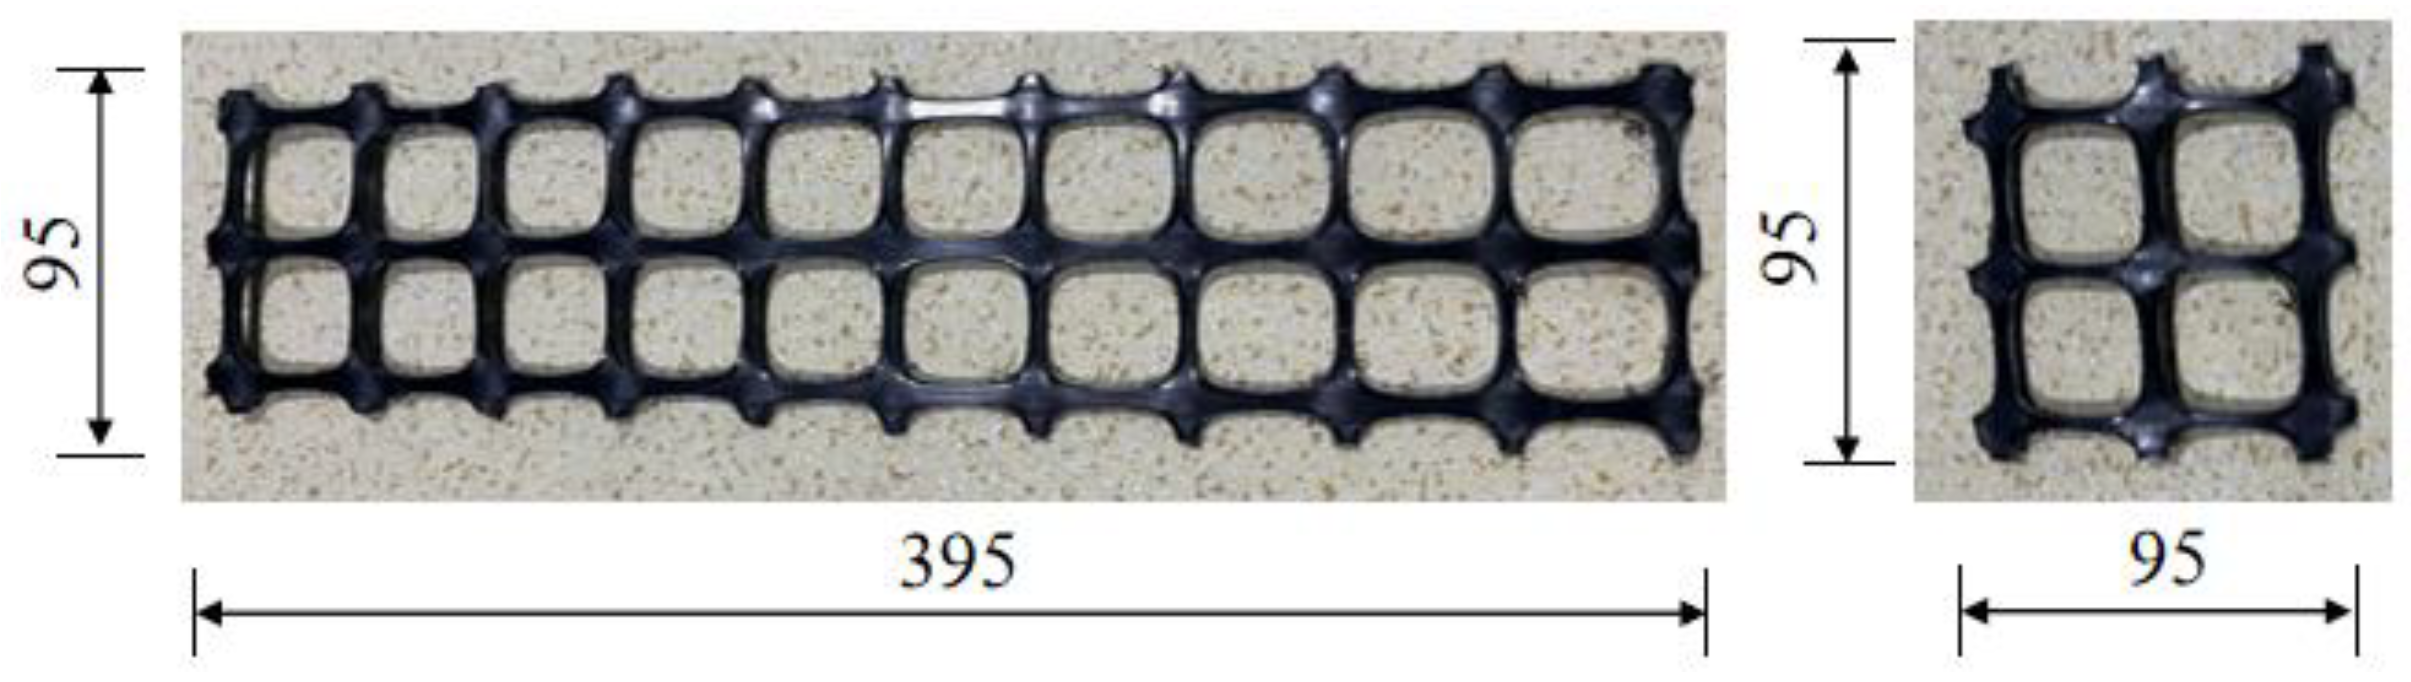
2.1. Raw Materials

The cement used in this study is ordinary Portland cement P·O 42.5. The foam was produced via the physical foaming method, using a PM-D50 composite foaming agent with a dilution ratio of 1:50. The foam had a density of 50 kg/m3 and a bleed water rate of 15.71%. The typical setting and hardening of the cement were unaffected by the laboratory water used for mixing. Polypropylene, which is inexpensive and has high tensile strength, was the primary component of the bi-directional plastic geogrid chosen for the test. Additionally, this material has great resistance to acids and alkalis, as well as anti-aging and anti-creep properties [25]. It is possible to overlook how cement slurry affects the plastic geogrid’s durability [26]. To guarantee complete contact with the top and lower fillers, the geogrid was cut into 95 mm × 95 mm and 95 mm × 395 mm rectangles [27], as shown in Figure 1. Its primary performance metrics, as determined by the geogrid tensile test, are listed in Table 1. The geogrid has a 33 mm × 33 mm grid, and the smaller the grid, the greater the reinforcement effect [28].

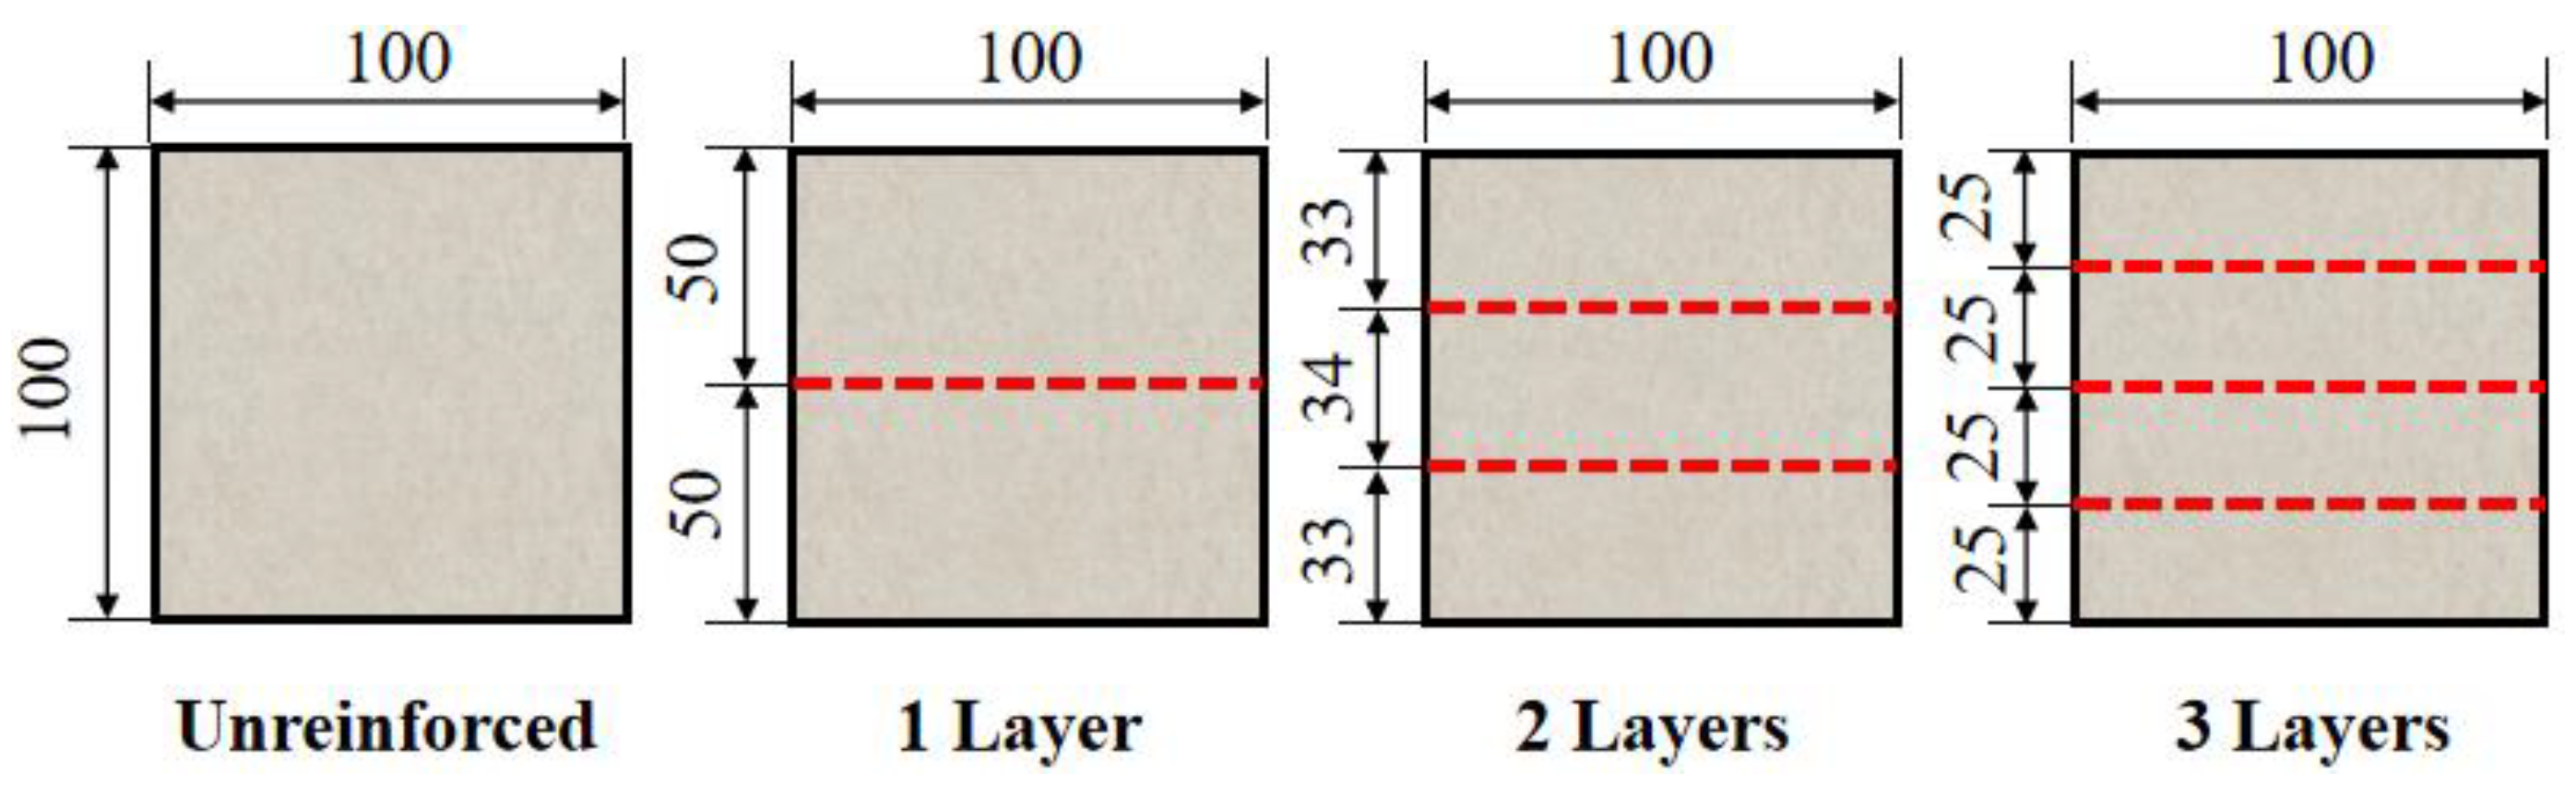
2.2. Experimental Design

Table 2 displays the mix ratio and fundamental physical characteristics of several foamed lightweight soils, and all flow values fall between 160 and 200 mm [29]. All compositions had a water–cement ratio of 0.55. The test used four different geogrid reinforcement layers: 0, 1, 2, and 3. These were chosen based on the actual engineering usage and cost performance; the wet density of 600 kg/m3, 700 kg/m3, and 800 kg/m3; and the economy, effective use of resources, and construction feasibility [30]. This is because the improvement in the reinforcement effect becomes less evident when the number of reinforcement layers increases from two to three. The geogrid in the sample side layout is depicted in Figure 2. Three parallel specimens were made for each of the twelve mixing ratios that were intended for this test, and a total of seventy-two specimens were tested for flexural and unconfined compressive strength. When processing the peak load data, the remaining specimens were averaged for analysis and processing if the error between the three parallel specimens was more than 10%. If the error was two more than 10%, the data were discarded and retested.

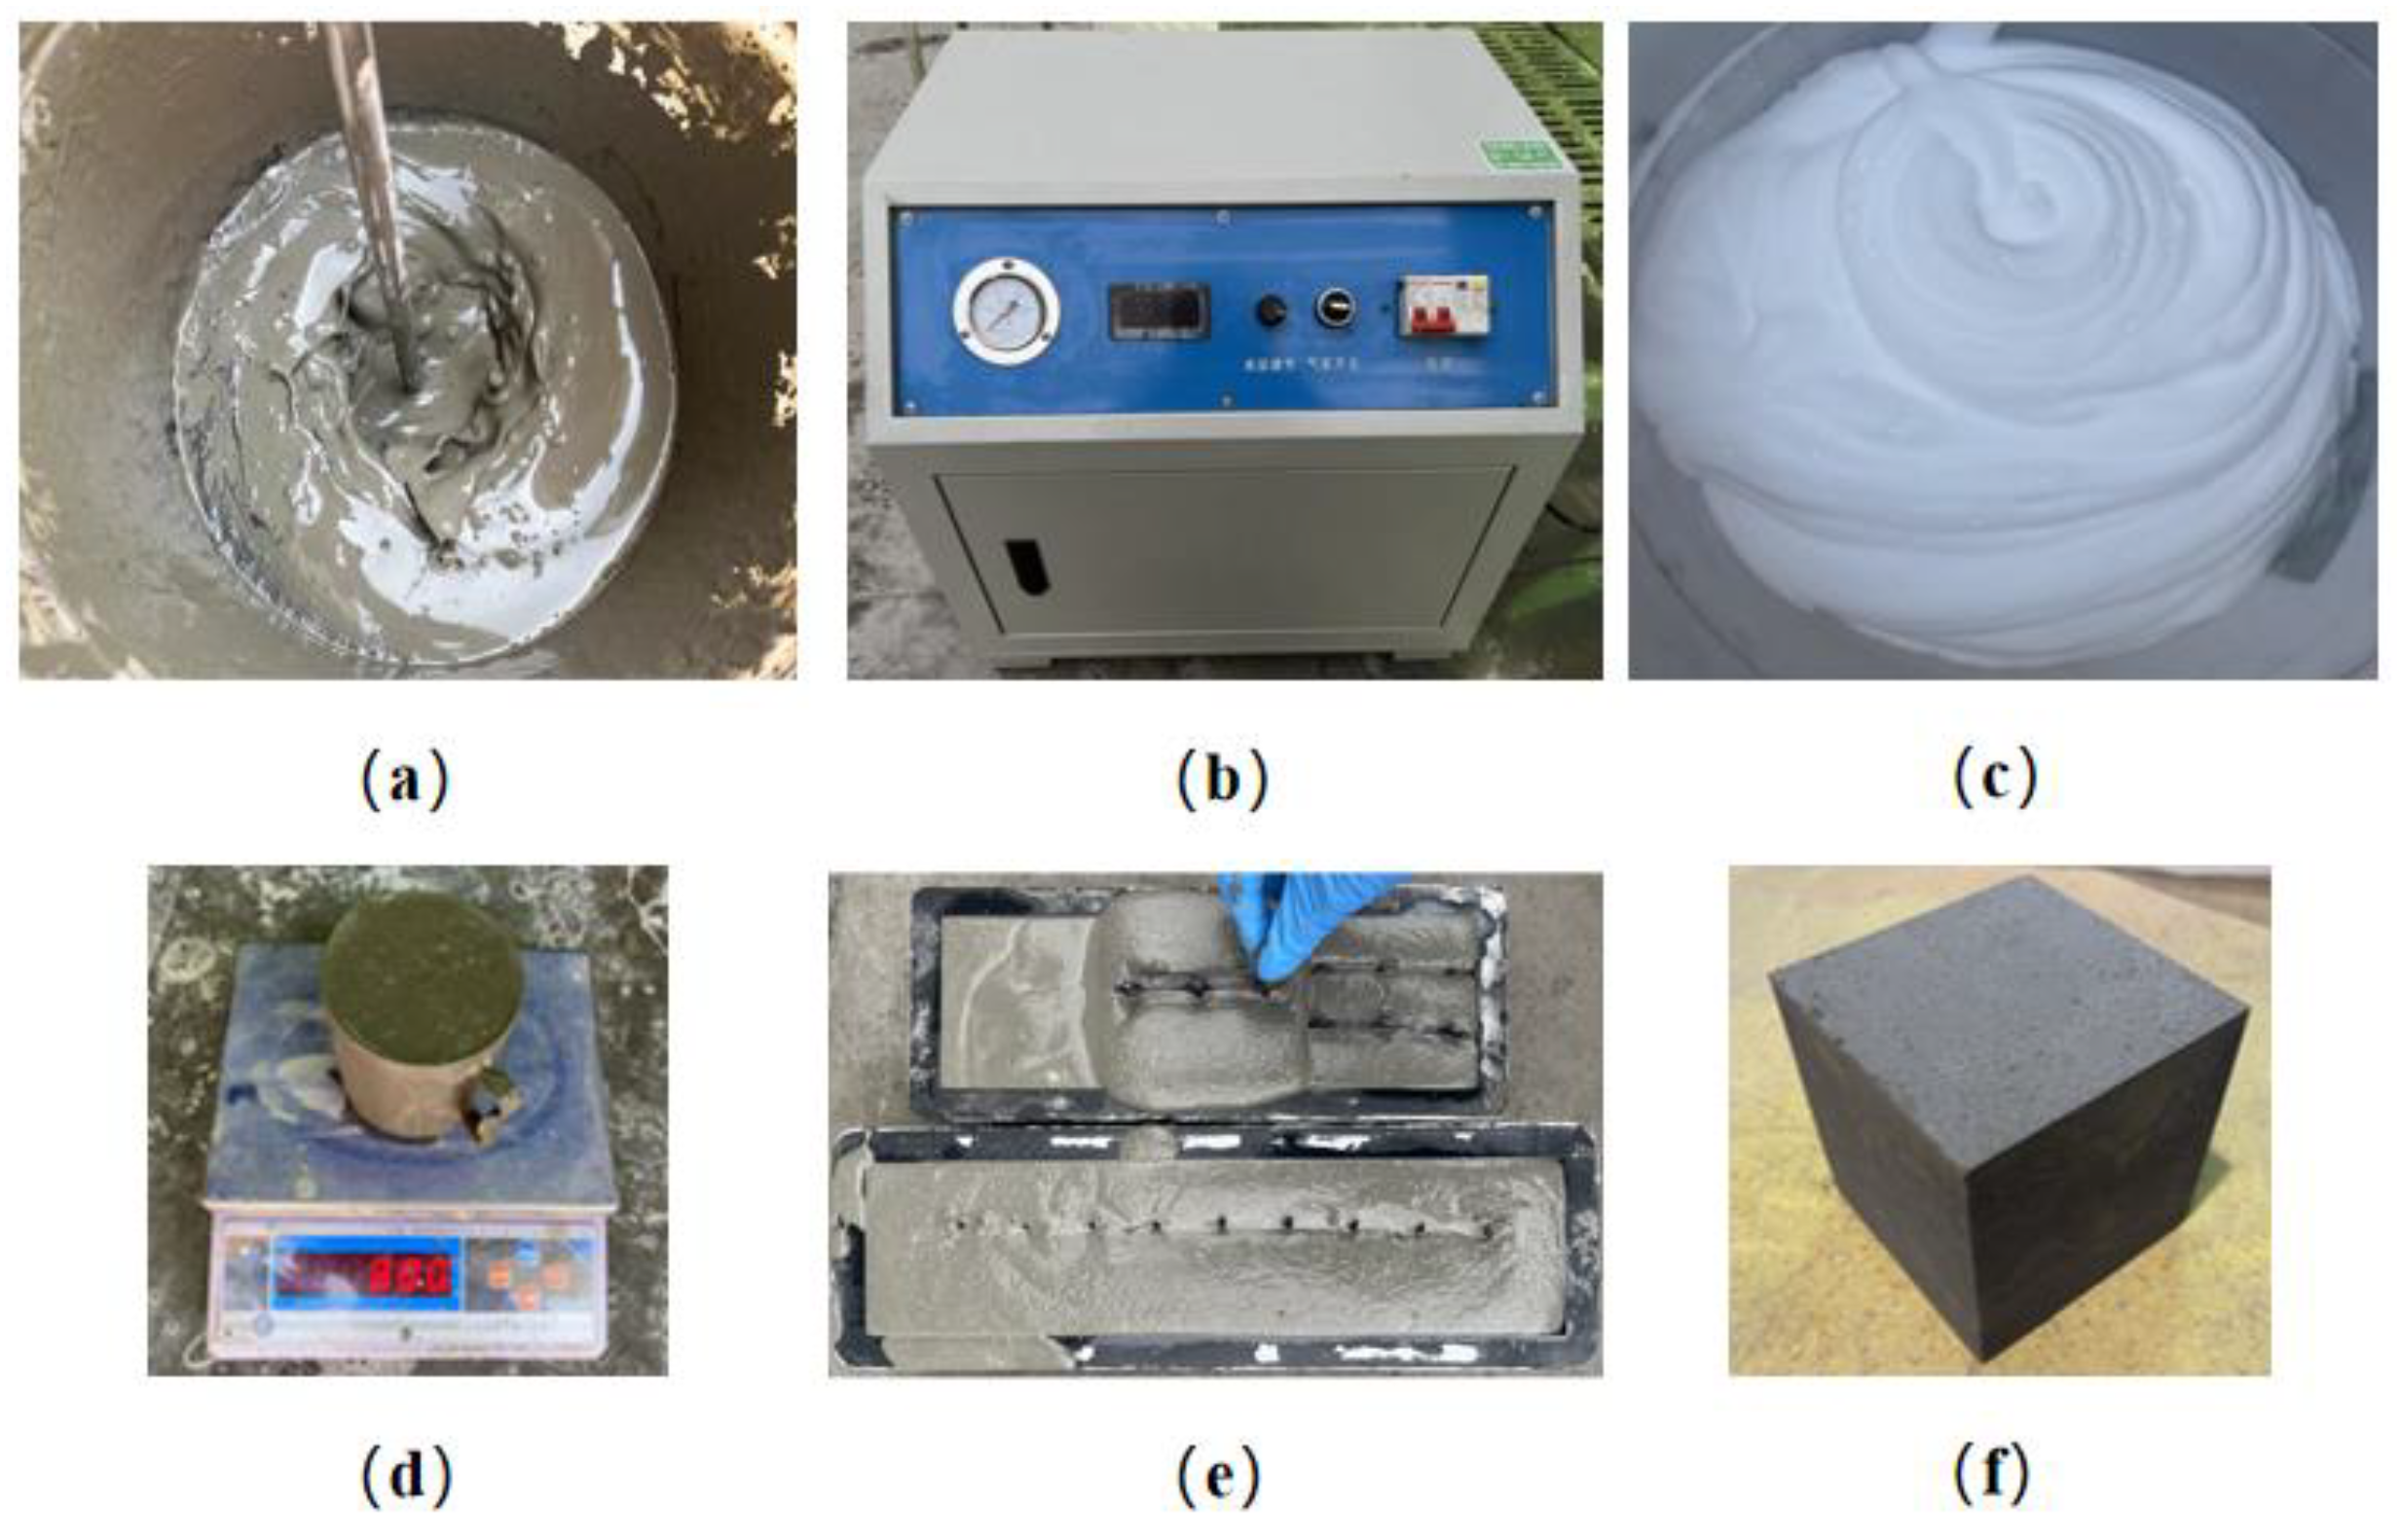
2.3. Specimen Preparation Method

The process of creating a GRFL soil specimen is depicted in Figure 3. Weighed cement and water were put into a bucket and mixed quickly with a hand-held mixer for one and a half minutes. The cement paste was then made as shown in Figure 3a, and the foam made on-site by a foaming machine, as shown in Figure 3b, was added as shown in Figure 3c. To meet the target wet density and the flow value requirements, as shown in Figure 3d, the slurry was then poured into a test mold. As shown in Figure 3e, the vertical insertion of the geogrid into the test mold filled with slurry at a specific location may effectively avoid geogrid location deviation, whereas horizontal layering in the test mold at a specified location before adding the slurry can easily lead to location deviation. Figure 3f shows the GRFL soil specimen obtained after maintenance for 28 days.

2.4. Test Methods

Using a micro-electro-hydraulic servo pressure testing machine, the flexural strength test uses four-point loading, with a test size of 100 mm × 100 mm × 400 mm and a loading rate of 0.2 ± 0.05 kN/s [31]. Data are automatically collected once the test has begun. The unconfined compressive strength test piece size was 100 mm × 100 mm × 100 mm, with a loading rate of 1 kN/s. GB/T 11969-2020, ’Test Method for Performance of Autoclaved Aerated Concrete’ [31], was the reference for the unconfined compressive strength and flexural strength calculation method. Although foamed lightweight soil and autoclaved aerated concrete have different maintenance requirements, the standards for autoclaved aerated concrete can serve as a useful guide for testing and applying foamed lightweight soil due to their similar mechanical characteristics, testing procedures, and material composition.

3. Experimental Results and Discussion

3.1. Flexural Properties of GRFL Soil

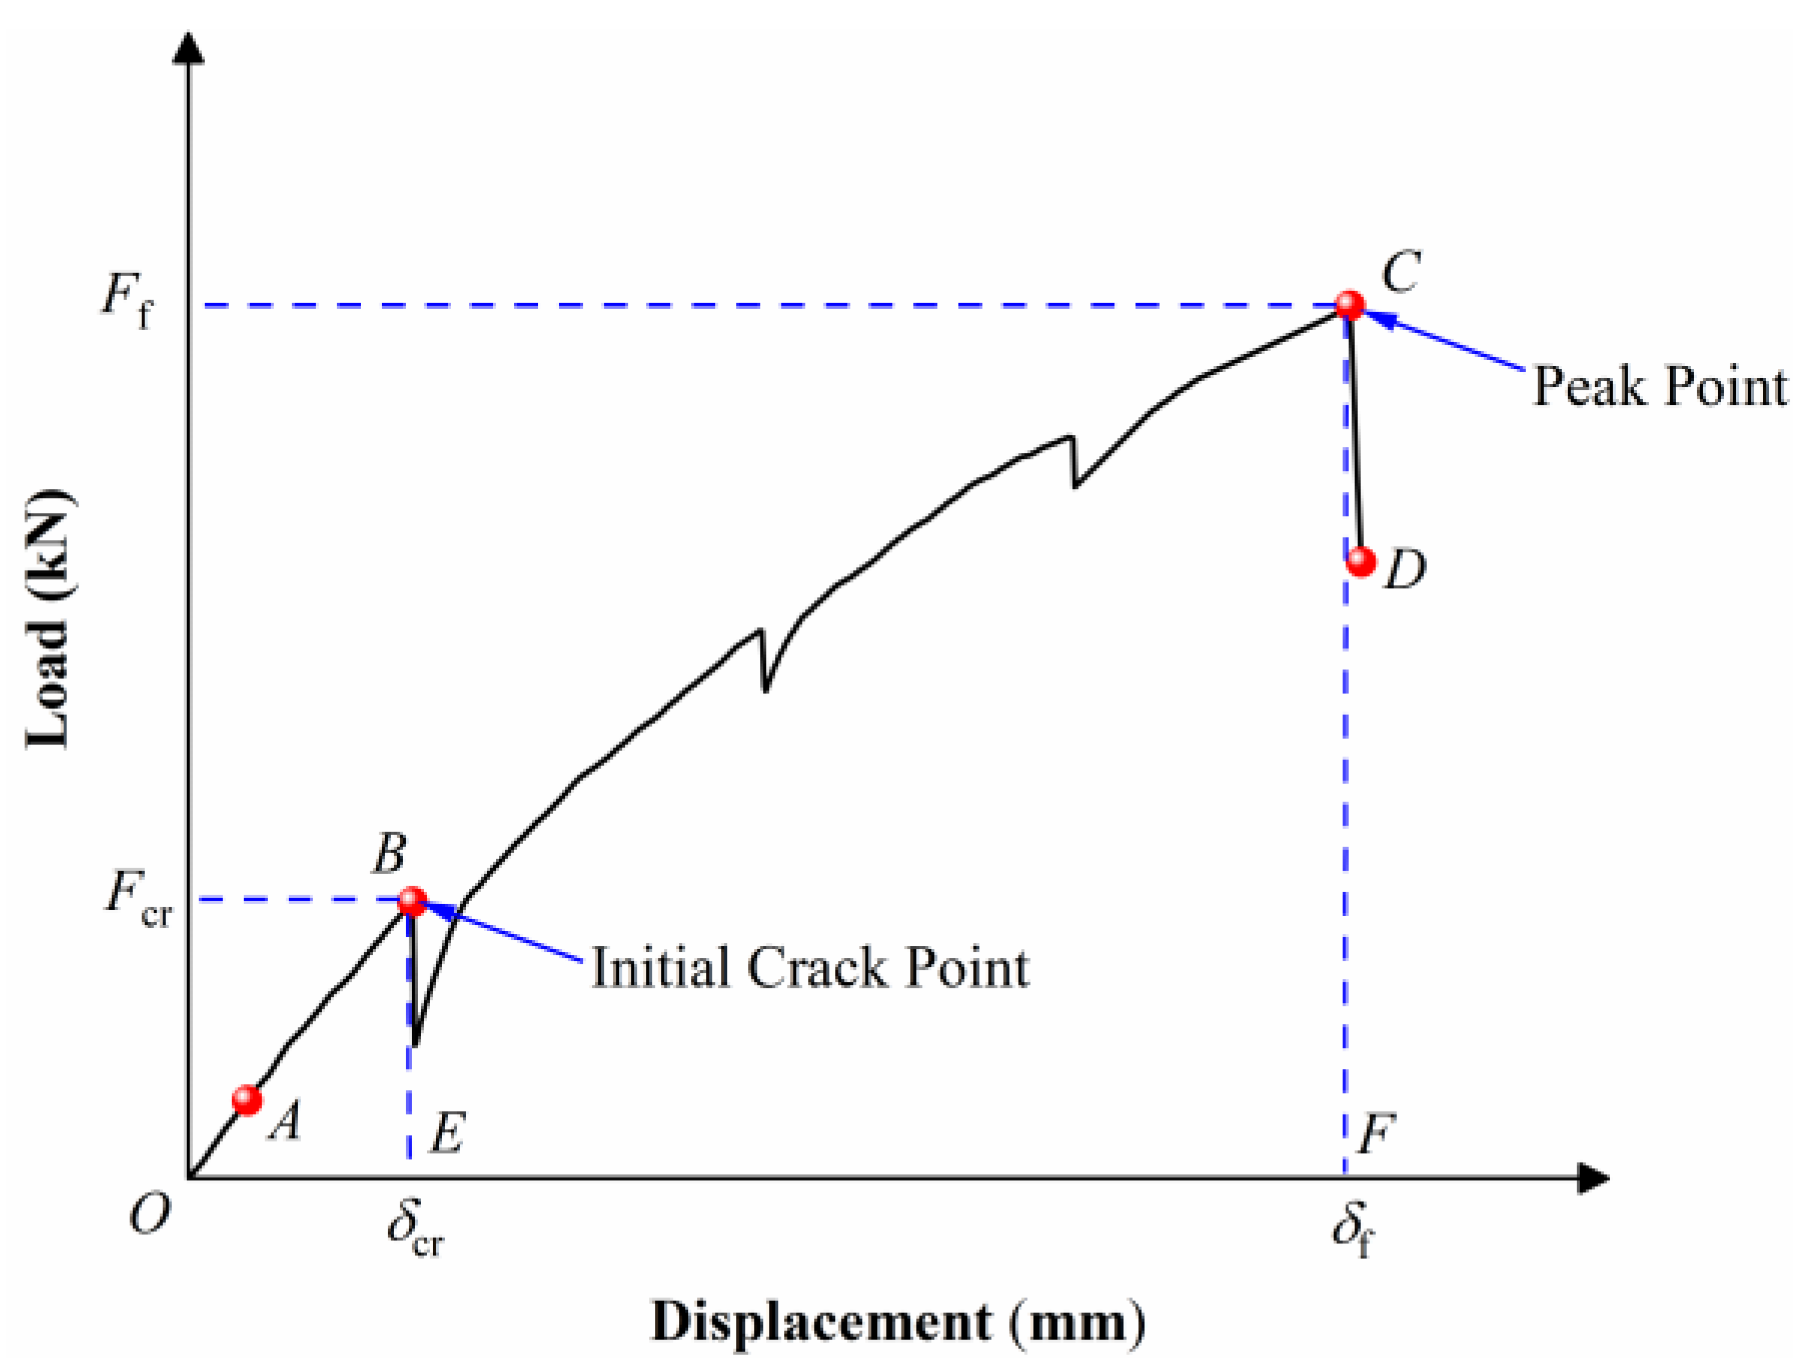
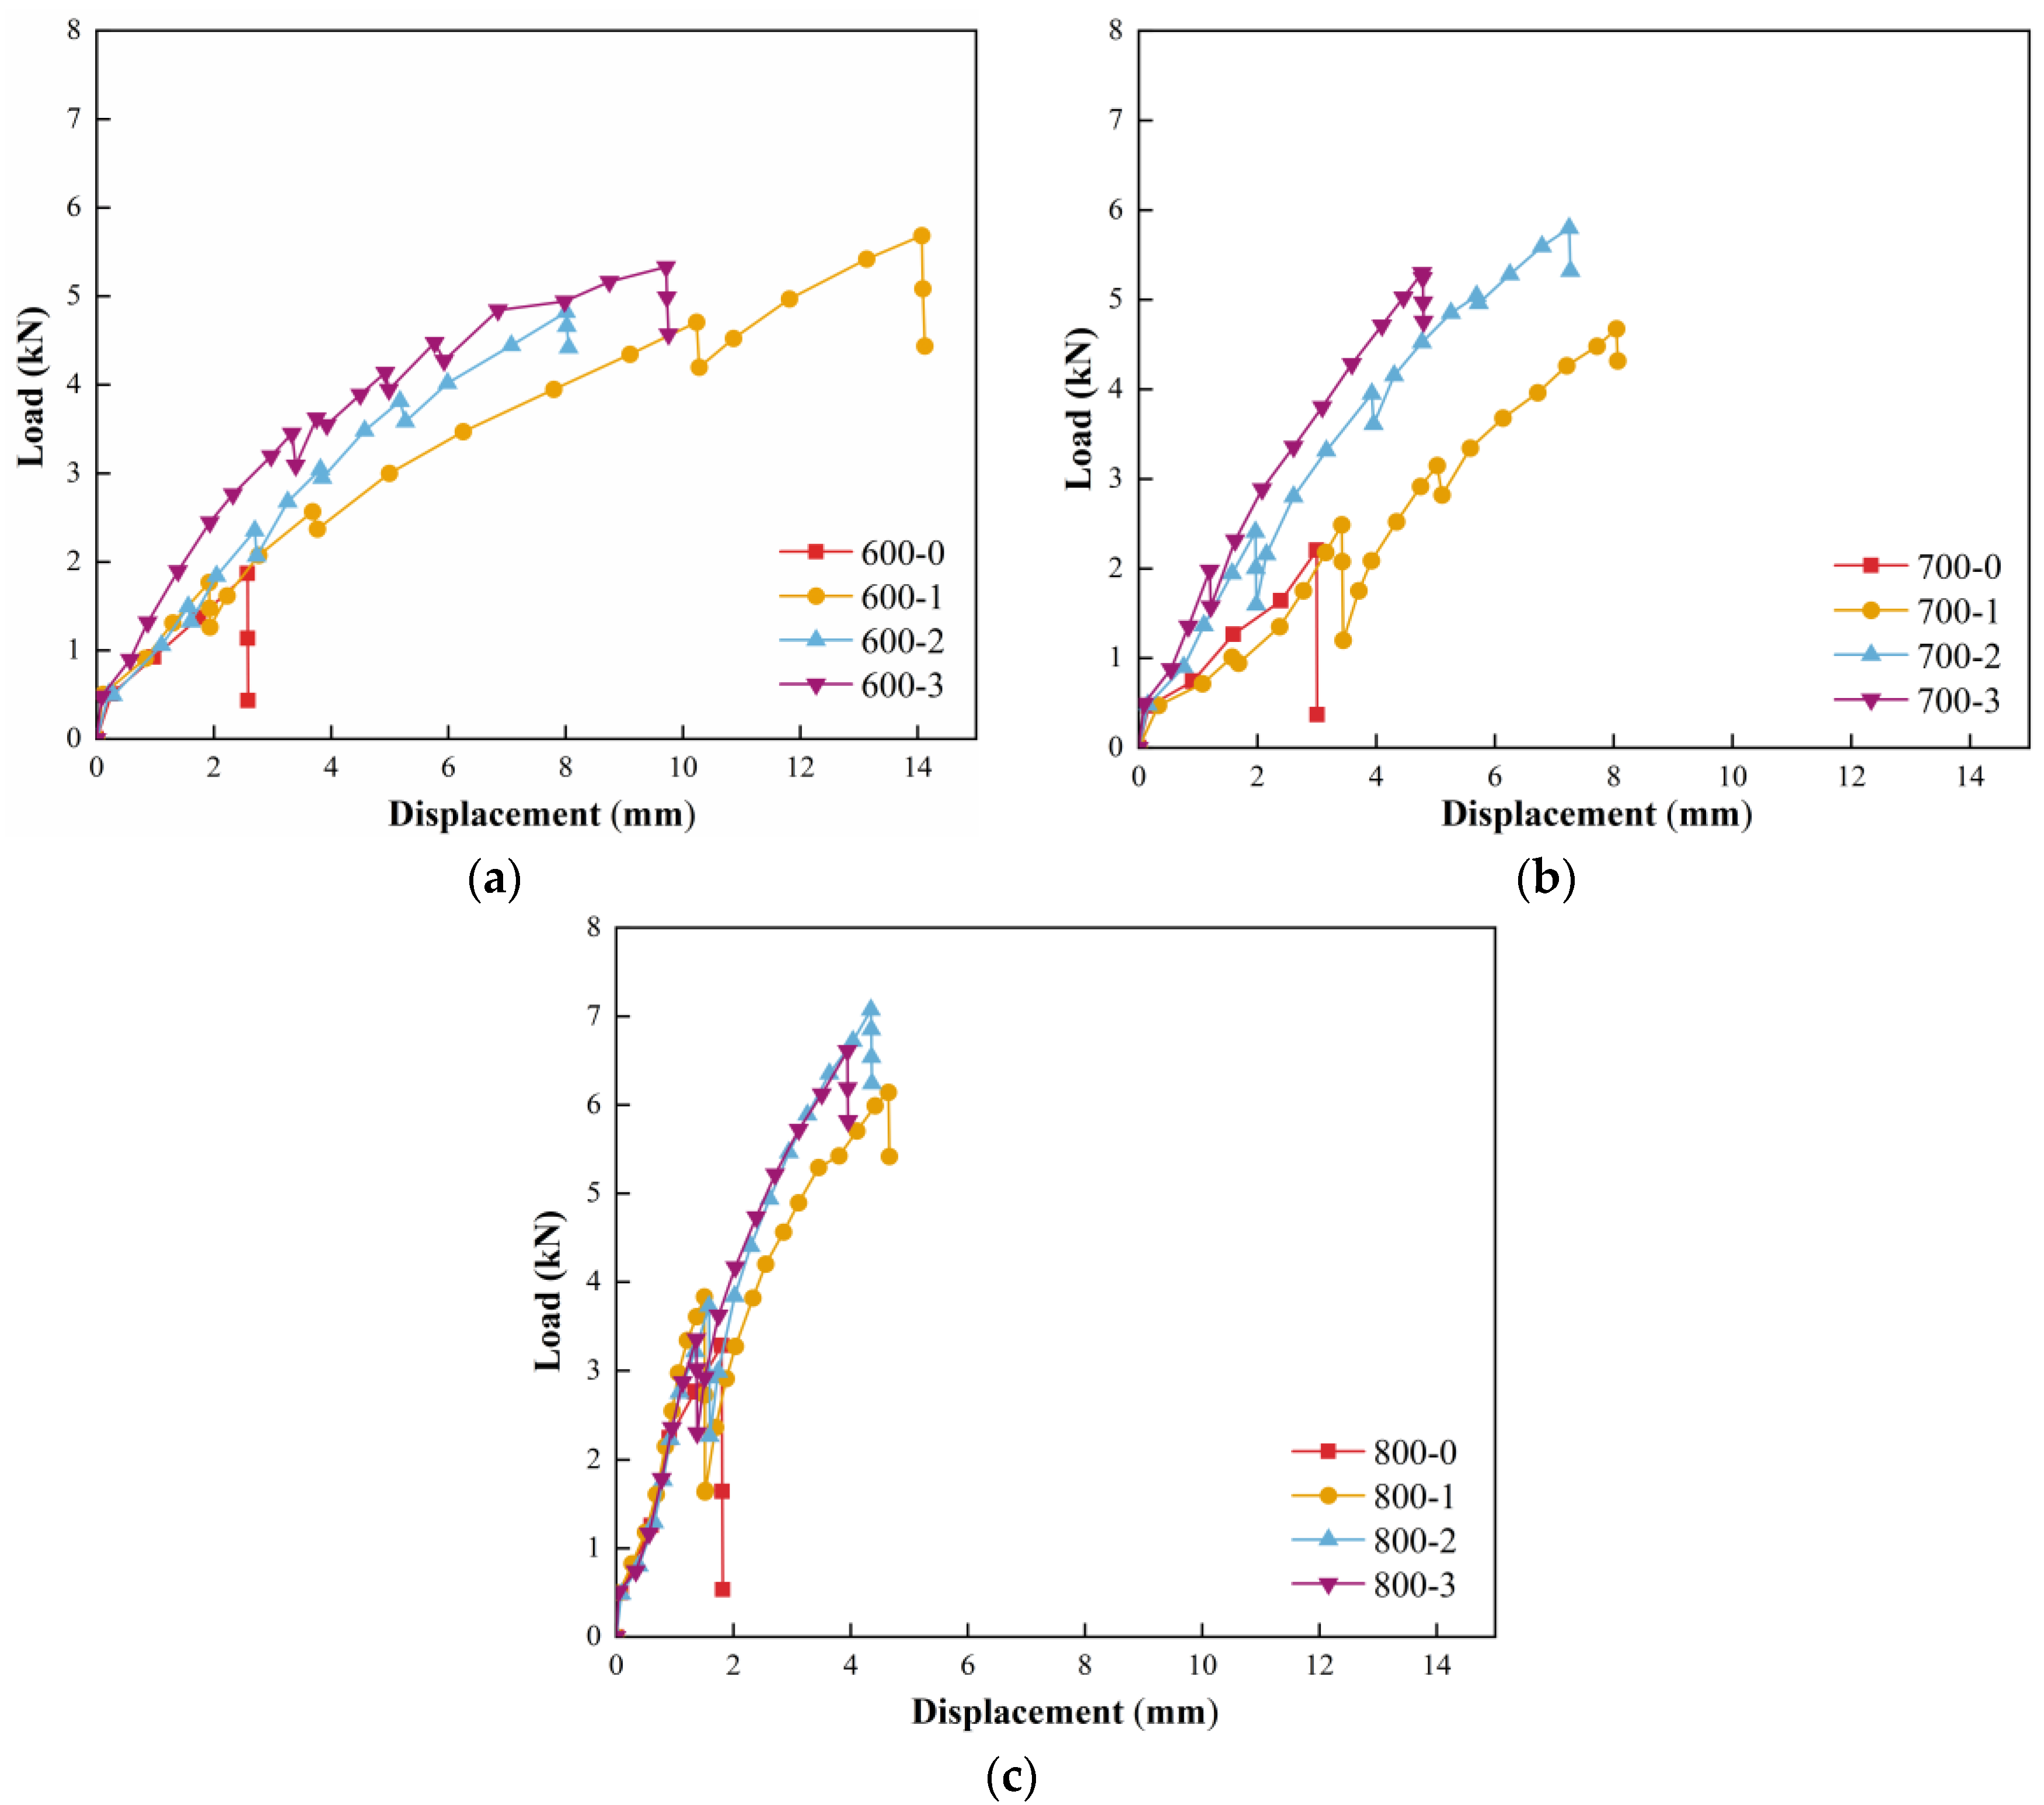
3.1.1. Load–Displacement Curves

Figure 4 shows the load–displacement curve of a GRFL soil specimen under a four-point bending test. Load–displacement curves were plotted for one sample data from two to three specimen samples. The findings demonstrate that the standard foamed lightweight soil showed signs of brittle degradation and fell after the load peaked. The load reached its initial peak value after adding the geogrid, and then briefly decreased before continuing to rise as the displacement increased. The load also increased more quickly as the number of reinforced layers increased, exhibiting elastic–plastic damage characteristics. This is because more displacement is needed to reach the peak load in relatively foamed lightweight soil with a lower wet density, whereas a smaller displacement is needed to reach the peak load in foamed lightweight soil with a higher wet density, resulting in fewer deformations. The upper and lower geogrids may efficiently share the vertical pressure load and the bottom tensile load, thereby increasing the bearing capacity, even though the reinforced two-layer foamed lightweight soil with a wet density of 700 kg/m3 and 800 kg/m3 has a greater load. The addition of geogrids can enhance flexural characteristics and ductility while also considerably raising the peak load of foamed lightweight soils.
A linear elastic phase (OA), a hardening phase (AB), a softening–hardening cyclic phase (BC), and a failure phase (CD) comprise the typical load–displacement curve of GRFL soil (depicted in Figure 5), as follows:
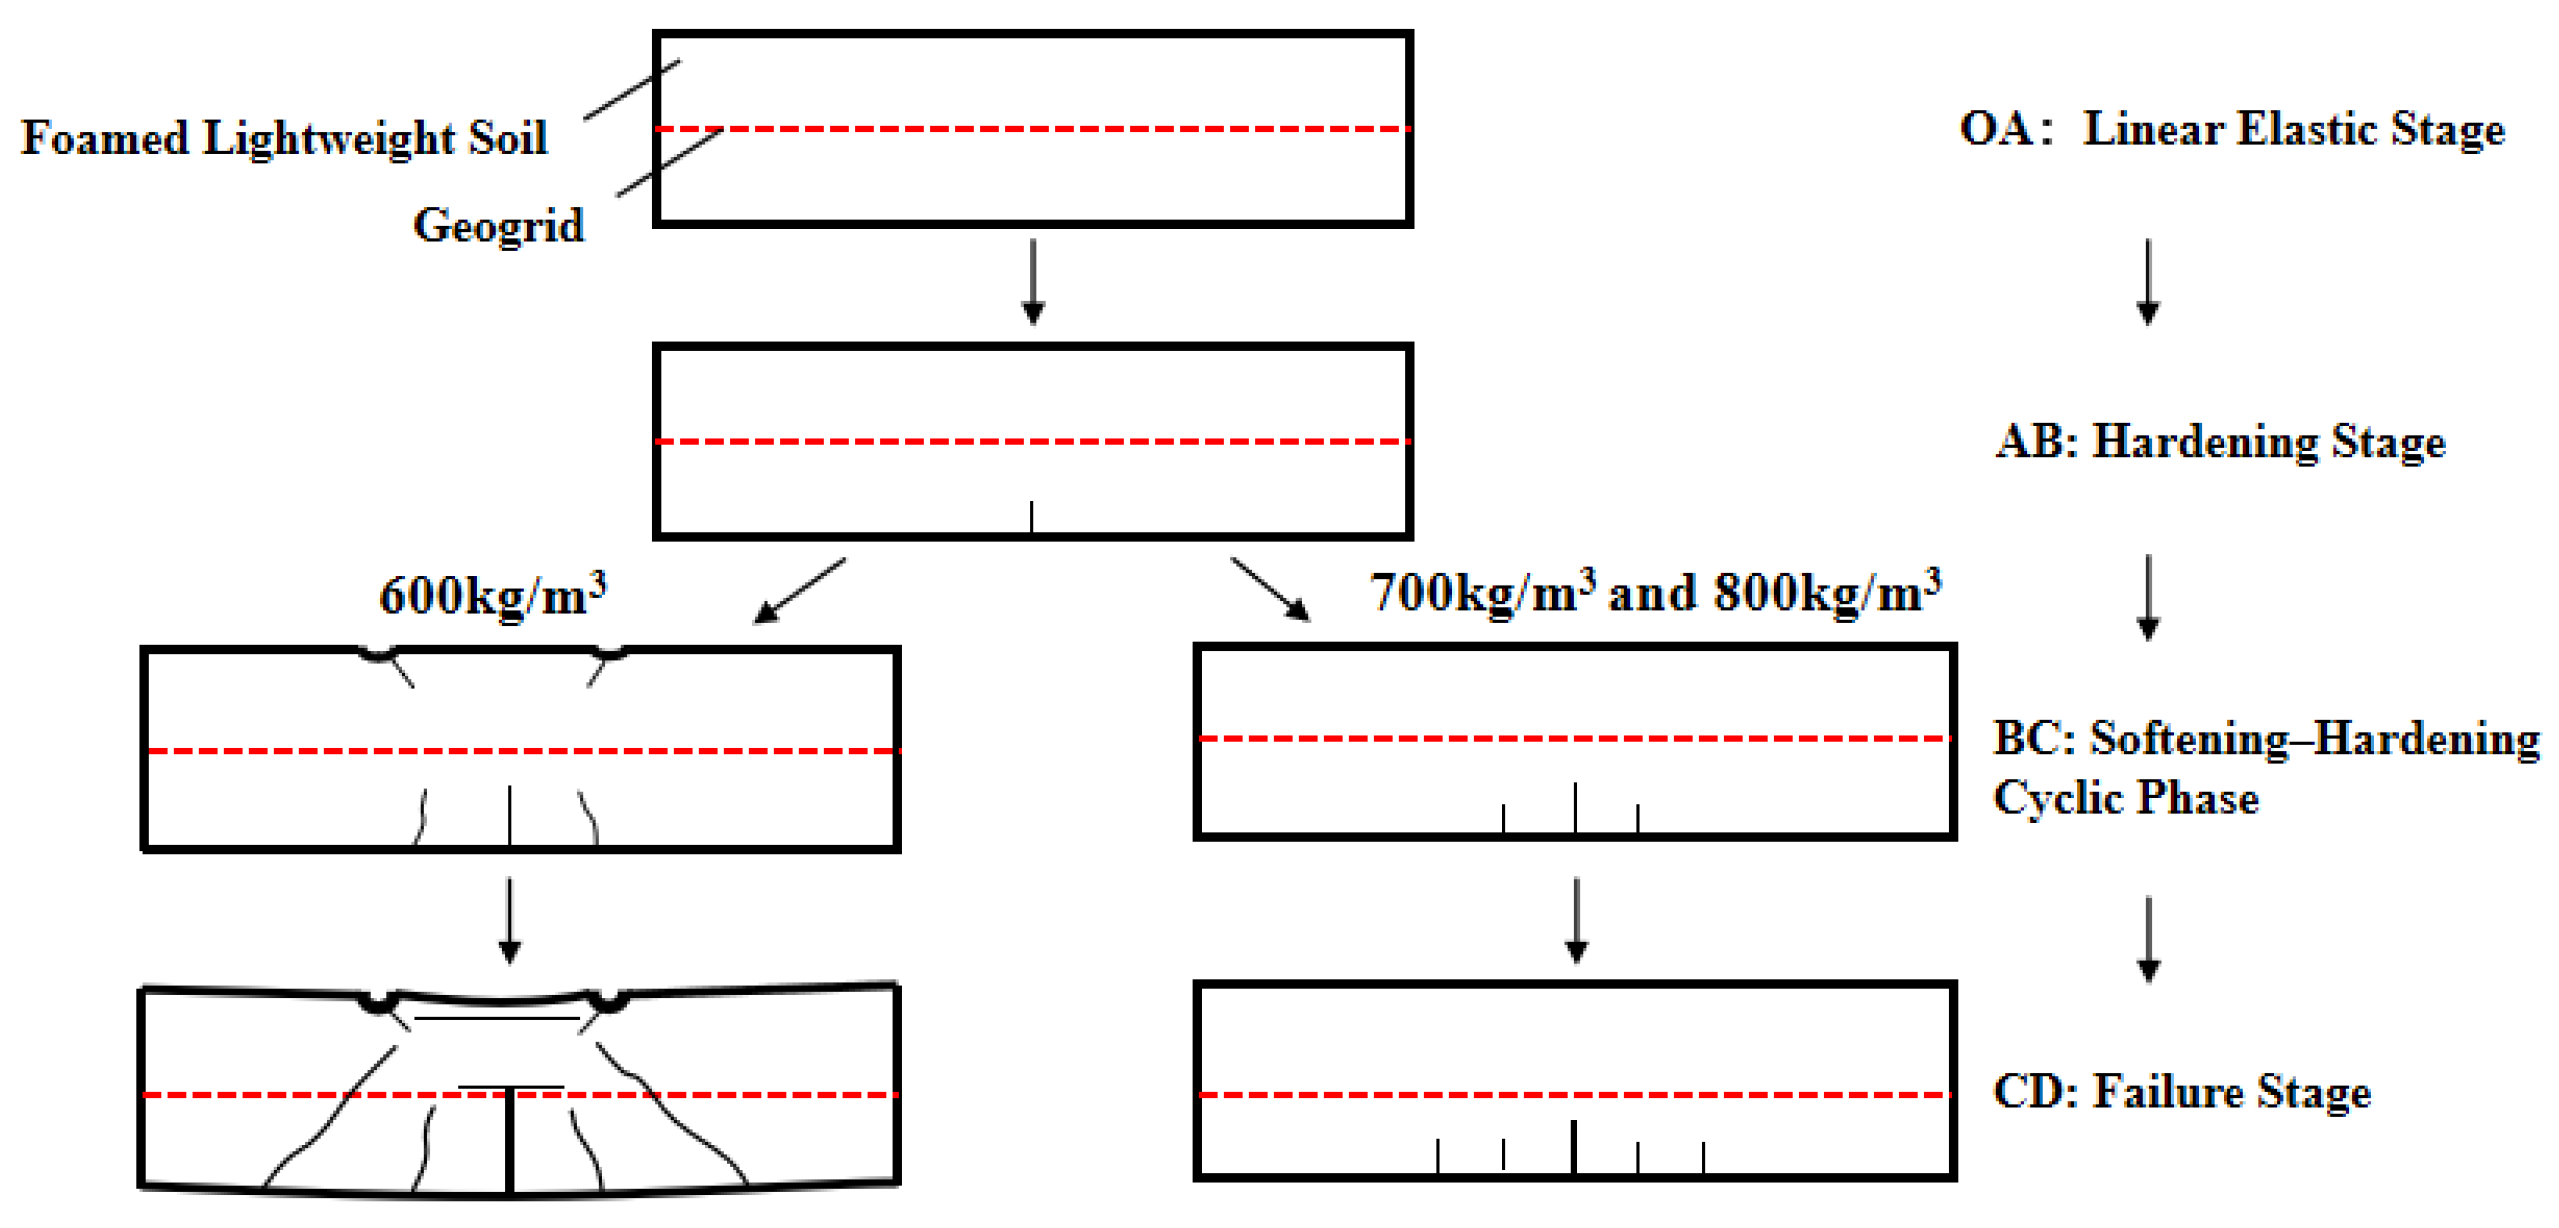
  • During the linear phase (OA), loads are low and grow linearly with displacement due to the cementite crystals between discrete pores bearing the load, which exhibit linear behavior.
  • The hardening phase (AB) is reached when the loads are slightly reduced relative to linearly increasing loads. The load–displacement curve shifts from linear to nonlinear, the internal self-structure’s microcracks start to develop new cracks, and the load continues to rise until it reaches the initial cracking load. The initial cracking load in this study is the load that corresponds to the first inflection point in the load–displacement curve’s rising portion.
  • The vertical load increases after a slight dip in the softening–hardening cycle phase (BC), which primarily affects foamed lightweight soils with wet densities of 600 kg/m3 and 700 kg/m3. The peak load is reached after multiple cycles, whereas the foamed lightweight soil with a wet density of 800 kg/m3 only goes through one cycle.
  • The specimen enters the failure phase (CD) after achieving the peak load. When the vertical load drops linearly, the foamed lightweight soil becomes incapable of withstanding the load, and the specimen is destroyed.
Figure 5. Typical load–displacement curves for GRFL soil.
Buildings 15 00461 g005

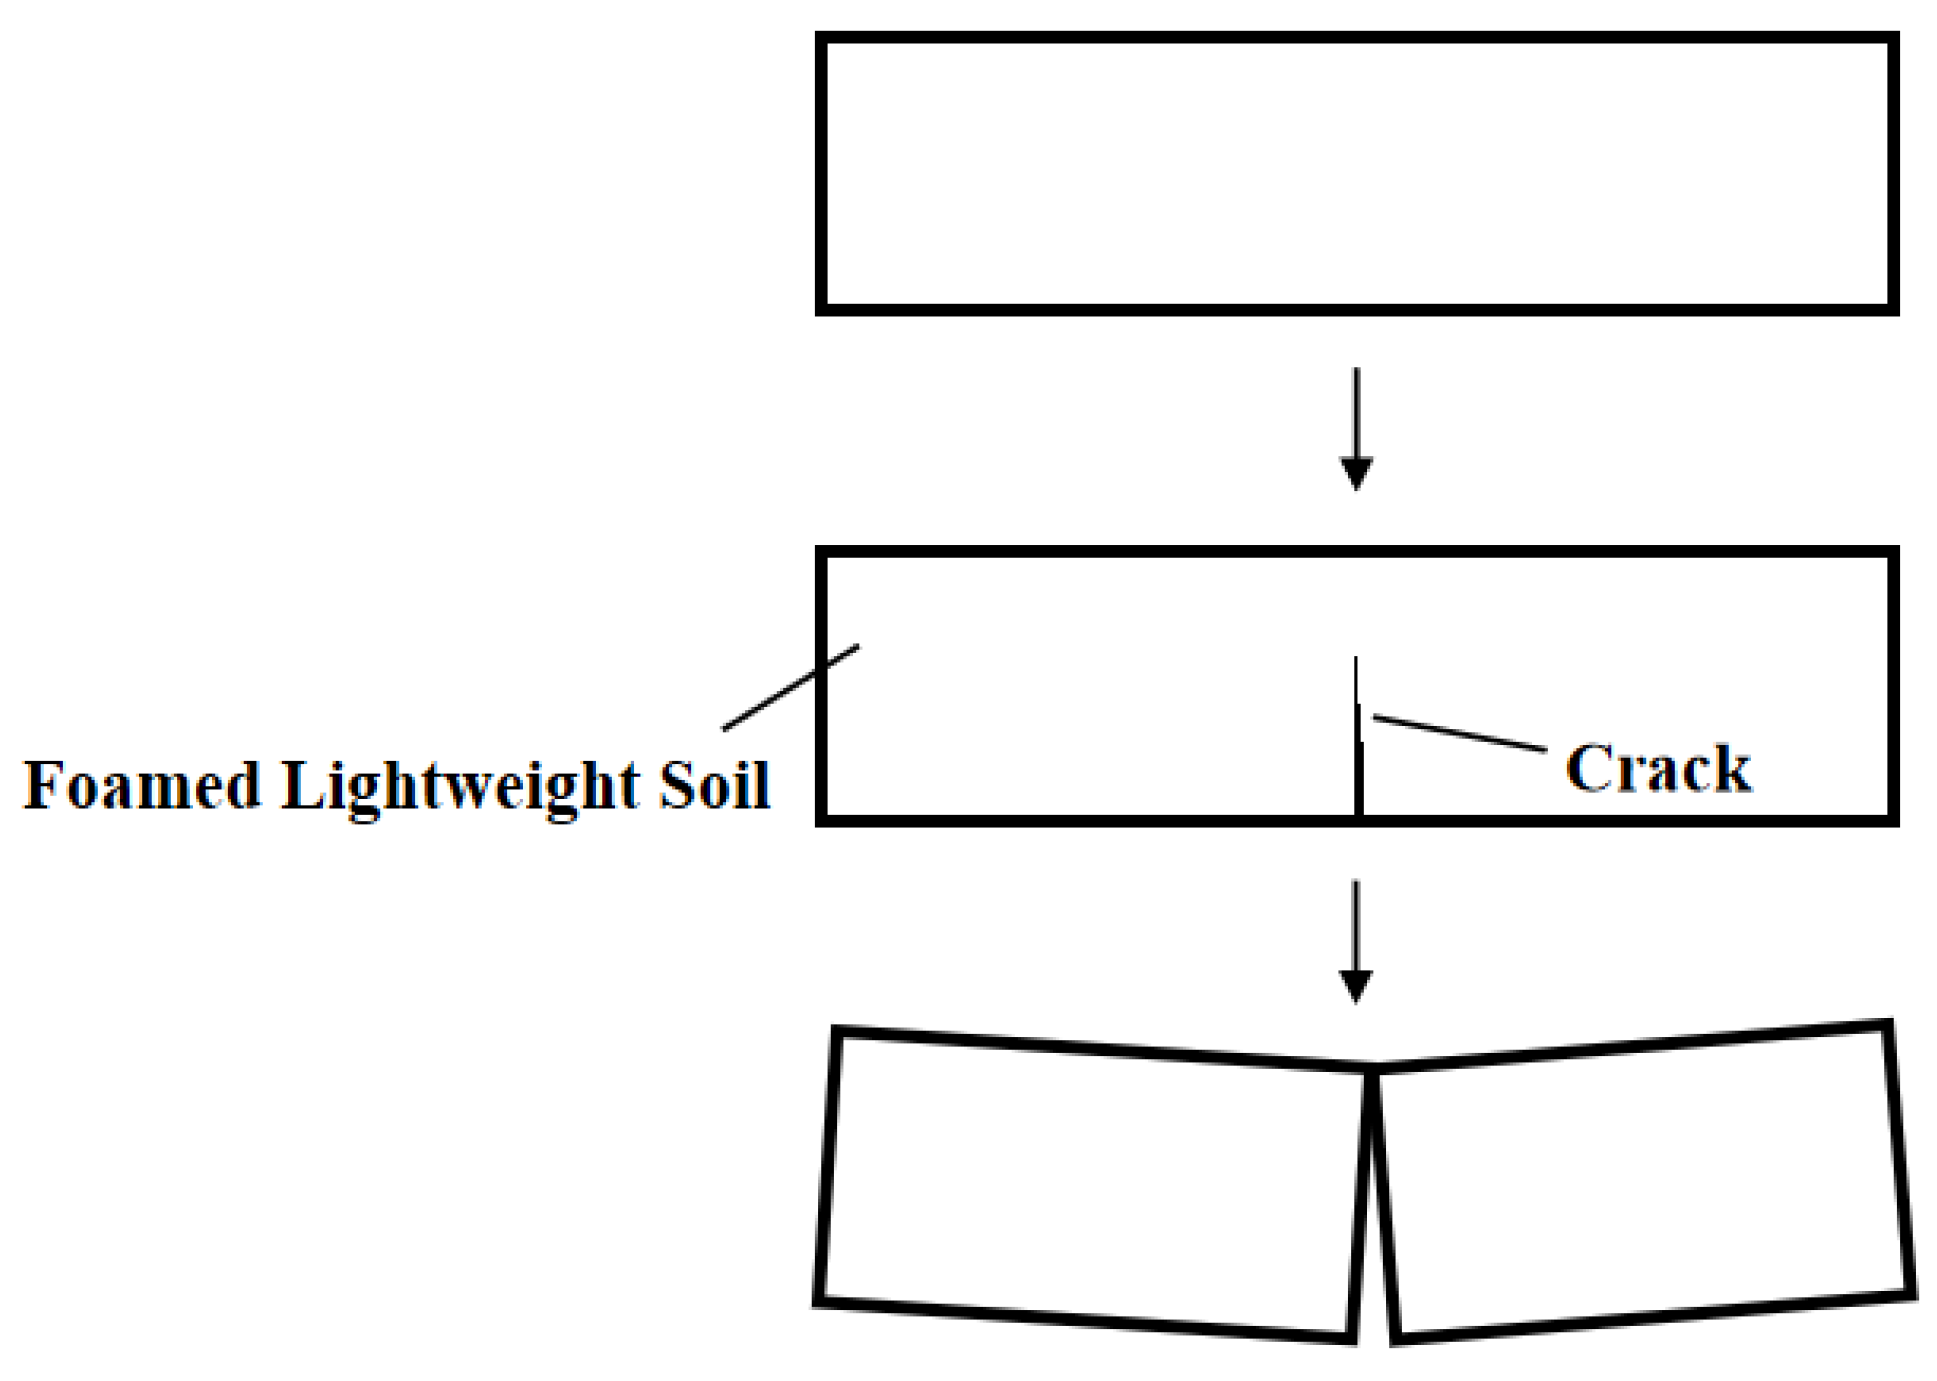
3.1.2. Damage Patterns

A schematic diagram of the typical destruction process of standard foamed lightweight soil is shown in Figure 6. This type of standard foamed lightweight soil experiences brittle destruction similar to that of cement concrete, with cracks spreading quickly from the bottom to the top surface and the specimen instantly breaking at the cross-sectional point of the maximum bending moment [32].
The foamed lightweight soil exhibited brittle destruction before the addition of the geogrid, but clearly exhibited elastic–plastic destruction after the addition of the geogrid. Figure 7 illustrates the usual process of GRFL soil damage using one layer of reinforcement as an example. In Figure 7, the geogrid is indicated by the red dashed line, and the foamed lightweight soil is indicated by the black solid line. The two main types of damage processes are a wet density of 600 kg/m3 and wet densities of 700 kg/m3 and 800 kg/m3. When combined with Figure 4, it can be seen that the damage process is further broken down into four stages: linear elastic (OA), hardening (AB), softening–hardening cycle (BC), and failure (CD). The foamed lightweight soil in the linear elastic phase (OA) retains its linear elastic behavior without cracking. As the load increases, the specimen moves into the hardening phase (AB), where cracks start to form at the bottom once the initial cracking load is reached. It then moves into the softening–hardening cycle phase (BC), where the width and number of cracks increase as the load increases. The displacement from the new cracks at the bottom also increases, which raises the load. As the load increases, the number of cracks also increases. The new cracks that form at the bottom cause displacement to increase, which causes a sudden drop in load and the sample exhibits transient brittle destruction characteristics. Meanwhile, the geogrid effectively prevents crack extension, allowing the load to increase. In a study on the three-dimensional modeling of foamed lightweight soil using X-CT scanning technology, Liu Jiemin et al. [33] discovered that as the wet density of foamed lightweight soil increased, the foam volume decreased, the amount of cement paste between the pores increased relatively, and the pore size distribution became more uniform. These findings demonstrate the strengthening of the bond between the foamed lightweight soil and the geogrid and the increase in its overall strength. The wet density of 600 kg/m3 foamed lightweight soil was low during the failure phase (CD), causing concave deformation and crack expansion on the top side of the compression zone, the geogrid surrounding the transverse shear crack, the separation of the bond between the geogrid and foamed lightweight soil, and, finally, specimen deformation and damage failure. With wet densities of 700 kg/m3 and 800 kg/m3, the foamed lightweight soil was stronger; only minor fractures emerged at the bottom, with very little deformation at the top of the compression zone. The width and quantity of fractures in the foamed lightweight soil were successfully decreased by the geogrid as the number of reinforced layers increased. When two layers of reinforcement were used, the lower geogrid bore the tensile load, lessening the formation of cracks at the bottom and increasing the structural load-bearing capacity. The upper geogrid shared the vertical pressure load, resulting in only a slight concave deformation at the top of the foamed lightweight soil. The three-layer reinforcement successfully prevented cracks from forming at the top while controlling the formation of cracks at the bottom, particularly in foamed lightweight soil with a high wet density.
Figure 8 displays the force schematic of the specimen at one layer of reinforcement. The solid line shows the specimen’s shape before force deformation, and the dotted line shows the specimen’s shape following deformation. The specimen developed cracks as a result of the tensile stress created at the foamed lightweight soil’s bottom after the load was applied. The geogrid successfully stops the bottom of the cracks in the foamed lightweight soil from extending upward. Transferring a portion of the load to the surrounding foamed lightweight soil through mechanical bite and bonding force also improves the synergy between the two [23]. The geogrid and the foamed lightweight soil deform when the load surpasses a certain threshold because the bond between the two materials cannot sustain the principal stress at the specimen’s bottom. The binding force of the foamed lightweight soil on the geogrid and the tensile stress of the geogrid also gradually deteriorate, which lowers the resistance to loading and deformation [19]. The formation of the crack path illustrates this stress transmission mechanism.

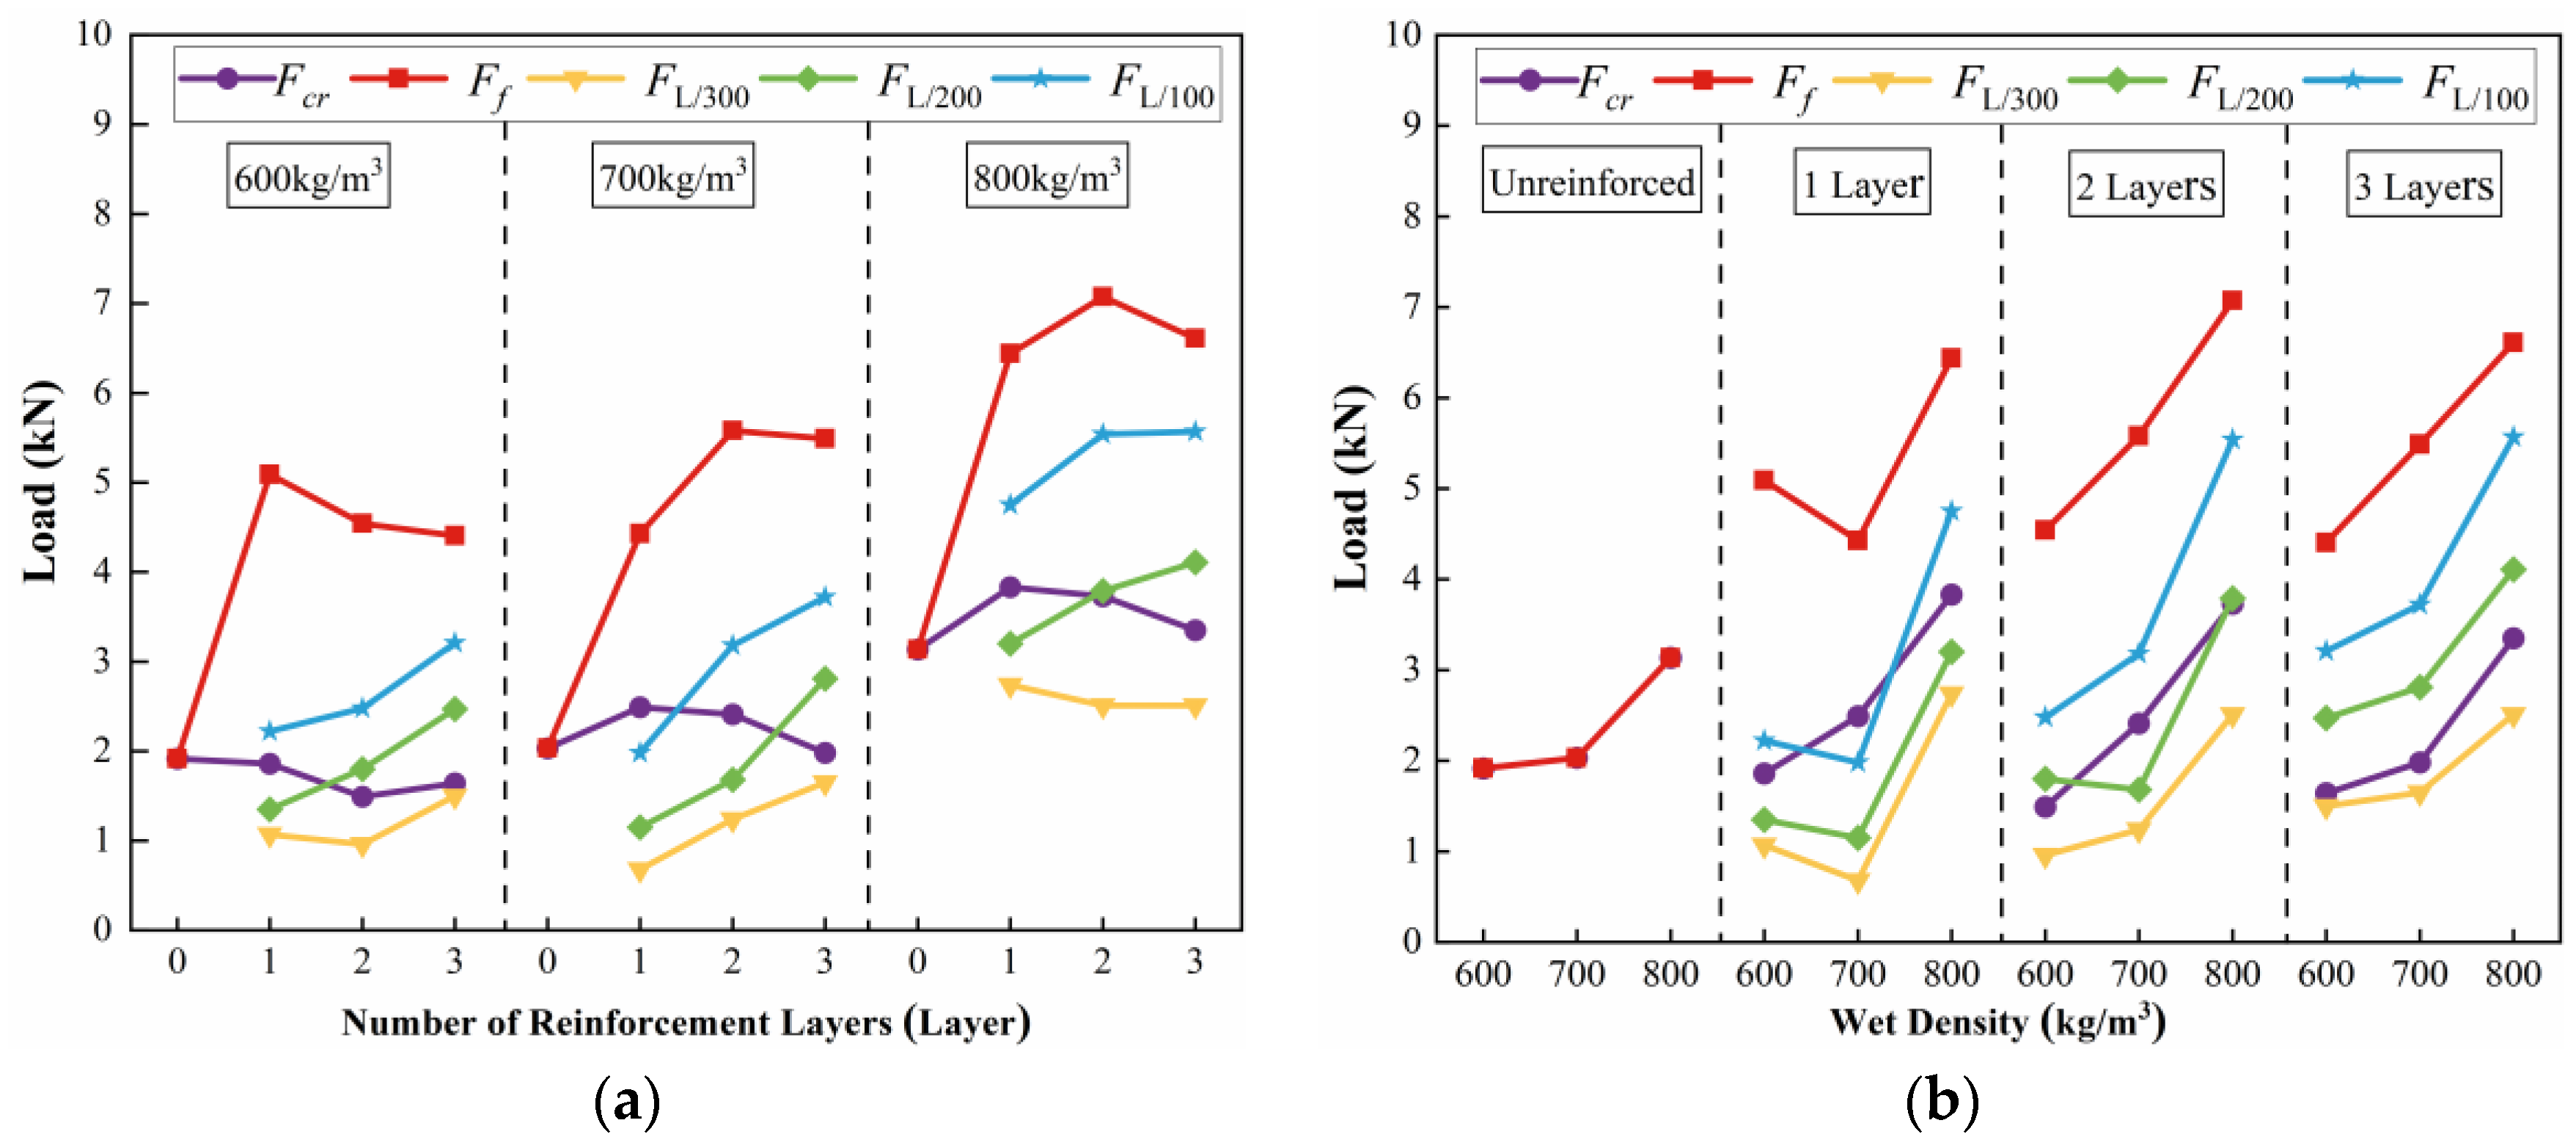
3.1.3. Characteristics of Load Changes at Different Stages

The initial cracking load Fcr and peak load Ff are the vertical loads of the GRFL soil, and the related displacements are initial cracking displacement δcr and peak displacement δf. These are shown in conjunction with Figure 5. The various stages of load changes were analyzed by using a simplified four-point bending test and the various stages of the load changes of the GRFL soil were characterized with reference to the specification ASTM C1609/C1609M-24 [34]. This paper defines three types of loads, FL/300, FL/150, and FL/100, which correspond to displacements of 1 mm, 2 mm, and 3 mm, respectively, and occur in the initial peak loads, which are defined as intensified loads in this paper. To make analysis easier, the loads FL/300, FL/150, and FL/100, as well as initial cracking loads Fcr, are designated as pre-intermediate loads, and the peak load Ff is defined as the late load.
The computational analysis indicates that the ratio between the initial cracking load Fcr of the GRFL soil and the peak load Ff of unreinforced foamed lightweight soil is between 0.8 and 1.17. The initial cracking load in Figure 9a does not change significantly as the number of reinforced layers increases under the same wet density condition. Looking at Figure 4, the thickness of the bottom protective layer reduces as the number of reinforced layers grows, which lowers the load in the load–displacement curve of the softening phase (BC). All of this suggests that the initial cracking load is mostly borne by the foamed lightweight soil itself. Figure 9 illustrates how the number of reinforced layers and wet density both enhance the overall reinforcement load, while the addition of the geogrid and the rise in wet density work together to improve the center and middle load of the foamed lightweight soil. Due to the brittle destruction of standard foamed lightweight soil, the initial fracture load and the peak load are equal. The late load-bearing capacity of the foamed lightweight soil is significantly boosted since its peak load is significantly greater than both the original crack load and the reinforcing load.
Figure 4 and Figure 9b demonstrate that the overall stiffness of the foamed lightweight soil improved when the wet density increased, resulting in a decrease in the displacements needed to reach the initial cracking stress and the peak load [35]. Overall, the pattern of increases in the initial cracking load, peak load, and reinforcing load as the foamed lightweight soil’s wet density increases supports the idea that wet density plays a significant role in boosting the foamed lightweight soil’s ability to support vertical loads.

3.2. Strength Characteristics of GRFL Soil

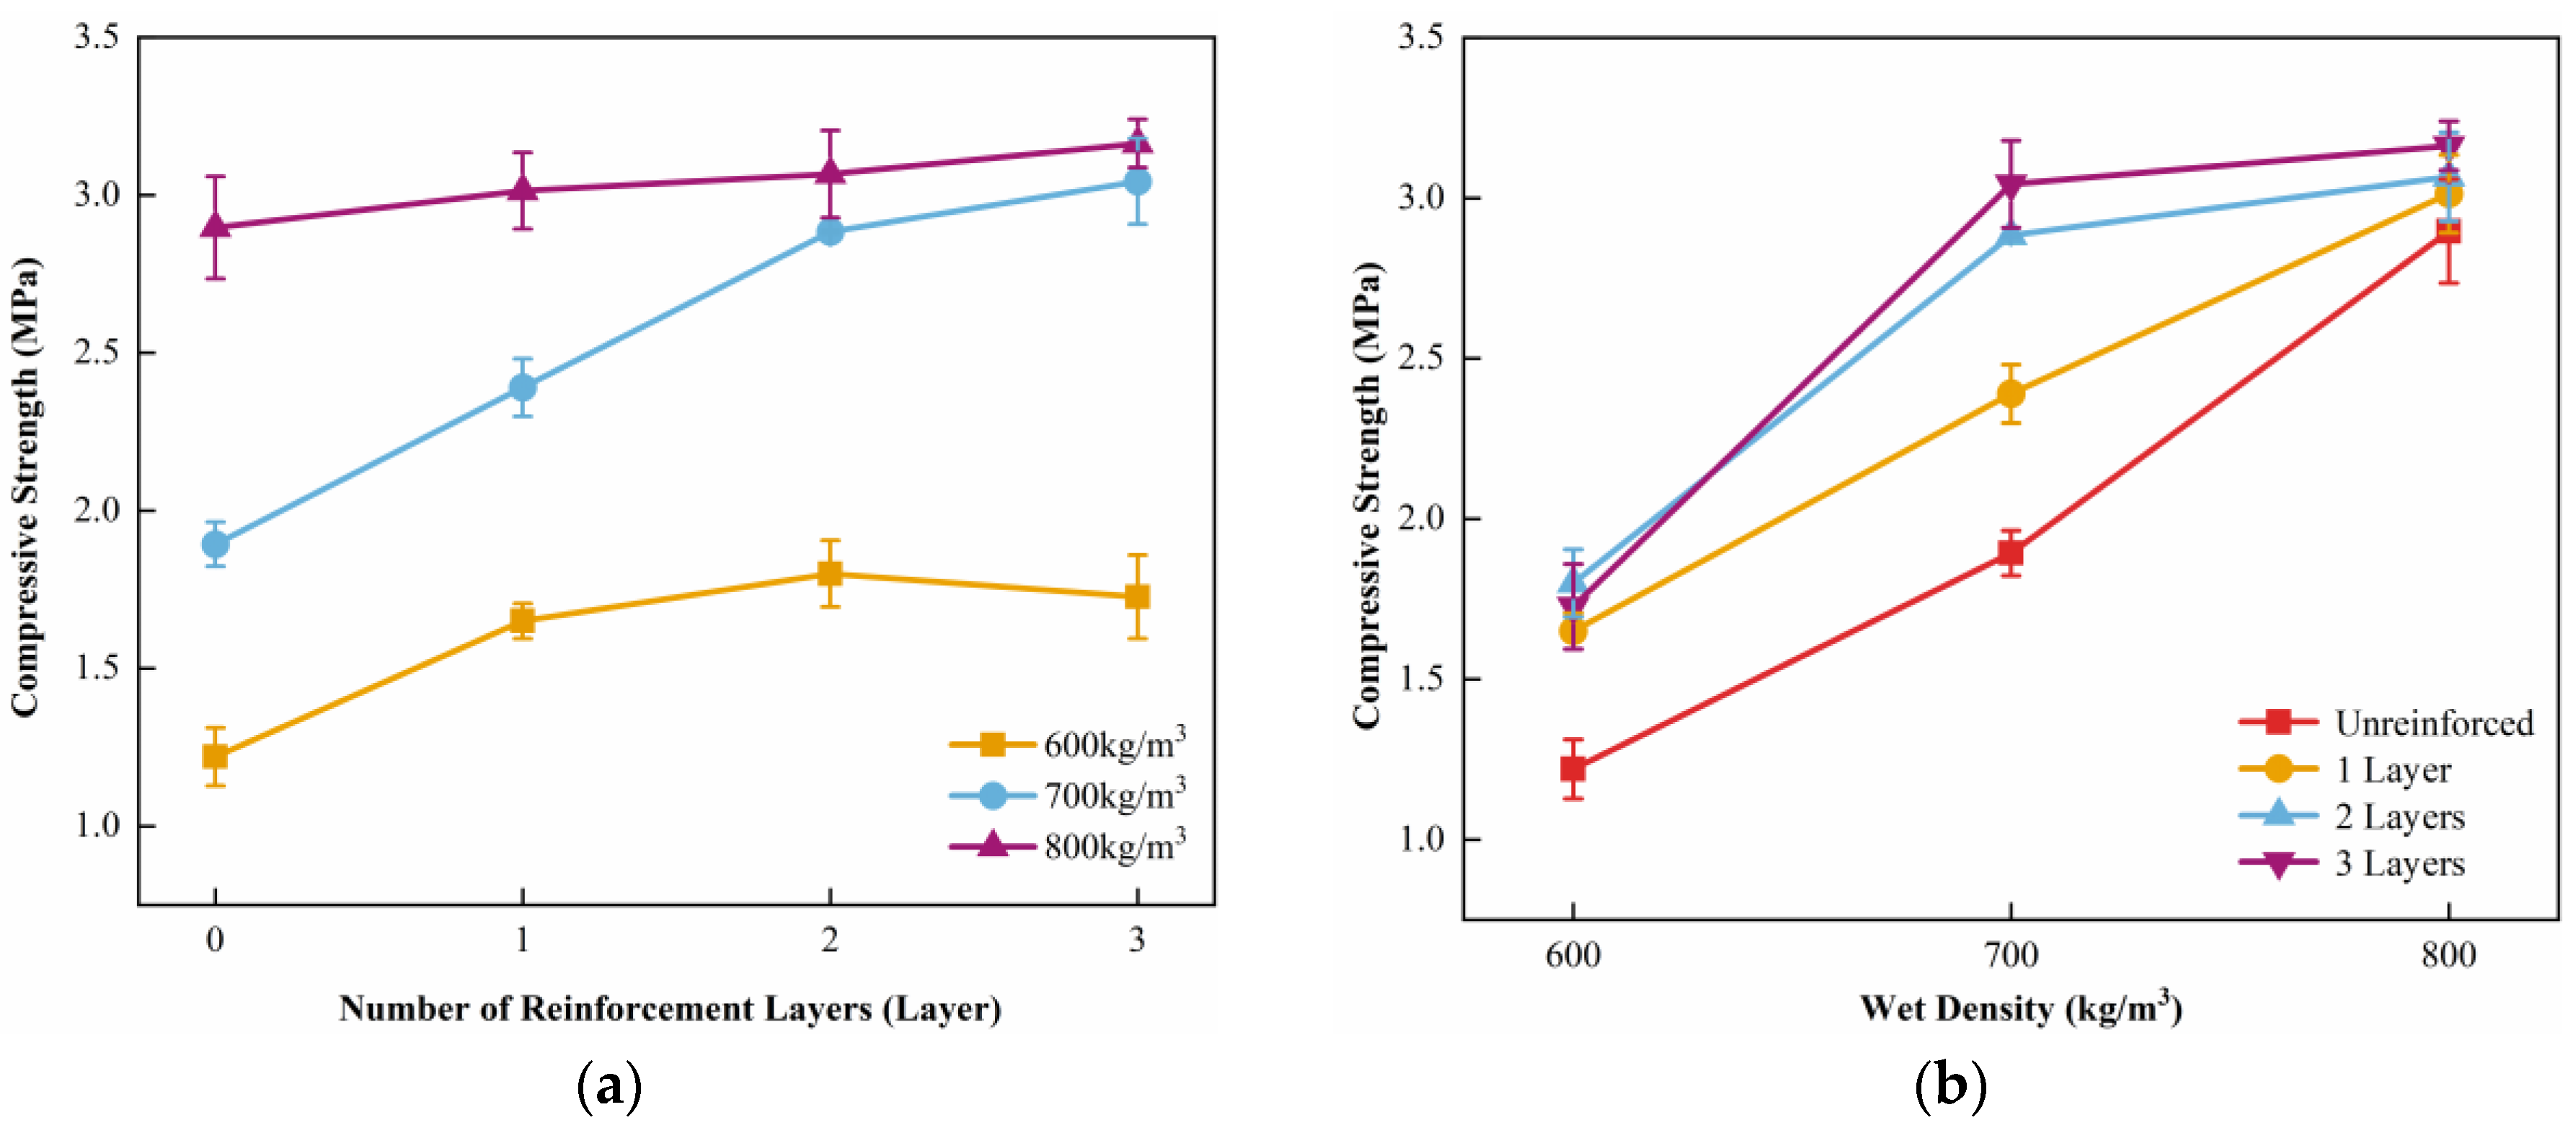
3.2.1. Unconfined Compressive Strength

According to Figure 10a, the compressive strength of various wet-density GRFL soils rises as the number of reinforced layers increases. This is particularly true when the wet density is 700 kg/m3, where the compressive strength growth is most pronounced. Using the interface constraint effect, geogrids can effectively improve the initial brittle destruction characteristics of unreinforced foamed lightweight soil by limiting the foamed lightweight soil’s lateral deformation and preventing crack propagation. This delays the failure process and increases the material’s compressive strength. The compressive strength gradually increased as the number of reinforced layers increased after the geogrid was added. For foamed lightweight soil with a wet density of 600 kg/m3, the compressive strength of three layers of reinforcement seemed to slightly decrease when compared to two layers. The overall stability of the foamed lightweight soil was impacted because of the inability to adequately integrate the reinforced layers due to their low strength and excessive number. Additionally, Figure 10b demonstrates that the compressive strength of the GRFL soil rises as the wet density increases. This suggests that the strength of the foamed lightweight soil itself has a significant impact on the compressive strength of GRFL soil.
Multivariate nonlinear fitting was used to determine the relationship between the foamed lightweight soil with wet density and the number of reinforced layers and unconfined compressive strength, as in Equation (1).
f c c = 2.924 + 0.211 X + 0.00716 ρ
where fcc is the unconfined compressive strength of the specimen; X is the number of reinforced layers (X = 0, 1, 2, 3); and r is the wet density (600 ≤ y ≤ 800).
The sum of the squares of the distances between the points identified by nonlinear regression and the best-fit curve was used to compute R2. R2 is a metric used to quantify how well a regression model fits the data; the closer the model is to 1, the better. The fitting result is good, and the R2 is 0.87. Table 3 displays the comparison between the measured and fitted values.

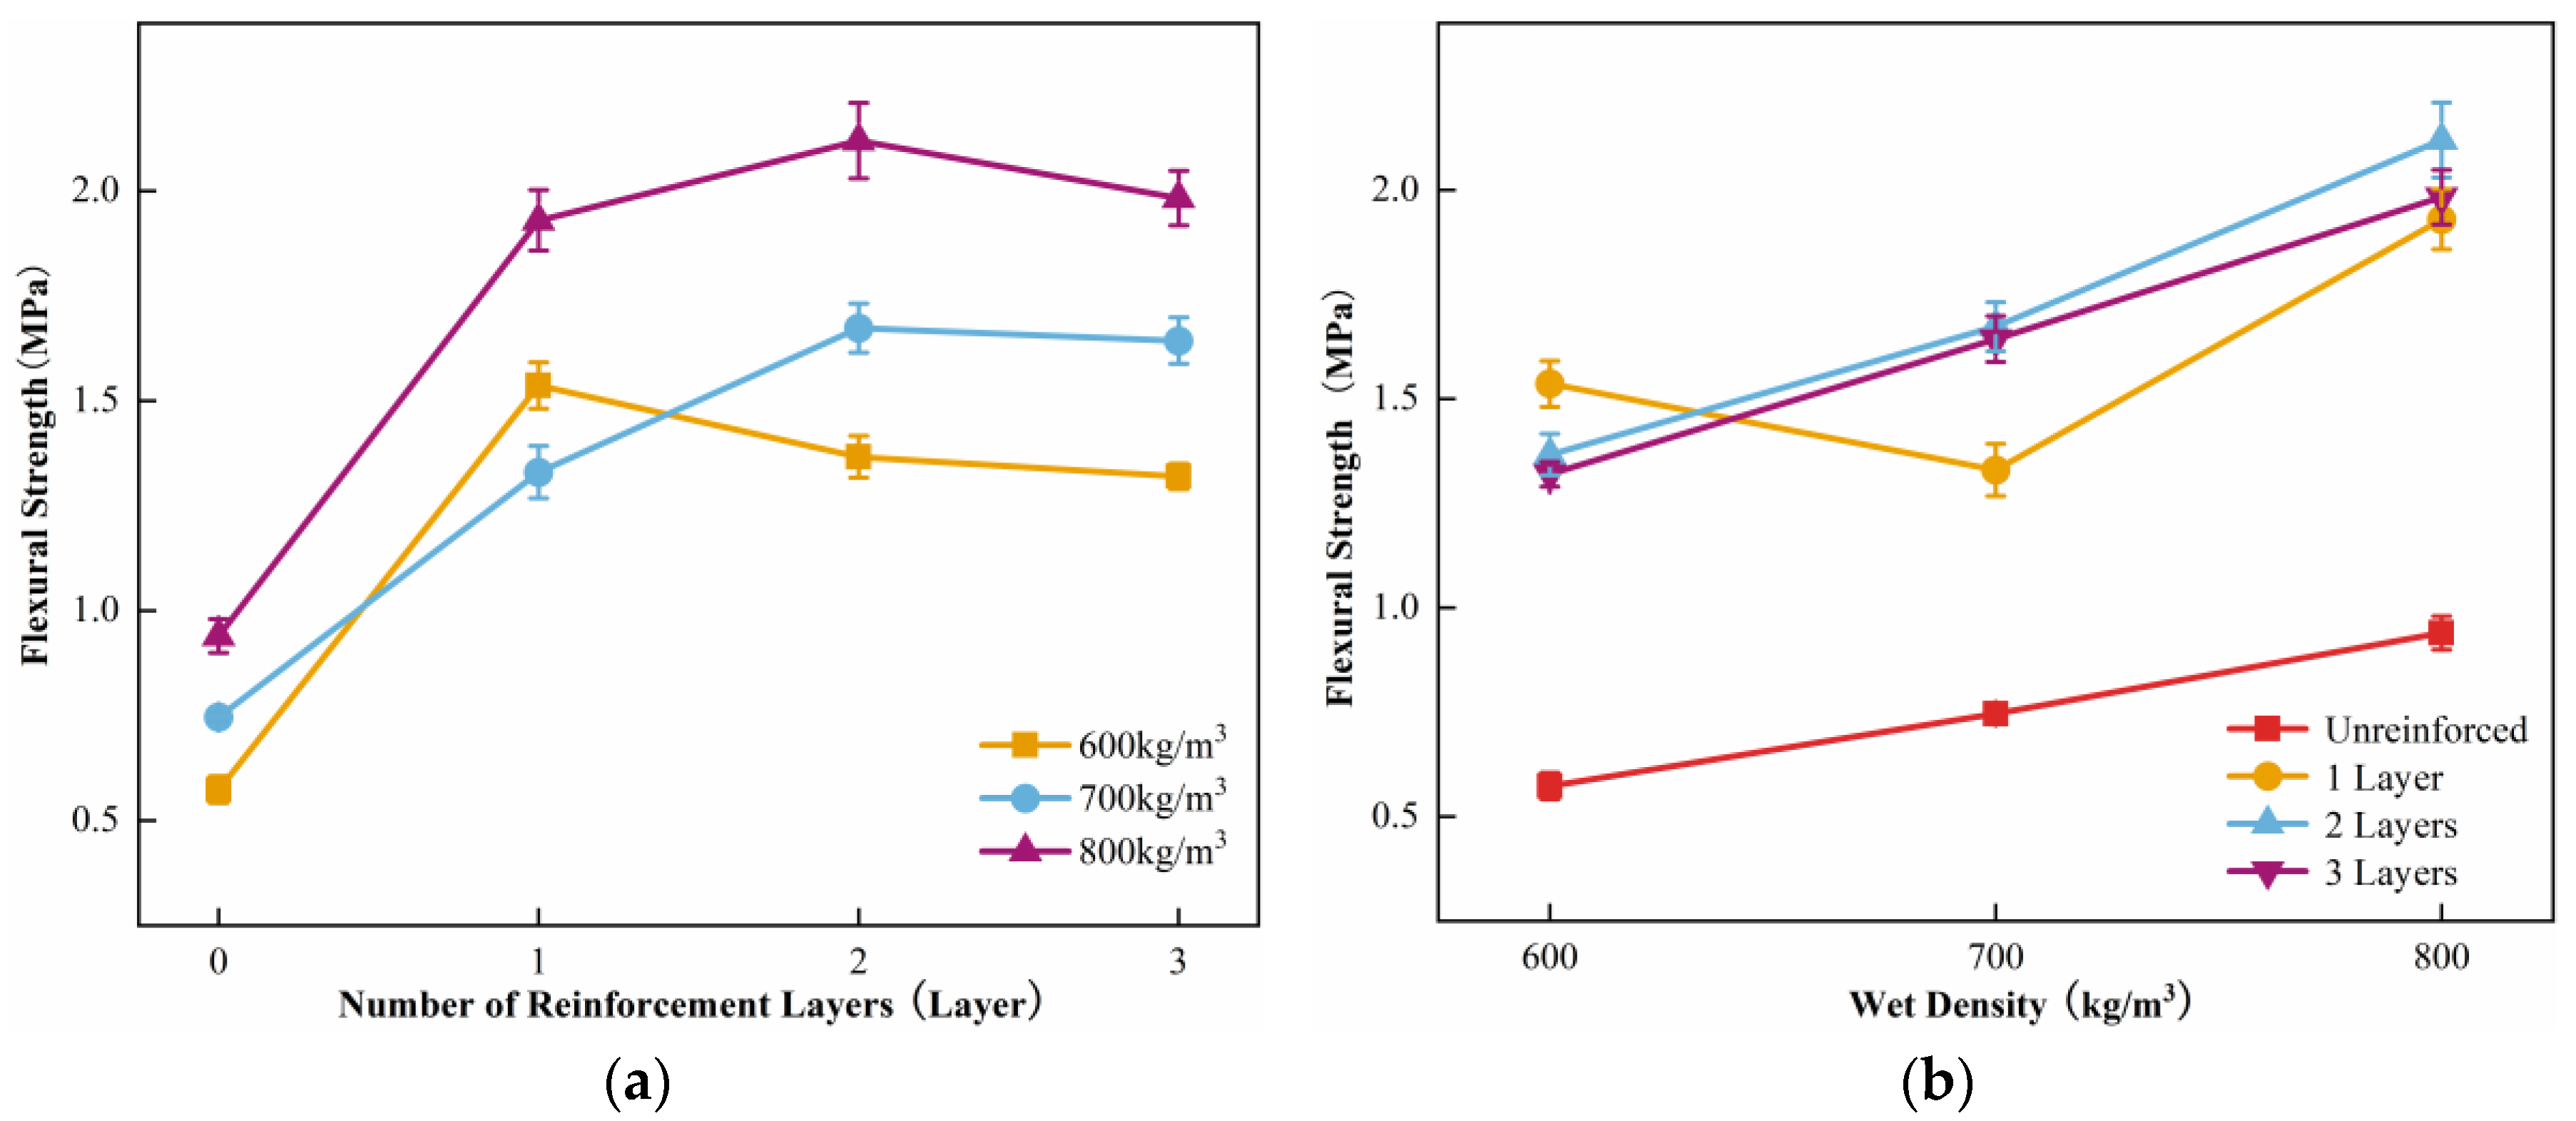
3.2.2. Flexural Strength

The flexural strength of the GRFL soil specimens was calculated using Equation (2).
f f = F L b h 2
where ff is the flexural strength of the specimen; F is the peak load; b is the width of the specimen, 100 mm; h is the height of the specimen, 100 mm; and L is the spacing of the support, 300 mm.
The flexural strength of the foamed lightweight soil is greatly increased by the inclusion of the geogrid, as seen in Figure 11a. The maximum increase in flexural strength for foamed lightweight soil with a wet density of 600 kg/m3 can be obtained with one layer of reinforcement. This is primarily because the foamed lightweight soil has a large thickness at the bottom and a low strength of its own. When a large load is applied, the top compression zone is depressed and the bottom tensile zone produces more cracks, which increases the load-carrying capacity by creating larger displacements. Unfortunately, as the number of reinforced layers increases, the flexural strength diminishes because of the insufficient bonding force and the decrease in the thickness of the foamed lightweight soil at the bottom. Because the two layers of reinforcement can efficiently share the vertical load in both compression and tension zones, the flexural strength of the foamed lightweight soil with wet densities of 700 kg/m3 and 800 kg/m3 improved the maximum when reinforced with two layers. As illustrated in Figure 11b, the flexural strength rises along with wet density. For foamed lightweight soil with a wet density of 600 kg/m3, despite its own low strength, the application of one layer of reinforcement results in a significant increase in flexural strength due to the increase in vertical displacement caused by the deformation of the foamed lightweight soil and the geogrid.

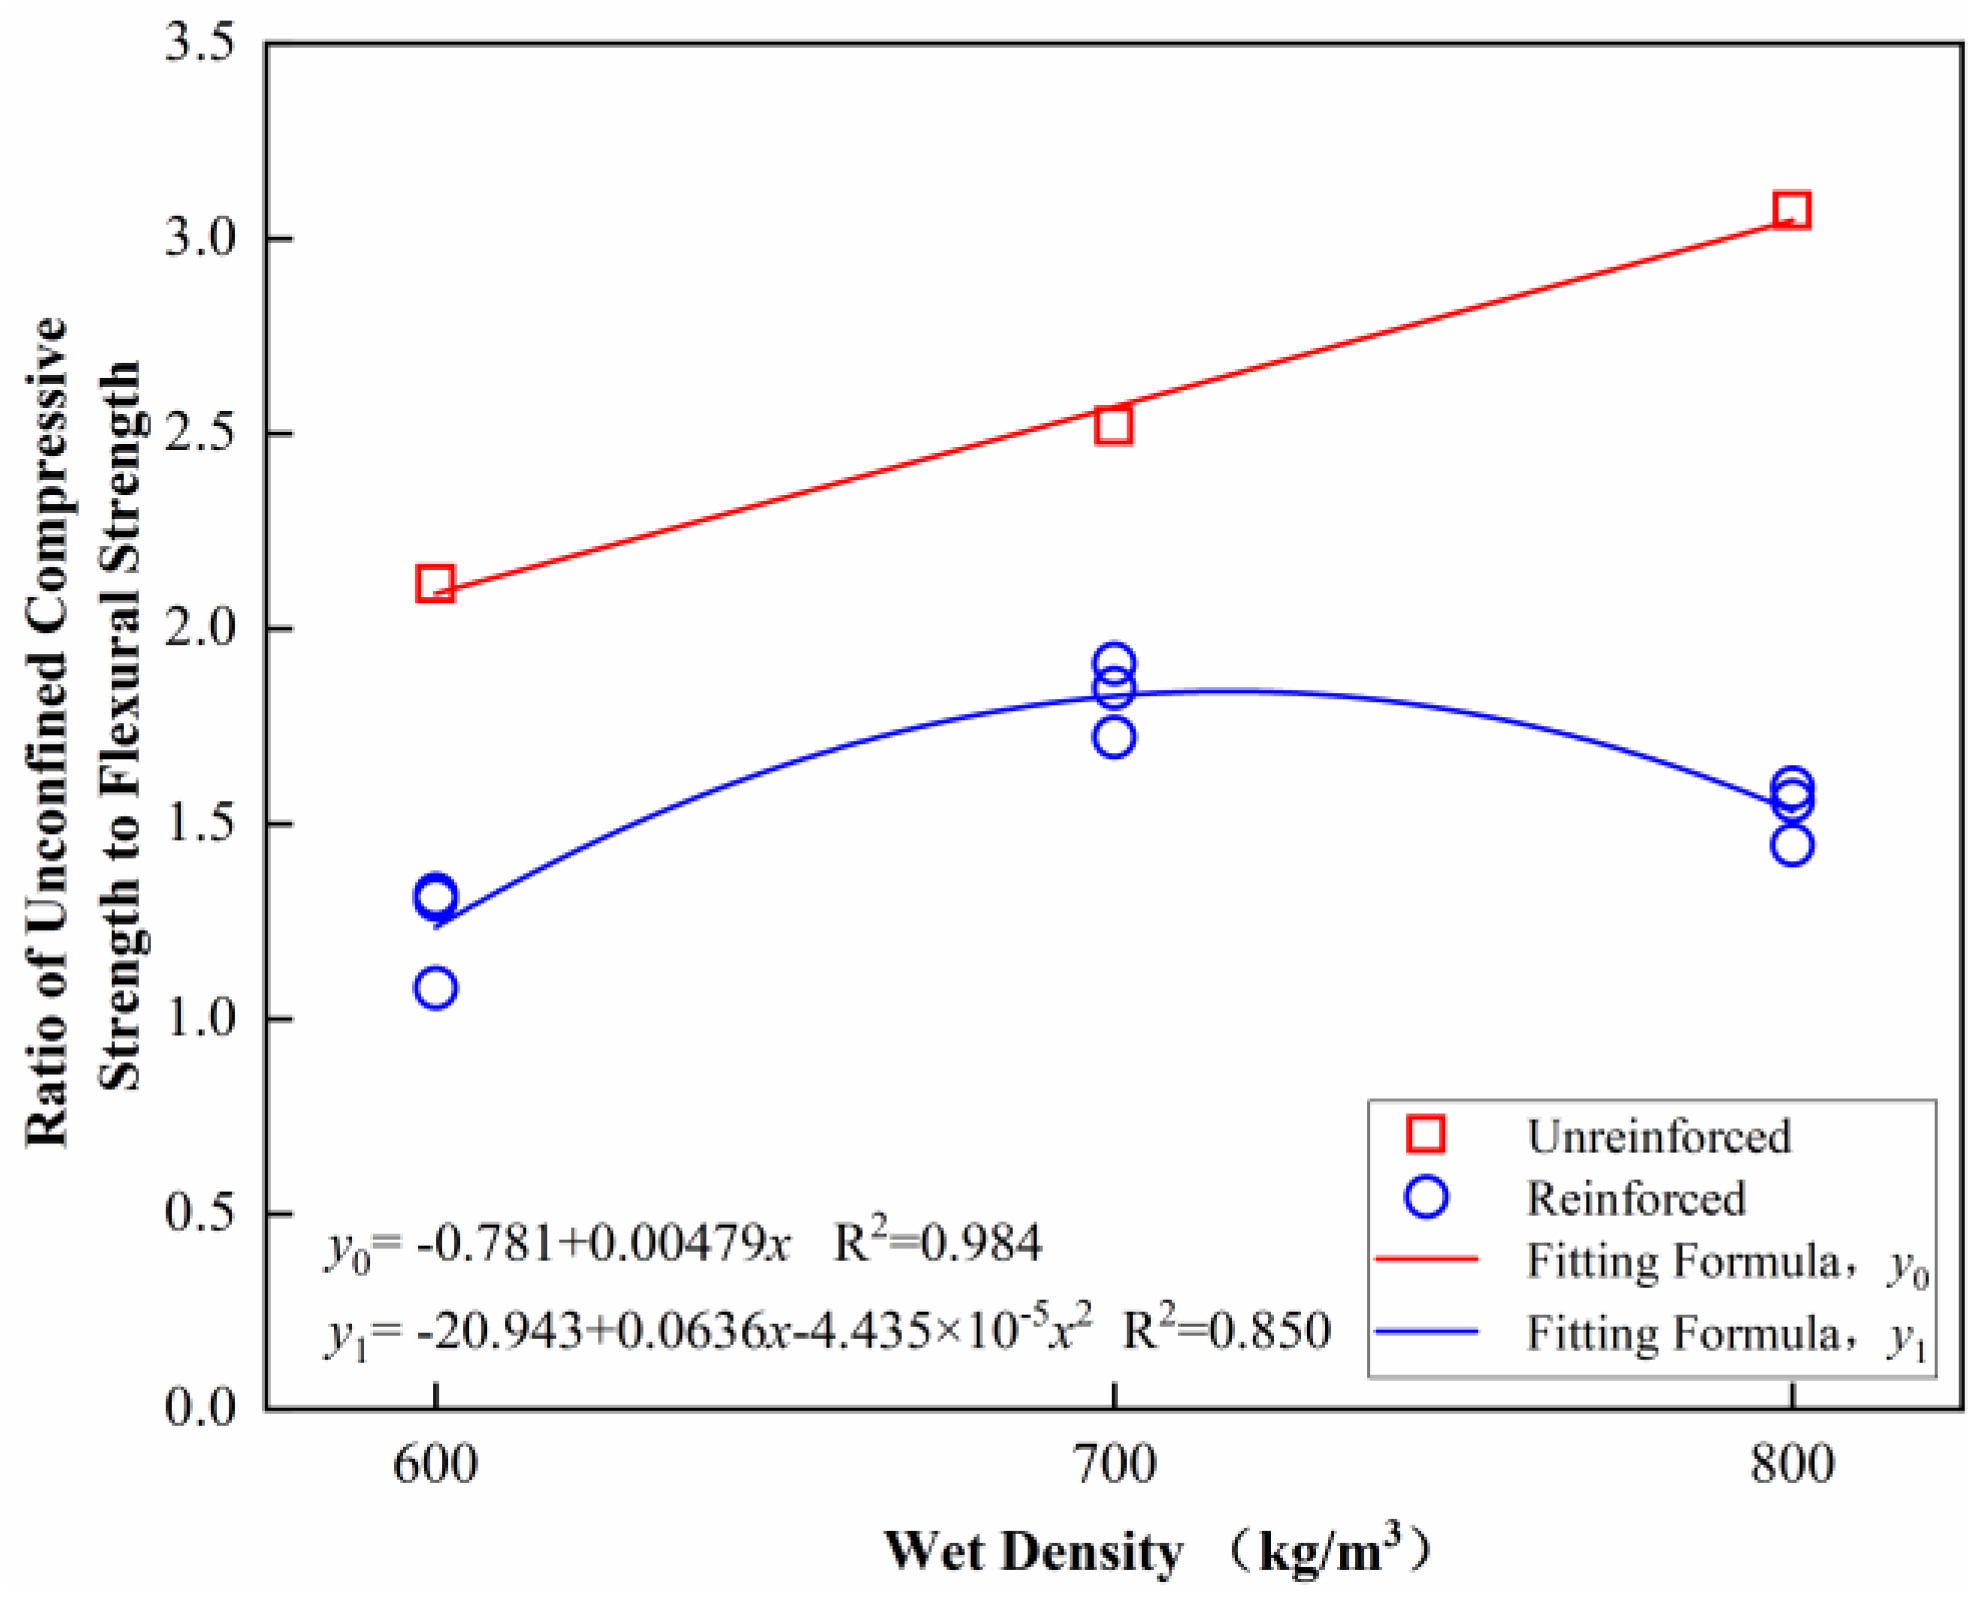
3.2.3. Relationship Between Unconfined Compressive Strength and Flexural Strength

Using the ratio of unconfined compressive strength and flexural strength as the vertical coordinate and wet density as the horizontal coordinate, a linear fit was used for unreinforced foamed lightweight soil and a polynomial fit was used for reinforced foamed lightweight soil. The fitting model was Equation (3).
y = a + b x + c x 2 ,
where x is the wet density, y is the ratio of unconfined compressive strength and flexural strength, and a, b, and c are parameters; refer to the formulae in Figure 12. For parameters a and b, the least squares approach produced the linear model of unreinforced foamed lightweight soil, while for parameters a, b, and c, the nonlinear least squares method produced the nonlinear model of the GRFL soil.
Figure 12 illustrates the fitting effect. In the 600–800 kg/m3 range of wet density, the ratio of unconfined compressive strength to flexural strength of standard foamed lightweight soil rises linearly as the wet density increases, whereas the ratio of GRFL soil rises initially and then falls as the wet density increases. The toughness of the unreinforced and reinforced foamed lightweight soil with a wet density of 600 kg/m3 is better when the ratio of unconfined compressive strength to flexural strength is smaller [36].
By choosing the right wet density and number of reinforced layers, road engineers can create GRFL soil, which can greatly increase the subgrade’s strength and toughness, boosting its bearing capacity, decreasing uneven settlement, improving overall stability, extending its lifespan, and providing economic advantages, among other advantages [37]. It can be used for abutment backfill, and different wet densities and numbers of reinforced layers are chosen based on the types of bridges and traffic loads to effectively lower costs. It can also effectively reduce post-work settlement and uneven settlement brought on by vehicle dynamic loads. Increased durability and driving comfort are achieved by reducing the thrust of the backfill towards the abutment [11,38]. Road salvage, soft foundation treatment, local subgrade restoration, the manufacture of lightweight reinforced blocks and reinforced prefabricated panels, energy conservation, and carbon reduction are just a few of its many potential uses [39,40,41,42].

3.3. Analysis of Variance

Finding the variables that significantly impact the mechanical indicators is the aim of the analysis of variance. The table below shows the crucial value of significance F1–0.05(2,9) = 4.26 in an analysis of variance with a confidence level of α = 0.05. The degree of importance is discriminated as indicated in Table 4 and the value of F1–0.05(2,9) is used to assess the significance of each factor’s influence when the confidence level is α = 0.05.
Using SPSS software (v26) for statistical data analysis [43], the unconfined compressive strength and flexural strength of the GRFL soils were analyzed for variance. The computations’ outcomes are displayed in Table 5. The unconfined compressive strength and flexural strength of the GRFL soil are significantly influenced by wet density and the number of reinforced layers. Wet density contributes more to unconfined compressive strength than the number of reinforced layers, with values of 89.41% and 10.59%, respectively, and the number of reinforced layers contributes more to flexural strength than wet density, with values of 33.84% and 66.16%, respectively. As a result, increasing the foamed lightweight soil’s wet density improved its compressive strength, whereas reinforcement improved its flexural strength.

4. Conclusions and Future Work

The flexural properties of GRFL soil were investigated in this study by analyzing the load–displacement curves, damage patterns, characteristics of load changes at different stages, unconfined compressive strength, and flexural strength. This was accomplished by combining a geogrid with foamed lightweight soil and conducting unconfined compressive strength tests and four-point bending tests. The primary findings were as follows:
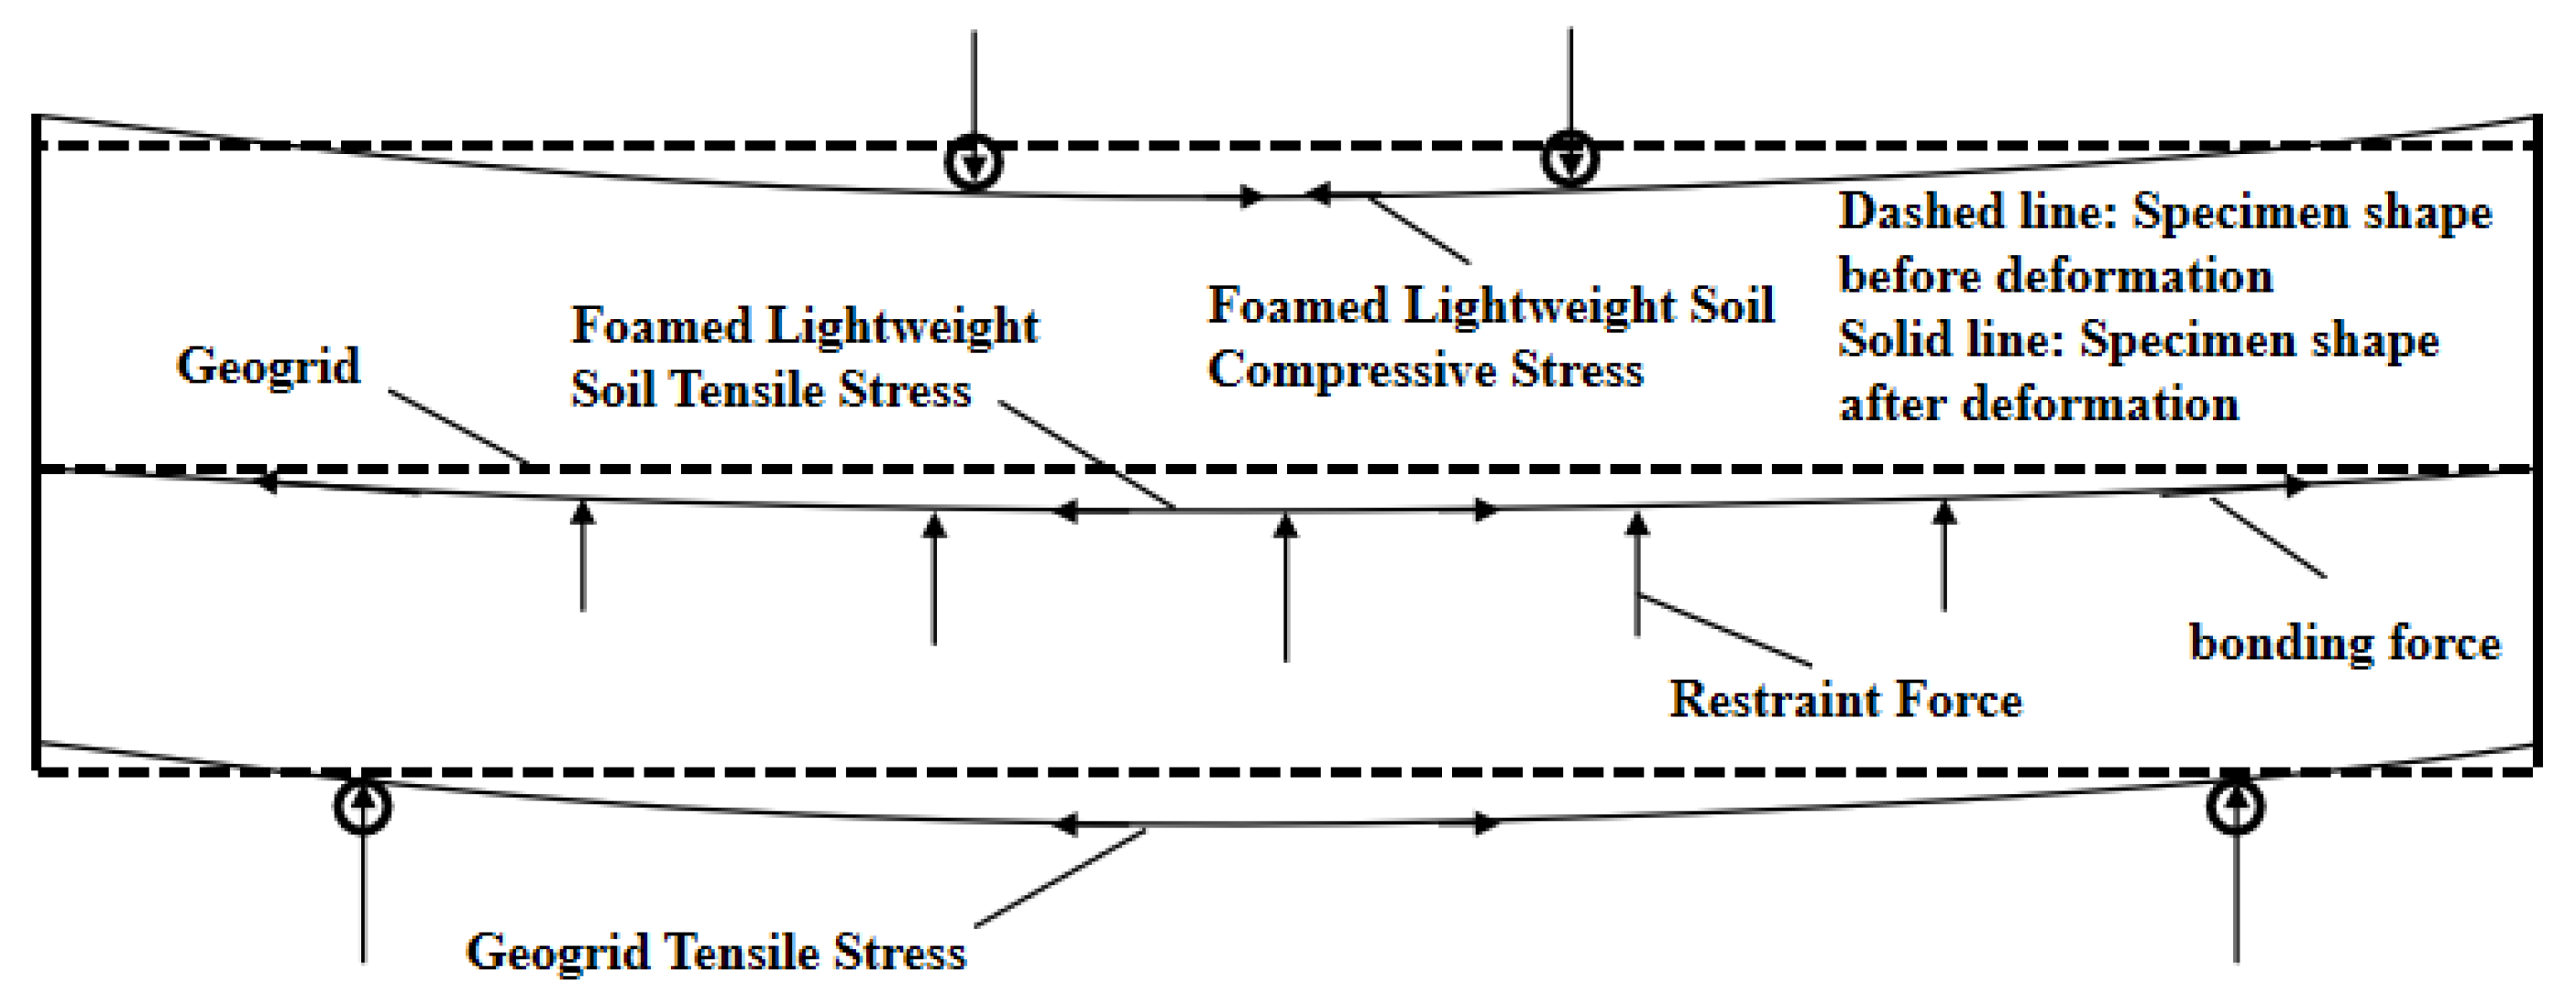
  • In order to properly avoid deflection, the geogrid is placed vertically at a predetermined location inside the test mold that is filled with a foamed lightweight soil slurry. GRFL soil’s load–displacement curve complies with the elastic–plastic deformation characteristics, which are separated into linear elastic, hardening, softening–hardening cyclic, and failure phases. After first breaking, the load continues to increase, consequently increasing the material’s ductility.
  • When the wet density of the GRFL soil is 600 kg/m3, bond failure destruction usually occurs; however, when the wet densities are 700 kg/m3 and 800 kg/m3, the damage pattern is less noticeable and the stability is improved.
  • The foamed lightweight soil itself bears the majority of the load in the early loading stage, while the geogrid bears the majority of the load in the late loading stage. The two share the load through cooperative action.
  • The unconfined compressive strength and flexural strength of the foamed lightweight soil were considerably increased by the addition of the geogrid. A multiple nonlinear regression equation was used to create a prediction model for unconfined compressive strength based on the wet density and the number of reinforced layers. Wet density and the ratio of unconfined compressive strength to flexural strength were shown to be positively correlated.
  • An analysis of variance revealed that the number of reinforced layers had the biggest impact on the flexural strength, while the wet density had the biggest impact on the unconfined compressive strength. The strength and ductility of GRFL soil may be efficiently managed to increase the applicability in road engineering by selecting the right wet density and number of reinforced layers.
The test results serve as a guide for future study and advocacy regarding the use of foamed lightweight soils with enhanced flexural qualities. Although the current study is only a preliminary experimental investigation on a small-scale sample, it is part of a research program on the static–dynamic properties of GRFL soil. For this new material to be applied in the construction industry, a more thorough investigation of its engineering properties is necessary. This investigation should go beyond the simple mechanical properties and include the simulation of the actual forces under static–dynamic loading, numerical simulation analysis, physical properties, durability, and large-scale modeling test studies. These are areas that are not covered in this paper, but are still being investigated experimentally.

Author Contributions

Writing—original draft, Y.L. (Yinhe Li); visualization, Y.L. (Yinhe Li); supervision, Y.L. (Yong Liu) and H.Z.; methodology, H.Z.; software, N.A.; validation, N.A.; formal analysis, Z.F. All authors have read and agreed to the published version of the manuscript.

Funding

This research received no external funding.

Data Availability Statement

The data used in this study can be requested from the corresponding author. The data are not publicly available due to information that could compromise research participant privacy.

Conflicts of Interest

The authors declare no conflicts of interest.

References

  1. Jierula, A.; Li, H.; Chen, Y.; Wu, C.; Wu, X.; Yin, H. Study on the Influence of Density and Water–Cement Ratio on the Cement Utilization, Fluidity, Mechanical Properties, and Water Absorption of Foam Concrete. Buildings 2024, 14, 3550. [Google Scholar] [CrossRef]
  2. Gołaszewski, J.; Klemczak, B.; Smolana, A.; Gołaszewska, M.; Cygan, G.; Mankel, C.; Peralta, I.; Röser, F.; Koenders, E.A.B. Effect of Foaming Agent, Binder and Density on the Compressive Strength and Thermal Conductivity of Ultra-Light Foam Concrete. Buildings 2022, 12, 1176. [Google Scholar] [CrossRef]
  3. Mohtadi, A.; Ghomeishi, M.; Dehghanbanadaki, A. Towards Sustainable Construction: Evaluating Thermal Conductivity in Advanced Foam Concrete Mixtures. Buildings 2024, 14, 3636. [Google Scholar] [CrossRef]
  4. Bat-Erdene, P.-E.; Pareek, S.; Koenders, E.; Mankel, C.; Löher, M.; Xiao, P. Evaluation of the Thermal Performance of Fly Ash Foam Concrete Containing Phase Change Materials (PCMs). Buildings 2023, 13, 2481. [Google Scholar] [CrossRef]
  5. Liu, C.; Luan, K.; Su, J. Study on Post-Fire Resistance of Ceramsite Foamed Concrete Sandwich Composite Slabs. Structures 2023, 58, 105506. [Google Scholar] [CrossRef]
  6. Kou, R.; Guo, M.-Z.; Shi, Y.; Mei, M.; Jiang, L.; Chu, H.; Zhang, Y.; Shen, H.; Xue, L. Sound-Insulation and Photocatalytic Foamed Concrete Prepared with Dredged Sediment. J. Clean. Prod. 2022, 356, 131902. [Google Scholar] [CrossRef]
  7. Zhang, B.; Poon, C.S. Sound Insulation Properties of Rubberized Lightweight Aggregate Concrete. J. Clean. Prod. 2018, 172, 3176–3185. [Google Scholar] [CrossRef]
  8. Raj, A.; Sathyan, D.; Mini, K.M. Physical and Functional Characteristics of Foam Concrete: A Review. Constr. Build. Mater. 2019, 221, 787–799. [Google Scholar] [CrossRef]
  9. Amran, Y.H.M.; Farzadnia, N.; Abang Ali, A.A. Properties and Applications of Foamed Concrete; A Review. Constr. Build. Mater. 2015, 101, 990–1005. [Google Scholar] [CrossRef]
  10. Zhang, S. Research on Dynamic Characteristics of Subgrade and Dynamic Construction Control Index on Changsha Round-the-City Expressway. Master’s Thesis, Changsha University of Science & Technology, Changsha, China, 2013. [Google Scholar]
  11. Zhang, H.; Qi, X.; Wan, L.; Zuo, Z.; Ge, Z.; Wu, J.; Song, X. Properties of Silt-Based Foamed Concrete: A Type of Material for Use in Backfill behind an Abutment. Constr. Build. Mater. 2020, 261, 119966. [Google Scholar] [CrossRef]
  12. Chica, L.; Alzate, A. Cellular Concrete Review: New Trends for Application in Construction. Constr. Build. Mater. 2019, 200, 637–647. [Google Scholar] [CrossRef]
  13. Huang, J.; Su, Q.; Zhao, W.; Li, T.; Zhang, X. Experimental Study on Use of Lightweight Foam Concrete as Subgrade Bed Filler of Ballastless Track. Constr. Build. Mater. 2017, 149, 911–920. [Google Scholar] [CrossRef]
  14. Zhang, C.; Zhu, Z.; Zhang, Y.; Liu, F.; Yang, Y.; Wan, Y.; Huo, W.; Yang, L. Engineering Properties and Optimal Design of Foam Lightweight Soil Composite Fly Ash: An Eco-Friendly Subgrade Material. J. Clean. Prod. 2023, 429, 139631. [Google Scholar] [CrossRef]
  15. Shi, L.; Chen, H.; Dou, J.; Lv, Z.; Muo, S.; Chen, Y. Finite element simulation of thermal performance of medium lightweight foamed concrete self-insulating block wall. Brick-Tile 2024, 5, 18–23. [Google Scholar] [CrossRef]
  16. Shi, X.; Huang, J.; Su, Q. Experimental and Numerical Analyses of Lightweight Foamed Concrete as Filler for Widening Embankment. Constr. Build. Mater. 2020, 250, 118897. [Google Scholar] [CrossRef]
  17. Fang, C. Study on Deformation and Stability Characteristics of Foamed Lightweight Soil Reinforced Embankment. Master’s Thesis, Chongqing Jiaotong University, Chongqing, China, 2023. [Google Scholar] [CrossRef]
  18. Liu, X.; Liu, F.; Yin, Z.; Zhu, P.; Wang, M. Study on Crack Propagation Characteristics of Foam Concrete–Soil Composite with Different Height Ratios under Dynamic and Static Loading Conditions. J. Eng. Sci. Technol. Rev. 2024, 17, 131–139. [Google Scholar] [CrossRef]
  19. Falliano, D.; De Domenico, D.; Ricciardi, G.; Gugliandolo, E. Improving the Flexural Capacity of Extrudable Foamed Concrete with Glass-Fiber Bi-Directional Grid Reinforcement: An Experimental Study. Compos. Struct. 2019, 209, 45–59. [Google Scholar] [CrossRef]
  20. Yavuz Bayraktar, O.; Kaplan, G.; Gencel, O.; Benli, A.; Sutcu, M. Physico-Mechanical, Durability and Thermal Properties of Basalt Fiber Reinforced Foamed Concrete Containing Waste Marble Powder and Slag. Constr. Build. Mater. 2021, 288, 123128. [Google Scholar] [CrossRef]
  21. Shi, X.; Ning, B.; Wang, J.; Cui, T.; Zhong, M. Improving Flexural Toughness of Foamed Concrete by Mixing Polyvinyl Alcohol-Polypropylene Fibers: An Experimental Study. Constr. Build. Mater. 2023, 400, 132689. [Google Scholar] [CrossRef]
  22. Rao, D.; Wang, X.; Zhou, W.; Zheng, G.; Chu, Y.; Fang, C. Study on the deformation of reinforced lightweight soil embankments based on full-scale model tests. Drill. Eng. 2024, 51, 111–116. [Google Scholar]
  23. Tao, Y. Experimental Study on Pavement Performance of Geogrid-Reinforced Foamed Concrete. Master’s Thesis, Hunan University of Science and Technology, Xiangtan, China, 2023. [Google Scholar] [CrossRef]
  24. Hulimka, J.; Krzywoń, R.; Jędrzejewska, A. Laboratory Tests of Foam Concrete Slabs Reinforced with Composite Grid. Procedia Eng 2017, 193, 337–344. [Google Scholar] [CrossRef]
  25. Al-Barqawi, M.; Aqel, R.; Wayne, M.; Titi, H.; Elhajjar, R. Polymer Geogrids: A Review of Material, Design and Structure Relationships. Materials 2021, 14, 4745. [Google Scholar] [CrossRef] [PubMed]
  26. El Meski, F.; Chehab, G.R. Flexural Behavior of Concrete Beams Reinforced with Different Types of Geogrids. J. Mater. Civ. Eng. 2014, 26, 04014038. [Google Scholar] [CrossRef]
  27. Wang, Z.; Cai, Y.; Qi, Y.; Yang, G.; Ye, C. Large-scale triaxial tests of geogrid reinforced rubber gravel mixtures. J. Railw. Sci. Eng. 2023, 20, 2509–2520. [Google Scholar] [CrossRef]
  28. Wu, L.; Zhu, Y.; Xu, Q.; Chen, Q.; Wang, Y. Triaxial test study of geogrid reinforced sand. J. Hefei Univ. Technol. Nat. Sci. 2024, 47, 83–90. [Google Scholar]
  29. CJJ/T 177—2012; Technical Specification for Filling Engineering with Foamed Lightweight Soil. China Architecture & Building Press: Beijing, China, 2012. (In Chinese)
  30. Zhang, Q.; Zhang, K.; Yu, J.; Sun, R.; Song, X. Experimental Study of Geogrid Reinforced under Different Foundation Settlement Modes. Hans J. Civ. Eng. 2019, 8, 939–948. [Google Scholar] [CrossRef]
  31. GB/T 11969—2020; Test Methods for Properties of Autoclaved Aerated Concrete. Standards Press of China: Beijing, China, 2020. (In Chinese)
  32. Zhang, X. Research on Static and Dynamic Characteristics and Durability of Polypropylene Fiber-modified Rubber Foamed Concrete. Master’s Thesis, Shandong University, Jinan, China, 2024. [Google Scholar]
  33. Liu, J.; Li, H.; Zhang, B.; Liu, B.; Hao, B.; Jiang, N. Pore structure analysis of foamed lightweight soil based on X-CT scanning technology. J. Beijing Polytech. Univ. 2024, 50, 1228–1236. [Google Scholar]
  34. ASTM C1609/C1609M-24; Standard Test Method for Flexural Performance of Fiber-Reinforced Concrete (Using Beam with Third-Point Loading). ASTM International: West Conshohocken, PA, USA, 2024.
  35. Wang, T. Flexural Behavior and Calculation Method of Reinforced Concrete Short Beam Strengthened by CFRP Sheet. Ph.D. Thesis, Zhengzhou University, Zhengzhou, China, 2018. [Google Scholar]
  36. Li, B.; Chi, Y.; Xu, L.; Shi, Y.; Li, C. Experimental Investigation on the Flexural Behavior of Steel-Polypropylene Hybrid Fiber Reinforced Concrete. Constr. Build. Mater. 2018, 191, 80–94. [Google Scholar] [CrossRef]
  37. Decký, M.; Drusa, M.; Zgútová, K.; Blaško, M.; Hájek, M.; Scherfel, W. Foam Concrete as New Material in Road Constructions. Procedia Eng. 2016, 161, 428–433. [Google Scholar] [CrossRef]
  38. Liu, K.; Su, Q.; Ni, P.; Zhou, C.; Zhao, W.; Yue, F. Evaluation on the Dynamic Performance of Bridge Approach Backfilled with Fibre Reinforced Lightweight Concrete under High-Speed Train Loading. Comput Geotech. 2018, 104, 42–53. [Google Scholar] [CrossRef]
  39. Wu, J.; Wang, J.; Liu, M.; Zhuang, P.; Zhang, H.; Song, X. Dynamic Properties of Silt-Based Foamed Concrete as Filler in Subgrade. J. Mater. Civ. Eng. 2022, 34, 04022241. [Google Scholar] [CrossRef]
  40. Liu, H.; Han, J.; Parsons, R.L. Mitigation of Seasonal Temperature Change-Induced Problems with Integral Bridge Abutments Using EPS Foam and Geogrid. Geotext. Geomembr. 2021, 49, 1380–1392. [Google Scholar] [CrossRef]
  41. Amran, M.; Huei Lee, Y.; Vatin, N.; Fediuk, R.; Poi-Ngian, S.; Yong Lee, Y.; Murali, G. Design Efficiency, Characteristics, and Utilization of Reinforced Foamed Concrete: A Review. Crystals 2020, 10, 948. [Google Scholar] [CrossRef]
  42. Li, W.; Yang, J.; Sun, M.; Xu, F.; Zhao, Y.; Xia, H. A Sludge-Modified Foam Concrete for Road Fill Material: Performance Evaluation and Carbon Footprint Analysis. J. CO2 Util. 2025, 91, 103006. [Google Scholar] [CrossRef]
  43. Zhang, H.; Wang, J.; Liu, Z.; Ma, C.; Song, Z.; Cui, F.; Wu, J.; Song, X. Strength Characteristics of Foamed Concrete under Coupling Effect of Constant Compressive Loading and Freeze-Thaw Cycles. Constr. Build. Mater. 2024, 411, 134565. [Google Scholar] [CrossRef]
Figure 1. Bi-directional plastic geogrid (unit in mm).
Buildings 15 00461 g001
Figure 2. Schematic diagram of reinforcement lateral placement in the specimen (unit in mm).
Buildings 15 00461 g002
Figure 3. Specimen preparation process. (a) Cement paste; (b) foaming machine; (c) foam; (d) measurement of target wet density; (e) geogrid positioning; (f) specimen.
Buildings 15 00461 g003
Figure 4. Load–displacement curves for GRFL soil specimen under four-point bending test. (a) Wet density of 600 kg/m3; (b) wet density of 700 kg/m3; (c) wet density of 800 kg/m3.
Buildings 15 00461 g004
Figure 6. Schematic diagram of the typical destruction process of standard foamed lightweight soil.
Buildings 15 00461 g006
Figure 7. Process sketch of GRFL soil damage using one-layer reinforcement as an example.
Buildings 15 00461 g007
Figure 8. Schematic diagram of the test specimen under load when reinforced with one layer.
Buildings 15 00461 g008
Figure 9. Load–displacement curves for GRFL soil at different stages. (a) Influence of reinforcement layer number; (b) influence of wet density.
Buildings 15 00461 g009
Figure 10. The unconfined compressive strength of GRFL soil. (a) The influence of reinforcement layer number; (b) the influence of wet density.
Buildings 15 00461 g010
Figure 11. Flexural strength of GRFL soil. (a) Influence of reinforcement layer number; (b) influence of wet density.
Buildings 15 00461 g011
Figure 12. Fitting effects of the ratio of unconfined compressive strength to flexural strength for GRFL soil at different wet densities.
Buildings 15 00461 g012
Table 1. Basic performance parameters of geogrids.
ModelMesh Size/mmTensile Strength/(kN/m)Elongation at Break/%
LongitudinalTransverseLongitudinalTransverse
TGSG50-5033 × 3355.860.36.37.6
Note: The geogrids in the specimens are arranged horizontally.
Table 2. Mix proportions and basic physical properties of GRFL soil.
Serial NumberTarget Wet Density/
(kg/m3)
Number of Reinforcement LayersCement Content/
(kg/m3)
Water Content/
(kg/m3)
Foam Dosage/
(kg/m3)
Measured Wet Density/
(kg/m3)
Flow Value/
(mm)
600-0600036520134608183
600-11592181
600-22605184
600-33602184
700-0700043223731697181
700-11705185
700-22700183
700-33710191
800-0800049827428805182
800-11800185
800-22802190
800-33808186
Table 3. Measured and calculated from the approximating function values of unconfined compressive strength for various mix proportions.
Wet Density (kg/m3)Reinforcement LayersMeasured Value (MPa)Calculated Value (MPa)Error (%)
60001.221.3712.30
11.651.584.24
21.801.790.56
31.732.0116.18
70001.892.0910.58
12.542.309.45
22.882.5112.85
33.042.7210.53
80002.892.803.11
13.013.020.33
23.073.235.21
33.163.448.86
Note: The calculated values are derived from the fitted functions.
Table 4. Significance discrimination.
F1–0.05(2,9)Degree of Significance
>4.26 Significant
<4.26 Insignificant
Table 5. Results of variance analysis.
Consideration IndexItemInfluencing Factors
Wet DensityNumber of Reinforcement Layers
Freedom
df
23
Unconfined Compressive StrengthSum of Squares12.8132.277
Mean Square6.4070.759
F1–0.05(2,9)166.80219.763
SignificanceSignificantSignificant
Contribution Rate89.41%10.59%
Flexural StrengthSum of Squares1.8985.566
Mean Square0.9491.855
F1–0.05(2,9)62.283121.787
SignificanceSignificantSignificant
Contribution Rate33.84%66.16%
Disclaimer/Publisher’s Note: The statements, opinions and data contained in all publications are solely those of the individual author(s) and contributor(s) and not of MDPI and/or the editor(s). MDPI and/or the editor(s) disclaim responsibility for any injury to people or property resulting from any ideas, methods, instructions or products referred to in the content.

