Article

Stability and Design Charts for 3D Rectangular Cavity Crowns with Limited Buried Depth in Rock Masses

1
College of Architecture and Civil Engineering, Beijing University of Technology, Beijing 100124, China
2
China Construction Fifth Engineering Division Corp., Ltd., Changsha 410004, China
*
Author to whom correspondence should be addressed.
Buildings 2025, 15(22), 4151; https://doi.org/10.3390/buildings15224151
Submission received: 22 September 2025 / Revised: 30 October 2025 / Accepted: 11 November 2025 / Published: 18 November 2025

Abstract

A quantitative stability analysis of a three-dimensional (3D) rectangular cavity crown with limited buried depth in generalized Hoek–Brown (GHB) rock mass is conducted employing the limit analysis approach. A 3D collapse mechanism for a shallow-buried rectangular cavity crown is developed, in which the mechanism for a deep-buried cavity crown represents a special case. The equations for three stability measures—that is, the stability number, the factor of safety (FoS), and the required support pressure—are derived. The feasibility of this study is verified. Consequently, a detailed analysis of the three measures is provided, focusing on the variation trends for the stability measures. An increase in the buried depth ratio C/R and strength index GSI enhances the stability of the cavity crown, while an increase in the 3D characteristics index L/R and strength index mi weakens it. Additionally, stability charts for both the required support pressure and FoS are presented for practical engineering applications.

1. Introduction

With the increasing utilization of underground spaces for transportation, commercial, and sports facilities, as well as for storage and waste disposal, the stability analysis of cavity crowns has become increasingly crucial as a determining factor in safety. During the initial stages of underground development, stability analysis for cavity crowns in rock mass mainly aimed at deep-buried cavity crowns. The collapse patterns for deeply buried rectangular cavities in rock mass, based on the generalized Hoek–Brown (GHB) criterion, were obtained within the framework of plastic theory by Fraldi and Guarracino using the variational approach of limit analysis [1]. Thereafter, the stability analysis of cavity crowns was extended to more complicated scenarios, including stratified surrounding rock inhomogeneity with pore water pressure and soil layers following the nonlinear power–law strength criterion, under both two-dimensional (2D) and three-dimensional (3D) conditions [2,3,4].
With the continuous development and utilization of underground space, the underground environment has become increasingly congested in recent years. In order to make full use of underground space, it is necessary to facilitate the construction of cavities and cavities at limited buried depth. Nevertheless, compared to the extensive stability analysis of deeply buried cavities, the limited relevant research and the more complex collapse mechanisms make the stability analysis of shallow-buried cavity crowns more challenging. The study of crown stability in shallow-buried cavities still holds significant importance. The effect of supporting pressure on the profiles of critical collapse mechanisms for shallow-buried cavities was investigated within the framework of the limit analysis upper-bound theorem [5]. A failure profile for shallow-buried cavity crowns in GHB rock mass is presented [6] to illustrate the differences between the deeply and shallowly buried conditions. Based on the variational approach, an equation for the collapse curve of the shallow cavity crowns was proposed [7]. It was concluded that the collapse curve of shallow cavities exists within the collapse curve of deeply buried cavities.
The aforementioned research provides detailed insights into the crown stability analysis of cavities under both deeply and shallowly buried conditions. However, these studies still predominantly focus on describing potential collapse profiles. In practical engineering, rather than failure profiles, quantitative metrics—which offer more intuitive evaluations of cavity crown stability—are more practically significant than failure profiles [8,9]. Currently, there remain notable gaps in the development of effective collapse mechanisms for cavity crowns with limited buried depth (i.e., mechanisms that can accurately provide quantitative estimates of cavity crown stability, with those for deeply buried conditions [9] treated as a special case) and in convenient stability charts for preliminary design reference, especially under 3D conditions.
Therefore, based on the upper-bound limit analysis [10,11,12,13,14], this paper investigates the stability of the crowns of rectangular cavities under limited buried depth in rock strata. A 3D collapse mechanism for the crowns of shallowly buried rectangular cavities—one that treats the collapse mechanisms for deeply buried conditions as a special case—is developed in accordance with the GHB criterion. Energy balance equations are established to derive various quantitative stability measures. Optimization algorithms are programmed to obtain the optimal upper-bound solutions. Comparative analyses are conducted to validate the rationality of the present method. A parametric analysis is performed to reveal the influences of factors such as GHB strength parameters, 3D geometric characteristics, and overburden depth on cavity crown stability. Additionally, a series of stability charts is presented to provide a reference for preliminary engineering design.

2. The Generalized Hoek–Brown (GHB) Strength Criterion

The GHB criterion has gained widespread acceptance in the field of rock mechanics and engineering [15,16,17,18]. It is directly associated with the assessment of rock types, quality, and disturbance indices, thereby providing parameters and metrics for analytical models. This criterion accounts for the intact rock strength and adjusts it downward according to the observed disturbance and weathering to predict more realistic rock mass behavior. Initially proposed by Hoek and Brown, the GHB strength criterion has since undergone a series of refinements. For the convenience of subsequent stability analysis, this paper adopts the parametric form of the GHB strength criterion proposed by Kumar.
σ n = σ c i 1 m b + sin δ m b a m b a 1 sin δ 2 sin δ 1 1 a s m b
τ = σ c i cos δ 2 m b a 1 sin δ 2 sin δ a 1 a
where σn and τ represent the normal stress and shear stress, respectively; δ denotes the fracture angle; and σci is the uniaxial compressive strength of the rock. The dimensionless parameters mb, a, and s are defined as follows:
m b = m i e G S I 100 28 14 D
a = 1 2 + 1 6 e G S I 15 e 20 3
s = e G S i 100 9 3 D
where GSI stands for the Geological Strength Index from 5 to 100; mi refers to the rock type within the range of 5 to 30; and D is the disturbance parameter ranging from 0 to 1. In this paper, D is assigned the value of 0, indicating the absence of disturbances in the rock mass.

3. Stability Analysis for 3D Shallow-Buried Rectangular Cavities

This section establishes a collapse mechanism for the crowns of rectangular-section cavities and thereafter develops three stability measures: the stability number N, the factor of safety (FoS), and the required supporting pressure p by utilizing the energy balance equation. Subsequently, optimization codes are developed to calculate these stability measures and obtain the optimal solutions.

3.1. Collapse Mechanism of 3D Shallow-Buried Rectangular Cavities

The schematic and cross-sectional diagrams for the crown collapse mechanism of rectangular cavities with limited burial depth are depicted in Figure 1. A collapse mechanism that extends to the surface corresponds to a shallow-buried condition and transitions to a deep-buried collapse mechanism as the burial depth gradually increases and reaches a certain value. Subsequently, further increases in buried depth will no longer affect the collapse mechanism of a cavity crown. This is to say, the deeply buried collapse mechanism can be considered as a special case of the shallow-buried mechanism developed in this study.
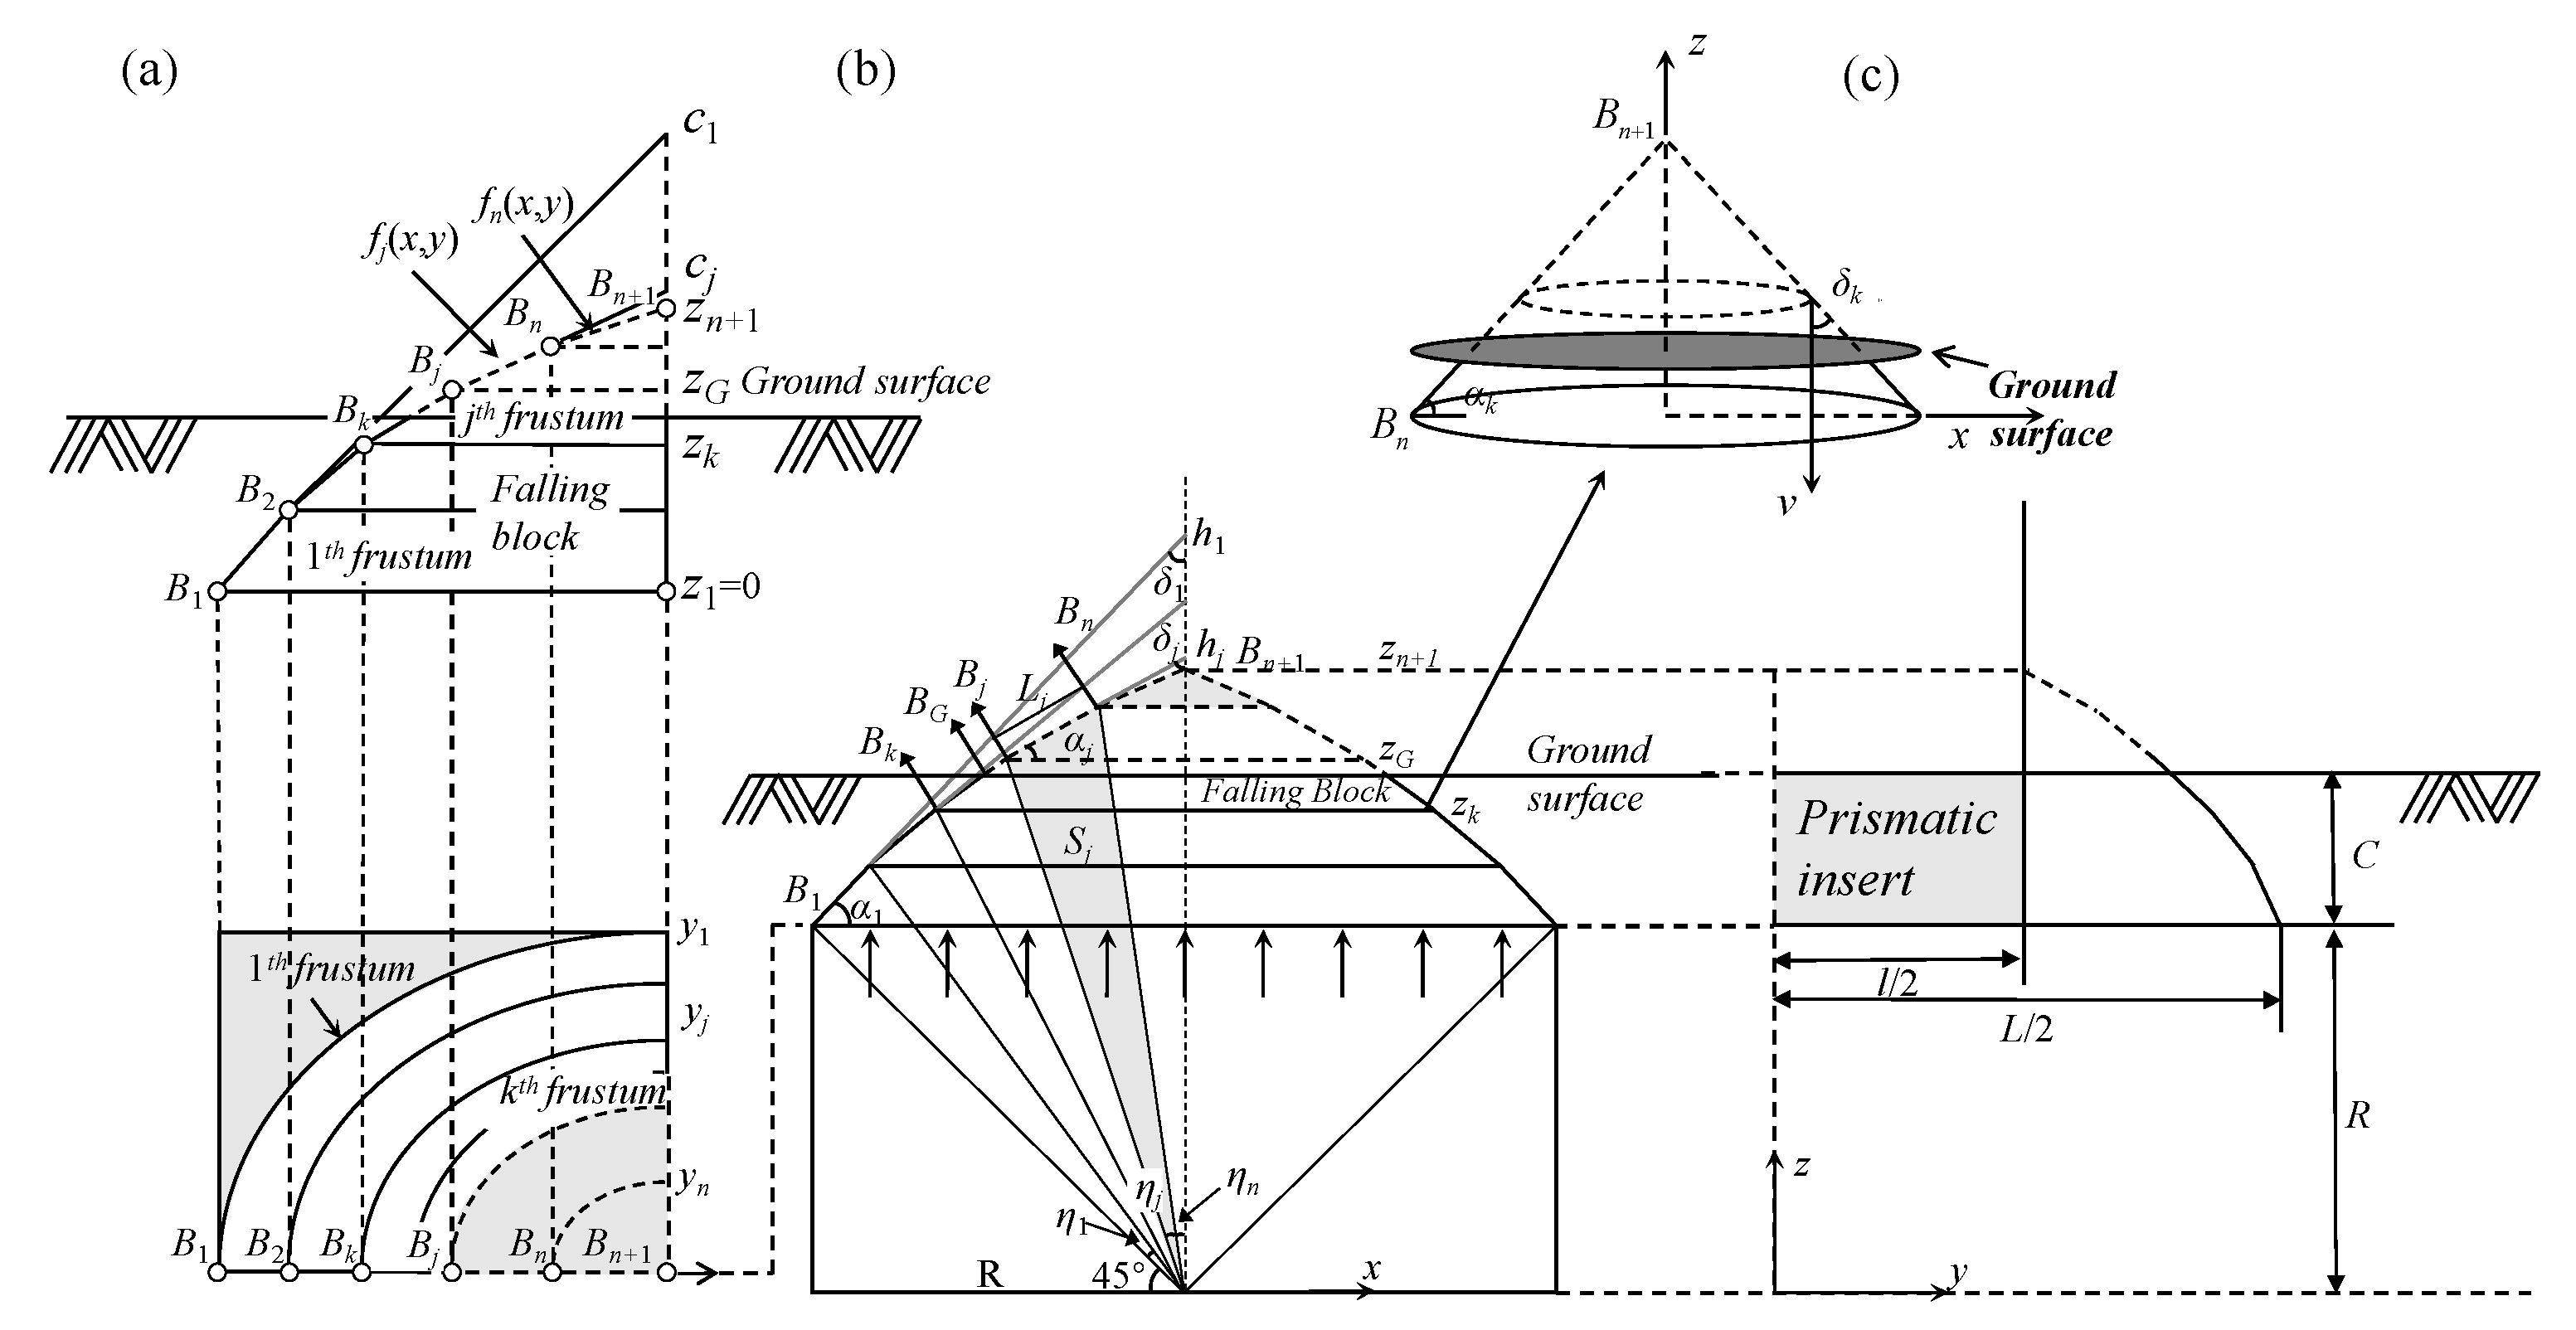
The 3D collapse mechanism of a shallow-buried rectangular cavity crown with a cover depth of C and a height of R is illustrated in Figure 2. The boundary of the collapsing block is described by the broken line B1B2...Bj...BnBn+1, as depicted in Figure 2. The rock mass in this collapse mechanism is composed of n elliptical cones, each with a different generatrix inclination and with a height defined by the coordinates hj (j = 1, 2, ..., n). Typically, an elliptical cone is described by the following equations, where the origin of the coordinate system is located at the center of the cone’s base, as shown in Figure 2:
x 2 a 2 + y 2 b 2 = ( z h ) 2 h 2
where a and b are the semiaxes of the cone’s base in the x and y directions, and h is the height of the cone. For convenience, Equation (6) for the jth cone can be converted to a function of the inclination angle of the cone’s base, αj = tan−1(h/a):
x 2 + y 2 λ 2 = z h j 2 tan 2 α j
where λ = b/a is equal for all cones producing rock masses, and the elliptical cones degenerate to circular cones when λ = 1.
Limit analysis requires that the vertical velocity of the block v be inclined to the rupture surface on a positive cone at a rupture angle δ, as shown in Figure 2. This angle equals half the apex angle of the cone and is independent of the position on the cone. However, for a positive elliptical cone, the rupture angle depends on the position of the cone that corresponds to the angular coordinate θ. Since the collapse surface in this mechanism consists of a series of truncated cones with different generatrices, each line segment BjBj+1 on the boundary corresponds to a positive elliptical cone with a distinct rupture angle δj. The rupture angle δj(θ) on the collapse surface as a function of the angular coordinate θ can be expressed as follows:
δ j ( θ ) = π 2 cos 1 1 cos θ cot α j 2 + sin θ λ cot α j 2 + 1
For circular cones under λ = 1, this equation simplifies to
δ j θ = π 2 α j
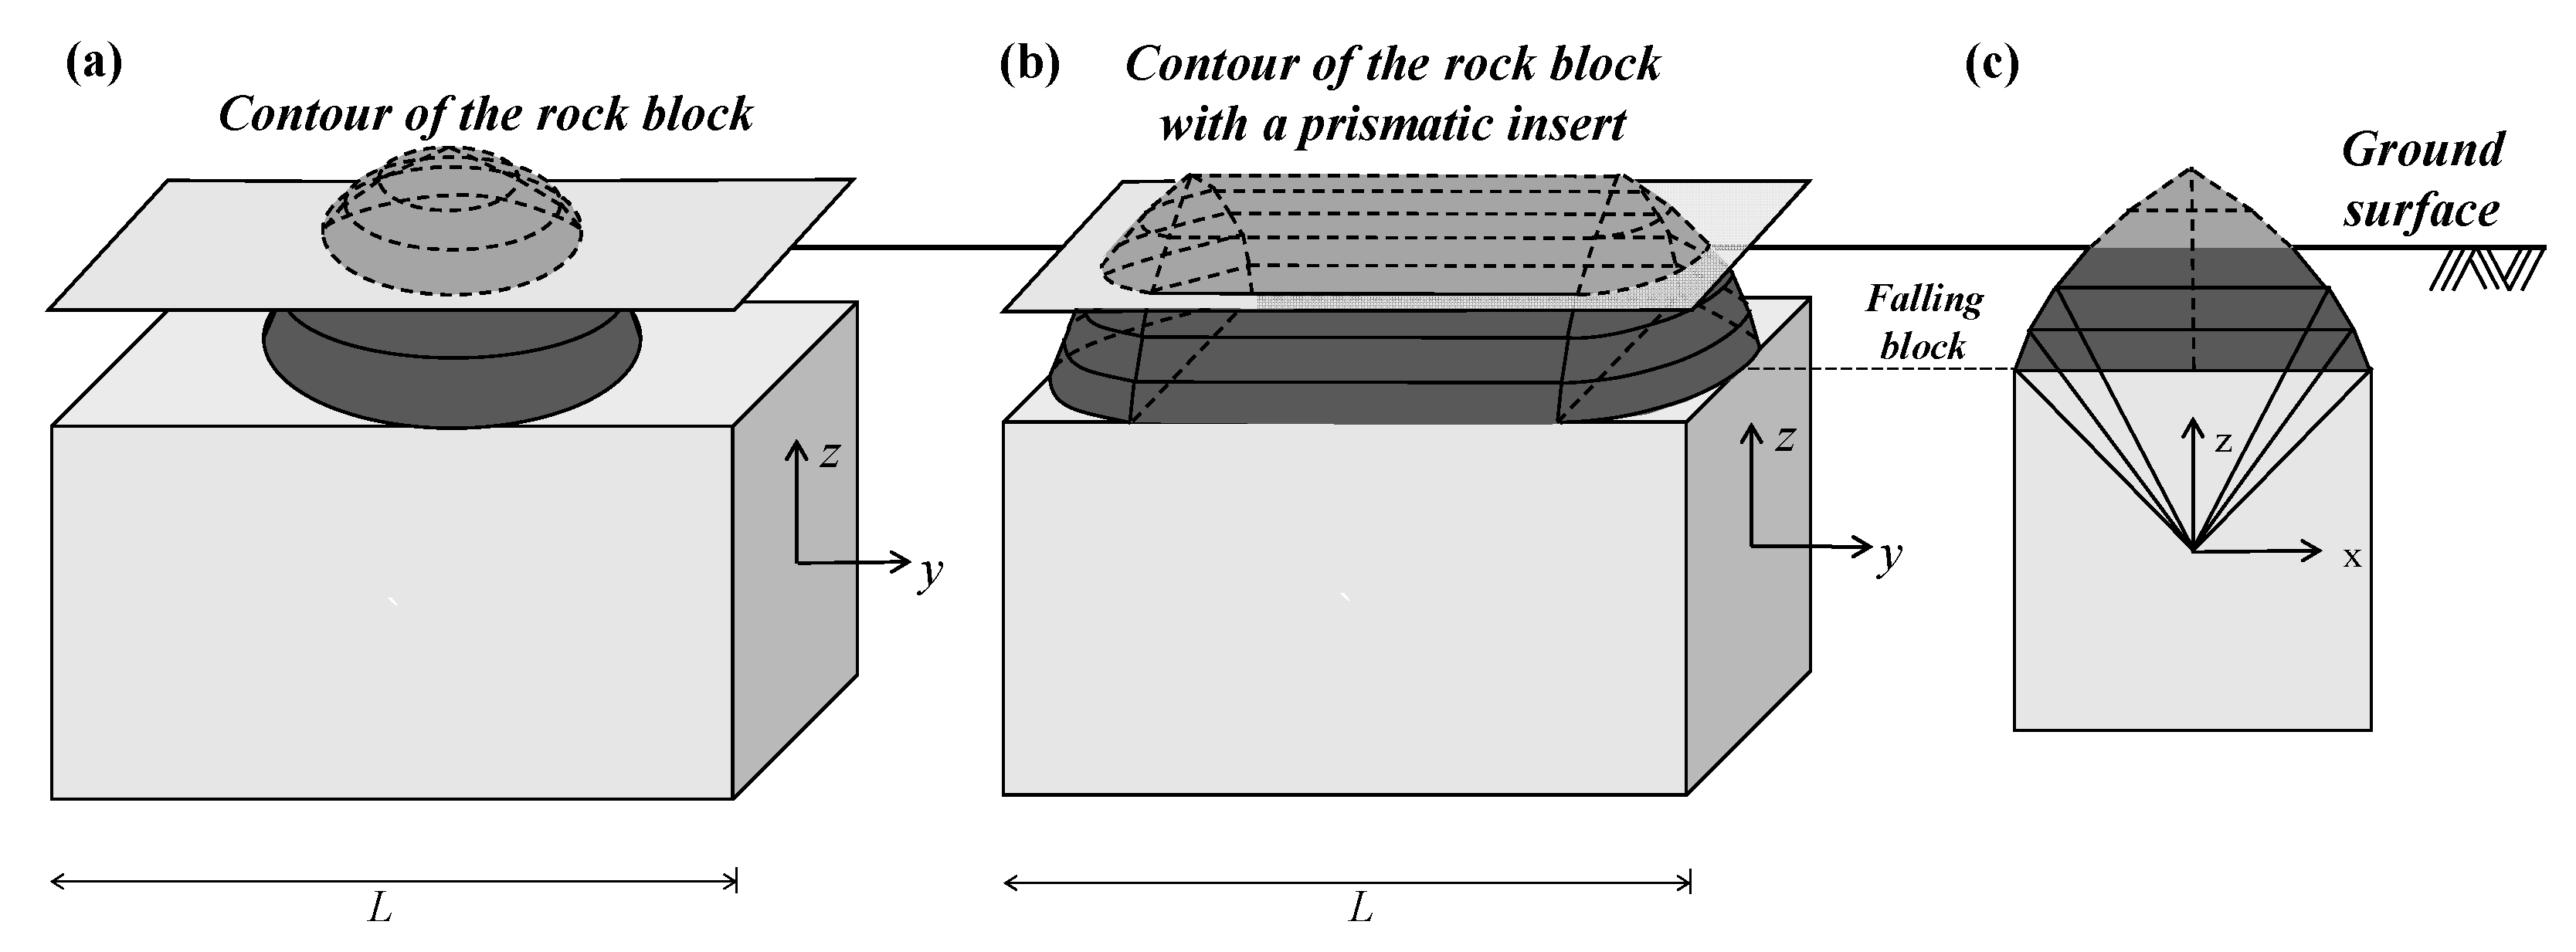
As shown in Figure 3, an insert plane with a length l is introduced and inserted into the symmetric plane of the 3D block to impart geometric significance to the collapse mechanism. Clearly, as l approaches infinity (L/R → ∞), the collapse mechanisms of the 3D cavity crowns degenerate into 2D. The 3D geometric characteristic index L/R is used to quantify the geometric morphology of the cavity. Here, L refers to the length of the cavity along the longitudinal direction, and R denotes the maximum half-width of the cavity in the transverse direction, i.e., half of the maximum transverse dimension.
The 3D collapse mechanism for a shallow-buried cavity crown developed in this study (Figure 2) can be divided into two parts, namely, the lower part from the cavity’s flat ceiling to the ground surface and the upper portion above the ground surface (which does not actually exist). It is clear from Figure 1 and Figure 2 that the collapse mechanism gradually becomes complete as the burial depth C increases. Once the buried depth C reaches a certain value, the complete collapse mechanism B1B2……Bn+1 will be formed. At this point, the cavities are at the critical state between shallow- and deep-buried conditions. Thereafter, the collapse mechanism degenerates into that of a deeply buried case, and subsequent increases in the burial depth C will no longer affect the collapse mechanism of cavity crowns. In other words, the collapse mechanism of the deeply buried cavity crowns can be regarded as a special case of the shallow-buried condition.

3.2. Stability Measures for a Shallow-Buried Cavity Crown

Three stability measures are considered in this work, namely: (i) the stability number N, defined as a dimensionless combination of rock properties and cavity dimensions required to maintain the stability of the cavity crown; (ii) the FoS derived from the strength reduction technique; and (iii) the supporting pressure required to maintain the cavity crown stability under the desired FoS values. The detailed calculation process for these stability measures can be found in Appendix A.

3.2.1. The Stability Number

The dimensionless stability number derived from the energy balance equation Wγ = D is defined as follows:
N = σ c i γ R c r i t
where the symbols σci and γ, respectively, represent the uniaxial compressive strength and unit weight of the rock mass. The stability of a cavity crown can be characterized by the safety margin between the physical strength σci/γR of the surrounding rock and the magnitude of the stability number. A cavity crown can be considered stable once the surrounding rock strength σci/γR exceeds the stability number N. A greater disparity between the rock mass strength σci/γR and the stability number also implies a larger safety margin. Collapse occurs when the dimensionless parameter σci/γR of the rock mass drops to the stability number N.

3.2.2. The FoS Solution

The second stability measure considered is the FoS, defined in Equation (11), using the strength reduction technique, as the ratio of the shear strength τ of the rock to the required shear strength τd for maintaining the cavity crowns in a limit equilibrium state.
F o S = τ τ d
where
σ n d = σ n = σ c i = 1 m b + s i n δ j m b a m b a 1 s i n δ j 2 s i n δ j 1 1 a s m b
τ d = τ F = σ c i F cos δ j 2 m b a 1 sin δ j 2 sin δ j a 1 a

3.2.3. The Required Supporting Pressure

The third stability measure considered is the required supporting pressure to maintain the stability of the cavity crown under desired FoS values. In this study, it is assumed that the supporting pressure acts as a passive load and is uniformly distributed on the cavity lining, as depicted in Figure 2. It is important to note that the supporting pressure only acts on the cavity lining beneath the potential collapse block. Therefore, by incorporating the work rate of the supporting pressure into the energy equilibrium equation Wγ = D + Wp, the dimensionless support pressure p/γR for a rectangular cavity can be obtained.

3.3. Objective Optimization

As depicted in Figure 2, for a rectangular cavity crown, the collapse mechanism B1B2……Bn+1 can be entirely described by 2n + 1 independent variables: λ, n αj, ηj, where j = 1…n. Optimization algorithms are programmed to solve and optimize the optimal solutions of the stability measures corresponding to the collapse mechanism under n = 10. The required geometric boundary conditions are computed to render the three measures meaningful, as follows:
η 1 + η 2 + ... + η n = π 4 0 < α i + 1 α i < π 2
As shown in Figure 2, ηj and αj are complementary angles. These two angles jointly determine the boundary range and spatial position of each elliptic frustum, thereby defining the geometric shape of the contour of the entire failure rock block.

4. Numerical Solutions

To verify the validity of the theoretical analysis, a 3D numerical model with parameters identical to those of the theoretical model was established using FLAC3D 7.00. The simulation focused on the stability of the crown of deep-buried rectangular cavities. The specific process and results are as follows.
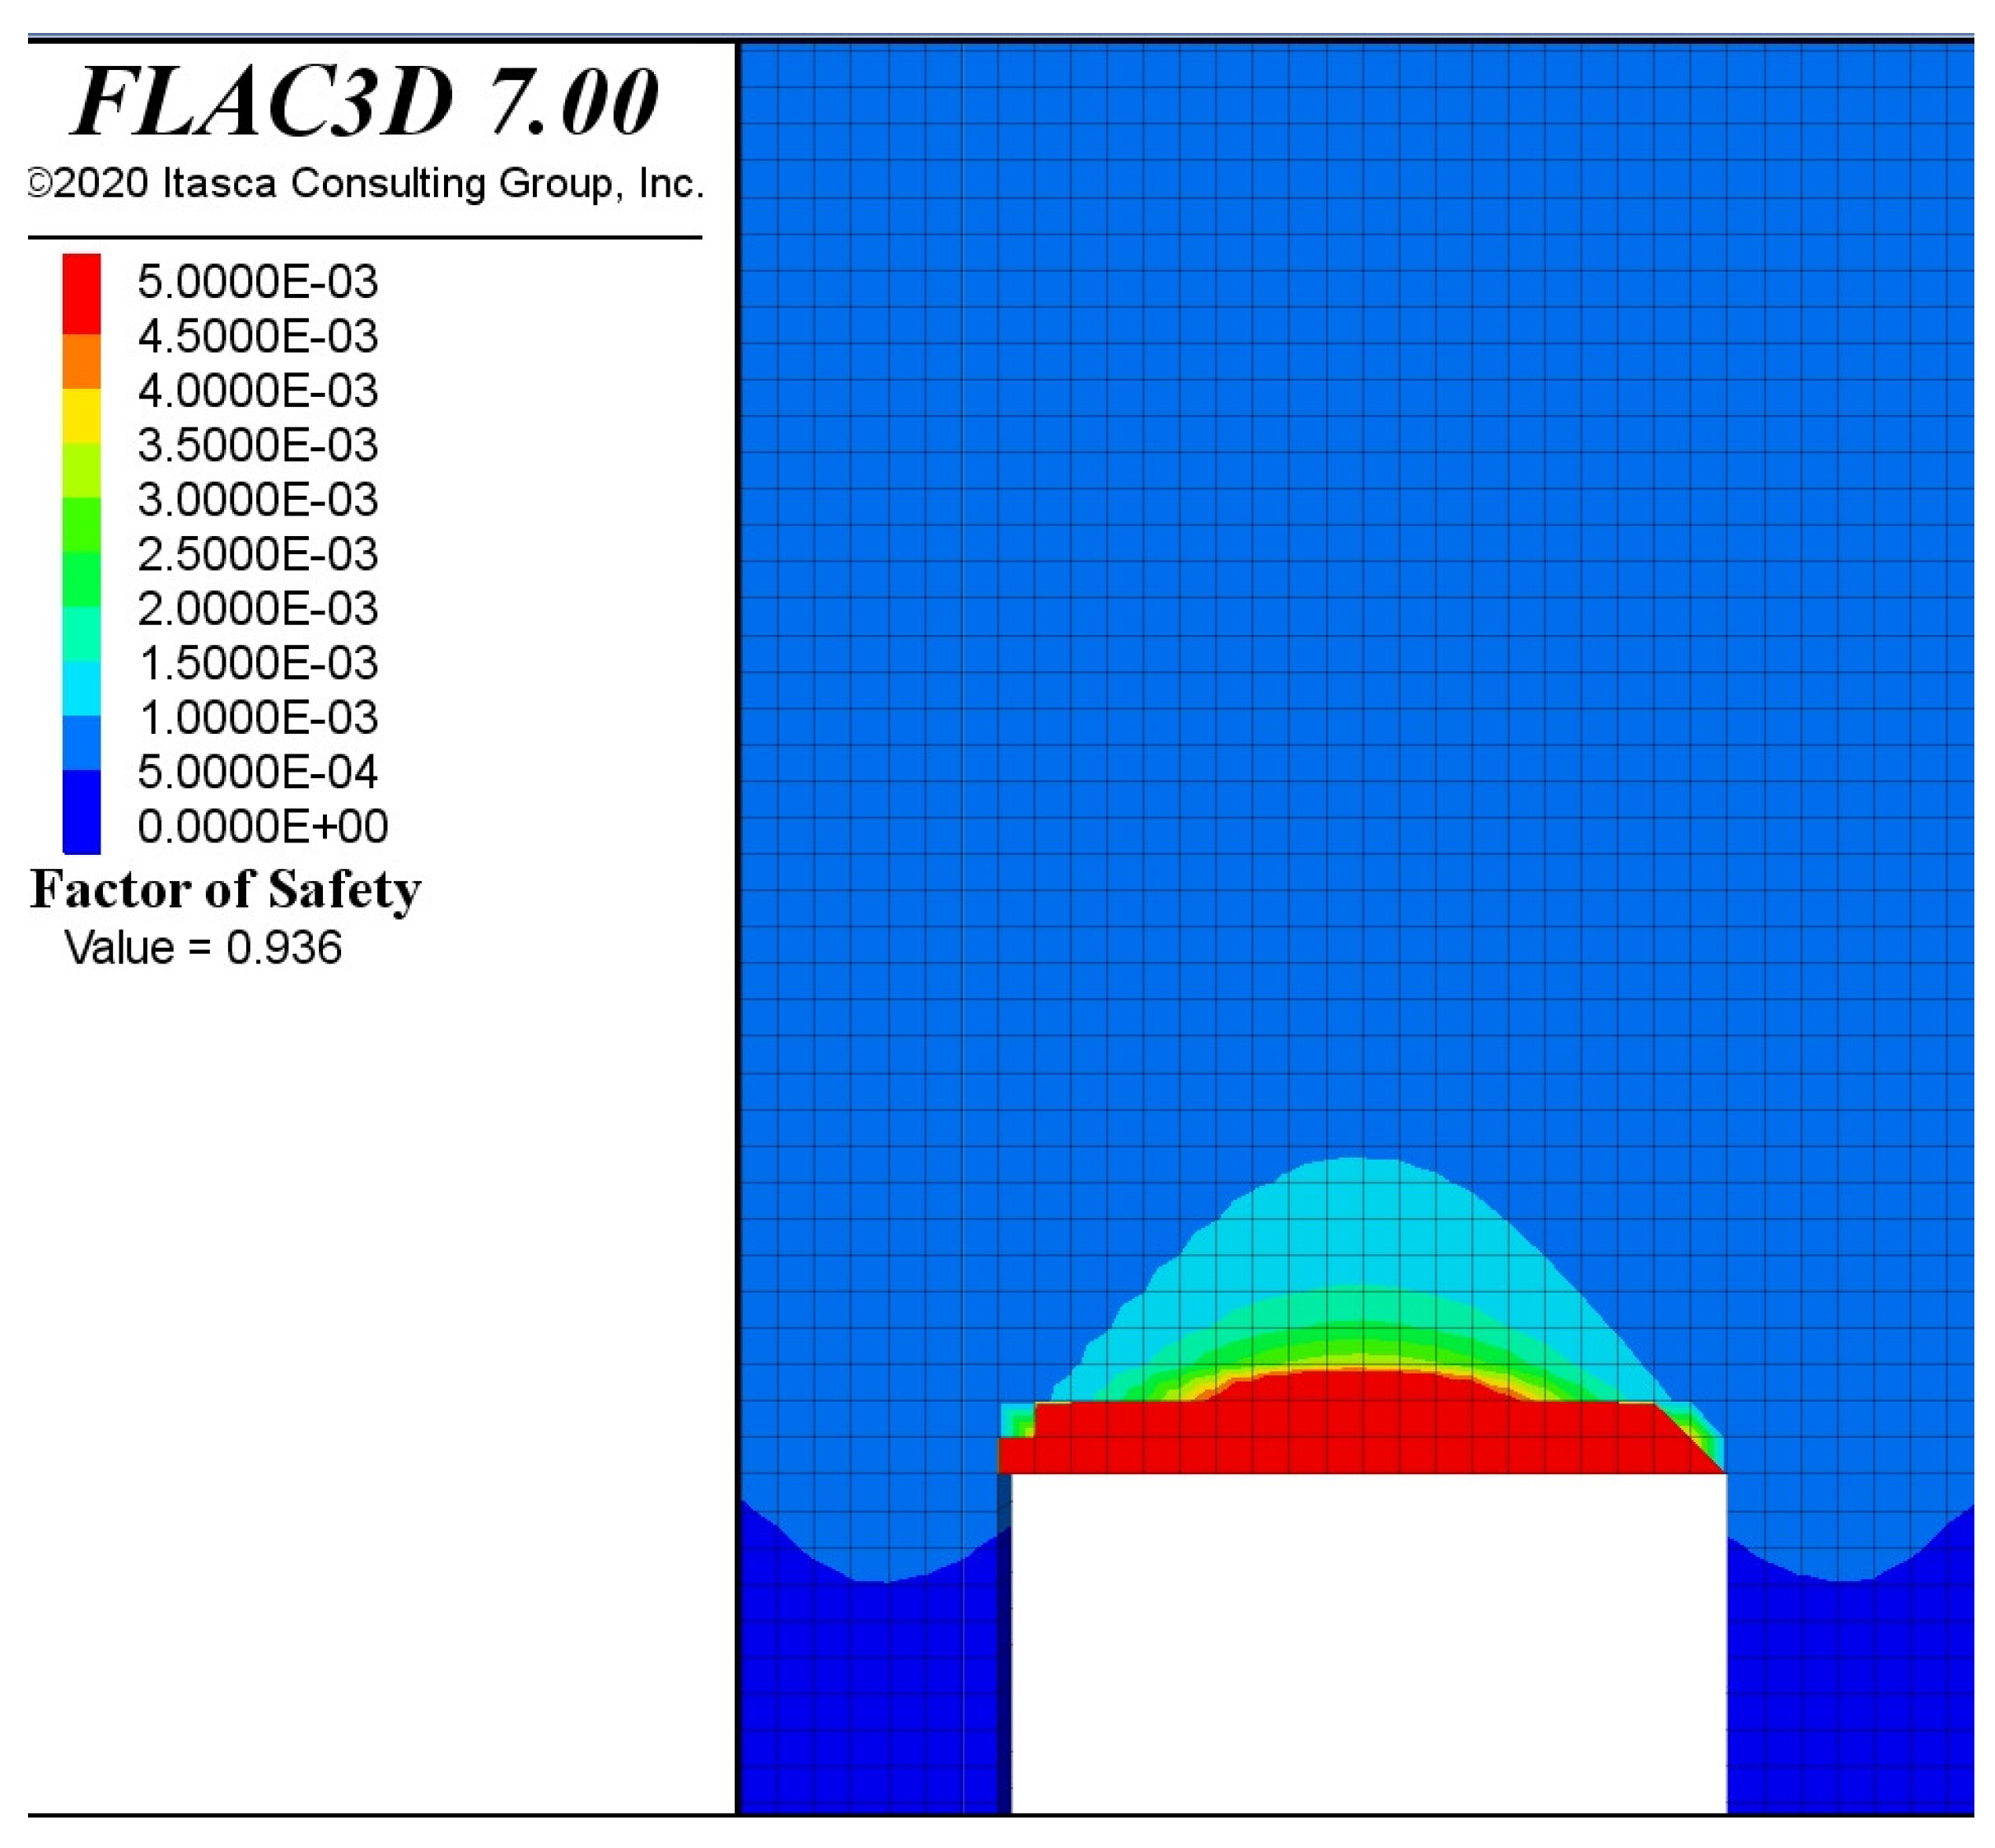
The numerical model strictly adopts the core parameters from the theoretical analysis in this paper to ensure the pertinence and consistency of the verification. The cavity geometric parameters are set according to the theoretical assumptions as follows: cavity length L = 20 m; burial depth C = 50 m; and radius R = 10 m. According to the geometric criterion C/R = 5, this ratio satisfies the definition of a “deep-buried cavity” (the potential failure mechanism does not extend to the ground surface). The HB parameters are GSI = 40, mi = 5, and D = 0. Consequently, a stability number N = σci/γR = 136.7056 is obtained in this work. It should be noted that the cavity crown corresponding to the defined stability number is in a limit equilibrium state. This is to say, the FoS for a deep-buried cavity crown under GSI = 40, mi = 5, D = 0, R = 10 m, σci = 34,176 kPa, and γ = 25 kN/m3 should be 1.0. As shown in Figure 4, a FoS = 0.936 is obtained from numerical simulation by FLAC3D 7.00. The relative error between the numerical result and the theoretical value is 6.8%, which meets the engineering accuracy requirements and verifies this work.
The calculated stability measures for a rectangular cavity crown—namely the stability numbers, the FoS solutions, and the required supporting pressures under desired FoS = 1 and 2 for C/R = 0.1, 0.3, 0.5, and deep-buried situations (C/R → ∞)—are presented in Table 1, Table 2, Table 3 and Table 4. More specifically, Table 1 presents the stability numbers for varying L/R = 2, 3, and ∞ (2D condition), mi = 5, 15, and 25, GSI = 20, 40, 60, 80, and 100. Table 2 presents the FoS solutions under σci/γR = 1000, 40, and 4, corresponding to GSI = 20, 60, and 100, respectively. Table 3 and Table 4 present the required supporting pressures under desired FoS of 1.0 and 2.0 under σci/γR = 200, 20, and 2 with GSI = 20, 60, and 100, respectively. The other parameters in Table 2, Table 3 and Table 4 are mi = 5, 15, 25, and L/R = 2, 3, 4, and ∞.
It is shown in Table 1 that the stability number decreases significantly with the increase in the buried depth ratio C/R. Once the buried depth reaches the critical value distinguishing between deep from shallow burial, the cavity crown is considered deeply buried. Thereafter, further increases in the buried depth do not change the stability or failure mechanisms of cavity crowns. For a cavity crown with L/R = 3 and mi = 15, the deep-buried state is reached under C/R = 0.5 with GSI = 20. However, the cavity crown is still at a shallow-buried state under C/R = 0.5 with GSI = 100. It means that the increase in GSI will also increase the critical burial depth of the cavity crown. Similarly, under the conditions L/R = 3, GSI = 20, and C/R = 0.5, the deep-buried state of the cavity crown is reached at mi = 25, but not yet at mi = 5. This indicates that the increase in mi will reduce the critical burial depth. In addition, Table 1 clearly shows that enhancing the 3D geometric characteristics—that is, decreasing L/R—reduces the critical burial depth required to reach the deep-buried state. It is also evident from Table 1 that the stability measures obtained in this study for the special deep-buried case with C/R → ∞ exhibit solid agreement with the results of Park and Michalowski [9], thereby confirming the effectiveness of the present work.

5. Parametric Analysis and Design Charts

This section examines the influence patterns of the buried depth C/R, the 3D geometric parameter L/R, and the strength indices GSI and mi of the GHB criterion on the stability number. Subsequently, a series of stability charts for the FoS values and required supporting pressures of shallow-buried rectangular cavities are presented, providing a convenient reference for engineers in practical solutions.

5.1. Stability Number

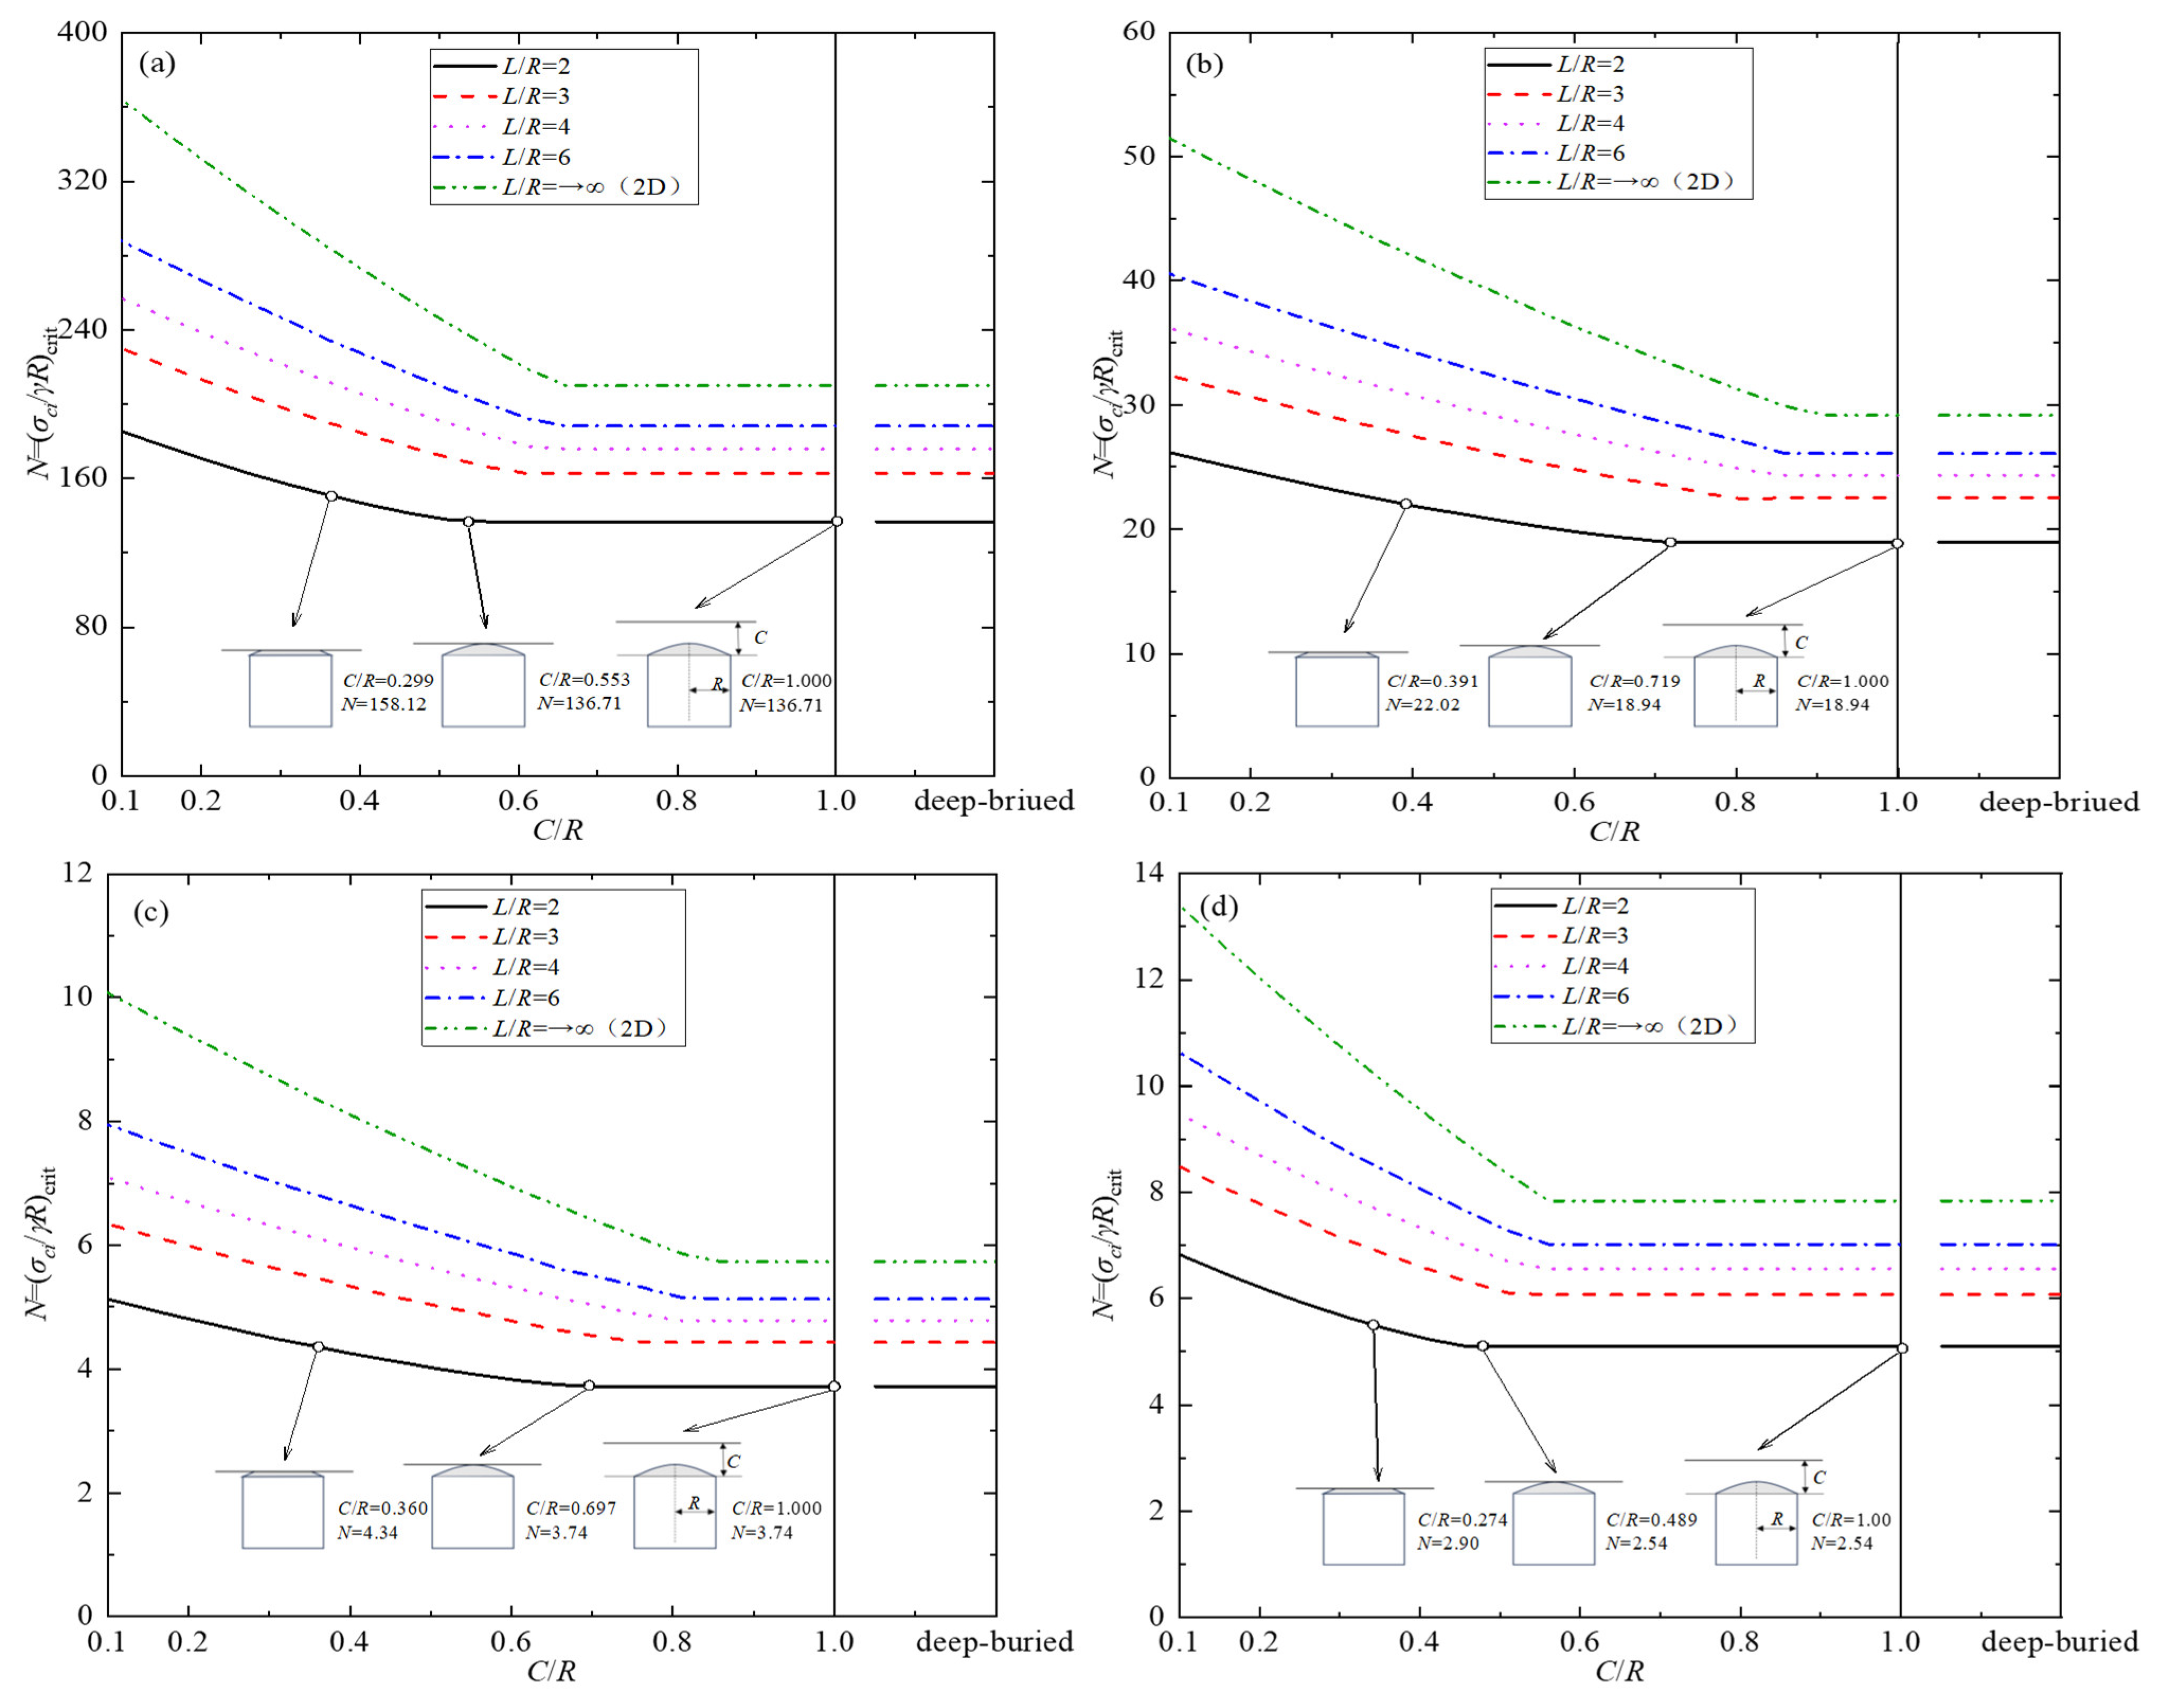
Figure 5 illustrates the variation of the stability number with respect to the 3D characteristics index L/R and C/R. The parameters are as follows: L/R = 2, 3, 4, 6, and a two-dimensional scenario (L/R → ∞), and the burial depth ratio C/R is varied in the range from 0.1 to 1.0. Additionally, mi = 5 and GSI = 40; mi = 5 and GSI = 70; GSI = 100 and mi = 10; and GSI = 100 and mi = 20 in Figure 5a to Figure 5d, respectively.
As observed in Figure 5, the stability number N first decreases and then remains nearly unchanged with increasing burial depth ratio C/R, once C/R reaches a certain value. This indicates that the crown of a shallow-buried rectangular cavity exhibits worse stability than that of a deeply buried one. The augmentation in the length-to-width ratio L/R eventually simplifies the problem into a 2D scenario and results in elevations of the stability number—namely, worse stability conditions. As the spacing between curves gradually decreases with increasing L/R, the variations in the stability number become less pronounced. It is also seen from Figure 5 that increases in the GSI and mi lead to a significant decrease and a slight increase in the stability number, respectively. Moreover, an increase in the length-to-width ratio L/R and GSI, as well as a decrease in mi, also results in an increase in the critical buried depth that distinguishes shallow from deep-buried conditions. Once the stability number with respect to C/R remains unchanged, the collapse mechanism shifts from a shallow-buried scenario to a deep-buried one. Any further increase in the C/R should be considered a deep-buried condition.
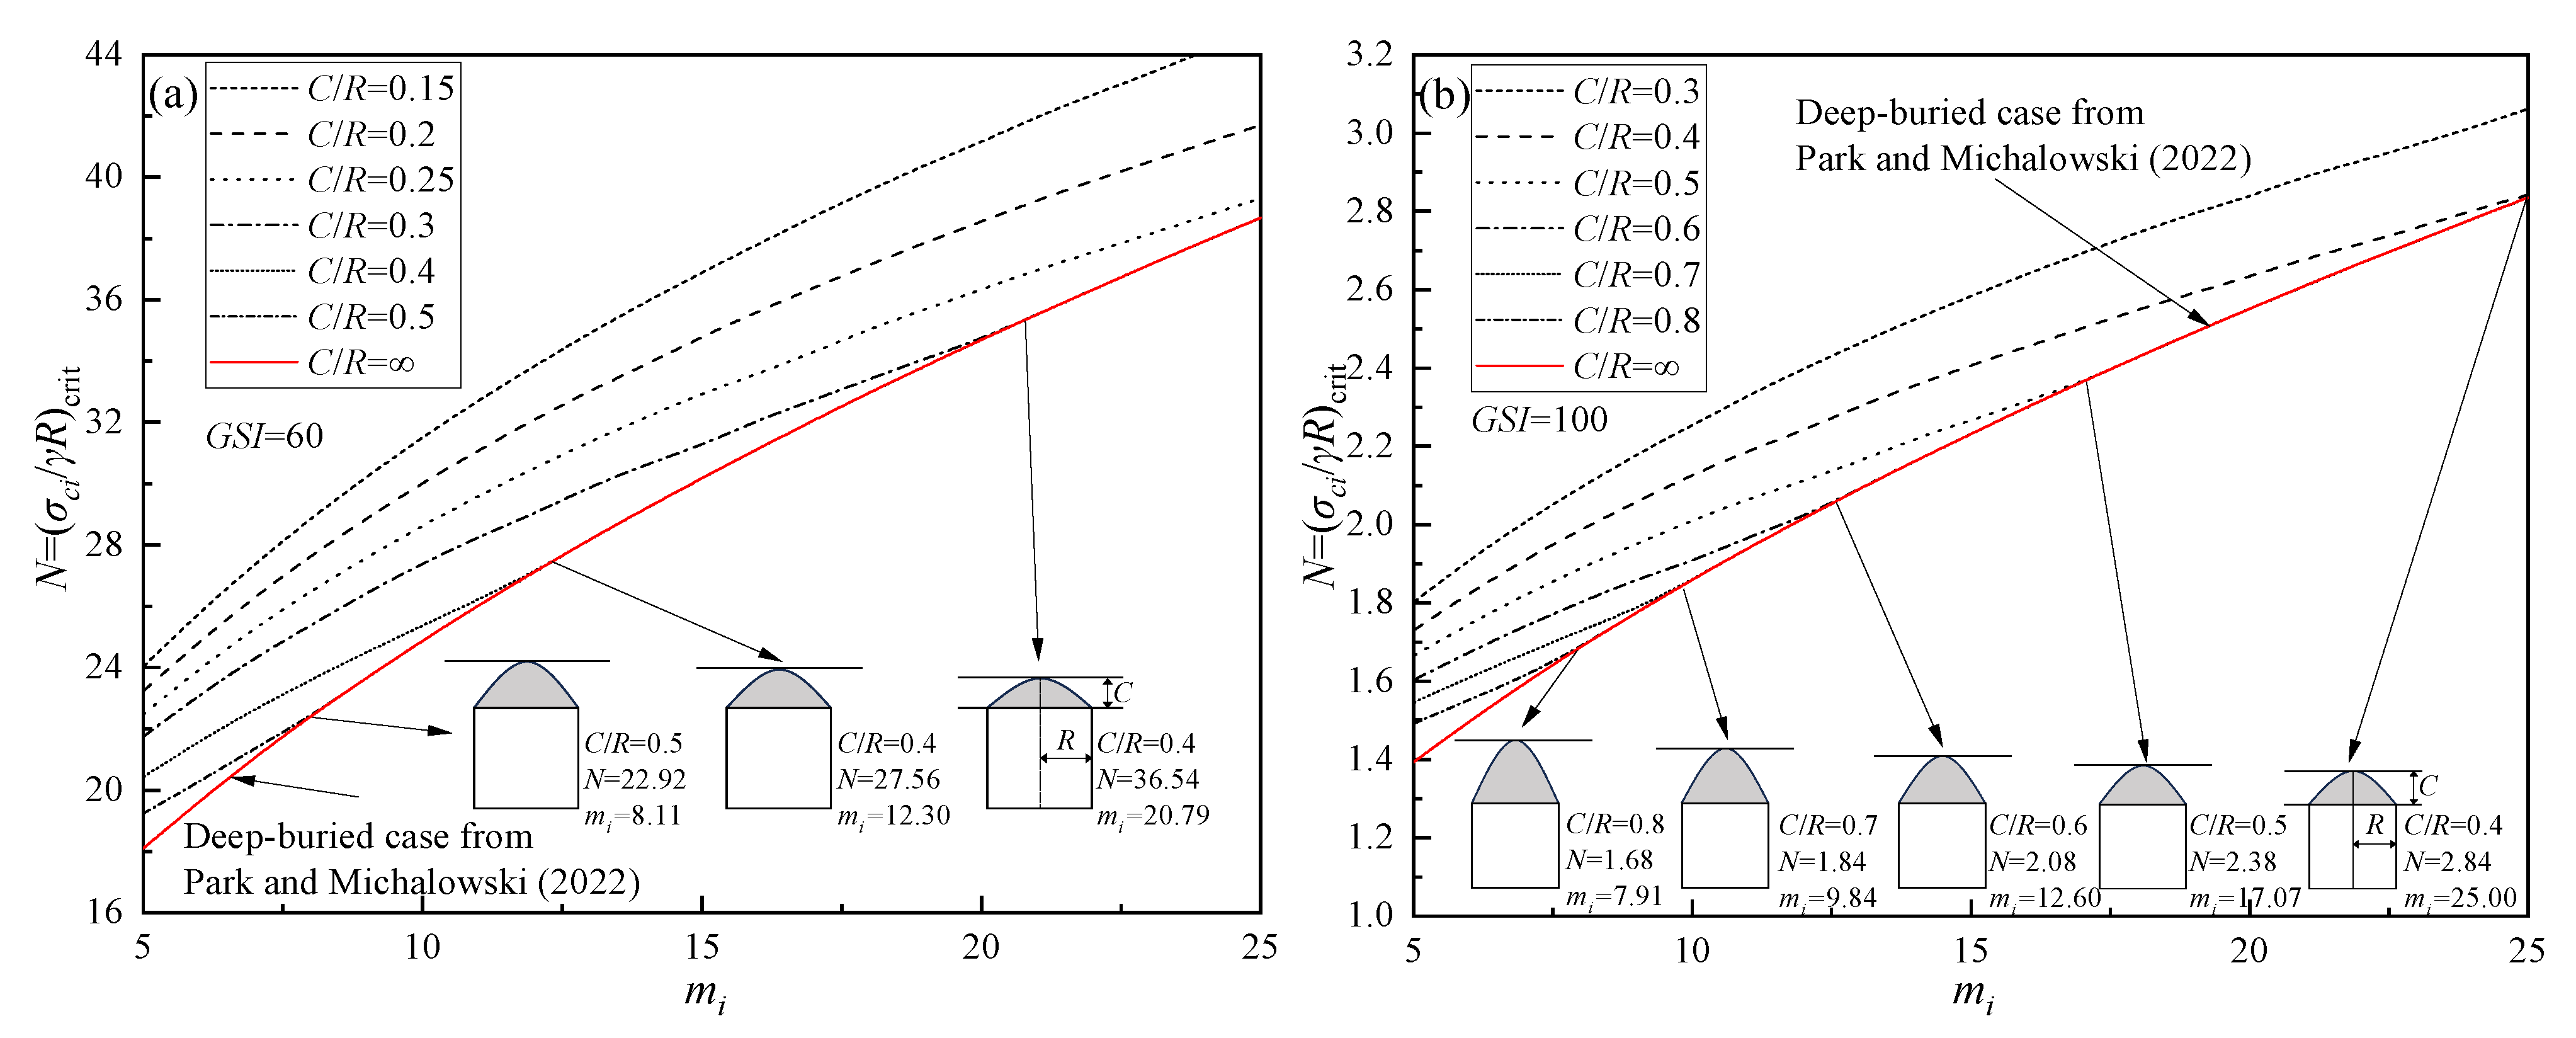
The curves in Figure 6 represent the variation of the stability number with respect to the index mi under different C/R conditions with L/R = 2; GSI = 60 in Figure 6a; and GSI = 100 in Figure 6b. In addition, the selected buried depths in Figure 6a,b are as illustrated.
The curve for C/R = 0.4 in Figure 6a lies in shallowly buried conditions when mi ≤ 12.5. As mi increases, the cavity crown then converts to a deeply buried state. This indicates that the increase of mi reduces the critical buried depth that distinguishes between shallowly buried and deeply buried conditions. It is also shown in Figure 6 that a larger GSI facilitates the attainment of deeply burial conditions under an identical mi condition. Taking the condition with GSI = 100 in Figure 6b as an example, the curve for C/R = 0.5 coincides with the solid curve at mi = 17.5, indicating that the cavity crown reaches a deep burial condition. However, when GSI = 60 in Figure 6a, the curve for C/R = 0.5 does not yet overlap with the red curve at mi = 17.5, signifying that the cavity crown is still in a shallowly buried state.
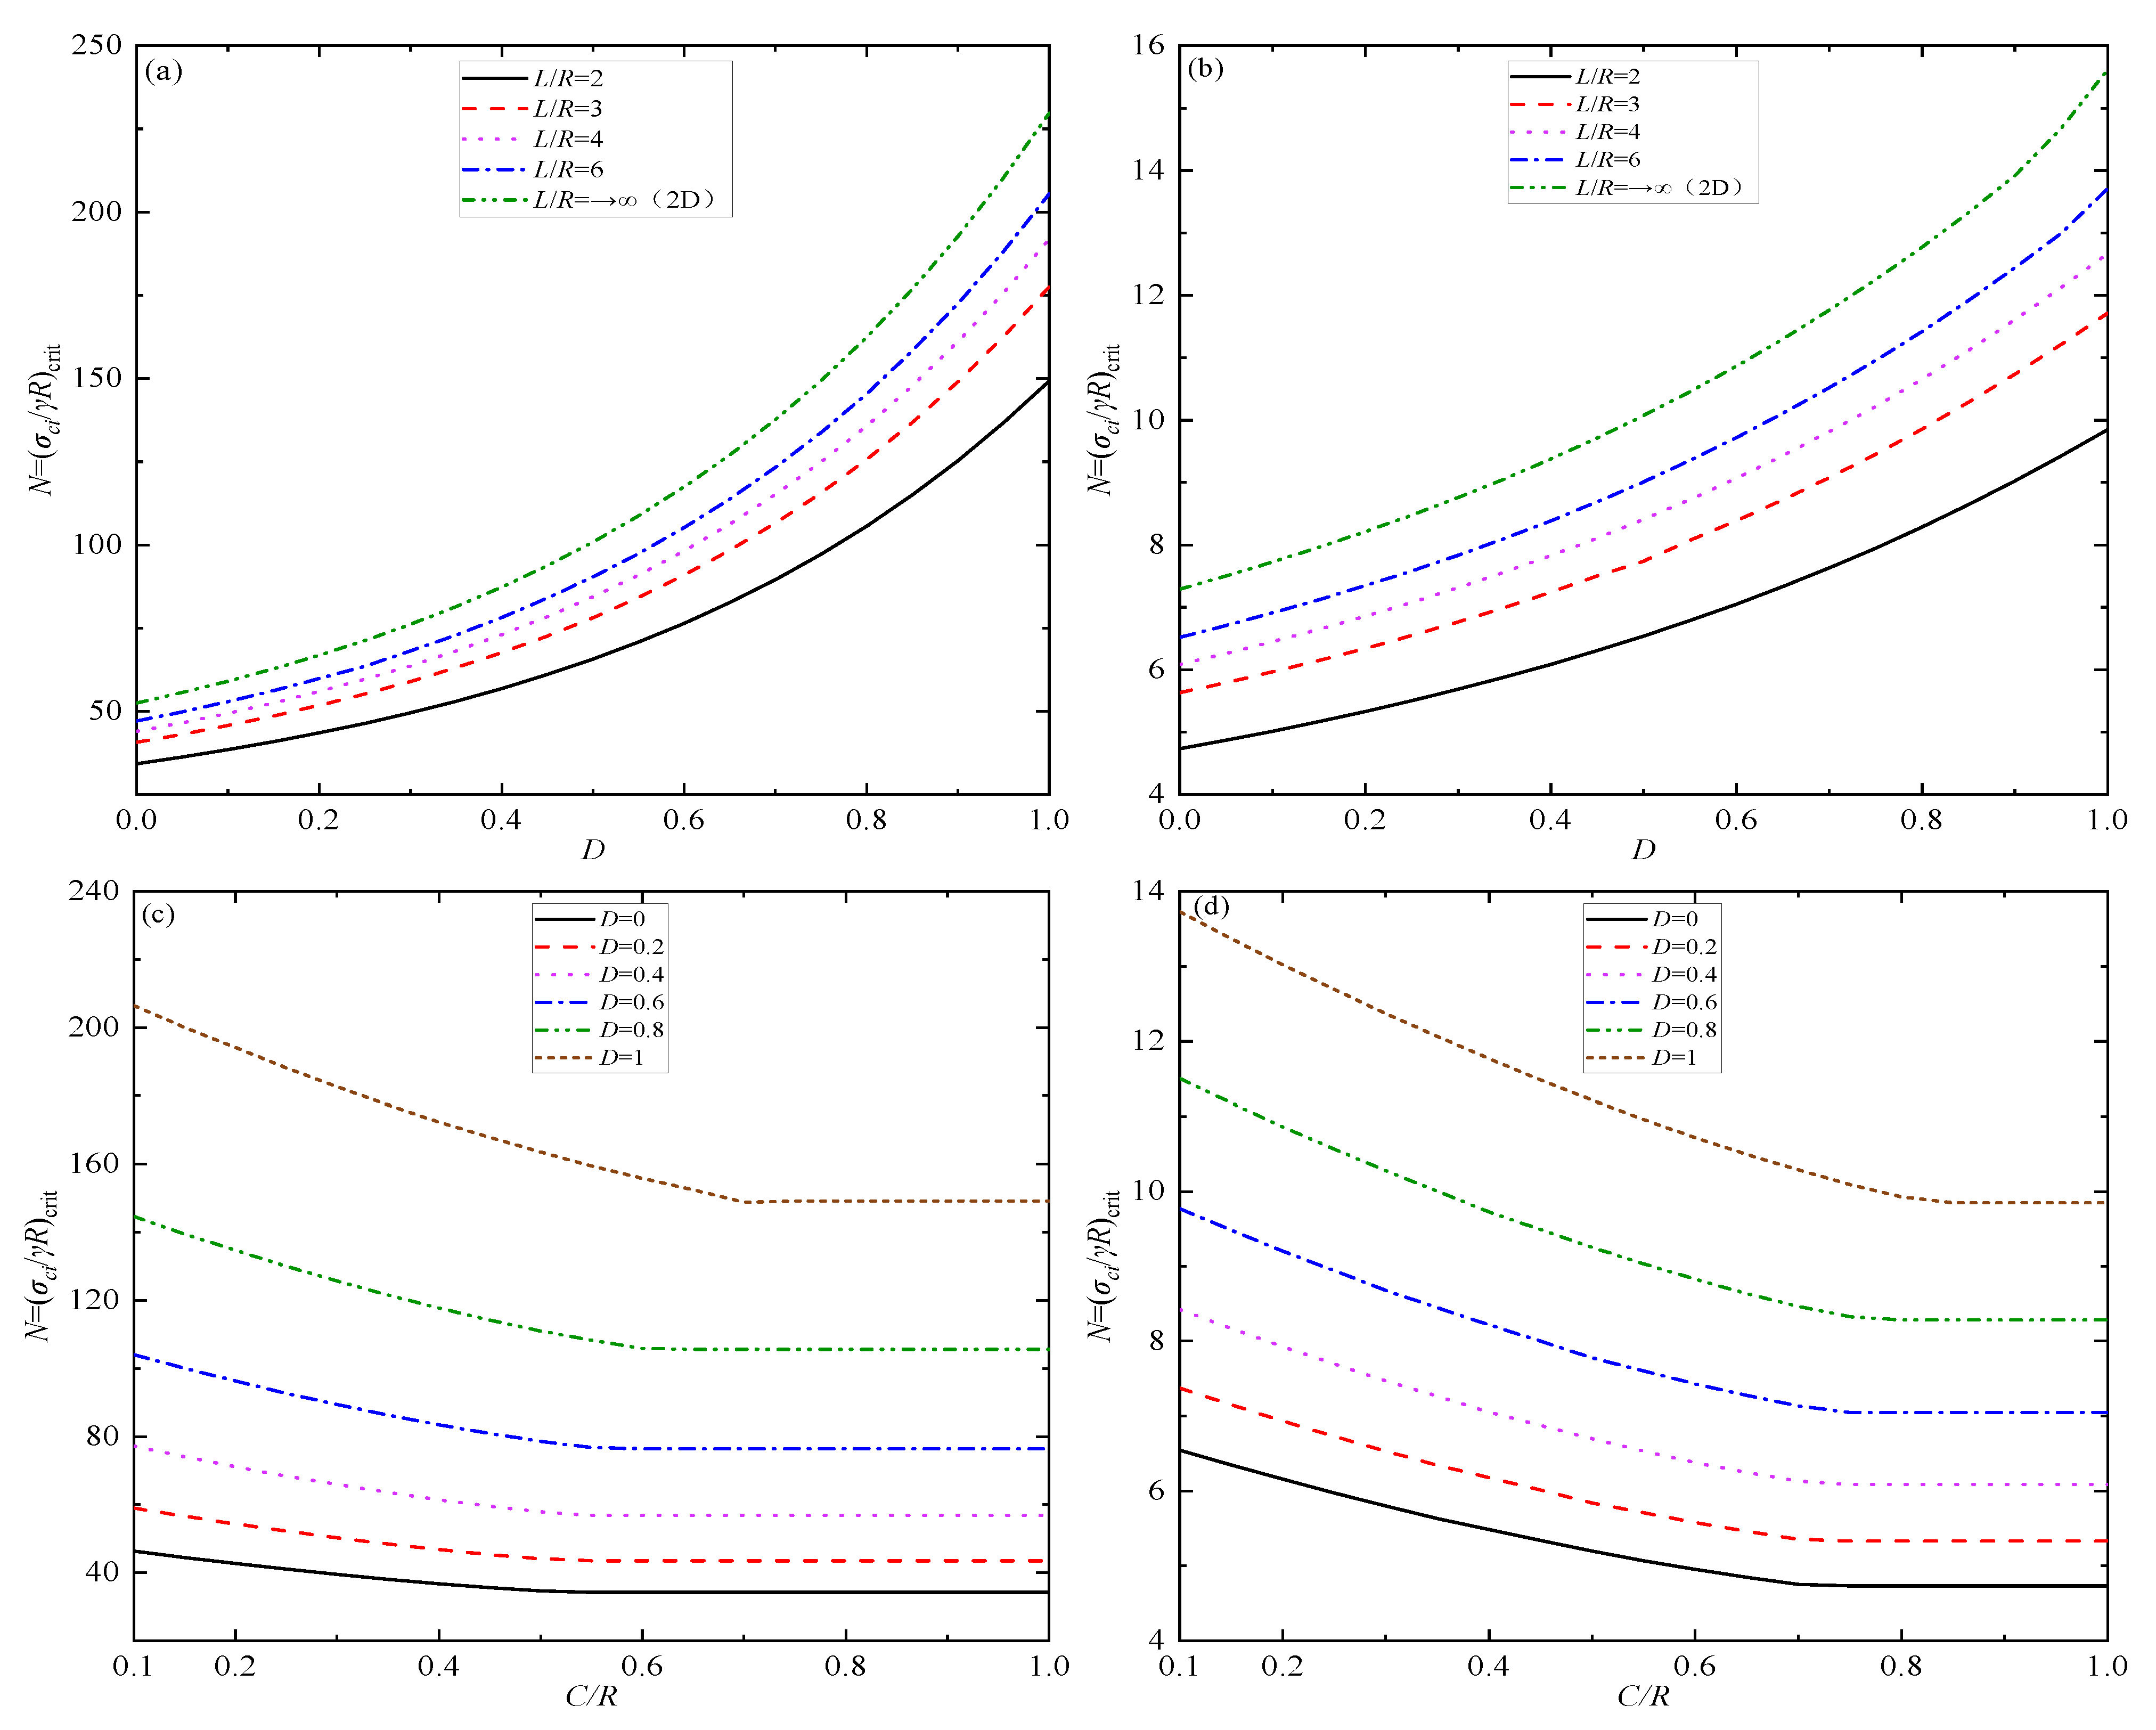
For Figure 7a,b, the cavity length-to-radius ratio L/R is set to 2, 3, 4, 6, and L/R → ∞ (a 2D scenario), with the disturbance factor D varying from 0 to 1. Additionally, the HB parameters are configured as mi = 5 with GSI = 40 in Figure 7a,c, and GSI = 70 in Figure 7b,d, respectively. For Figure 7c,d, the disturbance factor D is set to discrete values of 0, 0.2, 0.4, 0.6, 0.8, and 1. The burial depth ratio C/R is varied within the range of 0.1 to 1.0. The cavity length-to-radius ratio L/R is set to 2, 3, 4, 6, and L/R → ∞ (a two-dimensional scenario).
As can be observed from Figure 7a,b, the stability number N increases gradually with the increase in the disturbance factor D, and this increasing trend becomes more significant as D grows larger. From Figure 7c,d, it can be seen that D not only affects N but also exerts an influence on the critical burial depth ratio of the cavity. With the increase in D, the critical burial depth ratio of the cavity increases, making it more difficult for the cavity to reach the deep-buried condition (a state where the crown failure mechanism does not propagate to the ground surface).

5.2. FoS Solutions

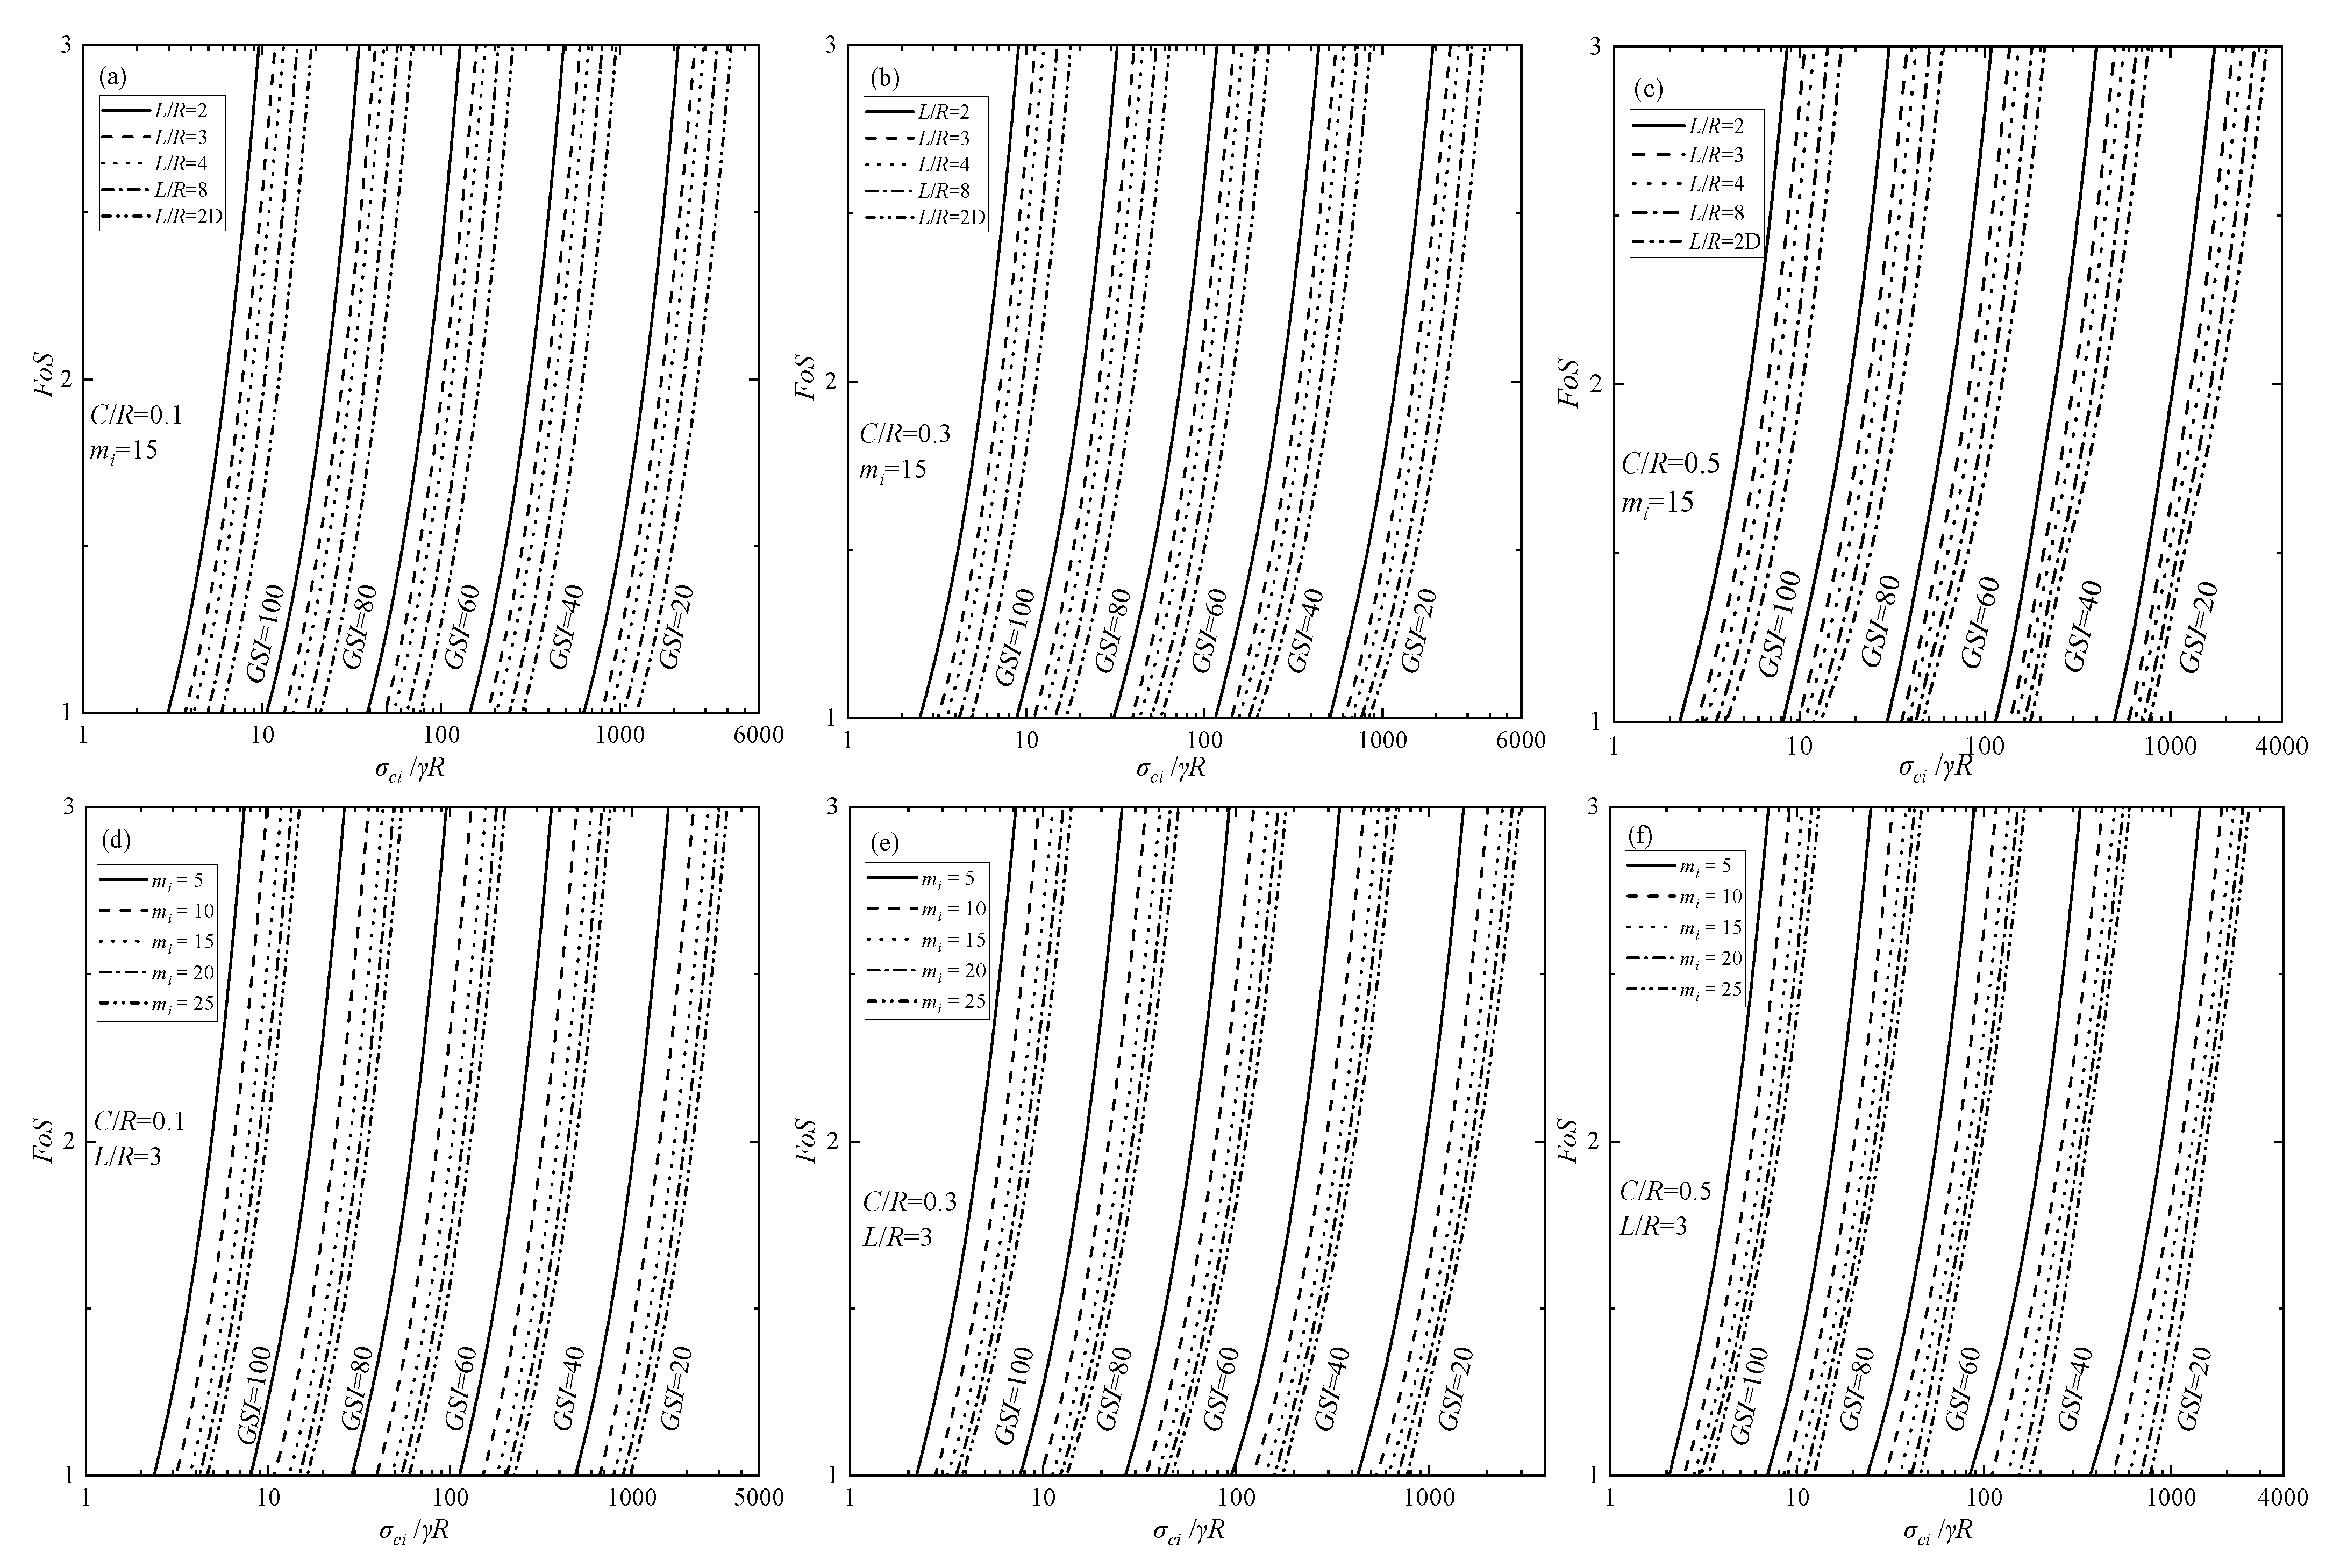
Each row corresponds to a different C/R: C/R = 0.1, 0.3, and 0.5, respectively. Figure 8a–c depict the variation in FoS with σci/γR for mi = 15, GSI = 20, 40, 60, 80, and 100, L/R = 2, 3, 4, 8, and a 2D scenario (L/R → ∞). Figure 8d–f depict the variation in FoS with σci/γR for L/R = 3, GSI = 20, 40, 60, 80, and 100, mi = 5, 10, 15, 20, and 25.
The increase in GSI and the dimensionless strength parameter σci/γR both contribute to an enhancement in the FoS values, indicating a better stability condition. Conversely, increases in L/R and the mi tend to reduce the FoS solutions. Given specific rock mass parameters—the 3D geometric characteristic L/R and the burial depth ratio C/R for a rectangular cavity—it is possible to determine the FoS by referencing the corresponding charts. This facilitates the application of relevant stability assessments in engineering practice.

5.3. Required Supporting Pressure

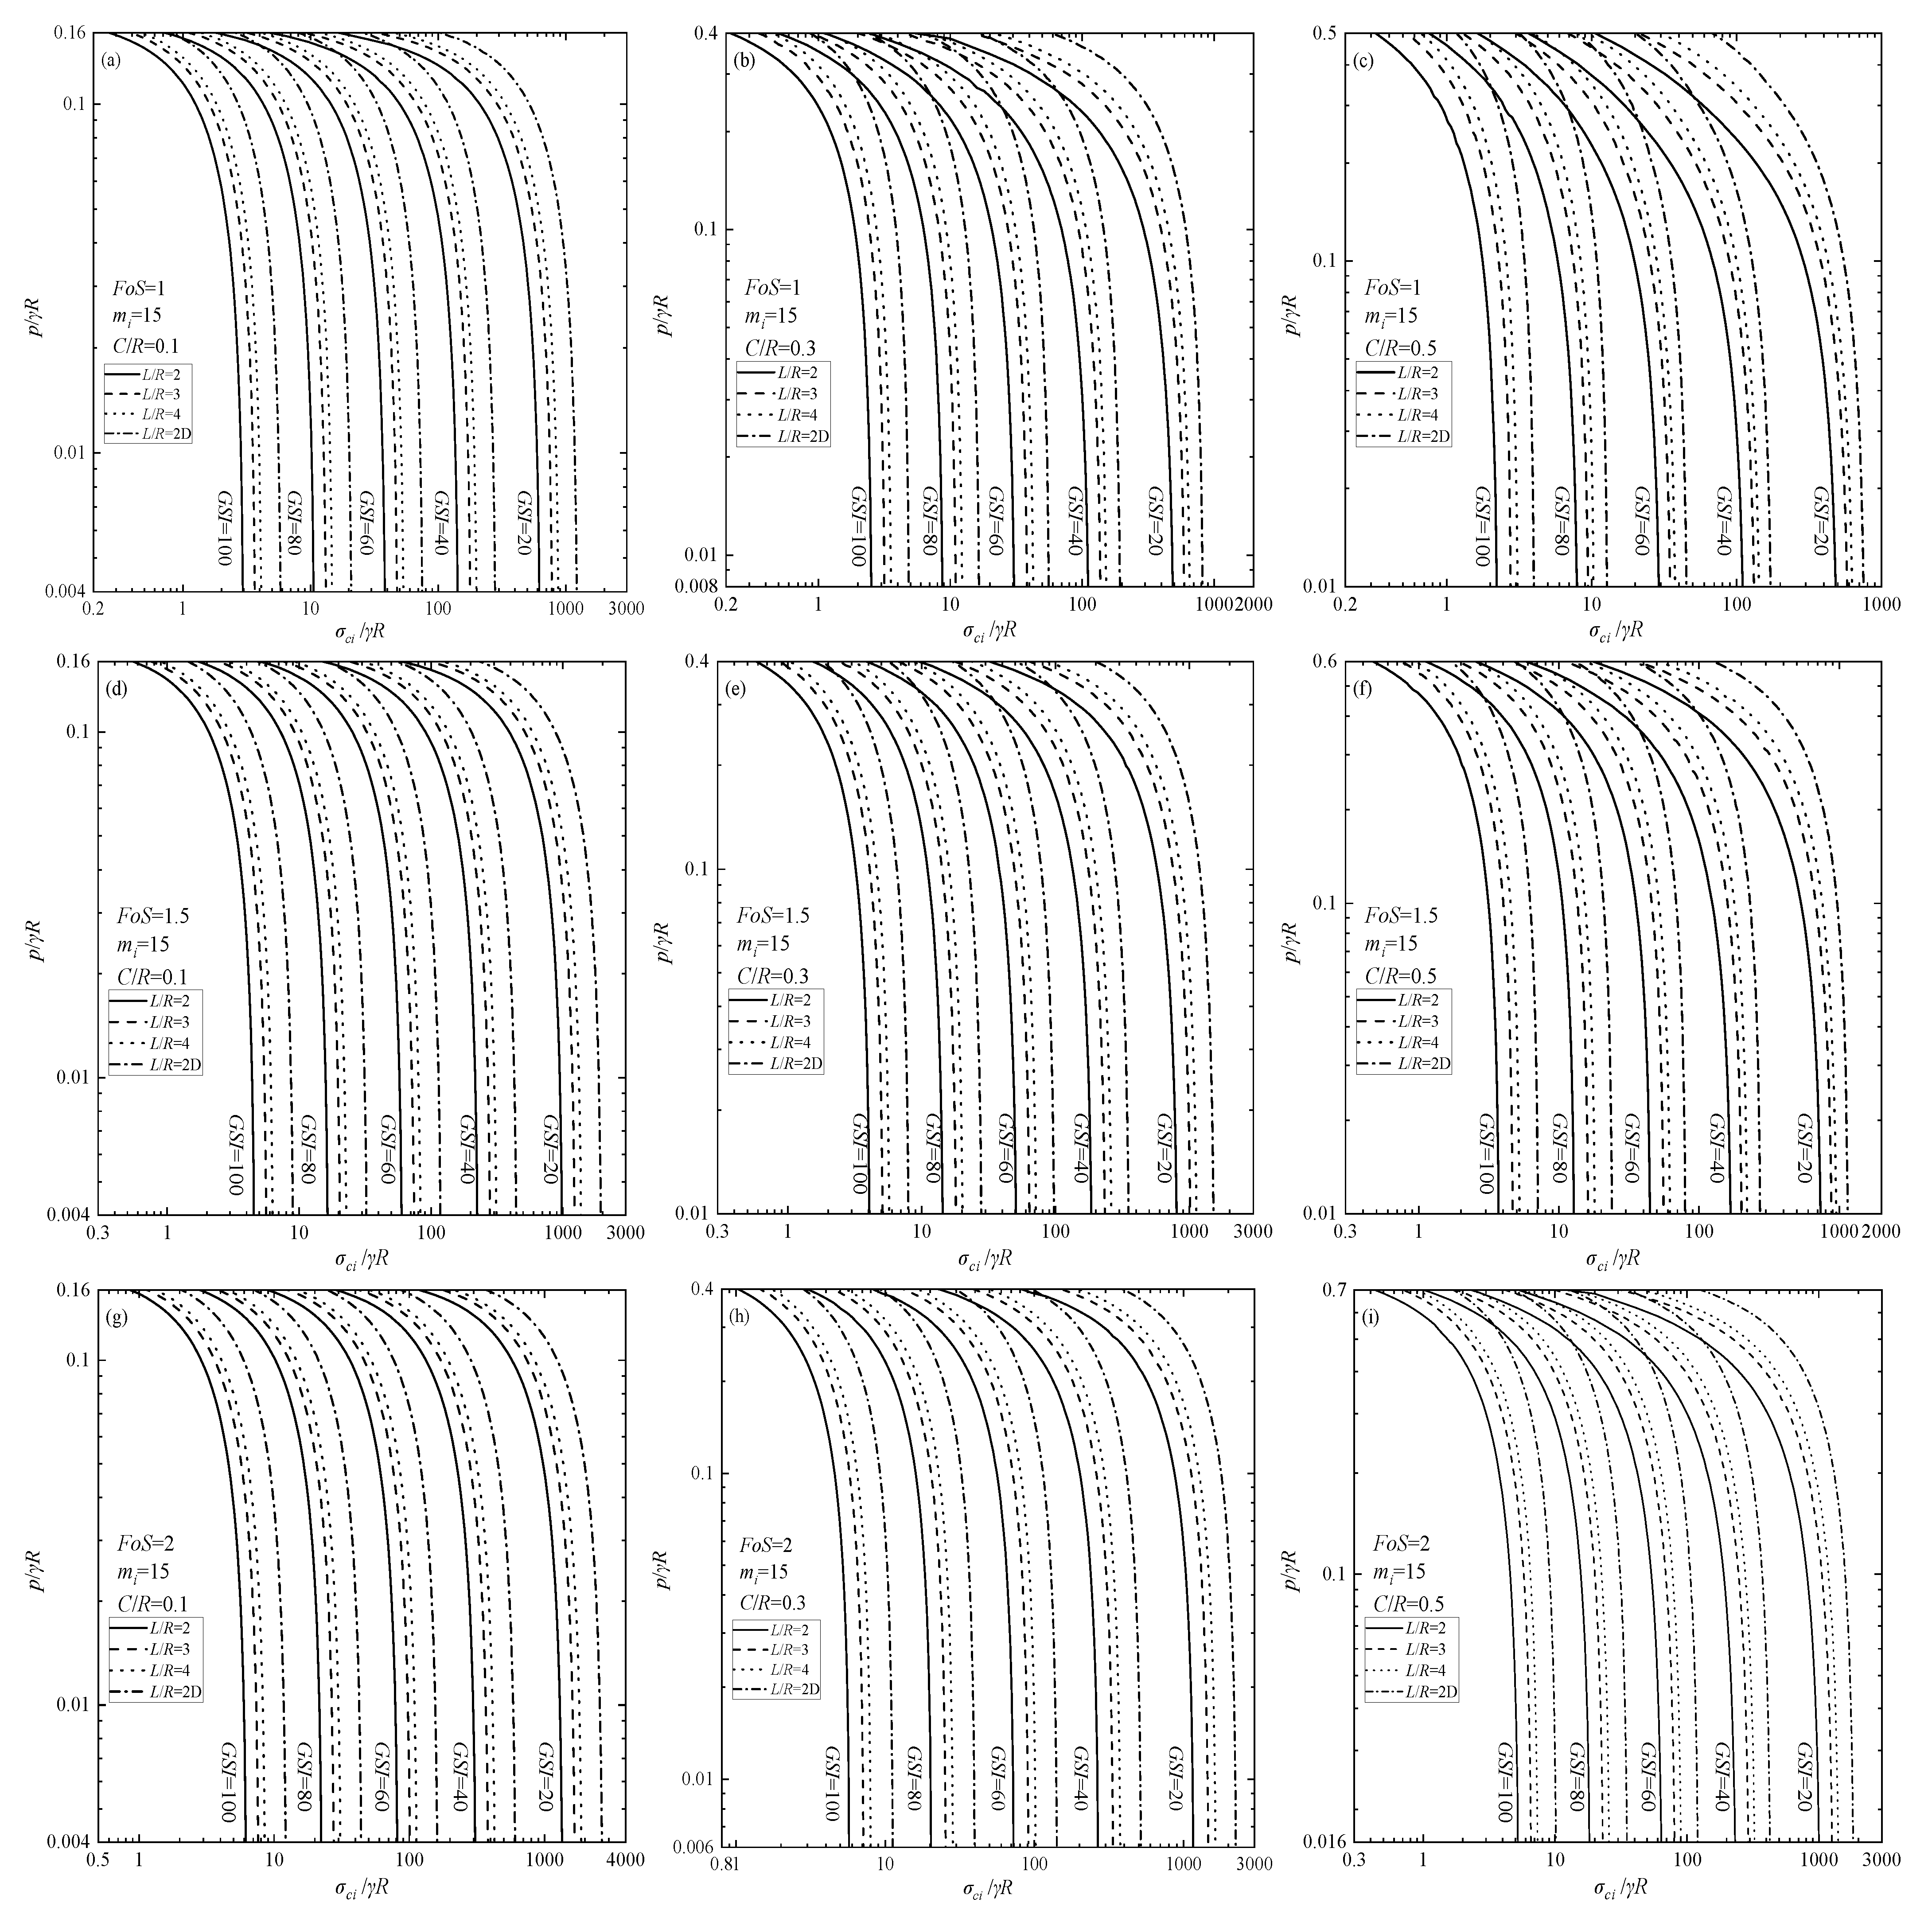
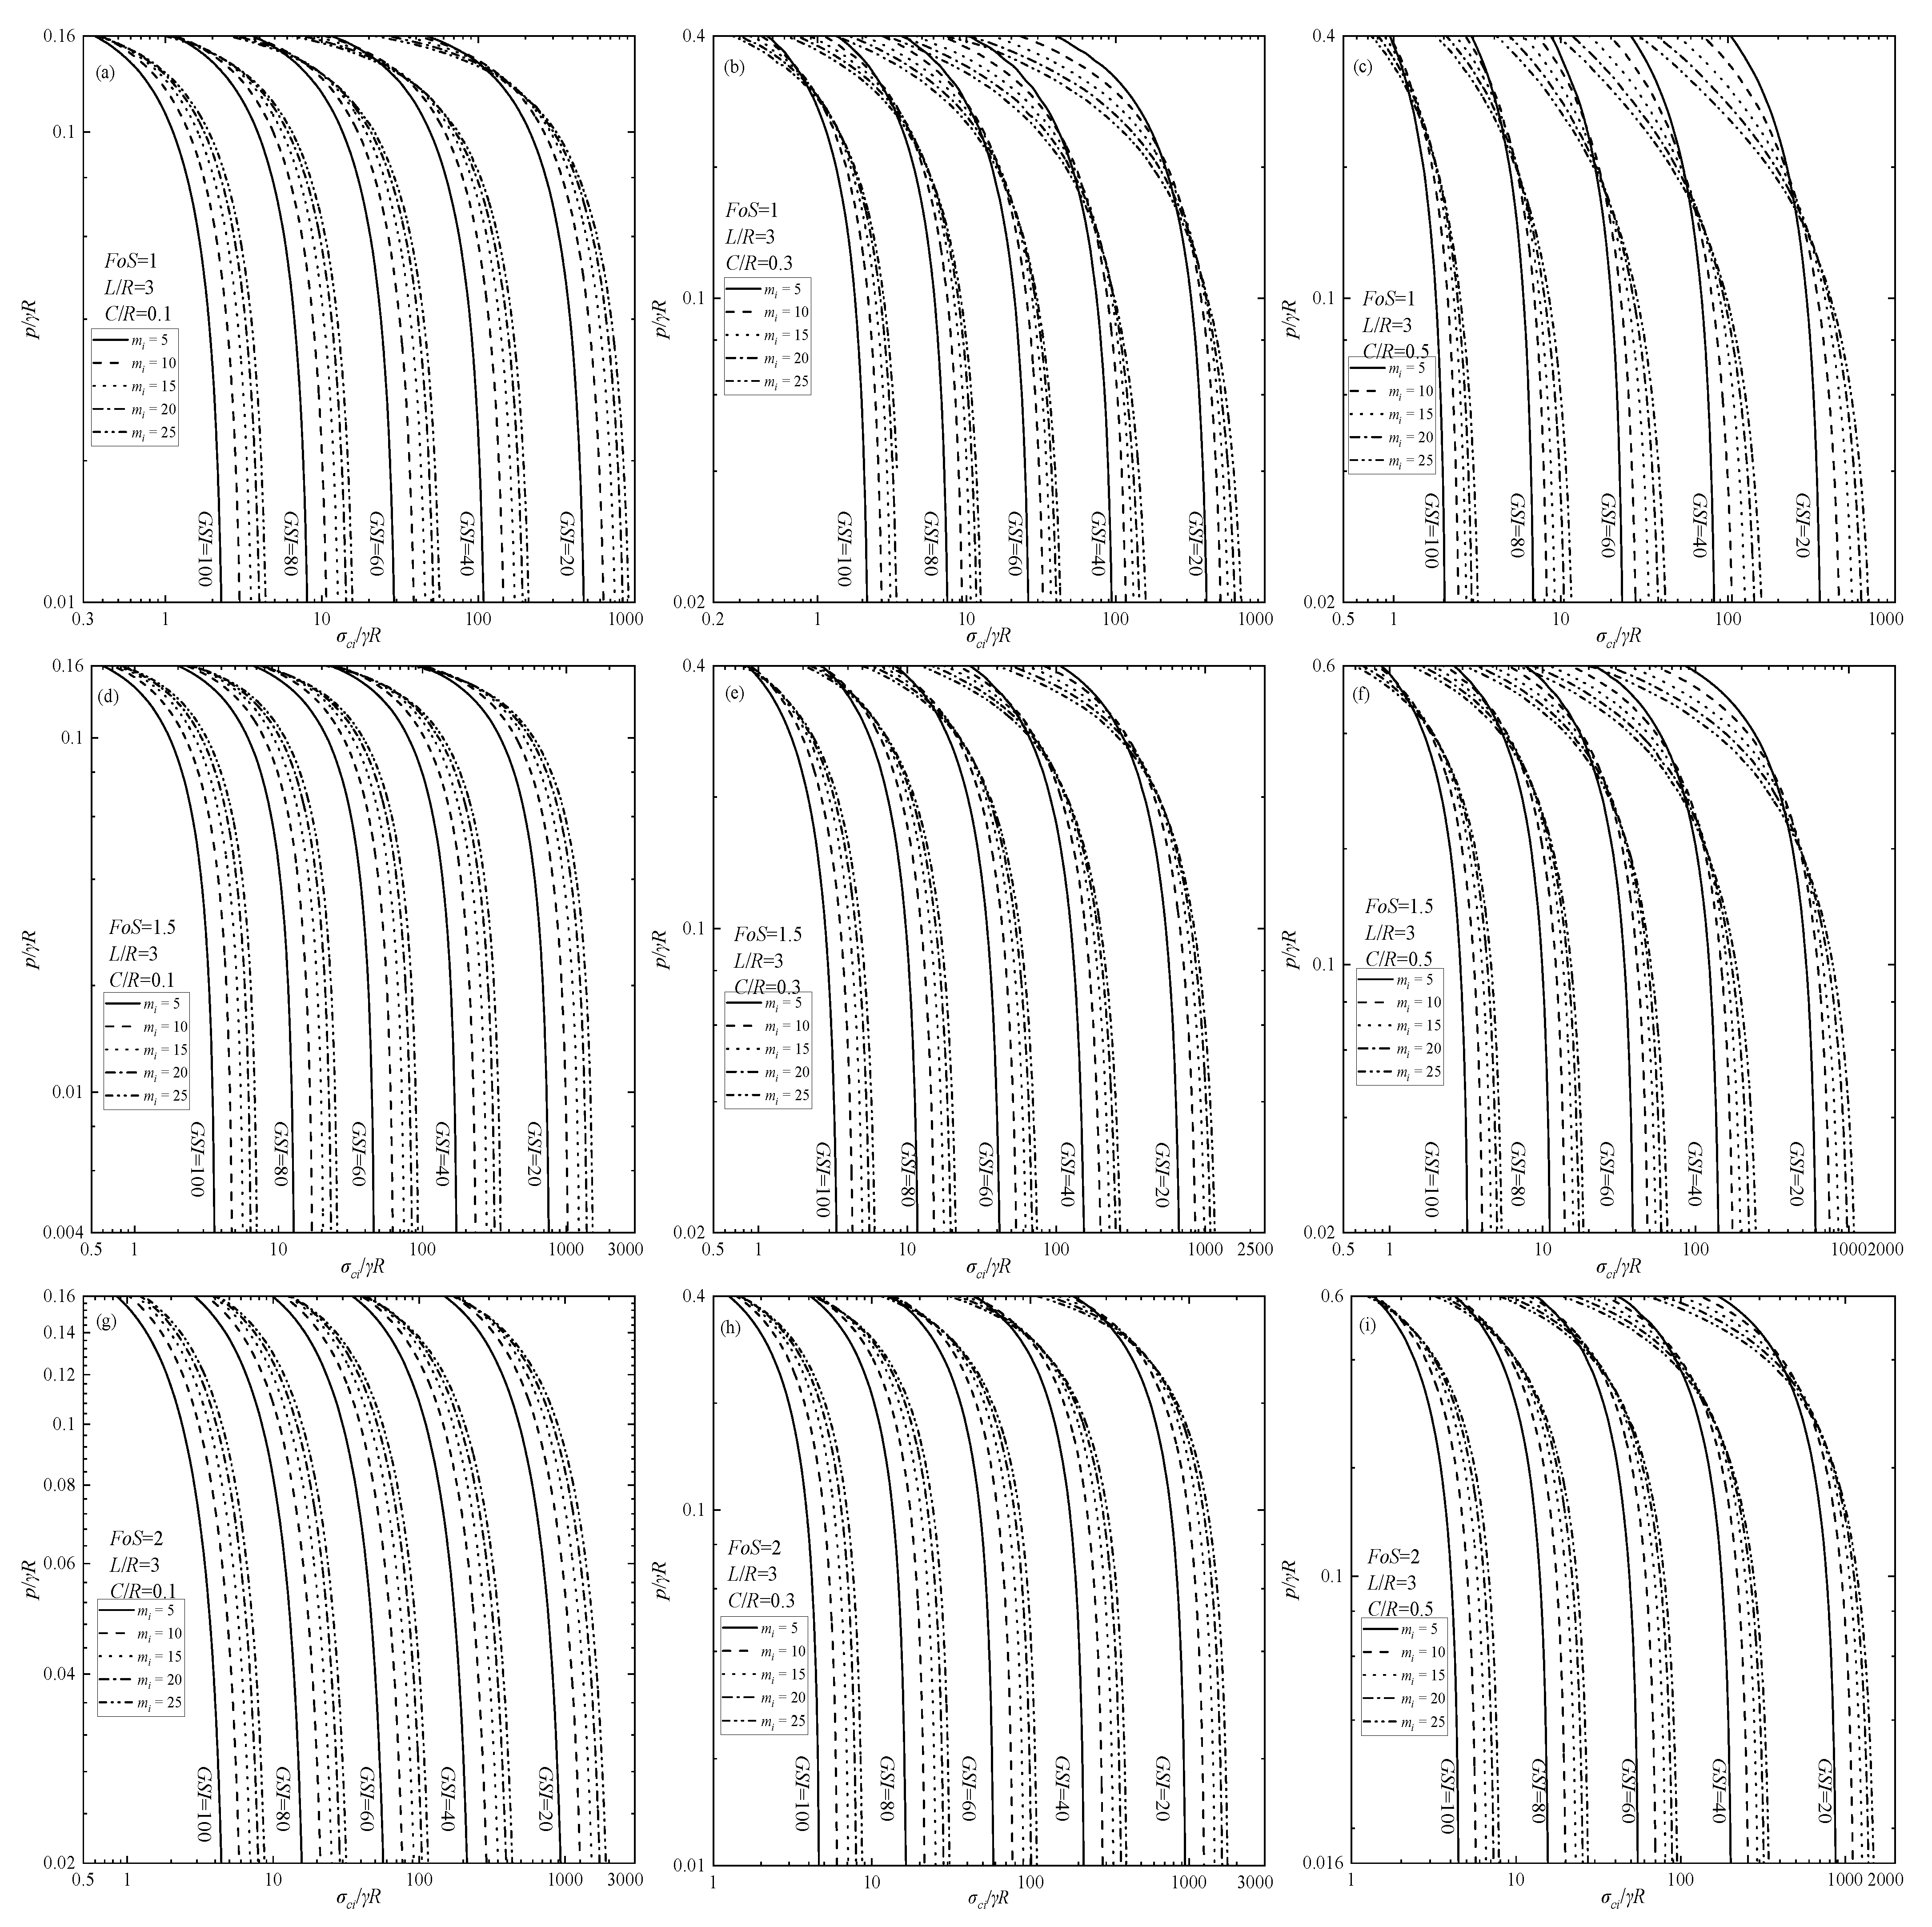
The charts for the required supporting pressures p/γR, varying with σci/γR, are illustrated in Figure 9 and Figure 10. Each column and row correspond to different desired FoS values of FoS = 1, FoS = 1.5, and FoS = 2, and specifically C/R = 0.1, 0.3, and 0.5, respectively. Simultaneously, various GSI values, including 20, 40, 60, 80, and 100, were used. Additionally, ratios L/R = 2, 3, 4, and 2D scenarios under mi = 15, and mi = 5, 10, 15, 20, and 25 under L/R = 3 were taken into account in Figure 9 and Figure 10, respectively.
In Figure 9 and Figure 10, a supporting pressure p = 0 is required under the circumstance that the dimensionless strength index σci/γR equals the stability number N = (σci/γR)crit. When the strength parameter σci/γR is significantly greater than the stability number, it may be possible for the cavity crown to maintain the selected FoS without the need for any supporting pressure. It is also clear that as the index σci/γR increases, there is a gradual reduction in the required supporting pressure to achieve the target FoS. For a given desired FoS, the other related parameters show opposite trends for the FoS solutions and the required supporting pressure: p increases with increasing L/R and with decreasing σci/γR and GSI. The larger the σci/γR, the faster the required supporting pressure decreases. However, an interesting trend emerges: increases in GSI and mi under a smaller σci/γR both contribute to reductions in the required supporting pressure to attain the desired FoS. However, with the increase in strength parameters, there is an interesting observation: when the strength parameter σci/γR reaches a certain threshold, the augmentation of mi actually results in an increase in the required supporting pressure to achieve the FoS. This phenomenon has become more pronounced with smaller GSI and FoS, but greater σci/γR and buried depth ratio C/R values. The influence of these parameters needs to be taken into account to determine the optimal support structure when addressing the engineering design problems of shallow-buried cavities.

5.4. Application Example

The design charts presented in Figure 8, Figure 9 and Figure 10 are very convenient for engineers to obtain the FoS and the required supporting pressure. Two application examples are presented below to demonstrate the application of the stability charts in Figure 8, Figure 9 and Figure 10.
(1)
Application Examples for the FoS Design Charts
Consider a rectangular cavity with a half-width of R = 5 m and a section length of L = 15 m. The distance from the cavity top to the ground is 2.5 m, i.e., C/R = 0.5. The rock mass properties/parameters are as follows: γ = 26 kN/m3, σci = 20 MPa, GSI = 40, mi = 15, D = 0. The dimensionless number σci/γR is calculated as σci/γR = 20,000/26/5 = 153.8. From Figure 8c, it can be seen that the achievable factor of safety (FoS) of the cavity without support is approximately 1.12.
(2)
Application Examples for the Required Supporting Pressure Charts
For a rectangular cavity with a width of B = 10 m (R = 5 m) and a length of L = 15 m, where the distance from the cavity top to the ground is 2.5 m (C/R = 0.5), and the rock mass parameters are γ = 26 kN/m3, σci = 20 MPa, GSI = 20, mi = 15, D = 0, the dimensionless number σci/γR is calculated as σci/γR = 20,000/26/5 = 153.8. Considering desired FoS = 1, 1.5, and 2, it can be determined that p/γR = 0.2454, 0.4274, and 0.5486, respectively, referring to Figure 9c,f,i. Therefore, the required supporting pressures are p = 31.902 kPa, 55.562 kPa, and 71.318 kPa for FoS = 1, 1.5, and 2, respectively.

6. Conclusions

A collapse mechanism for shallow-buried rectangular cavity crowns in rock surroundings based on the GHB criterion is developed in this study, with the deeply buried collapse mechanism treated as a special case. Through solving and optimizing the energy balance equation, the optimal upper-bound solutions for the stability number, the FoS, and the required supporting pressures under desired FoS values are obtained. The effectiveness of the proposed approach is validated by comparison. The effects of the buried depth, along with the geological strength parameters and 3D geometric characteristics, on the stability of rectangular cavity crowns are discussed. Stability charts concerning the FoS and the required supporting pressures for shallowly buried rectangular cavities are presented. Conclusions can be drawn from this research as follows:
(1)
The increases in the buried depth ratio C/R and the strength index GSI have significant beneficial effects on the stability of cavity crowns by reducing the stability number, while increases in mi and L/R weaken this stability by increasing the stability number. Once C/R reaches the critical buried depth, the cavity crown transitions to a deeply buried case; further increases in C/R will no longer impact the stability of the cavity crowns.
(2)
From a FoS perspective, increases in mi and L/R are poised to result in a reduction in the FoS for the cavity crowns. Conversely, the increases in C/R and GSI can improve the stability of the cavity crown, indicating that the crown of a shallowly buried cavity exhibits worse stability compared to that of a deeply buried one.
(3)
From the required supporting pressure, it can be seen that the increase in L/R will obviously reduce the crown stability by increasing the required supporting pressures. The increase in the dimensionless index σci/γR not only results in an opposite trend in the required supporting pressure, but also affects the mode of influence of mi on the required supporting pressure. The required supporting pressure decreases with the increase of mi under a smaller σci/γR. On the contrary, as σci/γR increases, the required supporting pressure increases with the increase of mi.

Author Contributions

Z.W.: Methodology, Validation, Formal analysis, Data curation, Writing, original draft, Visualization; Z.Y.: Validation, Writing—original draft, Software, Investigation, Formal analysis; Q.R.: Validation, Writing—original draft, Software, Investigation, Formal analysis; Z.H.: Methodology, Software, Validation, Formal analysis, Data curation, Writing, original draft, Visualization, Writing; J.X.: Validation, Formal analysis, Data curation, Writing, original draft, Supervision. All authors have read and agreed to the published version of the manuscript.

Funding

This work was supported by the National Natural Science Foundation of China (52208409) and the Natural Science Foundation of Chongqing City (CSTB2025NSCQ-GPX0408). The financial supports are greatly appreciated.

Data Availability Statement

The datasets in the current study are available from the corresponding author upon reasonable request.

Conflicts of Interest

Author Zihan Yang was employed by the company China Construction Fifth Engineering Division Corp., Ltd. The remaining authors declare that the research was conducted in the absence of any commercial or financial relationships that could be construed as a potential conflict of interest.

Nomenclature

List of Symbols
σnThe normal stressσ1Major effective principal stress
τThe shear stressσ3Minor effective principal stress
δThe fracture anglembHoek–Brown constant for rock mass
σciThe uniaxial compressive strength of the rockaHoek–Brown constant for rock mass
GSIThe Geological Strength IndexSLateral surface area of a right cone
miContingent upon the rock typeσtIsotropic tensile strength
DThe disturbance parameterftReduced tensile strength
λRatio of the minor axis to the major axis of an ellipsedThe energy dissipation per unit area on the collapse surface
vThe velocity change vectorLjLength of the generatrix of the jth cone
αjInclination angle of jth generatrixWpThe rate of work performed by the supporting pressure
ηIndependent variable angleNThe stability number
pSupporting pressureFoSFactor of safety
WThe external powerτdDemand on shear strength needed for the limit equilibrium
DintThe internal dissipation powerσndThe normal stress
γThe unit weight of the rock massCThe burial depth
KSymbols for rectangular cavitiesLCavity excavation width
sHoek–Brown constant for rock massWγRate of work performed by unit weight of geomaterials
S The boundary in limit analysis ε i j * The strain rate
V The volume in the limit analysis σ i j * The stress

Appendix A

The kinematic approach of limit analysis mandates deriving the stability measures by equating the external work rates to the internal energy dissipation along the collapse surface. To calculate the work rates on the shallow-buried cavity crown—namely, the work rate of the collapsing rock mass Wγ, the work rate of the supporting pressure Wp (only needed to calculate the required supporting pressure), and the internal energy dissipation D—these quantities must be calculated individually. The collapse mechanism depicted in Figure 1 and Figure 2 is divided into two distinct segments along the vertical direction. When the kth block is in contact with the ground surface, the collapse block forms an incomplete collapse mechanism, referring to a shallow-buried case. The detailed calculation process of the work rates for shallow-buried rectangular cavities is as follows.
The work rates by the collapse rock mass of the 3D end caps and the insert plane can be expressed as:
W γ 3 D = π 3 λ γ v j = 1 k 1 cot 2 α k h j z j 3 h j z j + 1 3 + π 3 λ γ v cot 2 α k h k z k 3 h k R + C 3
and
W γ 2 D = l γ v j = 1 k S j S Δ B G B k + 1 R 2 2
Therefore, the sum of the work rate from the rock mass can be expressed as:
W γ = W γ 3 D + W γ 2 D
For shallow-buried rectangular cavities, the internal energy dissipation rate of the 3D block depicted in Figure 2 can be expressed as follows:
D 3 D = 4 v j = 1 k 1 z j z j + 1 0 π / 2 f j ( z , θ ) d θ d z + z k R + C 0 π / 2 f k ( z , θ ) d θ d z
The internal energy dissipation of the insertion block with a width of l is presented in the following way:
D 2 D = l v j = 1 k 1 τ j cos δ j σ n j sin δ j L j + l v τ k cos δ k σ n k sin δ k L B k B G
where Lj represents the length of the line segment B1B2 in Figure 1.
The sum of the internal energy dissipation can be expressed as follows:
D = D 3 D + D 2 D
The work rate exerted by supporting pressure on a 3D block and a 2D inserted plane is defined by:
W p 3 D = p v π λ R 2
and
W p 2 D = 2 l p v R
Therefore, the total work rate from the supporting pressure can be expressed as:
W p = W p 3 D + W p 2 D
Thereafter, the stability number and the FoS can be derived from the energy balance equations Wγ = D, and the required supporting pressure p is obtained from Wγ = D + Wp.

References

  1. Fraldi, M.; Guarracino, F. Analytical solutions for collapse mechanisms in tunnels with arbitrary cross sections. Int. J. Solids Struct. 2010, 47, 216–223. [Google Scholar] [CrossRef]
  2. Qin, C.; Chian, S.C.; Yang, X. 3D limit analysis of progressive collapse in partly weathered Hoek–Brown rock banks. Int. J. Geomech. 2017, 17, 04017011. [Google Scholar] [CrossRef]
  3. Qin, C.; Li, Y.; Yu, J.; Chian, S.C.; Liu, H. Closed-form solutions for collapse mechanisms of tunnel crown in saturated non-uniform rock surrounds. Tunn. Undergr. Space Technol. 2022, 126, 104529. [Google Scholar] [CrossRef]
  4. Yu, L.; Lyu, C.; Wang, M.; Xu, T. Three-dimensional upper bound limit analysis of a deep soil-tunnel subjected to pore pressure based on the nonlinear Mohr-Coulomb criterion. Comput. Geotech. 2019, 112, 293–301. [Google Scholar] [CrossRef]
  5. Yang, X.; Huang, F. Collapse mechanism of shallow tunnel based on nonlinear Hoek–Brown failure criterion. Tunn. Undergr. Space Technol. 2011, 26, 686–691. [Google Scholar] [CrossRef]
  6. Fraldi, M.; Cavuoto, R.; Cutolo, A.; Guarracino, F. Stability of tunnels according to depth and variability of rock mass parameters. Int. J. Rock Mech. Min. Sci. 2019, 19, 222–229. [Google Scholar] [CrossRef]
  7. Liang, J.; Cui, J.; Lu, Y.; Li, Y.; Shan, Y. Limit analysis of shallow tunnels collapse problem with optimized solution. Appl. Math. Model. 2022, 109, 98–116. [Google Scholar] [CrossRef]
  8. Park, D.; Michalowski, R.L. Roof stability in deep rock tunnels. Int. J. Rock Mech. Min. Sci. 2019, 124, 104139. [Google Scholar] [CrossRef]
  9. Park, D.; Michalowski, R.L. Roof stability in flat-ceiling deep rock cavities and tunnels. Eng. Geol. 2022, 303, 106651. [Google Scholar] [CrossRef]
  10. Fraldi, M.; Guarracino, F. Limit analysis of collapse mechanisms in cavities and tunnels according to the Hoek–Brown failure criterion. Int. J. Rock Mech. Min. Sci. 2009, 46, 665–673. [Google Scholar] [CrossRef]
  11. Yang, X.; Huang, F. Three-dimensional failure mechanism of a rectangular cavity in a Hoek–Brown rock medium. Int. J. Rock Mech. Min. Sci. 2013, 61, 189–195. [Google Scholar] [CrossRef]
  12. Xu, J.S.; Wang, X.R.; Du, X.L. Seismic active earth pressure for 3D earth retaining structure following a nonlinear failure criterion. Comput. Geotech. 2024, 165, 105902. [Google Scholar] [CrossRef]
  13. Qin, C.; Zhou, J. On the seismic stability of soil slopes containing dual weak layers: True failure load assessment by finite-element limit-analysis. Acta Geotech. 2023, 18, 3153–3175. [Google Scholar] [CrossRef]
  14. Qin, C.; Li, Y.; Shi, Y.; Dai, C.; Zhang, W. On the dynamic stability of tunnel roof in nonuniform rock/soils characterized by nonlinear Mohr envelope. Tunn. Undergr. Space Technol. 2024, 145, 105490. [Google Scholar] [CrossRef]
  15. Huang, F.; Yang, X.; Ling, T. Prediction of collapsing region above deep spherical cavity roof under axis-symmetrical conditions. Rock Mech. Rock Eng. 2014, 47, 1511–1516. [Google Scholar] [CrossRef]
  16. Fraldi, M.; Guarracino, F. Limit analysis of progressive tunnel failure of tunnels in Hoek-Brown rock masses. Int. J. Rock Mech. Min. Sci. 2022, 50, 170–173. [Google Scholar] [CrossRef]
  17. Hoek, E.; Brown, E.T. Empirical strength criterion for rock masses. J. Geotech. Eng. Div. 1980, 106, 1013–1035. [Google Scholar] [CrossRef]
  18. Hoek, E.; Carranza-Torres, C.T.; Corkum, B. Hoek-Brown failure criterion–2002 edition. Geotech. Eng. 2022, 19, 26–38. [Google Scholar]
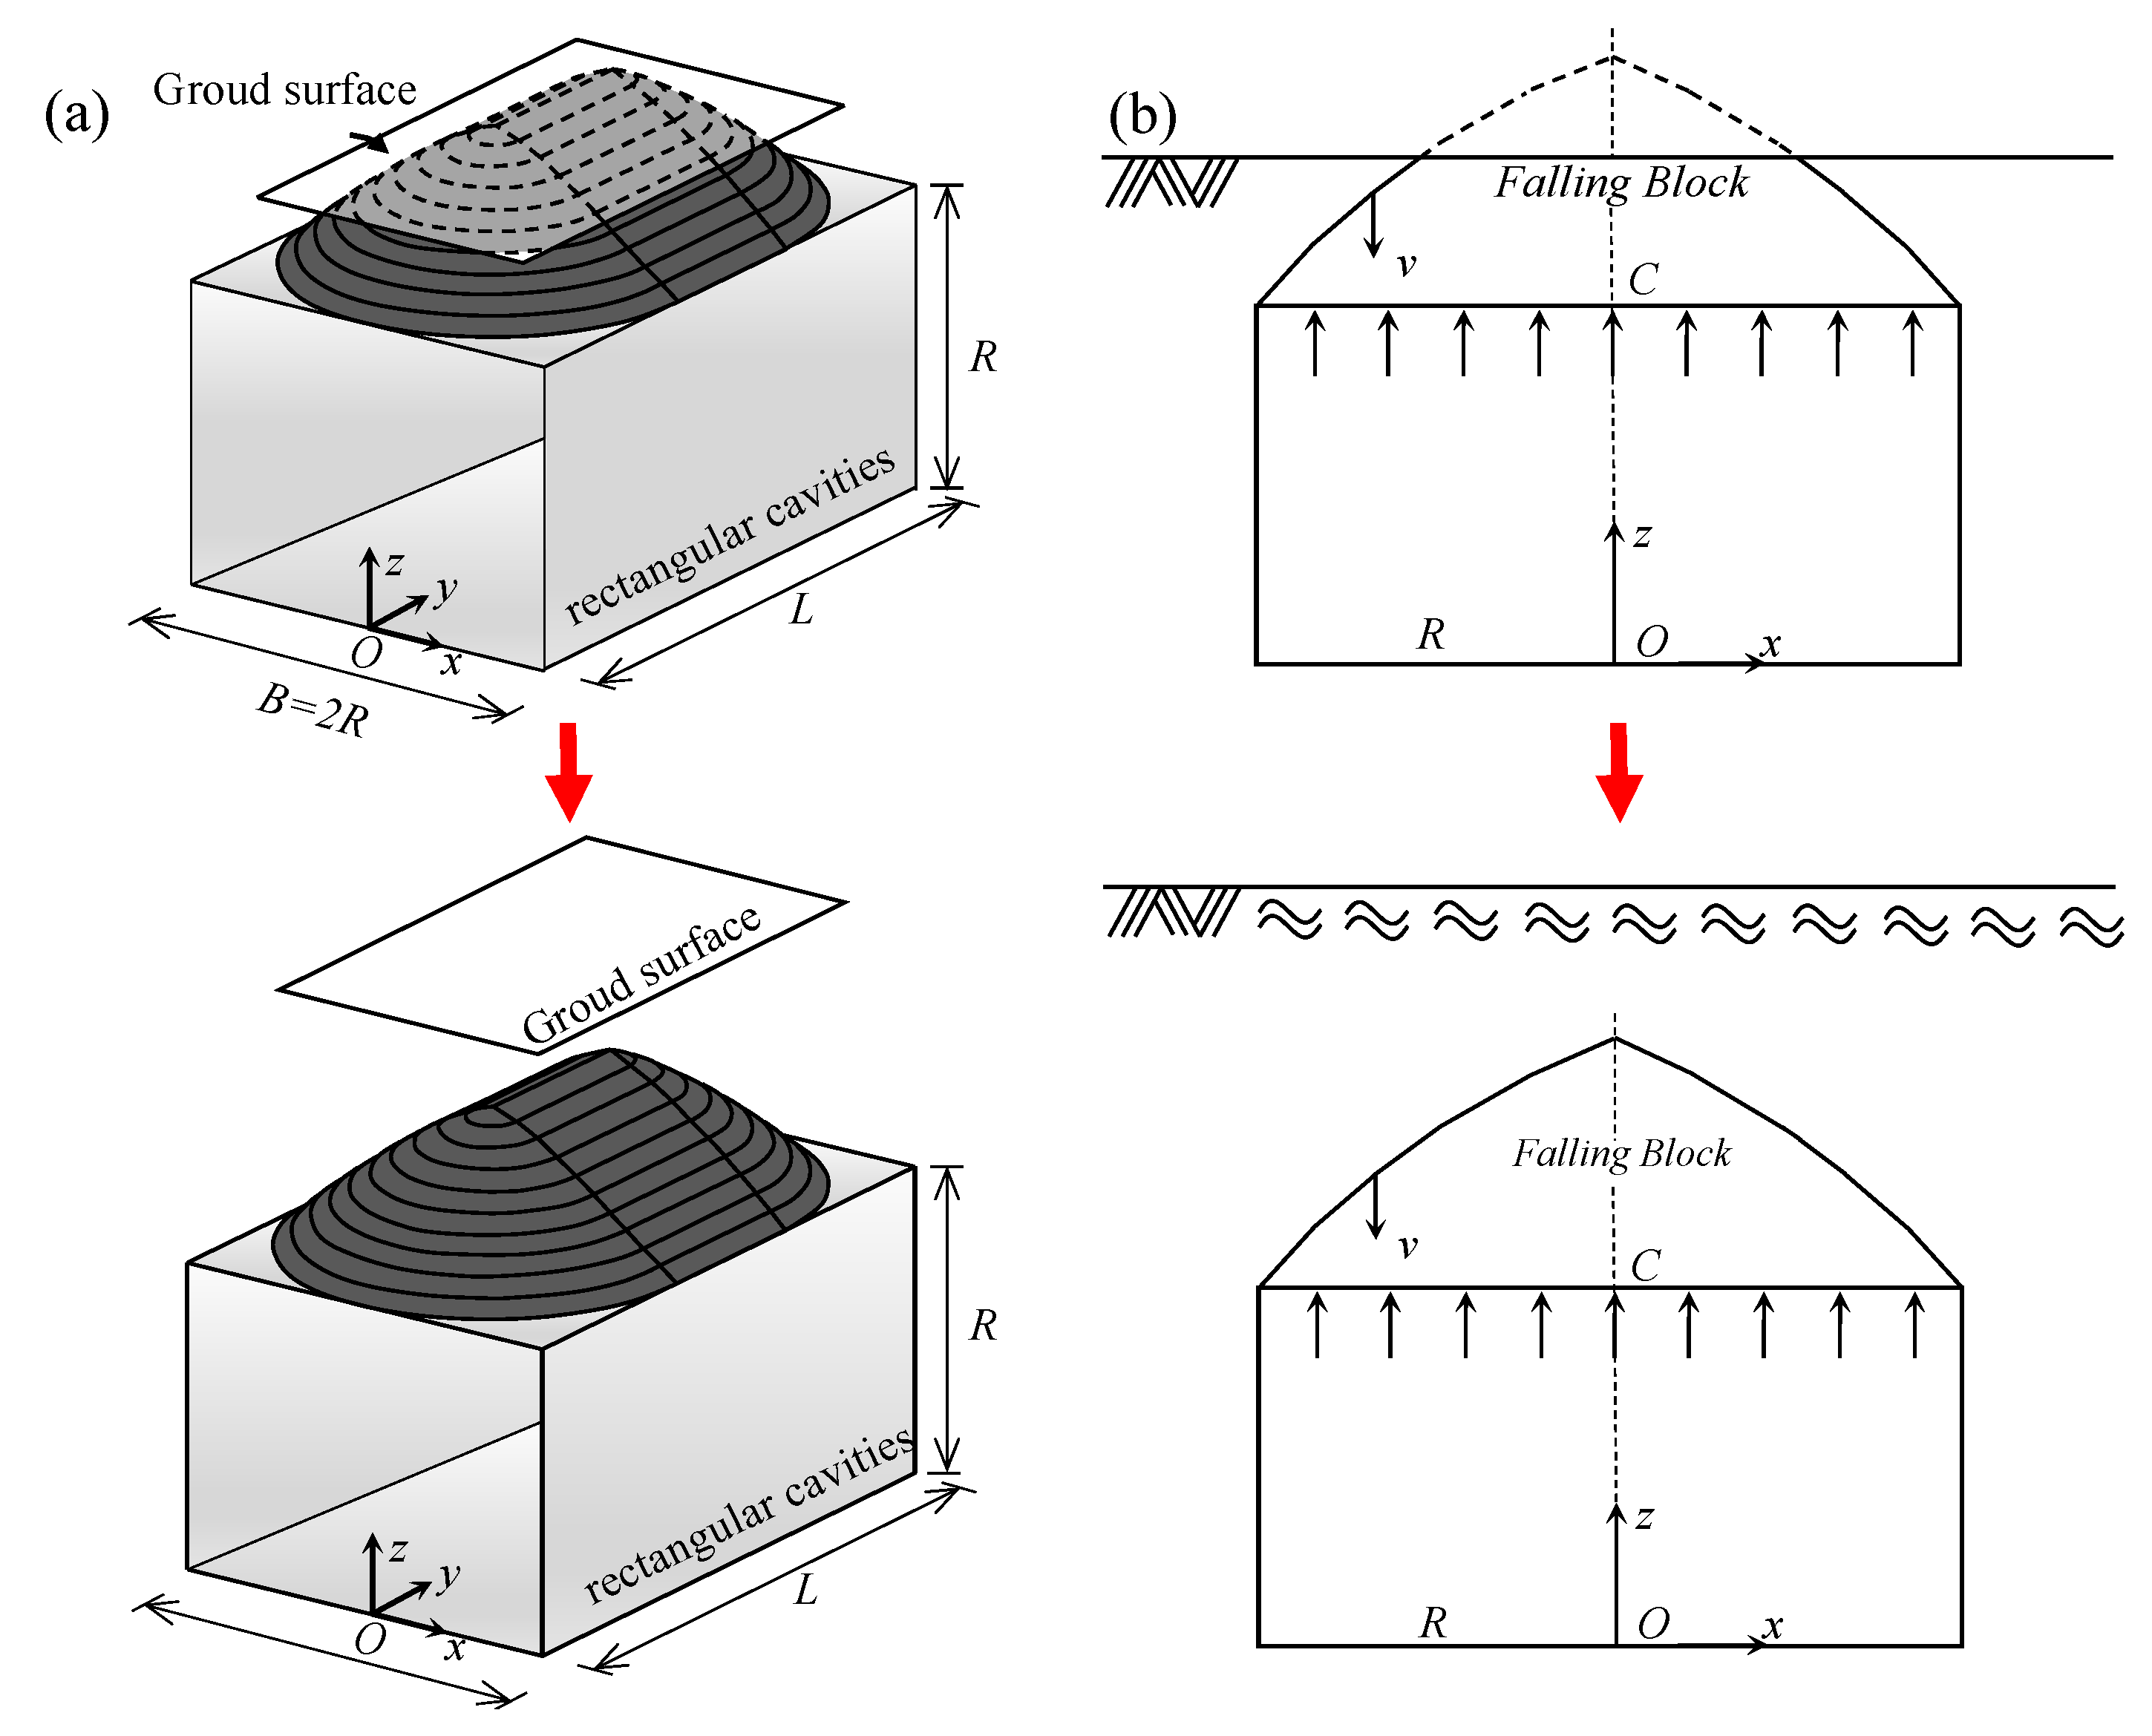
Figure 1. The 3D collapse profile for shallow-buried rectangular cavity crowns in rock strata: (a) schematics of 3D cavity crowns; (b) corresponding vertical cross-sections on the xOz plane.
Buildings 15 04151 g001
Figure 2. Collapse mechanism of a shallow-buried 3D cavity crown in rock strata: (a) plane view; (b) vertical xOz plane; and (c) longitudinal yOz plane.
Buildings 15 04151 g002
Figure 3. Collapse mechanism of a 3D shallow-buried rectangular cavity crown: (a) 3D collapse mechanism without plane insert; (b) 3D collapse mechanism with insert plane; (c) cross-section of the insert plane.
Buildings 15 04151 g003
Figure 4. FLAC3D 7.00 numerical simulation results.
Buildings 15 04151 g004
Figure 5. Stability number for a shallow-buried rectangular cavity crown. (a) mi = 5, GSI = 40; (b) mi = 5, GSI = 70; (c) mi = 10, GSI = 100; (d) mi = 20, GSI = 100.
Buildings 15 04151 g005
Figure 6. Stability number for a 3D shallow-buried rectangular cavity crown versus mi with L/R = 2. (a) GSI = 60; (b) GSI = 100 [9].
Buildings 15 04151 g006
Figure 7. Stability number for a shallow-buried rectangular cavity crown under. (a) mi = 5, GSI = 40; (b) mi = 5, GSI = 70; (c) mi = 5, GSI = 40; (d) mi = 5, GSI = 70.
Buildings 15 04151 g007
Figure 8. Stability charts of FoS for shallow-buried rectangular cavity crowns. (a) C/R = 0.1; (b) C/R = 0.3; (c) C/R = 0.5 under mi = 15; (d) C/R = 0.1; (e) C/R = 0.3; (f) C/R = 0.5 under L/R = 3.
Buildings 15 04151 g008
Figure 9. Variation in critical supporting pressure in a rectangular shallow-buried cavity. (a) C/R = 0.1; (b) C/R = 0.3; (c) C/R = 0.5 under FoS = 1; (d) C/R = 0.1; (e) C/R = 0.3; (f) C/R = 0.5 under FoS = 1.5; (g) C/R = 0.1; (h) C/R = 0.3; (i) C/R = 0.5 under FoS = 2.
Buildings 15 04151 g009
Figure 10. Variation in required supporting pressure in a rectangular shallow-buried cavity. (a) C/R = 0.1; (b) C/R = 0.3; (c) C/R = 0.5 under FoS = 1; (d) C/R = 0.1; (e) C/R = 0.3; (f) C/R = 0.5 under FoS = 1.5; (g) C/R = 0.1; (h) C/R = 0.3; (i) C/R = 0.5 under FoS = 2.
Buildings 15 04151 g010
Table 1. Present stability numbers under different buried cases.
L/RmiC/RSolutionsGSI
20Error40Error60Error80Error100Error
250.1Present research404.7432.7%92.6632.7%24.8634.2%6.9235.7%1.9636.1%
0.3341.6912.1%78.9513.0%21.7417.4%6.2222.0%1.8025.0%
0.5300.001.6%69.220.1%19.223.8%5.6210.2%1.6615.3%
Deep-buried299.621.6%68.382.1%18.102.3%4.982.4%1.402.7%
Park and Michalowski [9]304.80 69.84 18.52 5.10 1.44
150.1Present research638.8624.3%146.3824.3%39.2427.3%10.8630.0%3.0232.4%
0.3506.271.5%115.262.1%31.261.4%8.976.5%2.5813.2%
0.5506.541.5%115.322.0%30.182.1%8.181.7%2.260.8%
Deep-buried506.541.5%115.322.0%30.182.1%8.181.7%2.241.7%
Park and Michalowski [9]514.00 117.72 30.82 8.42 2.28
250.1Present research783.9018.7%179.7219.2%48.4222.2%13.4426.3%3.7430.0%
0.3650.401.5%147.991.8%38.681.9%10.640.0%3.065.5%
0.5650.761.4%148.081.7%38.701.9%10.441.9%2.842.9%
Deep-buried650.761.4%148.081.7%38.701.9%10.441.9%2.842.9%
Park and Michalowski [9]660.30 150.76 39.44 10.64 2.90
350.1Present research502.7840.5%108.9433.0%30.7841.6%8.5642.7%2.4244.6%
0.3430.0220.2%99.2021.1%27.2225.2%7.7629.3%2.2433.3%
0.5371.463.8%86.285.3%24.2211.4%7.0617.7%2.0823.8%
Deep-buried356.320.4%81.320.8%21.521.0%5.960.6%1.661.2%
Park and Michalowski [9]357.76 81.94 21.74 6.00 1.68
150.1Present research799.6232.3%182.8832.7%48.9235.4%13.50176.1%3.7640.3%
0.3612.431.3%141.722.9%39.308.7%11.28130.7%3.2521.3%
0.5600.600.7%137.160.5%35.920.5%9.7298.8%2.825.2%
Deep-buried600.600.7%137.160.5%35.920.5%4.870.4%2.660.7%
Park and Michalowski [9]604.58 137.80 36.14 4.89 2.68
250.1Present research984.8626.8%225.6827.6%60.6020.0%16.7834.5%4.6637.2%
0.3774.010.3%176.110.4%46.151.0%13.306.6%3.8513.2%
0.5774.000.3%176.120.4%45.023.4%12.400.6%3.380.6%
Deep-buried774.000.3%176.120.4%46.020.6%12.400.6%3.380.6%
Park and Michalowski [9]776.68 176.88 46.26 12.48 3.40
2D50.1Present research795.6672.6%182.0872.3%48.8474.2%13.6276.0%3.8677.1%
0.3650.9641.2%150.9642.8%42.0049.8%12.1156.5%3.5262.5%
0.5522.0613.3%123.3016.7%35.7827.6%10.7238.6%3.2247.7%
Deep-buried458.920.4%105.000.7%27.840.7%7.680.8%2.160.9%
Park and Michalowski [9]460.88 105.70 28.04 7.74 2.18
150.1Present research1246.6260.3%285.46143.0%76.7864.6%21.3268.9%5.9471.7%
0.3837.377.67%197.5369.2%57.0622.3%16.8433.4%4.9442.8%
0.5774.680.4%176.740.4%46.340.6%13.003.0%4.0617.3%
Deep-buried774.660.4%176.740.4%46.340.6%12.540.6%3.440.6%
Park and Michalowski [9]777.70 177.46 46.64 12.62 3.46
250.1Present research1517.0652.5%348.5444.8%94.3459.0%26.2664.1%7.3468.3%
0.3994.890.1%226.850.4%62.615.5%19.0719.2%5.7131.0%
0.5998.720.4%228.280.6%59.720.7%16.100.6%4.380.5%
Deep-buried998.720.4%228.280.6%59.720.7%16.100.6%4.380.5%
Park and Michalowski [9]994.88 226.84 59.32 16.00 4.36
Table 2. Present FoS solutions under different buried cases.
σci/γRGSImiC/RSolutionsL/R
2Error3Error4Error2DError
10002050.1Present research2.3529.4%1.9231.4%1.7233.6%1.2442.9%
0.32.5124.6%2.0626.4%1.8628.2%1.4035.5%
0.52.6719.8%2.2021.4%2.0022.8%1.5727.7%
Deep-buried3.340.3%2.810.4%2.600.4%2.180.5%
Park and Michalowski [9]3.33 2.80 2.59 2.17
150.1Present research1.4924.4%1.2226.1%1.1028.1%0.8335.2%
0.31.7411.7%1.4512.1%1.3412.4%1.1212.5%
0.51.941.5%1.640.6%1.540.7%1.290.8%
Deep-buried1.970.0%1.671.2%1.540.7%1.290.8%
Park and Michalowski [9]1.97 1.65 1.53 1.28
250.1Present research1.2319.6%1.0121.7%0.9222.7%0.7228.0%
0.31.511.3%1.280.8%1.200.8%1.011.0%
0.51.540.7%1.290.0%1.200.8%1.011.0%
Deep-buried1.540.7%1.290.0%1.200.8%1.011.0%
Park and Michalowski [9]1.53 1.29 1.19 1.00
406050.1Present research1.5728.6%1.2830.8%1.1532.7%0.8342.0%
0.31.7022.7%1.4024.3%1.2626.3%0.9632.9%
0.51.8117.71.5018.9%1.3719.9%1.0824.5%
Deep-buried2.220.9%1.860.5%1.720.6%1.440.7%
Park and Michalowski [9]2.20 1.85 1.71 1.43
150.1Present research1.0222.7%0.8424.3%0.7626.2%0.5832.6%
0.31.218.3%1.019.0%0.948.7%0.807.0%
0.51.330.8%1.110.0%1.030.0%0.860.0%
Deep-buried1.320.0%1.110.0%1.030.0%0.860.0%
Park and Michalowski [9]1.32 1.11 1.03 0.86
250.1Present research0.8517.5%0.7019.5%0.6421.0%0.5125%
0.31.030.0%0.870.0%0.810.0%0.680.0%
0.51.030.0%0.870.0%0.810.0%0.680.0%
Deep-buried1.030.0%0.870.0%0.810.0%0.680.0%
Park and Michalowski [9]1.03 0.87 0.80 0.67
410050.1Present research2.0030.1%1.6331.1%1.4634.2%1.0443.5%
0.32.0827.3%1.7029.2%1.5430.6%1.1239.1%
0.52.1624.5%1.7726.3%1.6027.9%1.2034.8%
Deep-buried2.870.3%2.410.4%2.230.5%1.861.1%
Park and Michalowski [9]2.86 2.40 2.22 1.84
150.1Present research1.3027.4%1.0629.3%0.9630.9%0.7039.7%
0.31.4419.6%1.1920.7%1.0921.6%0.8526.7%
0.51.5712.3%1.3112.7%1.2013.7%0.9914.7%
Deep-buried1.790.0%1.510.7%1.390.0%1.170.9%
Park and Michalowski [9]1.79 1.50 1.39 1.16
250.1Present research1.0624.8%0.8726.3%0.7927.5%0.5935.2%
0.31.2412.1%1.0312.7%0.9512.8%0.7814.3%
0.51.382.1%1.161.7%1.080.9%0.921.1%
Deep-buried1.410.0%1.190.8%1.100.9%0.921.1%
Park and Michalowski [9]1.41 1.18 1.09 0.91
Table 3. Required supporting pressure p/γR × 103 under various buried cases for a desired FoS = 1.
σci/γRGSImiC/RSolutionsL/R
2Error3Error4Error2DError
2002050.1Present research42.6240.9%52.4253.3%56.9057.7%68.6465.2%
0.375.724.9%107.544.3%122.708.8%161.7618.1%
0.571.630.7%118.935.9%142.736.0%204.893.8%
Deep-buried68.065.7%110.881.2%133.261.0%194.881.3%
Park and Michalowski [9]72.16 112.32 134.60 197.40
150.1Present research51.3634.3%59.0443.3%62.9447.0%72.4654.3%
0.376.861.7%103.340.8%116.421.9%150.065.3%
0.575.893.0%103.570.6%117.880.7%156.941.0%
Deep-buried75.903.0%103.560.6%117.880.7%156.941.0%
Park and Michalowski [9]78.22 104.20 118.70 158.46
250.1Present research51.8827.9%59.1236.8%62.6440.6%72.2047.7%
0.370.1635.2%93.400.1%105.500.1%136.641.0%
0.570.1735.3%93.000.6%104.780.6%136.830.9%
deep-buried70.1835.3%93.000.6%104.780.6%136.840.9%
Park and Michalowski [9]71.96 93.52 105.44 138.06
206050.1Present research17.04 31.3030.7%37.8819.7%55.0853.2%
0.315.78 57.26139.2%77.2463.6%128.589.3%
0.5- 50.92112.7%80.3210.2%159.2035.3%
Deep-buried- 20.9012.7%45.563.5%114.562.7%
Park and Michalowski [9]- 23.94 47.20 117.68
150.1Present research38.4025.9%48.6239.4%53.2844.3%65.4853.4%
0.353.423.0%82.823.3%98.522.9%137.562.1%
0.548.576.3%78.811.7%94.341.4%142.401.3%
Deep-buried48.586.3%78.821.7%94.701.1%138.641.3%
Park and Michalowski [9]51.84 80.20 95.72 140.52
250.1Present research43.2226.1%52.3236.2%56.5040.5%67.5048.8%
0.356.663.2%83.321.6%96.421.5%131.180.5%
0.555.884.5%80.991.3%94.140.9%130.361.2%
Deep-buried55.884.5%80.981.3%94.140.9%130.361.2%
Park and Michalowski [9]58.52 82.02 94.96 131.88
210050.1Present research- 16.08 24.34 46.04
0.3- 26.32 50.46 114.00
0.5- 14.45 51.78 152.23
Deep-buried- - - -
Park and Michalowski [9]- - - -
150.1Present research28.868.3%40.9238.1%46.5046.7%61.1659.4%
0.342.1858.3%78.7219.1%95.889.9%141.106.3%
0.526.410.9%77.9017.9%104.0019.2%172.9214.8%
Deep-buried21.6818.6%63.523.9%85.761.7%147.841.8%
Park and Michalowski [9]26.64 66.10 87.22 150.62
250.1Present research37.7827.8%48.1643.1%52.9248.2%65.4457.4%
0.356.447.8%88.324.3%103.781.6%144.026.2%
0.548.497.4%85.010.4%105.913.7%163.646.6%
Deep-buried48.527.3%82.862.1%101.001.1%151.321.4%
Park and Michalowski [9]52.36 84.66 102.16 153.52
Table 4. Required supporting pressure p/γR × 103 under various buried cases for a desired FoS = 2.
σci/γRGSImiC/RSolutionsL/R
2Error3Error4Error2DError
2002050.1Present research70.1878.8%75.4682.6%77.9684.1%84.3287.1%
0.3175.4647.0%196.2854.8%205.8458.1%230.8864.8%
0.5245.3225.8%285.2134.3%303.6638.1%352.0246.3%
Deep-buried317.5034.0%429.401.2%487.480.7%648.801.1%
Park and Michalowski [9]330.82 434.64 490.76 655.84
150.1Present research74.2469.4%78.7674.4%80.8276.5%86.2280.6%
0.3169.6830.0%190.1438.2%200.0041.9%225.0449.4%
0.5217.7010.2%258.1616.1%277.0219.5%326.4926.6%
Deep-buried236.622.4%306.000.5%342.060.6%440.860.9%
Park and Michalowski [9]242.42 307.58 344.10 444.98
250.1Present research74.2663.1%78.7069.8%80.5472.3%86.1076.9%
0.3160.5420.3%182.0430.1%191.9833.9%218.3242.4%
0.5196.032.7%236.209.3%256.1611.8%305.6517.9%
Deep-buried202.380.5%259.240.5%288.660.6%369.000.9%
Park and Michalowski [9]201.44 260.52 290.32 372.30
206050.1Present research57.1478.7%64.8083.2%68.3284.8%77.5487.9%
0.3144.3046.2%170.0656.0%182.6059.3%214.2866.7%
0.5201.5424.8%249.9435.3%270.4139.8%329.3048.8%
Deep-buried249.007.1%375.582.8%442.721.4%633.361.4%
Park and Michalowski [9]268.04 386.32 448.86 642.62
150.1Present research67.5071.3%73.3076.3%75.9078.3%82.7482.3%
0.3157.4833.1%180.3241.7%190.8845.4%218.7853.2%
0.5205.8512.6%248.3519.8%269.0123.0%321.8531.1%
Deep-buried226.883.7%305.301.4%346.840.7%462.421.1%
Park and Michalowski [9]235.52 309.50 349.40 467.74
250.1Present research69.6266.9%74.9072.3%77.4474.5%83.7479.1%
0.3155.0026.2%177.6434.4%188.4238.0%215.5846.1%
0.5193.937.7%235.8212.9%255.7815.8%309.1022.7%
deep-buried203.343.2%266.401.6%301.840.7%395.881.1%
Park and Michalowski [9]210.04 270.76 303.90 400.12
210050.1Present research48.0082.8%57.3887.6%61.7089.0%73.0291.6%
0.3127.0054.4%156.9266.0%170.7269.5%207.2476.1%
0.5186.6033.0%238.6448.2%262.7453.0%326.9062.2%
Deep-buried247.9011.0%437.025.2%542.263.0%850.341.8%
Park and Michalowski [9]278.50 461.06 558.98 865.78
150.1Present research63.0677.9%69.6282.2%72.6483.8%80.5887.0%
0.3156.9245.1%180.1254.0%191.7457.2%220.5664.5%
0.5217.9623.7%260.1433.6%282.4046.9%336.4645.8%
Deep-buried271.325.0%382.802.3%442.821.1%612.461.3%
Park and Michalowski [9]285.68 391.68 447.62 620.66
250.1Present research67.4074.2%73.1679.0%75.8080.7%82.7284.4%
0.3161.5438.2%184.1247.0%194.5450.5%222.0058.2%
0.5217.2416.9%259.8425.2%279.1729.0%331.2537.6%
Deep-buried252.003.6%342.041.6%390.020.8%524.341.2%
Park and Michalowski [9]261.48 347.68 393.00 530.66
Disclaimer/Publisher’s Note: The statements, opinions and data contained in all publications are solely those of the individual author(s) and contributor(s) and not of MDPI and/or the editor(s). MDPI and/or the editor(s) disclaim responsibility for any injury to people or property resulting from any ideas, methods, instructions or products referred to in the content.