1. Introduction
In some mountainous regions of China, the ground is uneven, and the geology is primarily rocky. Due to the construction needs, blasting is often used to level the terrain. Blasting-induced vibrations can cause irreversible deformations to geomaterials, posing significant risks to adjacent structures [
1,
2,
3]. To solve this problem, it is effective to determine the minimum safety distance of the blasting sources in advance and optimize the blasting scheme in time. These measures are of great significance to ensure the safety of adjacent structures.
Many researchers [
4,
5,
6,
7] have conducted extensive research on this topic using methods of theoretical analysis, model testing, field monitoring and numerical simulations. Influencing factors, degree and mode of the mountain blasting on adjacent structures, especially the strength and durability of the structures, have been studied in detail. Yan et al. [
8] suggest that the particle velocity is a better index for quantifying and describing the blasting vibration intensity than particle displacement or acceleration, as it can exclude the influence of geotechnical factors and be closely related to building damage. Based on the new Hongyan Tunnel in the Chengdu-Chongqing Passenger Dedicated Line, Guan et al. [
9] measured the blasting-induced ground vibrations when the tunnel closely undercrossed the existing buildings on the mountain slope. They found that the safety evaluation should consider the peak vibration velocities of monitoring points at both the shallow side and deep side of the slope, as well as the relationship between the predominant frequency of the blasting and the natural frequency of the buildings. Taking the new Liujiagou Tunnel as the background, Shen et al. [
10] analyzed the influence of blasting on the existing tunnel structures through field monitoring and proposed reasonable blasting parameters to guarantee the safety and normal operation of the existing tunnel. Zheng et al. [
11] conducted in situ tests and numerical simulations to explore the influence of the blasting vibration on the lining of adjacent high-speed railway tunnel. Wu et al. [
12] proposed the vibration safety threshold and control technology for preventing seawater intrusion in coastal tunnels near the fault zone. Moreover, based on the principle of minimum burden at the hole bottom, they came up with a simplified design method for the drill hole [
13] to reduce the influence of blasting on the adjacent structures. This method was applied to practical engineering and obtained satisfying results [
14].
In practical engineering, due to the tight construction schedule and limited budget, it is common to conduct the blasting excavation and concrete pouring simultaneously [
15]. According to the experiences in the rock foundation blasting of the Three Gorges Project, Lu et al. [
16] proposed that the characteristic values of the vibration should be determined by the age of the concrete. Fresher concrete corresponds to a lower vibration velocity that can ensure safety. According to the safety regulations for blasting (GB 6722-2014) [
17] and the standard for allowable vibration of building engineering (GB 50868-2013) [
18], some guidelines are proposed for the safe vibration velocities of concrete at different ages.
Current research mainly uses single methods to analyze the influence of blasting-induced vibrations on adjacent buildings or structures and lacks analysis of its influence on building foundations, especially pile foundations. Moreover, current research does not evaluate the safety vibration velocity for concrete at different ages in underground structures. Especially within the range of 10–50 Hz, the allowable vibration values of the foundation structure affected by blasting construction in the time domain bring great difficulties to engineering design. Based on a liquefied natural gas (LNG) project in Zhejiang, China, this paper investigates the influence of mountain blasting on the vibration of piles under the storage tank through in situ blasting tests and numerical simulations. The safety evaluation index for piles during the entire construction process is studied to provide references for the evaluation of similar projects.
2. Project Overview
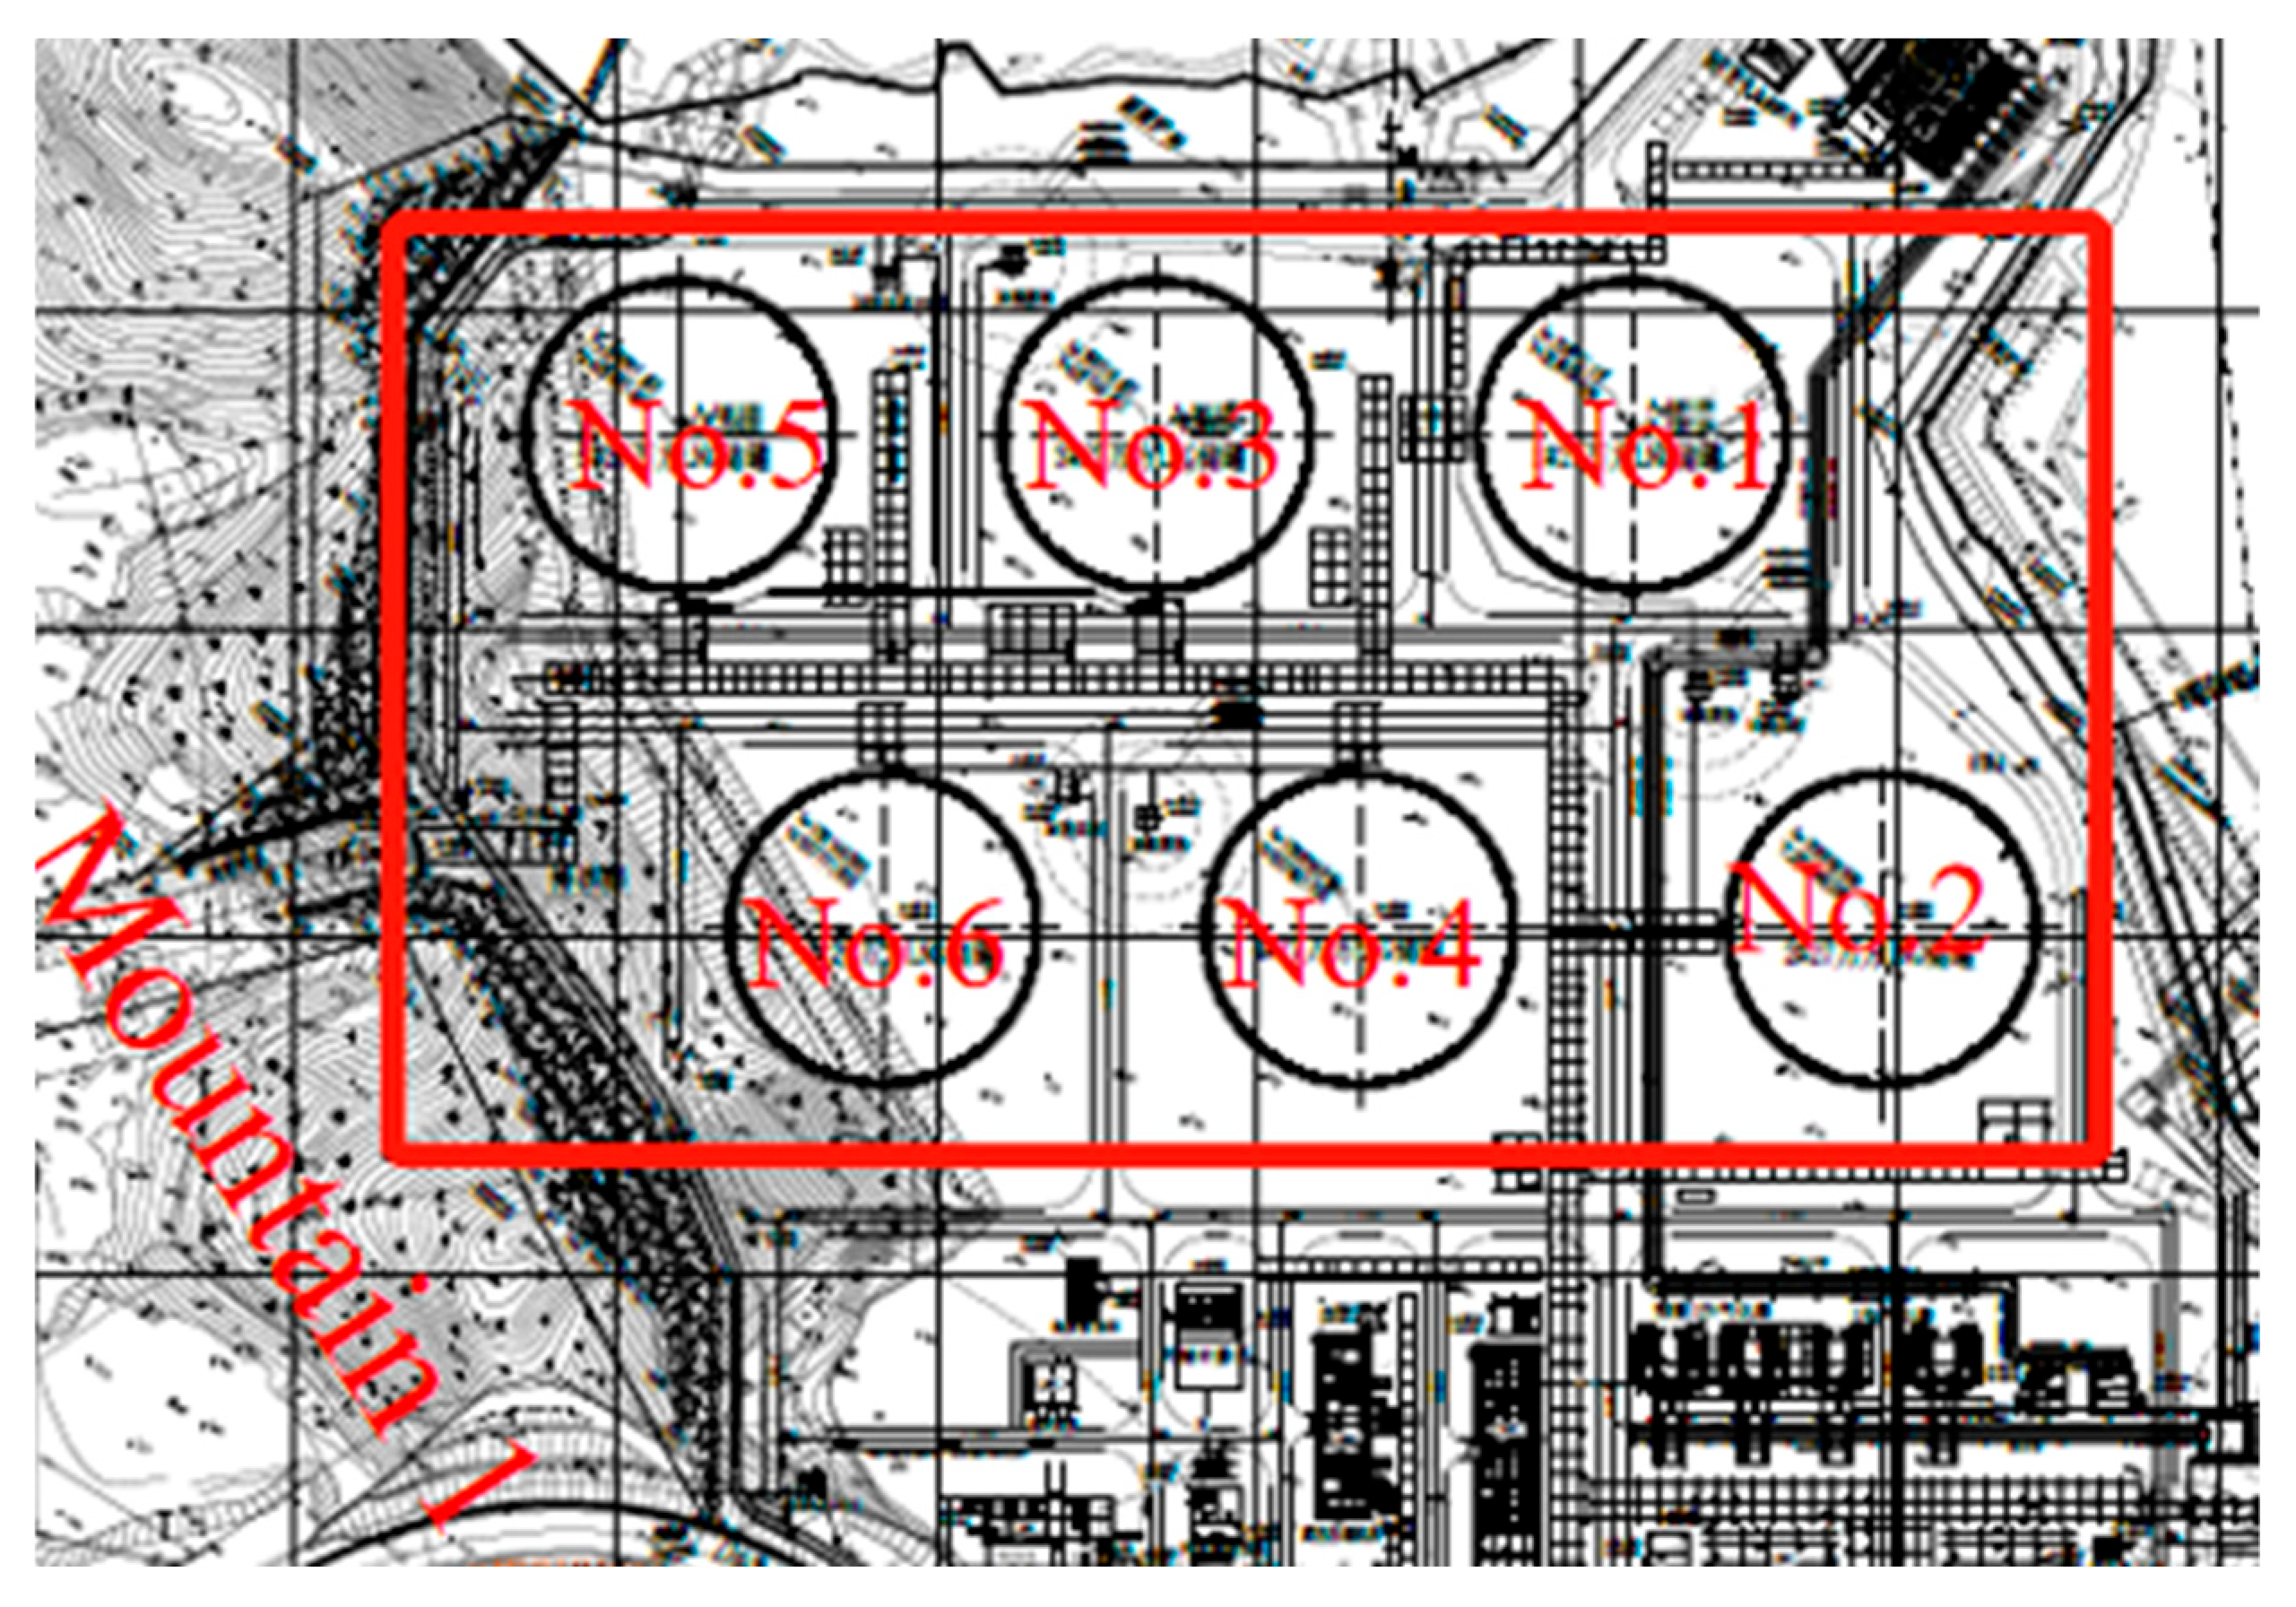
The LNG project is located in Ningbo, Zhejiang, China. It plans to construct six LNG storage tanks using 270,000 m
3 of concrete. The total construction scale is 4.8 million tons per year. Among them, Tanks 3#, 5# and 6# are near mountains, so flat raft foundations are used. Additionally, because the buried depth of the bedrock is large, pile-raft foundations are used for Tanks 1#, 2# and 4#. During the foundation construction, blasting work is performed for Mountain 1# on the west side of the site. The location of the mountain and the layout of the storage tanks are shown in
Figure 1.
2.1. Introduction to the Test Site
The landform of the testing site is quite complex. There are low mountains, hills and intermountain plains. On the south side, the mountain is partly excavated. Most of the site is covered by backfill. Because Tank 4# is the closest tank with a pile-raft foundation to Mountain 1#, our research focuses on the pile of this storage tank. From Mountain 1# to the edge of Tank 4#, the bedrock surface is high, with an elevation of approximately 3.2 m. According to the requirements of the design, approximately 3 m of crushed stones mixed with steel slag are used to pave the site, so the surface elevation during the test is about 6.2 m. Mountain 1# is about 18 m higher than the current ground level, giving it an elevation of approximately 24.2 m.
2.2. Geological Conditions
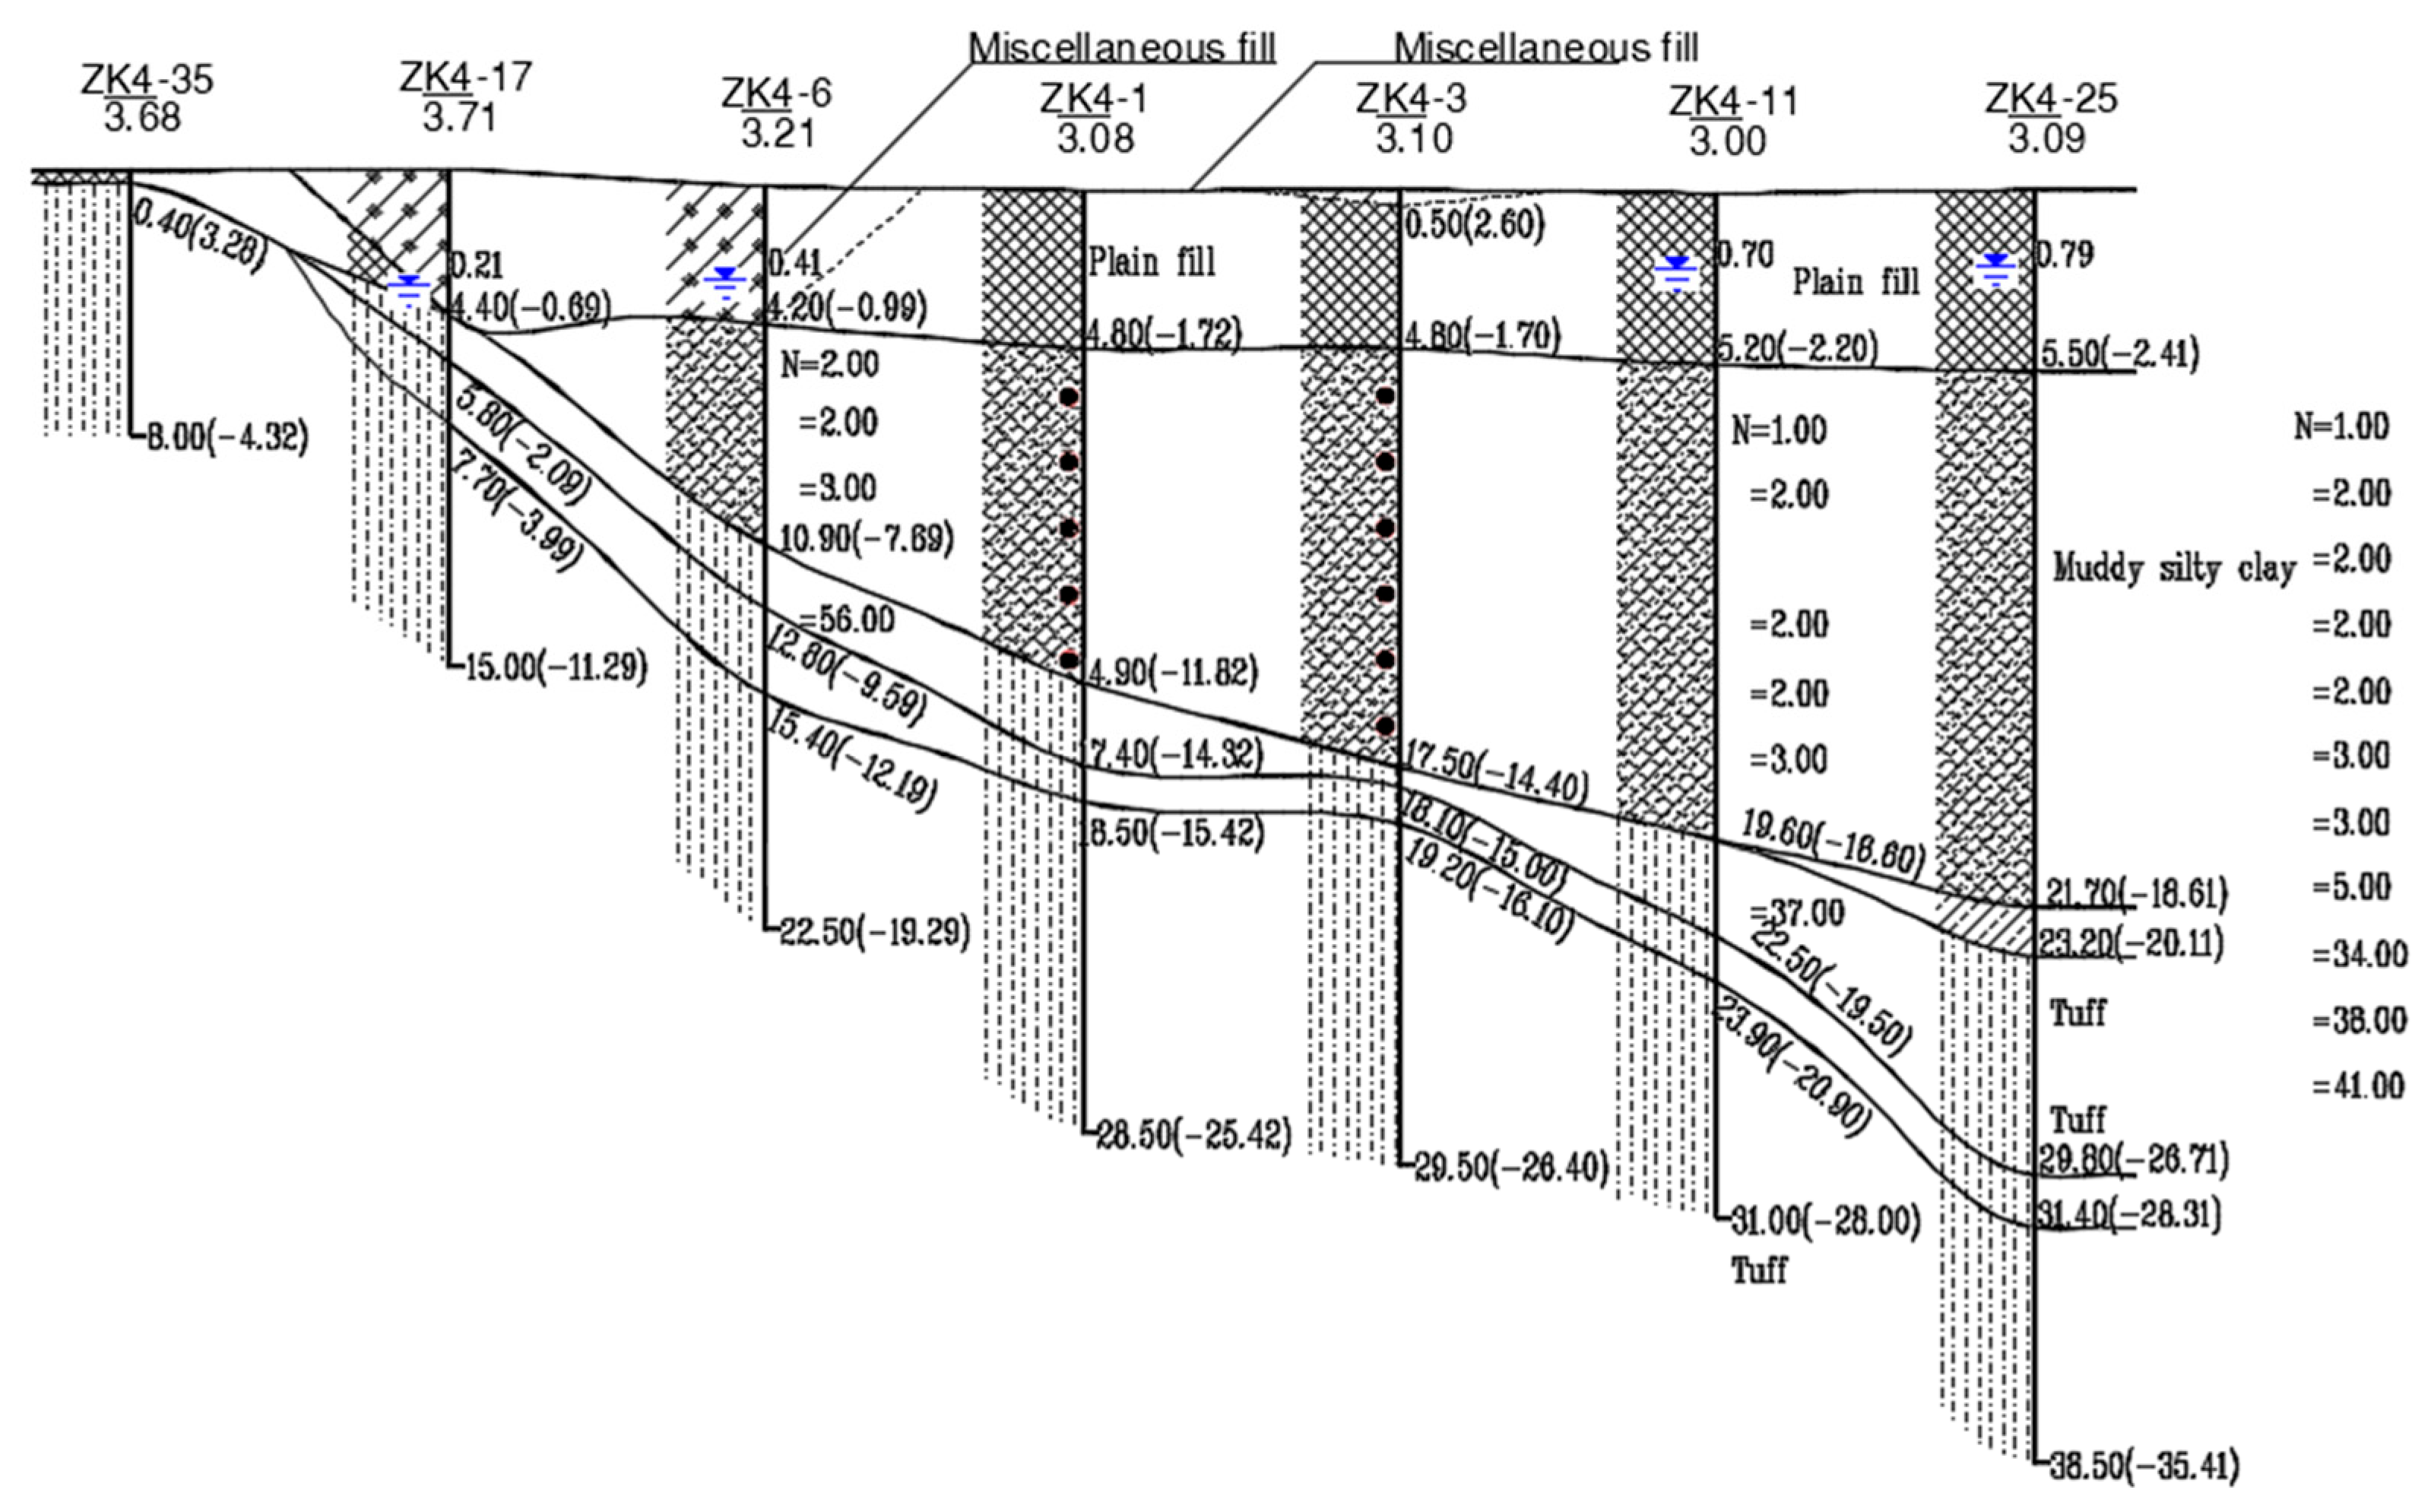
The strata beneath Tank 4#, from top to bottom, are described as follows:
①1-1 Miscellaneous fill: loose, primarily consisting of boulders, gravel, angular fragment, small amounts of clayey soil and building waste. It is heterogeneous, with the diameter of the gravel and angular fragment ranging from 2 cm to 10 cm. The largest particle diameter is approximately 50 cm. This layer is recently deposited.
①1-2 Plain fill: loose, primarily consisting of boulders, gravel and small amounts of clayey soil. The boulder is obtained from mountain blasting, with its particle diameter ranging from 2 cm to 10 cm. The largest particle diameter is also 50 cm. This layer is recently deposited.
②2 Muddy silty clay: flow-plastic with high, dry strength, high resilience, no seismic response and high compressive plasticity. It contains small amounts of silt and fine sand, some organic matter and the occasional shell fragment. Locally, it transitions into silty clay. This layer has a generally moderate uniformity.
⑦ Silty clay: plastic with moderate compressibility. It contains iron-manganese oxide spots and occasional clumps of fine sand and gravel. Its dry strength and resilience are moderate, without seismic response. Locally, it transitions into clay with medium compressibility. The heterogeneity of this layer is moderate.
⑩1 Tuff, fully weathered.
⑩2 Tuff, strongly weathered.
⑩3 Tuff, moderately weathered.
Typical stratigraphic profile beneath Tank 4# is shown in
Figure 2.
2.3. Hydrogeological Conditions
The groundwater at the site belongs to porous phreatic water and bedrock fissure water.
(1) Porous phreatic water: This kind of water bears slight pressure, and is mainly found in upper layers (Layer ①1-1 and Layer ①1-2) and clayey soil (Layer ②2). The primary source of this water is atmospheric precipitation and surface water infiltration. The highest water level in recent 3~5 years is close to the natural surface. During the investigation, the stable water level is 1.43~3.50 m below the surface.
(2) Bedrock fissure water: This kind of water primarily exists in the weathered fractures inside the bedrock. The fractures are moderately developed, with low connectivity and poor water retention conditions. The water amount is small, and the permeability is low, resulting in minimal impact on this project.
3. In Situ Test Scheme
3.1. Location of the Test Piles
When selecting the location of the test piles, we should comprehensively consider the engineering geological conditions of the site, the boundary effect of the vibration on the pile and the decreasing tendency of the vibration with the increasing distance to the blasting source. Finally, the location on the pile body corresponding to the muddy silty clay layer (Layer ②2) is chosen.
Figure 3 and
Figure 4 show the plan and profile of the test piles (marked by S1, S2 and S3), respectively. The nearest distance from the test piles to Mountain 1# is approximately 120 m. These test piles are made of C40 concrete, and their length is about 21 m and their diameter is 1.5 m.
In the
Figure 3, 4# refers to the fourth storage tank, ①~⑤, 1~6 represent the measurement points, and S1–S3 represent the test piles.
3.2. Layout of the Blasting Sources and Monitoring Points
To level the terrain, open-pit blasting is adopted stage by stage. In total, four times are conducted. The locations of the blasting sources are shown in
Figure 3. The basic parameters of each blasting are listed in
Table 1.
Based on the actual site conditions and geological conditions of Tank 4#, and considering the blasting operations, we arranged one monitoring line and six monitoring points, as shown in
Figure 3. The monitoring line consists of five single-component monitoring points. The monitoring line is approximately parallel to the line connecting Blasting Source 4 and the center of Tank 4#. The other individual monitoring points are positioned between the blasting sources and test piles of Tank 4#, or around the test piles. The monitoring scheme for the blasting vibration is designed as follows. Each detector is fixed at its designated position. Monitoring Point 1 and Point 2 take charge of measuring the vibration caused by Blasting Source 1. The vibration caused by Blasting Source 2 is measured by Monitoring Points 3 and 4, while the vibration caused by Blasting Source 3 is measured by Monitoring Points 5 and 6. The monitoring line measures the vibration of Tank 4# caused by Blasting Source 4.
3.3. Design of the Test Piles
For each pile, the times of the blasting tests are shown in
Table 2. It takes about 7~10 h from mixing the concrete in the factory to pouring the concrete into the test piles. The concrete strength is lower than 50% of the design strength. Then, blasting is conducted to level Mountain 1#, and the vibration velocity of the pile is measured. Once the concrete strength of the test piles reaches the design strength, a low-strain, dynamic testing method is adopted to detect the pile’s integrity. Note that the concrete strength of the pile body is detected by directly sampling from the test piles.
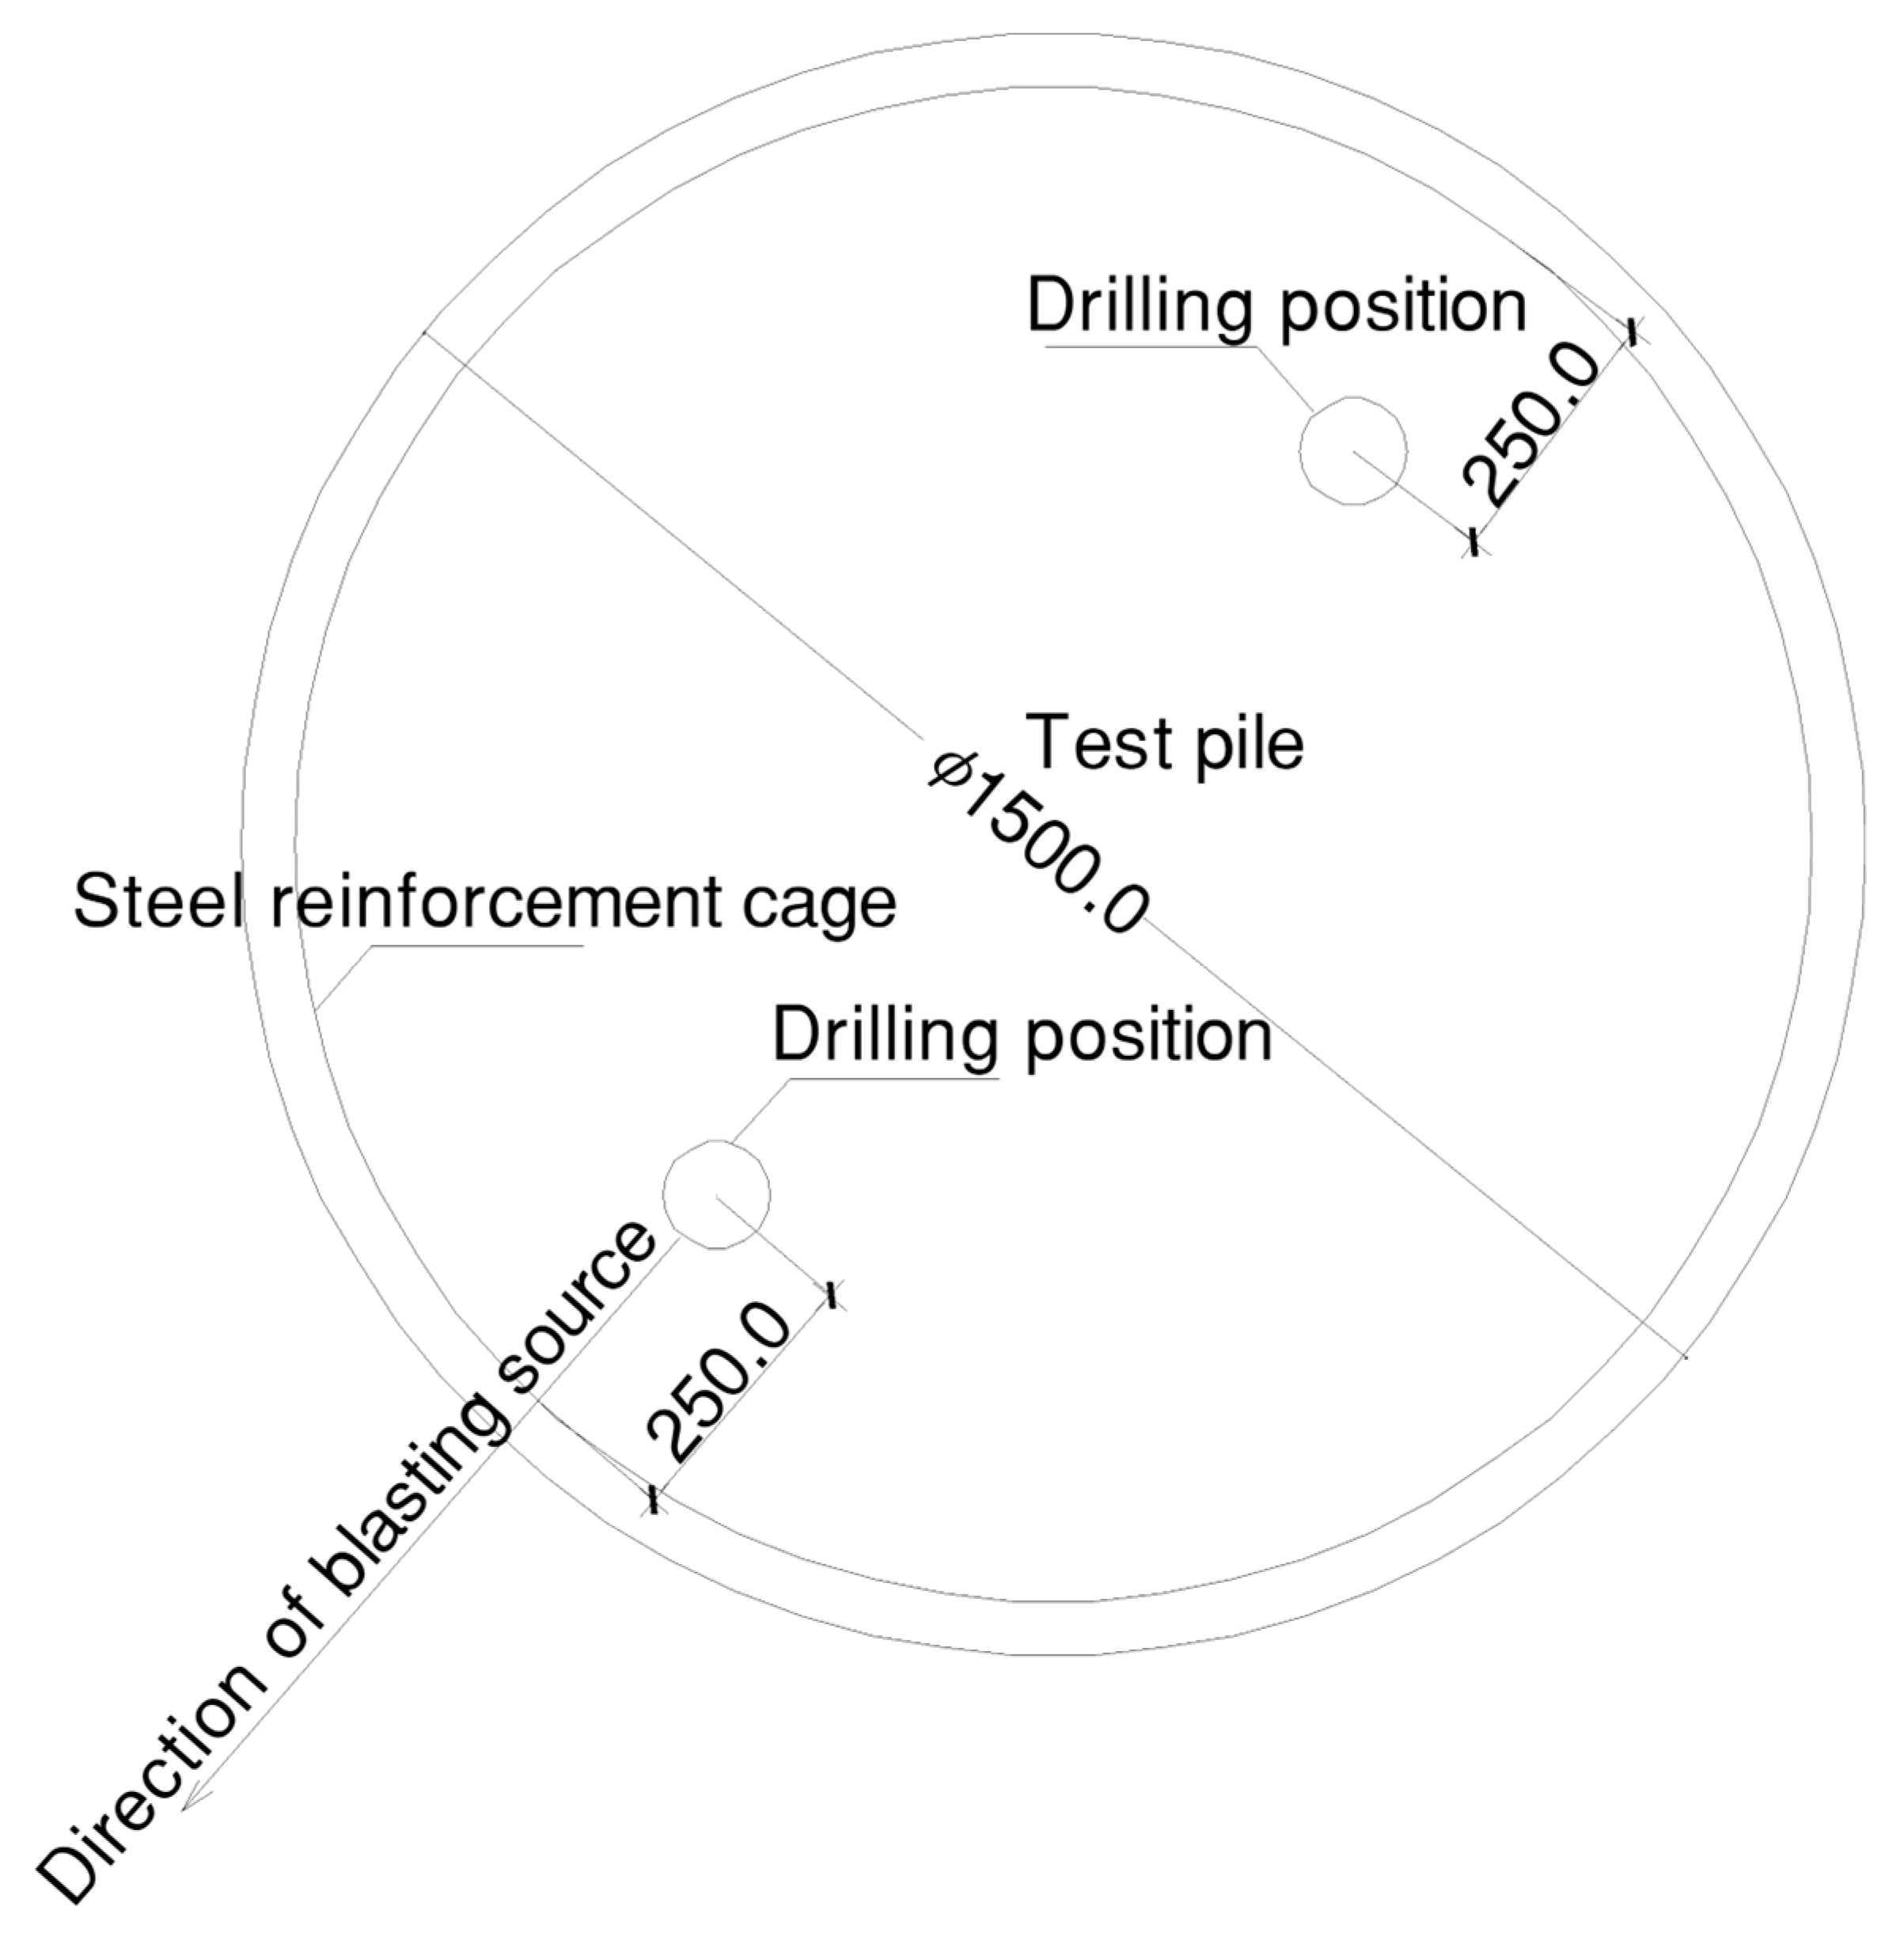
3.4. Sampling Scheme
Two holes are drilled from each test pile, and their locations are shown in
Figure 5. From the buried depth of 1.5 m, one sample is taken every 2.5 m (see
Figure 4). In total, 8 groups of samples are collected to do the compression tests to measure the concrete strength. Additionally, before the compression tests, high-resolution photos of these samples are taken and their appearances are described to check whether there are microscopic cracks.
4. Experimental Results
By performing a spectral analysis on the waveform measured by the detector, the frequency characteristics of the vibration at each monitoring point can be obtained, which provides the basis for analyzing the vibration responses of adjacent structures. Moreover, according to the experimental results at each monitoring point, we can acquire the variation of the vibration velocity with distance and the corresponding attenuation curve, so that the safe distance to avoid damage can be determined.
4.1. Blasting Vibration Frequency
Because the influence of blasting on adjacent structures is closely related to the vibration frequency [
8], it is necessary to determine the frequency characteristics of the blasting vibration first. A Fourier spectrum analysis is conducted for the time-domain waveform of the blasting vibration to obtain the vibration velocity amplitude spectrum (
V-
f). In this spectrum, the frequency corresponding to the maximum amplitude (
Vm) is referred to as the predominant frequency of the vibration (
fm).
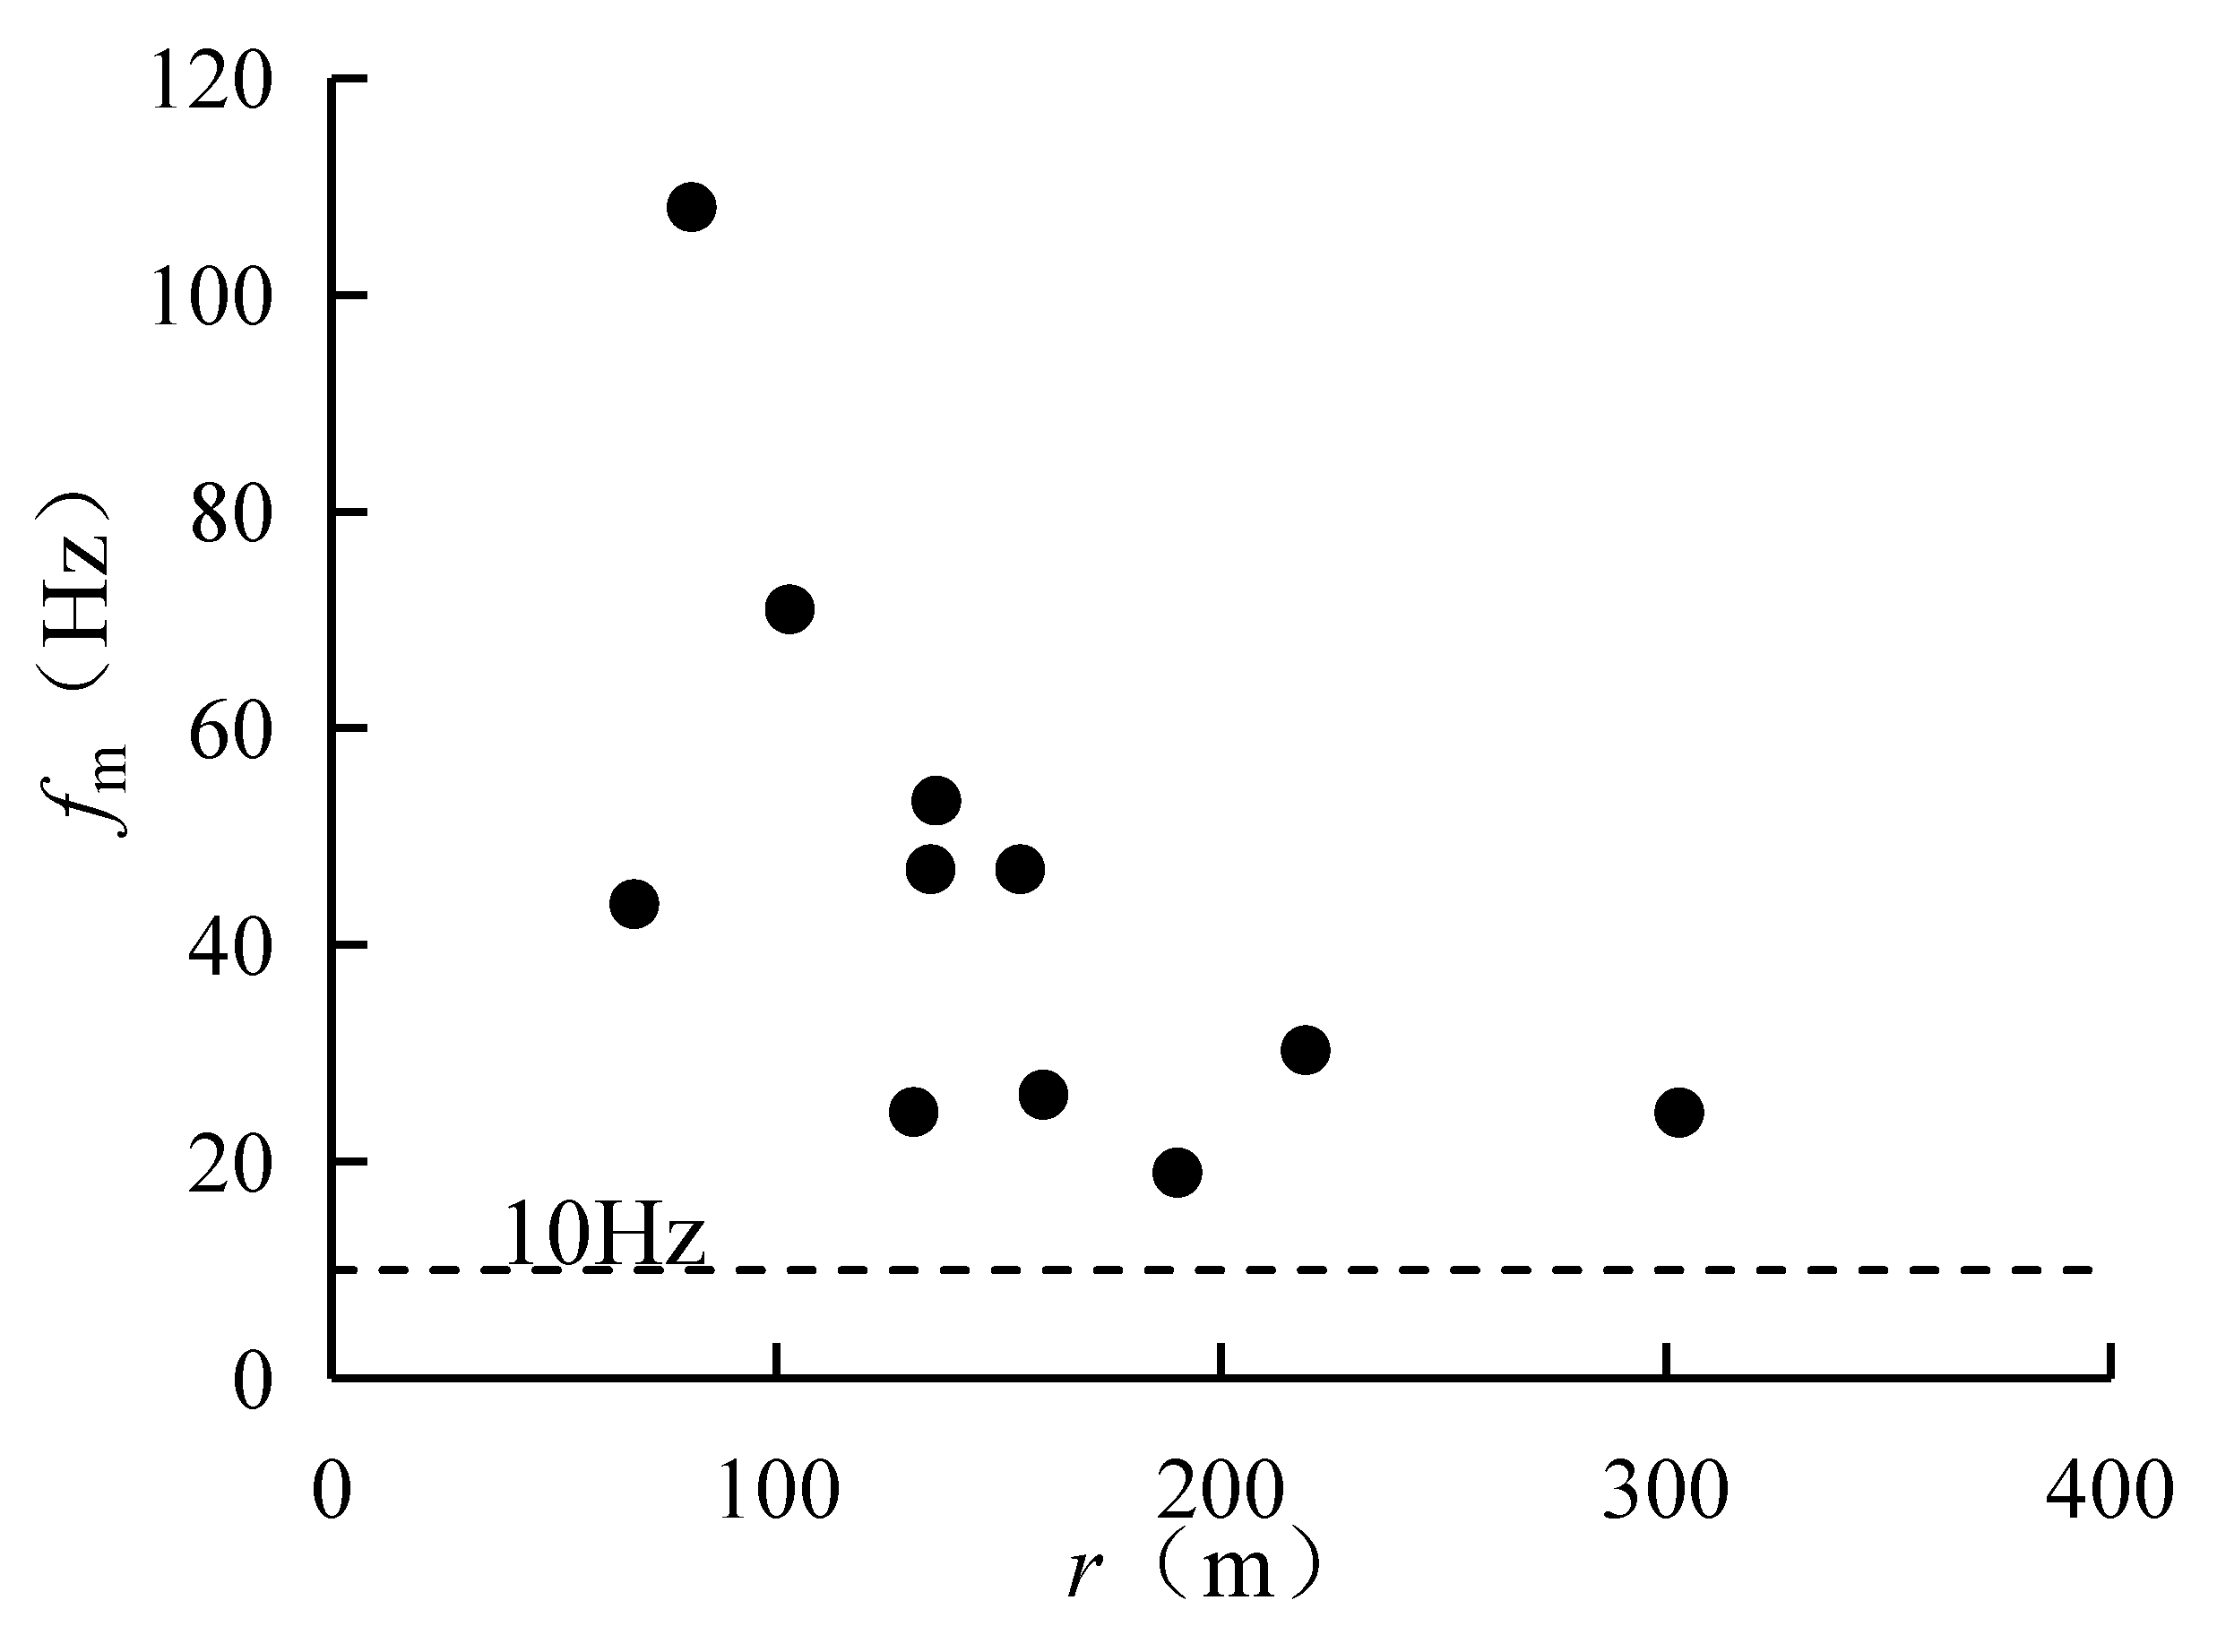
According to the amplitude spectrum of the vibration waveform at each monitoring point, the obtained predominant frequencies are shown in
Figure 6. The experimental results indicate that the
fm of this site is in the range of [19 (cm/s)/Hz, 108 (cm/s)/Hz]. Moreover, as the distance from the detector to the blasting source (
r) increases,
fm will gradually decrease.
4.2. Attenuation of the Maximum Amplitude
The distance to the blasting source,
r, is a critical factor that influences the vibration intensities of the waveforms recorded at different monitoring points in different blasting tests. For each monitoring point, the blasting vibration record with the greatest vibration intensity is chosen to draw the attenuation curve of
Vmax with
r. The experimental results are shown in
Figure 7. On the other side, Sodev’s formula is adopted to fit the data points using the least square method. The following formula can be obtained:
where
K is the site coefficient,
Q is the maximum charge weight for one segment and α is the attenuation exponent. Note that the horizontal axis of
Figure 7 is
instead of
r.
In the fitted formula,
K = 187.81 and α = 1.661. According to Section 13.2.4 of the safety regulations for blasting (GB 6722-2014) [
17], these parameters fall within the range of parameter values for medium-hard rock in the blasting zone.
4.3. Experimental Results of the Pile Foundation During Blasting
- (1)
Low-strain testing results
Before drilling holes in the test piles, low-strain testing is conducted to measure the wave velocity. The test results are shown in
Table 3.
- (2)
In-site drilling results
According to the concrete samples that are obtained from the test piles, the effective lengths of S1, S2 and S3 are approximately 22 m. The samples are continuous, integral and well-cemented, as shown in
Figure 8. Their side surfaces are smooth, and it can be observed that the aggregates are distributed uniformly. The top and bottom surfaces of the adjacent samples match well.
- (3)
Comparison of the concrete strength
To distinguish the two drill holes on the test pile (see
Figure 5), concrete samples, which are obtained from the drill hole that is closer to the blasting source, are marked by Si-1, where i denotes the pile number. Concrete samples from the other drill hole are marked by Si-2. The compressive strengths of the concrete samples at different depths are shown in
Figure 9. It can be found that after blasting four times, the compressive strengths of all three piles are greater than 40 MPa, indicating that the blasting has no significant effect on the pile quality.
Due to the low strength of the pile during blasting, it is not feasible to install detectors on the pile top and measure the vibration speed and frequency of the pile. Therefore, detectors are placed around the piles to measure the ground surface vibration speeds and frequencies (see Monitoring Points 2, 4 and 6 in
Figure 3). Based on the experimental results after blasting four times, the maximum ground surface vibration velocity around the piles is 9.07 mm/s. Therefore, if the ground surface vibration velocity is less than 9.07 mm/s, blasting has no adverse impact on the pile quality at this site.
5. Numerical Simulations
To determine the safe vibration velocity of the low-strength pile under blasting, it is necessary to study the relationship between the vibration velocities of the pile and the surrounding soil. This study analyzes the influence of blasting vibration on the pile foundation of Tank 4# using the finite element software MIDAS GTS NX 2023. Because Blasting Source 3 is the closest to Tank 4#, and its charge weight for one segment is the maximum, its blasting scheme is adopted for the numerical simulation.
5.1. Simulation Approach
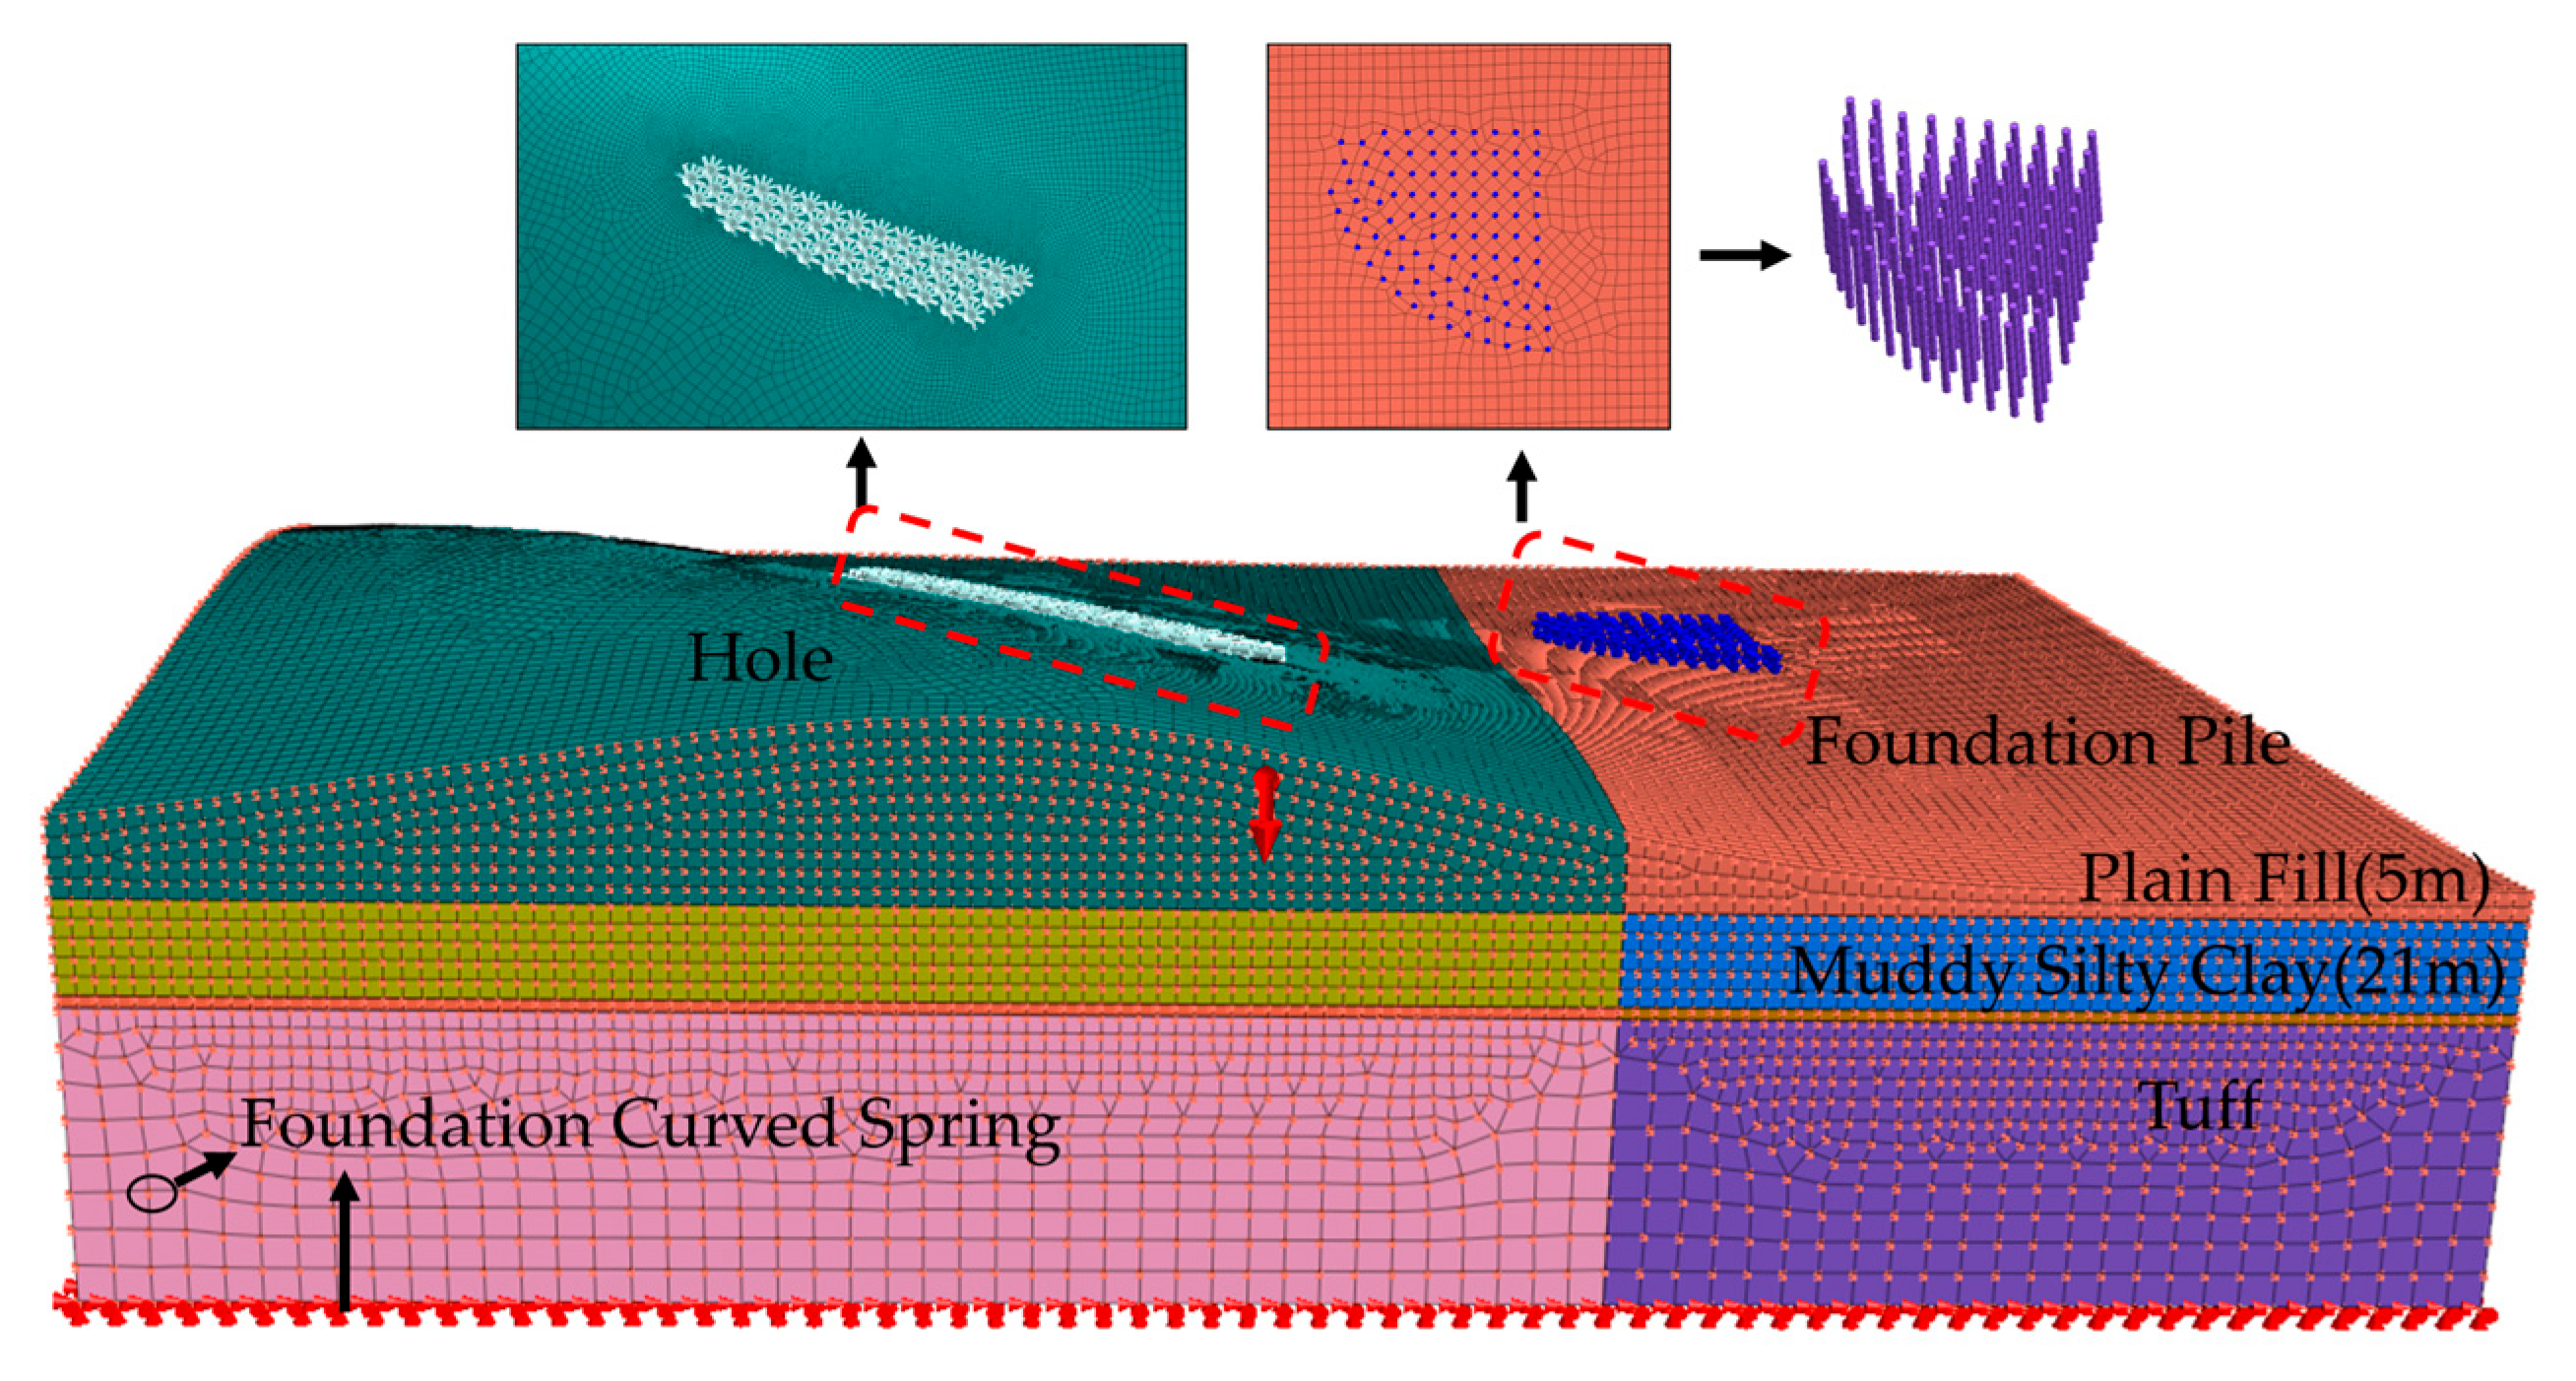
Based on the stratum structure method, a three-dimensional solid model is established on a scale of 1:1. The solid model is then optimized by adding the pile foundation of Tank 4# and partitioning it into elements with proper mesh sizes, according to the design. Material parameters, which are given in the geotechnical investigation report, are input into the computational model. The blasting load is applied using the equivalent load method. By calculating the full-time equivalent blasting load curve, issues such as the large number of blasting holes, large charge amount, and long computational time in the numerical simulations are addressed. The specific model is shown in
Figure 10.
Blasting pressure refers to the pressure at the wavefront surface during blasting. In a fully coupling state, the initial blasting load exerted on the inner wall of the hole is related to the propagation direction of the blasting-induced vibration. In a cylindrical hole, the vibration propagation direction is perpendicular to the inner wall. However, during the practical blasting excavation construction process, the charge and hole are usually not coupled. In this condition, the peak load
becomes functionally dependent on the coupling coefficient of the charge in the hole. Based on blasting dynamics, the blasting pressure is equivalent to the load exerted on the inner wall of the hole and can be formulated as:
where
is the charge density,
is the blasting velocity of the charge,
is called the adiabatic exponent of the blasting products, and is approximately equal to 3;
is the charge diameter and
is hole diameter.
During this work, the charge in the cylindrical hole is illustrated in
Figure 11. Here,
is not the actual diameter of the charge. Instead, it is the equivalent continuous diameter obtained by the charge amount. The calculation process is as follows:
where
is the charge amount in single hole and
is the hole depth.
Because the mechanical properties of gas and rock are different, the blasting pressure obtained by Equation (2) is not equal to the pressure applied by the blasting gas to the inner wall of the hole. According to the wave propagation and transmission principles in blasting dynamics, the pressure on the inner wall of the hole, i.e., the blasting-induced effect on the rock, can be formulated as
where
is the rock density and
is the velocity of the compressive wave propagating in rock.
In the numerical simulation, the blasting pressure on the inner wall of the hole is a function of time. Currently, the most commonly used function is the triangular function. The final time-history curve is obtained by defining the rising and falling time of the blasting pressure. According to the empirical formula, the rising time
and the falling time
are:
where
is the action radius of the blasting pressure,
is diameter of the hole and
is the bulk modulus.
When the finite element model is established, the equivalent blasting pressure determined by Equation (4) is applied to each hole. The charge density is
= 1200 kg/m
3, while blasting velocity is
= 4200 m/s. According to the blasting scheme, the hole has a diameter of
= 0.155 m, a depth of
= 16.5 m and the length of the charge reaches 11 m. If the maximum charge amount in a single hole is 120 kg, the equivalent blasting pressure will be 7840 MPa. The rising time is
= 3.9 ms, and the falling time is
= 16.0 ms. The time-history curve of the blasting pressure is demonstrated in
Figure 12.
The model includes four materials: plain fill, muddy silty clay, tuff and C40 concrete. The foundation is simulated by the Mohr–Coulomb constitutive model, while the pile is simulated by the elastic model. For further details, see
Figure 13.
The piles are made of C40 concrete. The concrete strength is equal to 30% of its standard value. Based on the geological conditions of the site and the experimental results of the concrete samples, mechanical parameters of the soil and structure are determined, as listed in
Table 4.
5.2. Analysis of Simulation Results
- (1)
Comparison of the measured and simulated peak vibration velocities.
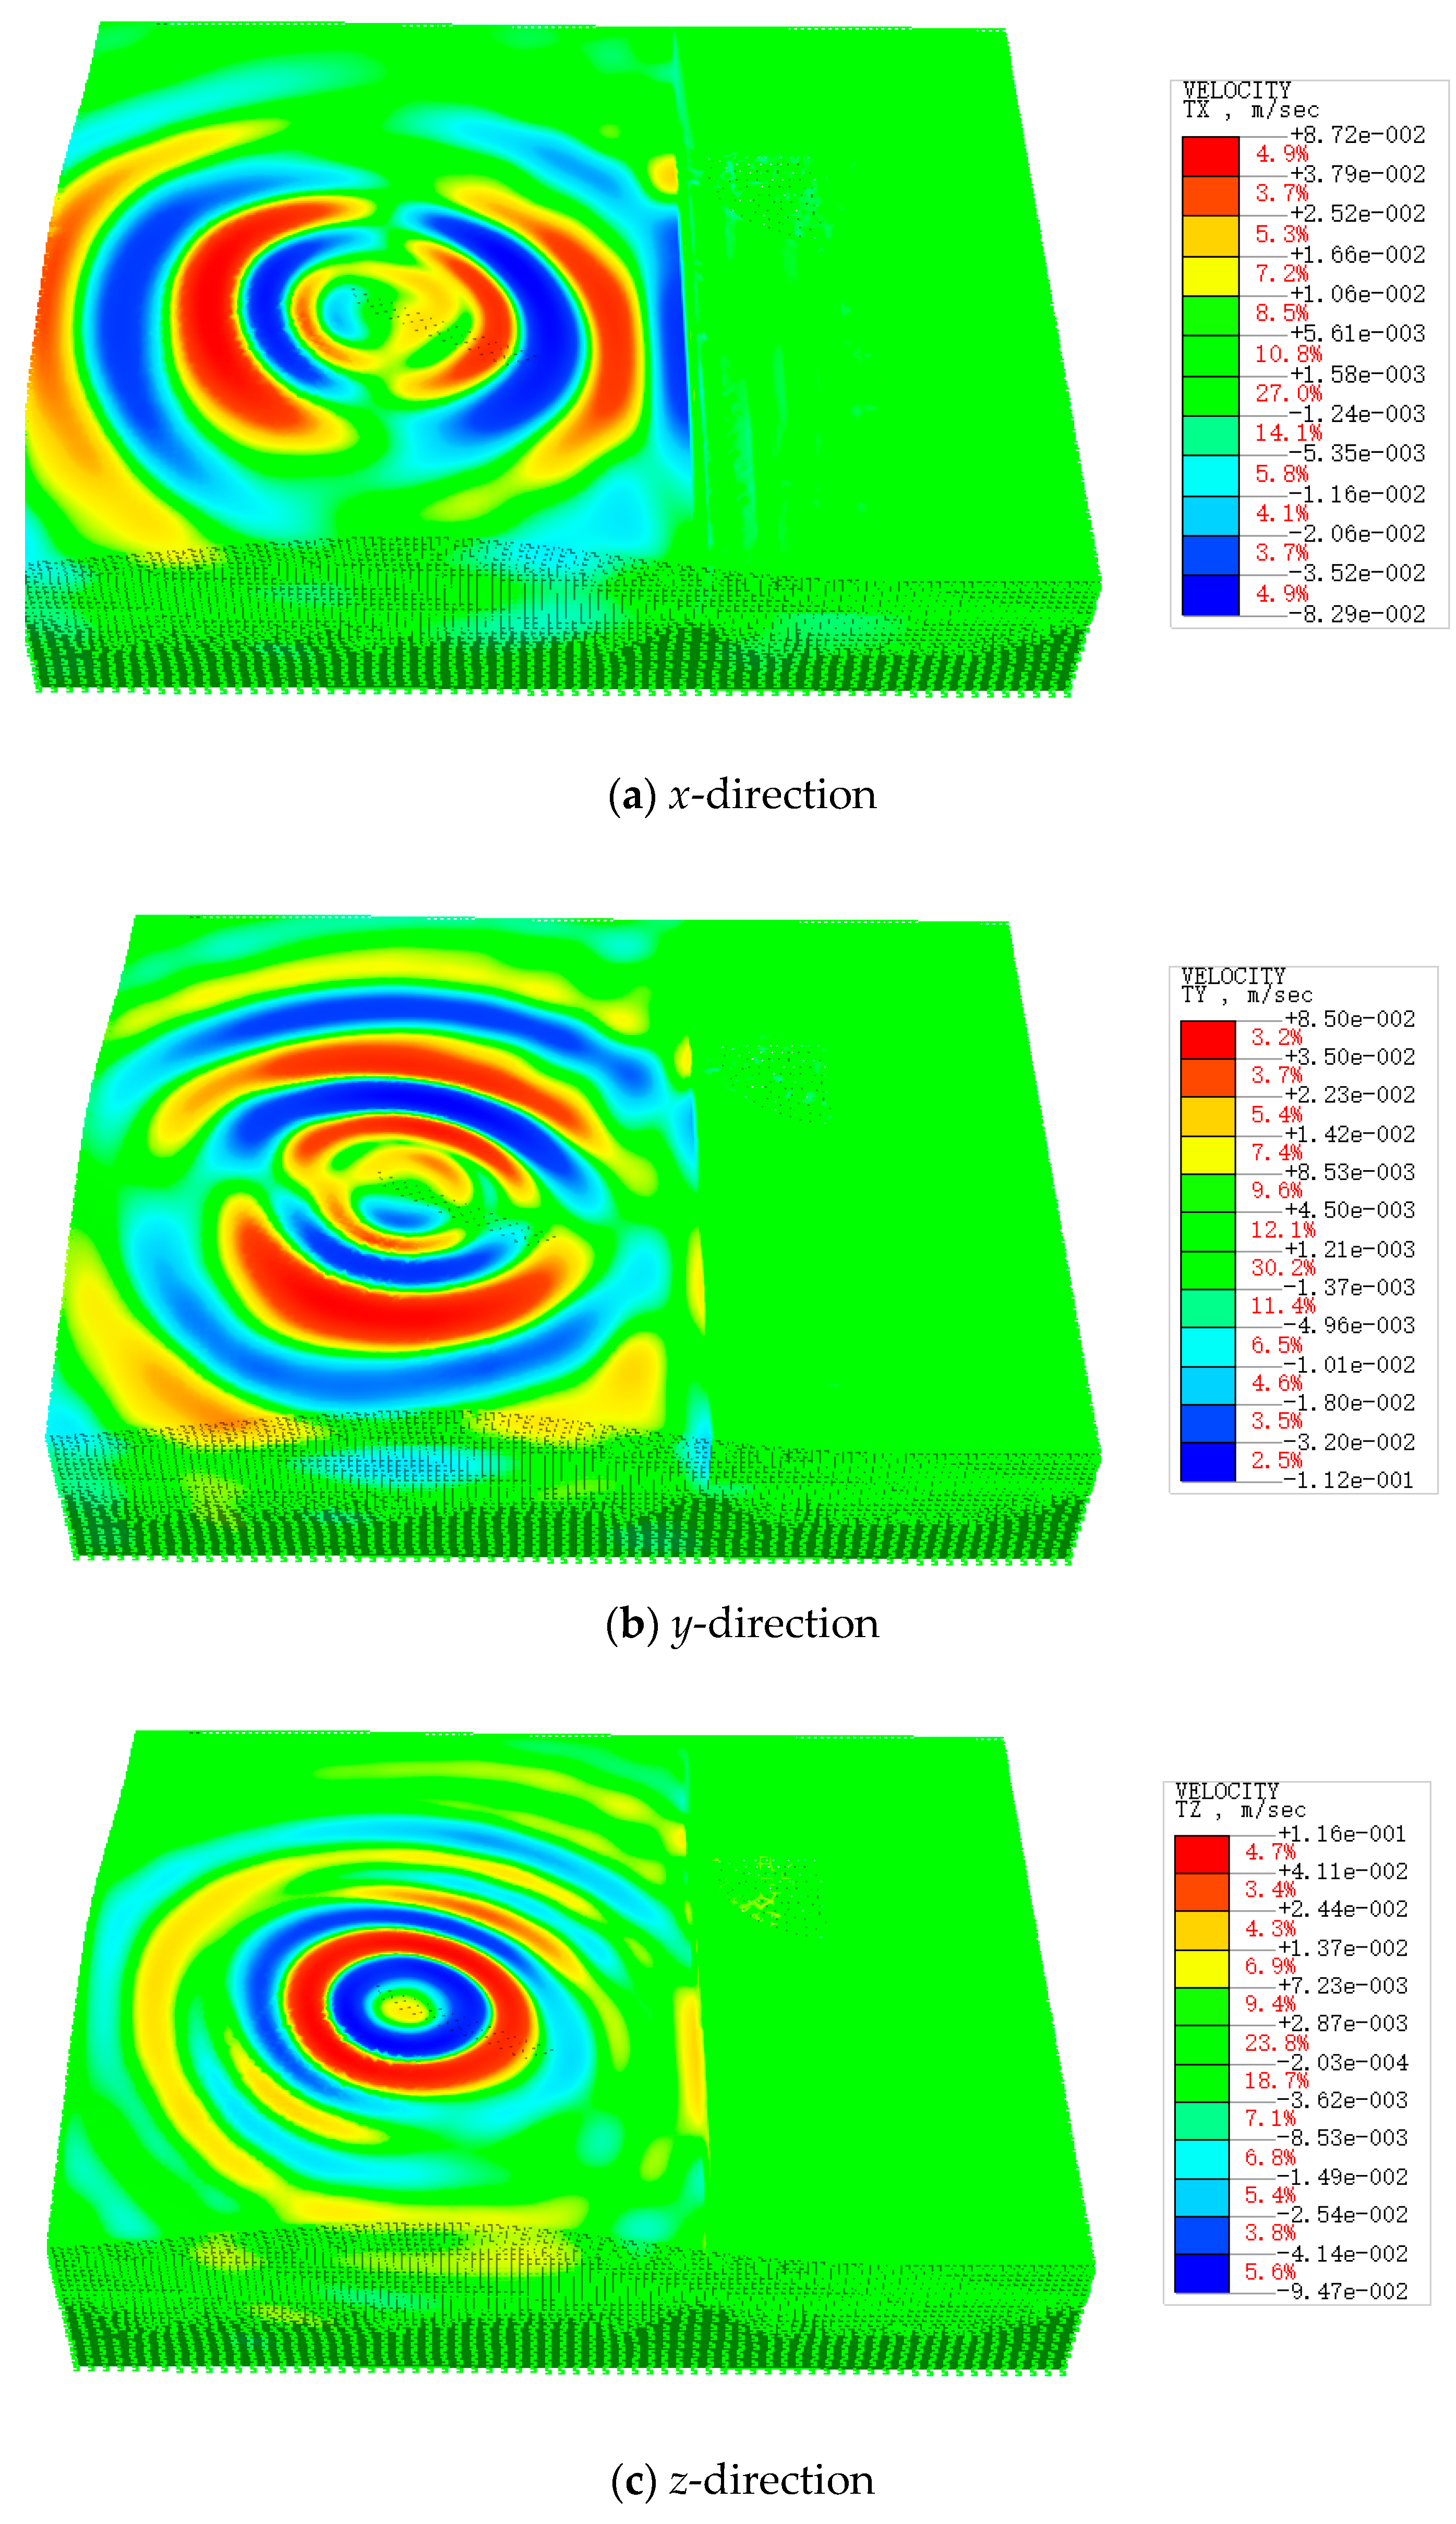
Figure 14 shows the contours of the blasting-induced vibration velocities in three directions when the time is
t = 800 ms. It can be observed that the variations in the soil layers affect the propagation of the blasting vibration. The seismic waves reflect and refract at the layers’ boundary. A part of the energy is dissipated during the reflection process, while the other part refracts into the new soil layer. Therefore, the soil layer acts as a dampener, reducing the impact of the blasting vibration on the pile.
Figure 15 compares the numerical simulation results and blasting test results at the same monitoring point. It can be seen that the peak vibration velocity obtained by numerical simulation is 1.15 cm/s, while the experimental result is 1.07 cm/s. The relative error is 7.3%, which is within the acceptable range in geotechnical engineering. This comparison indicates the accuracy of the numerical simulation.
- (2)
Vibration of the pile.
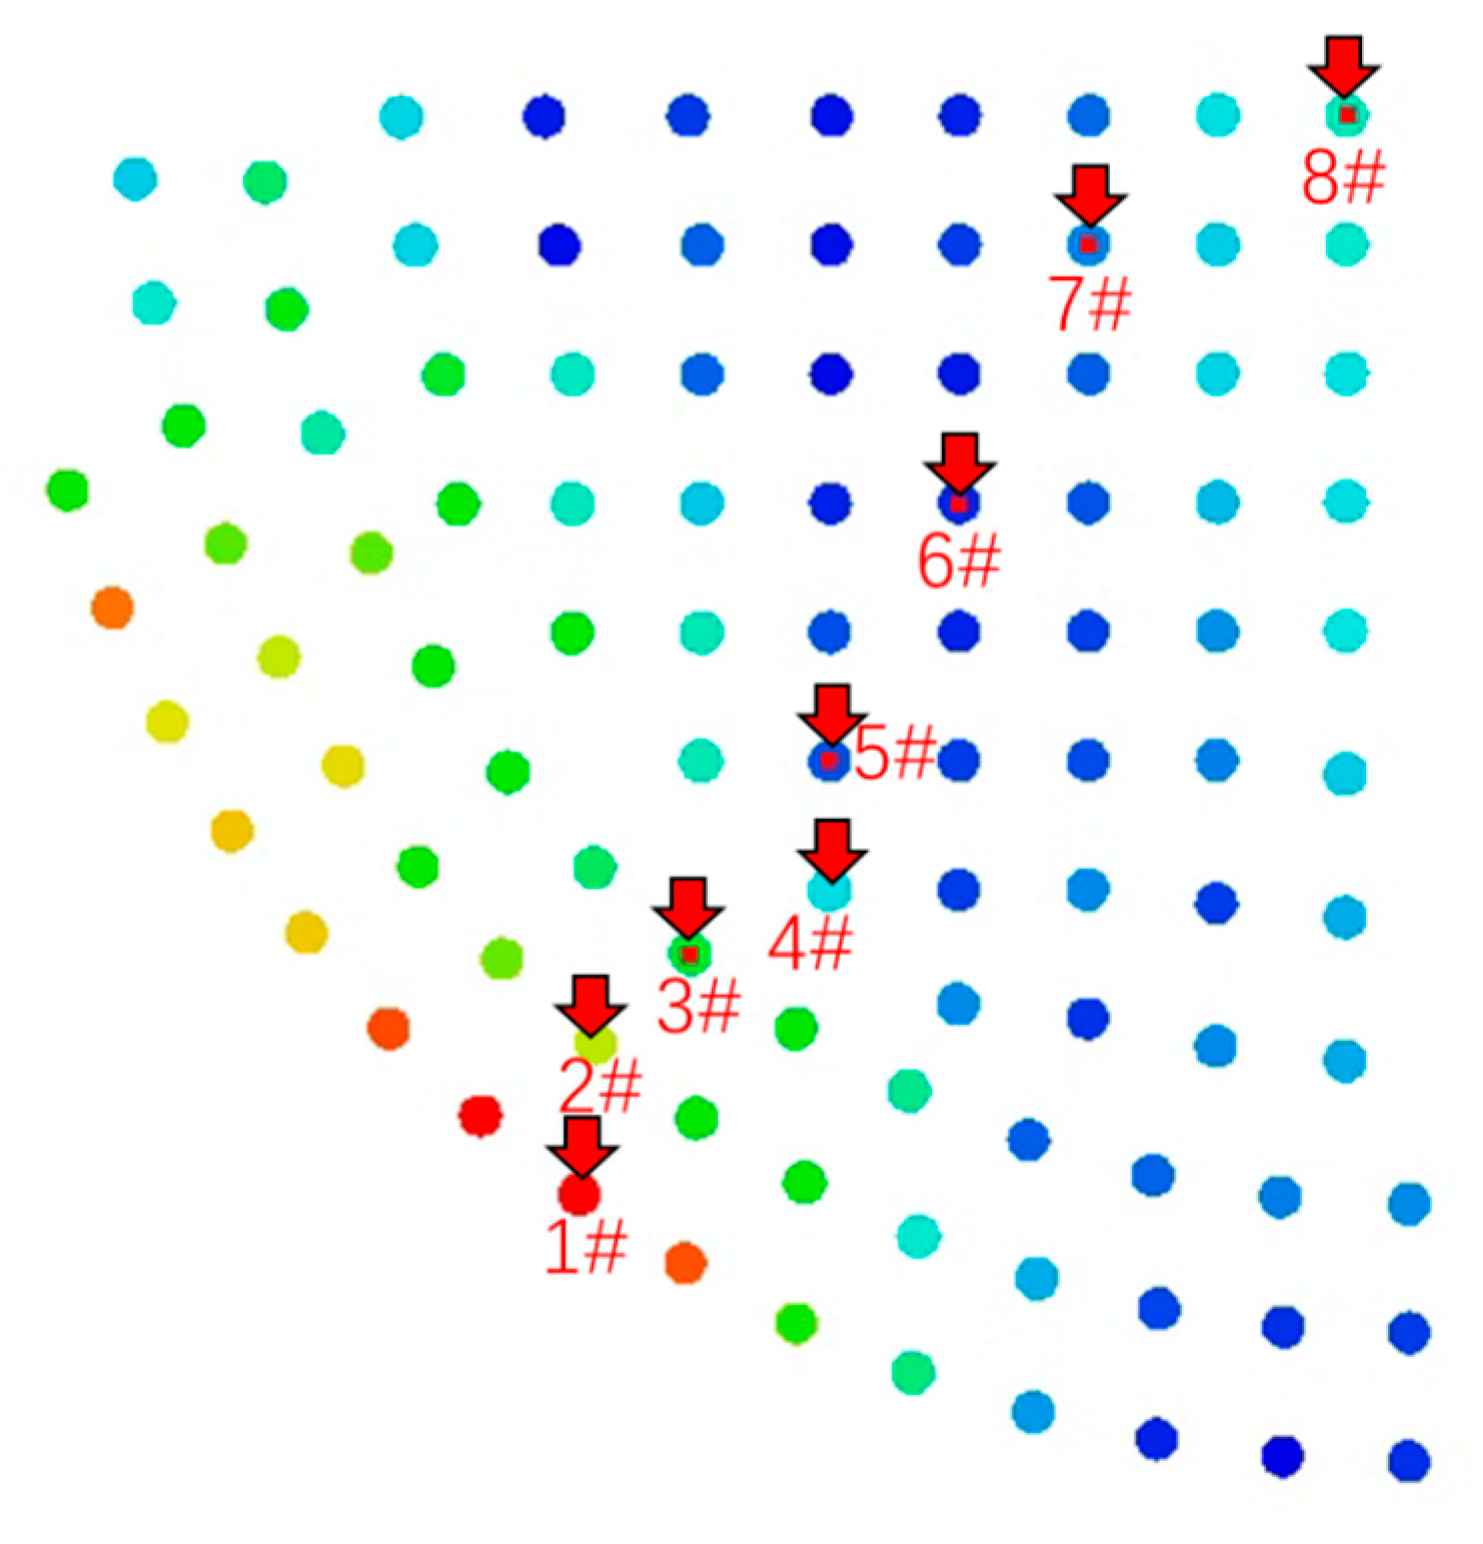
To analyze the propagation of the blasting-induced vibration at the pile beneath Tank 4#, waveforms at eight monitoring points, taken from near to far, are compared. The locations of the monitoring points are shown in
Figure 16, and the corresponding peak vibration velocities are listed in
Table 5. It is shown that during the staged blasting, vertical vibration (in the
z-direction) dominates the vibration of the pile. As the distance to the blasting source increases, the peak vibration velocity gradually decreases. 1#~8# represent monitoring pile numbers.
Three nodes are selected from the upper, middle and lower parts of the pile, corresponding to the layers of plain fill, muddy silty clay and tuff, respectively. The peak vibration velocities in the
z-direction at these nodes are summarized in
Table 6. It can be observed that the vibration at the pile top is the largest. As the depth increases and the soil becomes stronger, the peak vibration velocity induced by blasting decreases. The peak vibration velocity in the plain fill layer is approximately twice of that at the tuff layer.
- (3)
Relationship between the peak vibration velocities of the pile and ground.
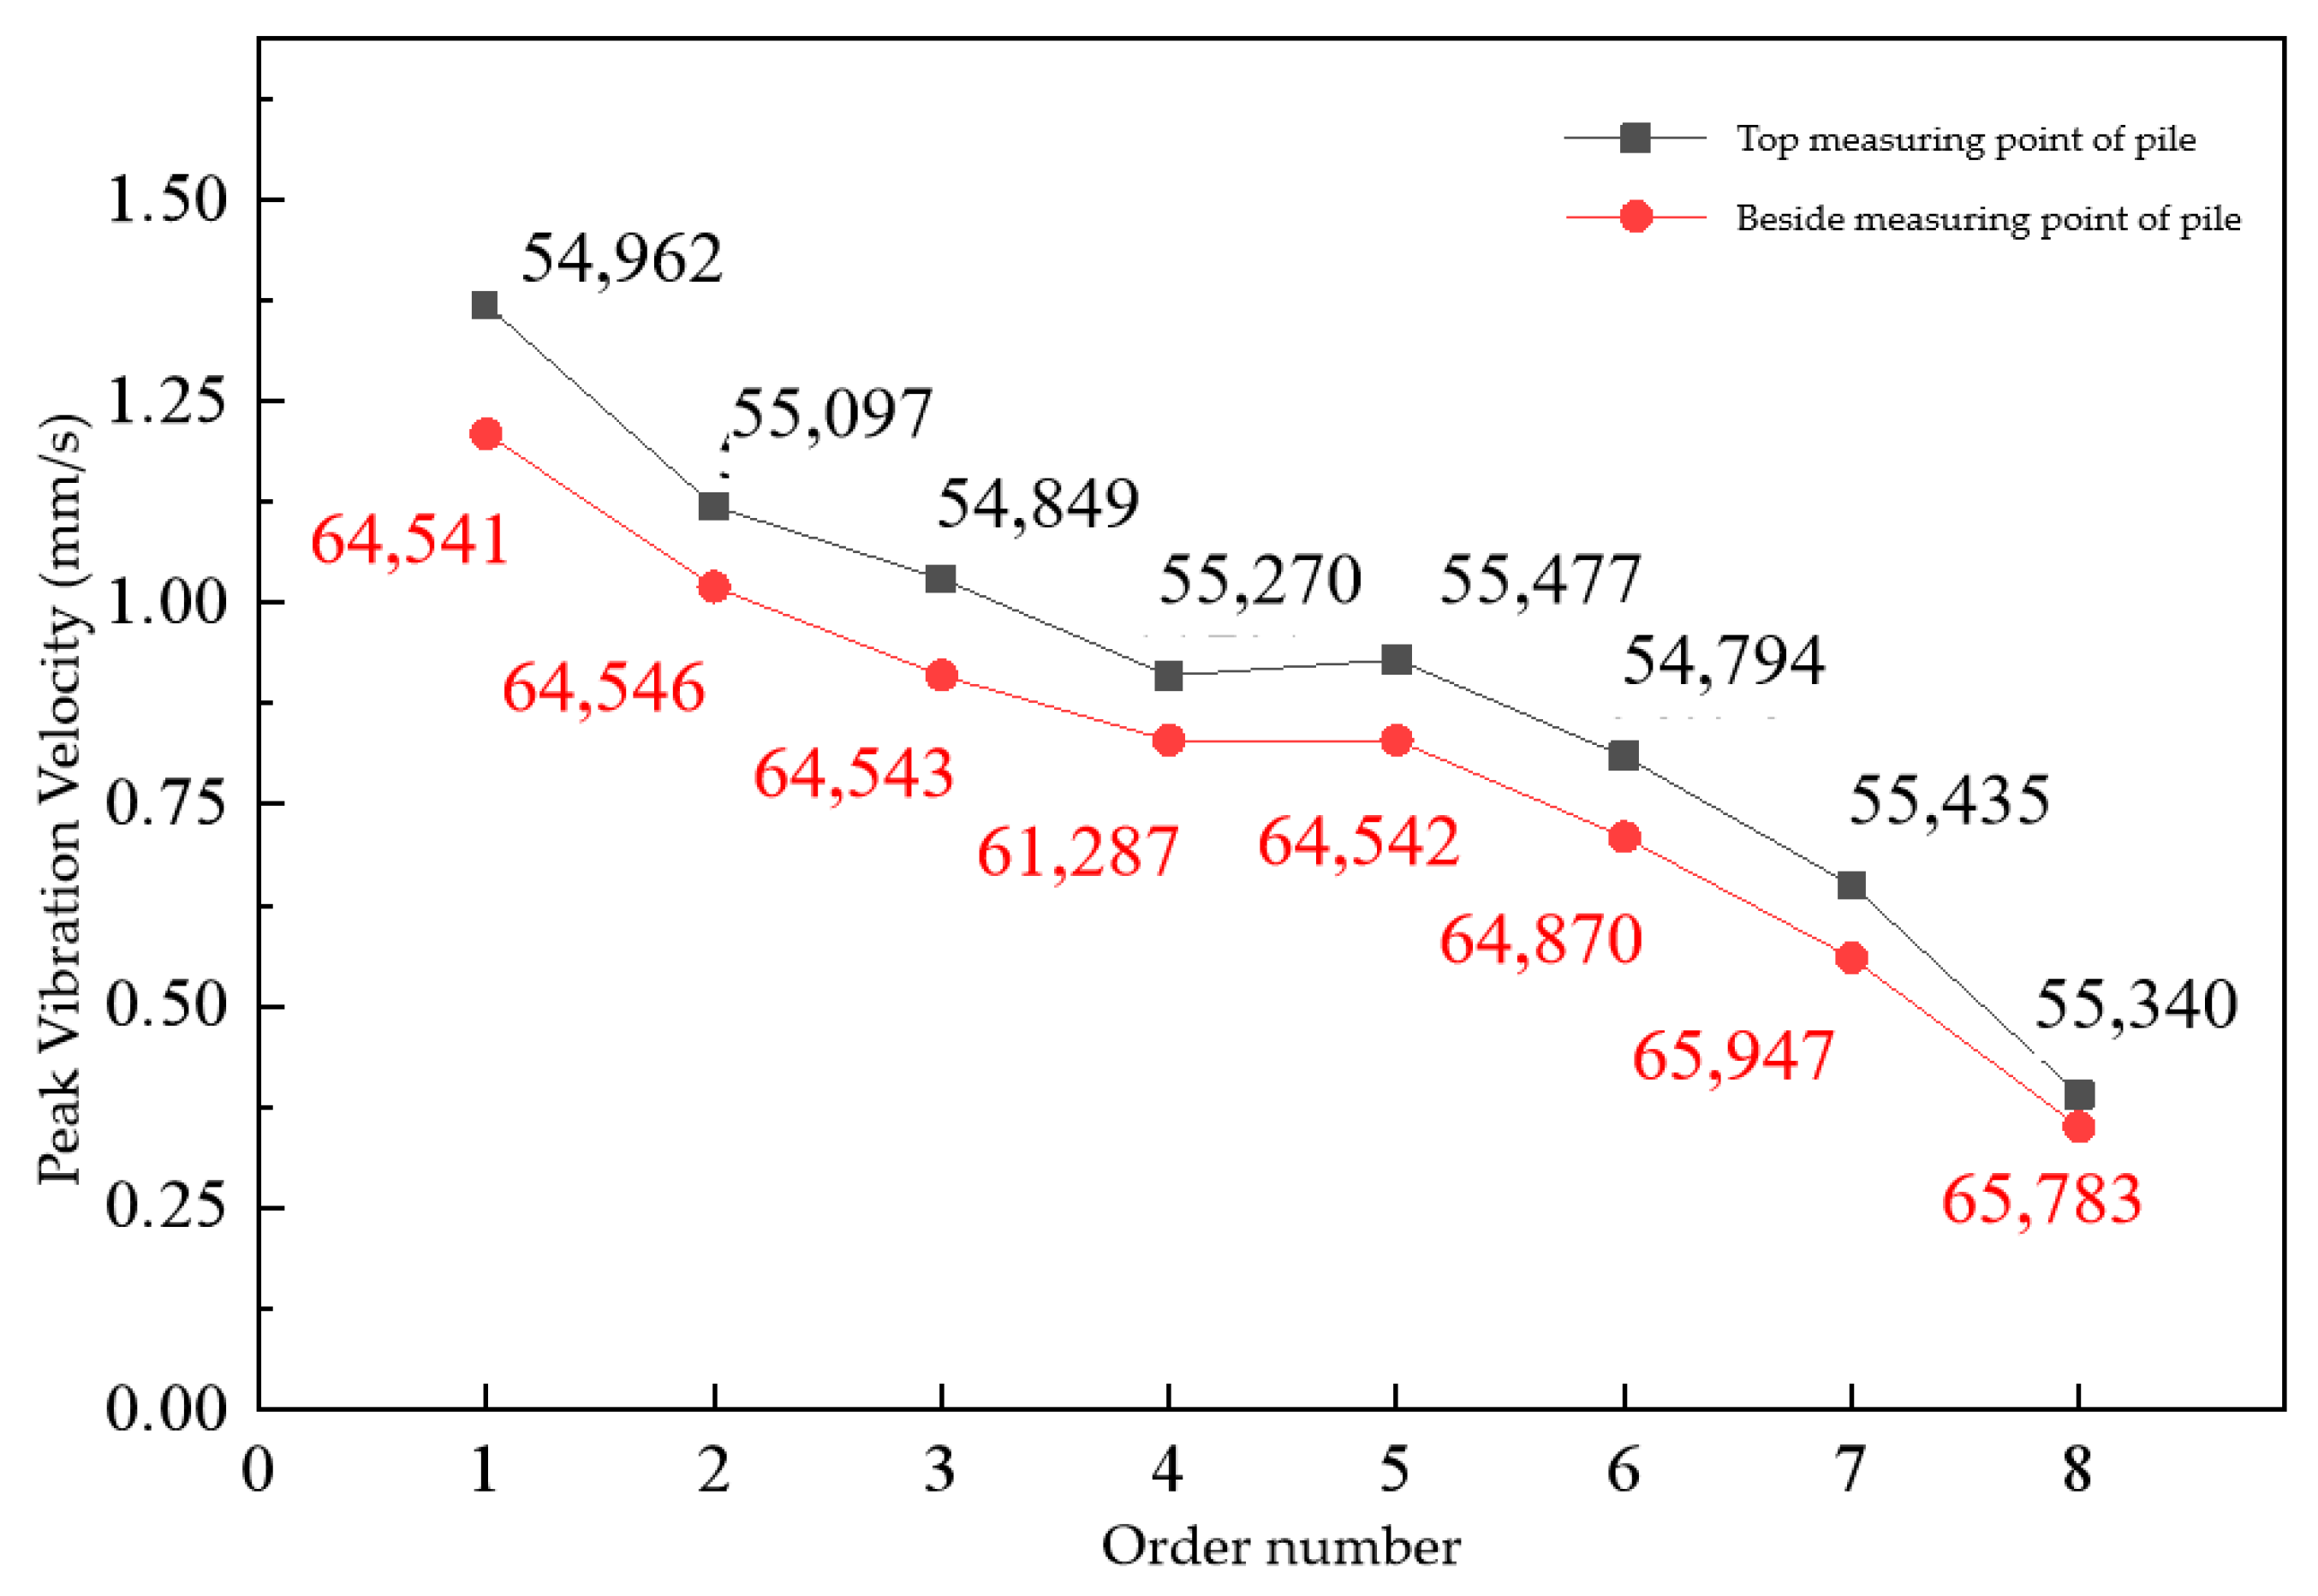
To compare the peak vibration velocity at the pile top and that at the ground surface around the pile, the simulation results of these monitoring points are extracted and shown in
Figure 17. This figure indicates that the peak vibration velocity at the pile top is higher than that at the ground surface. According to the statistics, when the concrete strength of the pile is 30% of the design strength, the ratio of the peak vibration velocity at the pile top to that at the ground surface gradually decreases as the distance to the blasting source increases. The ratio has a maximum value of 1.12. When the ground surface vibration velocity is 9.07 mm/s, the pile top vibration velocity is approximately 10.16 mm/s. This suggests that when the concrete strength is lower than 50% of the design strength, the safe blasting vibration velocity for the pile is 10.16 mm/s.
Figure 18 compares the peak vibration velocities at the pile top and at the ground surface around the pile when the concrete strength of the pile is equal to the design strength. It indicates that the increase in the concrete strength does not affect the variation tendency of the peak vibration velocities at these two locations, but the corresponding ratio increases. The peak vibration velocity at the pile top is 1.33 times as much as the peak vibration velocity at the ground surface around the pile.
6. Conclusions
This paper analyzes the influence of mountain blasting on the pile under the storage tank through in situ tests and numerical simulations. Based on the standard for allowable vibration of building engineering (GB 50868-2013), the following conclusions are drawn.
(1) Safety evaluation index of the pile under the influence of blasting. According to Section 8.0.5 in the standard, for buildings under construction, when the strength of concrete or mortar is lower than 50% of the design strength, construction vibrations should be avoided. However, based on the experimental and numerical simulation results in this study, when the blasting-induced vibration velocity is less than 10.16 mm/s, blasting has no impact on the pile. Additionally, Table 8.0.2-2 in the standard indicates that when the pile strength reaches 50~70% of the designed value, the safe vibration velocity for the pile is 16.8 mm/s. When the pile strength reaches the designed value, the safe vibration velocity is 24 mm/s.
(2) Safe distance to the blasting source. Generally, the safe distance is determined by adjusting the charge weight for one segment based on the safety evaluation index. According to the above conclusion, the safety evaluation index is the vibration velocity of the pile itself. However, parameters K and α in Sodev’s formula are determined by fitting the experimental results of the ground surface vibration velocity. Therefore, when the safe distance is calculated, the safety evaluation index of the pile should be transformed into the ground surface vibration velocity thresholds, i.e., 9.07 mm/s, 12.6 mm/s and 18 mm/s. Then, the safe distances corresponding to the different maximum charge weights for one segment can be calculated.
(3) Influence of blasting on the pile. As the distance to the blasting source increases, the ratio of the peak vibration velocity at the pile top to that at the ground surface around the pile gradually decreases. As the concrete strength increases, however, this ratio gradually increases.
The above research can provide valuable references for similar projects.
Author Contributions
Conceptualization, L.L.; methodology, L.L.; formal analysis, Q.Y. and J.C.; investigation, X.Z.; resources, W.C.; data curation, L.L. and Y.T.; writing—original draft preparation, Y.W.; writing—review and editing, Y.T.; supervision, W.C.; project administration, W.C.; funding acquisition, W.C. All authors have read and agreed to the published version of the manuscript.
Funding
This research was funded by the Youth Research Fund of CABR Foundation Engineering Co. Ltd. (Grant Number 20241602341030005).
Data Availability Statement
The data, models and codes that support the findings of this study are available from the corresponding author upon reasonable request.
Conflicts of Interest
Authors Wengang Cai, Jiuhuan Cheng and Qiankun Yang were employed by the company Offshore Oil Engineering Co., Ltd. Author Xiaolei Zhao was employed by the company China Hebei Construction & Geotechnical Investigation Group Ltd. Author Yong Wu was employed by the company Beijing Xinqiao Technology Development Co., Ltd. The remaining authors declare that the research was conducted in the absence of any commercial or financial relationships that could be construed as a potential conflict of interest.
References
- Zhao, M.S.; Liang, K.S.; Cao, Y.; Du, M.Z. Discussion on the security criteria of construction (structure) of building under blasting vibration. Blasting 2008, 25, 24–27. [Google Scholar]
- Yang, G.; Wang, G.; Lu, W.; Yan, P.; Chen, M. Damage assessment and mitigation measures of underwater tunnel subjected to blast loads. Tunn. Undergr. Space Technol. 2019, 94, 103131. [Google Scholar] [CrossRef]
- Zhao, Y.; Shan, R.; Wang, H. Blasting vibration effect and safety evaluation method of railway cross tunnels. Tunn. Undergr. Space Technol 2024, 145, 105588. [Google Scholar] [CrossRef]
- Tan, Z.Z.; Zhang, G.H.; Chen, M.; Zhang, J.T.; Cheng, Y.L. Control Technique of Oversized Fragments in Pingtanyuan Pumped Storage Power Station. 2025. Available online: https://link.cnki.net/urlid/42.1164.TJ.20250320.0944.002 (accessed on 24 April 2025).
- He, J.H.; Cheng, T.J.; Cheng, C.; Liu, X.L.; Jiang, N.; Shao, Y.; Liu, Y. The structure of bridge pile foundation under the action of blasting vibration in canal excavation. Chin. J. High Press. Phys. 2025. accepted. [Google Scholar] [CrossRef]
- Yang, Y.M.; Zhao, M.X.; Zhou, C.B.; Zhang, S.; He, G.L.; Hao, R.H.; Zhang, Y.Q. Vibration response and safety control of frame-shear structure adjacent to mine blasting. Blasting 2025, 42, 166–174. [Google Scholar]
- Jiang, S.P.; Han, Z.B.; Lin, F.; Chen, X.B. Study on the influence of blasting operation on the vibration of surrounding buildings. Yellow River 2021, 43, 248–250. [Google Scholar]
- Yan, Z.X.; Wang, Y.H.; Jiang, P.; Wang, H.Y. Study on measurement of blast-induced seism and building safety criteria. Chin. J. Rock Mech. Eng. 2003, 22, 1907–1911. [Google Scholar]
- Guan, X.M.; Fu, H.X.; Wang, M.S. Blasting vibration characteristics monitoring of tunnel under-passing hillside buildings in short-distance. Rock Soil Mech. 2014, 35, 1995–2003. [Google Scholar]
- Shen, Y.S.; Gao, B.; Wang, Z.J.; Meng, F.J. Effect of blasting in double line tunnel on existing tunnel. Chin. J. Undergr. Space Eng. 2009, 5, 980–984. [Google Scholar]
- Zheng, M.X.; Xia, Y.M.; Hu, G.P.; Liu, J.H. Impact analysis of blasting vibration on the safety of existing high speed tunnel lining. Chin. J. Undergr. Space Eng. 2018, 14, 813–818. [Google Scholar]
- Wu, X.D.; Miao, X.M.; Gong, M.; Su, J.P.; Zhu, Y.Q.; Chen, X.L. Vibration safety threshold and control technology for blasting to prevent seawater intrusion in coastal tunnel sections near faults. J. Mar. Sci. Eng. 2024, 12, 1646. [Google Scholar] [CrossRef]
- Wu, X.D.; Jia, J.Y.; Wang, L.K.; Zhou, S.J.; Wu, H.J.; Zhao, X.X.; Gong, M. Easer hole design method based on the principle of minimum burden at the hole bottom and its application in tunnel blasting. Processes 2024, 12, 1581. [Google Scholar] [CrossRef]
- Wu, X.D.; Gong, M.; Wu, H.J.; Liu, X.Y. Parameter calculation of the initiating circuit with mixed use of nonel detonators and electronic detonators in tunnel controlled-blasting. Tunn. Undergr. Space Technol. 2021, 113, 103975. [Google Scholar] [CrossRef]
- Lu, W.B.; Li, H.B.; Chen, M.; Zhou, C.B.; Wu, X.X. Safety criteria of blasting vibration in hydropower engineering and several key problems in their application. Chin. J. Rock Mech. Eng. 2009, 28, 1513–1520. [Google Scholar]
- Lu, W.B.; Lai, S.X.; Zhu, C.Y.; Shu, D.Q. Safety standards of blast vibrations adopted in rock base excavation of three gorge project. Blasting Shock Waves 2001, 21, 67–71. [Google Scholar]
- GB 6722-2014; Safety regulations for blasting. China Architecture & Building Press: Beijing, China, 2011.
- GB 50868-2013; Standard for allowable vibration of building engineering. China Architecture & Building Press: Beijing, China, 2013.
Figure 1.
Layout of the storage tanks and surrounding mountains.
Figure 1.
Layout of the storage tanks and surrounding mountains.
Figure 2.
Typical stratigraphic profile beneath Tank 4#.
Figure 2.
Typical stratigraphic profile beneath Tank 4#.
Figure 3.
Plan of the test piles and monitoring line.
Figure 3.
Plan of the test piles and monitoring line.
Figure 4.
Profile of the test piles.
Figure 4.
Profile of the test piles.
Figure 5.
Drill holes on the test pile.
Figure 5.
Drill holes on the test pile.
Figure 6.
Variation of the predominant frequency with the distance to the blasting source.
Figure 6.
Variation of the predominant frequency with the distance to the blasting source.
Figure 7.
Attenuation curve of the maximum amplitude with the distance to the blasting source.
Figure 7.
Attenuation curve of the maximum amplitude with the distance to the blasting source.
Figure 8.
Concrete samples obtained from the test piles.
Figure 8.
Concrete samples obtained from the test piles.
Figure 9.
Variation of the compressive strengths of the test piles with depth.
Figure 9.
Variation of the compressive strengths of the test piles with depth.
Figure 10.
Three-dimensional finite element model for the blasting test.
Figure 10.
Three-dimensional finite element model for the blasting test.
Figure 11.
Schematic diagram of the equivalent blasting pressure in a single hole.
Figure 11.
Schematic diagram of the equivalent blasting pressure in a single hole.
Figure 12.
Time-history curve of the equivalent blasting pressure in a single hole.
Figure 12.
Time-history curve of the equivalent blasting pressure in a single hole.
Figure 13.
Boundary conditions and mesh partition.
Figure 13.
Boundary conditions and mesh partition.
Figure 14.
Contours of the blasting-induced vibration velocities at t = 800 ms.
Figure 14.
Contours of the blasting-induced vibration velocities at t = 800 ms.
Figure 15.
Comparison of the measured and simulated vibration velocities.
Figure 15.
Comparison of the measured and simulated vibration velocities.
Figure 16.
Locations of the monitoring points.
Figure 16.
Locations of the monitoring points.
Figure 17.
Peak vibration velocities at the pile top and at the ground surface around the pile when the concrete strength of the pile is 30% of the design strength.
Figure 17.
Peak vibration velocities at the pile top and at the ground surface around the pile when the concrete strength of the pile is 30% of the design strength.
Figure 18.
Peak vibration velocities at the pile top and at the ground surface around the pile when the concrete strength of the pile is equal to the design strength.
Figure 18.
Peak vibration velocities at the pile top and at the ground surface around the pile when the concrete strength of the pile is equal to the design strength.
Table 1.
Basic parameters of the blasting tests.
Table 1.
Basic parameters of the blasting tests.
| | Total Charge Weight/kg | Number of Holes | Number of Rows | Maximum Charge Weight for One Segment/kg | Time
Interval/ms | Total Time/ms |
|---|
| Blasting Source 1 | 5952 | 100 | 6 | 104 | 40 | 1185 |
| Blasting Source 2 | 5784 | 133 | 7 | 74 | 40 | 1439 |
| Blasting Source 3 | 5952 | 53 | 4 | 120 | 40 | 800 |
| Blasting Source 4 | 5948 | 98 | 5 | 92 | 40 | 1195 |
Table 2.
Times of the blasting tests.
Table 2.
Times of the blasting tests.
| Blasting Source | Pile Number | Concrete Grade | Time of Concrete Pouring | Time of Blasting | Time Interval/h |
|---|
| 1 | S3 | C40 | 06:48~08:26 | 12:30 | 5.7 |
| 2 | S1 | C40 | 05:23~07:30 | 14:30 | 9.1 |
| 3 | S2 | C40 | 05:50~08:30 | 12:00 | 6.2 |
Table 3.
Low-strain testing results of the test piles.
Table 3.
Low-strain testing results of the test piles.
Pile
Number | Pile
Length/m | Pile
Diameter/mm | Wave Velocity/(m/s) | Structural Integrity of Pile Body | Type |
|---|
| S1 | 22.00 | 1500 | 3868 | Integral | Ⅰ |
| S2 | 21.84 | 1500 | 3773 | Integral | Ⅰ |
| S3 | 21.85 | 1500 | 3823 | Integral | Ⅰ |
Table 4.
Mechanical parameters of the soil and structure.
Table 4.
Mechanical parameters of the soil and structure.
| Material | Elastic Modulus
/GPa | Poisson’s Ratio | Density
/(kg/m3) | Internal Friction Angle/° | Cohesion
/kPa |
|---|
| Plain fill | 0.012 | 0.38 | 12.4 | 12 | 18 |
| Muddy silty clay | 0.03 | 0.32 | 17.5 | 9 | 18 |
| Tuff | 5.00 | 0.30 | 23.0 | 40 | 58 |
| C40 concrete | 10.00 | 0.2 | 25.0 | / | / |
Table 5.
Peak vibration velocities at monitoring points on the pile top.
Table 5.
Peak vibration velocities at monitoring points on the pile top.
| Monitoring Point Number | Nearest Horizontal
Distance to the Blasting Source/m | Peak Vibration Velocity/(cm/s) |
|---|
| x-Direction | y-Direction | z-Direction | Maximum Value |
|---|
| 1 | 121 | 0.79 | 0.70 | 1.37 | 1.37 |
| 2 | 126 | 0.57 | 0.54 | 1.12 | 1.12 |
| 3 | 130 | 0.54 | 0.28 | 1.03 | 1.03 |
| 4 | 135 | 0.47 | 0.33 | 0.91 | 0.91 |
| 5 | 138 | 0.43 | 0.24 | 0.93 | 0.93 |
| 6 | 148 | 0.34 | 0.22 | 0.81 | 0.81 |
| 7 | 157 | 0.49 | 0.25 | 0.65 | 0.65 |
| 8 | 167 | 0.16 | 0.17 | 0.39 | 0.39 |
Table 6.
Peak vibration velocities at different parts on the pile.
Table 6.
Peak vibration velocities at different parts on the pile.
| Monitoring Point Number | Soil Layer | Peak Vertical Vibration Velocity/(cm/s) |
|---|
| 1 | Plain fill | 1.09 |
| Muddy silty clay | 0.81 |
| Tuff | 0.53 |
| 2 | Plain fill | 1.12 |
| Muddy silty clay | 0.67 |
| Tuff | 0.56 |
| 3 | Plain fill | 1.03 |
| Muddy silty clay | 0.73 |
| Tuff | 0.57 |
| Disclaimer/Publisher’s Note: The statements, opinions and data contained in all publications are solely those of the individual author(s) and contributor(s) and not of MDPI and/or the editor(s). MDPI and/or the editor(s) disclaim responsibility for any injury to people or property resulting from any ideas, methods, instructions or products referred to in the content. |
© 2025 by the authors. Licensee MDPI, Basel, Switzerland. This article is an open access article distributed under the terms and conditions of the Creative Commons Attribution (CC BY) license (https://creativecommons.org/licenses/by/4.0/).


