Article

Local Fracture of a Reinforced Concrete Beam Under High-Velocity Impact on Biaxial Bending and Torsion Deformation

by
Anatoly Alekseytsev
Department of Reinforced Concrete and Stone Structures, Moscow State University of Civil Engineering (National Research University), 26, Yaroslavskoye Shosse, 129337 Moscow, Russia
Buildings 2025, 15(22), 4153; https://doi.org/10.3390/buildings15224153
Submission received: 7 October 2025 / Revised: 10 November 2025 / Accepted: 14 November 2025 / Published: 18 November 2025
(This article belongs to the Special Issue Dynamic Response of Structures)

Abstract

Designing buildings and structures that meet advanced mechanical safety standards is a relevant task in the present-day socio-economic environment, given that structural safety is evaluated by resistance to progressive collapse. The design of key elements, capable of withstanding accidental actions, means preventing the escalation of progressive collapse. This task also involves evaluating the bearing capacity of reinforced concrete beams under high-velocity impacts triggering supplementary dynamic loading by bending and torsion moments. The authors present their method for the dynamic load analysis based on the development of limiting surfaces. For this purpose, the value of the J-integral is computed to analyze the fracture of a rebar, and the inability of a rebar to take loads is simulated by a normalized time function. The resulting conclusion is that the proposed design method, applied to key elements of buildings and structures, improves their mechanical safety in the case of dynamic loading that causes local damage and triggers resistance to combined stress, including bending in two planes and torsion. It has been established that at a bending load level constituting 80% of its ultimate value or higher, a combined impact bending-torsional load, as low as 25% of its own ultimate capacity, can cause the rupture of tensile reinforcement and lead to a loss of mechanical safety in conventionally designed beams.

1. Introduction

Analysis of the combined effects of torsion and bending is a relevant method due to an increase in the complexity of advanced structural solutions for buildings and structures and tighter reliability standards. According to several studies, a combination of loads, including those causing torsion, can reduce the load-bearing capacity of structures by 10–25%. Hence, it is necessary to add such actions to structural design standards. Both compressed and bending elements are subjected to supplementary torsional loads. Since resistance to loads of this type remain understudied, experiments were conducted. For example, the article [1] presents an experimental study of the load-bearing capacity of reinforced concrete columns under the action of compressive forces and torsion. Tests were conducted on specimens featuring different types of reinforcement; these tests involved varying loads. The conclusion is that a 15% increase in longitudinal reinforcement raises the column strength by 12%. The author of work [2] describes experimental and numerical analyses of reinforced concrete beams whose webs had openings, given that such beams were strengthened by different materials. The results show that fiberglass rebars (GFRP) increase the bearing capacity by up to 30%, while ferrocement boosts strain resistance by 25%. In the work [3], standard reinforced concrete beams were tested by torsional loads. It was found that a 20% increase in the number of stirrups increased torsional strength by 30%. The data thus obtained served as the basis for an analytical model used to more accurately calculate the bearing capacity of such structures.
Numerical modeling is an effective tool used to study structures subjected to supplementary torsional loads due to the complex nature of the phenomenon under consideration. A new model was developed in [4] to analyze the behavior of reinforced concrete structures with supplementary steel fibers under pure torsion. Numerical simulation and its experimental verification showed that a 1% increase in the amount of supplementary steel fibers rose the bearing capacity to 25%. Numerical models are also effectively applied to some types of structures [2] and frame systems to analyze progressive collapse. The study [5] analyzes the behavior of glass fiber reinforced plastic (GFRP) columns under reversed loading, including torsion moments. The experiment proved that this type of reinforcement increased the strength of columns by 25% compared to the steel reinforcement. Numerical simulation optimized reinforcement schemes for bridge structures. The work [6] discusses numerical simulations of single-story substructures used to analyze the progressive collapse of multi-story frame structures. The authors performed simulations and compared their results with those obtained using a full-size building model. The results show that such substructures can reproduce nearly 85% of the condition of a structure reproduced as a full-size model.
A considerable amount of research deals with the reinforcement efficiency evaluation of (1) structures subjected to combined torsional loads and (2) new materials. The work [7] proposes a material testing method that involves spiral notches made to investigate the fracture of composites. Experiments involving different types of reinforcement show that the direction of fibers greatly affects resistance to fracture. The work [8] (Figure 1) analyzes torsion-triggered damage of reinforced concrete beams, featuring different reinforcement schemes and stirrup spacing. Experimental results show that the torsion resistance of BFRP beams is 18% higher than that of the steel reinforcement. Work [9] describes an experimental study on reinforced concrete beams with inclined spirals used as reinforcement. The results show that spirals increase the torsion strength up to 30%. The authors also analyze the effect of reinforcement parameters and offer recommendations on their optimization for engineering solutions.
Several works study the dynamic effects of loads on the load-bearing capacity, as well as multiple directions of loading. The work [10] addresses the dynamic behavior of box-shaped reinforced concrete structures under torsional loading. The study shows that a 10% increase in prestressing reduces the probability of fracture by 15%. The work [5] deals with reversed loading. Another article [11] addresses the action of dynamic loading on reinforced concrete beams with regard for resistance to torsion. Composite carbon materials were applied to increase strength. Strengthening resulted in an increase in the maximum torsion moment up to 40%, while deflections were reduced by 25%. The results of the study are helpful for designers of bridges and other structures subjected to high dynamic loading.
Strengthening and restoration of structures, made of reinforced concrete and other materials, is another field where torsion and its effects are studied in detail. Various materials and strengthening methods are used for this purpose. The work [12] presents the results of experiments, involving reinforced concrete beams reinforced with a steel channel and subjected to pure torsion. Several specimens of beam were tested; they differed in shape and arrangement of steel elements. The study shows that channels can greatly increase the stiffness and torsional resistance. The work [13] studies box girders reinforced with steel and composite basalt fiber rods. The experiments show that a combination of composite basalt fiber rods and steel stirrups increases the strength of a structure by 15–25%. A reduction in the number of shear-triggered cracks and an increase in the total fracture energy prove the advantages of this system. The authors of work [14] designed a bending force model for columns reinforced with angle bars and subjected to simultaneous torsional action. The study shows that a 30% increase in angle bars leads to an increase in torsional resistance reaching up to 20%. The model presented in the paper was verified experimentally. The authors of work [15] describe a unique testing system designed for the simultaneous loading of concrete structures with axial and torsion moments. Experimental studies involving specimens with different reinforcement ratios demonstrate that a combination of loads reduces the strength of structures by 10–15% compared to simple loads, confirming the need to analyze such loads in design. The article [16] addresses experimental and analytical analyses of box girders with temporary openings that are strengthened with carbon fiber tapes. The results show that composite materials greatly increase torsional strength, reducing the probability of sudden failures.
An important issue in the practical design of civil engineering facilities is studying the resistance of frame structures to torsional loads. Studies focus on the nonlinear behavior and seismic stability of buildings. The authors of work [17] performed numerical analysis of 3D frames by simulating interaction between axial, torsional, and bending loads. Algorithms were developed to analyze the plastic behavior of concrete and interaction between rebars and concrete. Models feature high accuracy in predicting fracture under combinations of loads. The work [18] describes the results of tests that involved reinforced concrete structures subjected to the foundation rotation under seismic loading. Three models were used to generate the experimental data showing that soil rotation, if taken into account, increased the deviation amplitude by 20%. The authors propose methods of seismic design optimization to mitigate such effects. The work [19] presents a mathematical model for reinforced concrete frame structures that takes into account nonlinear effects of torsion. Numerical experiments and laboratory data were used to develop a finite element capable of accurately modeling combined effects of loading. The authors of work [20] investigate the seismic stability of symmetrical reinforced concrete frames subjected to torsional loads. The result is that even minor geometrical imperfections could cause an increase in frame deformations reaching 15%. Strengthened joints can mitigate such effects. The authors emphasize the importance of torsional loads in the design of buildings for earthquake-prone areas. The article [21] (Figure 2) addresses the reliability of reinforced concrete frame structures whose elements are subjected to combined bending and torsional loads. Hybrid reinforcement (steel and composites) can increase the strength of elements up to 25%. The results include recommendations on the rational arrangement of reinforcement bars to improve the reliability of structures.
Supplementary torsion can have a negative effect on mechanisms of progressive collapse of building frames subjected to accidental actions. Numerous works focus on these phenomena. The work [22] presents a method based on the energy approach used to detect the limit states of reinforced concrete multistory frames in the case of removal of columns. The authors investigated the dynamic behavior of buildings subjected to sudden column removal and determined the key parameters affecting the stability of the system. The experiments show that a 15% increase in the reinforcement strength can reduce the risk of collapse by 20%. The study [23] focuses on analyzing the behavior of CFRP-reinforced rubberized concrete under progressive collapse. Ten scenarios of column removal from different points of structures were developed to conduct simulation studies. The results show that CFRP increases collapse resistance by 30–40%. Authors of the work [24] studied the progressive collapse of reinforced concrete frames caused by the removal of an edge column. Torsional loads are relevant here. Stirrups added to key nodes increase the stability limit by 25%. The article [25] addresses the mechanism of progressive collapse of buildings under seismic loading. This work presents a more accurate seismic collapse risk assessment of buildings in seismically active areas. The authors of work [26] performed dynamic modeling of the progressive collapse of prestressed reinforced concrete frames with walls that had no openings. It was found that the stiffness of a wall increased the collapse resistance of buildings by 35%. This method of collapse probability evaluation is used to design safe buildings in the case of loading uncertainty. The article [27] investigates the effect of impact column removal on the behavior of reinforced concrete frame structures. Tests involving models of six-storey buildings show that composite rebars increase structural stability by 20%. Simulations prove that strengthening of joints in key zones can minimize consequences of such fractures. The study [28] addresses the economic and structural assessment of the life-cycle stability of reinforced concrete frame structures. The authors present a method for analyzing costs and benefits of strengthening techniques preventing progressive collapse. Calculations involving real data show that rebars and composites can greatly reduce long-term risks at relatively small additional costs. The authors of the work [29] study the behavior of reinforced concrete frames with supplementary steel fibers and rubberized concrete under progressive collapse. Simulations show that the probability of collapse goes down to 15–20% if the ratio of steel fibers reaches 1%. Analysis of central and edge column removal scenarios proves that such frames demonstrate higher resistance to local defects. The study [30] analyzes the progressive collapse resistance of 3D frame structures reinforced with composite steel-FRP bars. The work [31] examines the 3D behavior of reinforced concrete frames under different column removal scenarios. The highest stability was demonstrated by structures whose edge columns were strengthened. Hence, prevention of progressive collapse requires an integrated approach that includes analysis of torsional loads.
Stability in case of accidents caused by combinations of loads, including torsional loads, is investigated both in terms of actions addressed in designs (post-stressed joints) [32] and environmental exposure (corrosion) [33]. Advanced information technologies, such as neural networks, can be employed to study cases of fracture that are hard to predict [34]. The research topics covered in this article are also addressed in other relevant and contemporary works [35,36,37], which examine the bending-torsion effect under dynamic loading of structures.
The literature review allows formulating the following areas of research:
  • Analysis of combined torsion and bending requires supplementary research and revision of regulations with a focus on load combinations, including new analytical and numerical approaches.
  • Risks of progressive collapse of structures can be effectively reduced by optimizing parameters of joints, using composites to strengthen structures, and developing accurate calculation and prediction methods.
  • Dynamic torsional loads, including a combination of torsion and bending, can greatly affect the mechanical safety of structures, which is proved by experimental and theoretical studies.
Existing studies of the torsional-bending behavior of bar structures are aimed at determining specific parameters of the stress-strain state under specific specified loads, which under other loads may lead to a loss of mechanical safety of structures. This is the main drawback of many studies. Therefore, there is a need to develop a unified method based on the construction of an envelope surface that separates the strength region from the loss of load-bearing capacity region in the solution space.
Finding an operational load whose values are within the found strength region will guarantee the safety of the structure. In this case, the combinations of operational loads can be arbitrary.
This project focuses on dynamic bending and torsional loading of a floor beam in a building if this load is applied as the impact pulse. Such actions are possible in emergencies caused by man-made factors, industrial accidents, etc. The limit bearing capacity of a beam under various combinations of regular and extraordinary loads is investigated.
The advantage of this method is that it allows load limits to be set to ensure mechanical safety under any possible combinations of dynamic torsional-bending and other loads.

2. Materials and Methods

2.1. Problem Statement and Target of Research

The mechanical safety of buildings and structures under accidental actions is considered in this article. A building or structure is safe if its structural system, as a whole, demonstrates robustness in case of local damage. Robustness is the maintenance of joints strength and absence of any great distortions in the geometry of a structural system. Such behavior of a structure is possible if an emergency action does not cause key elements to fail. One of these key elements is a floor beam, whose fracture will cause progressive collapse of the frame as a whole. Let us take a closer look at the beam.
The accidental loading of a beam is analyzed as a short-term impact made by an absolutely rigid impactor, whose mass is much smaller than that of a beam. This impact will be considered in terms of high-velocity dynamics. The energy method based on the J. Rice integral will be employed to evaluate the nonlinear strain of materials, geometrical nonlinearity, and potential fracture of materials.
A 3D finite element method is used to analyze the stress-strain state, and hexahedral elements, simulating 3D concrete beam elements, are also employed.
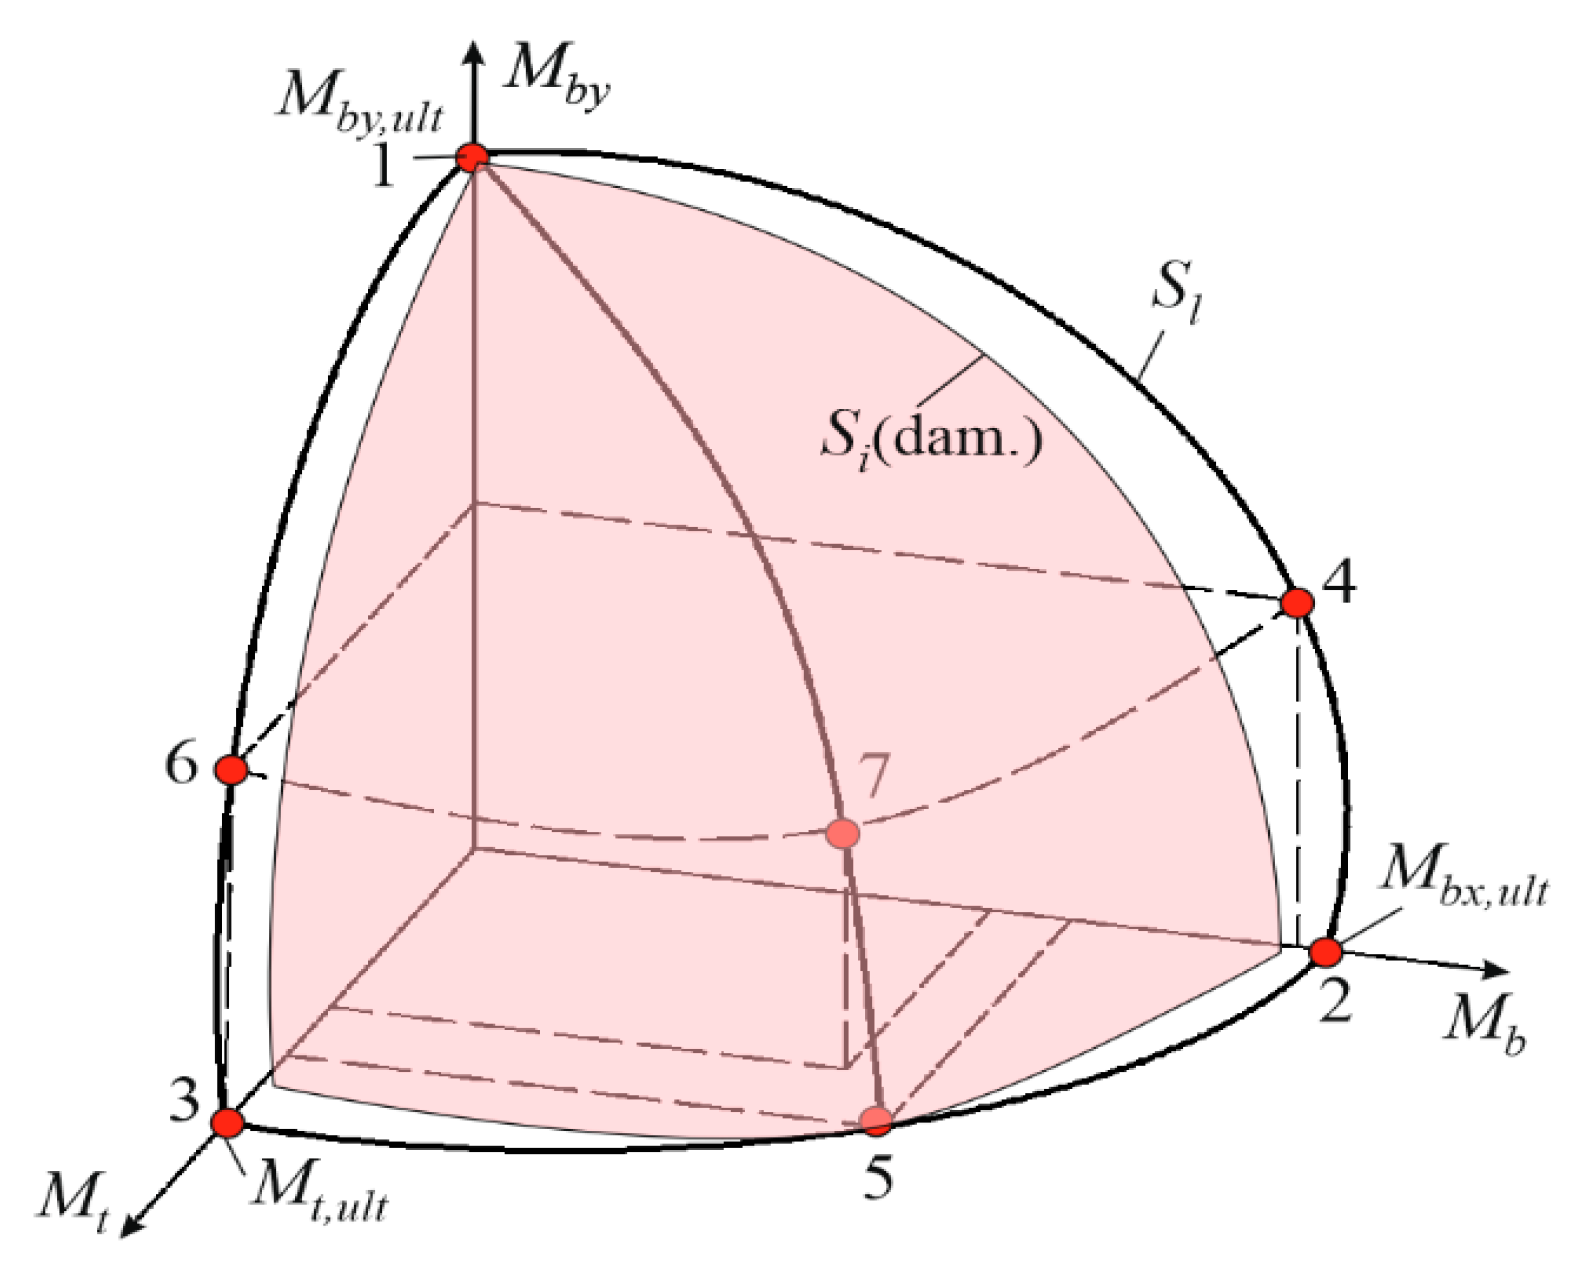
The task is to evaluate the safety of a non-prestressed reinforced concrete beam subjected to several types of loading by constructing the limiting surface S l (Figure 3) to analyze the bearing capacity in the case of accidental loading that causes bending and torsion. Figure 3 shows M t , u l t , M b x , u l t , M b y , u l t as the limiting values of the torsion moment, bending moments relative to the coordinate axes.
The surface is constructed for the most dangerous of C s cross-sections and loading options. The following extremum problems are to be solved for this purpose:
M b 1 = min C s M b y M b y , u l t M b x = 0 , M t = 0 ; M b 2 = min C s M b x M b x , u l t M t = 0 , M b y = 0 ; M t 3 = min C s M t M t , u l t M b x = 0 , M b y = 0 ; M b 4 = min C s M b x max M b y = M b y , u l t / 2 , M t = 0 ; M b 5 = min C s M b x max M b y = 0 , M t / M b x = k ; M t 6 = min C s M t max M b x = 0 , M b y = M b y , u l t / 2 ; M b 7 = min C s M b x max M b y = M b y , u l t / 2 , M t / M b y = k ,
where k is a dimensionless coefficient depending on the loading pattern; M b 1 is the bending moment for point 1 in Figure 3; M b 2 is the bending moment for point 2; M t 3 is the torsion moment for point 3, etc. For any of the cross-sections S i (including those damaged ( dam . ) ) of the beam, the surface S l must be the enveloping surface. If the surface extends beyond S l for any section S i , it becomes part of that surface. Limit load values identified using this surface determine whether the beam is safe.
Mathematically, this safety criterion can be formulated as a new boundary inequality of the first group of limit states:
P ¯ d ( t ) + P ( V ¯ ( t ) ) P ¯ u l t = f ( V ¯ ( t ) ) , V ¯ ( t ) = N ( t ) , Q x ( t ) , Q y ( t ) , M x ( t ) , M y ( t ) , M t ( t )
where P ¯ d ( t ) is the vector of ultimate generalized dynamic load varying in time t ; V ¯ ( t ) is the vector of internal forces N ( t ) M t ( t ) , affected by the local damage of concrete and rebars within some time period; P ( V ¯ ( t ) ) is the vector of loads simulating the local damage in time.
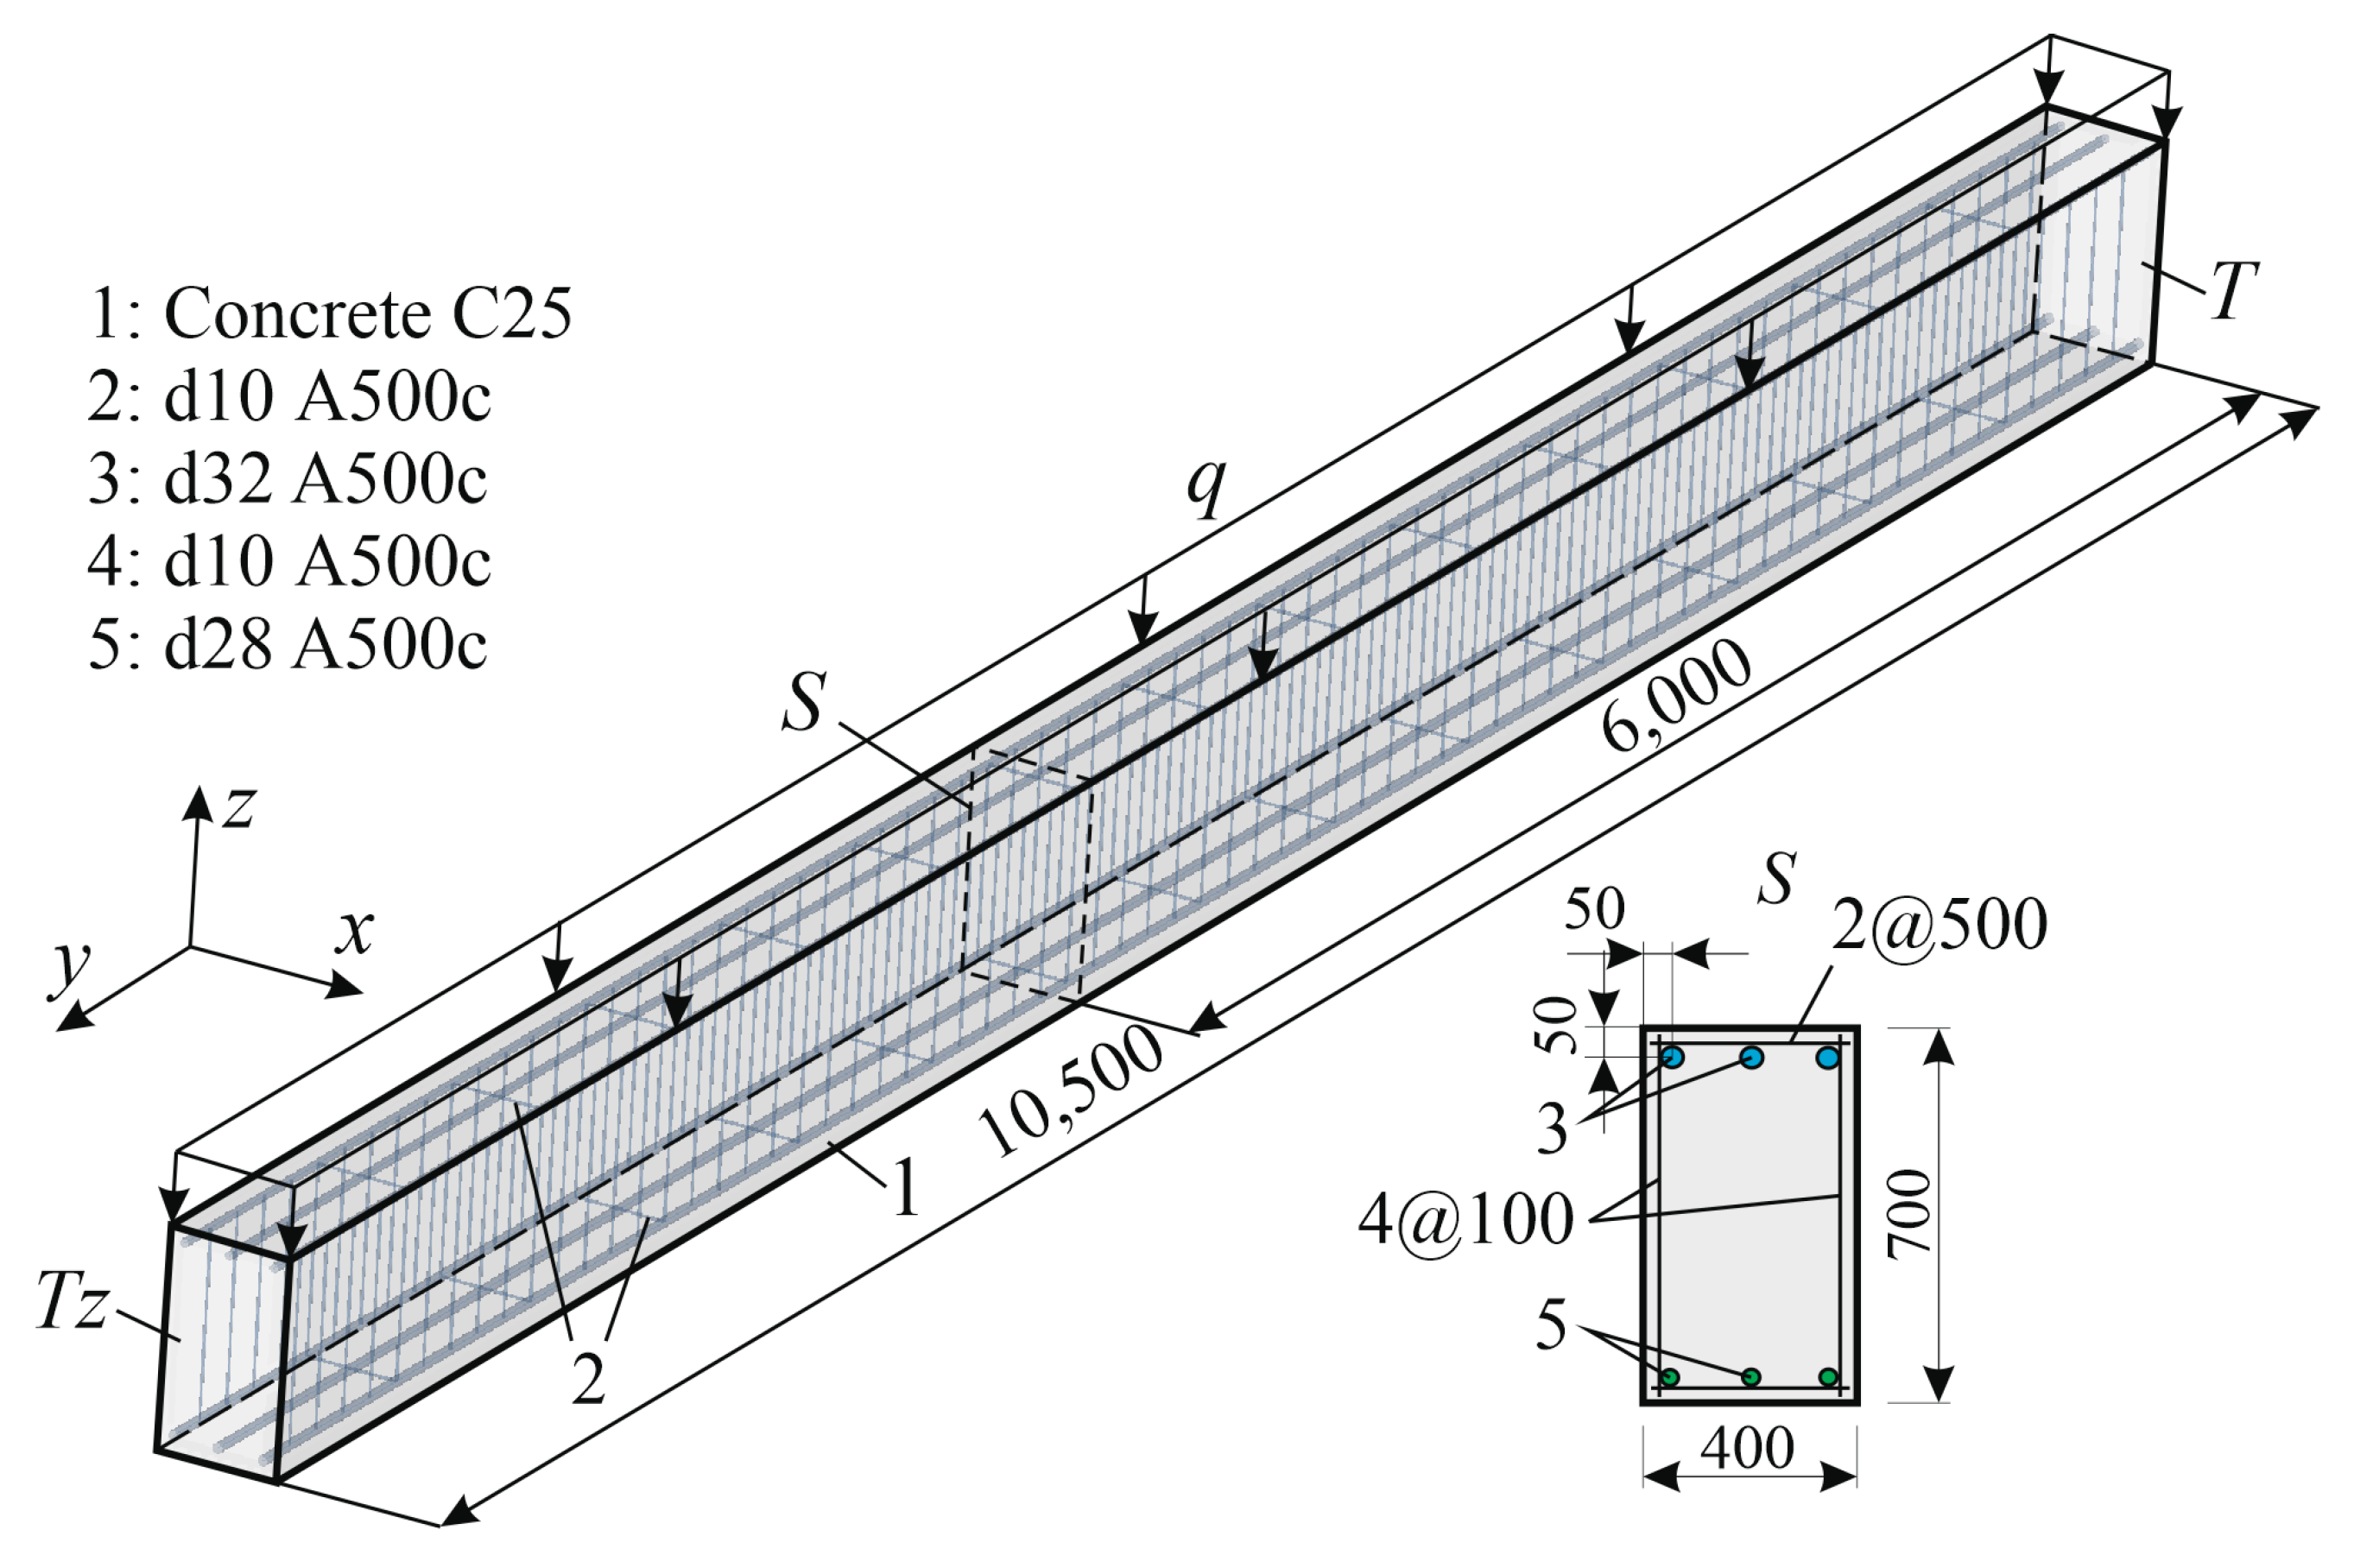
A reinforced concrete beam strengthened with steel rebars without prestressing is analyzed in Figure 4. The computation of limiting values according to (1) accompanied the structural analysis performed in the dynamic formulation using the Newton–Raphson method for nonlinear problems. The force error of 0.001 was used as an iteration convergence criterion.

2.2. Problem Constraints

The condition of survivability of a reinforced concrete beam subjected to an accidental action is formulated as follows:
q ¯ = f ( M t , M b x , M b y ) q ¯ u l t = f ( M t , u l t , M b x , u l t , M b y , u l t )
where q ¯ is a generalized load vector determining the position of points in the cross-sections on the surface S i , which corresponds to the actual bearing capacity of a loaded beam; q ¯ u l t is the limit value of the load vector determining the ultimate bearing capacity (at points on the surface S l (Figure 3)).
A method of direct integration of equations, describing the motion of a structure, is used to solve this problem in the 3D formulation, and condition (3) is satisfied, if the integration process is stable throughout the entire time interval. The process interruption by a mistake evidences the insufficient conditioning of the stiffness matrix, which indicates the emergence of geometric variability of individual elements of a structure. This is possible due to the unacceptable plasticity or large strain-free displacements, which means (a) loss of robustness and, consequently, (b) compromised mechanical safety of the beam.

2.3. Basic Provisions of the FEM Analysis

A direct step method of numerical integration was used to solve the problem:
M y ¨ ( t ) + β K y ˙ ( t ) + K y ( t ) = F ( t ) + G , K = K c σ + K c g + K r σ + K r g , M = M c + M r
where K c σ , K r σ are matrices of tangent coefficients of elasticity for concrete and rebars determining their minor strain; K c g , K r g are geometrical matrices; M c , M r are nodal mass matrices of concrete and rebars; β is the structural damping coefficient; y ( t ) , y ¨ ( t ) , y ˙ ( t ) are nodal displacements, accelerations and velocities, respectively; F ( t ) is the vector of nodal load; G is the vector of gravity forces.
A time step of 0.05 s was used in all computations; the total integration time was 2.8 s, and up to 30 iterations were used to solve the nonlinear problem at each step. The analysis of natural vibrations was performed to find out that the bending-torsional pattern of vibrations, corresponding to loading, was excited at a frequency of 10.3 Hz. At this frequency, damping equal to 0.05 was taken into account.

2.3.1. Simulation of Loads

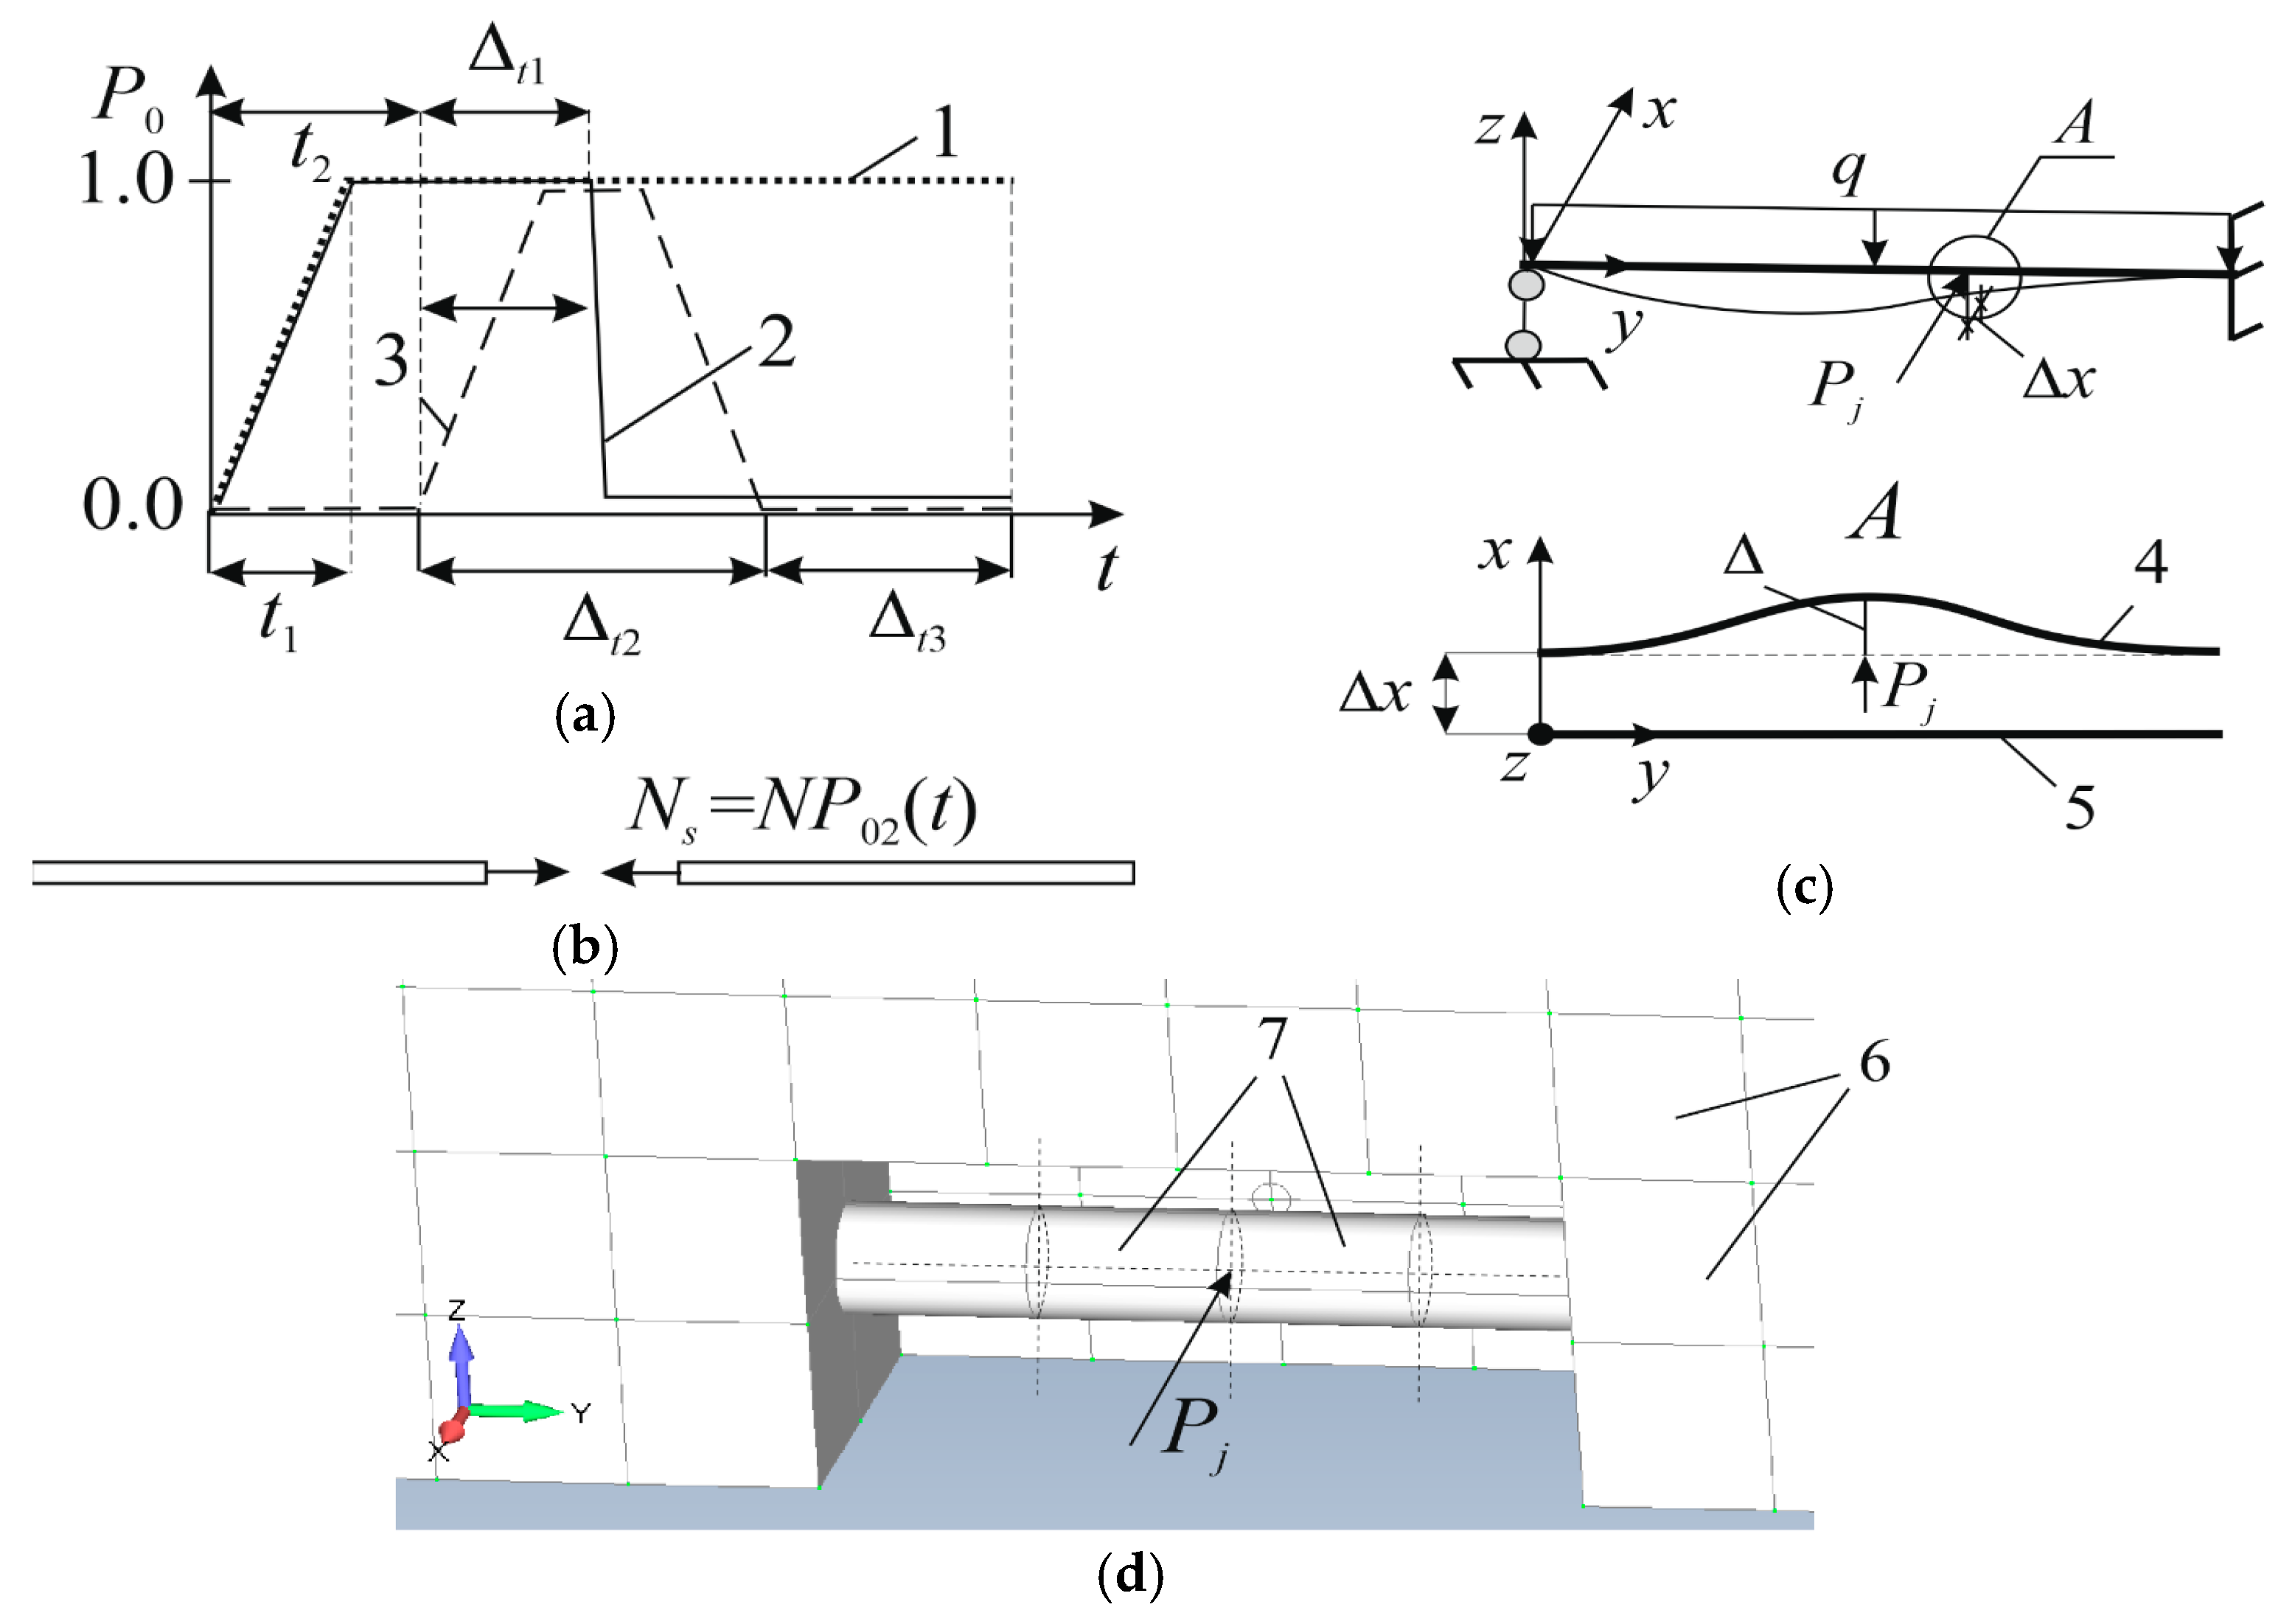
All loads acting on a structure were assumed to be time-variant (Figure 5a). Final values of loads Q i were computed using the following formula:
Q i = Q P 0 i ( t )
where Q is the nominal load value; P 0 i ( t ) is the function provided in (Figure 5a); i = 1 , 2 , 3 .
Static operation load (curve 1, i = 1 ) was growing during time t 1 ; it was followed by oscillation damping during time t 2 t 1 , and the static state was reproduced during the remaining time of integration. The axial force in rebars (curve 2, i = 2 , Figure 5b) was growing same as the operation load, and it remained unchanged until time t 2 + Δ t 1 . After this point, the rupture of rebars was simulated, and the axial force equaled zero. Emergency load (curve 3, i = 3 ) was applied after the static equilibrium of the system; this load triggered a force in the rebar (after time t 2 ; the total time of action was Δ t 2 ). If the bearing capacity of the system was preserved after the emergency action, oscillations were damped during time Δ t 3 .
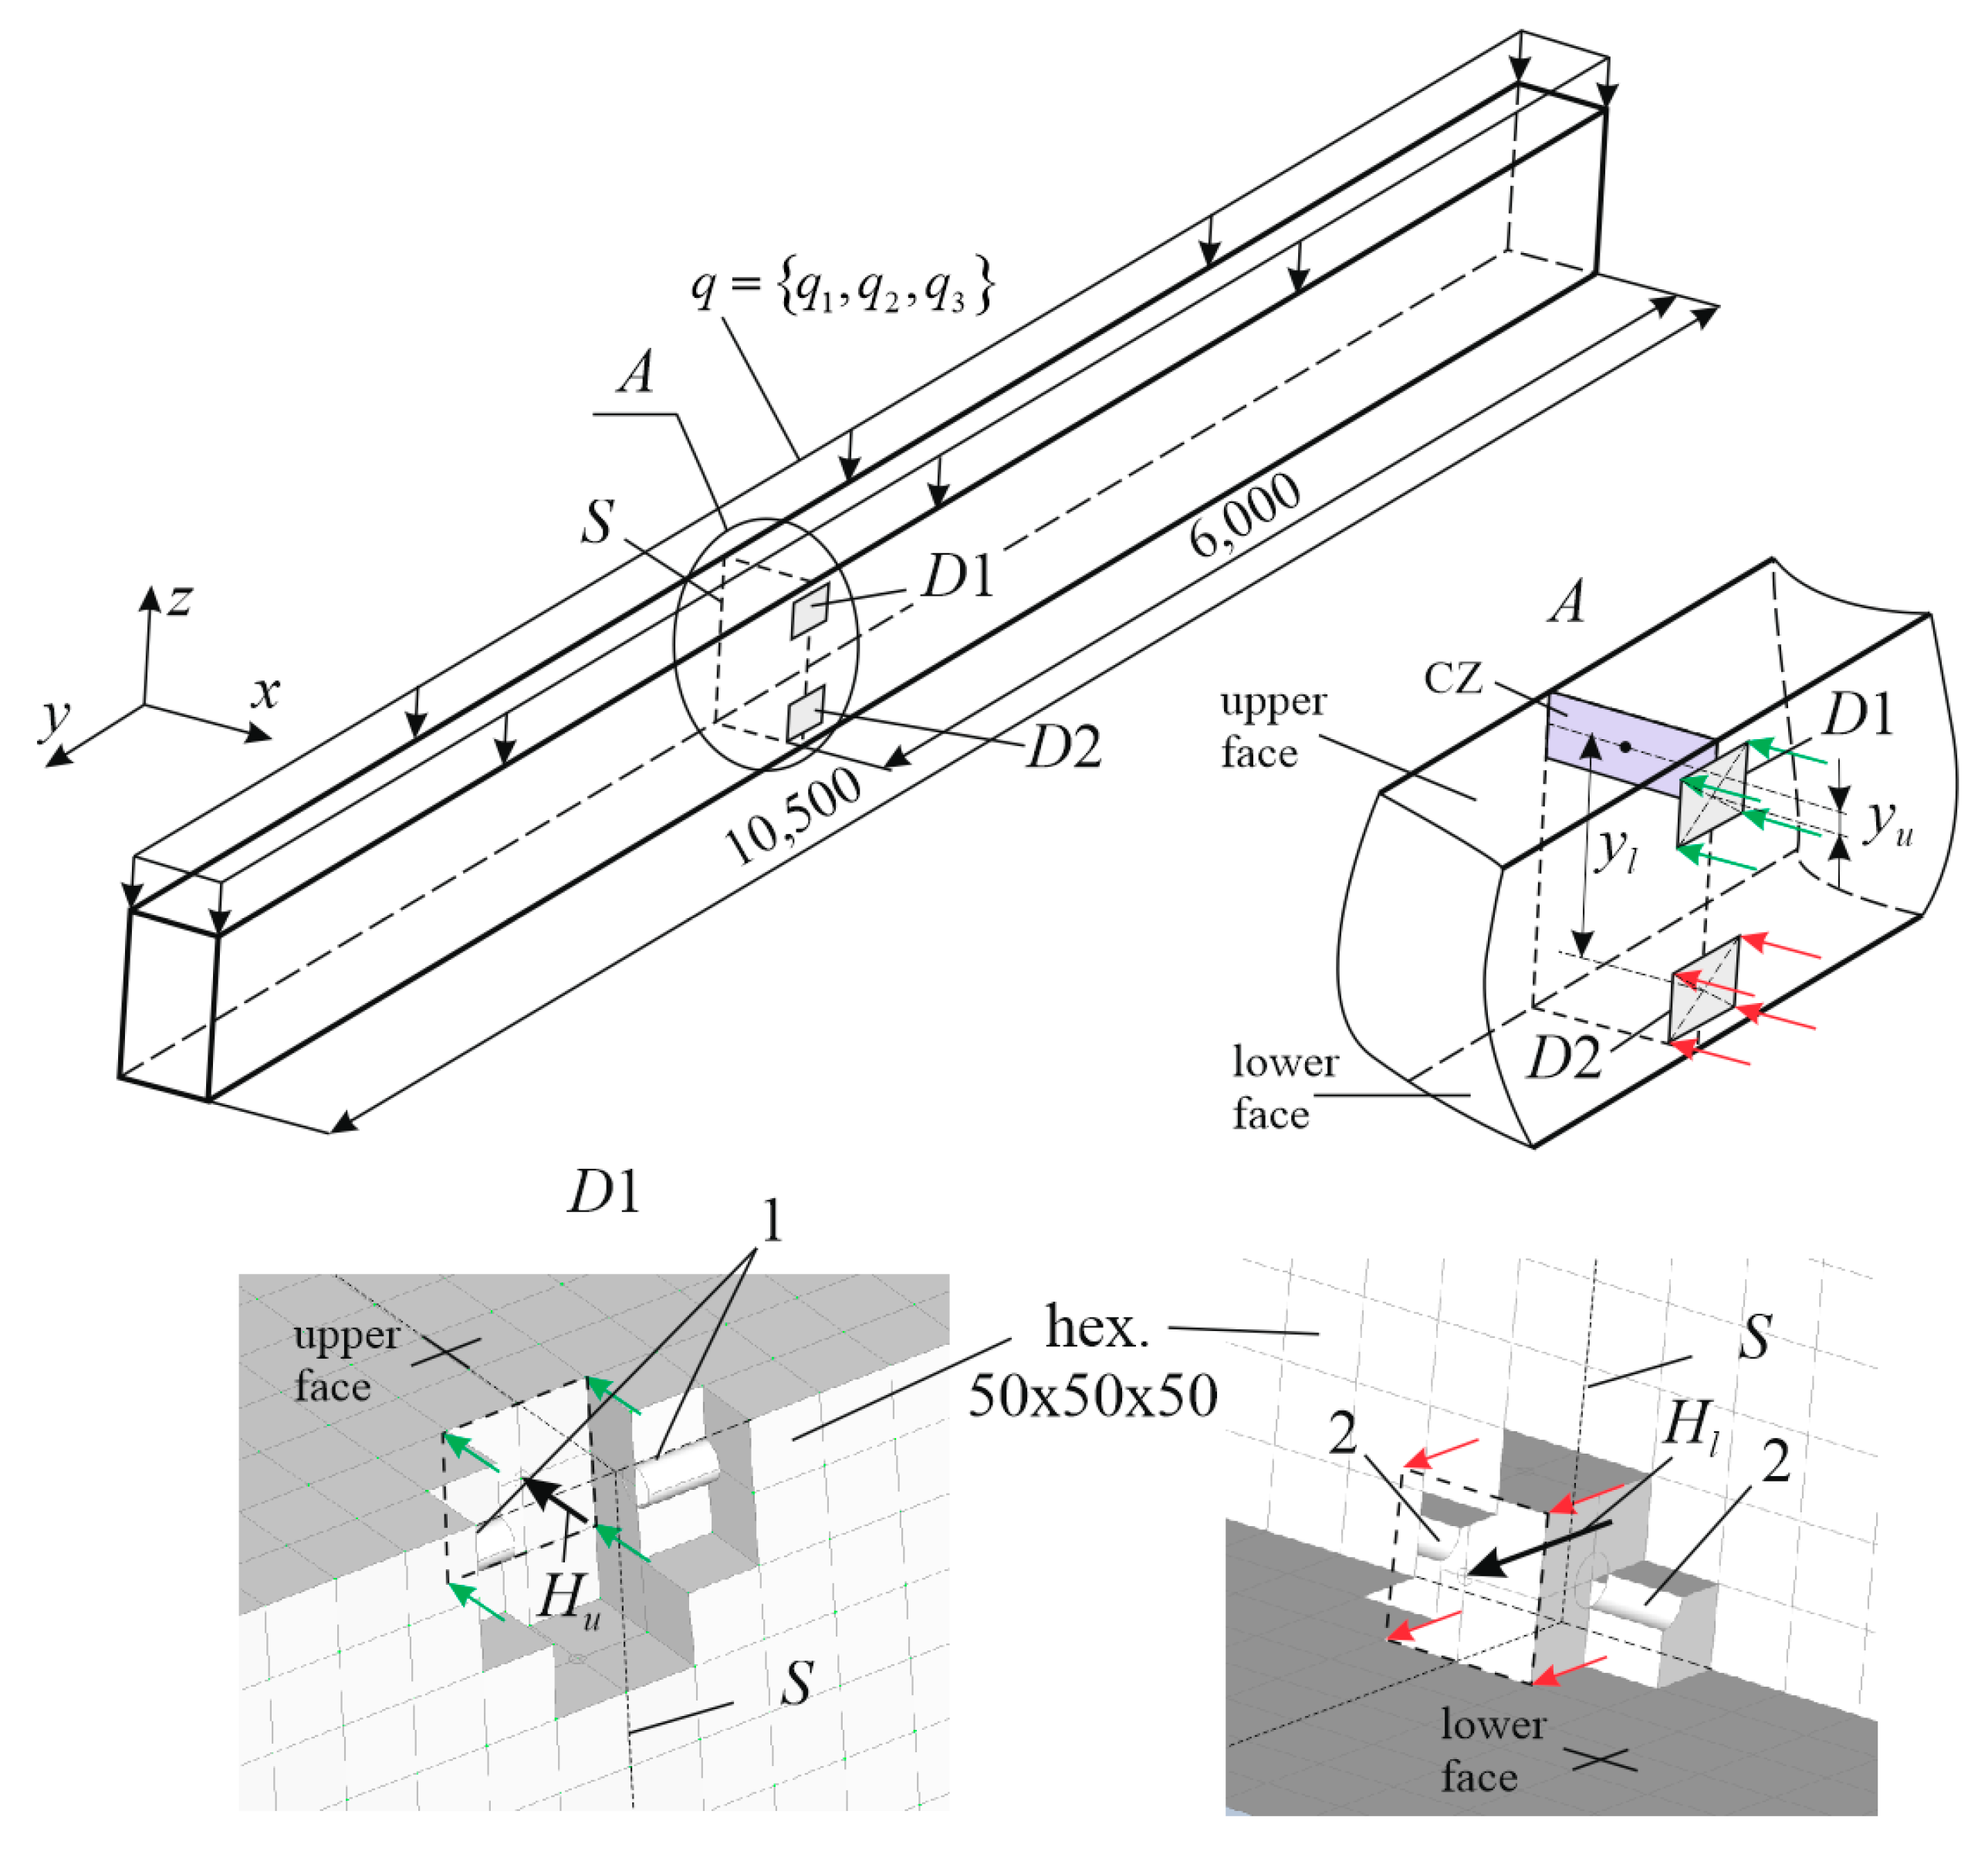
The loading scenario had the following options (Figure 6):
(1) q 1 0 , H u ( D 1 ) 0 ; (2) q 1 0 , H l ( D 2 ) 0 ; (3) q 2 0 , H u ( D 1 ) 0 ; (4) q 2 0 , H l ( D 2 ) 0 ; (5) q 3 0 , H u ( D 1 ) 0 ; (6) q 3 0 , H l ( D 2 ) 0 . Values of the torsion moment M t l = H l y 1 are shown in node A, where the distance y is measured between the line of force H l and a parallel horizontal line passing through the centroid of the compressed zone of concrete C Z (Figure 6). The torsion moment is M t u = H u y 2 . The distance y 2 is determined in the same way.

2.3.2. Strain of Materials

The mechanical characteristics of concrete and reinforcement, as well as the softening curve parameters, were established on the basis of regulatory document SP 63.13330 “SNiP 52-01-2003 Concrete and reinforced concrete structures. Basic provisions.” Concrete strain was described by the Drucker–Prager model with possibility of material damage; its parameters are provided in Table 1.
The values of ultimate concrete strain are 0.0035 for compression and 0.00015 for tension. Concrete softening was analyzed according to the following diagram in the case of high strain values (Figure 7).
The behavior of rebars follows the bilinear behavior pattern typical for an elastoplastic body without hardening (the Prandtl model). The yield strength of rebars is assumed to be 435 MPa. The ultimate strain of rebars is 0.025. The cohesion between concrete and rebars is assumed to be rigid; an analytical model was used to check the potential loss of anchorage. All cases showed the presence of concrete anchorage in rebars, and cohesion was assumed to be rigid.

2.3.3. Impact Mechanics

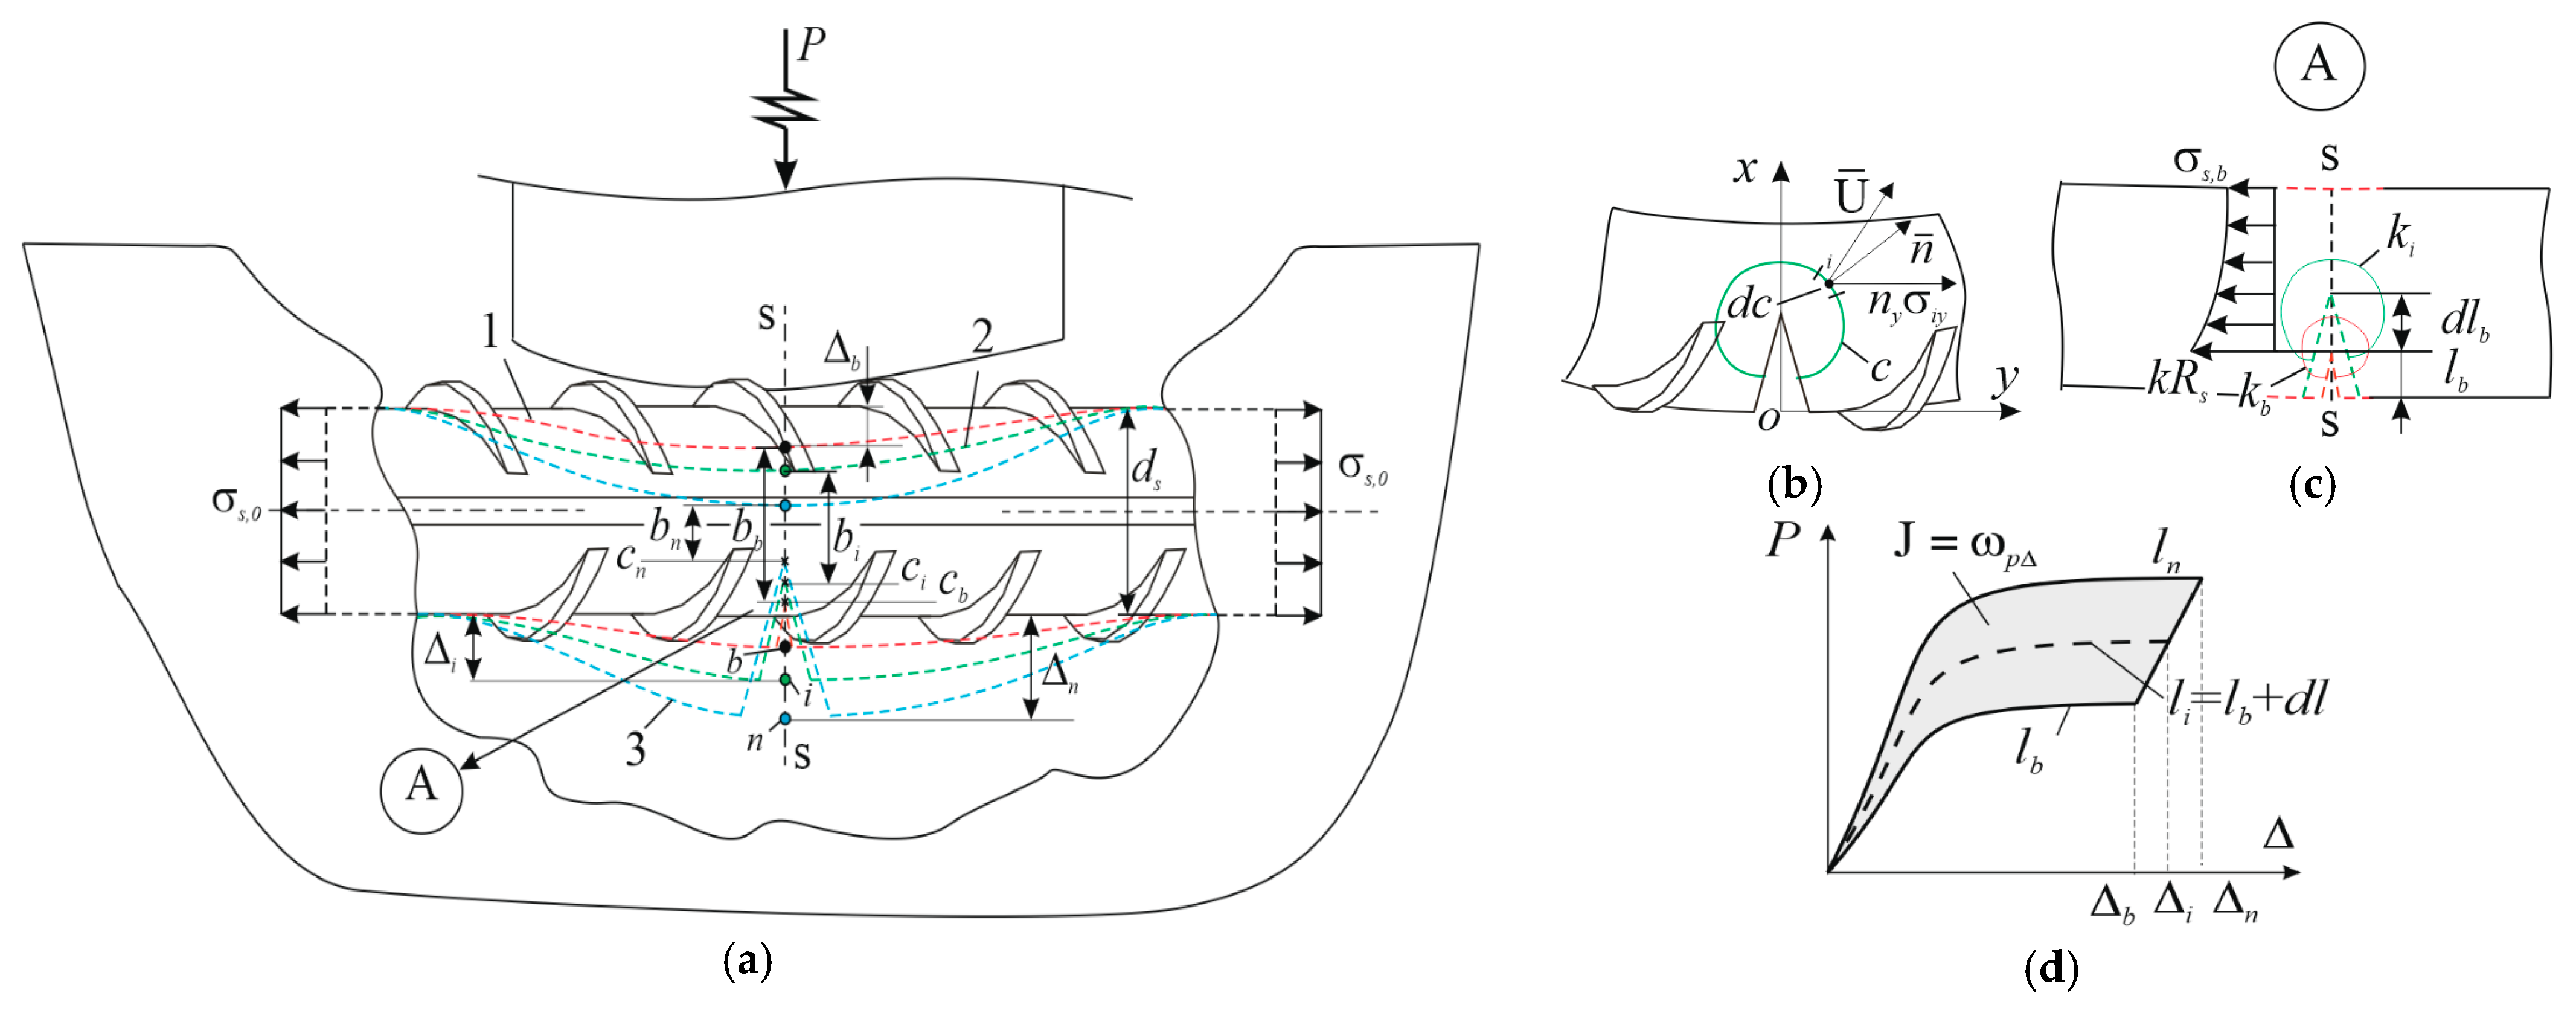
The case considered in this work involves interaction in the contact zone of the impactor. This interaction causes the local fracture of concrete. Hence, the load is transferred to rebars according to the scheme shown in Figure 5c. Two cases of transmission of the impact pulse are possible. As for the first case, rebars do not rupture, unlike the second case. In the first case, modeling involves erosion or physical removal of finite elements of concrete in the contact zone.
Let us consider the second case, or the condition of physical fracture. To describe the condition of fracture for rebars in the state of elastoplastic strain, we use fundamentals of fracture mechanics. We assume that fracture is a result of cracking and crack propagation in rebars in case of their direct contact with the impactor (Figure 8a). Since no exact solution is available for this case, we will use an approximate energy criterion formulated in the general case for a two-dimensional crack in the form of an inequality:
J = C W d y σ i y n y U i x d c J c r
where J is the Rice integral [38], whose geometrical interpretation is shown in Figure 8b,d; W is strain energy density; σ i y , U i are stress and displacement components at the point of curve C, and J c r is the value of this integral, which determines the strain energy of the material initiating progressive cracking.
Let us make the following assumptions for the subproblem to be solved:
-
interaction with the impactor causes brittle failure of concrete in the vicinity of the rebar, and only the rebar takes the kinetic energy at the moment of the impact.
-
The potential energy of the rebar strain in the case of the elastic-plastic behavior of the material consists of the impact energy transferred from the impactor and causing the local bending of the rebar and the longitudinal deformation energy from the operation load.
-
Since local fracture of the structure is considered here, which in some cases may not lead to complete fracture, it is sufficient to consider the quasi-elastic behavior of the rebar by focusing on one integral (6).
Expression (6) was obtained by Rice for the case of local bending, and it is as follows:
J = 2 b 0 Δ P d s d Δ
where Δ is the displacement of the point of force P application, if this force is applied along the crack propagation direction; d s is the full size of the intact body along this direction; b is the size of the intact body if measured from the crack mouth.
Interaction with the impactor assumes that the rebar is already tensile due to the action of the operational load. In this case, tension contributes to crack propagation, so the contribution of these stresses must be taken into account. Given the dynamic nature of emergency loading, a steel rebar will fracture if stresses in it reach ultimate strength R u . In this case, in the limit state calculation, the limit state is the case when operational stresses σ s reach the value equal to yield strength R s (Figure 8c). In this case, Formula (5) will take the following form under single-stage loading:
J = 2 b 0 Δ P d s + σ s R u d s R s d Δ
In the absence of information about the initial crack size, the value of b can be calculated as follows:
b = d s 1 k σ s R s ,   k = 1.0 ,   σ s 0 , 25 R s 0.35 , σ s > 0 , 25 R s
The coefficient k was determined empirically based on experimental data on the impact toughness of steel. The physical meaning of the coefficient k is the degree of reduction in the cross-sectional area of a rod subjected to transverse dynamic stress. At low initial stresses, more energy is required for crack propagation, and this crack propagates over a shorter length. If the stresses are high, less energy is required for rupture, which is simulated by more severe damage to the rod d s .

3. Results

3.1. Verification of the Intact Beam Model

Results of beam analysis in the verified SCAD 23.1.1.1 software package were used to verify the 3D model. The data provided in Figure 9 were used. The maximum deflection of the structure, provided in Figure 9b, and values of moments M and shear forces Q in the case of loading q = 36 kN/m (3.6 t/m), provided in Figure 9d, were used as the verification data. Values of parameters calculated according to Collection of Regulations SP 63.13330 and identified using the proposed model are shown in Figure 9c and Table 2.
Table 2 shows that the analytical model is sufficiently accurately verified and can be used in further studies. These rebars ensure high strength of inclined sections. Therefore, emergency actions near supports (in the case of absolute rigidity of supports) will not affect progressive collapse.

3.2. Resulting Study of the Bearing Capacity of Concrete Without Ruptured Rebars

Results of computations made for section S of the beam (Figure 6) at different correlations of M t l / M b = 128 H l y 1 / 9 q l 2 and M t u / M b = 128 H u y 2 / 9 q l 2 are shown in Table 3.
Table 3 allows us to conclude the following. At lower levels of bending stress on the bar, it has a significantly greater capacity to absorb kinetic impact energy, both when subjected to forces on the upper zone and when subjected to forces on the lower zone. A 33% increase in bending load reduces the beam’s absorption capacity by 2.6 times when the tension zone of the concrete is impacted and by 2 times when the compression zone of the concrete is impacted. Impacts on the compression zones of concrete are more dangerous.
The analysis of tabular data shows that if rebars do not fracture at the operational load of 70% of ultimate loading, horizontal impact loads are more dangerous for upper (D1) zones of impact than for lower (D2) ones. If loading values are close to those of the ultimate (71 to 100%) operational load, the load from the horizontal impact is equally dangerous for upper (D1) and lower (D2) zones of impact.

3.3. Resulting Study of the Bearing Capacity in the Case of Local Mechanical Fracture of Concrete and Facture of Rebars

Let us focus on the simulated fracture of a rebar resulting from the contact interaction with the impactor. Let us assume that a crack of infinitely small length is formed in the rebar as a result of the contact. Let us use Expression (6) to find the value of emergency impact load that initiates the fracture of rebars capable of taking the load.
The following steps are taken for this purpose:
  • The computation is made and the initial displacement of the rebar in the horizontal direction is determined, given that this displacement is triggered by initial impact loading, shown in Figure 5c. Actual stress in the rebar is identified.
  • The initial opening width of an infinitely small crack is determined by Formula (8).
  • The Rice integral (7) is calculated and the condition of crack development to fracture (5) is verified. If the condition is satisfied, the rebar is considered fractured.
The Rice integrals, calculated for the lower longitudinal rebar and for different values of operational loading, are presented in Table 4. The values d s = 0.032   m , R u = 500 10 6   P a , R s = 435 10 6   P a , and J c r = 100000   H / m are used in the computations.
A qualitative analysis of Table 4 suggests that the impact resistance of the rods decreases significantly depending on their initial stress levels. The presence of defects that may be related to welding or the microstructure of the steel, as well as damage to the rod profiles, can lead to rupture and a reduction in the safety level of the entire structure.
Table 4 determines the “2” function of the force variation in time (Figure 5a) for specific values of loading at which the rebar ruptures. These data ensure a proper simulation of the effect of rebar rupture, taking into account the dynamic nature of this effect. These data contribute to the analysis of a beam subjected to an impact in the lower zone, shown in Table 5.
Table 5 shows that if loading equals q = 120,000, almost any local impact in zone D1, leading to the rupture of rebars, causes the whole structure to fracture. However, horizontal impacts with peak intensity values of 24, 28, and 30 kN, at which the rebar remains serviceable, do not lead to a complete loss of the bearing capacity of the structure. Table 5 expands on Table 4 by linking the energy criterion to ultimate load states.
Table 5 additionally shows that the presence of damage in the reinforcement under the complex loading under consideration may not lead to complete failure of the beam only under initial (operational) bending loads not exceeding 50% of their ultimate value. This allows, if necessary, a safety margin to be built in to ensure the reliability and accident resistance of key elements.
Time analysis of the numerical model shows that in the case of (1) emergency loading of the edge rebar as a whole, (2) beam bending beyond its plane, and (3) torsion, compressive stresses arise in the edge rebar. Hence, the rebar starts de-loading and stresses in it do not exceed 0.2–0.4 R s . Therefore, the rupture of the rebar neither causes any great stress spikes, nor strongly affects the loss of the bearing capacity by the structure as a whole. The rupture of rebars triggers longitudinal stress waves. When emergency loading stops, the rebar recovers bending strength, except for the local area in the vicinity of the rupture. The resulting loss of the bearing capacity by the structure is only observed if vertical loading values are close to ultimate ones.
Values of the Rice integral, computed for the upper longitudinal rebar and for different values of operational loading, are presented in Table 6. d s = 0.028   m , R u = 500 10 6   P a ,   R s = 435 10 6   P a , and J c r = 100000   H / m , and these values are used in the computations.
Table 6 expands on Table 7 by linking the energy criterion to ultimate load states. Analysis of Table 6 shows that the fracture of rebars by horizontal loading strongly depends on the value of initial normal stresses. Ultimate loads are analyzed for a beam in bending and torsion (Table 7), taking into account the data shown in Table 6. The comparison of data provided in Table 5 and Table 7 shows the following:
-
The value of the ultimate force ( H u ) causing the torsion moment taken by the beam when the value of the vertical load ( q 1 , , q 2 ) is below 70% of its ultimate value q u l t is greater if the impact focuses on the upper (compressed) zone of concrete;
-
If values of vertical load are q 3 > 0 , 9 q u l t , rebars do not facture. The fracture process starts from the local loss of stability of the rebar, followed by the fracture of the compressed zone of concrete.

3.4. Studying Changes in the Compressed Zone of Concrete

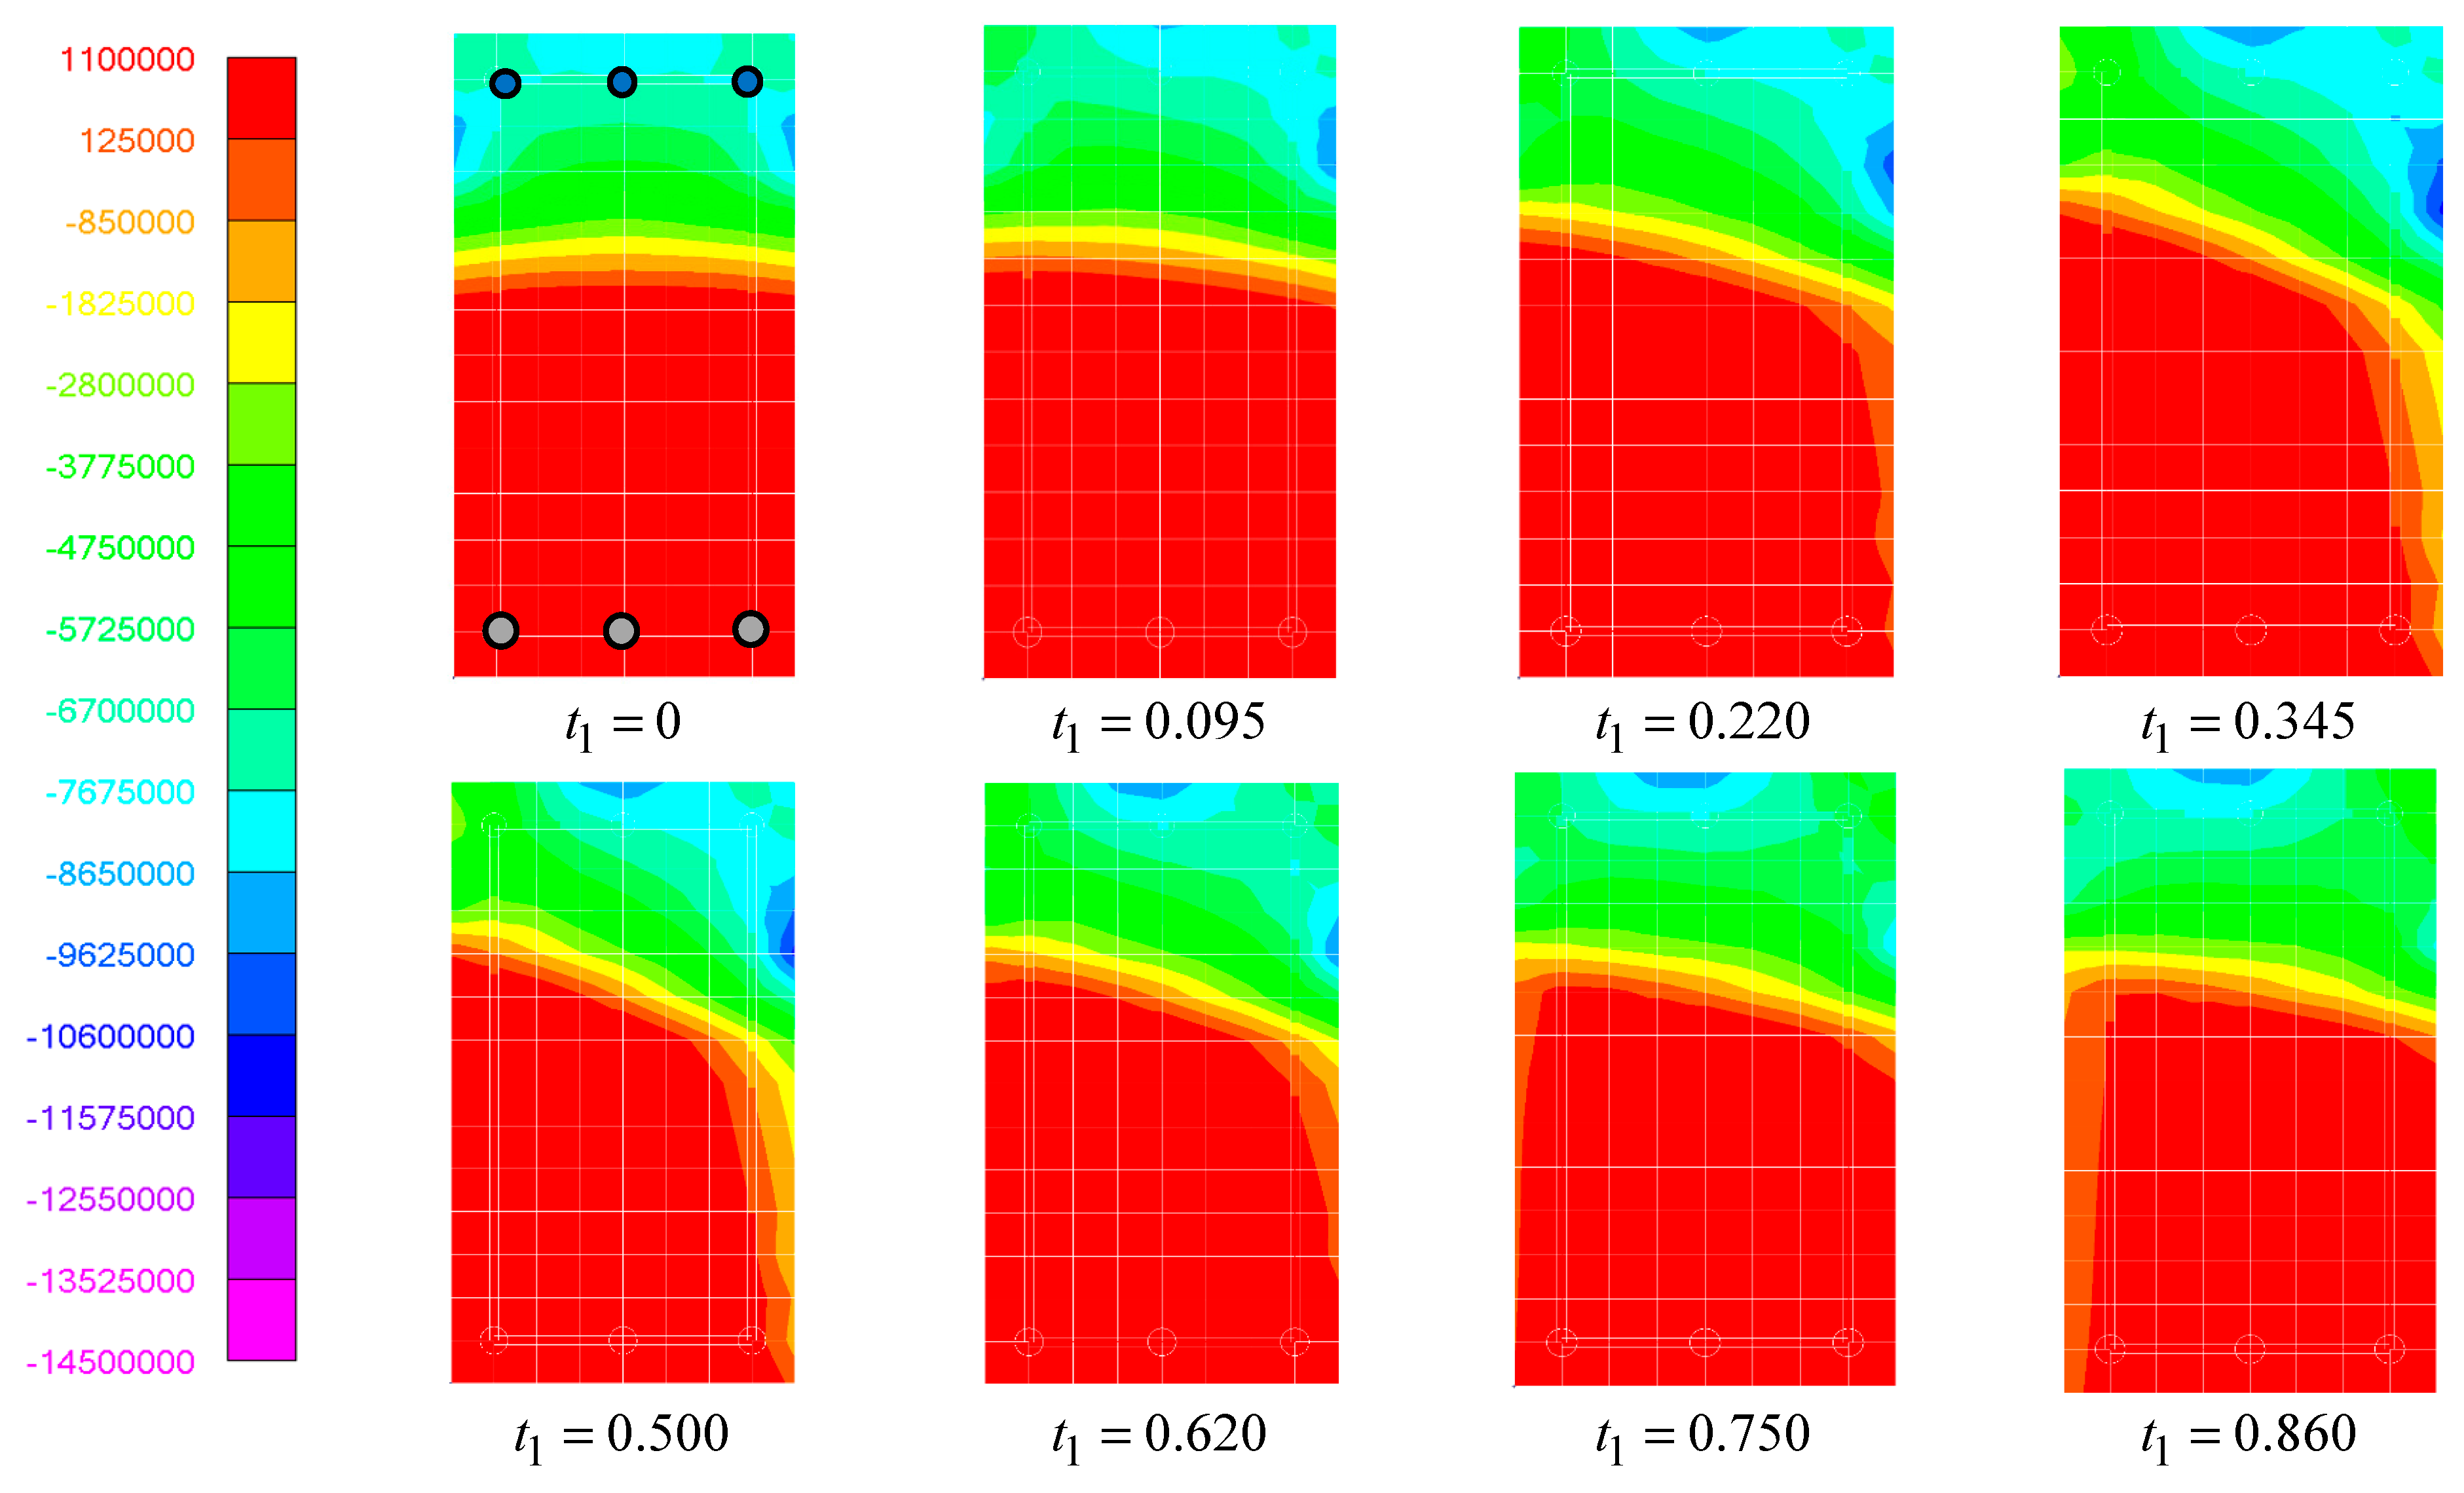
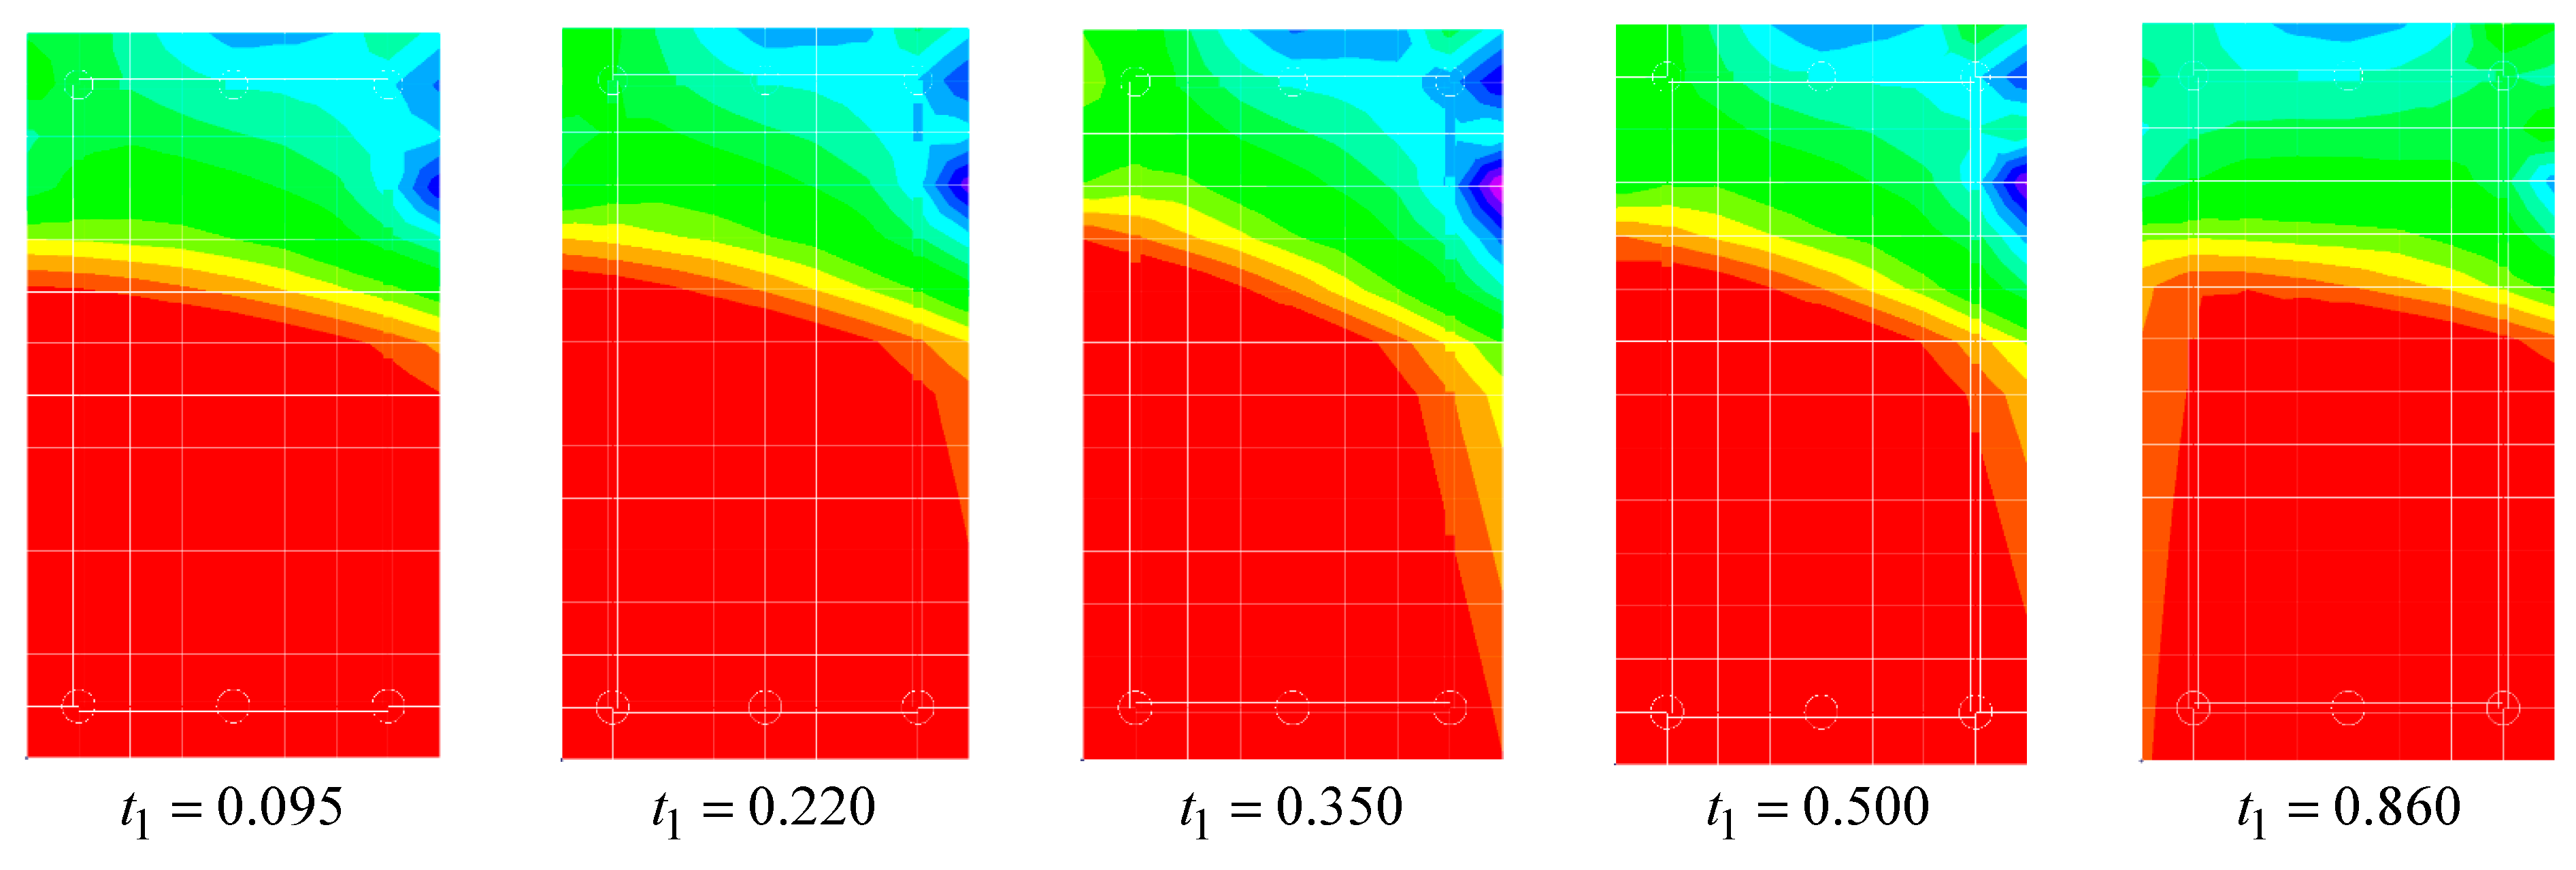
The development of an analytical method for analysis of beams in bending and torsion requires a study of the shape of a compressed zone of the section to find the compressive force taken by the concrete exposed to the action of this force. The cases are similar to those involving impacts in zones D1 and D2. Let us introduce coefficients of the static force ratio k 1 = M t / M b x , k 2 = M t / M b y , k 3 = M b x / M b y , and M b x , M b y , where M are bending moments relative to the coordinate axes. Based on the experiments in [39], the time for the dynamic load to increase from 0 to its maximum value was taken to be 0.01 s, and the total exposure time considered was 0.9 s. Time changes in the compressed zone of the reinforced concrete section are shown in Figure 10, and the impact is on the tensile zone (the lower one). Figure 9 shows minimum principal stresses. Coefficients include k 1 ( D 1 ) = 128 H l y 1 / 9 q l 2 = 0.085 , k 2 ( D 1 ) = 2 H l y 1 / P l u 2 v ( 1 v 2 ) = 0.977 , and k 3 ( D 1 ) = 0.09 . In Figure 9, t 1 = 0 (sec) corresponds to the onset of impact loading. Analysis of the figure shows that after the removal of emergency load, whose duration is 0.8 s, the compressed zone changes its shape due to residual strains, which can be taken into account in the course of the further operation of the structure. If the impact is on zone D2 (Figure 11), the image of the compressed zone is similar, and the difference is that there is strengthening in the compressed zone and concrete is subjected to local plastic fracture or crushing.
Dimensions of the compressed zone can be determined by the size of the mesh, the square side of which is 5 cm. The stress scale for Figure 11 is the same as for Figure 10. At the moment of time t 1 = 0.350 the impact action is maximal and the beam is subjected to bending stresses in the horizontal plane (Figure 12a) and torsional tangential stresses (Figure 12b).
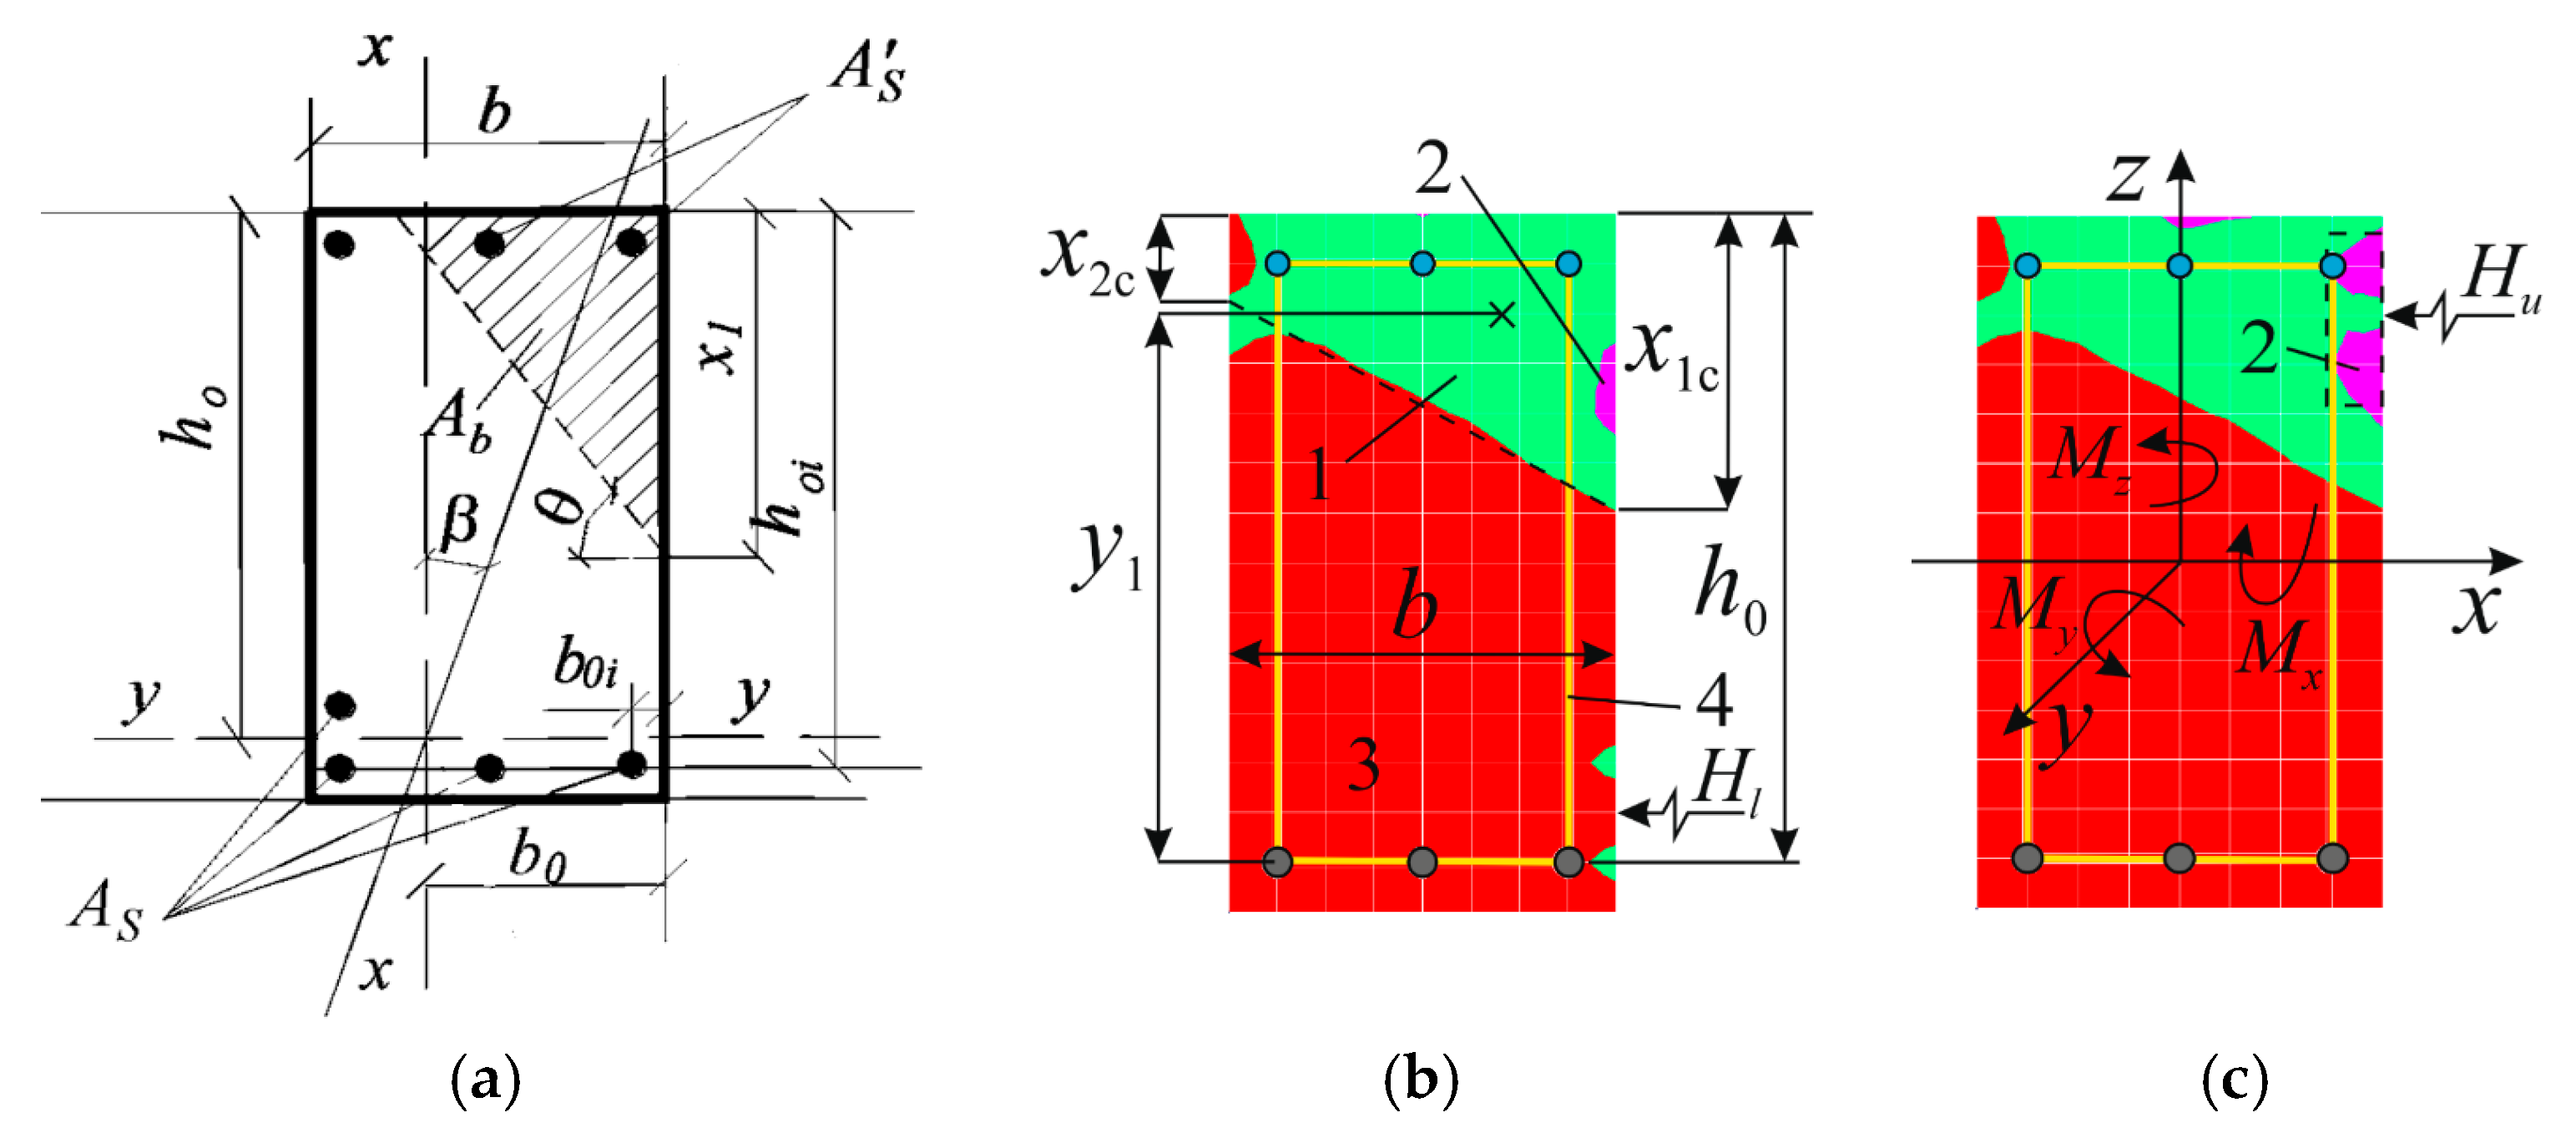
Given the complexity of the stressed state, analysis of dynamic loading by bending and torsional moments requires parameterization of the design section (Figure 13a) and revision of the standard method of analysis of reinforced concrete elements. The idea is to use a multiplane bending method as the basis for analysis. At the same time, it is necessary to take into account simplified features of the section behavior in torsion (Figure 13b,c).
The revision of the method can have the following steps:
-
Deriving analytical expressions for variables x 1 c , x 2 c , taking into account their change in time;
-
Identifying the zone of crushing in the compressed zone of concrete;
-
Determining the condition for the rupture of a rebar (rebars) in the zone of contact with the impactor initiating the impact action;
-
Accurately analyzing the resulting force taken by the compressed concrete, taking into account potential microcracking in the concrete zones that became tensile at earlier moments of time;
-
Finding the areas of longitudinal rebars on the basis of the condition of plastic fracture of the section;
-
Finding (verifying) the area of stirrups capable of supporting the torsion moment with regard for the confined concrete strain within the loop.

3.5. Studying the Strain of Rebars Subjected to Accidental Actions

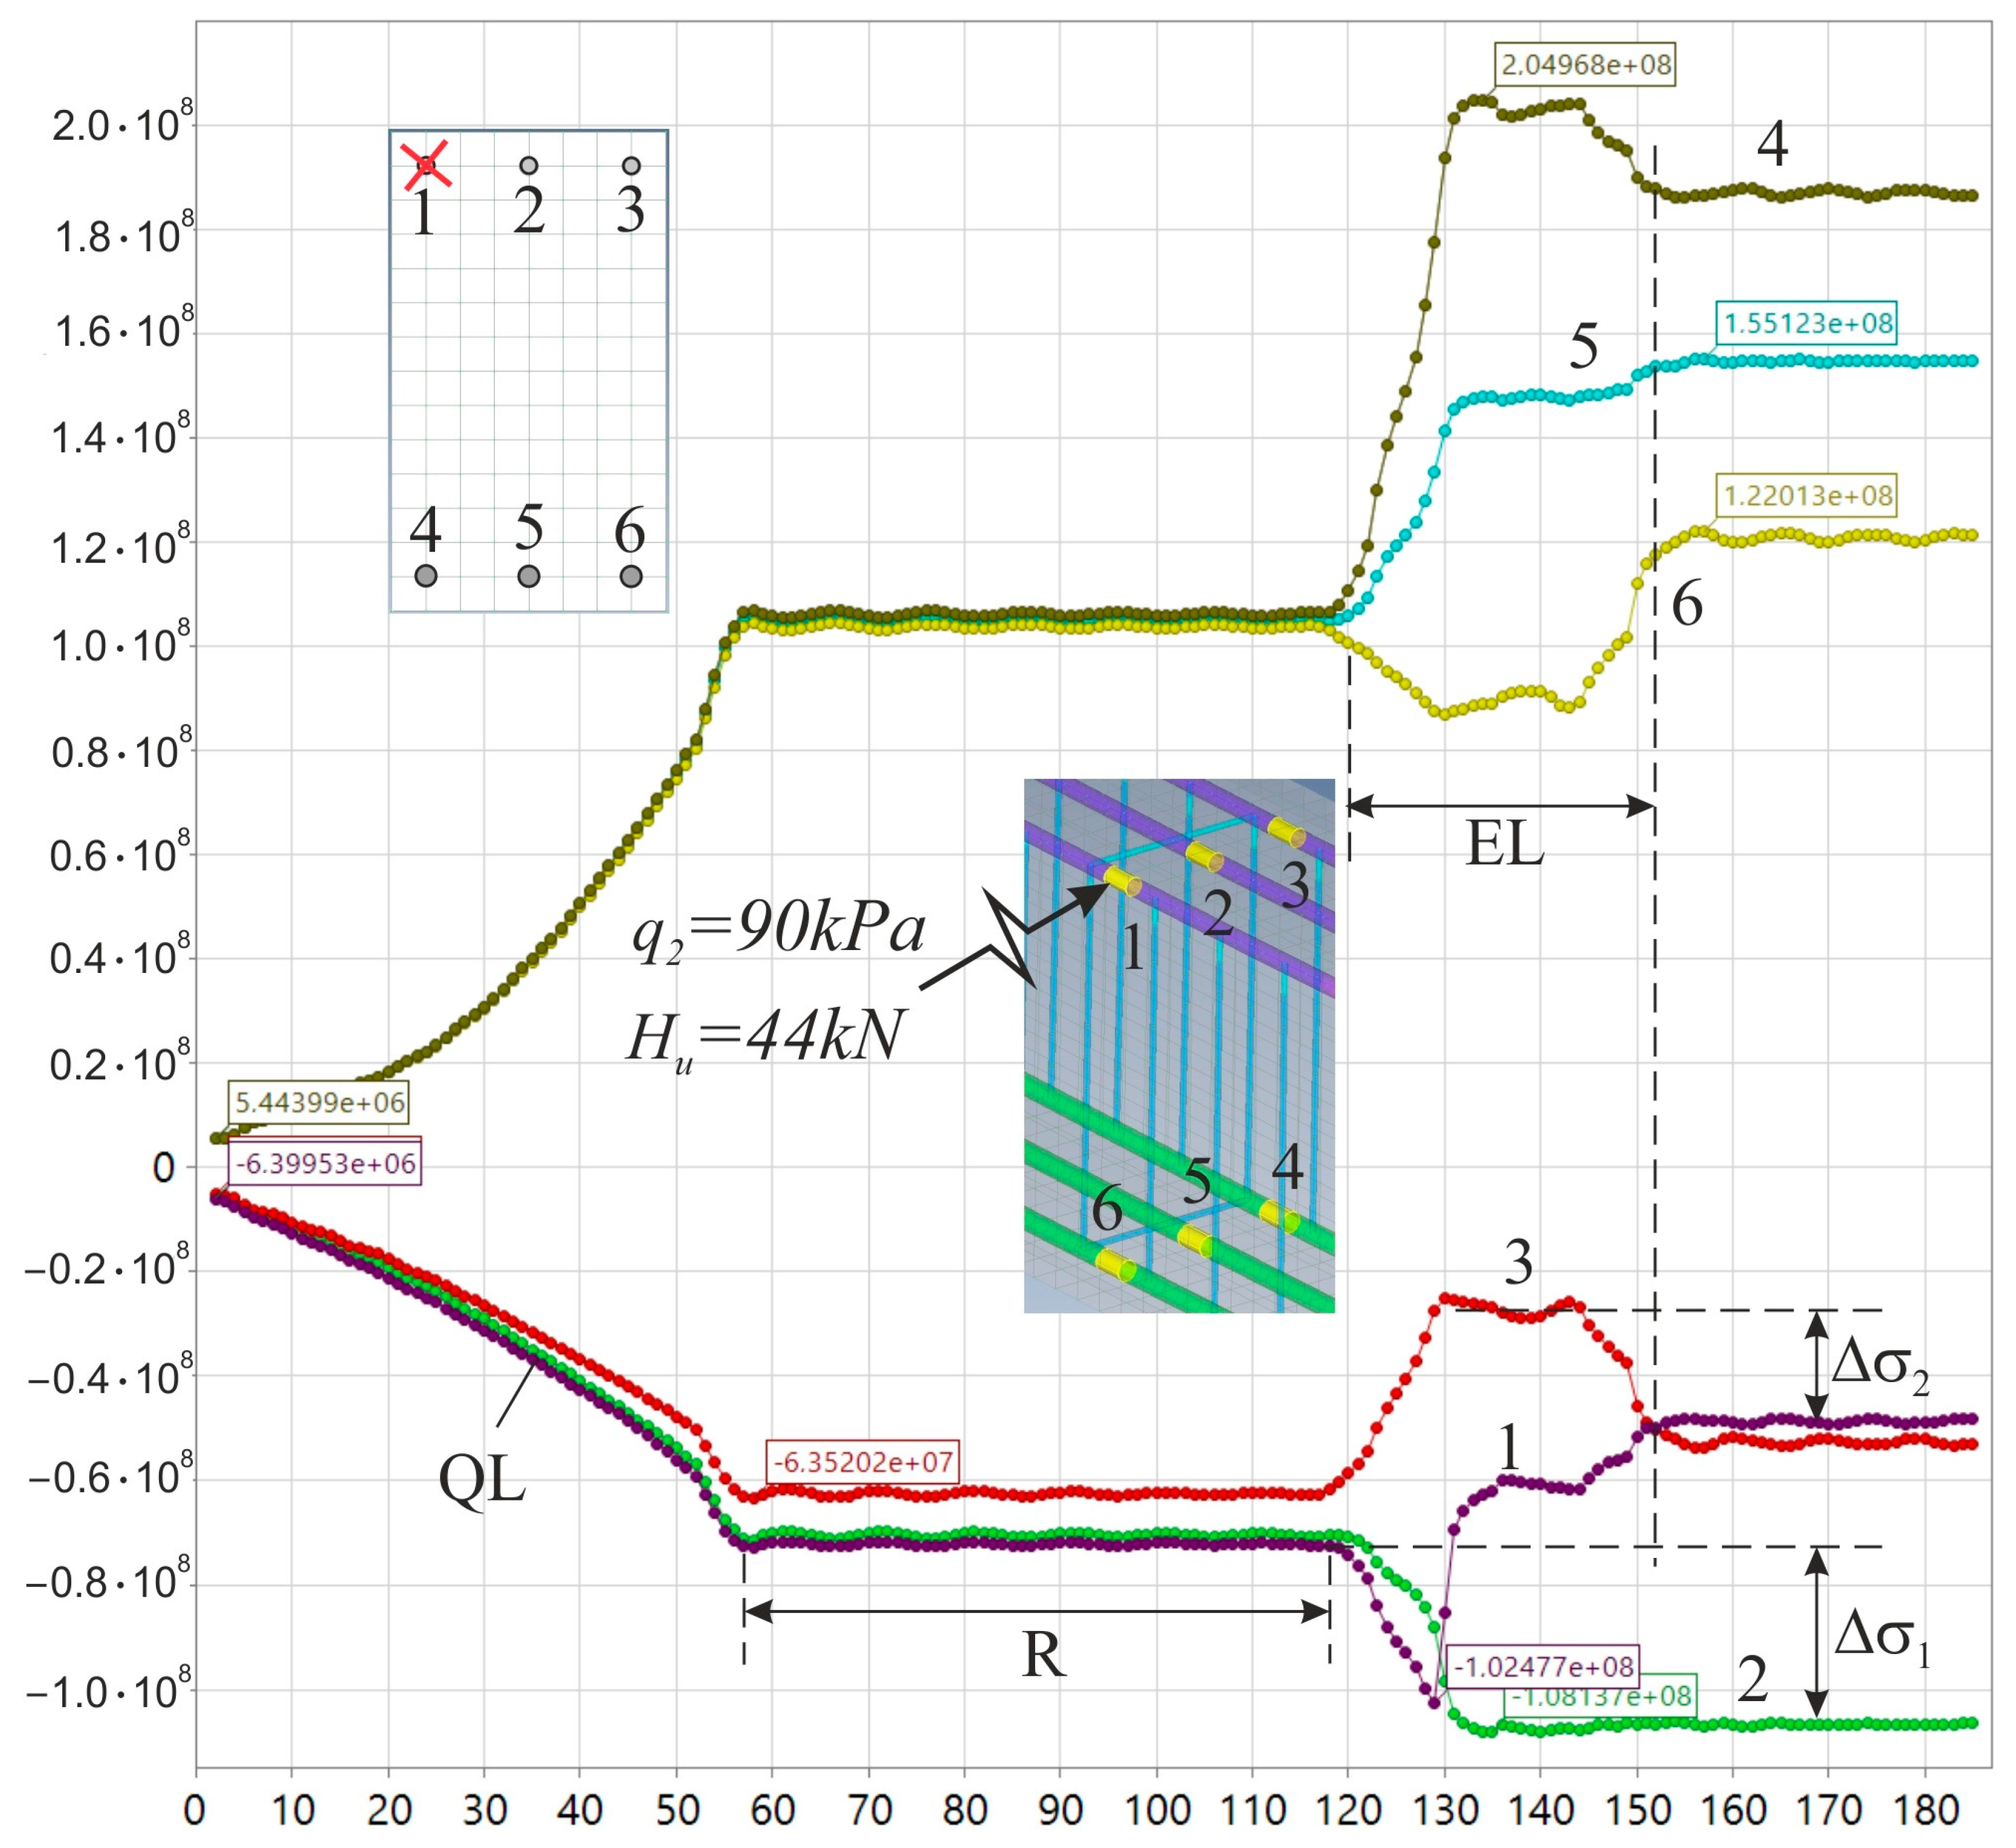
Let us focus on a beam subjected to loading: q1 = 24 kN/m. This standard load is typical for numerous buildings in the course of operation. Time variations of equivalent stresses in the bars are shown in Figure 14 for the case of an impact on the tensile zone of concrete and for the case of rupture of the lower rebar.
Numerical simulation of the impact effect has the following distinctive features. Stable integration in the dynamic formulation requires the static state of a structure. The following segments are used to attain the static state: QL—the segment of static loading that changes from zero to the design value; R—the segment of dynamic relaxation, where oscillations decay, the mission of this segment being to reproduce the static equilibrium of the system; EL—the segment that models the change in time for impact load from the moment of its peak increase to its decrease to zero. In this state, axial forces are applied to the rebar to be subjected to rupture (as shown in Figure 5b for tension). At the EL segment, these forces are removed simultaneously with pulse loading. Figure 14 shows that forces in the rebars are dynamically redistributed. Rebar 4 is subjected to the greatest supplementary loading; peak equivalent stresses in this rebar increase by a factor of 4. When rebar 6 ruptures, the value of load Δ σ 1 is initially removed and then tensile stresses increase due to its gaining the ability to take loads together with concrete, and after the accidental action, the rebar remains underloaded by a value of Δ σ 2 relative to its initial state.
The graph shows that in the horizontal plane, the bending moment is also taken by rebars 2 and 5. In this case, in the upper zone, rebars 1 and 3 take the dynamic action of torsion and bending, and rebar 1 is tensile. A similar pattern is observed for rebars 4 and 6, but due to the rupture, a greater stress focuses on rebar 5 compared to rebar 2, which is shown in Figure 15. The time step is 0.0175 here, and the total integration time is 0.0175 ∗ 160 = 2.8 s.
Now, let us analyze strain in the case of vertical loading q2 = 36 kN/m. The impact load is applied to the top of the beam, where concrete is compressed in the course of operation. The time distribution of stresses in rebars is shown in Figure 15.
Bars 4, 5, and 6 in the tensile zone of concrete are strained similarly to the previous impact action, but values of supplementary loads are smaller. In the course of an accidental action, the force in the damaged rebar drops by a factor of 2 and then the rebar starts taking loads.
A reduction in the value of this stress is compensated by growing compressive stresses in rebar 2 by the value of Δ σ 1 , or by a factor of 1.54. Load is removed from rebar 3, as it takes the action of torsion and bending moments, and after emergency loading, the force in this rebar increases by Δ σ 2 , i.e., by a factor of 2.3.
Hence, the presence of symmetrical reinforcement in tensile and compressed zones of concrete effectively redistributes forces from emergency loads associated with dynamic loading. Studies show that (1) the loading that equals q1 = 24 kN/m, q2 = 36 kN/m, q3 = 48 kN/m and (2) impact actions always cause the compressed zone of concrete to fracture; stresses in rebars do not reach the yield stress value for a given cross-section under the condition of its integrity. Stresses reach the yield stress value in a rigid support node, but rebars do not rupture.

3.6. Development of the Limiting Surface and Conclusion About the Mechanical Safety of the Key Element

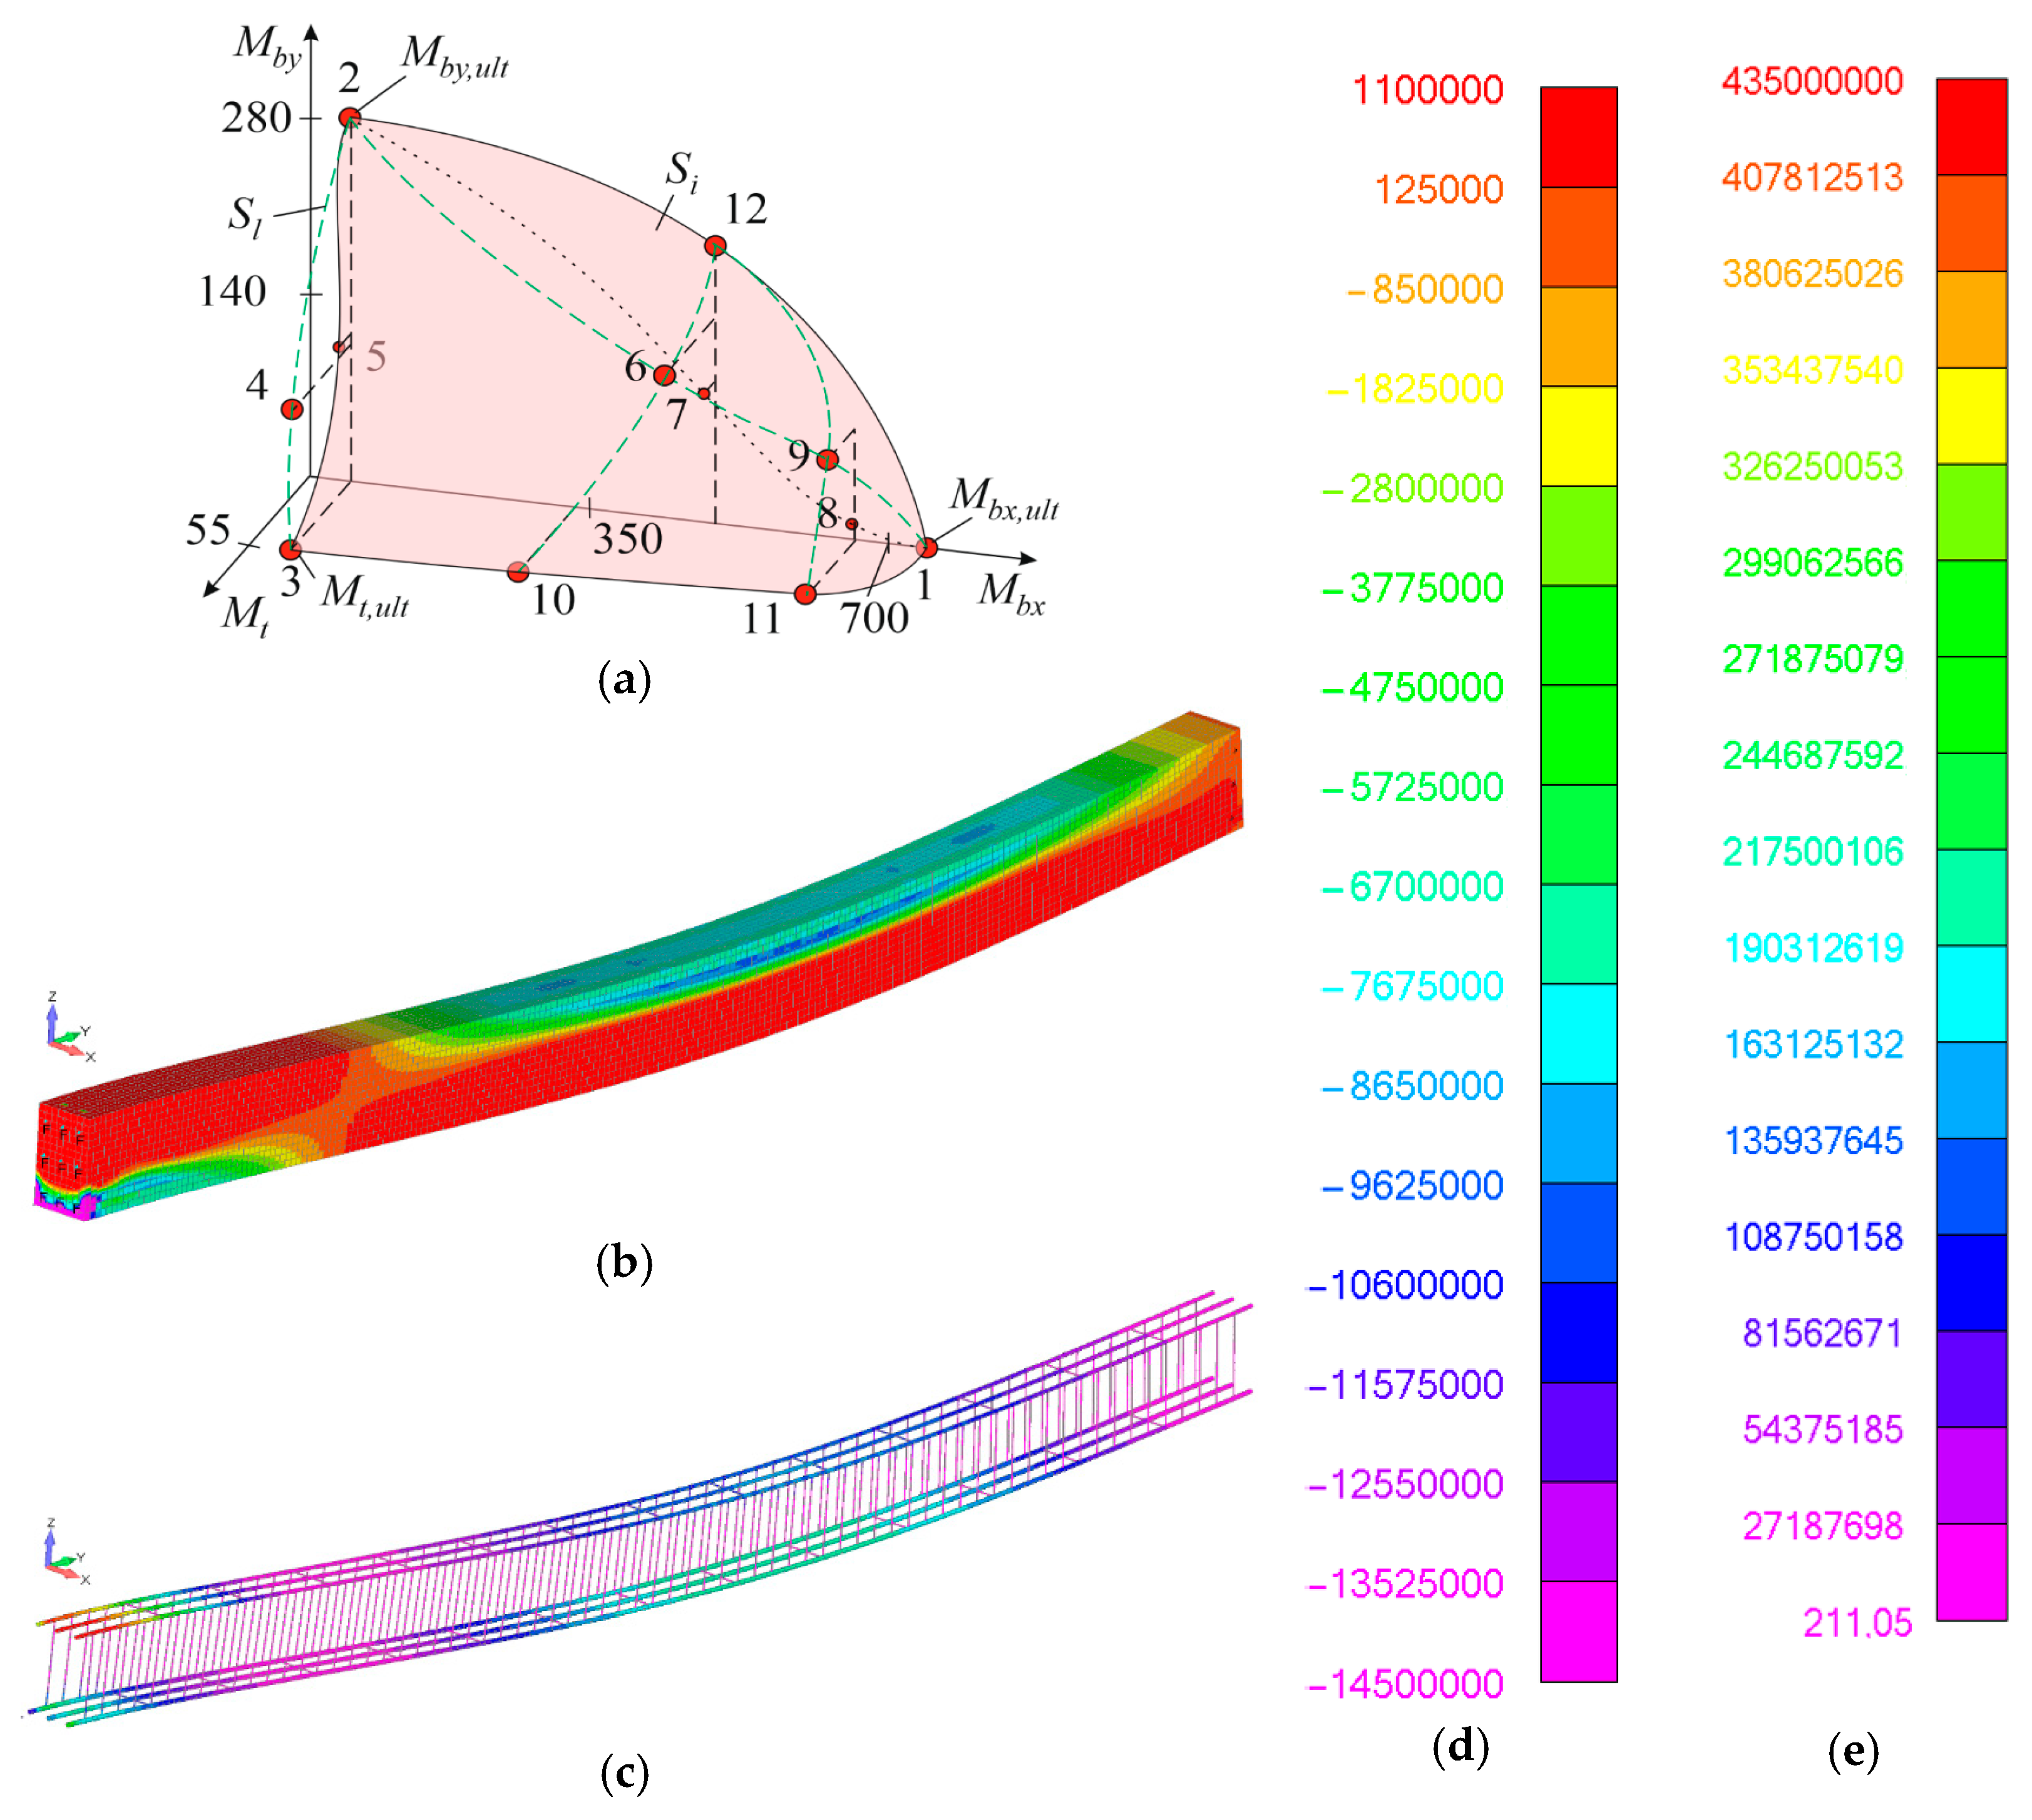
Pursuant to the theoretical assumptions listed in Section 2.1, according to emergency scenarios, the key element must prevent the fracture of the entire structure; in other words, it must ensure mechanical safety so that the structure does not collapse or go beyond the required values of safe deformation. The simplest solution is assignment of design parameters and construction of the limiting surface in accordance with Formula (1). Let us describe this process. Point 1 (Figure 3) is obtained when the beam is designed to support the limit bending moment M b x , u l t . Point 2 is obtained when the beam analysis is accompanied by the search for the maximum M b , u l t max . Point 3 can be found by solving the extremum problem M t , u l t max M b , u l t ( q w ) 0 . The remaining points 4–6 are identified by finding one of internal forces and identifying the limit value of the other force. The results of constructing the limiting surface are presented in Figure 16 and Table 8.
It is necessary to construct three limiting surfaces and their envelope along the internal contour in the case of rupture of rebars if upper and lower zones are subjected to impacts.
Figure 16a shows two limiting surfaces. The first limiting surface S l determines the load-bearing capacity of the structure in the case of an impact on the tensile zone of the beam concrete. The second limiting surface S i determines the load-bearing capacity in the case of an impact on the compressed zone of concrete. This surface is the envelope surface for the minimum values of the torsion moment. In the case of the rebar rupture following the impact action, two other limiting surfaces and the envelope surface must be constructed for the minimum values of the force. This method is used to unambiguously determine the range of values of emergency loads, whose action will not lead to the fracture of the beam as a key element of the structural system.
Based on the calculated results, it can be stated that the use of a safety criterion based on the construction of a limit surface and the evaluation of the local J-integral value allows for a significant increase in the mechanical safety of key structural elements under any combination of accident loads and impacts, i.e., under conditions of uncertainty.

4. Discussion

Computations show that different concrete models, used for 3D elements, can change the value of the limit load by 10–20%, both upward and downward. In this case, for structures that are the key elements and are subjected to combined resistance conditions, there is no other option but to use 3D concrete models and 3D reinforcing cages. Theoretical assumptions outlined in Collection of Regulations SP 63.13330 and MC2024 assume the use of rebars “distributed” over a certain area. The discrete arrangement and individual diameters of the reinforcing bars are not accounted for. Consequently, under combined bending and torsion, or biaxial bending, individual bars may rupture. Standard design codes typically consider only the total cross-sectional area of reinforcement, A (cm2). As a result, under localized impact and subsequent failure, a portion of this area nA (cm2) may become ineffective. This can lead to a loss of structural strength and safety, as the reduction in the effective reinforcement area is not considered in conventional design methodologies. In such cases, the assessment of the ultimate load-bearing capacity may be unrealistically high if three-dimensional modeling is not employed. Any such inaccuracy must be eliminated from the evaluation of the hazard level or safety of impacts on key structural elements.
Furthermore, a promising direction for this research is to analyze the safety of key elements in the case of impacts on the following:
-
Support zones of beams in case of lateral impacts, where loss of shear bearing capacity may occur. It will also be necessary to construct limiting envelope surfaces in the Q x , Q y , M t axes;
-
Columns, if the impact is transverse; the limiting envelope surface will be constructed in the M x , M y , N z axes.

5. Conclusions

  • A method for evaluating the mechanical safety of key elements in structural systems was developed. This method is based on construction of limiting envelope surfaces based on minimum values of prevailing internal forces. This method unambiguously determines the range of emergency load values for pre-set design parameters of a bearing structure (section sizes, material classes, and reinforcement features) that do not cause the element fracture, protecting the structural system from progressive collapse.
  • Analysis of the dynamics of reinforced concrete beams in the 3D formulation proved the need to develop a new safety criterion for key load-bearing elements. This criterion is to be formulated in the form of Expression (2). This criterion stems from a differentiated approach to the evaluation of section strength, taking into account the discrete location of rebars and their specific areas.
  • The general Rice formula was employed to formulate the analytical dependence for the J integral, which allows a simplified evaluation of the condition of failure of a rebar under the direct action of an impactor. This approach allows detecting the possibility of preventing the local fracture of rebars/concrete parts of the key structure in the process of computation.
  • Analysis of a specific reinforced concrete beam without prestressing shows that construction of the limiting envelope surface for the most dangerous sections makes it possible to unambiguously determine the range of values of emergency loading, at which the key element will not collapse and will be able to localize the progressive collapse in the structural system as a whole, even in the case of local damage.
  • A limitation of the method is its inability to perform calculations for the purpose of determining design parameters (such as reinforcement layout, concrete grade, etc.). The generation of ultimate load envelopes and the subsequent safety assessment of structures presuppose a fixed design, where these parameters remain unchanged.

Funding

This research received no external funding.

Data Availability Statement

Data presented in this research are available on request from the corresponding author.

Conflicts of Interest

The author declares no conflicts of interest.

References

  1. Zhu, Z.; Chen, Y.; Wu, H.; Ye, P. Experimental Investigation on Shear Capacity of Steel Reinforced Concrete Columns under Combined Torque. J. Constr. Steel Res. 2024, 213, 108345. [Google Scholar] [CrossRef]
  2. Nasser, A.G.; Makhlouf, M.H.; Elsayed, K.M.; Gamal, I.K. Experimental and Numerical Investigation on RC Beams with Web Openings Subjected to Pure Torsion Strengthened by Ferrocement Technique or GFRP Sheets. Structures 2024, 69, 107479. [Google Scholar] [CrossRef]
  3. Patane, A.; Vesmawala, G. Experimental and Analytical Investigation of the Behaviour of Reinforced Concrete Beam under Pure Torsion. Mater. Today Proc. 2023; in press. [Google Scholar] [CrossRef]
  4. Hui, L.; López-Almansa, F. New Modifying Truss Model and Numerical Simulation of Steel Fiber Reinforced Concrete under Pure Torsion. Structures 2018, 14, 32–42. [Google Scholar] [CrossRef]
  5. Selmy, Y.M.; El-Salakawy, E.F. Behaviour of Circular Concrete Bridge Columns Internally Reinforced with GFRP under Reversed-Cyclic Loading Including Torsion. Structures 2024, 59, 105680. [Google Scholar] [CrossRef]
  6. Qian, K.; Weng, Y.-H.; Fu, F.; Deng, X.-F. Numerical Evaluation of the Reliability of Using Single-Story Substructures to Study Progressive Collapse Behaviour of Multi-Story RC Frames. J. Build. Eng. 2021, 33, 101636. [Google Scholar] [CrossRef]
  7. Du, F.; Wang, J.A.J.; Tan, T. Using Spiral Notch Torsional Test to Investigate Fracture of Unidirectional Fiber Reinforced Composites. Compr. Struct. Integr. 2023, 10, 349–359. [Google Scholar] [CrossRef]
  8. Lei, Y.; Jin, L.; Li, D.; Zhu, H.; Du, X. Comparison of Torsional Damage and Size Effects of BFRP- and Steel-Reinforced Concrete Beams with Different Stirrup Ratios. Eng. Struct. 2023, 285, 116042. [Google Scholar] [CrossRef]
  9. Ibrahim, A.; Askar, H.S.; El-Zoughiby, M.E. Torsional Behavior of Solid and Hollow Concrete Beams Reinforced with Inclined Spirals. J. King Saud Univ. Eng. Sci. 2022, 34, 309–321. [Google Scholar] [CrossRef]
  10. Mo, Y.L.; Yang, R.Y. Response of Reinforced/Prestressed Concrete Box Structures to Dynamically Applied Torsion. Nucl. Eng. Des. 1996, 165, 25–41. [Google Scholar] [CrossRef]
  11. Ayaad, N.; Oukaili, N. Impact Torsional Behavior and Strengthening of Reinforced Concrete Spandrel Beams. Case Stud. Constr. Mater. 2023, 19, e02591. [Google Scholar] [CrossRef]
  12. Xin, Z.; Jianyang, X.; Rui, R.; Linlin, M. Test on Pure Torsion Behavior of Channel Steel Reinforced Concrete Beams. J. Build. Eng. 2021, 44, 102967. [Google Scholar] [CrossRef]
  13. MohamedSalih, M.M.; Yousif, A.R. Effect of Type, Amount and Configuration of Reinforcement in HSC Box-Girders Reinforced with BFRP Bars and Steel Stirrups under Torsion-Shear-Bending. Ain Shams Eng. J. 2022, 13, 101787. [Google Scholar] [CrossRef]
  14. Chen, Y.; He, Q.; Chen, Z.; Liang, X. Bending Restoring Force Model of Angle-Steel Reinforced Concrete Columns under Combined Torsion. Structures 2023, 55, 2186–2198. [Google Scholar] [CrossRef]
  15. Becks, H.; Schmidt, M.; Bosbach, S.; Classen, M. Large-Scale Combined Torsional and Axial Loading System (TorAx)—A New Perspective on Multiaxial Testing of Fracture and Stress Transfer in Plain and Reinforced Concrete. Eng. Struct. 2024, 302, 117391. [Google Scholar] [CrossRef]
  16. Eltaly, B.; EL_Sayed, M.; Meleka, N.; Kandil, K. Torsion Behavior of Strengthened Reinforced Concrete Box Girders with Openings: Analytical and Experimental Investigation. Structures 2024, 60, 105908. [Google Scholar] [CrossRef]
  17. Cocchi, G.M.; Cappello, F. Inelastic Analysis of Reinforced Concrete Space Frames Influenced by Axial, Torsional and Bending Interaction. Comput. Struct. 1993, 46, 83–97. [Google Scholar] [CrossRef]
  18. De-la-Colina, J.; Valdés-González, J.; González-Pérez, C.A. Experiments to Study the Effect of Foundation Rotation on the Seismic Building Torsional, Response of a Reinforced Concrete Space Frame. Eng. Struct. 2013, 56, 1154–1163. [Google Scholar] [CrossRef]
  19. Valipour, H.R.; Foster, S.J. Nonlinear Reinforced Concrete Frame Element with Torsion. Eng. Struct. 2010, 32, 988–1002. [Google Scholar] [CrossRef]
  20. Benavent-Climent, A.; Morillas, L.; Escolano-Margarit, D. Inelastic Torsional Seismic Response of Nominally Symmetric Reinforced Concrete Frame Structures: Shaking Table Tests. Eng. Struct. 2014, 80, 109–117. [Google Scholar] [CrossRef]
  21. Kolchunov, V.I.; Moskovtseva, V.S. Robustness of Reinforced Concrete Frames with Elements Experiencing Bending with Torsion. Eng. Struct. 2024, 314, 118309. [Google Scholar] [CrossRef]
  22. Ding, L.; Chen, J.; Caspeele, R. Determination of Dynamic Collapse Limit States Using the Energy-Based Method for Multi-Story RC Frames Subjected to Column Removal Scenarios. Eng. Struct. 2024, 311, 118170. [Google Scholar] [CrossRef]
  23. Alshaikh, I.M.H.; Nehdi, M.L.; Abadel, A.A. Numerical Investigations on Progressive Collapse of Rubberized Concrete Frames Strengthened by CFRP Sheets. Structures 2024, 60, 105918. [Google Scholar] [CrossRef]
  24. Cheng, J.F.; Gu, Q.; Qian, K.; Fu, F.; Deng, X.F. Dynamic Behavior of RC Frames against Progressive Collapse Subjected to Loss of a Corner Column Scenario. J. Build. Eng. 2024, 86, 108872. [Google Scholar] [CrossRef]
  25. Xiong, Z.; Jia, W.; Chen, X. Progressive Collapse Mechanism of RC Framed Structures Under Earthquake Using Energy Method. KSCE J. Civ. Eng. 2024, 29, 100104. [Google Scholar] [CrossRef]
  26. Qu, T.; Zeng, B.; Zhou, Z.; Huang, L.; Chang, D. Dynamic and Uncertainty-Based Assessment of the Progressive Collapse Probability of Prestressed Concrete Frame Structures with Infill Walls. Structures 2024, 61, 106105. [Google Scholar] [CrossRef]
  27. Yi, F.; Yi, W.J.; Sun, J.M.; Ni, J.; He, Q.F.; Zhou, Y. On the Progressive Collapse Performance of RC Frame Structures under Impact Column Removal. Eng. Struct. 2024, 307, 117926. [Google Scholar] [CrossRef]
  28. Lin, K.; Zheng, J.; Wu, Z.; Lu, X.; Li, Y. Risk-Based Life Cycle Cost–Benefit Analysis for Progressive Collapse Design of RC Frame Structures. Structures 2024, 63, 106468. [Google Scholar] [CrossRef]
  29. Alshaikh, I.M.H.; Abu Bakar, B.H.; Alwesabi, E.A.H.; Abadel, A.A.; Alghamdi, H.; Altheeb, A.; Tuladhar, R. Progressive Collapse Behavior of Steel Fiber-Reinforced Rubberized Concrete Frames. J. Build. Eng. 2022, 57, 104920. [Google Scholar] [CrossRef]
  30. Liu, X.Y.; Qin, W.H.; Xu, Z.D.; Xi, Z.; Zhang, Z.C. Investigation on the Progressive Collapse Resistance of Three-Dimensional Concrete Frame Structures Reinforced by Steel-FRP Composite Bar. J. Build. Eng. 2022, 59, 105116. [Google Scholar] [CrossRef]
  31. Feng, F.F.; Hwang, H.J.; Zhou, Y.; Sun, J.M.; Zhang, H.Z.; Roh, J.H.; Kang, S.M.; Yi, W.J. Effect of Three-Dimensional Space on Progressive Collapse Resistance of Reinforced Concrete Frames under Various Column Removal Scenarios. J. Build. Eng. 2024, 90, 109405. [Google Scholar] [CrossRef]
  32. Husain, M.; Yu, J.; Osman, B.H.; Ji, J. Progressive Collapse Resistance of Post-Tensioned Concrete Beam-Column Assemblies under a Middle Column Removal Scenario. J. Build. Eng. 2021, 34, 101945. [Google Scholar] [CrossRef]
  33. Yu, X.-H.; Dai, K.-Y.; Li, Y.-S. Variability in Corrosion Damage Models and Its Effect on Seismic Collapse Fragility of Aging Reinforced Concrete Frames. Constr. Build. Mater. 2021, 295, 123654. [Google Scholar] [CrossRef]
  34. Wang, S.; Cheng, X.; Li, Y.; Yang, X.; Zhang, H.; Guo, R.; Song, X.; Liang, Z. Assessing Progressive Collapse Regions of Reinforced Concrete Frame Structures Using Graph Convolutional Networks. Eng. Struct. 2025, 322, 119076. [Google Scholar] [CrossRef]
  35. Nguyen, V.H.; Lim, N.S.; Tan, K.H. Effect of torsion on the mobilisation of alternate load paths in double-span reinforced concrete edge beams subjected to progressive collapse. Structures 2025, 77, 109106. [Google Scholar] [CrossRef]
  36. Lei, Y.; Jin, L.; Du, X. Experimental investigation of size effects on BFRP-RC beams under combined bending-shear-torsion loading. Eng. Struct. 2025, 336, 120457. [Google Scholar] [CrossRef]
  37. Fayed, S.; Badawi, M.; Ghalla, M.; Mlybari, E.A.; Iskander, Y.; Yehia, S.A. Effect of reinforcement configurations on behavior of non-straight RC beams under torsion: Optimization for construction safety. Eng. Struct. 2025, 340, 120725. [Google Scholar] [CrossRef]
  38. Rice, J.R. A Path Independent Integral and the Approximate Analysis of Strain Concentration by Notches and Cracks. J. Appl. Mech. Trans. 1968, 35, 379–386. [Google Scholar] [CrossRef]
  39. Chen, A.; Liu, Y.; Ma, R.; Zhou, X. Experimental and Numerical Analysis of Reinforced Concrete Columns under Lateral Impact Loading. Buildings 2023, 13, 708. [Google Scholar] [CrossRef]
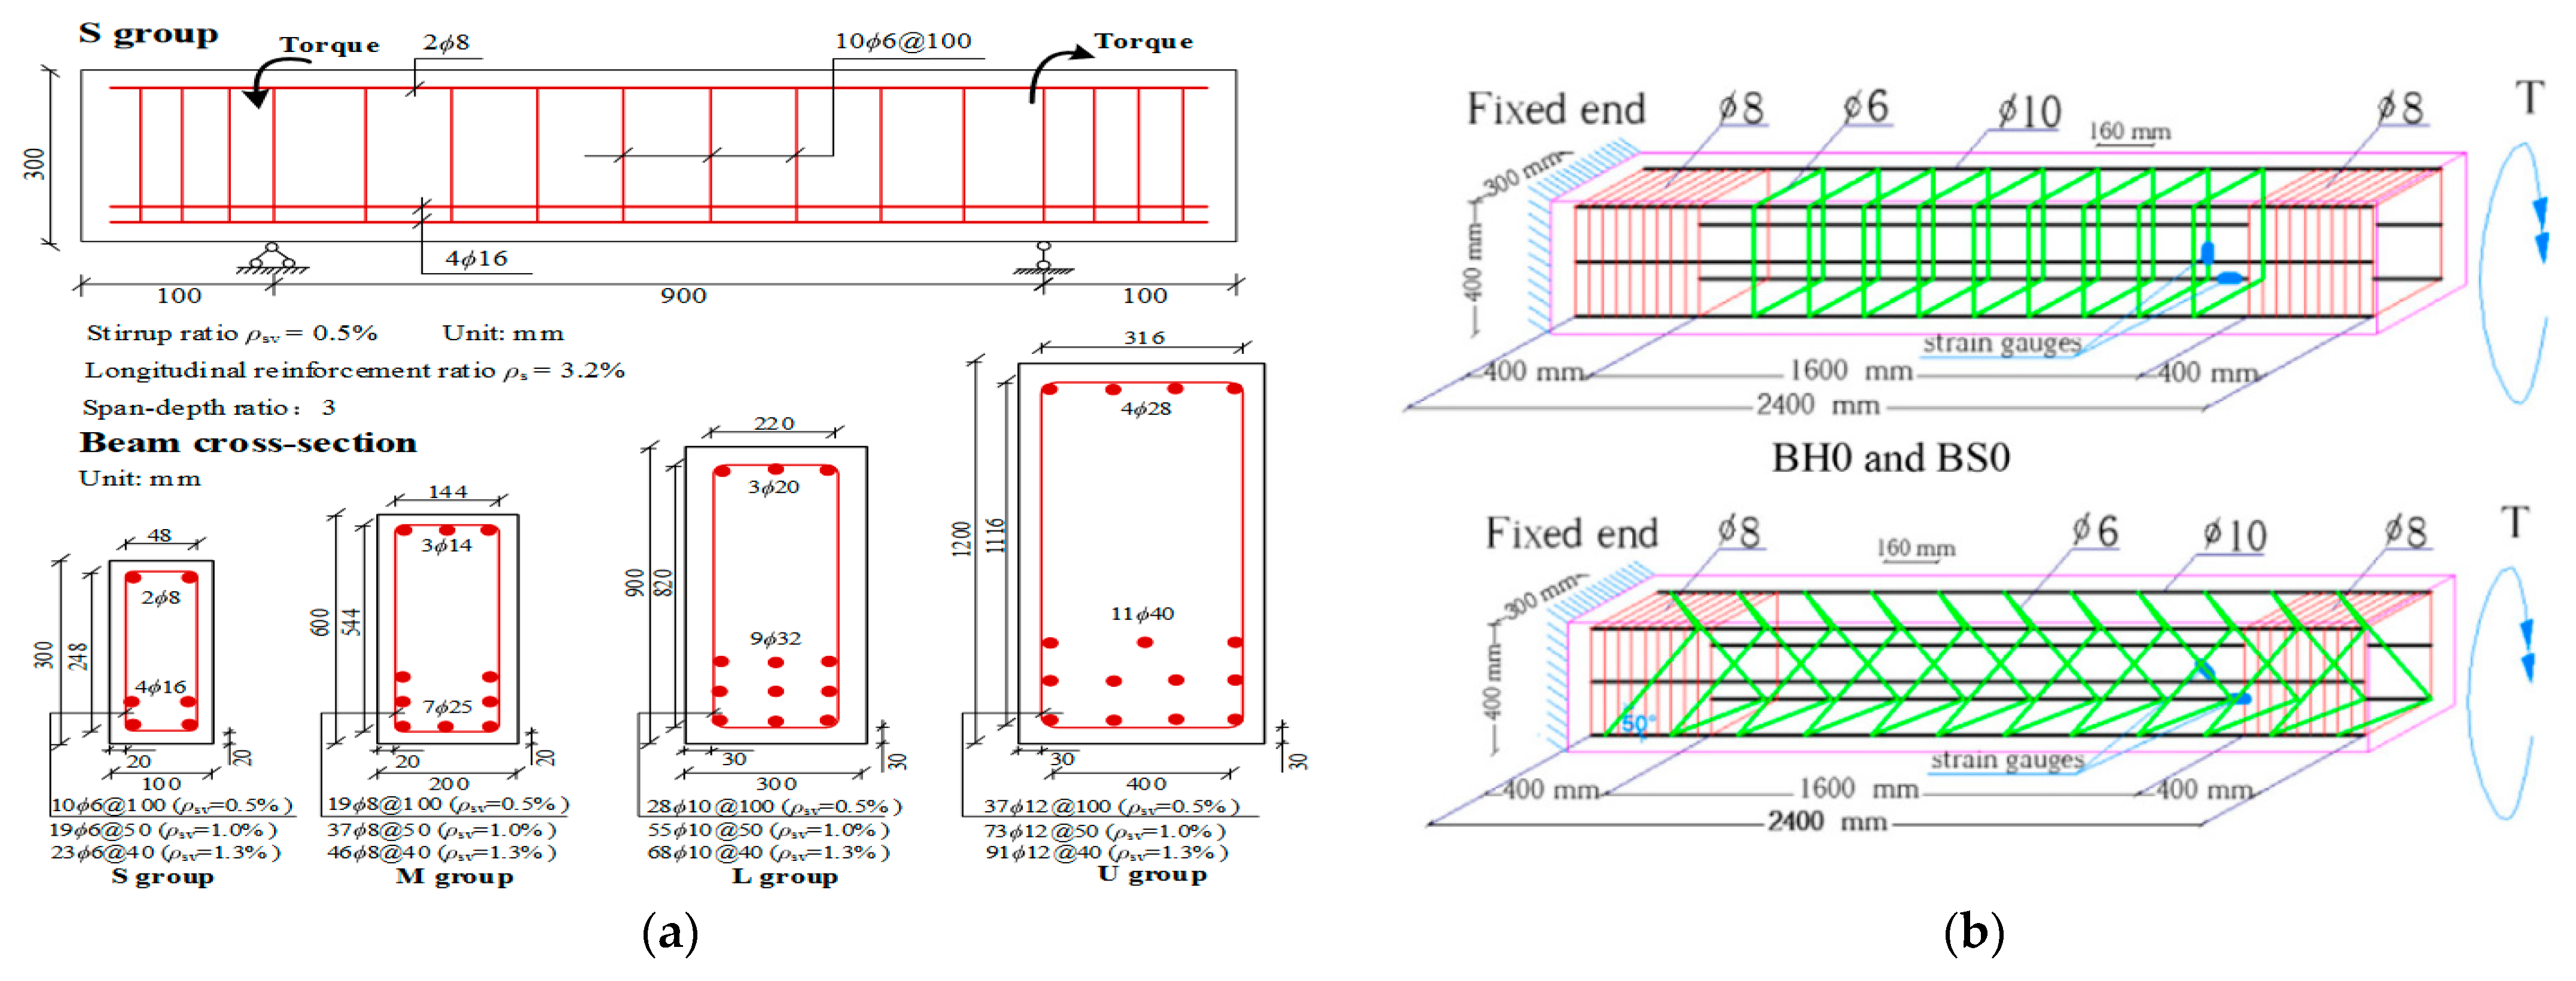
Figure 1. Specimen reinforcement patterns (a) and a spiral reinforcement pattern [9] (b).
Buildings 15 04153 g001
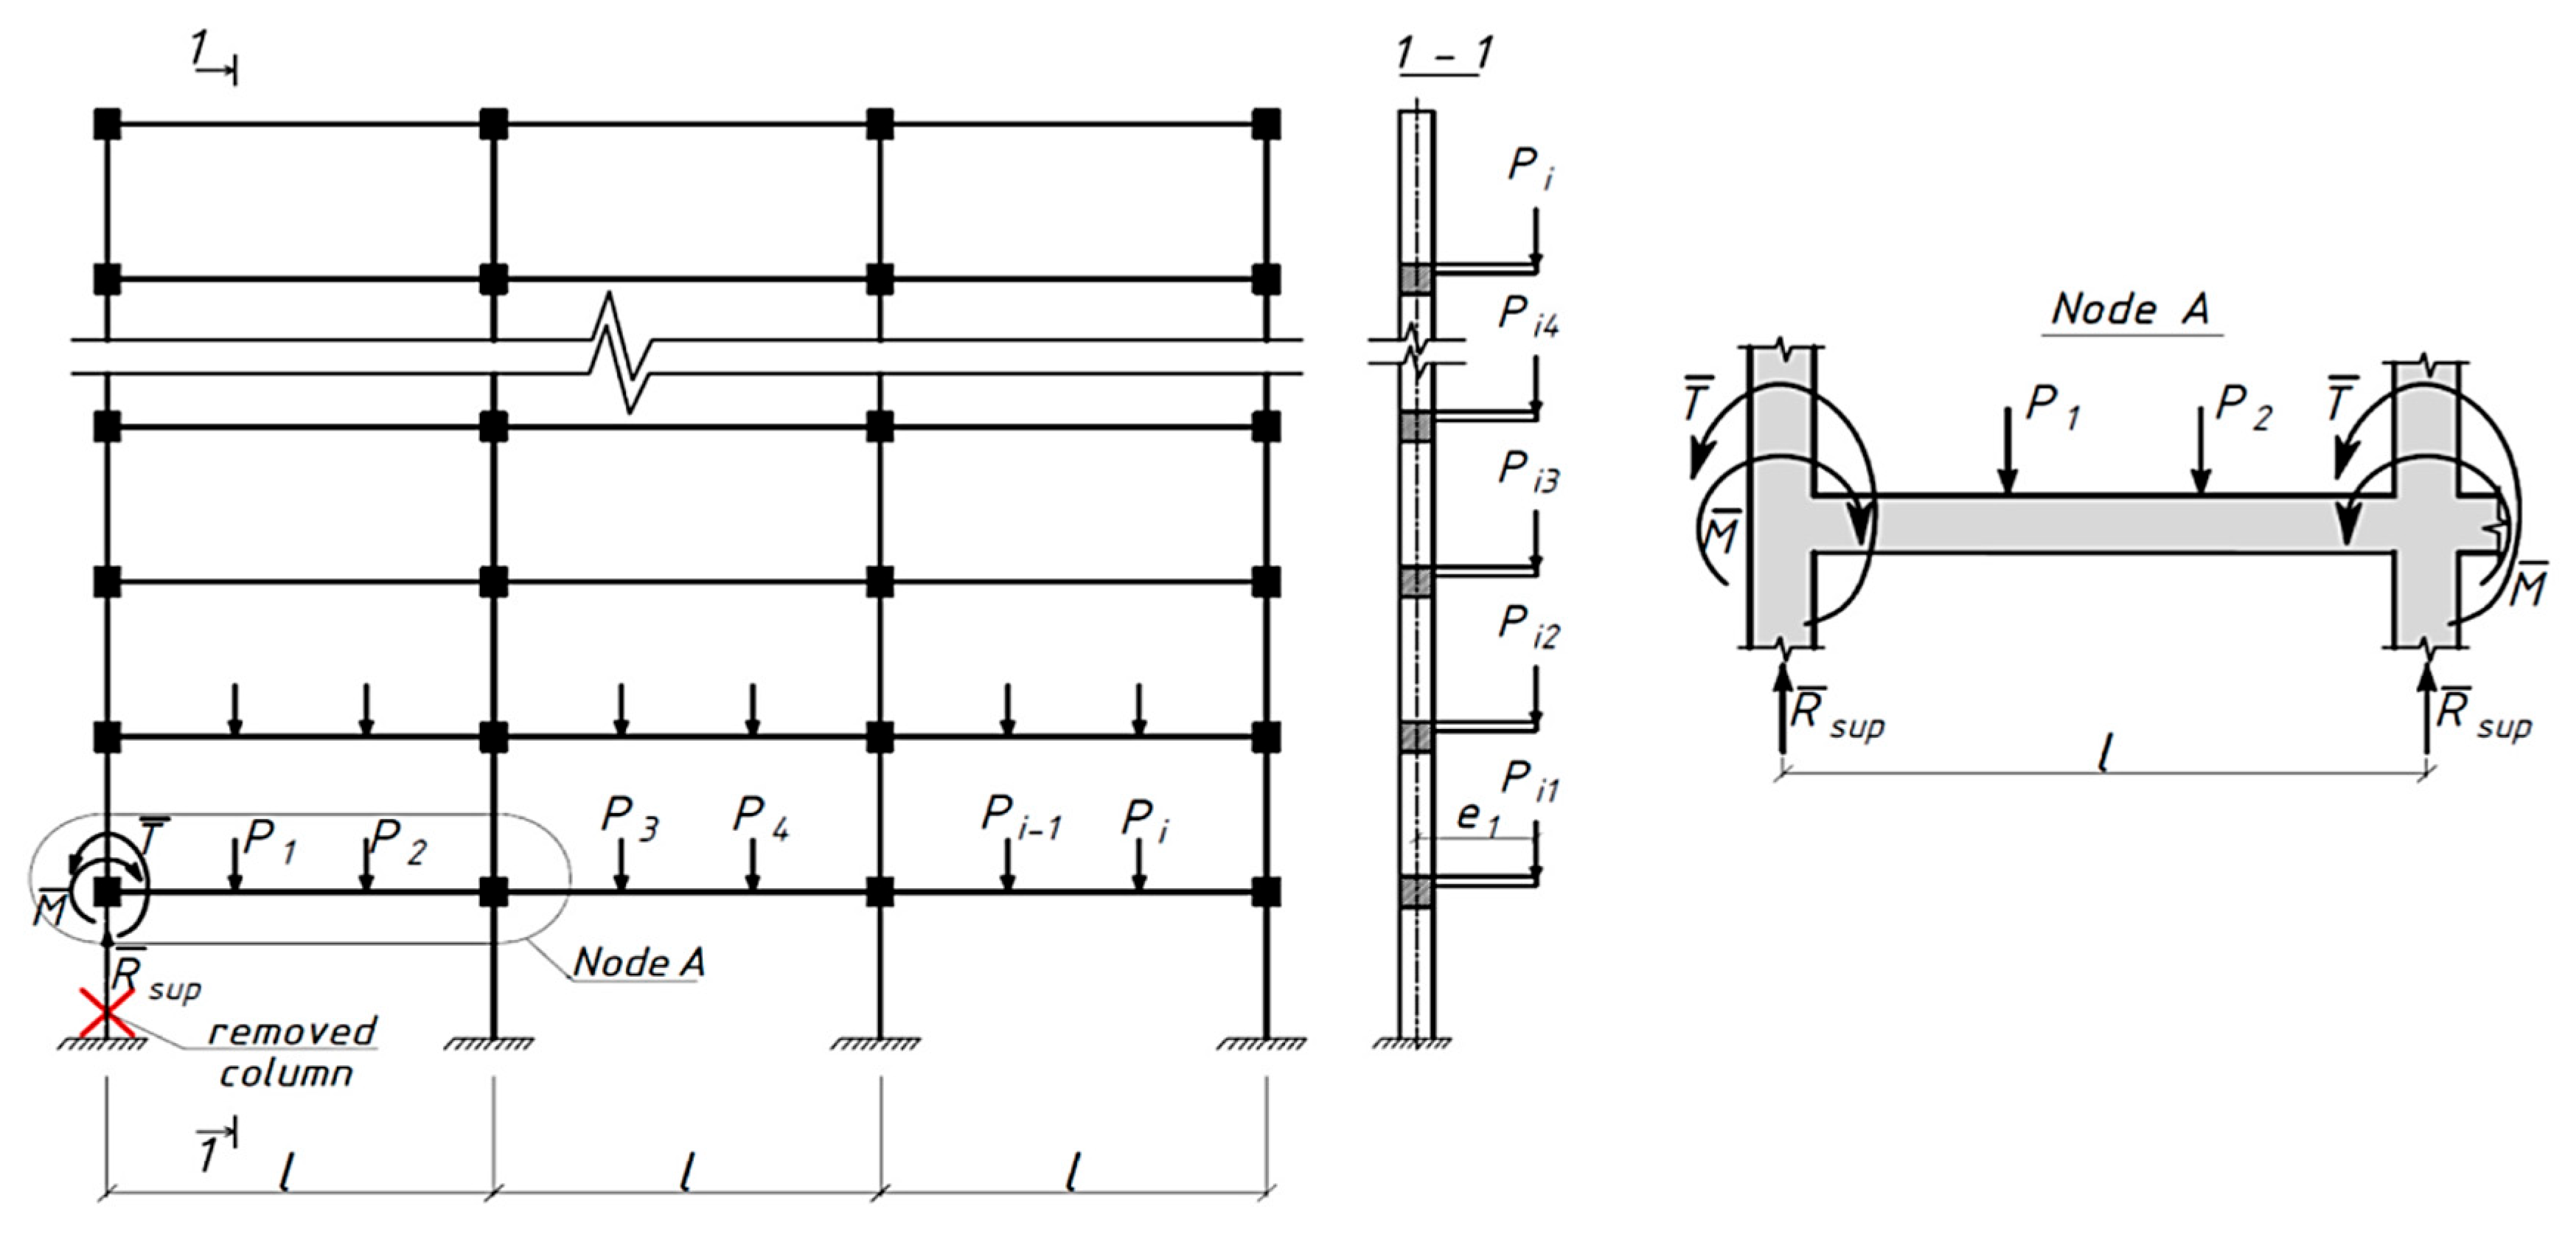
Figure 2. Schematic diagram showing the torsion moment in case of progressive collapse of a frame caused by removal of the edge column.
Buildings 15 04153 g002
Figure 3. Limit surface for bending moments M b x , M b y , torsion moment M t ; 1–7 are surface point numbers.
Buildings 15 04153 g003
Figure 4. A reinforced concrete beam: S—an endangered section; T, Tz—support surfaces with displacement constraints along x, y, z axes and along z axis, respectively.
Buildings 15 04153 g004
Figure 5. Simulation of loads: force actions (a); force in rebars in case of rupture (b); pattern of emergency actions on rebars in case of concrete fracture (c); emergency action on a fragment of a finite element model (d); 1—static operation load, 2—force in rebars, 3—horizontal emergency action, 4—longitudinal rebar curve in case of emergency actions, 5—the same before emergency actions, 6—hexahedral elements of concrete, 7—beam elements of a longitudinal rebar.
Buildings 15 04153 g005
Figure 6. Loading pattern: D1, D2—zones of emergency impact loading, 1—rebars of upper longitudinal reinforcement, 2—rebars of lower longitudinal reinforcement.
Buildings 15 04153 g006
Figure 7. Concrete softening function.
Buildings 15 04153 g007
Figure 8. Interaction between the impactor and a longitudinal rebar: parameterization of contact interaction (a); contour for determining the J integral (b); distribution of stresses in rebar (c); energy interpretation of the J integral (d).
Buildings 15 04153 g008
Figure 9. Beam analysis made according to Collection of Regulations SP 63.13330 for the purpose of beam verification: calculation scheme (a), deflection diagram (b), limit state factors (c), bending moment diagrams (blue curve) and shear forces (red curve) (d).
Buildings 15 04153 g009
Figure 10. Shape and size of the compressed zone of concrete subjected to bending and supplementary dynamic loading by bending and torsion in the zone D1. The values indicated on the scale are given in “Pa”.
Buildings 15 04153 g010
Figure 11. Shape and size of the compressed zone of concrete subjected to bending and supplementary dynamic loading by bending and torsion in the zone D2.
Buildings 15 04153 g011
Figure 12. Stresses triggered by bending in the horizontal plane (a) and torsion (b).
Buildings 15 04153 g012
Figure 13. Section parameters to be added to methods of analysis: Collection of Regulations SP 63.13330 (a); numerical modeling of an impact on the tensile zone of concrete (b); numerical modeling of an impact on the compressed zone of concrete (c), 1—compressed zone of concrete, 2—zone of crushing in the compressed zone, 3—tensile zone of concrete, 4—closed loop of stirrups needed to take impact-triggered torsion.
Buildings 15 04153 g013
Figure 14. Characteristics of strained rebars in the tensile zone of concrete near the impact action: 1–6 are section numbers assigned for strain measurement purposes.
Buildings 15 04153 g014
Figure 15. Characteristics of reinforcing bar strain in the tensile zone of concrete near the impact action: 1–6 are sections numbered for strain measurement purposes.
Buildings 15 04153 g015
Figure 16. Construction of limiting surfaces: visualization (a), characteristics of the stress-strain state of concrete (b) and rebars (c) for point 1, stress scale for principal stresses in concrete (d) and equivalent stresses in rebars (e) 1–12—numbers assigned to surface points.
Buildings 15 04153 g016
Table 1. Numerical description of concrete model.
Compressive Strength, MPaTensile Strength, MPaAngle of Internal Friction
φ , Degrees
Cohesion Stresses C, MPaDilation Angle,
Degrees
Dilatation Level,
σ / R b
14.51.05343.5280.3
Table 2. Analytical model verification.
Method of AnalysisMaximum Deflection, mmM/Mult *Q/Qult *
Collection of Regulations 63.13330.201816.5780.9560.765
Collection of Regulations 63.13330.2018
(redistribution of forces in a statically indeterminate system)
16.570.6560.555
DP-model (3D model)16.440.70130.559
* Mult, Qult are ultimate values of forces that can be taken by the section.
Table 3. Beam analysis without ruptured rebars.
D1, Lower Zone, at Peak Intensity H l Bearing Capacity,
Exposure Time
D2, Upper Zone, at Peak Intensity H u Bearing Capacity,
Exposure Time
Load q2 = 90,000 N/m2 (3.6 t/m) *, if an impact on concrete does not cause any fracture of rebars
40 kNBearing capacity
maintained, t = 0.8 s
40 kNBearing capacity
maintained, t = 0.8 s
60 kNThe same60 kNThe same
80 kNThe same80 kNFracture, t = 0.36 s
84 kNFracture, t = 0.351 s84 kNFracture, t = 0.336 s
86 kNFracture, t = 0.328 s86 kNFracture, t = 0.323 s
88 kNFracture, t = 0.332 s88 kNFracture, t = 0.320 s
90 kNFracture, t = 0.326 s90 kNFracture, t = 0.310 s
q3 = 120,000 N/m2 (4.8 t/m), if an impact on concrete does not cause any fracture of rebars
10 kNBearing capacity
maintained, t = 0.8 s
10 kNBearing capacity
maintained, t = 0.8 s
20 kNThe same20 kNThe same
30 kN-//-30 kNThe same
40 kNFracture, t = 0.303 s40 kNFracture, t = 0.287 s
50 kNFracture, t = 0.251 s50 kNFracture, t = 0.231 s
60 kNFracture, t = 0.186 s60 kNFracture, t = 0.172 s
80 kNFracture, t = 0.135 s80 kNt = 0.123 s
* The load q2 = 90 kN/m2 (and other similar loads) acts on the upper plane of the 0.4 m wide beam and is converted to a linear load by multiplying it by this width, i.e., 90 ∗ 0.4 = 36 kN/m = 3.6 t/m. The load of 80 kN is the total concentrated force (Figure 6), which in the calculation model was applied in the form of four forces shown by red arrows.
Table 4. Using energy estimation to determine the condition for the rebar rupture in the lower zone.
P, kN σ s , MPa b , m Δ 10 3 , m J , N/mFracture
Operating load q1 = 60,000 (2.4 t/m)
14430.50.029750.5388,963no
2500.61110,080yes
3540.71134,092yes
Operating load q2 = 90,000 (3.6 t/m)
13562.20.027420.3996,645no
2360.40100,035yes
3380.43109,948yes
Operating load q3 = 120,000 (4.8 t/m)
12885.50.025710.2991,177no
2300.3198,972no
3320.34110,203yes
Table 5. Ultimate loads in case of bending and dynamic torsion, and fracture of the rebar in the lower zone D1.
Peak IntensityBearing Capacity,
Exposure Time
Peak IntensityBearing Capacity,
Exposure Time
Peak IntensityBearing Capacity,
Exposure Time
Load q1 = 60,000 (2.4 t/m),Load q2 = 90,000 (3.6 t/m),Load q3 = 120,000 (2.4 t/m),
30 kNNot evaluated
because
J < Jcr
48 kNRebar fracture
J > Jcr
The bearing capacity is maintained, t = 0.8 s
24 kNNot evaluated
because
J < Jcr
40 kNThe same52 kNThe same32 kNRebar rupture
J > Jcr
Fracture,
t = 0.356 s
50 kNRebar rupture
J > Jcr. The bearing capacity is maintained, t = 0.8 s
56 kNFracture,
t = 0.354 s
40 kNFracture,
t = 0.300 s
60 kNThe same60 kNFracture,
t = 0.323 s
48 kNFracture,
t = 0.254 s
72 kNThe same68 kNFracture,
t = 0.307 s
60 kNFracture,
t = 0.181 s
76 kNFracture,
t = 0.285 s
72 kNFracture,
t = 0.298 s
64 kNFracture,
t = 0.127 s
80 kNFracture,
t = 0.303 s
76 kNFracture,
t = 0.292 s
70 kNFracture,
t = 0.083 s
Table 6. Using energy estimation to determine the condition for rebar rupture in the upper zone.
P, kN σ s , MPa b , m Δ 10 3 , m J , N/mRebar Fracture
Operating load q = 60,000 (2.4 t/m)
150370.025610.4195,304no
2560.46114,624yes
3600.49127,566yes
Operating load q = 90,000 (3.6 t/m)
120700.023490.3691,426no
2240.40106,450yes
3260.46125,215yes
Operating load q = 120,000 (4.8 t/m)
1121300.019630.2199,309no
2160.27131,616yes
3240.30154,970yes
Table 7. Ultimate loads in bending and dynamic torsion and inability of the rebar in the upper zone D2 to take loads.
Peak IntensityBearing Capacity,
Exposure Time
Peak IntensityBearing Capacity,
Exposure Time
Peak IntensityBearing Capacity,
Exposure Time
Load q1 = 60,000 (2.4 t/m),Load q2 = 90,000 (3.6 t/m),Load q3 = 120,000 (4.8 t/m),
48 kNNot evaluated as J < Jcr28 kNRebar rupture,
J > Jcr.
Bearing capacity maintained, t = 0.8 s
14 kNRebar rupture,
J > Jcr.
Bearing capacity maintained, t = 0.8 s
52 kNThe same30 kNThe same16 kNThe same
56 kNRebar rupture,
J > Jcr.
Bearing capacity maintained, t = 0.8 s
32 kNThe same20 kNThe same
60 kNThe same38 kNThe same24 kNThe same
68 kNThe same44 kNThe same28 kNFracture,
t = 0.287 s
72 kNFracture,
t = 0.304 s
48 kNFracture,
t = 0.285 s
32 kNFracture,
t = 0.312 s
76 kNFracture,
t = 0.359 s
52 kNFracture,
t = 0.264 s
36 kNFracture,
t = 0.069 s
Table 8. Construction of the limiting surface.
No. of Points
(Figure 16a)
M b x , kN M b y , kNm M t , kNm
1731.800
238.58 *280.700
3 **38.58054.00
438.58126.0450.63
538.58120.154.41
6496.12115.2146.04
7496.1286.253.20
8661.5021.201.40
9661.5072.9128.70
10330.75052.54
11661.50051.01
12496.12239.00
* Here, if q w = 7   kPa , M b = q l 2 / 8 38.58   kN m . ** Obtained by applying a follower couple of forces to the section in the horizontal plane.
Disclaimer/Publisher’s Note: The statements, opinions and data contained in all publications are solely those of the individual author(s) and contributor(s) and not of MDPI and/or the editor(s). MDPI and/or the editor(s) disclaim responsibility for any injury to people or property resulting from any ideas, methods, instructions or products referred to in the content.