1. Introduction
Dampers are devices employed to mitigate vibrations in structures [
1]. The concept of particle dampers originates from the development of single-particle impact dampers proposed by Paget [
2]. Particle dampers serve as passive control systems, finding extensive use owing to their simplicity, cost-effectiveness, and resilience in various temperature ranges. These dampers consist of granular materials with sizes normally ranging from the micrometer scale to the millimeter scale, contained in a unit mounted on the structure [
3]. The dissipation of energy within these dampers arises from impacts between particles and with the container walls [
4]. Researchers have previously reported the efficiency of particle dampers in mitigating structural seismic responses, e.g., [
5,
6,
7,
8]. The use of a cantilever beam has proven to be an effective method for investigating the performance of particle dampers and has been employed by researchers in previous studies, e.g., [
9,
10,
11,
12]. Guo et al. [
12] conducted a numerical investigation of multi-unit particle dampers attached to a cantilever beam. The results indicated that damping primarily occurred due to particles hitting the walls. Additionally, an increase in the number of cells within the multi-unit particle damper resulted in a reduction of specific damping capacity. Wang et al. [
11] studied the performance of a particle damper attached to an L-shaped cantilever beam subjected to horizontal–vertical vibrations. It was observed that friction played a central role in kinetic energy dissipation during horizontal–vertical vibrations. On the other hand, for vertical vibrations, energy dissipation was dominated by inelastic collisions.
Cundall and Strack [
13] introduced the discrete element method (DEM), which is based on the Lagrangian method. Although this method can model both structures and sand grains, e.g., [
14,
15], it has a high computational cost and becomes challenging when simulating large-scale systems [
16]. DEM computer simulations of particle dampers attached to cantilever beams showed that the addition of particles could alter the system’s vibrating frequency [
10]. When single mass impact dampers were compared to fine particle impact dampers, it was observed that the latter exhibited superior performance. Researchers noted that attaching a fine particle damper to a cantilever beam led to a reduction in the displacement of the primary structure [
17]. Additionally, Panossian [
5] showed that the optimal vibration suppression could be achieved by filling small particles into the cavities.
Pressurized sand dampers (PSDs) are classified as passive control systems that dissipate input energy. Their energy dissipation mechanism primarily arises from shear forces generated between sand grains, which are more significant than inertia forces [
18]. PSDs are classified as particle dampers, where pressurized sand particles are placed within a container featuring a movable piston [
19]. The PSD was developed to overcome the shortcomings of commonly used dampers, such as the influence of environmental changes on friction damper performance, the degeneration of viscous fluid in viscoelastic dampers, and displacement restrictions in metallic yield dampers [
19].
Kalfas et al. [
20] examined various configurations of the recently developed PSD and concluded that the force output of the PSD reduces with an increase in container length. Karimipetanlar et al. [
21] conducted a numerical investigation into energy dissipation and particle crushing within a PSD. Their findings indicated that a significant portion of the particle crushing occurs at the center of the PSD. Furthermore, it was observed that increasing the stroke amplitude of the piston leads to higher energy dissipation. Sabi et al. [
22] explored a PSD using rigid blocks as sand grains and determined that energy dissipation primarily occurs from frictional sliding between particles. Examining the impact of different particle shapes as sand grains within a PSD revealed that, despite the variation in particle shapes, the majority of particle crushing still occurs at the center of the PSD, and the dynamic force generation remains unaffected by particle shapes [
23].
There are three main definitions for the coefficient of restitution (COR): kinematic [
24], kinetic [
25], and energetic [
26]. The kinematic definition is based on velocity, while the kinetic definition is based on the impulse during impact. The energetic definition is also based on the energy during impact. Stronge [
26] showed that these three definitions converge to the same value during the direct central impact of two identical spheres. In the present study, the kinematic COR is employed and calculated as the ratio of the relative velocities between post-impact and pre-impact [
27]. Li et al. [
28] numerically investigated drop weight experiments on reinforced concrete beams and observed that the interaction between the drop weight and the beam affects the impact force. A lighter mass tends to rebound more quickly from a heavier beam, whereas a heavier mass tends to move together with a lighter beam.
The aim of this study is to investigate the response of a cantilever beam equipped with a particle damper filled with pressurized sand (PSD). The sand grains used in this study, previously utilized by Karimipetanlar et al. [
21,
23], were classified as poorly graded according to the Unified Soil Classification System (USCS). The influence of different particle damper porosities and initial pressures on the beam’s response when subjected to impact was investigated. Additionally, the energy dissipated inside the damper for various damper porosities was monitored and compared. The optimal position for reducing the beam’s displacement was also explored.
Figure 1 illustrates the numerical setup along with a close view of the particle damper and the two measurement spheres inside the particle damper. In this figure each particle color indicates a different particle size.
The runtime of each simulation ranged from 4 to 7 days, depending on the initial pressure and porosity conditions of the model. All simulations were performed using a powerful workstation equipped with dual Intel(R) Xeon(R) Gold 6230 R CPUs running at GHz, each with 52 cores and 13,690 threads, and 128 GB of RAM.
2. Numerical Model
The response of a cantilever beam equipped with a PSD and subjected to impact loads was investigated using PFC 3D version 7 software [
29]. In DEM the movement of an individual, rigid particle is governed by the resultant force and moment vectors exerted on it. This motion can be explained by considering the translational movement of a point in a particle, as well as its rotational motion. The center of mass’s motion is characterized by its position (
x), velocity (
), and acceleration (
). Meanwhile, the particle’s rotational motion is described by its angular velocity (
) and angular acceleration (
).
The equations describing motion can be presented as a pair of vector equations: one connects the resultant force to the translational motion, while the other relates the resultant moment to rotational motion. The translational motion can be described in vector form using Equation (
1):
where
is the resultant force,
m is the particle’s mass, and
is gravitational loading [
29]. This equation can be solved using the second-order Velocity Verlet algorithm [
30].
The equation for rotational motion of a rigid body is presented in Equation (
2).
where
and
are the angular momentum and inertia tensor [
29].
Particles in DEM are considered rigid with the ability to overlap. This amount of overlap is controlled by a contact force model. The contact force between two particles is comprised of normal (
) and shear (
) components. The normal component is idealized using a linear spring model connected in parallel with a viscous dashpot:
where
and
are relative displacement and velocity at the contact along the line connecting the spherical particle centers, respectively.
is the unit normal vector at the contact,
is the normal contact stiffness, and
is the normal viscous damping coefficient [
29]. The incremental shear contact force is also idealized using a linear spring in series with a frictional slider:
where
and
are, respectively, the incremental shear displacement and velocity vectors at the contact.
and
are the shear viscous damping coefficient and shear contact stiffness, respectively [
29].
The relationship between the shear and normal forces follows a slip Coulomb model [
29], where
is the resultant shear force at the contact,
represents the Coulomb friction coefficient, and
is the resultant normal force at the contact, with the condition that
.
The rolling resistance contact model introduces a rolling resistance mechanism to the linear contact model. This contact model generates a counteracting torque at the contact point to oppose rolling motion. As the relative rotation between contacting surfaces increases, an internal moment develops in proportion to the rotation. This model can only resist relative bending at contact points and is activated when the surface gap is zero or smaller [
29]. The motion of a discrete particle
p can be expressed using the momentum equations:
where
and
are the translational and rotational displacement vectors, respectively. The particle’s moment of inertia is
,
is the mass of the particle,
refers to the number of contacts with surrounding particles,
is the interparticle force at contact
c,
is the vector connecting the particle’s center to the contact’s location,
is the gravitational acceleration vector, and
is the rolling resistance contact moment [
29].
Parallel bonds can be employed to create flexible structures in DEM. A parallel bond connecting two particles comprises a group of normal and shear springs with consistent stiffness. These springs are uniformly distributed across a circular disk positioned on the contact plane and centered at the contact point [
29].
Figure 2 illustrates the components of the linear parallel bond model between two particles in contact. In this figure,
and
represent the normal and shear critical damping ratios, respectively.
denotes the contact gap, while
and
are the normal and shear stiffnesses of the linear springs, respectively. Similarly,
and
indicate the normal and shear stiffnesses of the parallel bond springs, respectively.
is the tensile strength, and
is the shear strength (cohesion) of the parallel bond. Finally,
and
represent the friction angle and friction coefficient, respectively.
When there is relative motion at a bonded contact, it leads to the generation of force and moment within the circular disk (
Figure 3). The incremental interparticle bond forces in the normal
and shear
directions at contact point
c are calculated as follows:
where
and
are, respectively, the normal and shear relative displacements of the particles at contact point
c.
and
are the normal and shear contact bond stiffness.
is the ratio between the radii of the bond disk and the smaller of the two bonded spherical particles [
29]. The interparticle bond moments also include normal and shear components as follows:
In the above equations,
and
are the normal and shear components of the bond moment, respectively [
29]. The translational equation of motion for a bonded particle can be expressed using Equation (
5) where interparticle forces are calculated using Equations (
7) and (
8). The rotational motion of bonded particles is calculated by using Equation (
11) [
29]:
The cantilever beam was modeled as a flexible structure through the use of parallel bonds, which can transfer both forces and moments. The beam had a length of 3000 mm and a diameter of 100 mm. The density of each particle composing the beam was set to 1 kg/
to minimize the effect of the beam’s weight. This resulted in a total mass of
kg for the beam. The stiffness of the parallel bond was calculated using Equations (
12) and (
13) in a manner that ensures the collection of equivalent elastic cylinders forming the beam mimics a steel beam with a modulus of elasticity of 200 GPa and a shear modulus of 77 GPa.
where
and
are the normal and shear stiffness of the parallel bond, respectively.
is the modulus of elasticity,
is the shear modulus, and
is the length of the parallel bond between two neighboring particles [
29].
The local damping for the beam was chosen in such a way as to achieve a damping ratio of
during free vibration. The tensile and shear strength of the parallel bonds creating the beam have both been assigned a high value of
GPa to prevent them from breaking due to the sudden application of loads. The damper container measured 300 mm in length and had a radius of
mm. The inner rod featured a radius of
mm and had a sphere with a radius of 28 mm attached to its center. The damper was attached to the tip of the beam and filled with sand grains. Using the agglomerate method, crushable, elongated-shaped particles were selected to represent the sand grains inside the damper (
Figure 1). As Karimipetanlar et al. [
23] showed, this particle shape is capable of showing the behavior of real sand grains. For each simulation, nine specific sets of sand particles were produced, with radii ranging from
mm to 5 mm. When crushing occurs, the rolling resistance model will be applied at all particle–particle and particle–wall contacts to account for the non-realistic spherical shape of the separated particles.
Table 1 shows the values used for each parameter, separately for the beam and the particle damper. In addition, the parameters for the sand grains presented in
Table 1 were previously implemented by Karimipetanlar et al. [
21], yielding close results to the physical experiments.
In the first step, sand particles were allowed to settle under gravity to achieve the target porosity. Following this step, using a servo mechanism, the necessary initial pressure was applied to the damper’s end caps. Impact loading was applied to the system by dropping a 1 kg free-falling mass from an initial height of 50 mm onto the cantilever beam. Measurement spheres were positioned on both sides of the central sphere, at distances of 80 mm (
Figure 1). These measurement spheres, with a radius of 50 mm, ensured that a sufficient number of particles could be monitored for higher accuracy. Measurement spheres calculate average values from objects that are fully or partly within the specified region. They were applied to track variations in porosity in these regions.
3. Results and Discussion
Theoretical and numerical results were compared to verify that the DEM model produces results consistent with theoretical predictions. To achieve this, the cantilever beam was initially subjected to a static downward force of
N. The resulting deflection of the beam can be calculated using the following equation, e.g., [
31]:
where
P is the force applied,
L is the beam’s length,
E is the modulus of elasticity, and
I is the moment of inertia.
Figure 4a displays the static deflection of the cantilever beam as determined by the DEM model. A close agreement is observed between the two sets of values with an error of
. In the next step, the theoretical deflection of a cantilever beam subjected to an impact force from a free-falling 1 kg mass was calculated using the following equation, e.g., [
31]:
where
h is the falling height.
Figure 4b illustrates the modeled beam’s response to the same falling mass, demonstrating a close agreement with the theoretical result obtained from Equation (
15). In this case the error was
.
In this study, two definitions of porosity—local and global—have been utilized to investigate the response of a cantilever beam with an attached particle damper. Global porosity is defined as the volume of pores, or open spaces, between particles within the damper’s housing, while local porosity specifically refers to the empty spaces between particles that are enclosed within the measurement spheres, as mentioned in
Figure 1. Changes in local porosity were closely monitored using the previously mentioned measurement spheres. Additionally, the global porosity was calculated by considering the volume of each particle relative to the total volume of the container. In the numerical model, each particle’s volume was calculated based on its geometry, and the available void volume inside the damper was also determined. The number of particles in each size group was then determined by relating the total particle volume to the damper’s void volume in order to achieve the target porosities, where porosity is defined as the ratio of void volume to total volume. This procedure allowed precise control of packing density, resulting in more representative material behavior in the simulations. Through a systematic optimization process, four different local porosities—
,
,
, and
—corresponding to global porosities of
,
,
, and
, respectively, were considered in this study to investigate the beam’s response. These four values capture all the different behaviors observed in the beam during simulations. It should be noted that, in practice, a given porosity can be realized by selecting appropriate grain size distributions and particle shapes that promote dense packing.
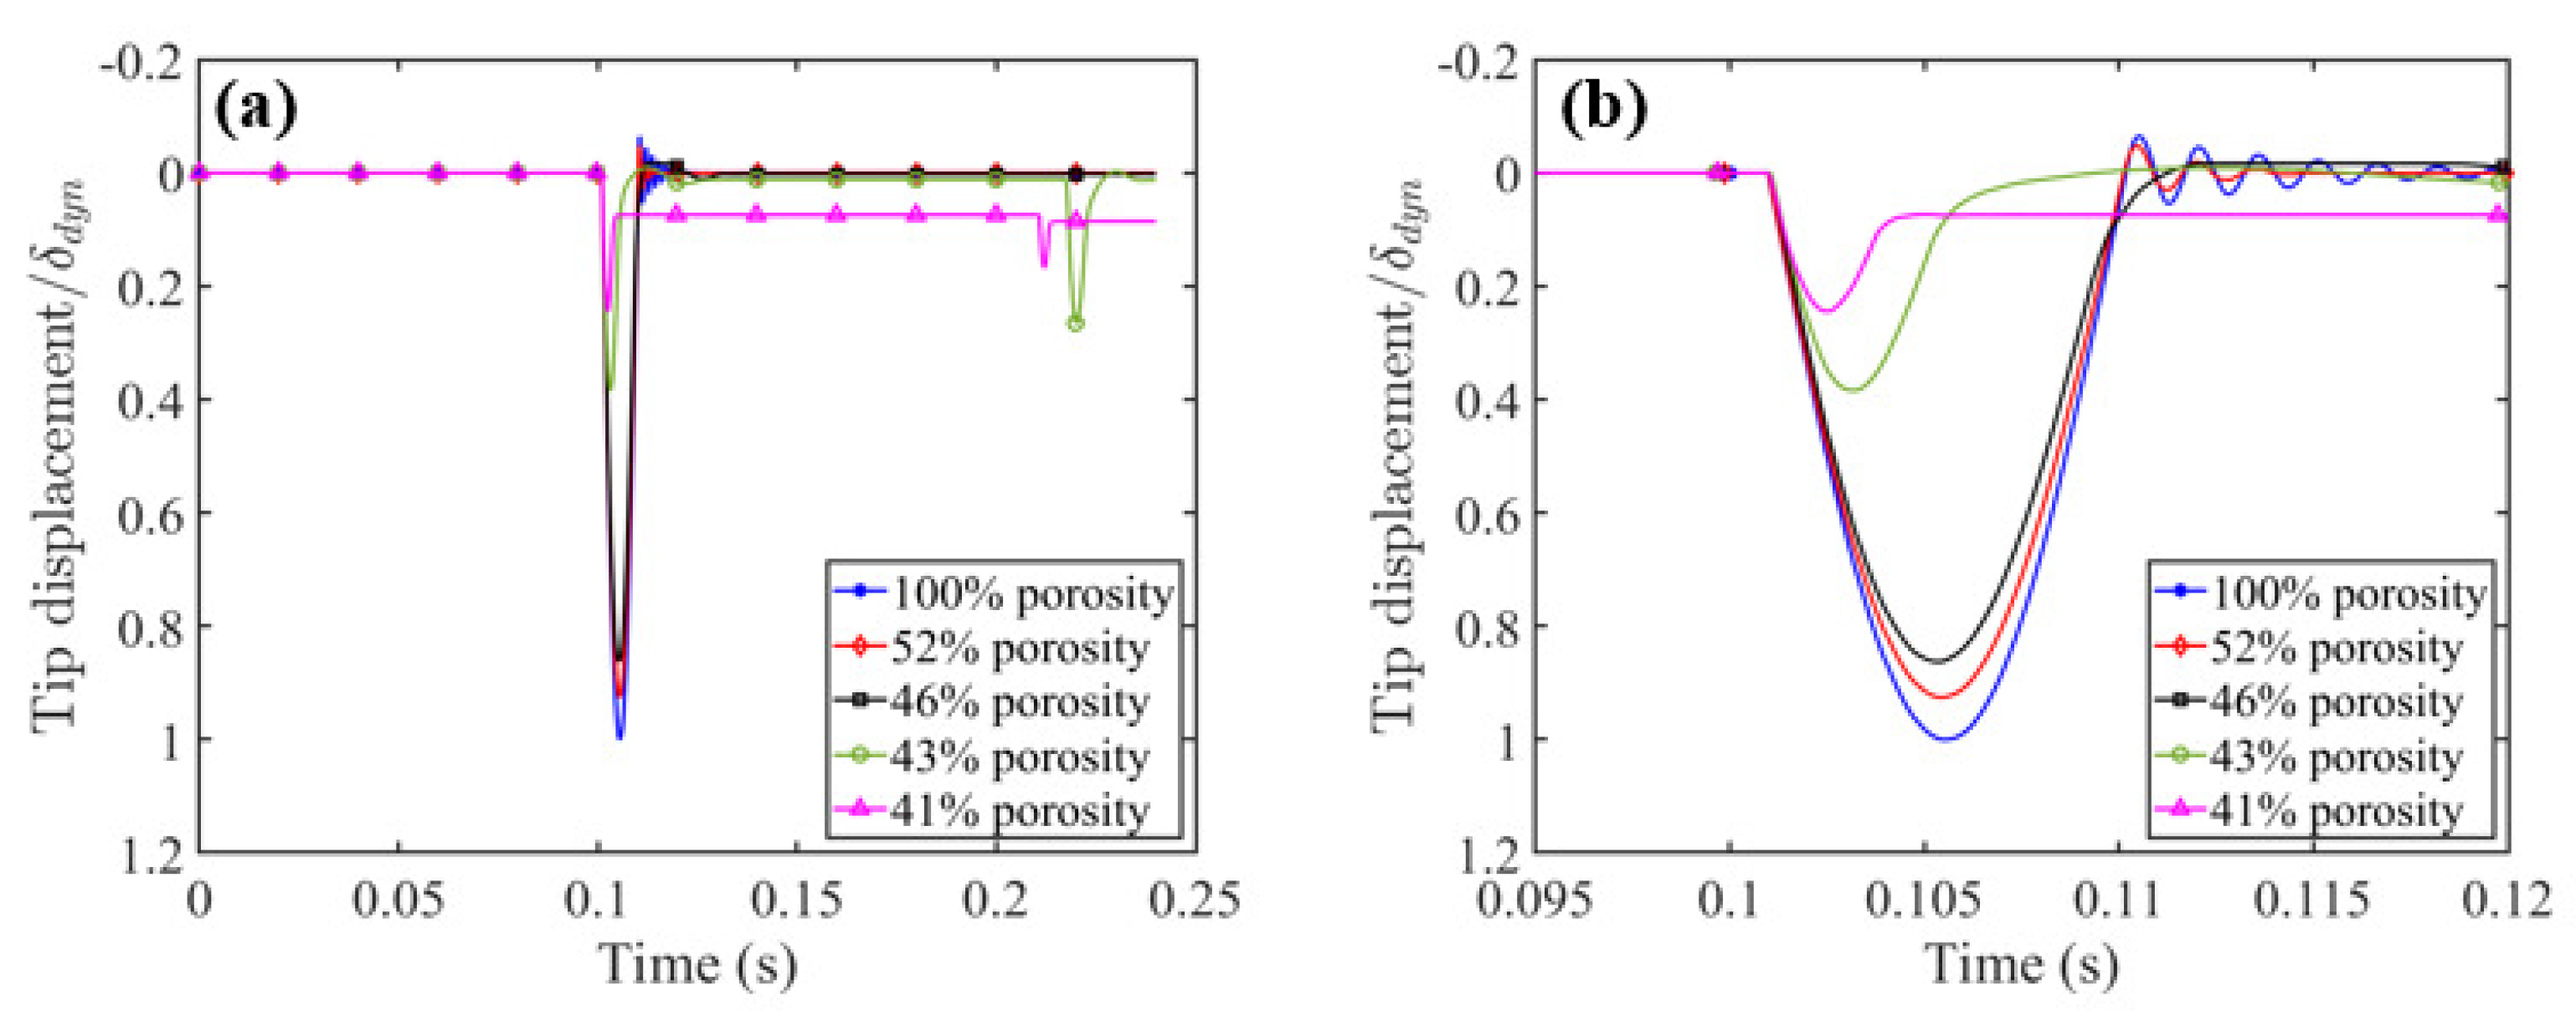
The normalized tip displacement time history of the cantilever beam, both with and without a particle damper attached to the tip, when subjected to an impact load caused by a free-falling 1 kg mass from a height of 50 mm, is illustrated in
Figure 5a.
Figure 5b is presented to better monitor the changes in tip displacement during the first impact. The results indicate that the presence of a particle damper decreases the beam’s tip displacement and also alters the primary system’s vibration frequency. In terms of minimizing the beam’s tip displacement, a decrease in the sand’s local porosity leads to improved performance of the particle damper. Based on this figure, the case of
local porosity results in a more noticeable permanent displacement compared to the case of
. This is because of the resistance provided by the dense packing of particles that prevents the rod to rebound back to its original position. Similar improvements in a beam’s response were observed by Ehlers et al. [
32] and Zhang et al. [
33] when a particle damper was applied.
Applying the logarithmic decrement approach, it was observed that attaching a particle damper with a local porosity of increases the system’s damping ratio from to . Additionally, it was observed that when the local porosity falls below , the system becomes over-damped. The beam’s displacement reduces significantly when the damper is nearly full of particles. It can be concluded from this figure that while reducing local porosity leads to smaller displacement, it also reduces the time interval between sub-impacts on the beam. These sub-impacts, in turn, result in a smaller displacement compared to the initial impact. This behavior can be attributed to the greater amount of dissipated energy at lower porosity levels. As more energy is dissipated, less remains in the falling mass, reducing the maximum height of rebound and thereby causing sub-impacts to occur sooner.
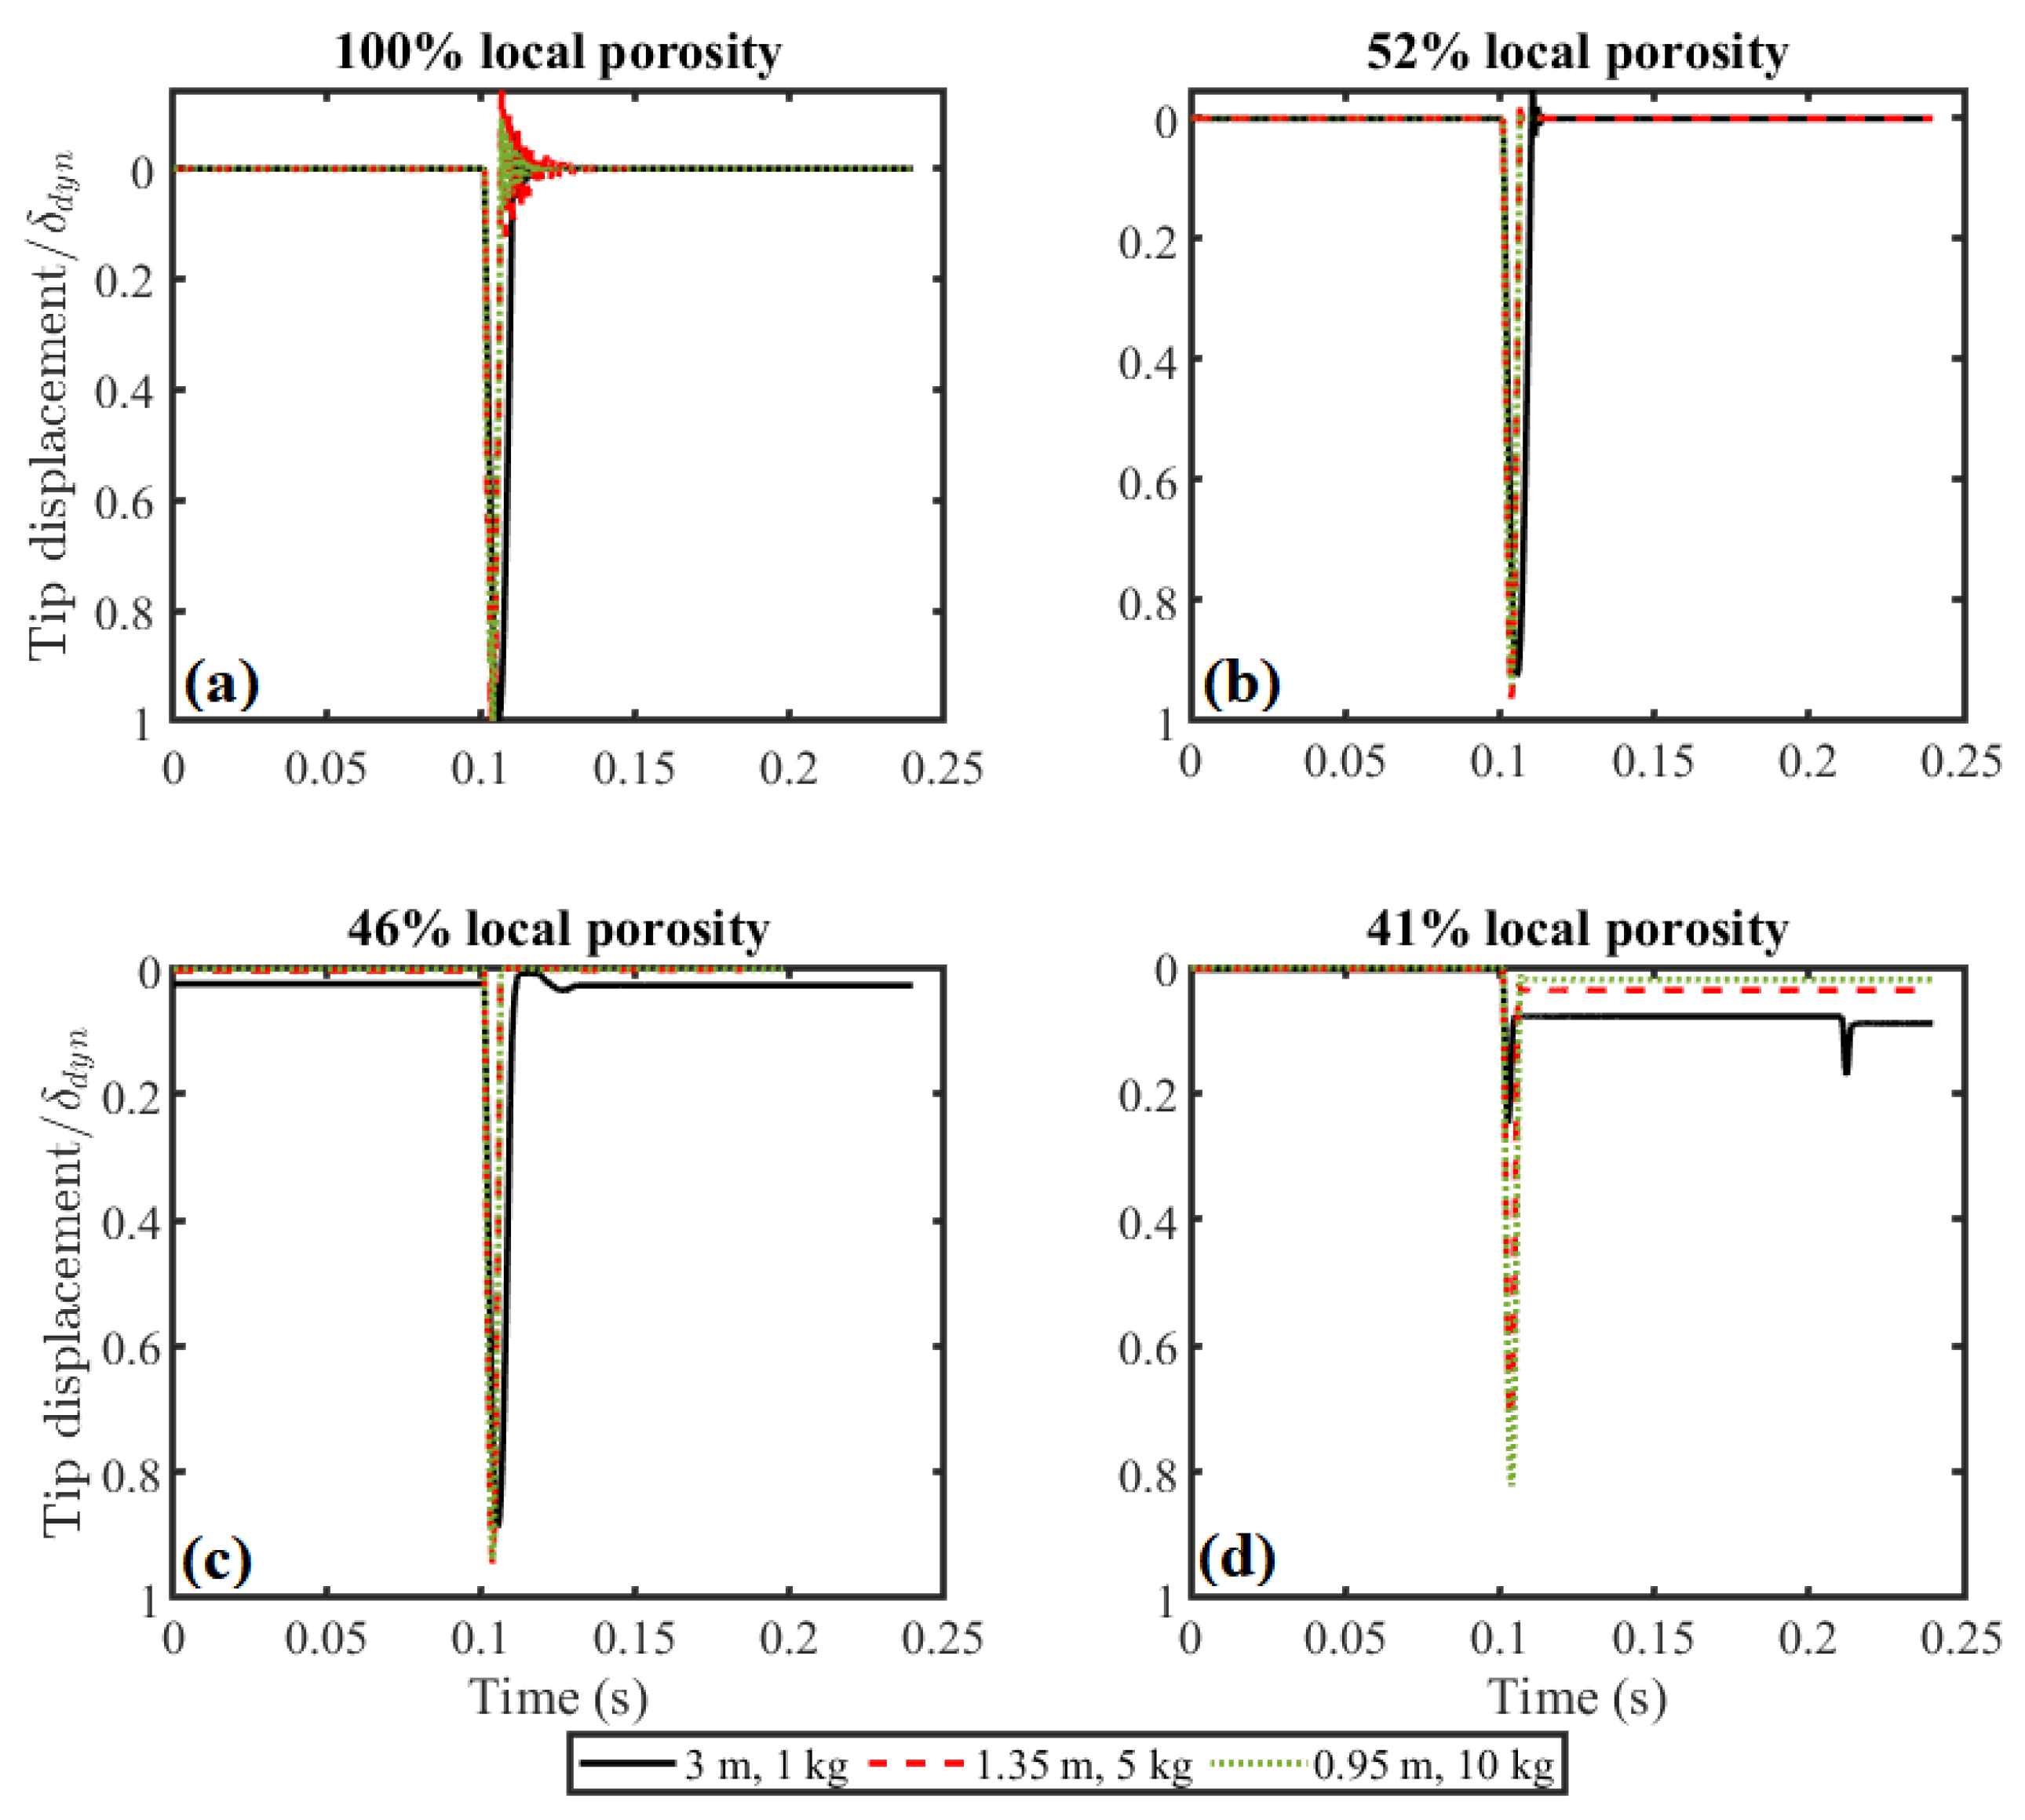
A dimensional analysis was carried out to investigate the tip displacement of the cantilever beam equipped with the damper at the tip under various falling masses of 1 kg, 5 kg, and 10 kg, with beam lengths of 3 m,
m, and
m, respectively.
Figure 6 shows these plots where the tip displacement for different cases is normalized by the dynamic tip displacement when the damper is not attached to the tip. This plot indicates that, in general, the presence of the damper reduces the tip displacement, and this reduction is more evident when the system is over-damped.
Figure 7 shows a close view of the beam’s response during the first impact.
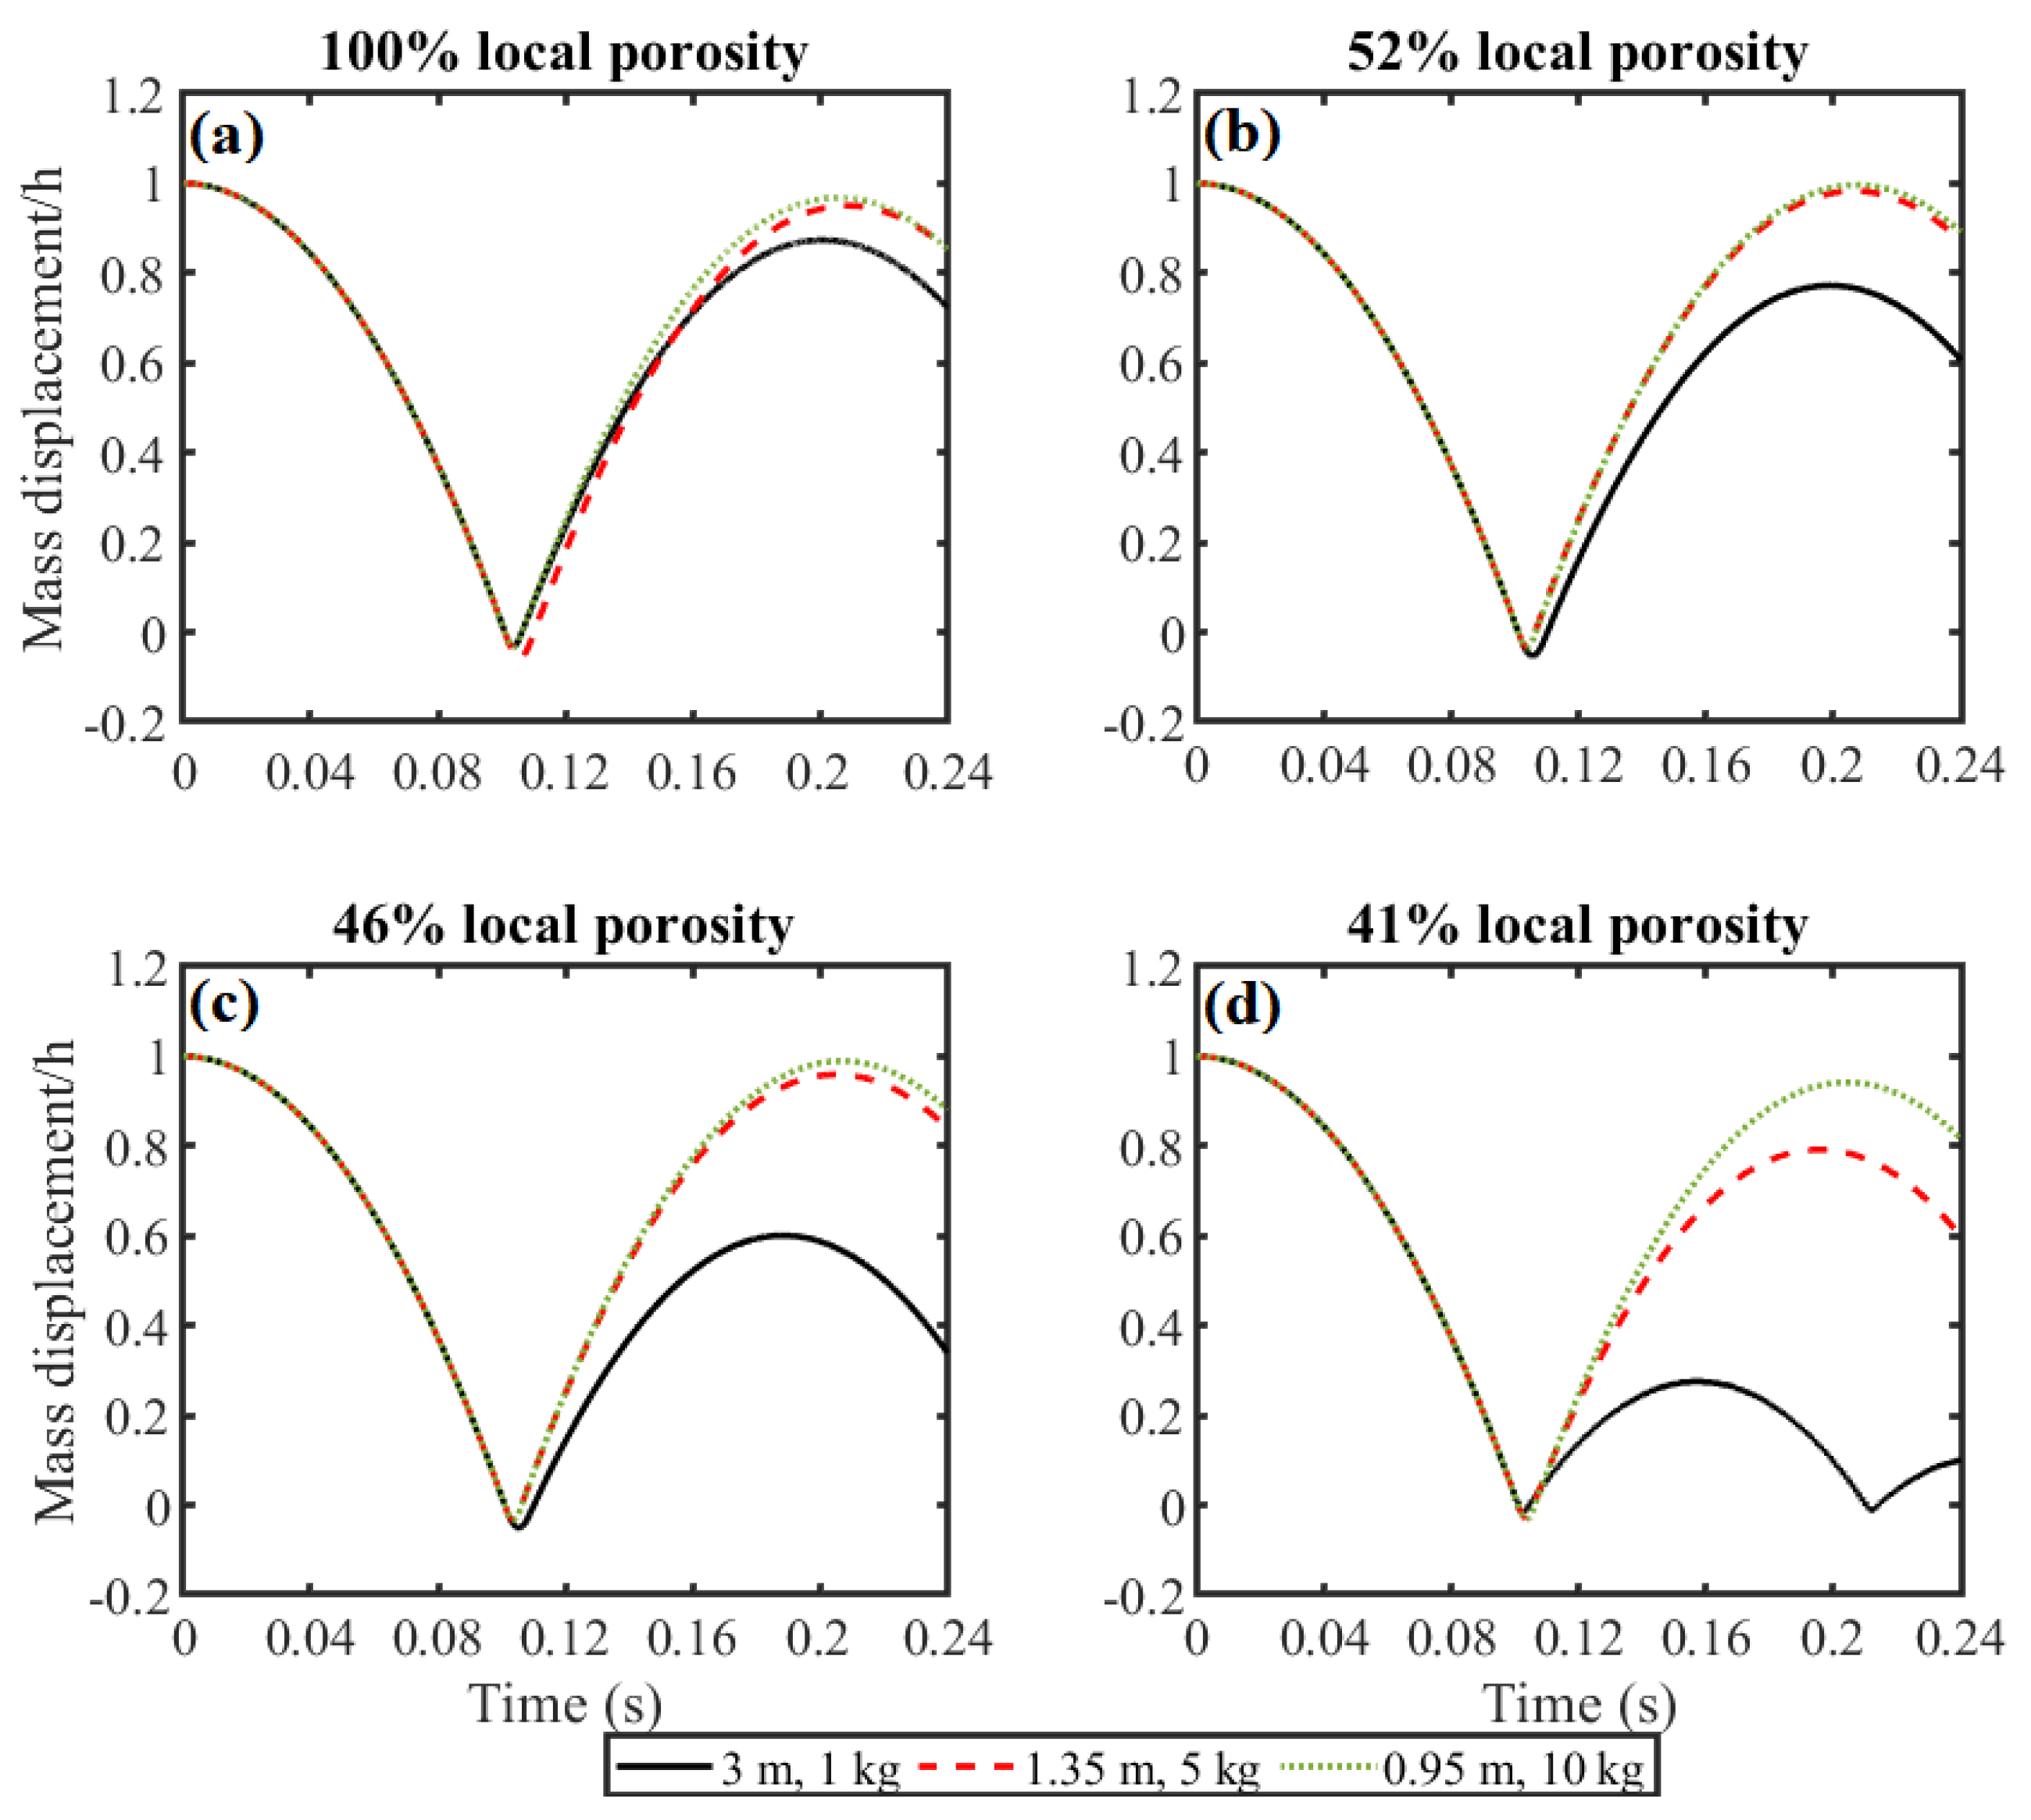
Figure 8 displays the displacement of the 1 kg mass normalized by the initial falling height (h) for various local porosities of the particle damper. It is observed that during the first impact, the particle damper’s presence decreases the downward displacement of the mass. Both the magnitude of this displacement and the number of sub-impacts are influenced by the particle damper’s local porosity. Lower local porosities lead to smaller downward displacements and also shorten the intervals between sub-impacts. As the local porosity of the particle damper decreases, the rebound height of the mass also decreases.
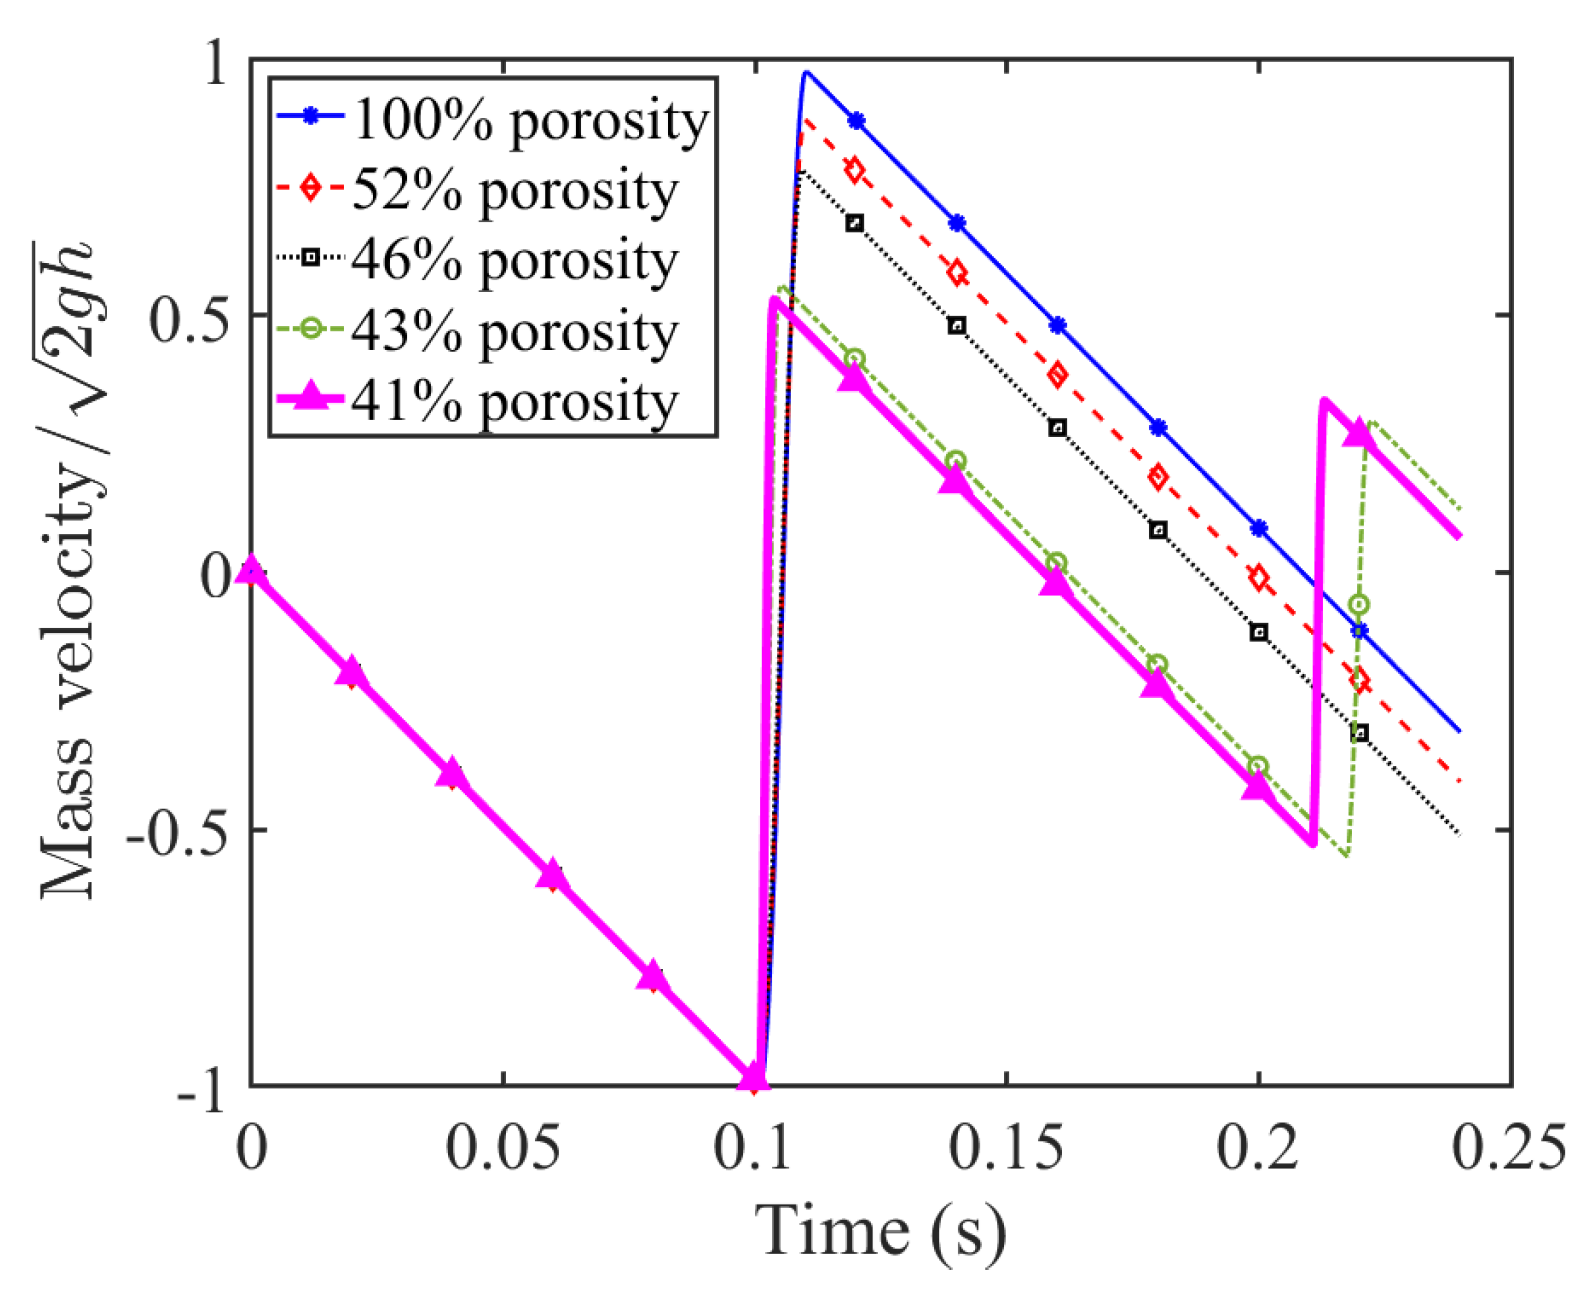
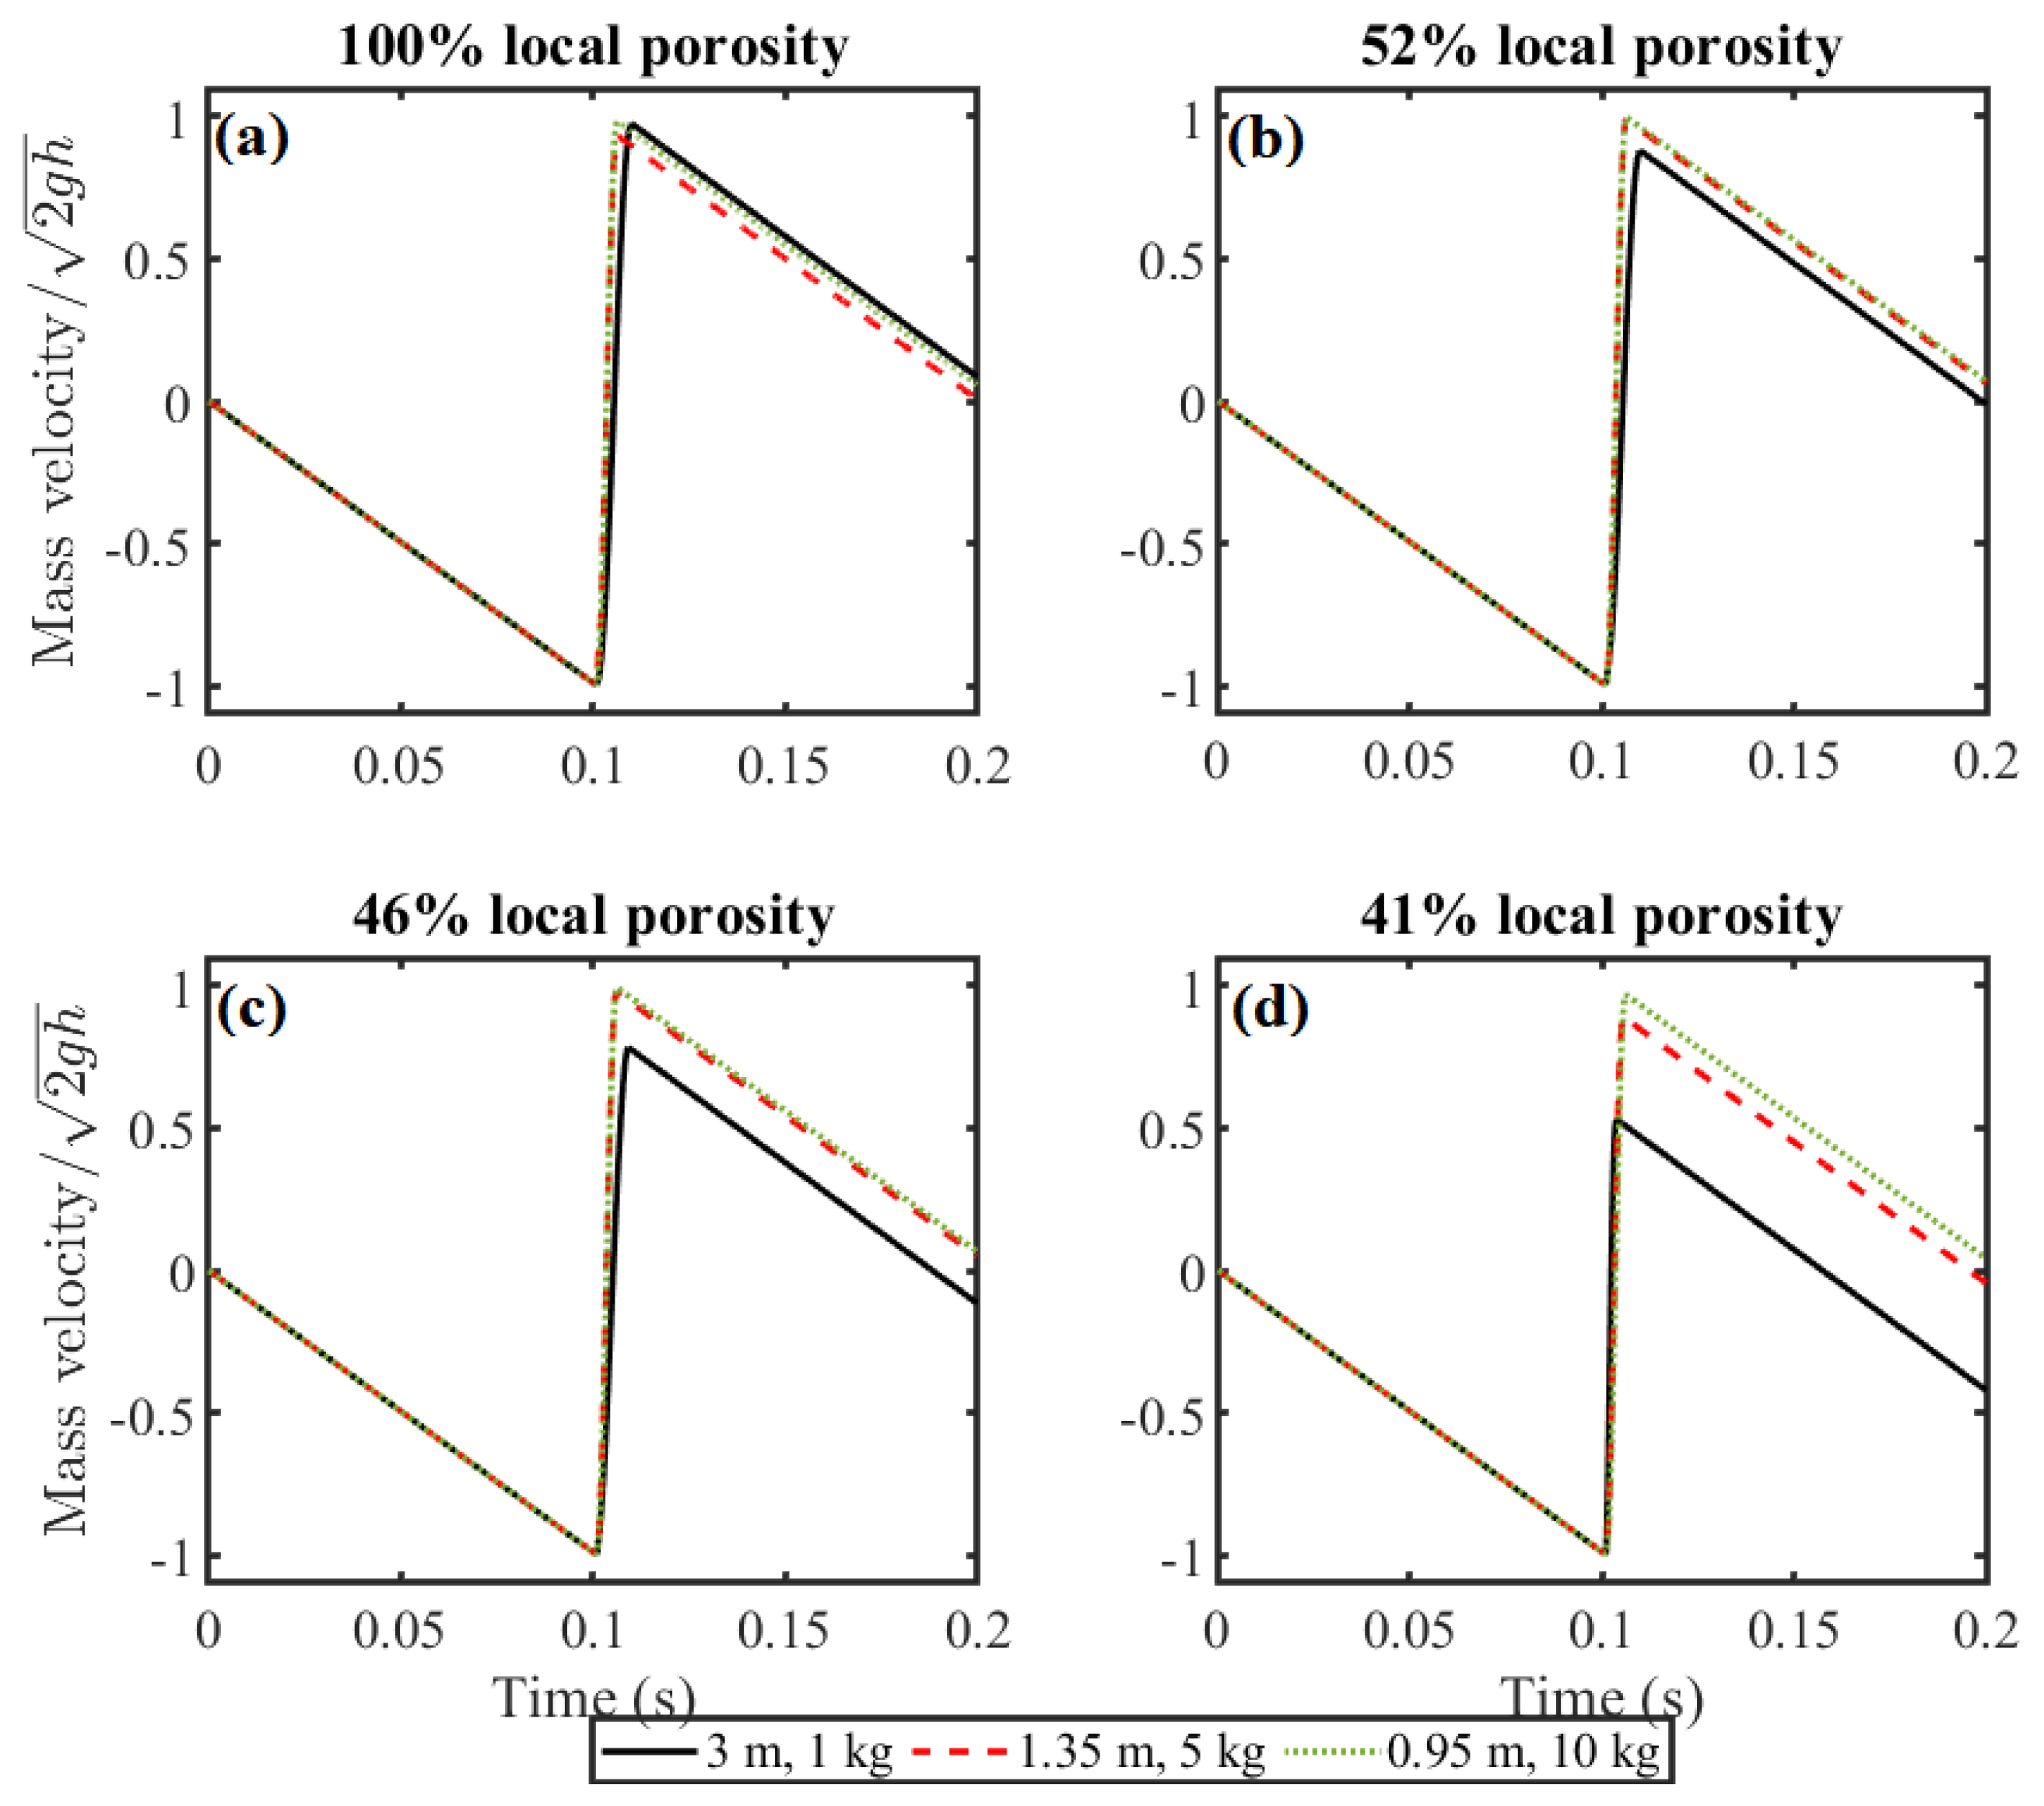
Figure 9 displays the normalized velocity of the falling mass before and after impact for different particle damper local porosities. This figure demonstrates that the rebound velocity decreases as the local porosity is reduced. This phenomenon can be attributed to the amount of energy absorbed by the damper with denser packing. Equation (
17) was utilized to create the dimensionless y-axis in this figure where
v is the mass’s velocity.
The COR for local porosities of , , , , and was calculated as , , , , and , respectively. This demonstrates a reduction in the COR with the increase in the packing density of the particles in the damper. Having a COR value close to one shows the impact is almost elastic. Additionally, it is observed that the maximum rebound velocity is achieved sooner when the system is over-damped.
Dimensional analyses were carried out to investigate the rebound height and velocity of the falling mass for different mass weights and beam lengths.
Figure 10 illustrates the mass’s rebound height under various conditions, indicating that the rebound height is greater when the beam is shorter. This is attributed to the shorter beam having less flexibility. As observed from
Figure 11, the rebound velocity of the mass is higher when its weight is greater, and the beam’s length is shorter. Since the material of the beam and its section remain constant, a shorter beam exhibits a more rigid structure compared to a longer beam.
Figure 12a illustrates the normalized impact force over time for different cases. Due to the brief duration of the impact,
Figure 12b is presented to better represent the changes in impact force during the first impact. When the local porosity is reduced from
to
, an increase in impact force is observed. The dependence of impact force on porosity becomes more evident beyond this point, resulting in a higher increase in impact force, as the local porosity is reduced by
to a local porosity of
. It is also observed that the impact force becomes relatively smaller during sub-impacts.
Figure 13 shows that for the cases of a damper attached to the beam, the normalized impact force generally increases gradually as the local porosity of the damper is reduced, regardless of the falling mass’s weight or the beam’s length. Comparing
Figure 13a with
Figure 13b shows that the normalized impact force slightly decreases when a damper with
local porosity is attached to the beam. Specifically, for the under-damped systems, the lowest value of the normalized impact force is recorded for the case of a 3 m beam and a smaller weight of 1 kg, among all the different local porosities monitored. A similar trend was also observed for the sub-impacts.
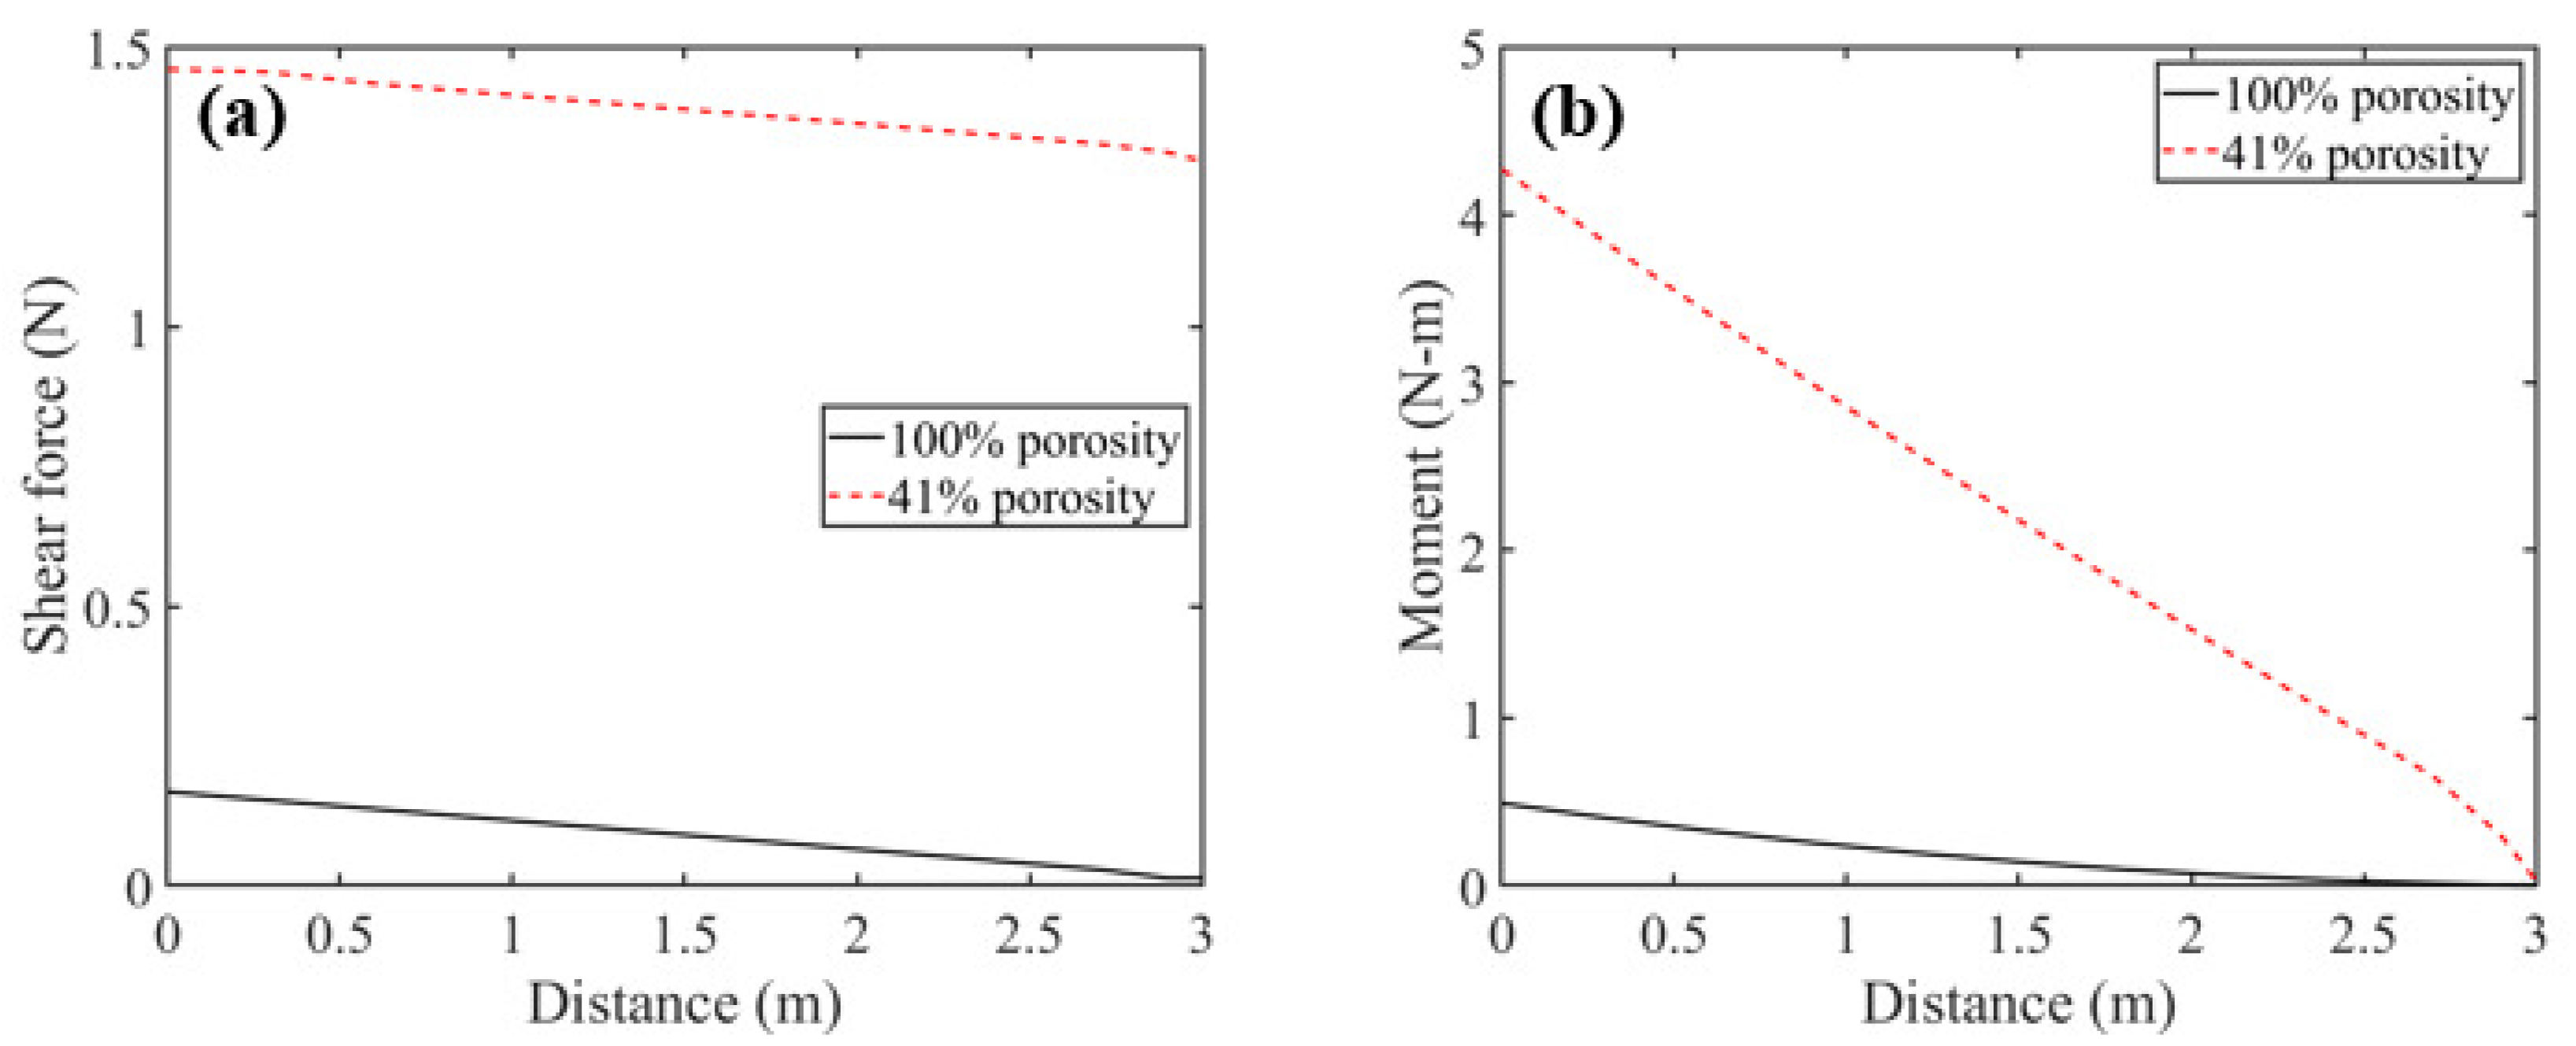
Figure 14a,b display the shear and moment diagrams for the beam, both with a particle damper featuring
local porosity at the tip and without, prior to impact, respectively. It was previously noted that the beam itself is of low mass, with the primary static load coming from the particle damper’s mass at the tip.
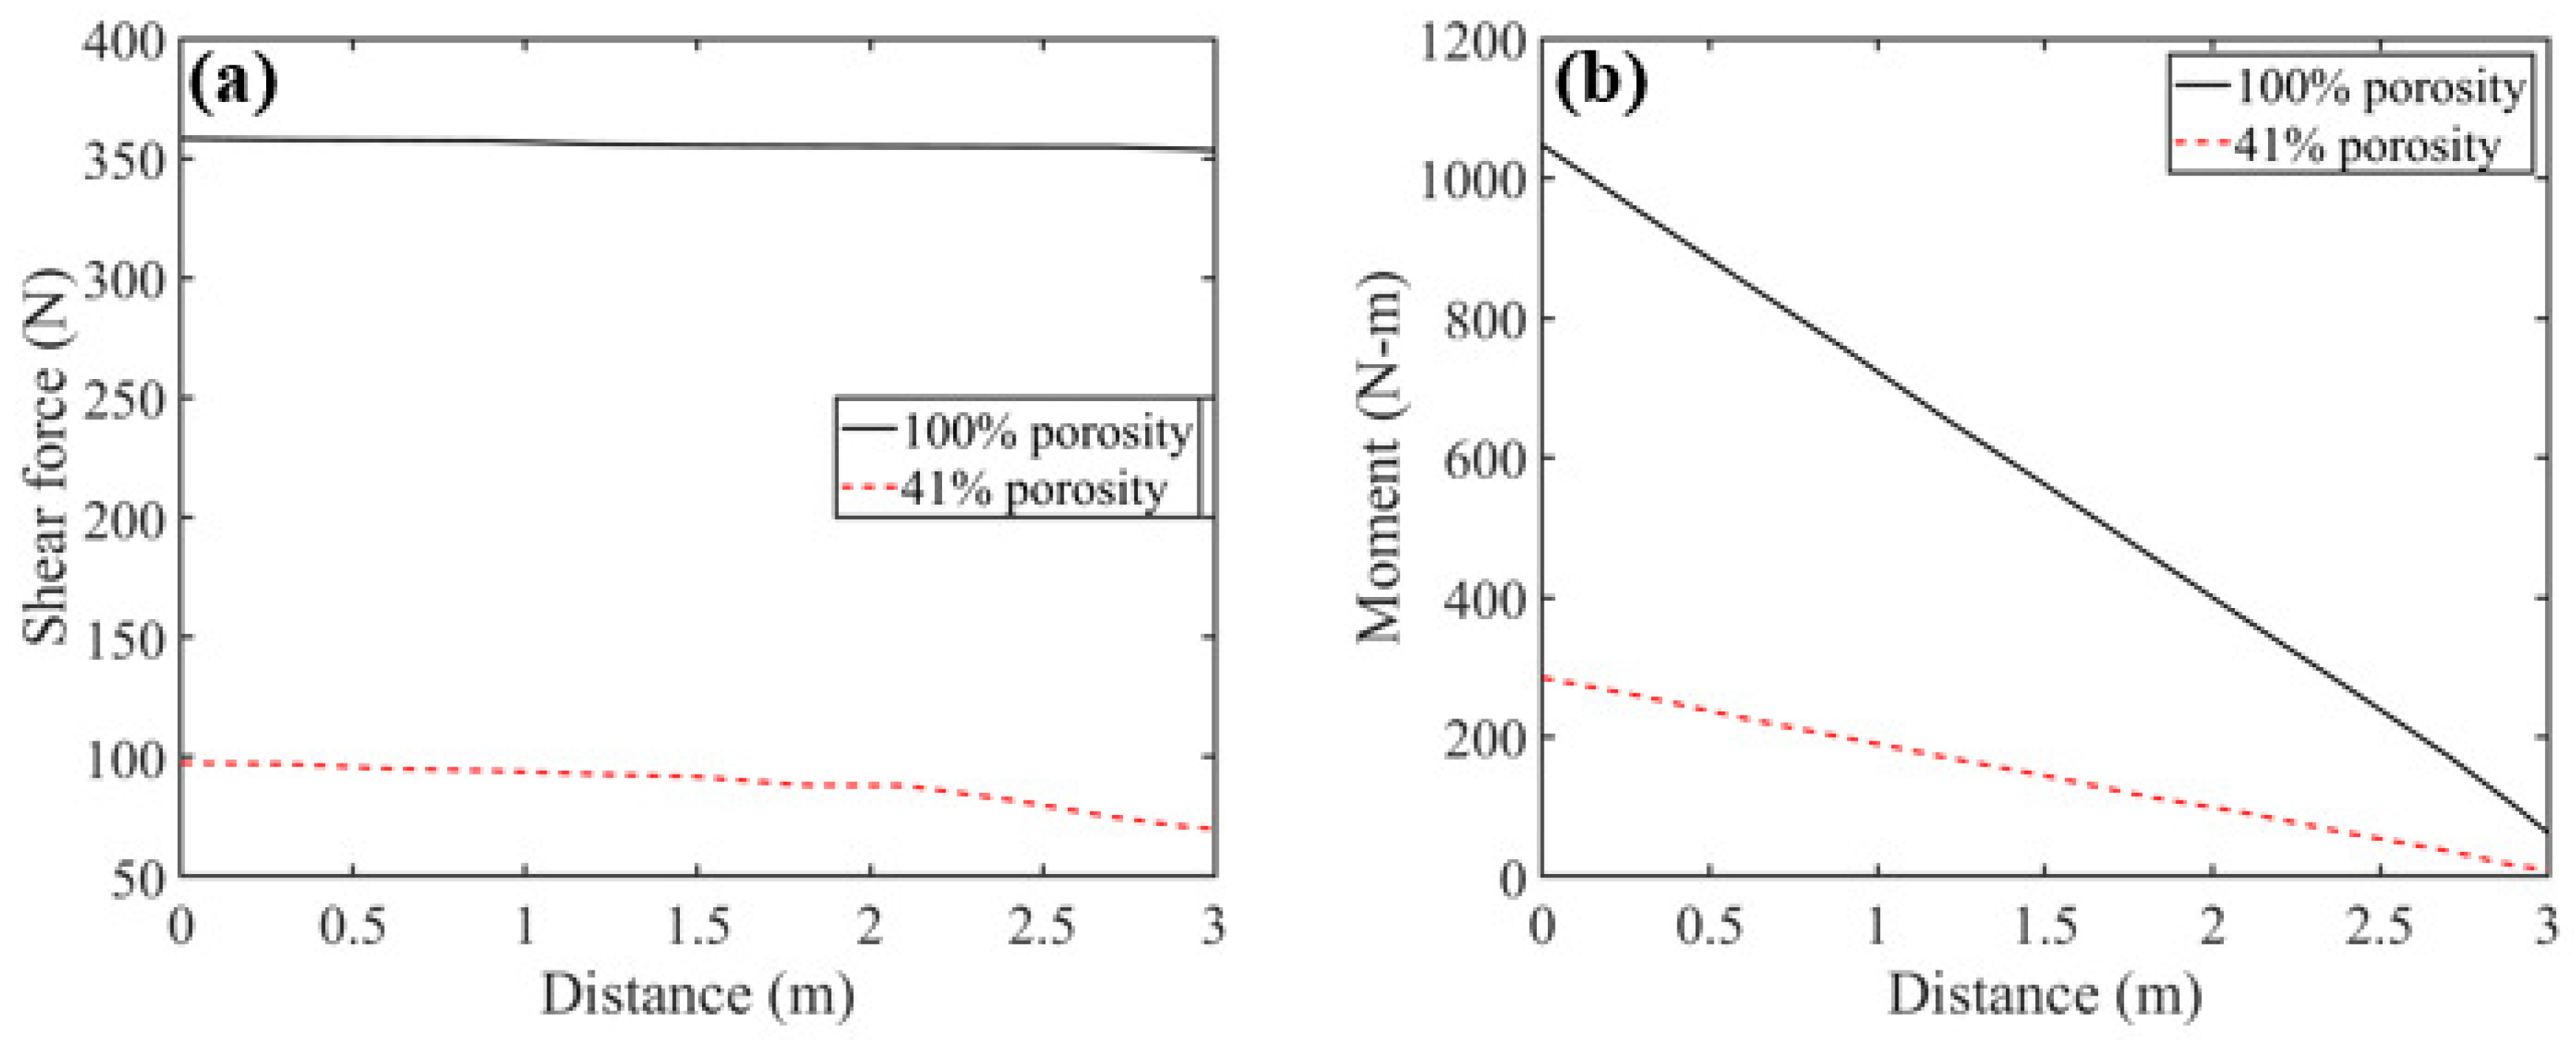
Figure 15a,b present the shear and moment diagrams for the same assembly at the moment of the first impact, respectively. As observed, the shear force along the length of the beam is relatively constant. The presence of the damper resulted in about
reduction in shear forces (
Figure 15a) and maximum bending moment in the beam (
Figure 15b). The moment diagram presented in
Figure 15b shows a decrease in the moment for both cases as the free end is approached. These figures demonstrate that the presence of the particle damper can significantly reduce both the shear force and the moment exerted on the beam during impact.
One of the unique features of the PSD is its ability to pressurize the sand within. To investigate this feature, the case with
local porosity was examined under two different initial pressures.
Figure 16a shows the normalized tip displacement of the beam when the damper is set to two different initial pressures. It is observed that increasing the initial pressure reduces the beam’s downward displacement and diminishes the number of sub-impacts on the beam. This plot highlights the importance of applying initial pressure to the particle damper.
Figure 16b shows a close view of the normalized tip displacement changes during the first impact. Increasing the initial pressure also increases the impact force during the first impact and increases the time interval between sub-impacts (
Figure 17a,b). It should be noted that porosity was monitored throughout all simulations to ensure it remained constant as the simulations progressed.
In DEM the movement of an individual, rigid particle is governed by the resultant force and moment vectors exerted on it. This motion can be explained by considering the translational movement of a point in a particle, as well as its rotational motion. The total kinetic energy, considering both translational and rotational motion, was calculated using the following equation:
where
and
are the translational and rotational velocity vectors of the particle, and
is the particle’s moment of inertia.
also represents the number of particles [
29].
Figure 18a illustrates the kinetic energy absorbed in the damper normalized by the initial potential energy in the falling mass (P) for different damper local porosities. It is observed that the dissipated kinetic energy increases as the damper’s local porosity decreases, reaching its highest value at
local porosity during the first impact (
Figure 18b). This indicates that energy dissipation inside the damper increases with decreasing local porosity. However, this trend changes during subsequent impacts, where the kinetic energy at
local porosity is slightly higher than that at
local porosity. The sharp reduction in kinetic energy at the beginning of the graphs can be attributed to the movement of the rod within the damper. As the rod reaches a velocity of zero, the kinetic energy experiences a sharp decrease. Conversely, when the rod starts to gain velocity and moves within the domain, the kinetic energy increases again. This behavior is due to the movement of the rod in the damper causing sand particles around the middle sphere and rod to move and collide, resulting in increased kinetic energy. The more energy absorbed by the damper, the less energy remains in the mass for it to bounce back (
Figure 8). It should also be noted that the primary source of dissipated energy in the PSD is frictional sliding between sand particles, which is mainly concentrated in the vicinity of the middle sphere [
21].
Comparing the normalized dissipated kinetic energies in the damper while having a local porosity of
, as shown in
Figure 19, for the cases of 0 MPa and 1 MPa initial pressure reveals that the kinetic energy during the first impact is relatively similar in both scenarios. Notably, the secondary spike during the first impact occurs sooner when the initial pressure is increased. This indicates that the rod’s vibration due to impact is dampened more quickly when the initial pressure is higher.
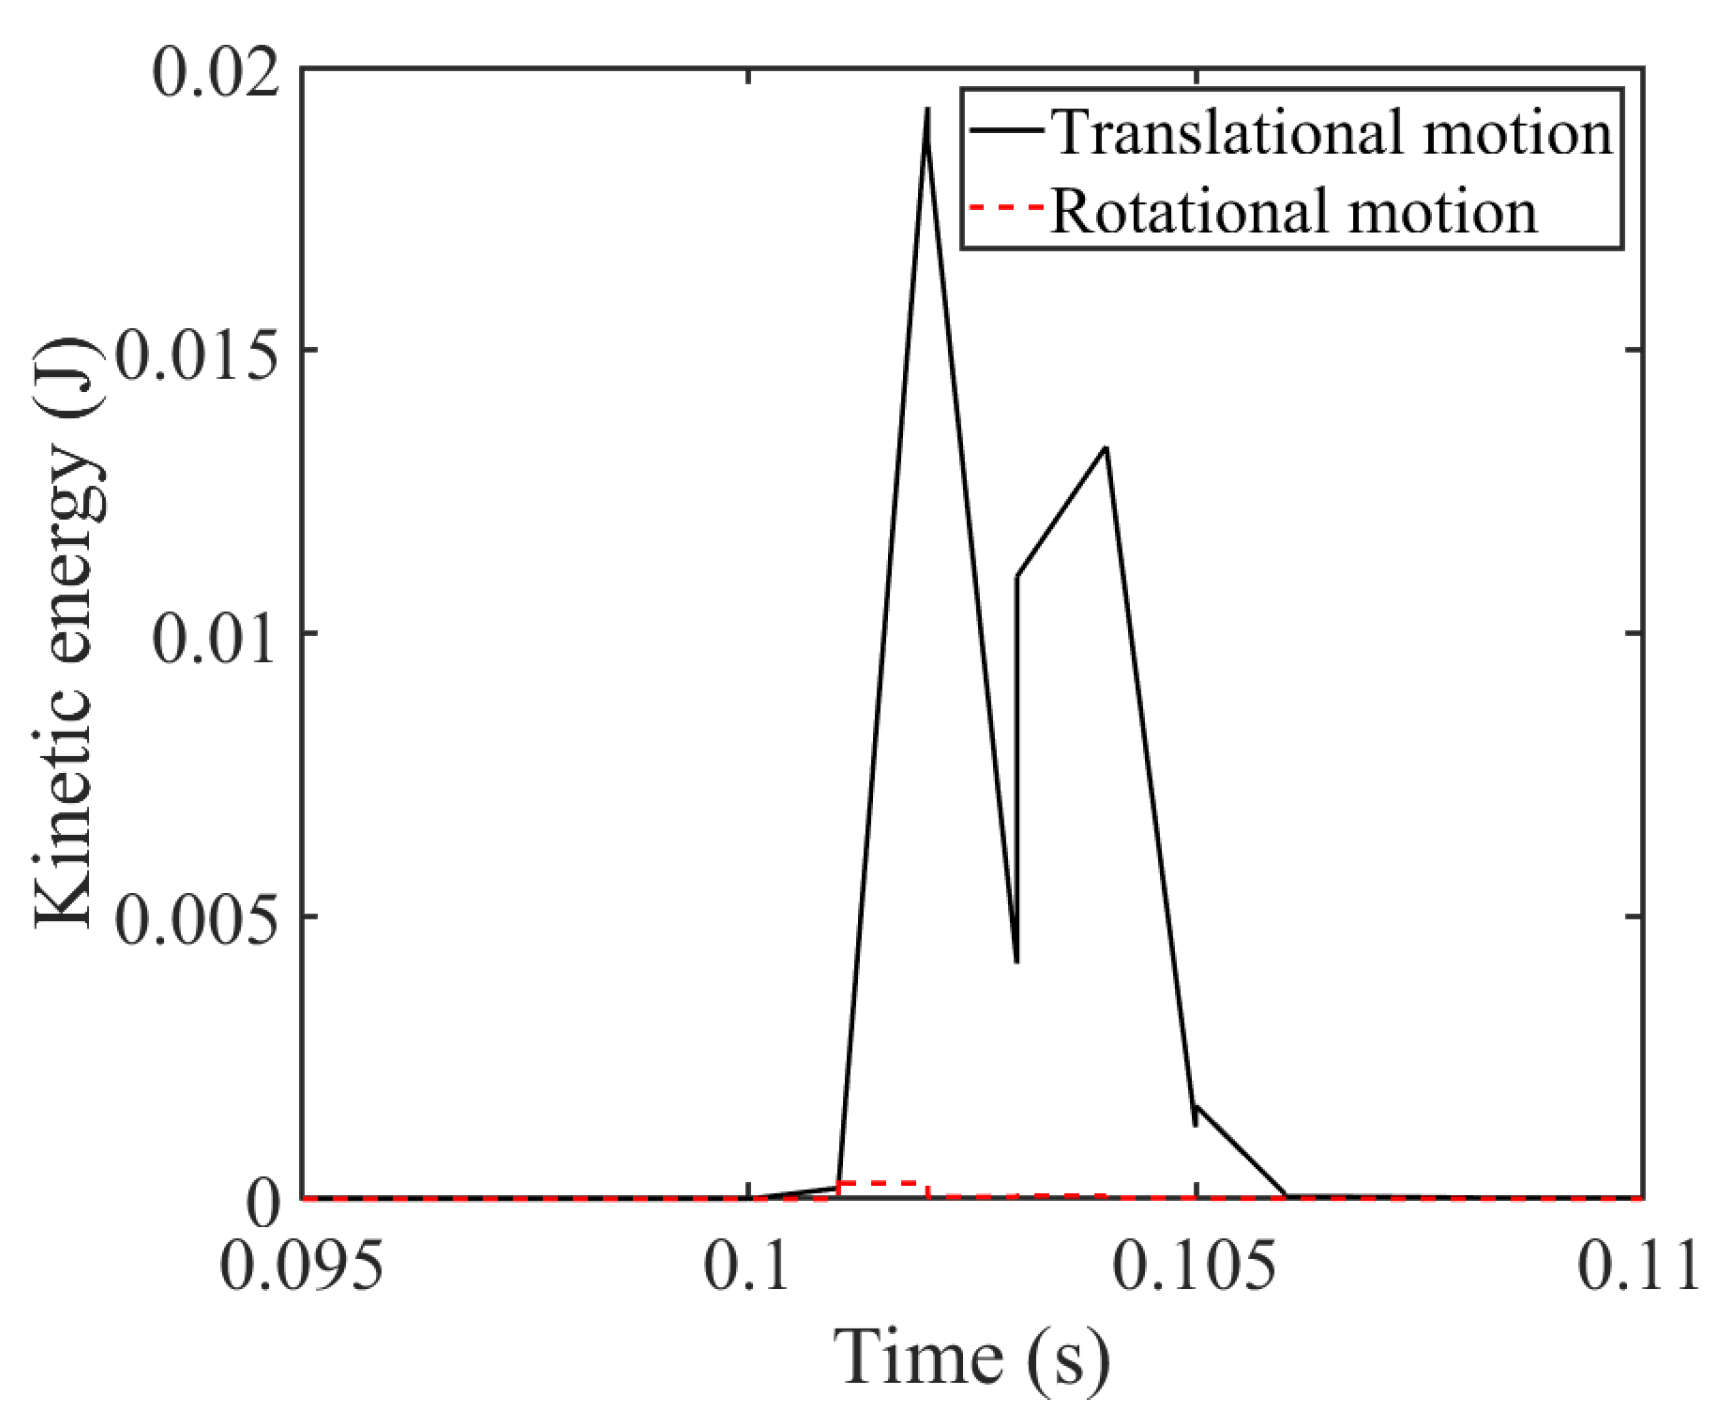
In all the cases studied, the kinetic energy due to translational motion was significantly higher than the energy resulting from the rotational motion of the particles inside the particle damper.
Figure 20 illustrates both the translational and rotational components of kinetic energy for the case with
local porosity and without initial pressure during the first impact. As observed, the majority of the energy dissipation arises from the translational movement of the particles near the rod and the middle sphere. In other words, the translational velocity of the particles is higher than the rotational velocity.
The results thus far indicate that attaching a particle damper to the tip of a cantilever beam can reduce its displacement when impacted at the tip. However, this effect might vary if the impact force is applied at the beam’s center. To explore this,
Figure 21 and
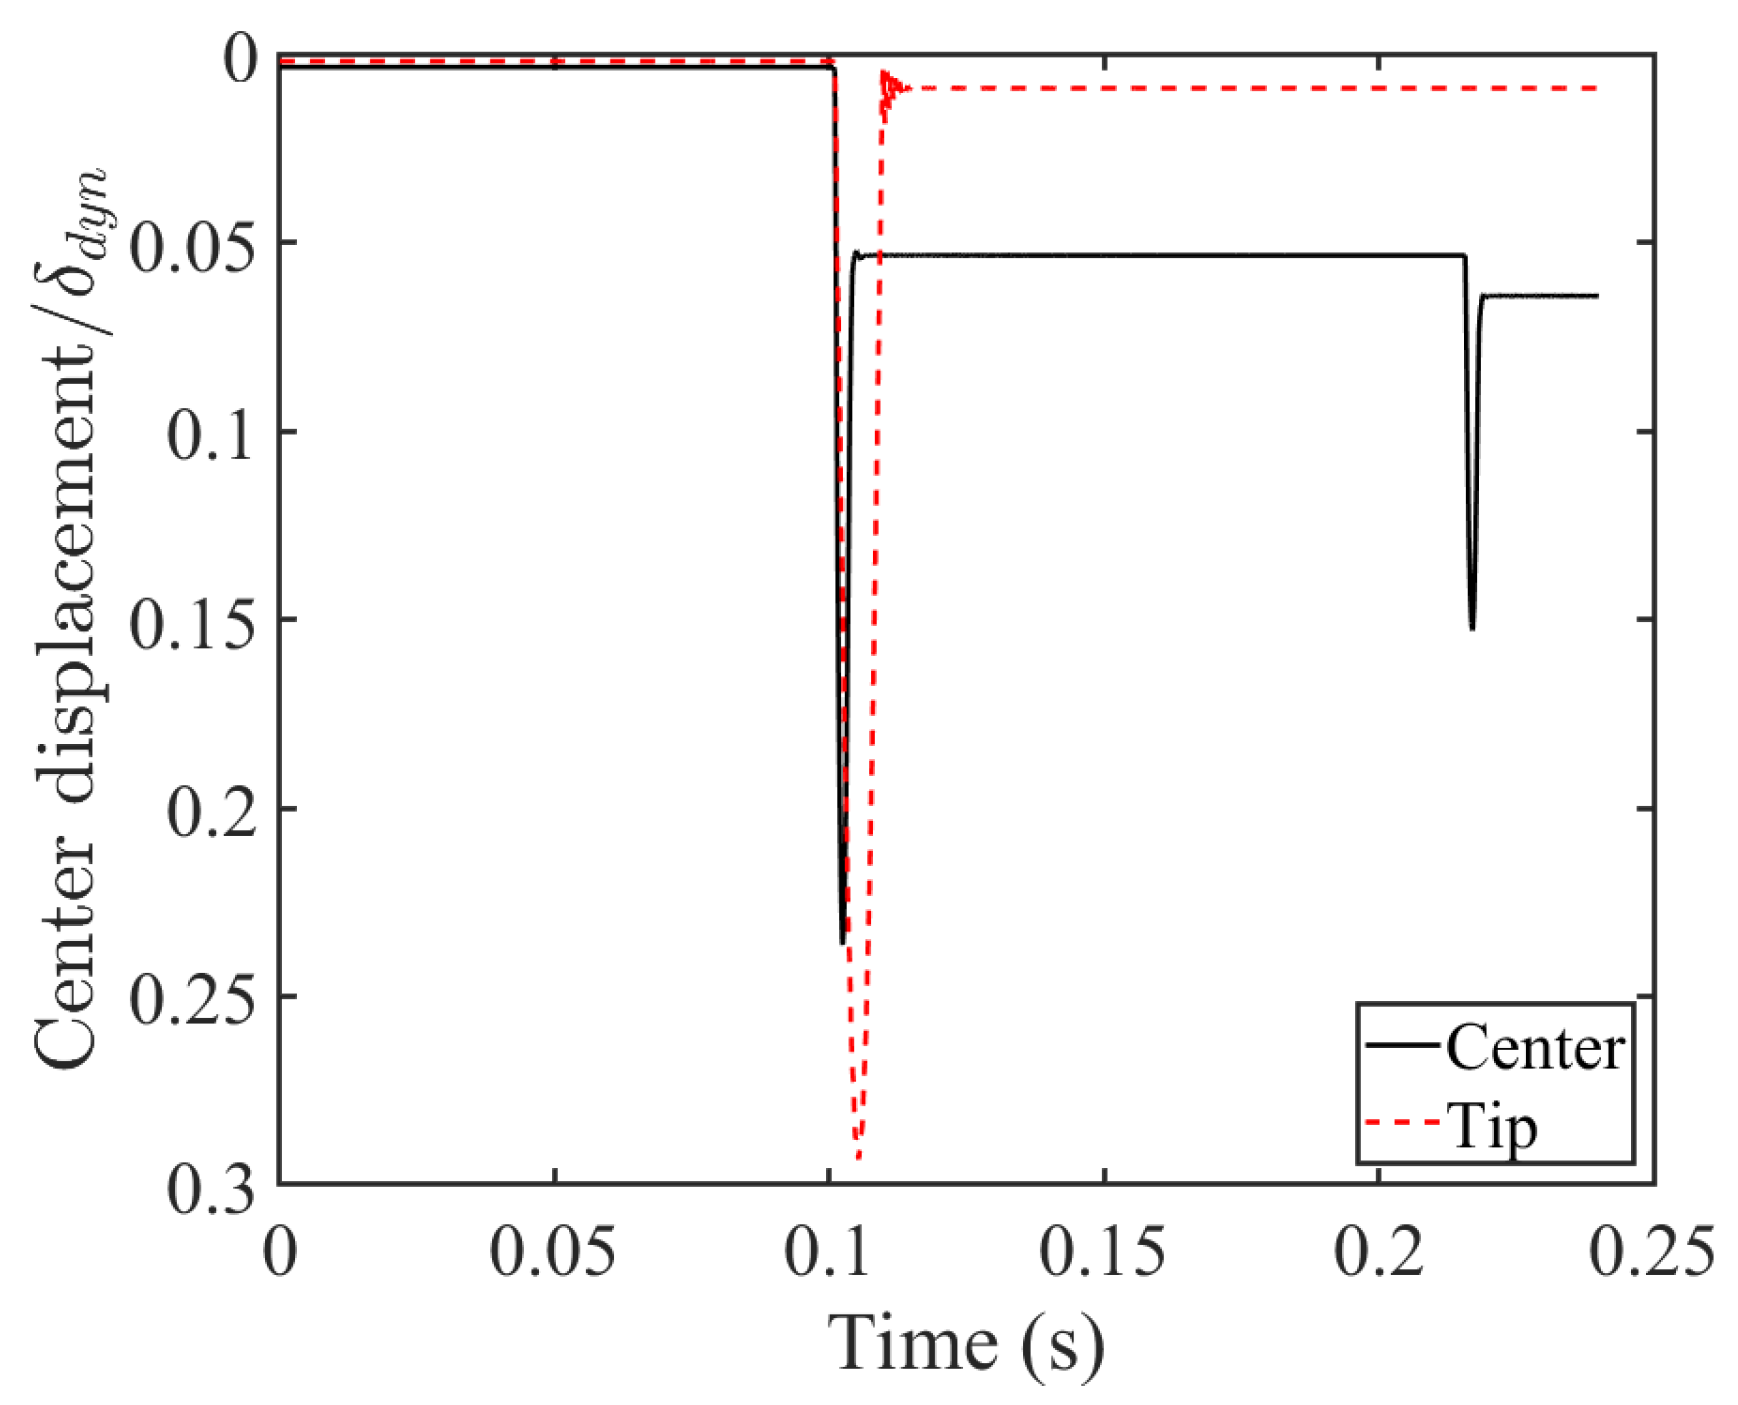
Figure 22 compare the effectiveness of different particle damper locations along the beam’s length, specifically when the impact load is at the center. In these figures, the tip and center displacements are normalized by the dynamic tip displacement.
Figure 21 depicts the beam’s normalized displacement at its center when the impact force is also at the center. It is observed that placing the particle damper directly beneath the impact location reduces the beam’s displacement at that point, compared to when the damper is at the tip. However, as also seen in
Figure 5a, the damper’s presence underneath the impact point increases the number of sub-impacts at that location.
Figure 22 shows the beam’s normalized tip displacement when the impact force remains in the center, but the damper’s location varies from the center to the tip. Here, positioning the particle damper at the tip noticeably reduces the tip displacement and results in fewer sub-impacts on the beam. This suggests that to minimize the beam’s displacement at a specific location, the particle damper should be placed at that location, rather than beneath the impact’s location.
The influence of damper size was investigated in
Figure 23, where a damper one-third the size of the original without initial pressure was created and subjected to the same impact load. The measurement spheres and their positions were also changed to match the new damper’s size. This figure demonstrates that reducing the damper’s size does not significantly alter the tip displacement of the beam, indicating that a smaller, more economical damper could replace the original-sized damper without notably affecting performance. Previous results have shown that local porosity plays a significant role in the beam’s response. Therefore, care was taken to maintain the same local porosity of
in both the smaller and the original-sized dampers. It should be mentioned that due to the extensive time required for the simulation, only the first impact was considered.
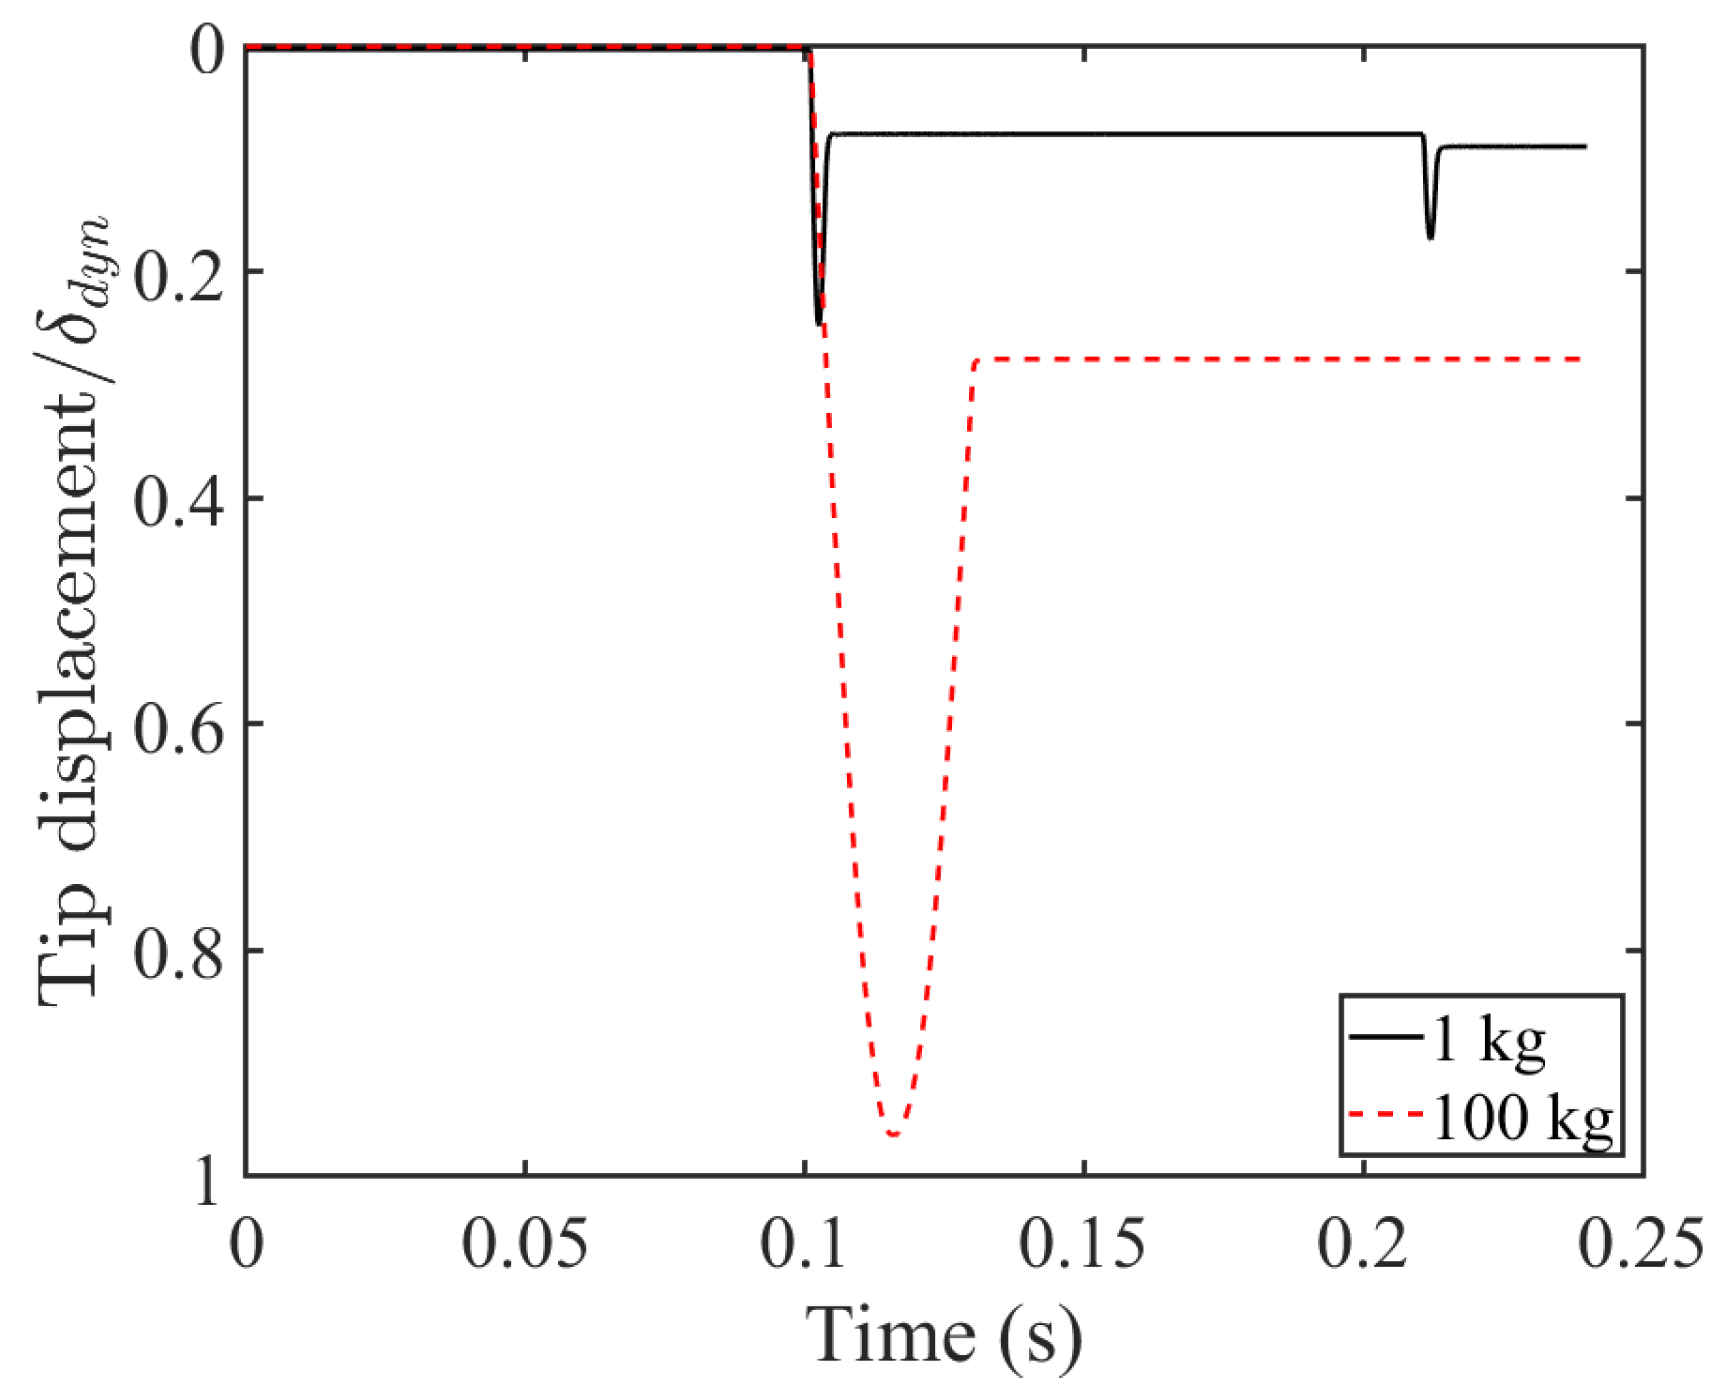
In order to better understand the beam’s response under a heavier load, the initial mass was replaced with a mass of 100 kg.
Figure 24 illustrates the tip displacement of the beam under different impact masses. In this figure, tip displacement is divided by the dynamic displacement when the same mass hits the beam without a damper attached to it. As observed, the tip displacement increases significantly, and the permanent displacement remaining in the beam is higher when a heavier mass is used. The duration of impact is also longer compared to the case of having a lighter mass. It should be mentioned that the maximum displacement for the case of a 100 kg mass used was less than the stroke permissible by the damper; the middle sphere did not reach the end of the damper.
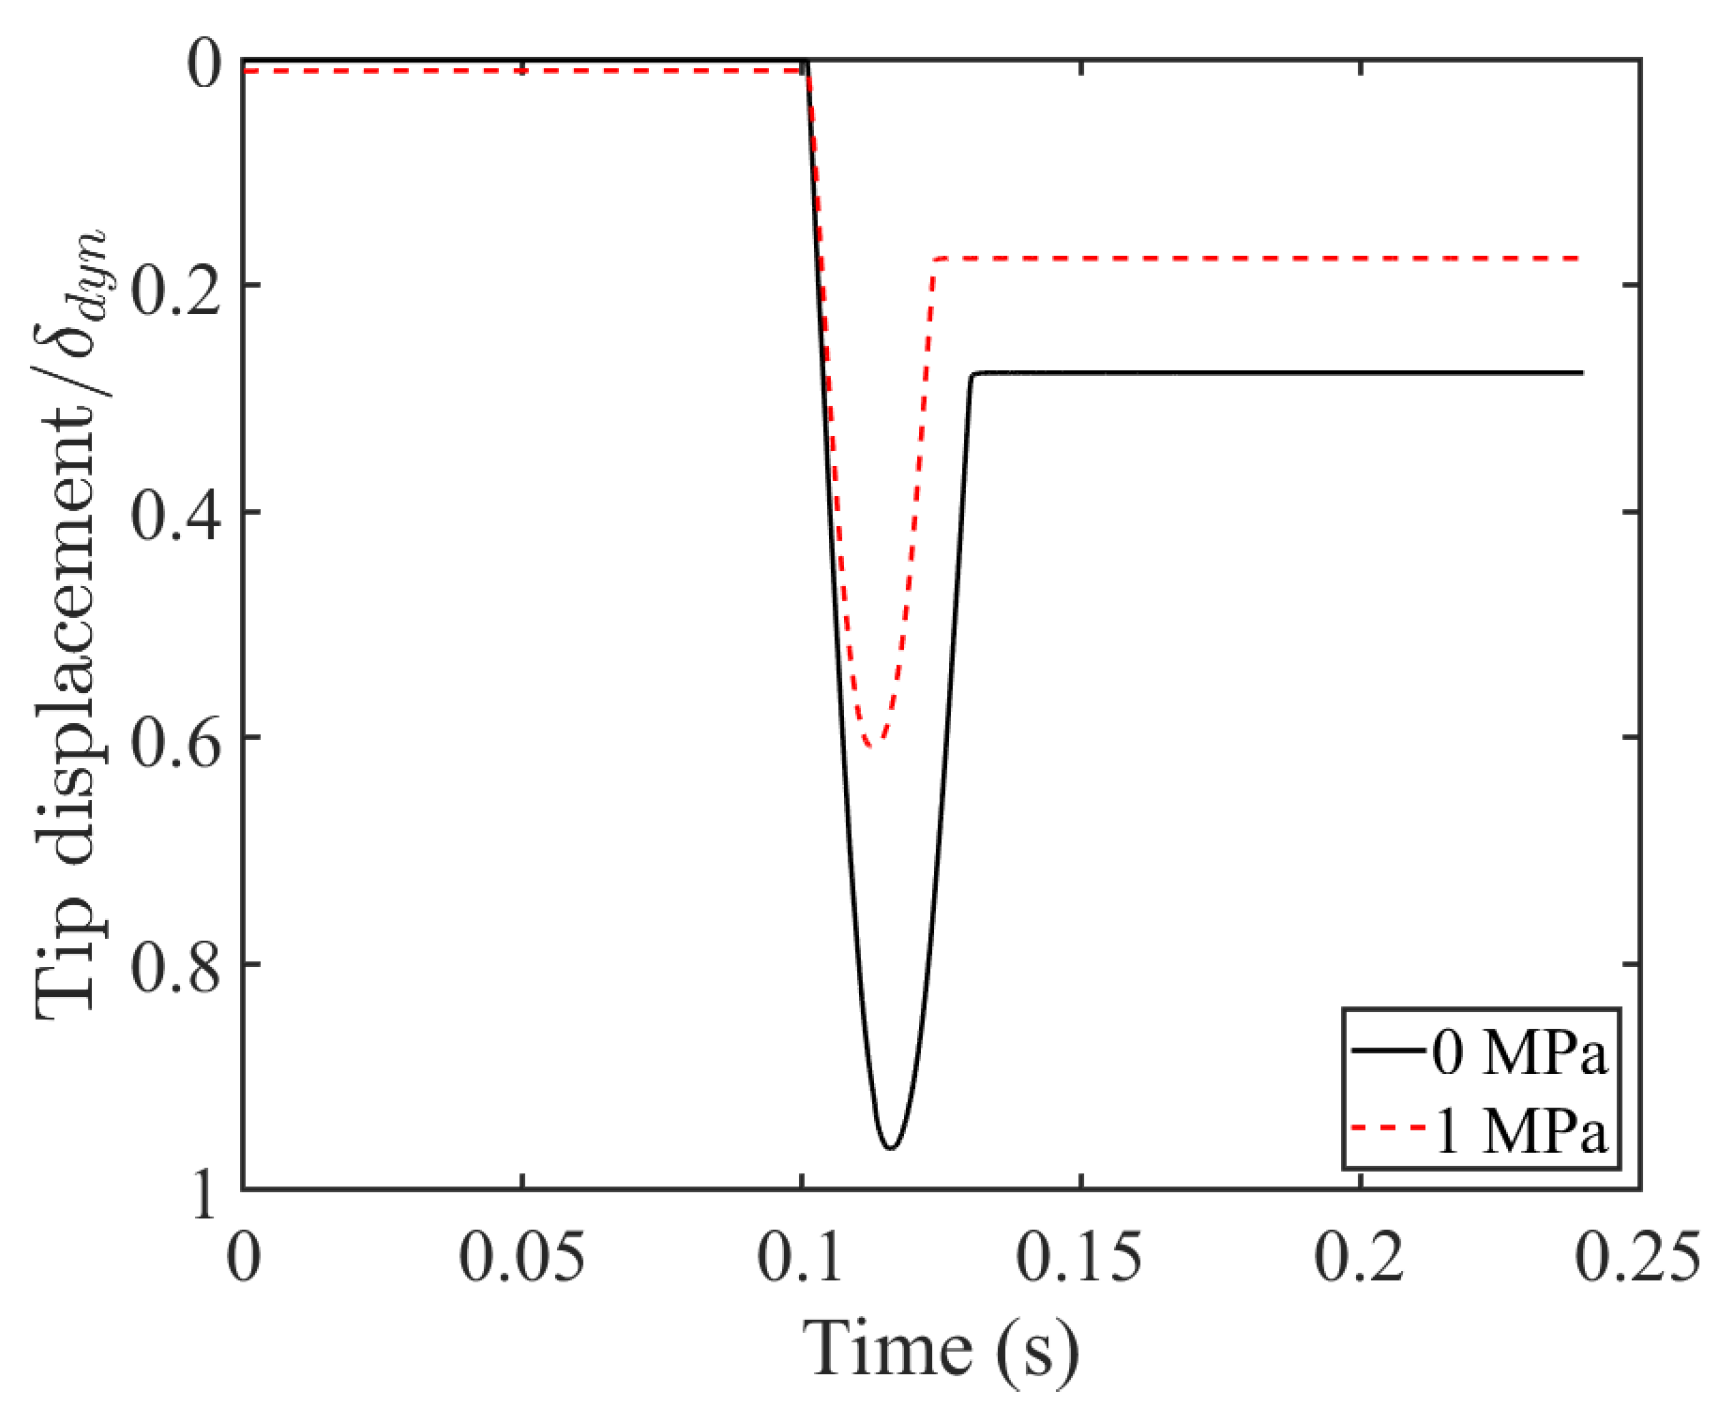
The influence of initial pressure on the tip displacement of the beam when subjected to a heavy mass of 100 kg is presented in
Figure 25. As observed in this case, similar to the case of having a 1 kg mass, the tip displacement is reduced, and the permanent displacement after impact is smaller. In this figure, the tip displacement was normalized by the dynamic tip displacement for when a 100 kg mass hits the tip of the beam.


