Article

Experiment and Numerical Study on the Flexural Behavior of a 30 m Pre-Tensioned Concrete T-Beam with Polygonal Tendons

1
School of Infrastructure Engineering, Dalian University of Technology, Dalian 116024, China
2
Shanghai Municipal Engineering Design Institute (Group) Co., Ltd., Shanghai 200092, China
3
Jiangxi Gan Yue Expressway Co., Ltd., Nanchang 330025, China
4
Jiangxi Communications Investment Group Co., Ltd., Nanchang 330108, China
5
Jiangxi Communications Design and Research Institute Co., Ltd., Nanchang 330029, China
*
Author to whom correspondence should be addressed.
Buildings 2025, 15(15), 2595; https://doi.org/10.3390/buildings15152595
Submission received: 10 June 2025 / Revised: 15 July 2025 / Accepted: 19 July 2025 / Published: 22 July 2025
(This article belongs to the Special Issue Structural Vibration Analysis and Control in Civil Engineering)

Abstract

As a novel prefabricated structural element, the pre-tensioned, prestressed concrete T-beam with polygonal tendons layout demonstrates advantages including reduced prestress loss, streamlined construction procedures, and stable manufacturing quality, showing promising applications in medium-span bridge engineering. This paper conducted a full-scale experiment and numerical simulation research on a 30 m pre-tensioned, prestressed concrete T-beam with polygonal tendons practically used in engineering. The full-scale experiment applied symmetrical four-point bending to create a pure bending region and used embedded strain gauges, surface sensors, and optical 3D motion capture systems to monitor the beam’s internal strain, surface strain distribution, and three-dimensional displacement patterns during loading. The experiment observed that the test beam underwent elastic, crack development, and failure phases. The design’s service-load bending moment induced a deflection of 18.67 mm (below the 47.13 mm limit). Visible cracking initiated under a bending moment of 7916.85 kN·m, which exceeded the theoretical cracking moment of 5928.81 kN·m calculated from the design parameters. Upon yielding of the bottom steel reinforcement, the maximum of the crack width reached 1.00 mm, the deflection in mid-span measured 148.61 mm, and the residual deflection after unloading was 10.68 mm. These results confirmed that the beam satisfied design code requirements for serviceability stiffness and crack control, exhibiting favorable elastic recovery characteristics. Numerical simulations using ABAQUS further verified the structural performance of the T-beam. The finite element model accurately captured the beam’s mechanical response and verified its satisfactory ductility, highlighting the applicability of this beam type in bridge engineering.

1. Introduction

Prefabricated bridge elements and systems (PBES) accelerate construction, enhance quality and safety, reduce costs, and minimize traffic disruption through off-site manufacturing and rapid on-site assembly [1]. The pre-tensioned, prestressed concrete beam is one type of prefabricated bridge element that, as a principal load-bearing component, has demonstrated extensive applicability in medium-span bridges [1,2,3,4]. The pre-tensioning methodology implemented during beam prefabrication effectively enhances structural capacity and crack resistance, meanwhile offering advantages in construction efficiency, process simplification, and quality control [5,6,7]. Initial prestress, applied through the tensioning and anchoring of steel strands or wire bundles in concrete members, introduces pre-compressive stresses to counteract service-stage tensile stresses, thereby enhancing crack resistance and stiffness. In pre-tensioning systems, prestress losses during construction arise from five primary mechanisms: (1) anchor deformation losses due to displacement of anchorage devices under tendon tension; (2) frictional losses, including anchorage mouth friction (determined by measured data or manufacturer specs) and friction at deflection devices (based on actual conditions); (3) thermal differential losses caused by temperature disparities between tendons and tension-bearing equipment during concrete heating curing; (4) stress-relaxation losses resulting from time-dependent stress attenuation in tendons under sustained strain (with specific formulas for different tendon types); and (5) losses due to concrete shrinkage and creep, which progressively reduce effective prestress over the service life. Accurate modeling of these mechanisms is critical for predicting the mechanical behavior of pre-tensioned beams and ensuring their long-term reliability in bridge engineering [7,8].
To study the pre-tensioned, prestressed concrete beam’s mechanical properties, some scholars have carried out experimental research. Jianqun Wang et al. [8] conducted destructive testing and finite strip analysis on a full-scale prestressed box beam, revealing premature tendon fracture with underutilized concrete compressive capacity (1456 με vs. 3300 με), and proposed optimized steel reinforcement configurations that enhance ductility and increase bearing capacity by 44.3%. Garber et al. [9] investigated non-traditional shear failure mechanisms in bulb-T beams, revealing critical considerations for designs with high prestress ratios and wide flange-web connections. Zhuyou Hu et al. [10] developed a nondestructive method correlating bending stiffness reduction with residual bearing capacity in prestressed concrete T-beam bridges, experimentally validating that transverse connection damage minimally impacts RBC (<5%), and proposed a field-applicable model to objectively assess structural integrity without subjective expertise. Zengbo Yao et al. [11] experimentally studied a full-scale prestressed T-beam under combined loading. The beam was tested via multi-sensors and VIC-3D. Loading stages included elastic and crack development. Initial cracks formed at flange-web junctions and the loaded segment bottom, followed by web diagonal/shear cracks. Stirrup/concrete strains spiked after web cracking, with upper stirrup peaks. Principal strain peaks were localized near loading-support connections on web surfaces. Experimental and theoretical investigations into the cyclic performance of bonded/unbonded prestressed beams—encompassing both normal-strength concrete (NSC) and high-strength concrete (HSC)—were systematically conducted by O.F. Hussien et al. [12]. Their key finding revealed that unbonded HSC beams showed a significant ductility reduction relative to bonded HSC beams. Analytical models effectively predicted flexural capacity but showed a consistent underestimation of ductility. Concurrently, independent studies have validated the efficacy of numerical simulation methods in capturing the complex mechanical response of prestressed concrete structures. M. Singh et al. [13] performed experimental evaluations on four full-scale UHPFRC beams with diverse span configurations and cross-sectional geometries. They validated finite element models incorporating the concrete damaged plasticity (CDP) framework, demonstrating that these models precisely forecasted both load-bearing capacity and load-deflection responses. Numerical methods, specifically the finite element method (FEM) and artificial neural networks (ANN), effectively predicted the flexural behavior of UHPFRC T-beams reinforced with prestressed CFRP strands and non-prestressed steel, as validated by experimental results. FEM models closely matched test data, highlighting the influence of prestress level, concrete strength, and steel ratio on failure mechanisms and ultimate load capacity. Meanwhile, a backpropagation (BP)-ANN model achieved exceptional predictive accuracy for ultimate moments, with a correlation coefficient of 0.99 and a maximum error of 8%, underscoring the efficacy of computational tools in analyzing UHPFRC structures [14]. A nonlinear finite element model for pre-tensioned, prestressed concrete beams, developed by O. Yapar et al. [15], integrated key mechanisms including concrete plasticity, damage evolution, and strand slip-bond behavior. This model successfully simulated the entire loading process—including prestress transfer—across the beam’s service life. Validated through experimental comparisons, the framework accurately predicted structural behavior both prior to and following bonded composite patch repairs, thereby filling a critical void in reliable finite element analysis of prestressed concrete systems. Alfred Strauss et al. [16] conducted experimental and numerical investigations on prestressed concrete T-beams, combining material fracture tests and nonlinear finite element model updating to accurately capture combined shear-flexure behavior. Their multi-stage approach, validated through tests on scaled beams (0.3–0.6 m height) and long-span roof elements (30 m), successfully integrated fracture-mechanical parameters from monitoring systems and code methods to improve shear capacity predictions in prestressed members. Mohammad Maghsoudi and Ali Akbar Maghsoudi [17] conducted finite element analysis (using ABAQUS) on the flexural response of experimental tests on 9 m pre-tensioned HSSCC T-beams, demonstrating high agreement in crack patterns and load-deflection behavior, though FEA overestimated tendon stresses at the ultimate state due to unmodeled practical losses. Shozab Mustafa et al. [4] carried out nonlinear finite element analysis adhering to Dutch guidelines. Their work focused on assessing shear-critical post-tensioned bridge beams from the demolished Helperzoom bridge. The analysis showed safe forecasts of cracking and ultimate capacities when compared with experimental data. Parameter studies further verified the method’s reliability for structural assessment. Distinct from straight-tendon systems, polygonal tendon systems enable the superposition of positive bending moments from polygonal tendons and negative moments from straight tendons. Moreover, polygonal tendons can take on shear forces at beam ends, boosting the structure’s shear resistance. This mechanism results in optimized force distribution inside the structure [18]. Given this context, a novel pre-tensioned, prestressed concrete T-beam featuring polygonal tendons was introduced in the reconstruction and expansion project of Changzhang Expressway.
Although the scaled-down tests and numerical simulations of pre-tensioned beams are relatively mature, the research on full-scale pre-tensioned prestressed T-beams with polygonal tendons remains in short supply [19,20,21]. There is an urgent need to comprehensively understand its flexural performance. To address this, both a full-scale flexural static load test and numerical simulations were carried out. For the experimental part, multiple types of sensors, such as vibrating-string-type steel strand gauges, an optical three-dimensional dynamic tracking system, and displacement transducers, were strategically deployed. Through the coordinated operation of these sensors, a comprehensive set of data regarding the beam’s internal forces, vertical displacements, and strains during loading was accurately obtained. In terms of numerical simulations, Abaqus/CAE Release 2022 software was utilized. The model was meticulously established, taking into account various factors like material properties, geometric dimensions, and boundary conditions. Nonlinear behaviors, including concrete damage, were also incorporated to ensure the authenticity of the simulation results. By comparing and validating the data from the experiment and numerical simulations, a more accurate understanding of the flexural performance of this type of beam was achieved. The combined dataset from the experiment and numerical simulations provided crucial theoretical support and practical references for optimizing the design, controlling construction quality, and managing the maintenance of this type of beam throughout its service life.

2. Experimental Setup and Beam Design
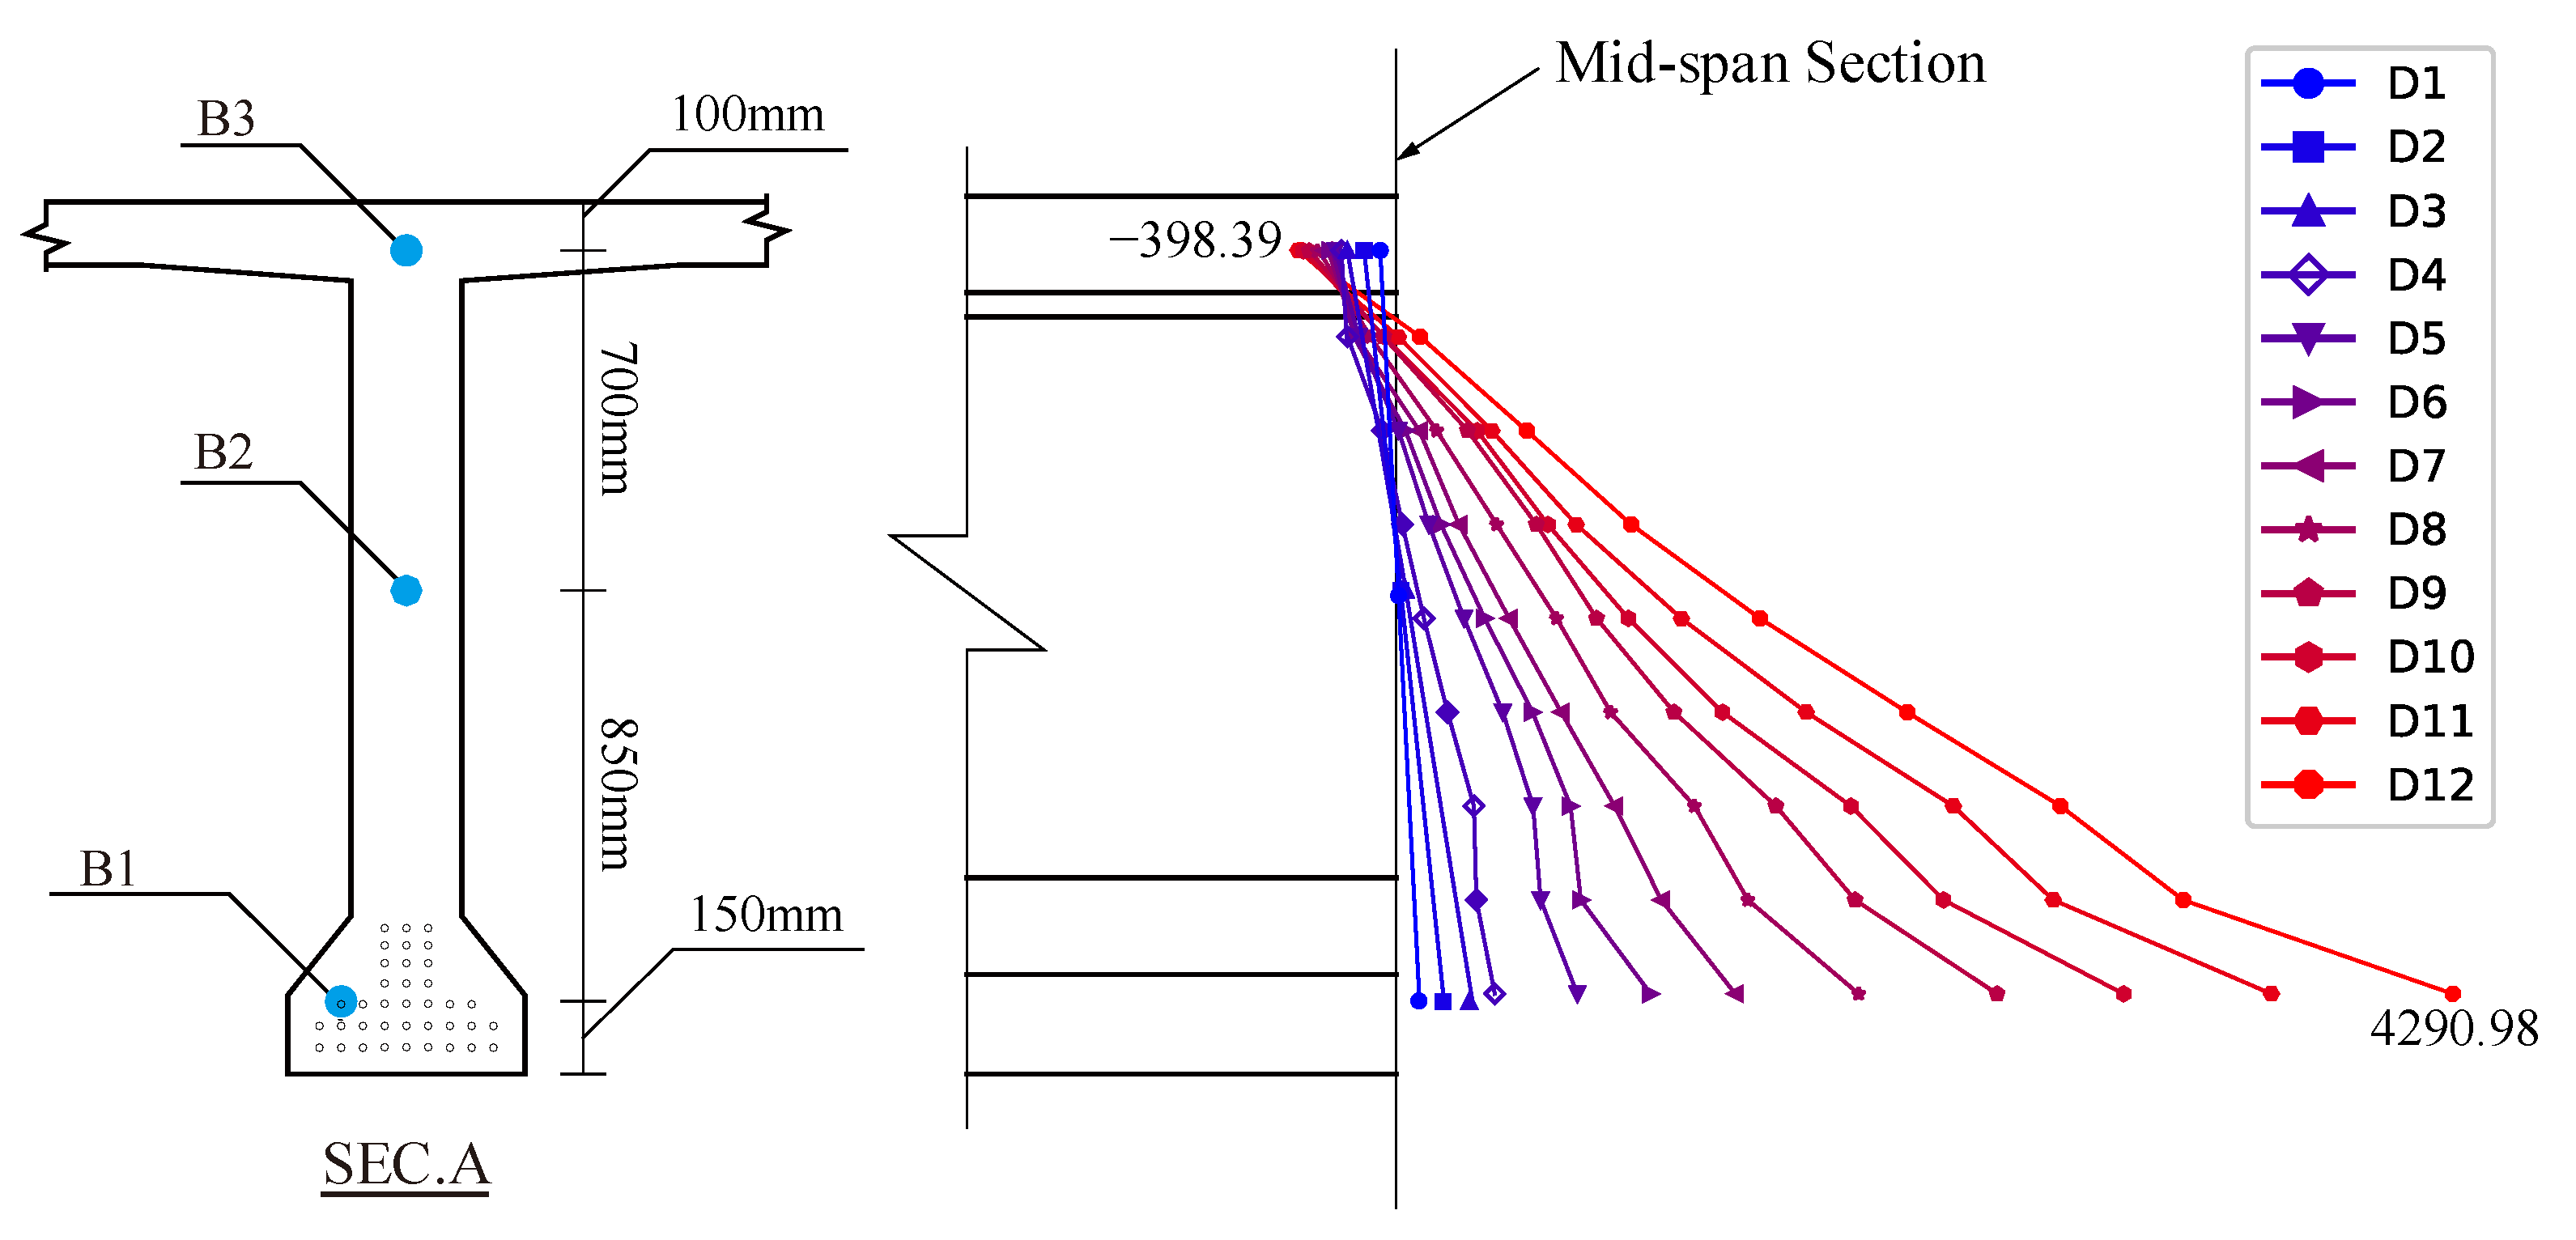
2.1. Model Overview

For this study, the T-shaped test beam was sourced from the Nanchang–Zhangshu Expressway Reconstruction and Expansion Phase I Project. The double-fold-tensioning approach was utilized to impart prestress. Dimensionally, the beam spanned 30,000 mm in total length, had a calculated length of 28,280 mm, stood at a height of 1800 mm, and featured a web width of 280 mm and an overhanging flange width of 1750 mm. In terms of tendon arrangement, its body incorporated a combination of 16 straight prestressing tendons and 21 folded ones. A deflector was used to centrally bend the folded prestressing tendons at the 5000 mm mark from both sides of the mid-span. The structural layout of the test beam is presented in Figure 1. The concrete strength used was C55. The prestressing tendons were 1 × 7 Փs15.2 low-relaxation prestressing strands with a standard value of ultimate strength of 1860 MPa. The reinforcement configuration of the beam, along with the mechanical properties of the steel materials, is specified as follows: HRB400-grade steel bars served as the primary reinforcement in key locations; 14 mm-diameter bars were placed at the upper part of the flange plate and 28 mm-diameter bars at the bottom of the beam. For the lower section of the flange plate and the web, 10 mm-diameter bars were used, but with differing grades—HPB400 for some areas and HPB300 for others within these components. Stirrups, meanwhile, were uniformly specified as 12 mm-diameter HRB400 bars. Prior to testing, performance evaluations were conducted on all steel bars and strands used in beam fabrication, with their mechanical property parameters summarized in Table 1. For concrete production, P.O. 52.5 ordinary portland cement served as the binder, fine sand as the fine aggregate, and crushed stone as the coarse aggregate. To ensure concrete workability, superplasticizers were added. The compressive strength of concrete was determined through cubic sample tests: three 150 mm × 150 mm × 150 mm cubes were prepared, cured for 28 days, and then tested, with the average compressive strength measuring 64.8 MPa.

2.2. Fabrication of Test Beam

The test beam was cast using a high-precision custom-fabricated steel formwork. Before installation, the formwork surface was meticulously cleaned and coated with a mold-release agent to ensure a smooth beam surface after demolding. During steel reinforcement placement, positioning spacers were installed to maintain the required cover thickness. These spacers ensured accurate steel reinforcement positioning and prevented displacement during concrete pouring.
Before the main tensioning, a pre-tensioning step was carried out to mitigate initial relaxation deformation. The pre-tensioning tensile stress was set at 465 MPa. During the subsequent main tensioning operation, the cumulative tensile stress reached 1339 MPa. Concrete was layered and vibrated in sequence. After pouring, the concrete was left undisturbed for six hours prior to being shielded with a tarpaulin. Steam curing was subsequently applied using a stepwise heating protocol. Initial prestress application commenced once in situ tests confirmed that the concrete’s compressive strength and elastic modulus had reached or exceeded 90% of the design-specified values at seven days post-casting.

2.3. Loading Program

To assess the ultimate flexural capacity of the test beam, the loading setup was configured as follows (Figure 2): A hydraulic jack was positioned at the beam’s mid-span, with a distributor beam installed to create a pure bending zone. The T-beam itself was supported on steel hinges, while the reaction frame—linked to the upper cross beam and high-strength tie rods—was anchored to concrete piles at the base. When the jack was pressurized, the loading frame transmitted the reaction force to these base piles via the high-strength tie rods.
The loading protocol adhered to a two-phase approach: preloading and formal loading. During preloading, 20% of the designed cracking load was applied to the steel strands to stabilize initial deformations. Formal loading then commenced, strictly following the procedure outlined in China’s Standard for Test Methods of Concrete Structures [22].
Theoretical calculations indicated that the tensile steel at the beam bottom would yield once the strain reached 2219.55 με. Loading was ceased when the steel strain reached 2300 με, considering test safety and the hydraulic jack’s effective stroke (with a maximum displacement limit of ±300 mm). Specific loading parameters were detailed in Table 2.

2.4. Measurement Program

The test pre-tensioned T-beam was placed on supports. Linear displacement transducers were placed at the mid-span, 4050 mm from the mid-span, and at the supports. The beam sides were painted white to enhance crack visualization. Vibrating wire strain gauges measured strand strain, while concrete strain gauges monitored strains in the flanges, webs, and lower flanges at the mid-span of cross-section 1-1. Figure 3 illustrated the deflection and strain gauge configurations.
An optical 3D dynamic tracking system (Optotrak Certus, Northern Digital Inc., Waterloo, ON, Canada) was deployed to measure the absolute displacements of target points on the beam. Average linear strains were derived from these displacements to characterize cross-sectional strain distributions. The system used three calibrated linear array CCD cameras to triangulate near-infrared emissions from passive targets, enabling real-time 3D coordinate acquisition with 0.1 mm RMS accuracy and 0.01 mm resolution. In this test, 2 × 8 target points spaced 400 mm longitudinally and 200 mm vertically were placed at the mid-span web and lower flange deformation zones, as shown in Figure 3.
Crack monitoring involved measuring the maximum crack width with a crack width gauge. Crack development was recorded at every 1–2 loading increments, documenting crack propagation, width expansion, and new crack formation.

3. Experimental Results

3.1. Test Phenomena

Figure 4 presented the load-deflection distribution along the beam length. Under D10 conditions, cracks in the flexural-shear zone coalesced, with the maximum crack width reaching 0.30 mm in the pure flexure region. For D12 conditions, where steel reinforcement yielded, significant crack interconnection occurred. At this stage, the maximum crack width measured 0.55 mm in the pure flexure zone and 1.00 mm in the flexural-shear zone. Moreover, the beam experienced a maximum mid-span deflection of 148.61 mm.

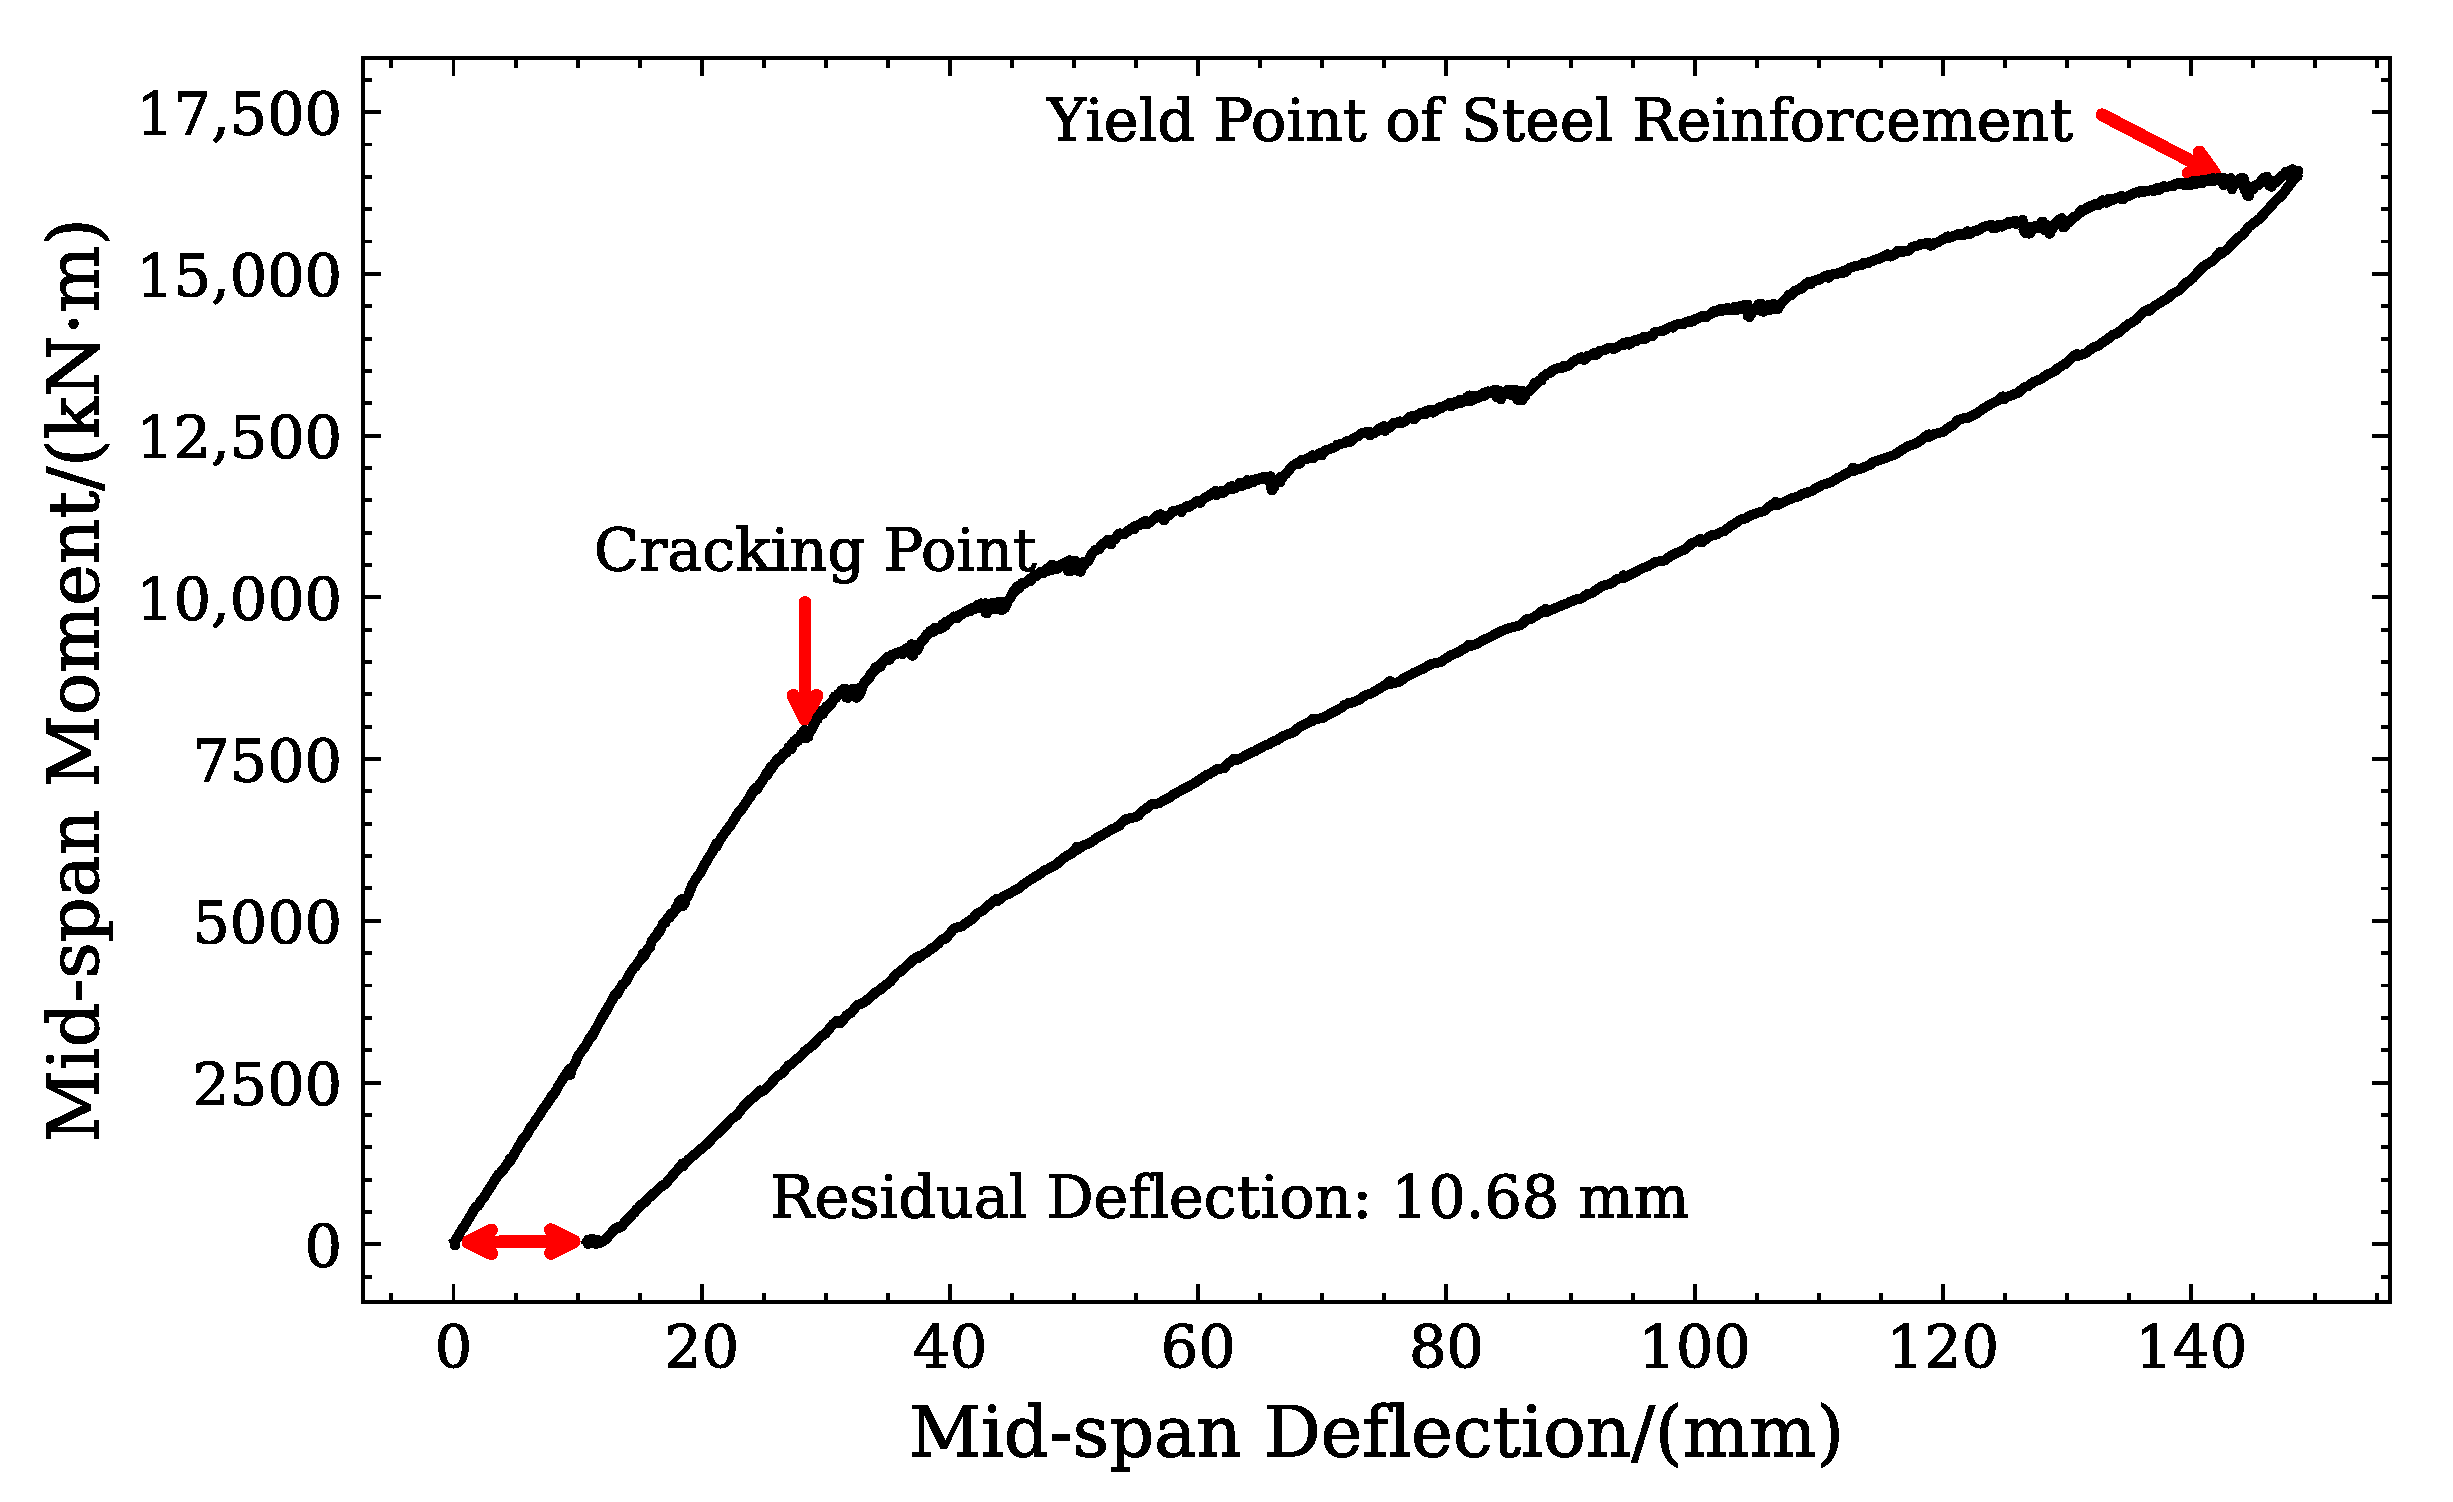
3.2. Experimental Bending Moment and Deflection of Mid-Span Relationship

To more distinctly illustrate how deflection changes corresponding to the mid-span bending moment generated by experimental loads (excluding the moment from initial prestress), the mid-span deflections corresponding to each loading stage were separately extracted, as illustrated in Figure 5. The curve indicated that the gradient of the load-deflection relationship diminished beyond the cracking point. After steel reinforcement yielding, the curves exhibited a “plastic plateau” region, indicating that the beam was close to its ultimate load-carrying capacity limit state.
Through analyzing the test load-deflection curves and applying material mechanics principles [23], the secant stiffness formula for the mid-span section was derived using the following equation:
B S ω ¨ ( x ) = M ( x ) ω ( x ) = 1 B S 1 6 F x 3 + ( L a ) ( L + a ) F 8 x , x L a 2 1 B S L a 4 F x 2 + ( L a ) F L 4 x + F ( L a ) 48 ( L a ) 2 + 3 L + 3 a 6 L 2 + 6 L a , L a 2 < x L 2 B S = 1 6 F x 3 + ( L a ) ( L + a ) F 8 x w ( x ) , x L a 2 L a 4 F x 2 + ( L a ) F L 4 x + F ( L a ) 48 L 2 2 L a + a 2 + 6 a 6 L w ( x ) , L a 2 < x L 2 B S M i d s p a n = ( F ( L a ) 48 ( 4 L 2 2 L a + a 2 + 6 a 6 L ) w ( L 2 ) )
where BS is the secant stiffness, ω(x) is the deflection equation, F is the force value of a single support of the distributing beam, x is the distance from the origin of the end coordinates, L is the calculated span, and a is the spacing between the centers of the two supports of the distributing beam.
The calculated results were presented in Figure 6. Based on secant stiffness variations, the load-deflection curves during beam loading could be classified into three distinct stages [24]:
  • Elastic Stage: Prior to cracking, the secant stiffness was maintained at approximately 6.9 × 10¹⁶ N·mm2. At this stage, the beam exhibited linear elastic behavior with a proportional load-deflection response.
  • Cracking stage: After the cracking point, the secant stiffness gradually declined. As the concrete developed tensile cracks while the steel reinforcement had not yielded, the slope of the load-deflection curve did not drop rapidly.
  • Steel reinforcement yielding stage: When the steel reinforcement yielded, the secant stiffness reached 2.84 × 10¹⁶ N·mm2, and the slope of the load-deflection curve underwent a significant reduction.
Figure 6. Variation curve of secant stiffness at mid-span cross-section.
Buildings 15 02595 g006
The pre-tensioned, prestressed concrete T-beam with polygonal tendon profiled demonstrated excellent stiffness and crack resistance. Under D2 conditions, which simulated a design service load bending moment, the mid-span section registered a measured bending moment of 4061.26 kN·m and a deflection of 18.67 mm, below the 47.13 mm code-specified limit. The theoretical cracking moment, calculated from design parameters, was 5928.81 kN·m. Cracks were initiated under D3 conditions, with significant strain gauge responses and visible surface cracks. The measured mid-span cracking moment (Mcr) was 7916.85 kN·m, and the secant stiffness was 6.83 × 10¹⁶ N·mm2, consistent with previous results, which confirmed the beam’s superior crack resistance.
Verification of flexural capacity showed that the theoretical normal section capacity, calculated according to Specification [25] using reliability-based material strength design values, was 10,885.98 kN·m. The test beam reached a flexural capacity of 16,457.85 kN·m at steel reinforcement yielding, indicating substantial strength reserves.
Under D4–D12 loading, crack propagation and widening led to nonlinear deflection development and a gradual decline in secant stiffness. The 30 m pre-tensioned prestressed T-beam had outstanding flexural behavior, meeting stiffness, crack resistance, and load-carrying capacity requirements of the specifications. Notably, after cracking, the bending moment increased with deflection, and prestress restored most of the deflection upon unloading, leaving a residual deflection of 10.68 mm.

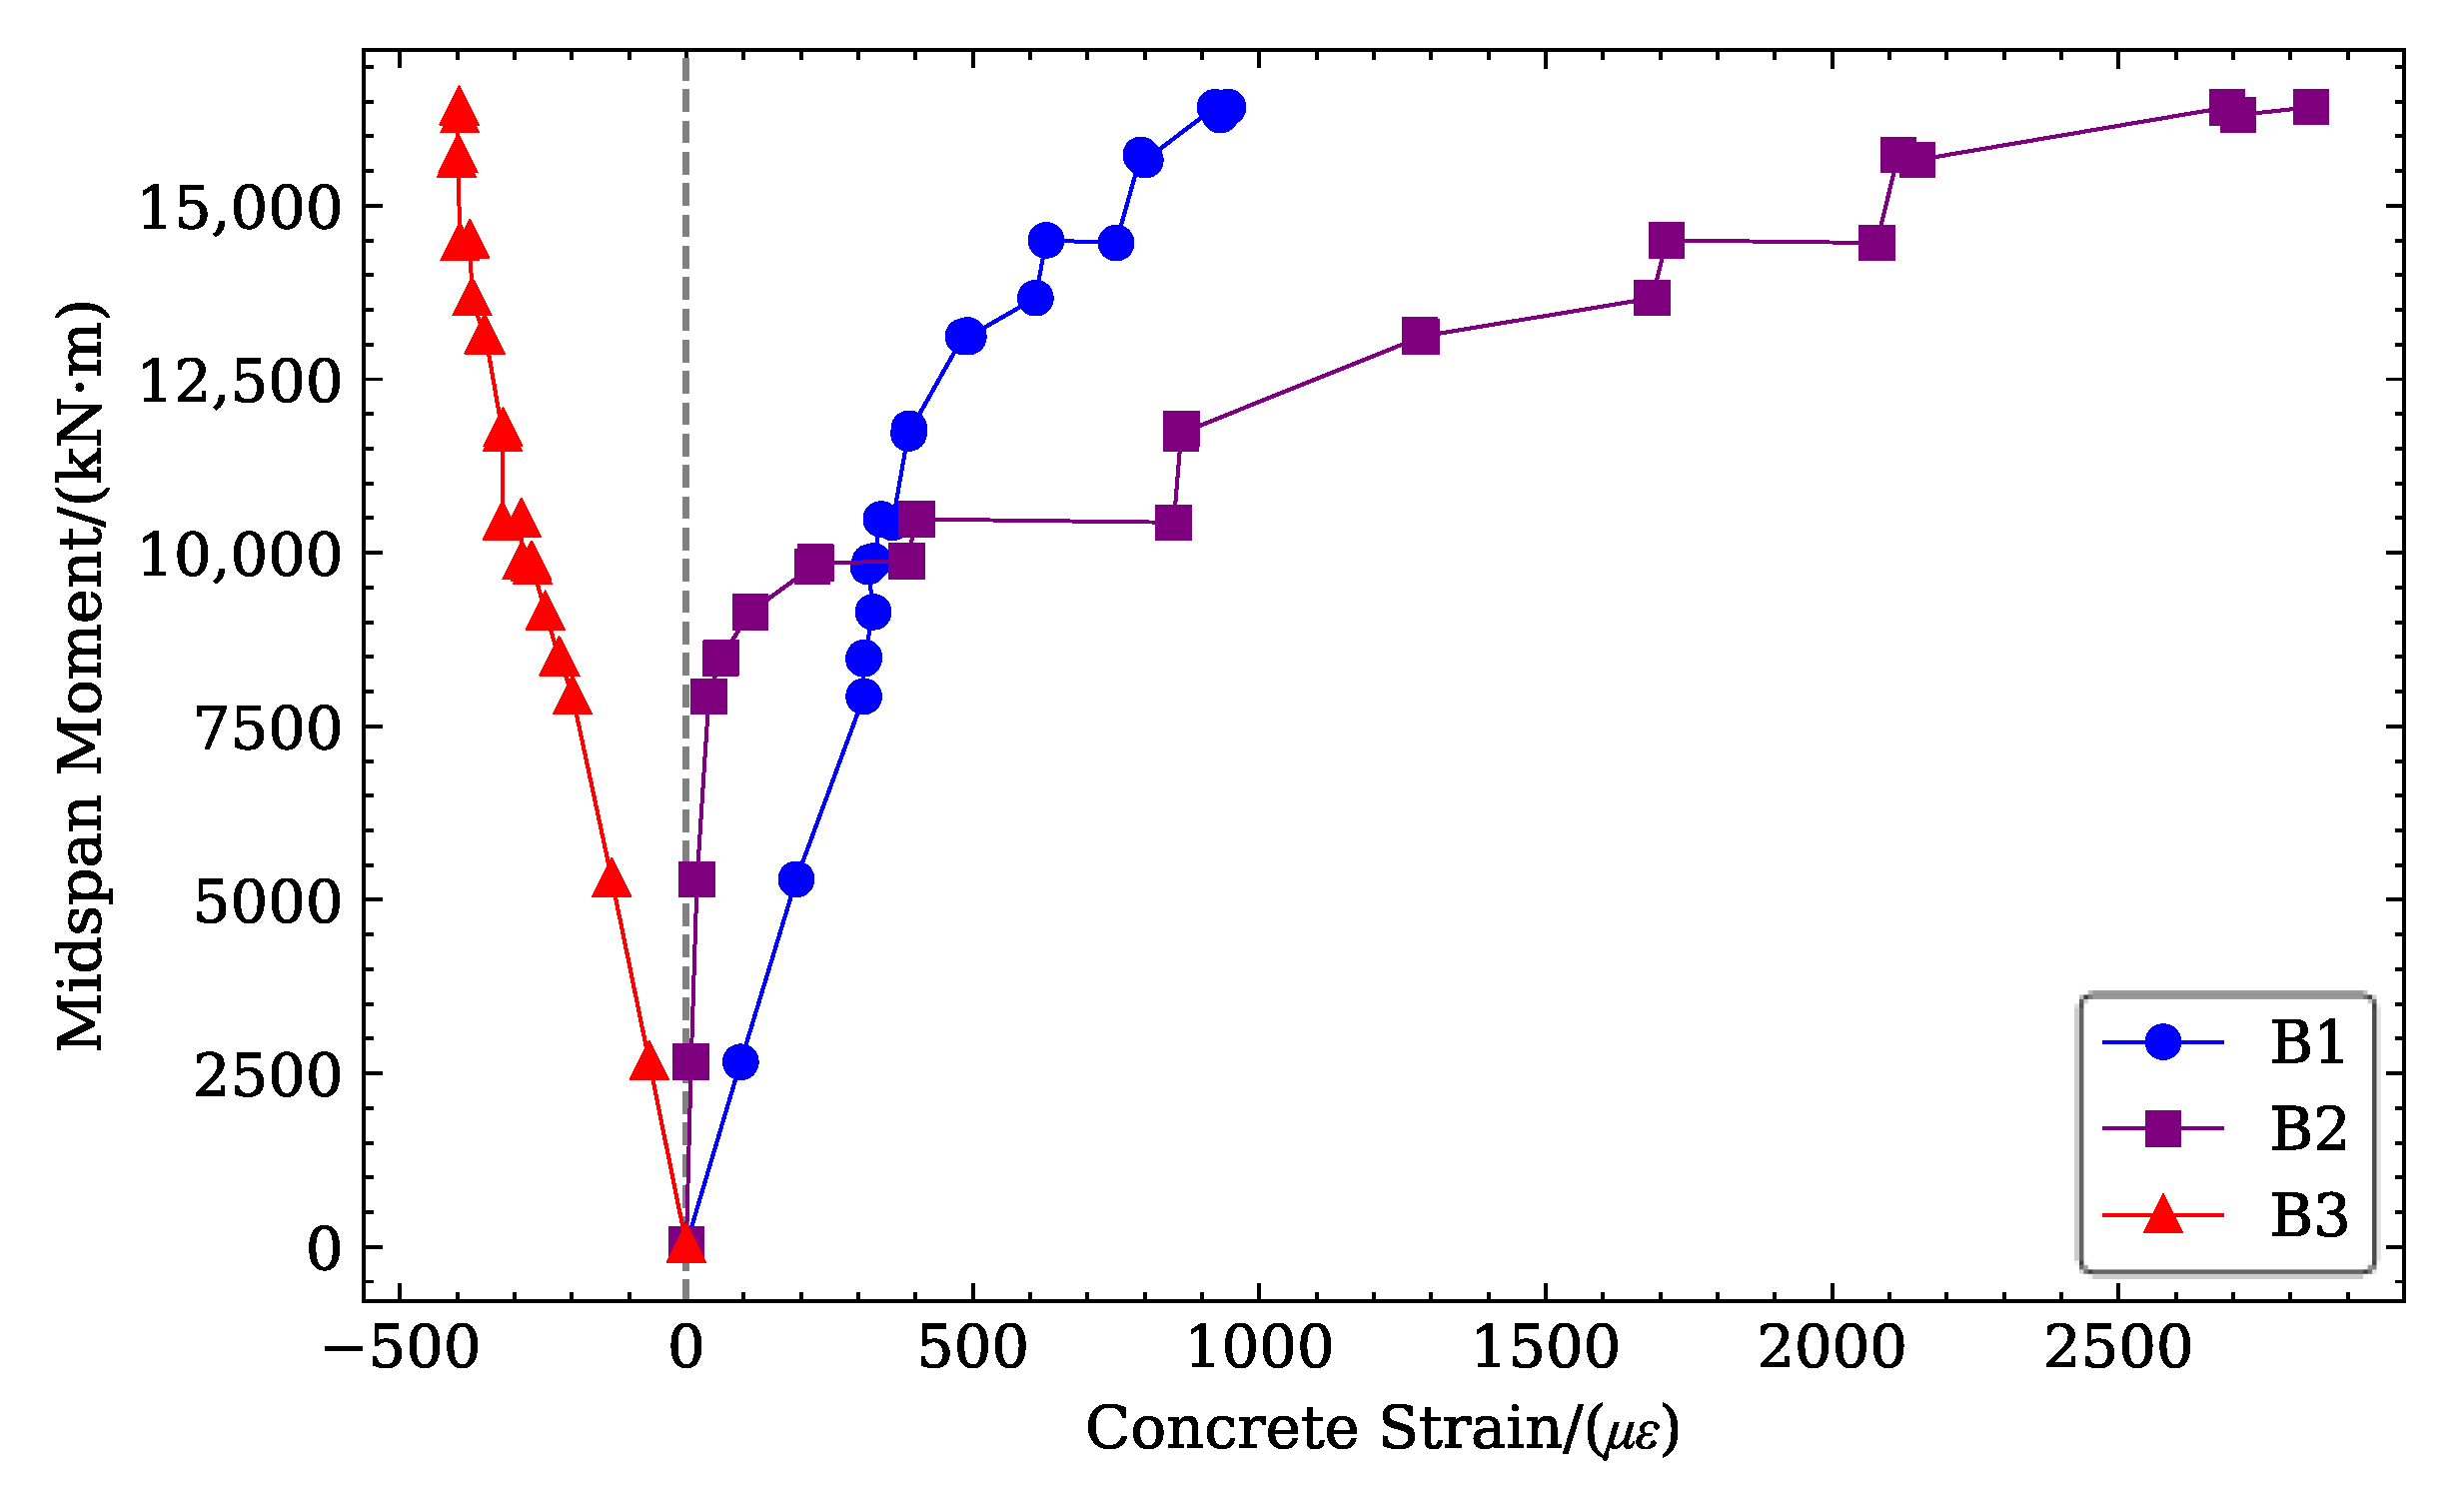
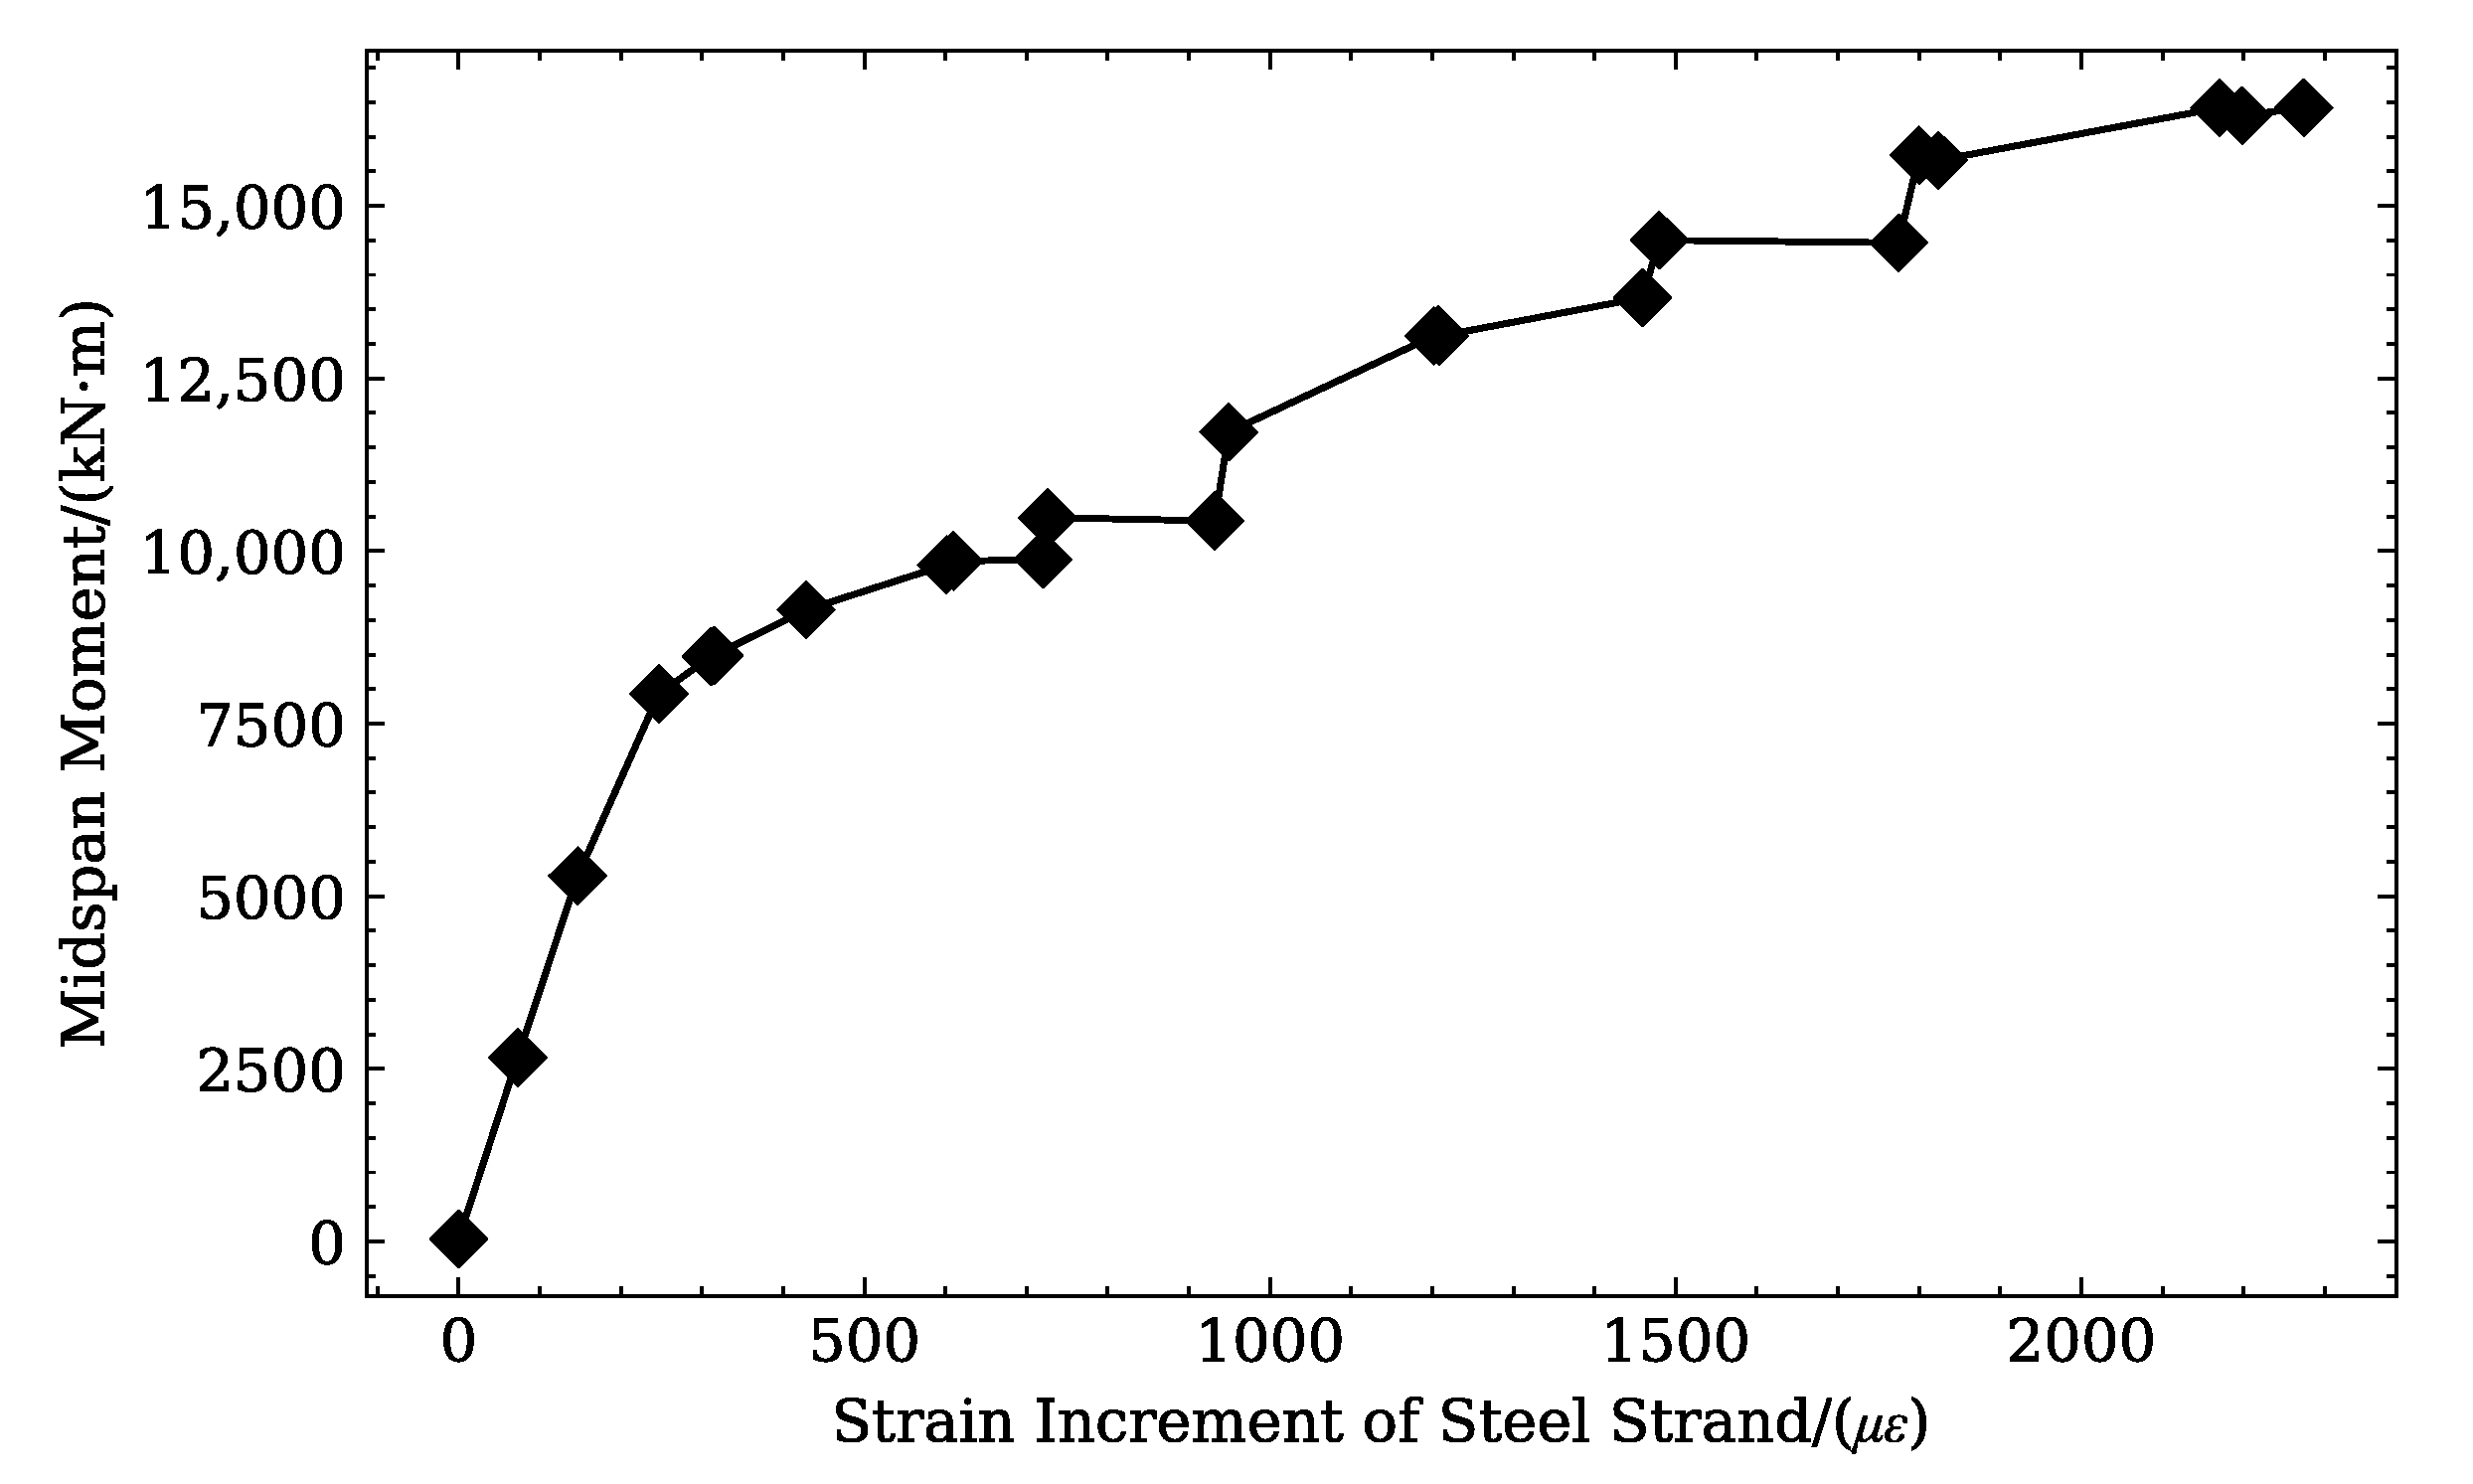
3.3. Strain Evolution and Cracking Pattern

3.3.1. Strain Evolution and Structural Response

As shown in Figure 7, strain gauge data traversed by cracks became invalid after cracking occurred at the bottom concrete following D3 loading. The strain distribution at the mid-span section, reflecting only the response to experimental loads (excluding initial prestress-induced strain components), measured by concrete strain gauges B1, B2, and B3, is presented in the curves (D1–D3) of Figure 8.
The average strain was calculated using displacement data from NDI-measured target points and B3 strain gauge readings to derive the mid-section strain distribution for subsequent loading conditions. A longitudinal measurement segment was formed by connecting two target points ((x1, y1, z1), (x2, y2, z2)) spaced 400 mm apart at the same elevation, as defined in the following equation:
l 12 = ( x 1 x 2 ) 2 + ( y 1 y 2 ) 2 + ( z 1 z 2 ) 2 l 12 = ( x 1 x 2 ) 2 + ( y 1 y 2 ) 2 + ( z 1 z 2 ) 2 ε 12 = l 12 l 12 l 12
where xi, xi′ denote the x-coordinate value of the target point of the i point in the initial loading condition and the loading condition to be calculated, lij, lij′ denote the lengths of the long scale segment formed by the two points i, j in the initial loading condition and the loading condition to be calculated, and εij, denotes the calculated average linear stress of the long scale segment formed by the two points i, j in the calculation of the loading condition.
The analysis of mid-span strain distribution evolution revealed that during the elastic stage, the zero-strain axis was located approximately 750 mm below the top of the upper flange. With increasing load, mid-span cracks propagated upward, causing the zero-strain axis to shift upward gradually. At steel reinforcement yielding, the zero-strain axis reached the bottom of the upper flange, demonstrating the stress redistribution mechanism following concrete cracking. Once the concrete tensile zone at the beam bottom exceeded its tensile strength, its load-bearing capacity diminished, with subsequent stress increments transferred to prestressed and ordinary primary reinforcement.
Figure 9 presents the data from the steel strand gauges. In the D1–D3 conditions, the strain of the steel strand changed smoothly and linearly. This showed that the beam was in an elastic state. The steel strand, steel reinforcement, and the concrete withstood tensile stress, keeping the beam stable without obvious nonlinear deformation. There were no visible cracks, and the deflection increased linearly, which agreed with the beam’s macroscopic stress performance at this time.
As the loading progressed to the D4 condition, when the beam started to decompress and crack, an obvious “inflection point” appeared in the steel strand gauge data. At this time, the concrete began to crack, causing the internal forces in the structure to redistribute. Part of the tension originally borne by the concrete was gradually transferred to the steel strand. The strain of the steel strand increased faster than before, meaning it bore more tensile stress and took part in load-bearing more actively.
In the subsequent D5–D10 conditions, the cracks developed quickly. The values from the steel strand gauge kept rising, and the growth rate increased further. As the cracks spread and widened, the steel strand took on almost all the additional tension, and its strain growth was closely related to the development of cracks. This showed that the structure relied on the prestressing steel strand to increase load-bearing capacity and slow down the destruction process in this stage.
By the D12 condition, the steel reinforcement reached yield strain, and the prestressing steel approached the yield strain. Due to the jack stroke limitation and safety concerns, the loading stopped. At this time, the test beam was close to its ultimate load-carrying capacity.

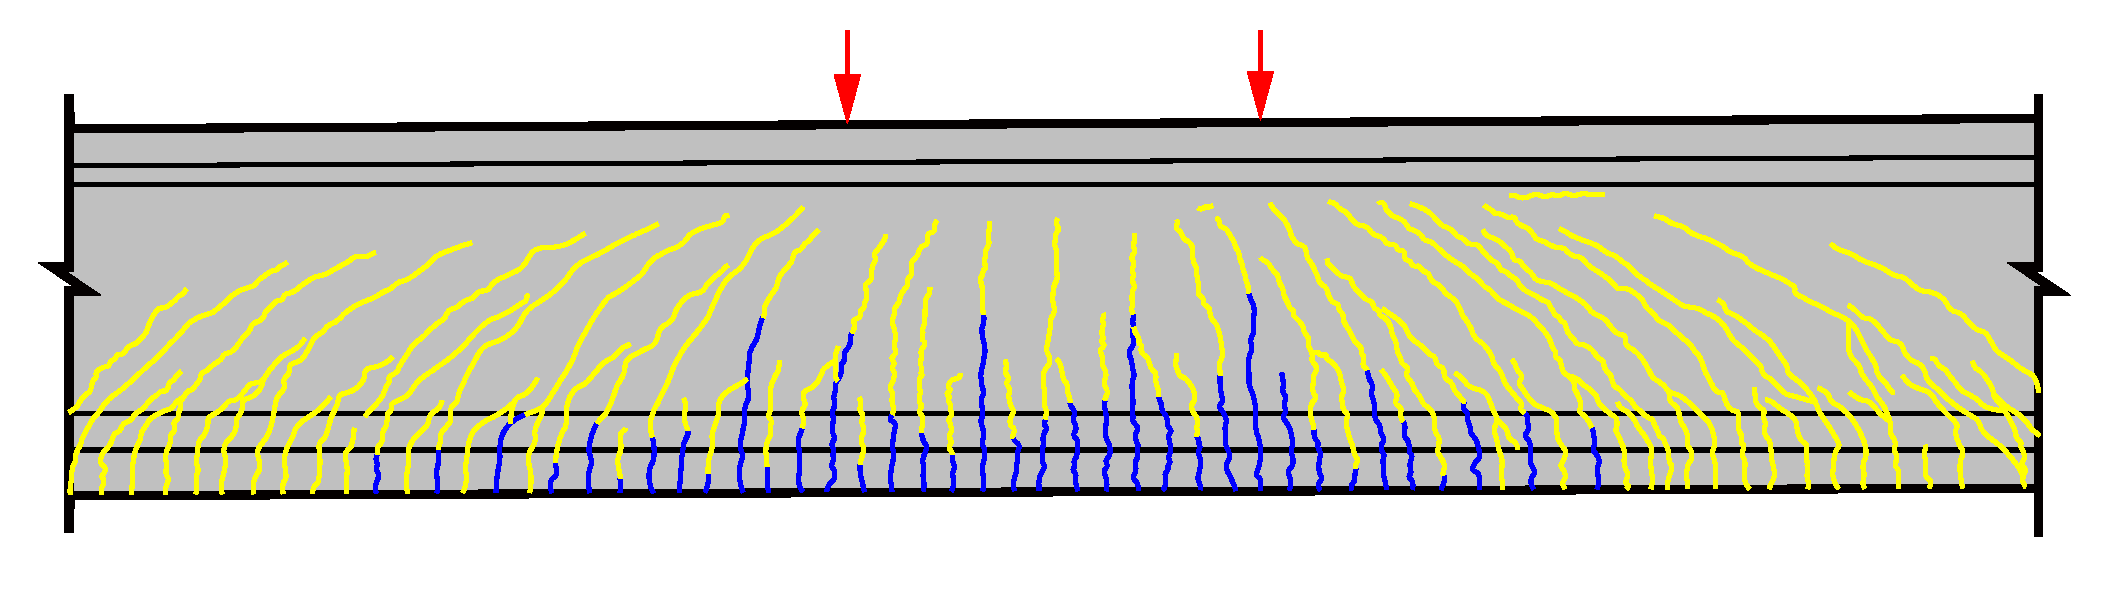
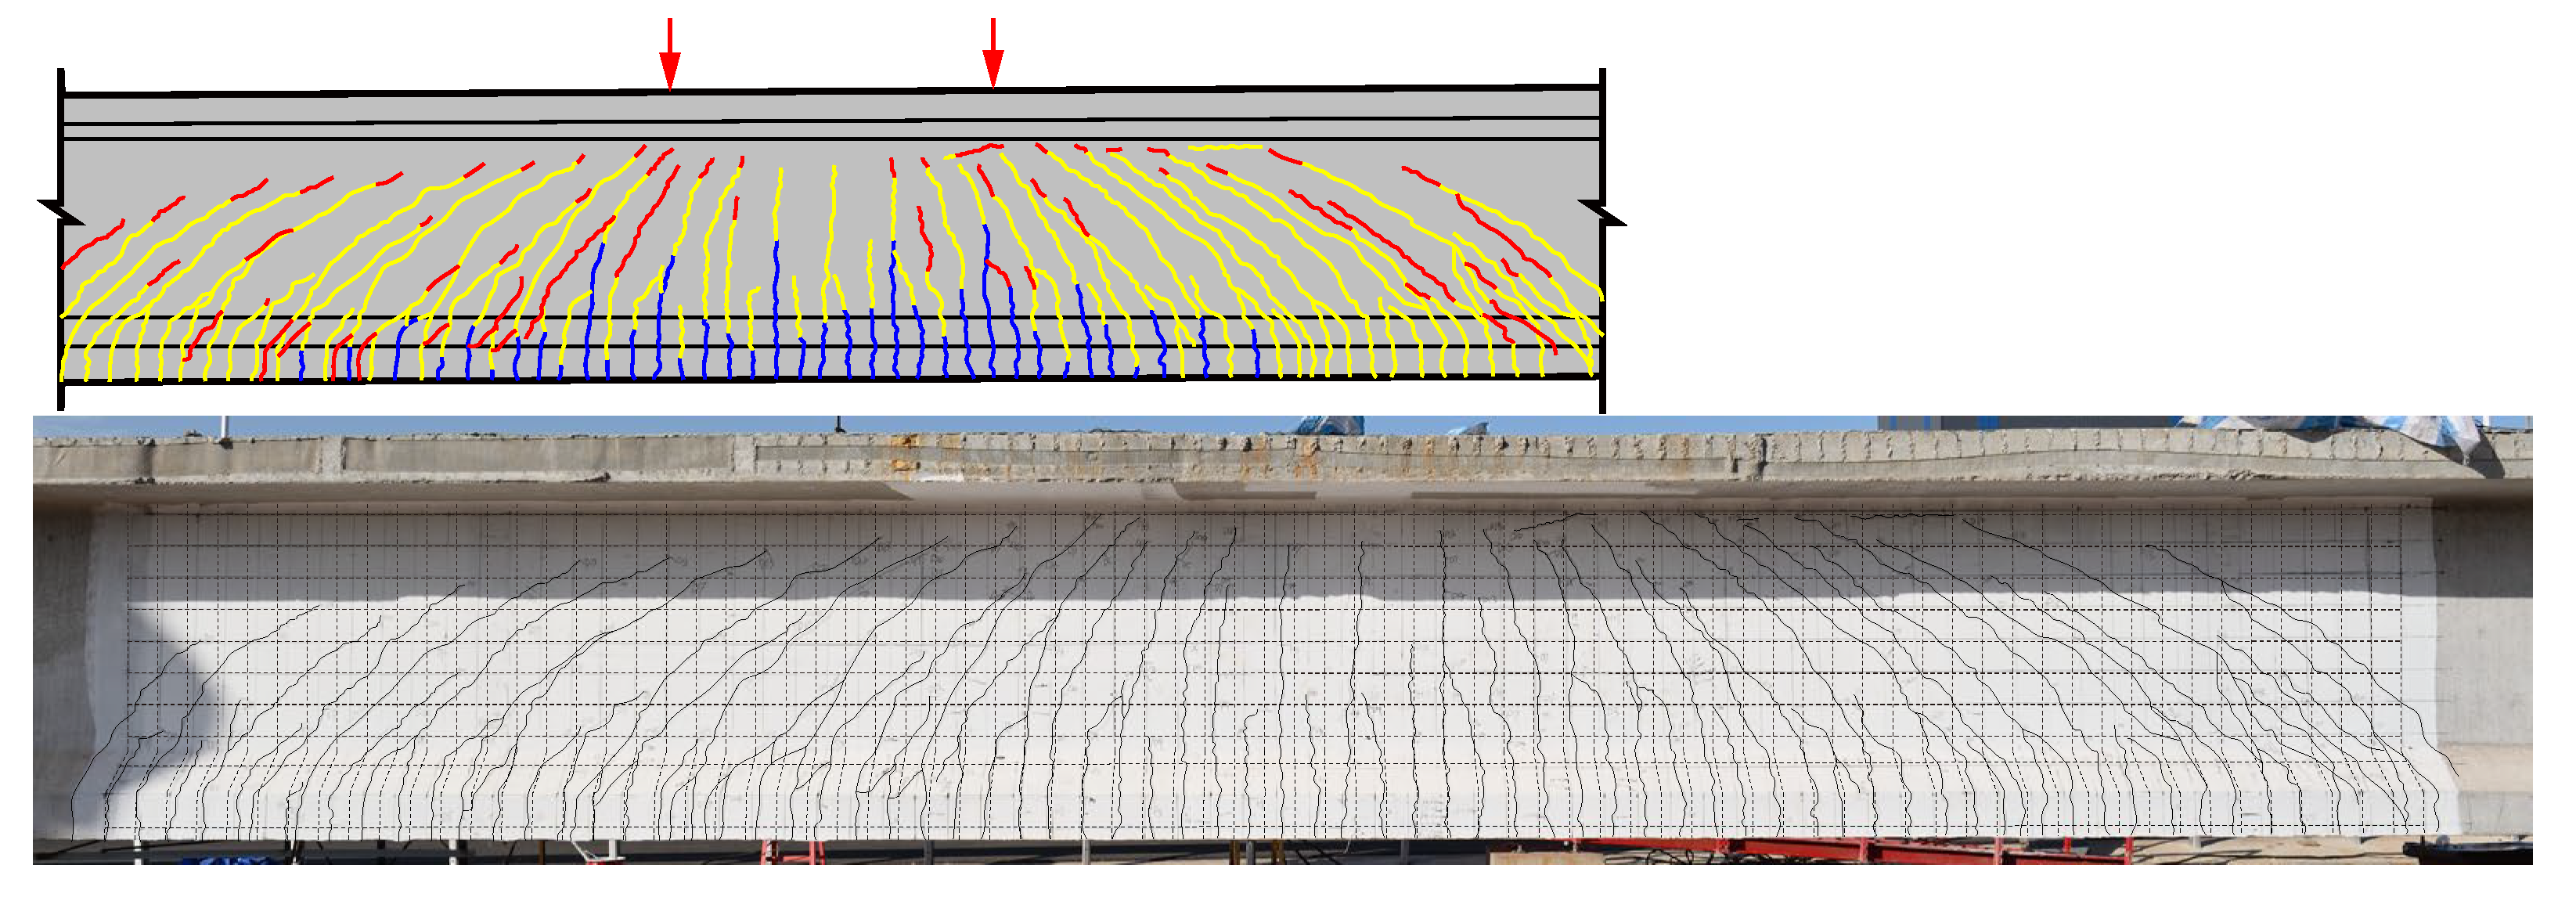
3.3.2. Cracking Pattern

The crack evolution exhibited sequential stages under progressive loading.
Initial Cracking Stage: Initial flexural cracking is illustrated in Figure 10, which initiated at the mid-span soffit (tensile zone) at a measured concrete strain of 359.09 µɛ, determined through linear interpolation of strain gauge data. Subsequent crack propagation manifested as vertically oriented fractures extending through the beam’s web, demonstrating characteristic patterns consistent with classical flexural failure mechanisms. This fracture progression correlated directly with applied load increments.
Stage of Accelerated Crack Propagation: At the D10 loading level (Figure 11), the crack development entered a critical phase with pronounced morphological shifts. Crack length, width, and quantity increased significantly. Concurrently, diagonal cracks initiated in the bending–shear interaction region. These diagonal cracks propagated progressively towards the loading point.
Final Crack Condition: Upon reaching the D12 loading condition (Figure 12), characterized by steel reinforcement yielding, crack propagation attained a stable configuration. In the pure bending zone, the maximum crack width was 0.55 mm, while in the bending-shear interaction zone, it reached 1.00 mm.

4. Numerical Simulation

To fully uncover the nonlinear bending behavior of the pre-tensioned, prestressed concrete T-beam with polygonal tendons, a finite element model was built using ABAQUS, as depicted in Figure 13. The simulation proceeded in two phases. The first phase involved applying prestress and self-weight, where the prestress of straight and polygonal prestressed steel strands was imposed via the temperature-reduction method to simulate the prestress release process. The second phase was to apply loading.

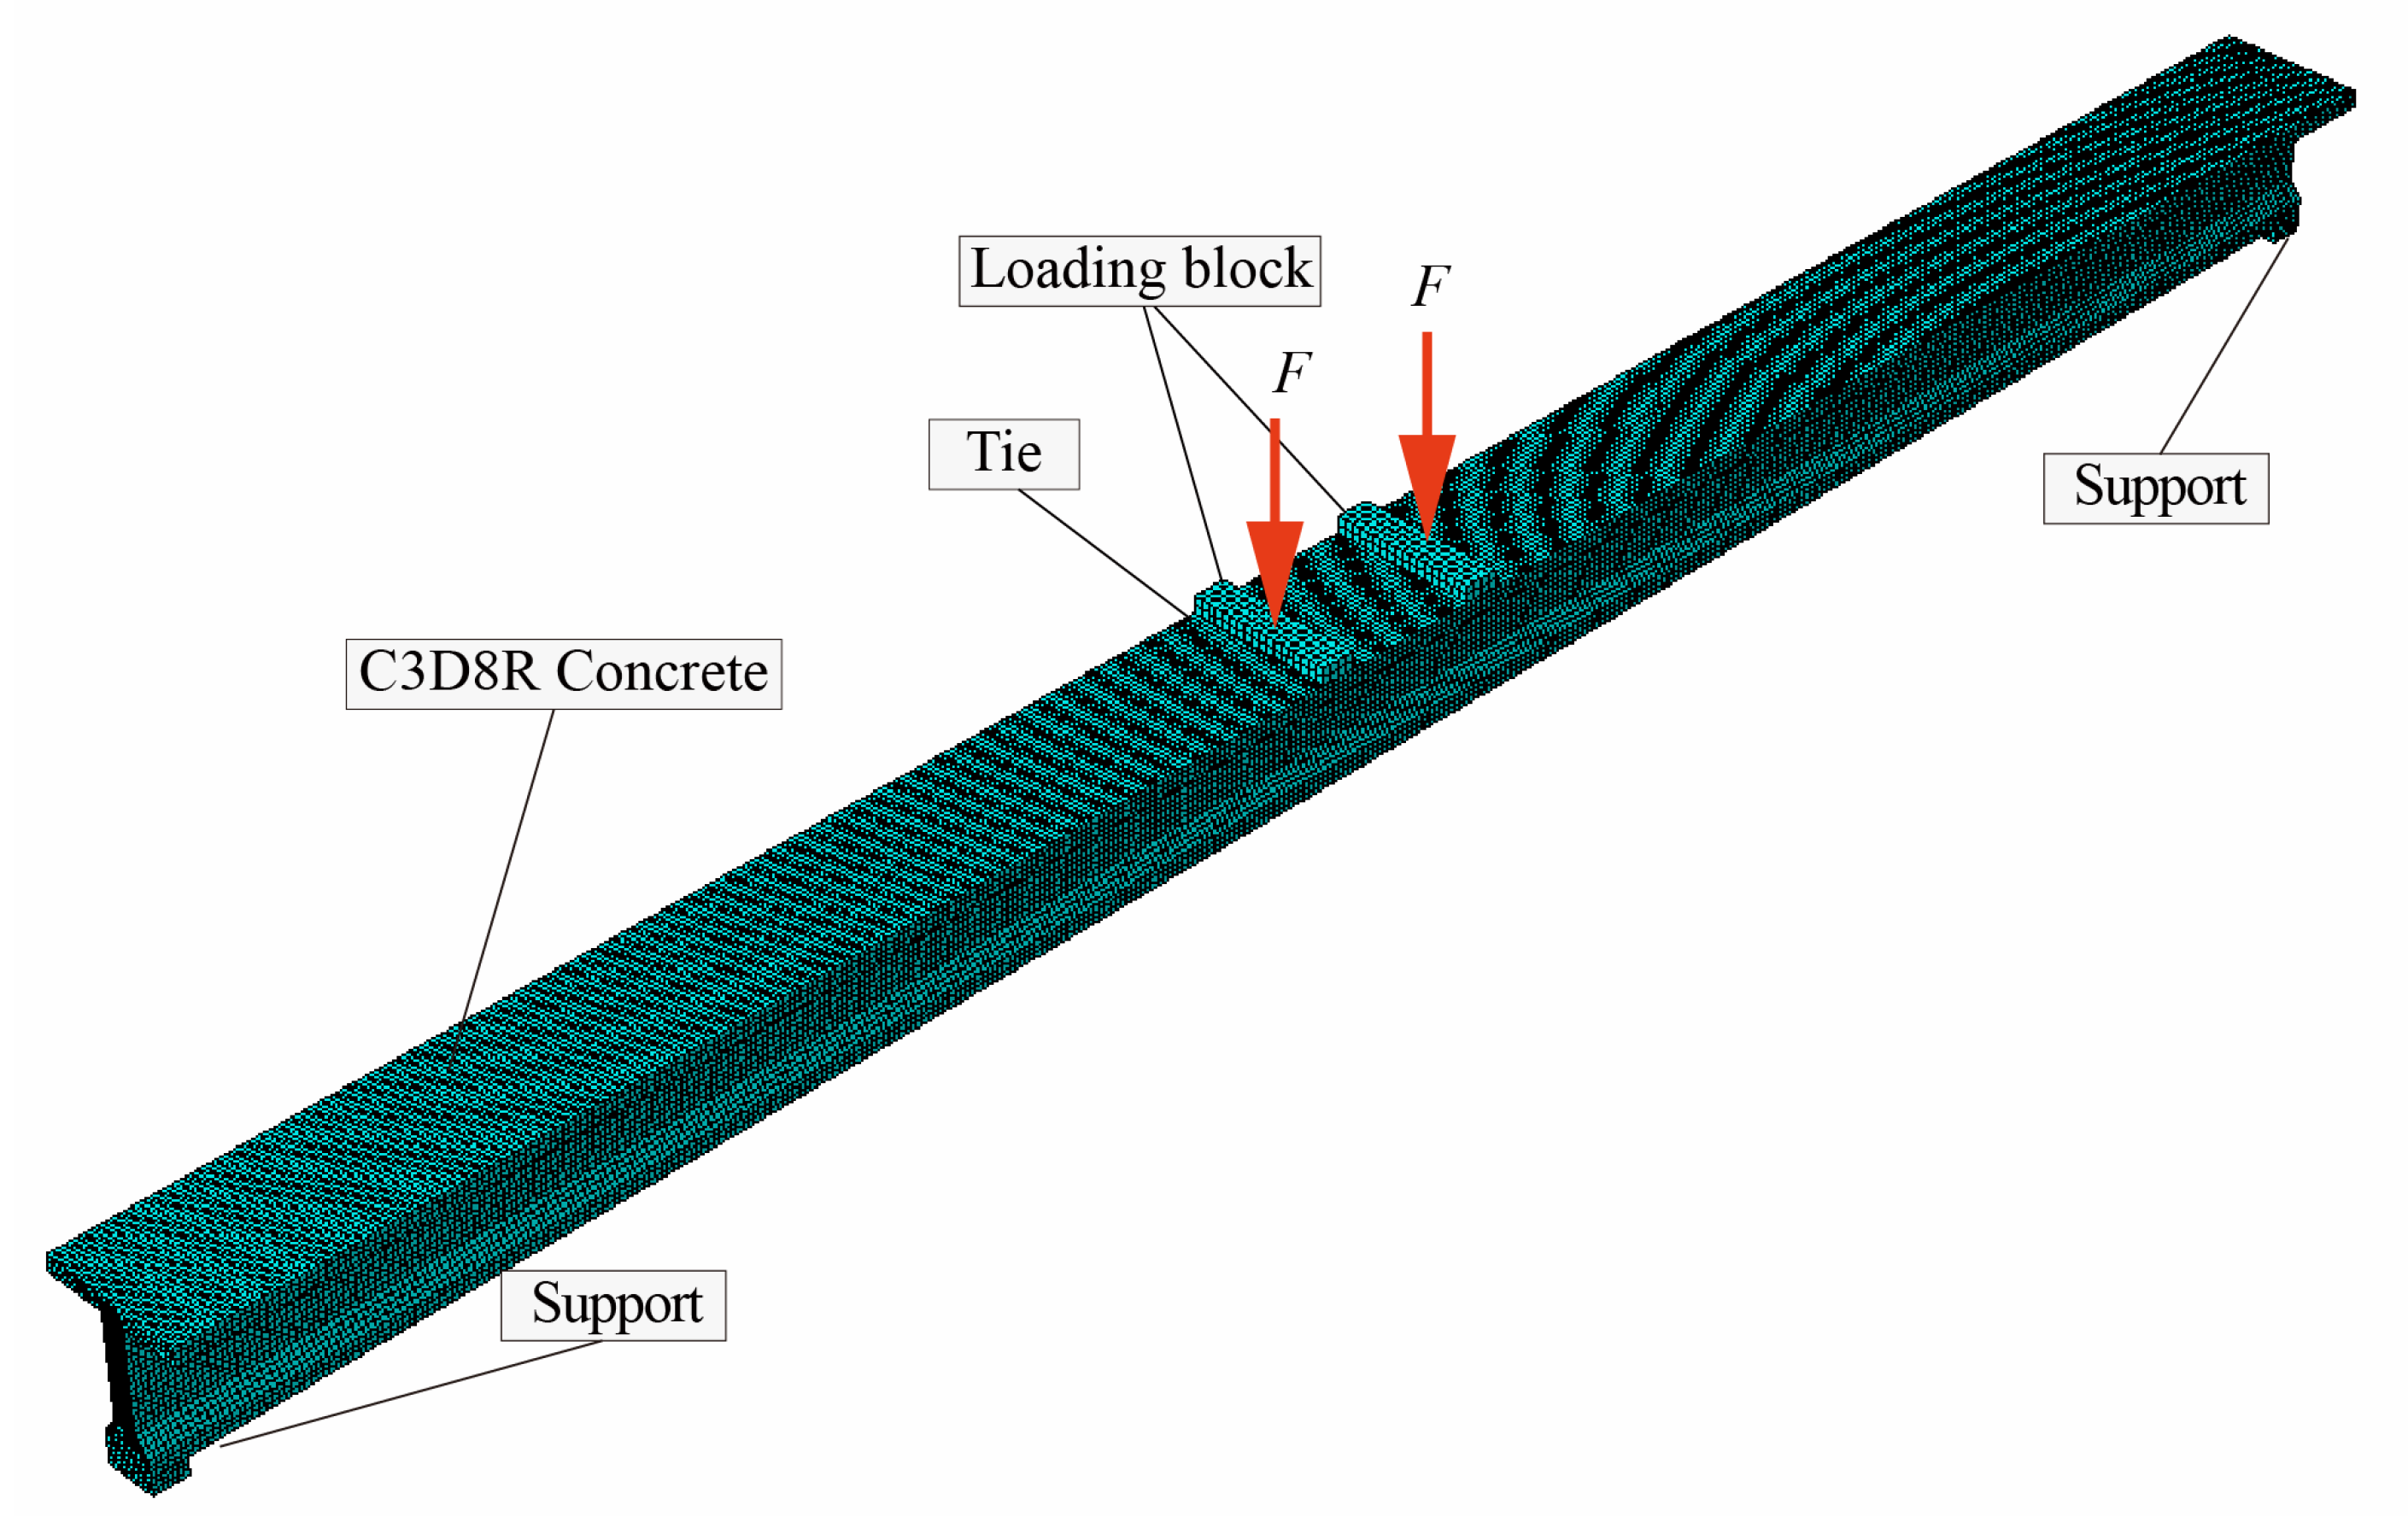
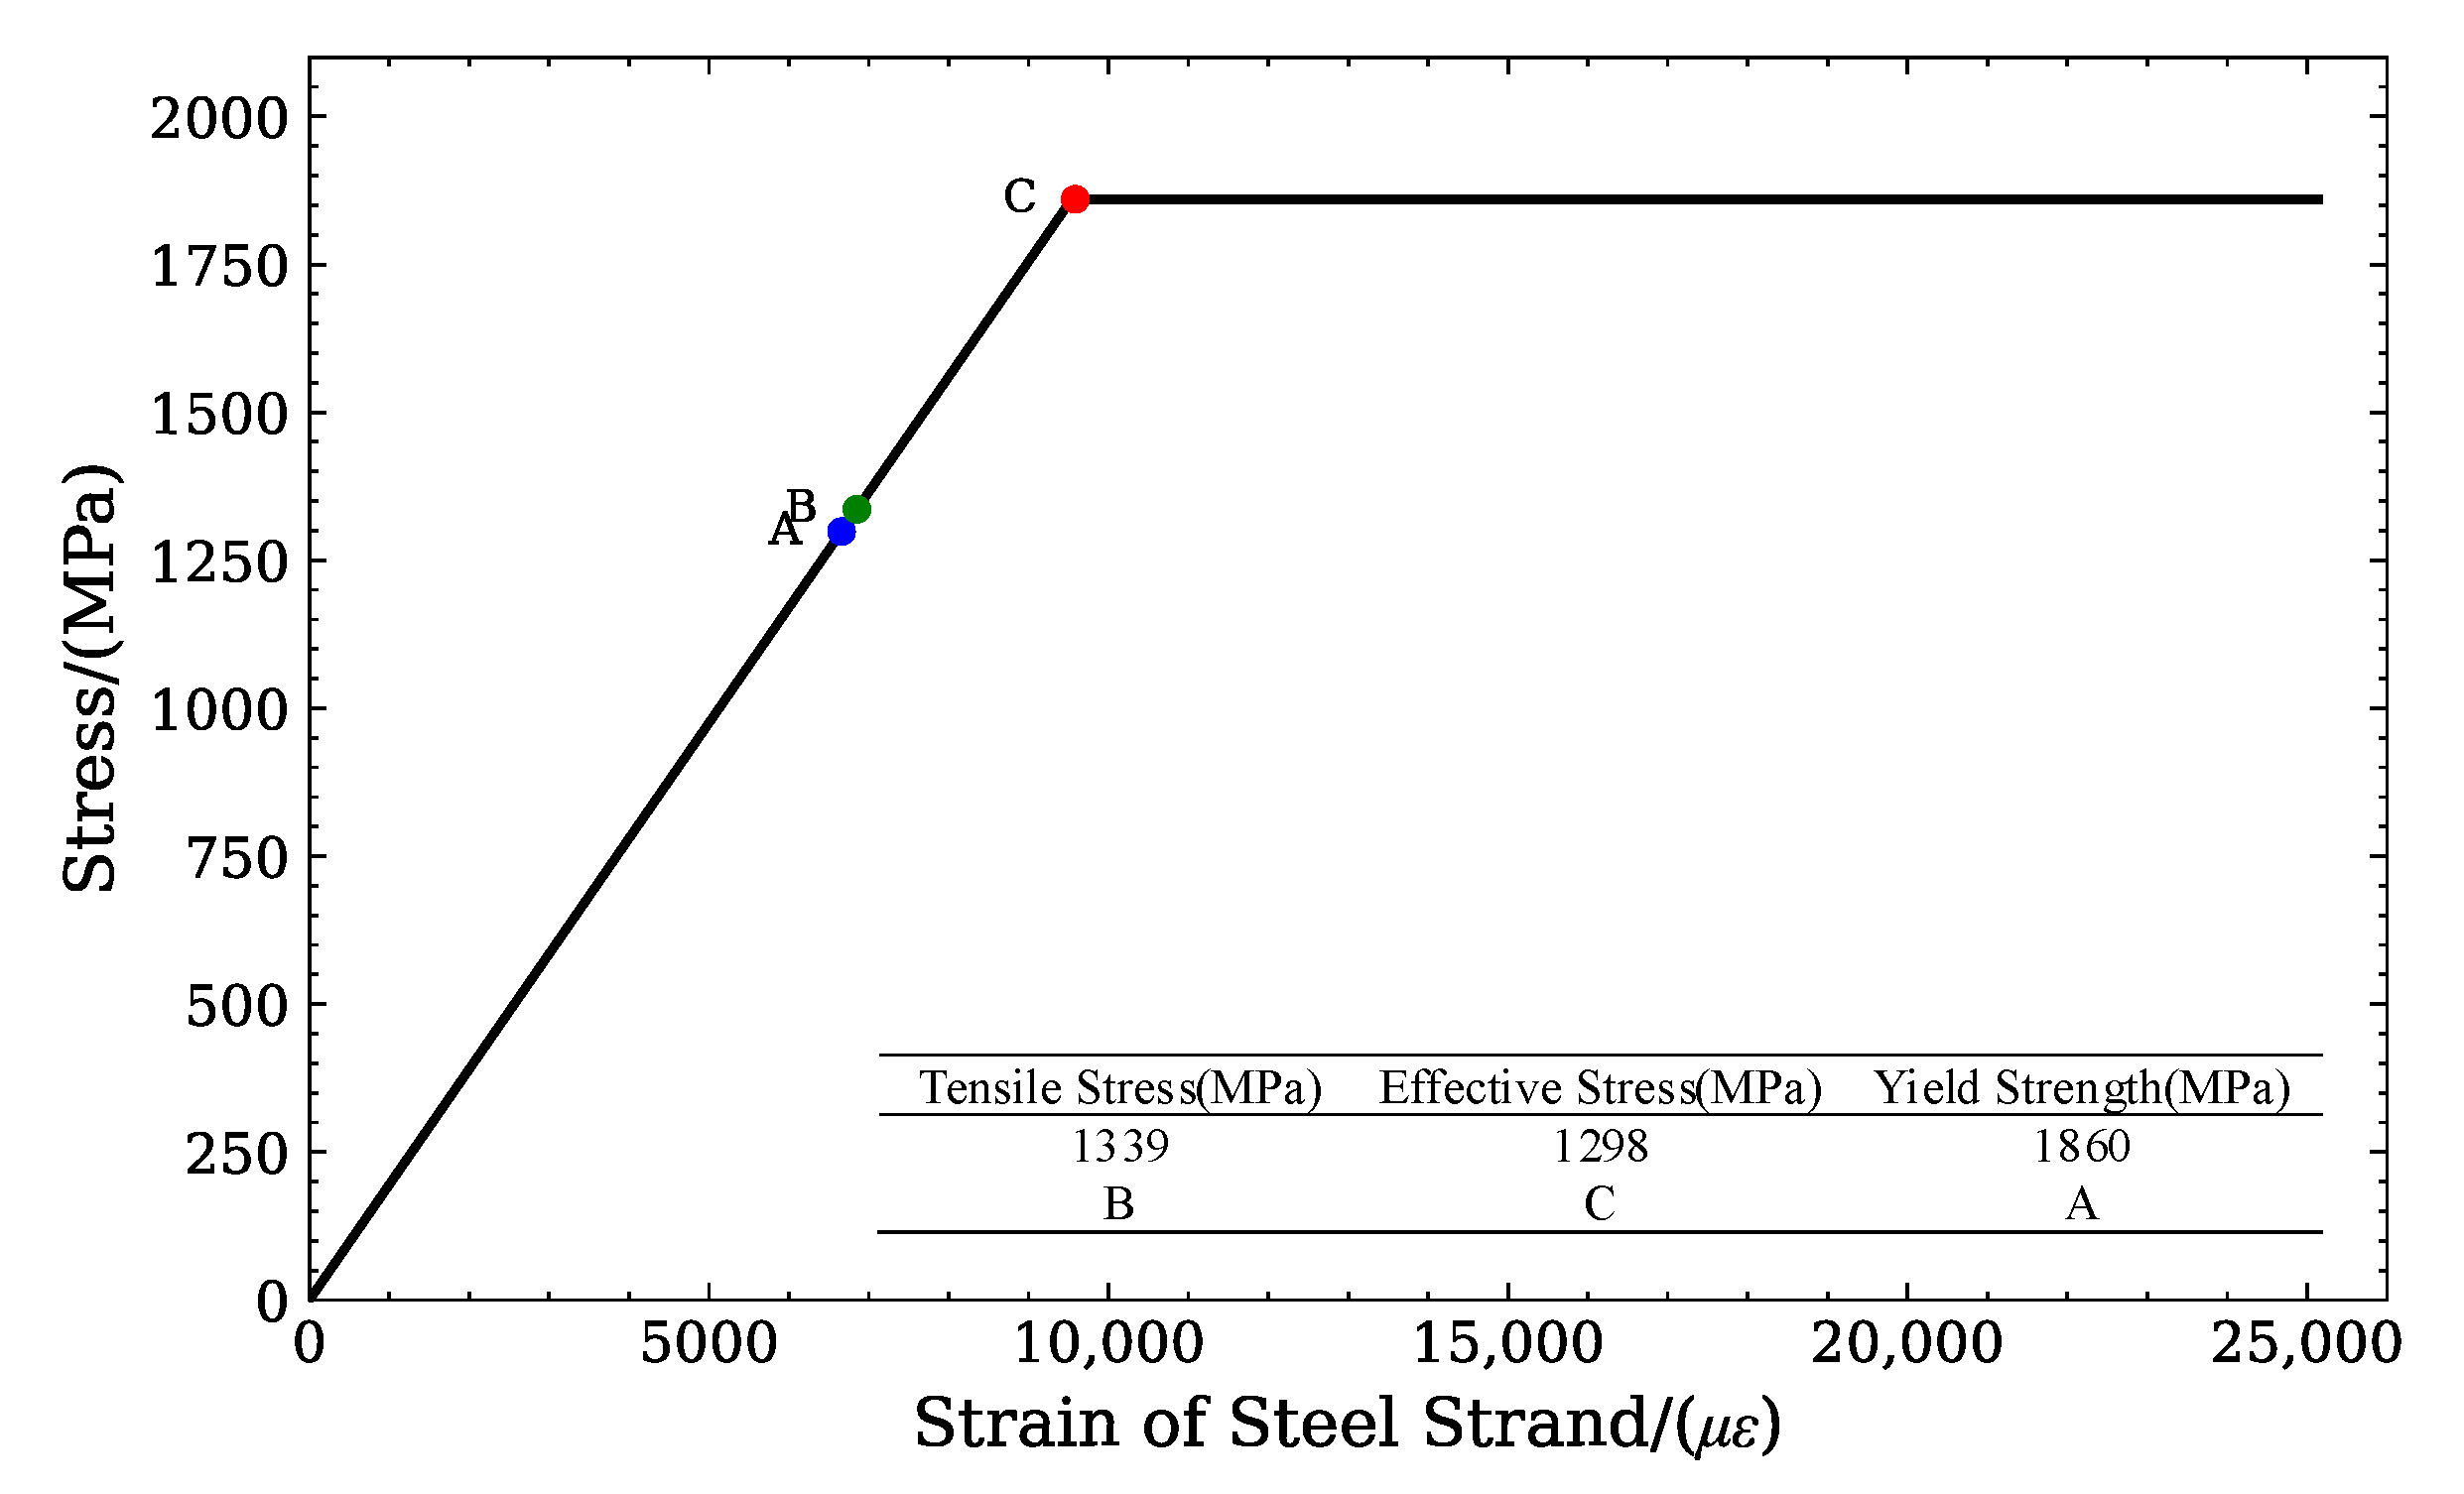
4.1. Material and Element

Concrete was simulated using the 3D solid element C3D8R with the Concrete Damage Plasticity (CDP) model [17]. The model decomposes the total strain ε into elastic ε e and plastic ε p components:
ε = ε e + ε p ε e = σ a E 0
where the σ a is the effective stress, and E 0 denotes the initial elastic stiffness tensor.
The total stress accounts for stiffness degradation through damage variables Dt (tensile) and Dc (compressive), expressed as follows:
σ = ( 1 D ) σ a D = 1 ( 1 D t   ) ( 1 D c   )
where D combines the effects of both tensile and compressive damage, with 0 < D < 1 representing the degradation degree.
The yield function of the CDP model is a modified version of the Barcelona model, incorporating the first stress invariant I1, second deviatoric invariant J2, and maximum principal stress σmax:
F ( σ , κ ) = 1 1 α [ α I 1 + 3 J 2 + β ( κ ) σ max ] c c ( κ ) 0
where α and β are material constants, and cc(κ) is the compressive cohesion controlled by the damage variable κ. The plastic flow rule follows a non-associative potential function Φ:
Φ = 2 J 2     + α p   I 1  
where αp governs the dilatancy angle ψ (set to 38° in this study). The plastic strain rate is given by the following:
ε ˙ p = λ ˙ σ a   Φ
where λ ˙ is the plastic consistency parameter.
Damage evolution in the model is defined based on fracture energy and plastic strain. For uniaxial tension/compression, the damage variable κ x ( x = t , c ) accumulates with plastic strain ε p :
κ x   =   1 g x   0 ε p   σ x   ( ε p ) d ε p
where g x = G x / l x combines the fracture energy G x and characteristic length l x . The stiffness recovery during crack closing is modeled via a parameter s ( σ a ) :
s ( σ a ) = s 0 + ( 1 s 0 ) r ( σ ^ )
with r ( σ ^ ) being a stress-weighted function and s 0 a constant (typically 0 s 0 1 ).
The ultimate compressive strength of concrete was determined using the average test value of 36.24 MPa. The ultimate tensile strength of 2.74 MPa and the elastic modulus of 35.5 GPa were adopted as specified in the relevant code [25]. Other parameters included Poisson’s ratio ν = 0.2, dilation angle ψ = 38°, and viscosity parameter µ = 0.005 [26].
Both non-prestressed steel reinforcements and prestressed strands were modeled using truss elements (T3D2) with ideal elastoplastic constitutive models [27]. For non-prestressed steel reinforcements, the constitutive model directly adopted the experimentally measured values in Table 1. It was assumed that the material exhibited linear elastic behavior up to the yield strength and then underwent perfectly plastic deformation with constant stress after reaching the yield point, without considering strain hardening. This approach ensured that the mechanical properties of ordinary steel bars, such as yield strength, ultimate strength, and elastic modulus, were all derived from actual test data to reflect the real mechanical behavior of the material accurately. Prestressed steel strands adopted an identical ideal elastoplastic framework, specifying a yield strength of 1860 MPa. This modeling approach ensured that both materials sustained constant stress beyond the yield point as strain increased, explicitly neglecting work-hardening effects under the von Mises yield criterion [28].

4.2. Boundary Conditions and Interactions

Steel reinforcements and prestressed steel strands were embedded in concrete elements using the Embedded function to model the bond behavior between steel and concrete. As demonstrated in Figure 13, rigid blocks with Tie constraints were assigned at support and loading positions to replicate experimental conditions. The simply-supported boundary was simulated by restraining degrees of freedom (U1, U2) for the two support rigid pads and (U1, U2, U3) for the loading rigid pad, ensuring kinematic compatibility with the test setup [29].

4.3. Prestressing Force Simulation

The initial prestress of the concrete T-beam was achieved by controlling the temperature field around steel tendon elements. A specific analysis step for prestress application was integrated into the simulation, as detailed in the following equation:
Δ T = f c o n E s α
where ΔT represents the temperature difference; fcon is the initial prestress value; Es is the elastic modulus of prestressed steel strand; and α is the thermal expansion coefficient of the prestressed steel strand.
The initial stress state of the beam’s concrete after applying prestress and self-weight is shown in Figure 14. The beam formed a camber, and the camber’s maximum deflection reached 15.66 mm.

4.4. Numerical Results and Validations

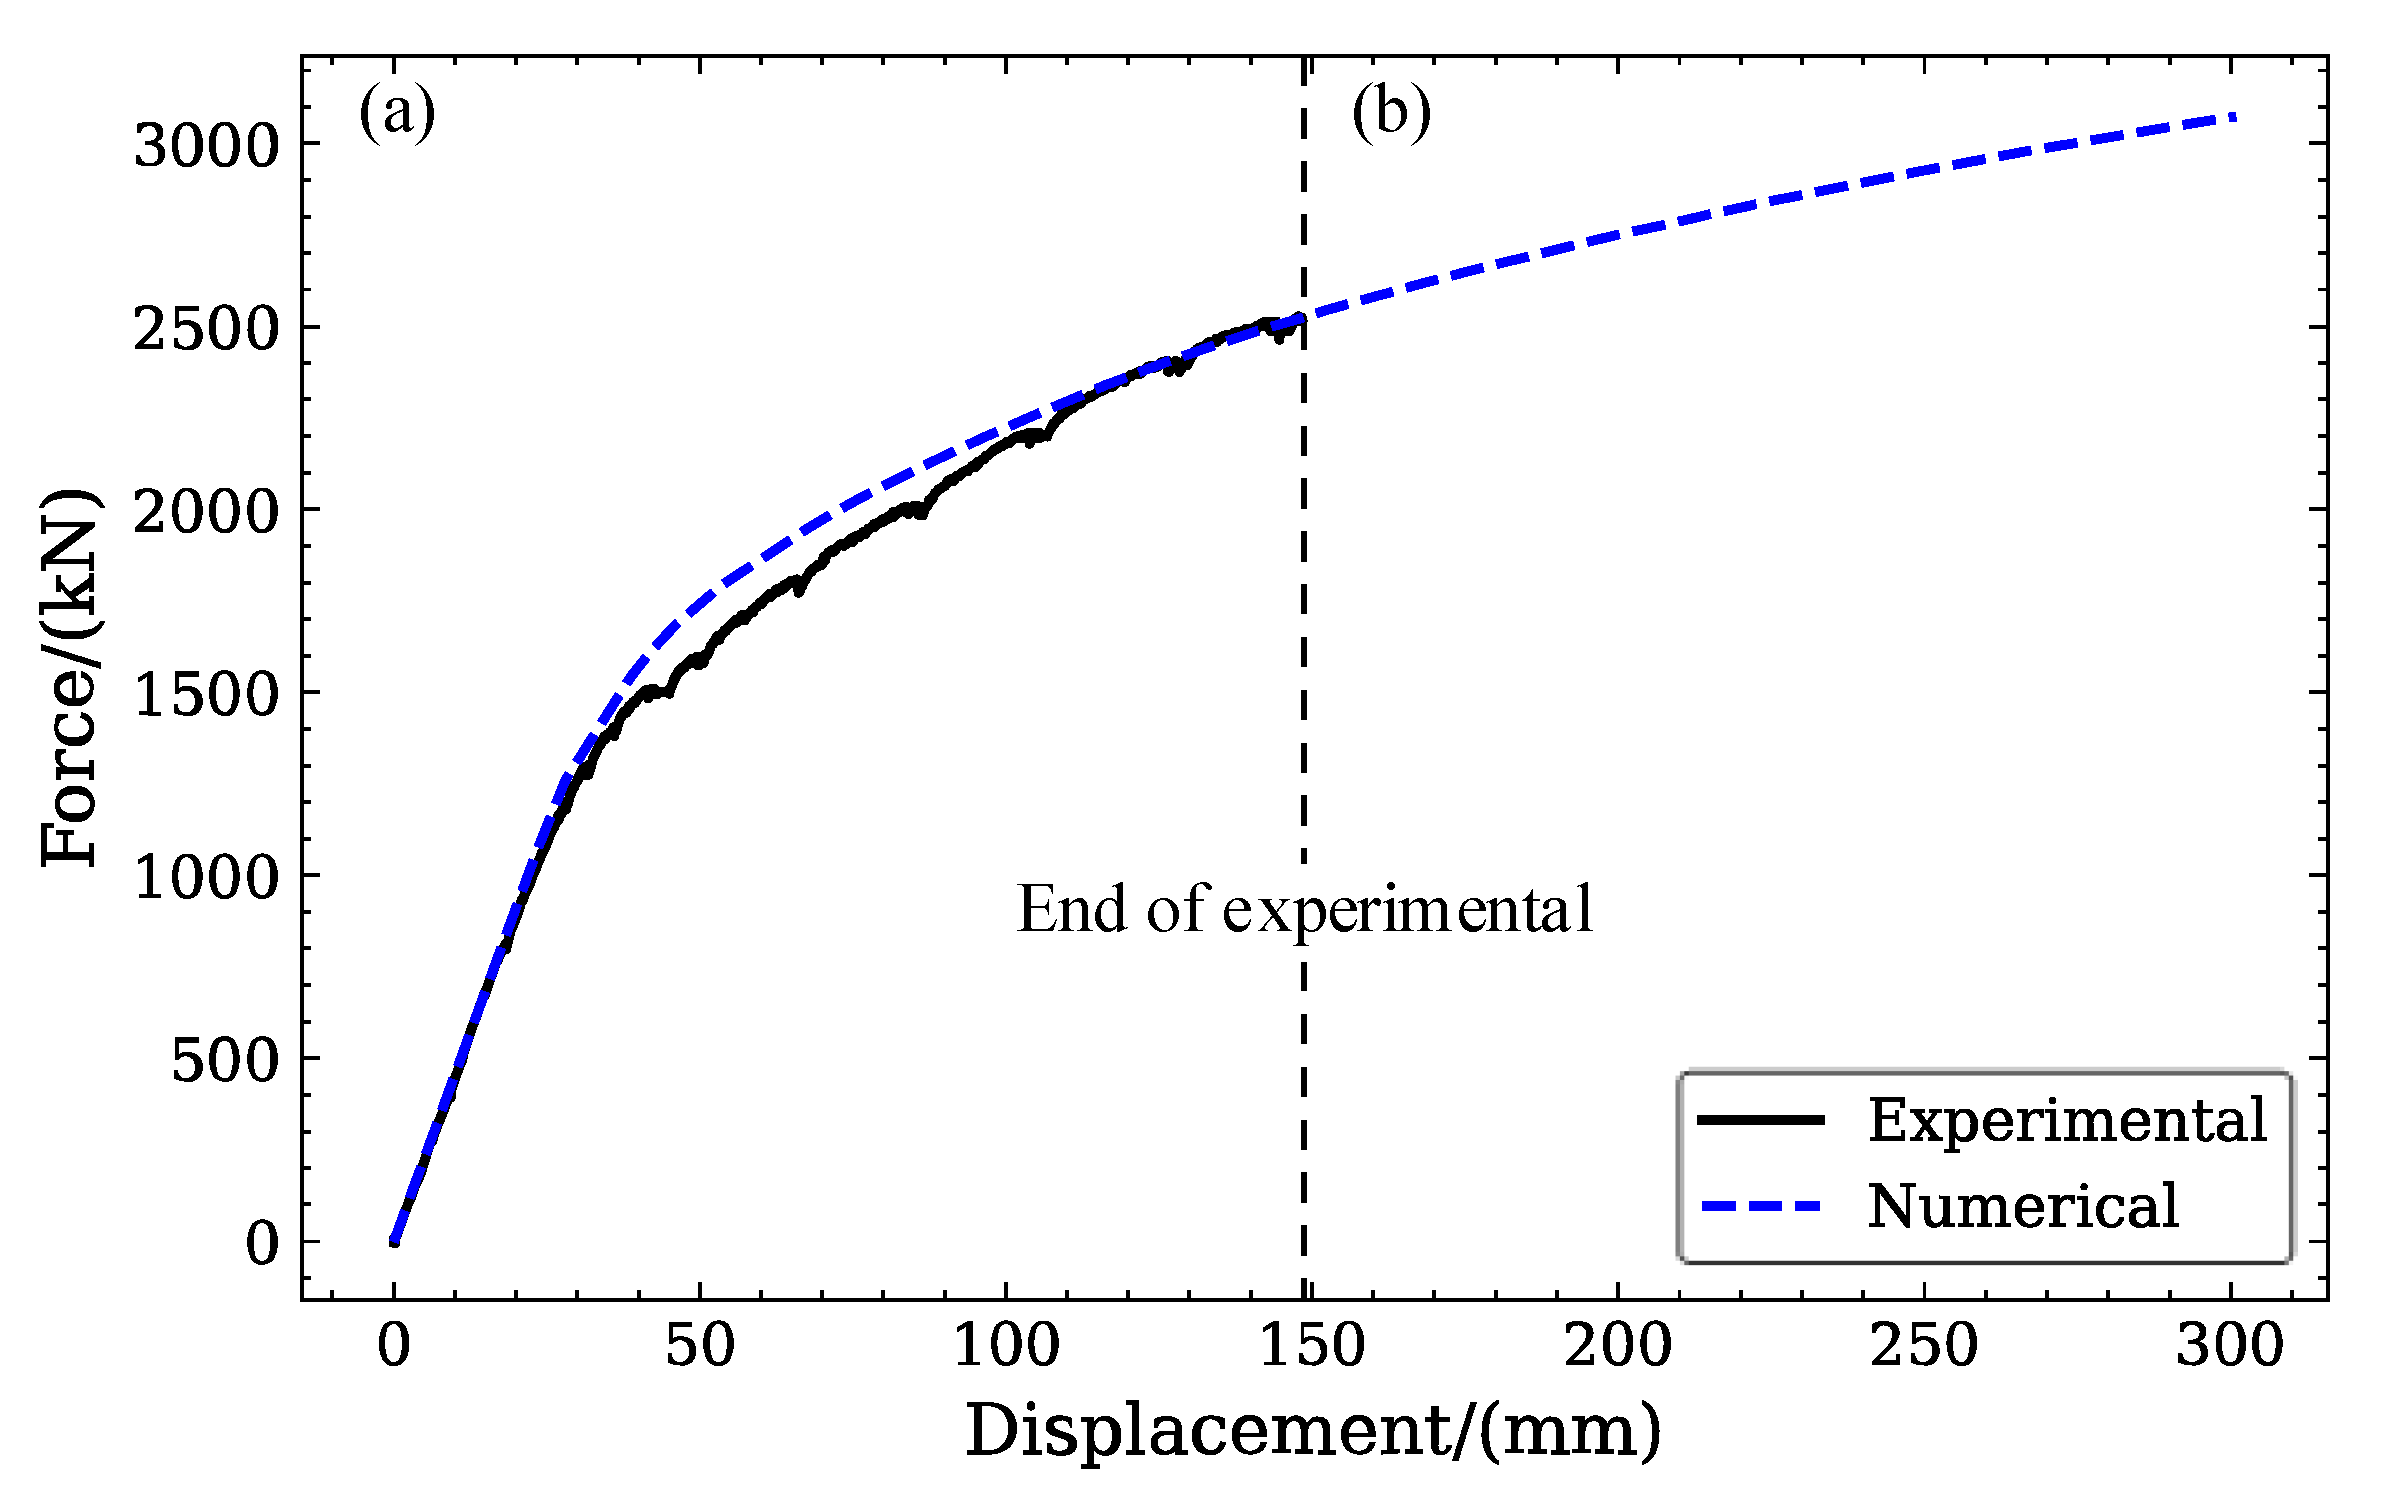
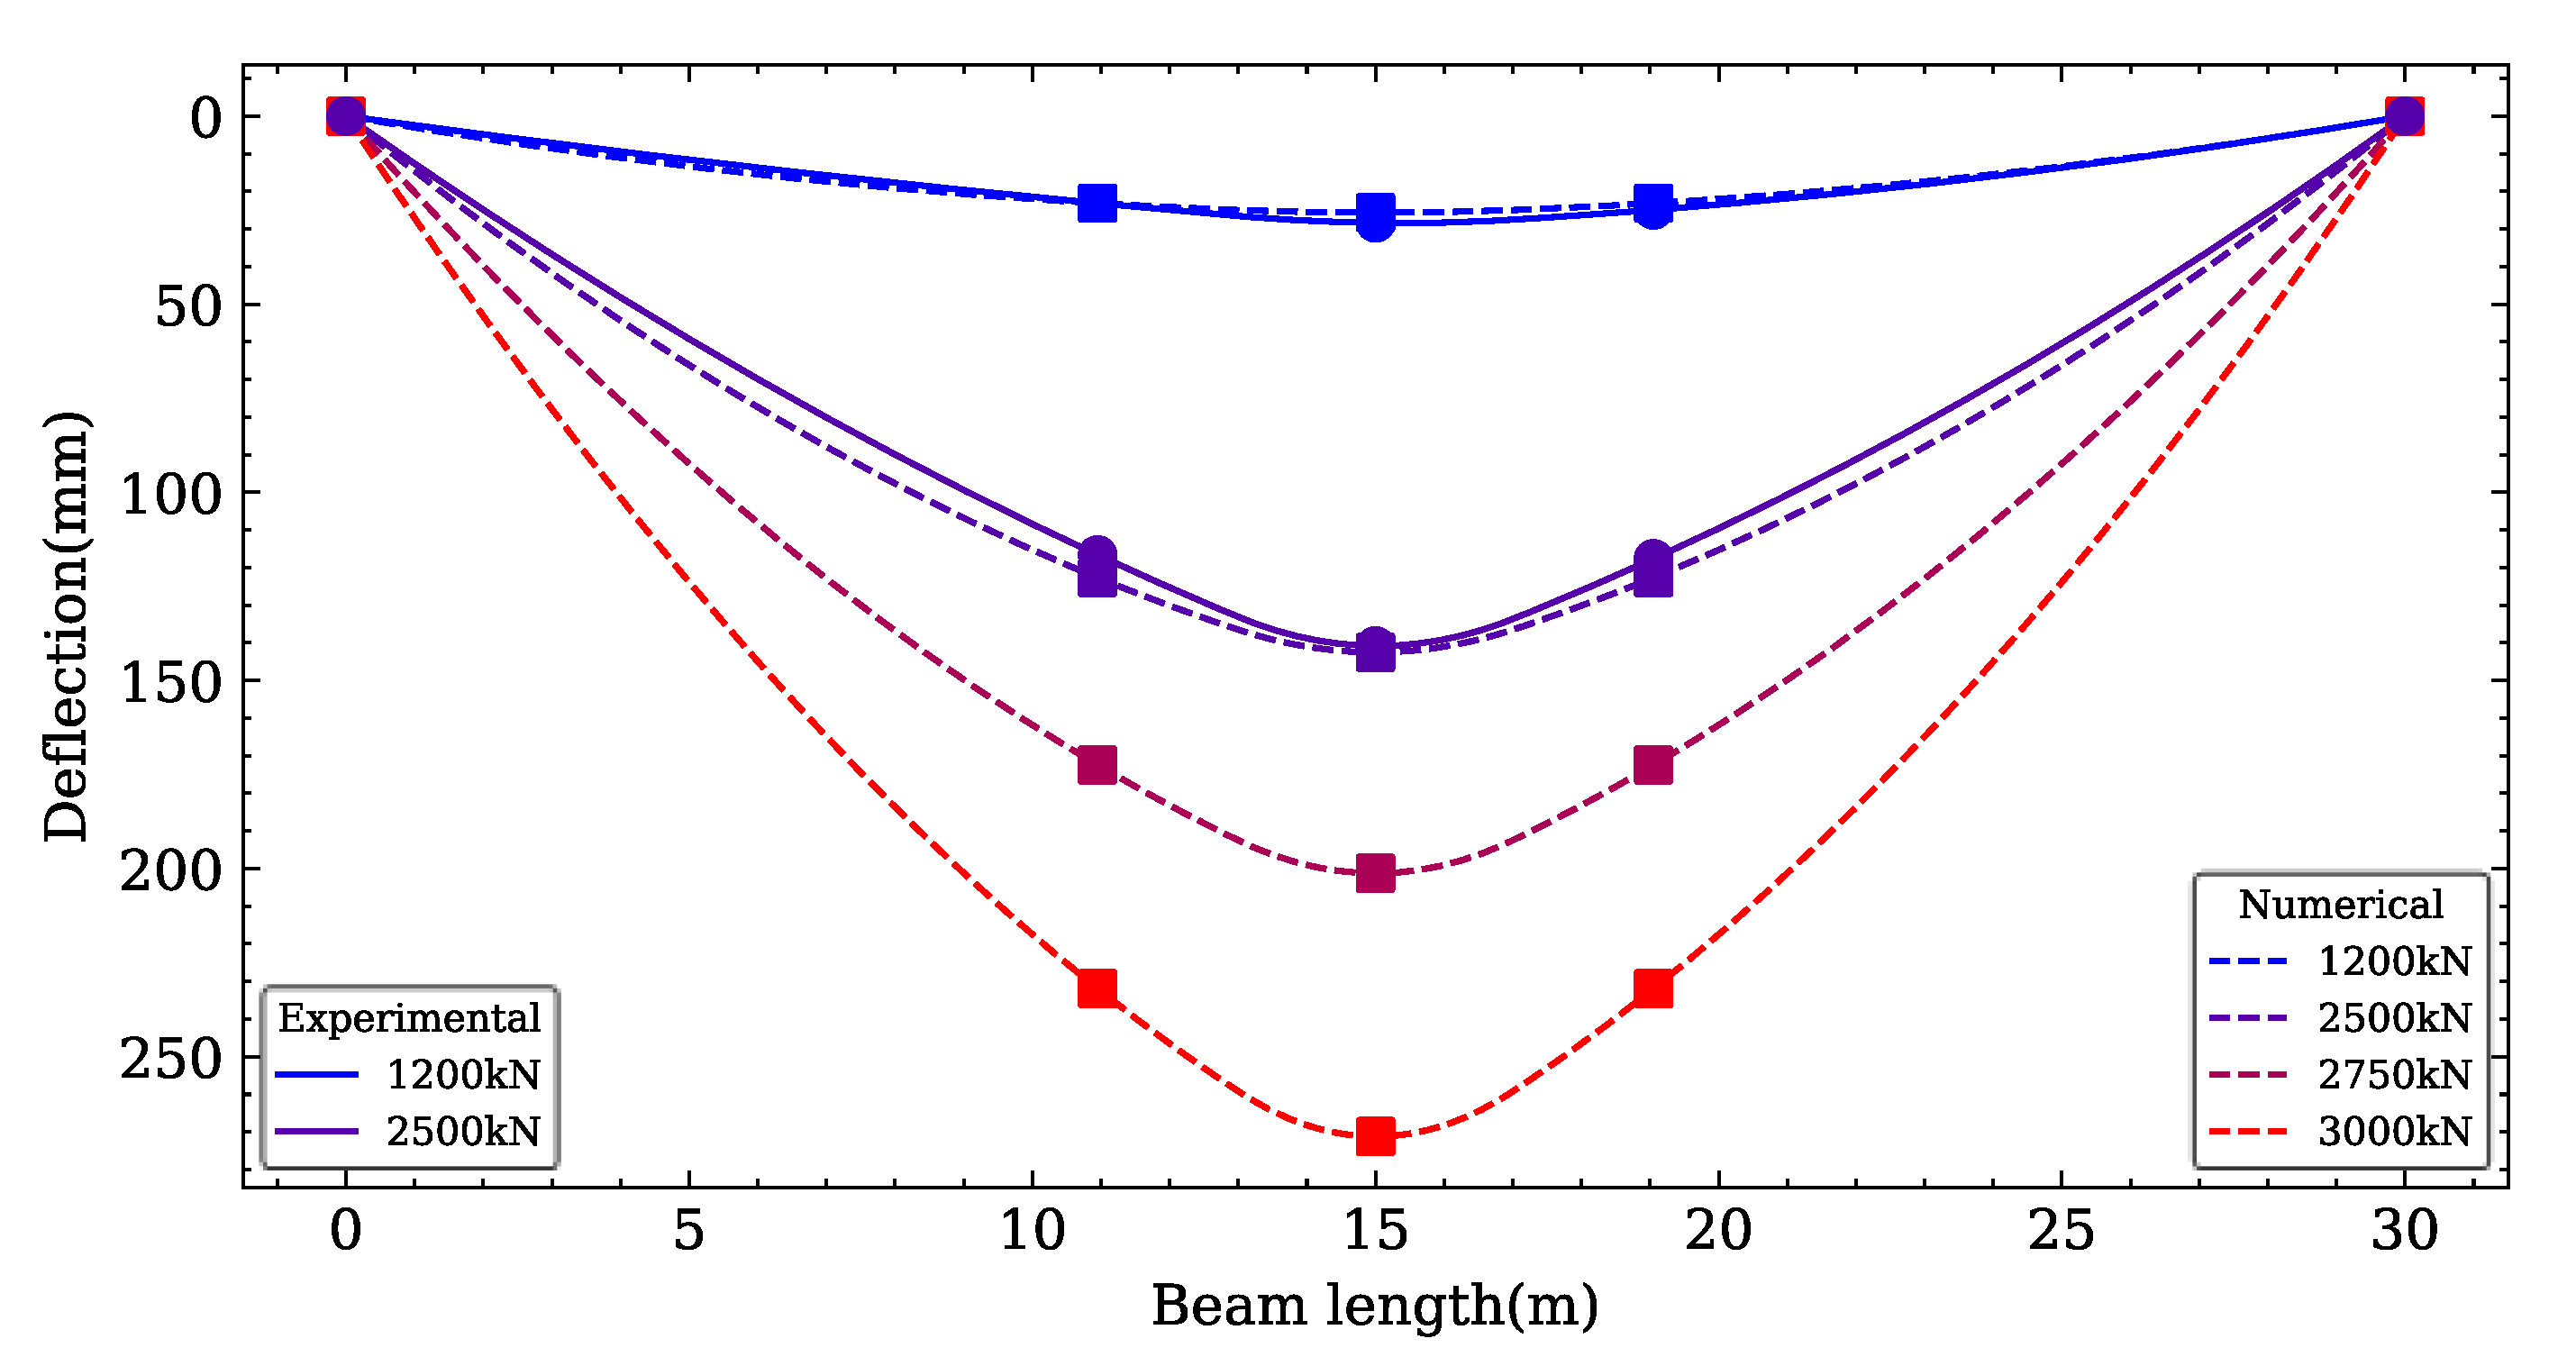
4.4.1. Load-Deflection Relationship

The mid-span load-deflection curves from numerical simulation are compared with experimental ones in Figure 15a. The measured cracking load in experiments was 1205 kN, and the simulation gave 1284 kN, with good agreement. When the specimen was loaded to steel yielding, the test load reached 2505 kN, versus 2539 kN from simulation. Discrepancies for cracking and yielding loads were both within 10%, and the load-deflection curves matched. This model effectively simulated mechanical behavior in the linear stage and at steel yielding.
Given the consistency between simulation and experimental results, an extra load was applied to the beam’s finite-element model until mid-span deflection hit 1/100 of the span. The load-deflection along the beam length was shown in Figure 16. As in Figure 15b, at 3084.94 kN load, mid-span deflection reached 300 mm (near 1/100 of the span). As loading proceeded, beam deformation accelerated, yet bearing capacity kept rising, showing the tested T-beam’s favorable ductility.

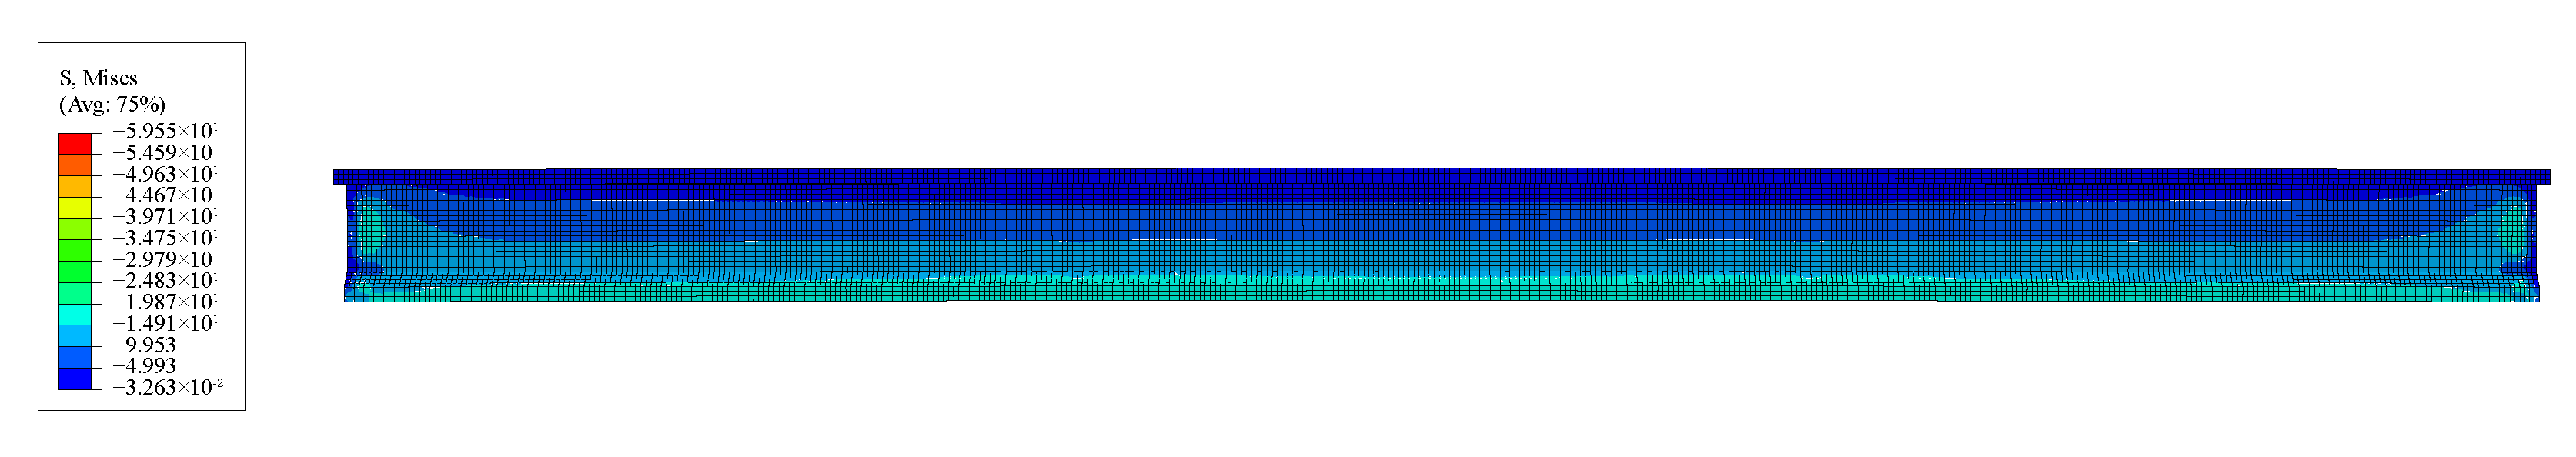
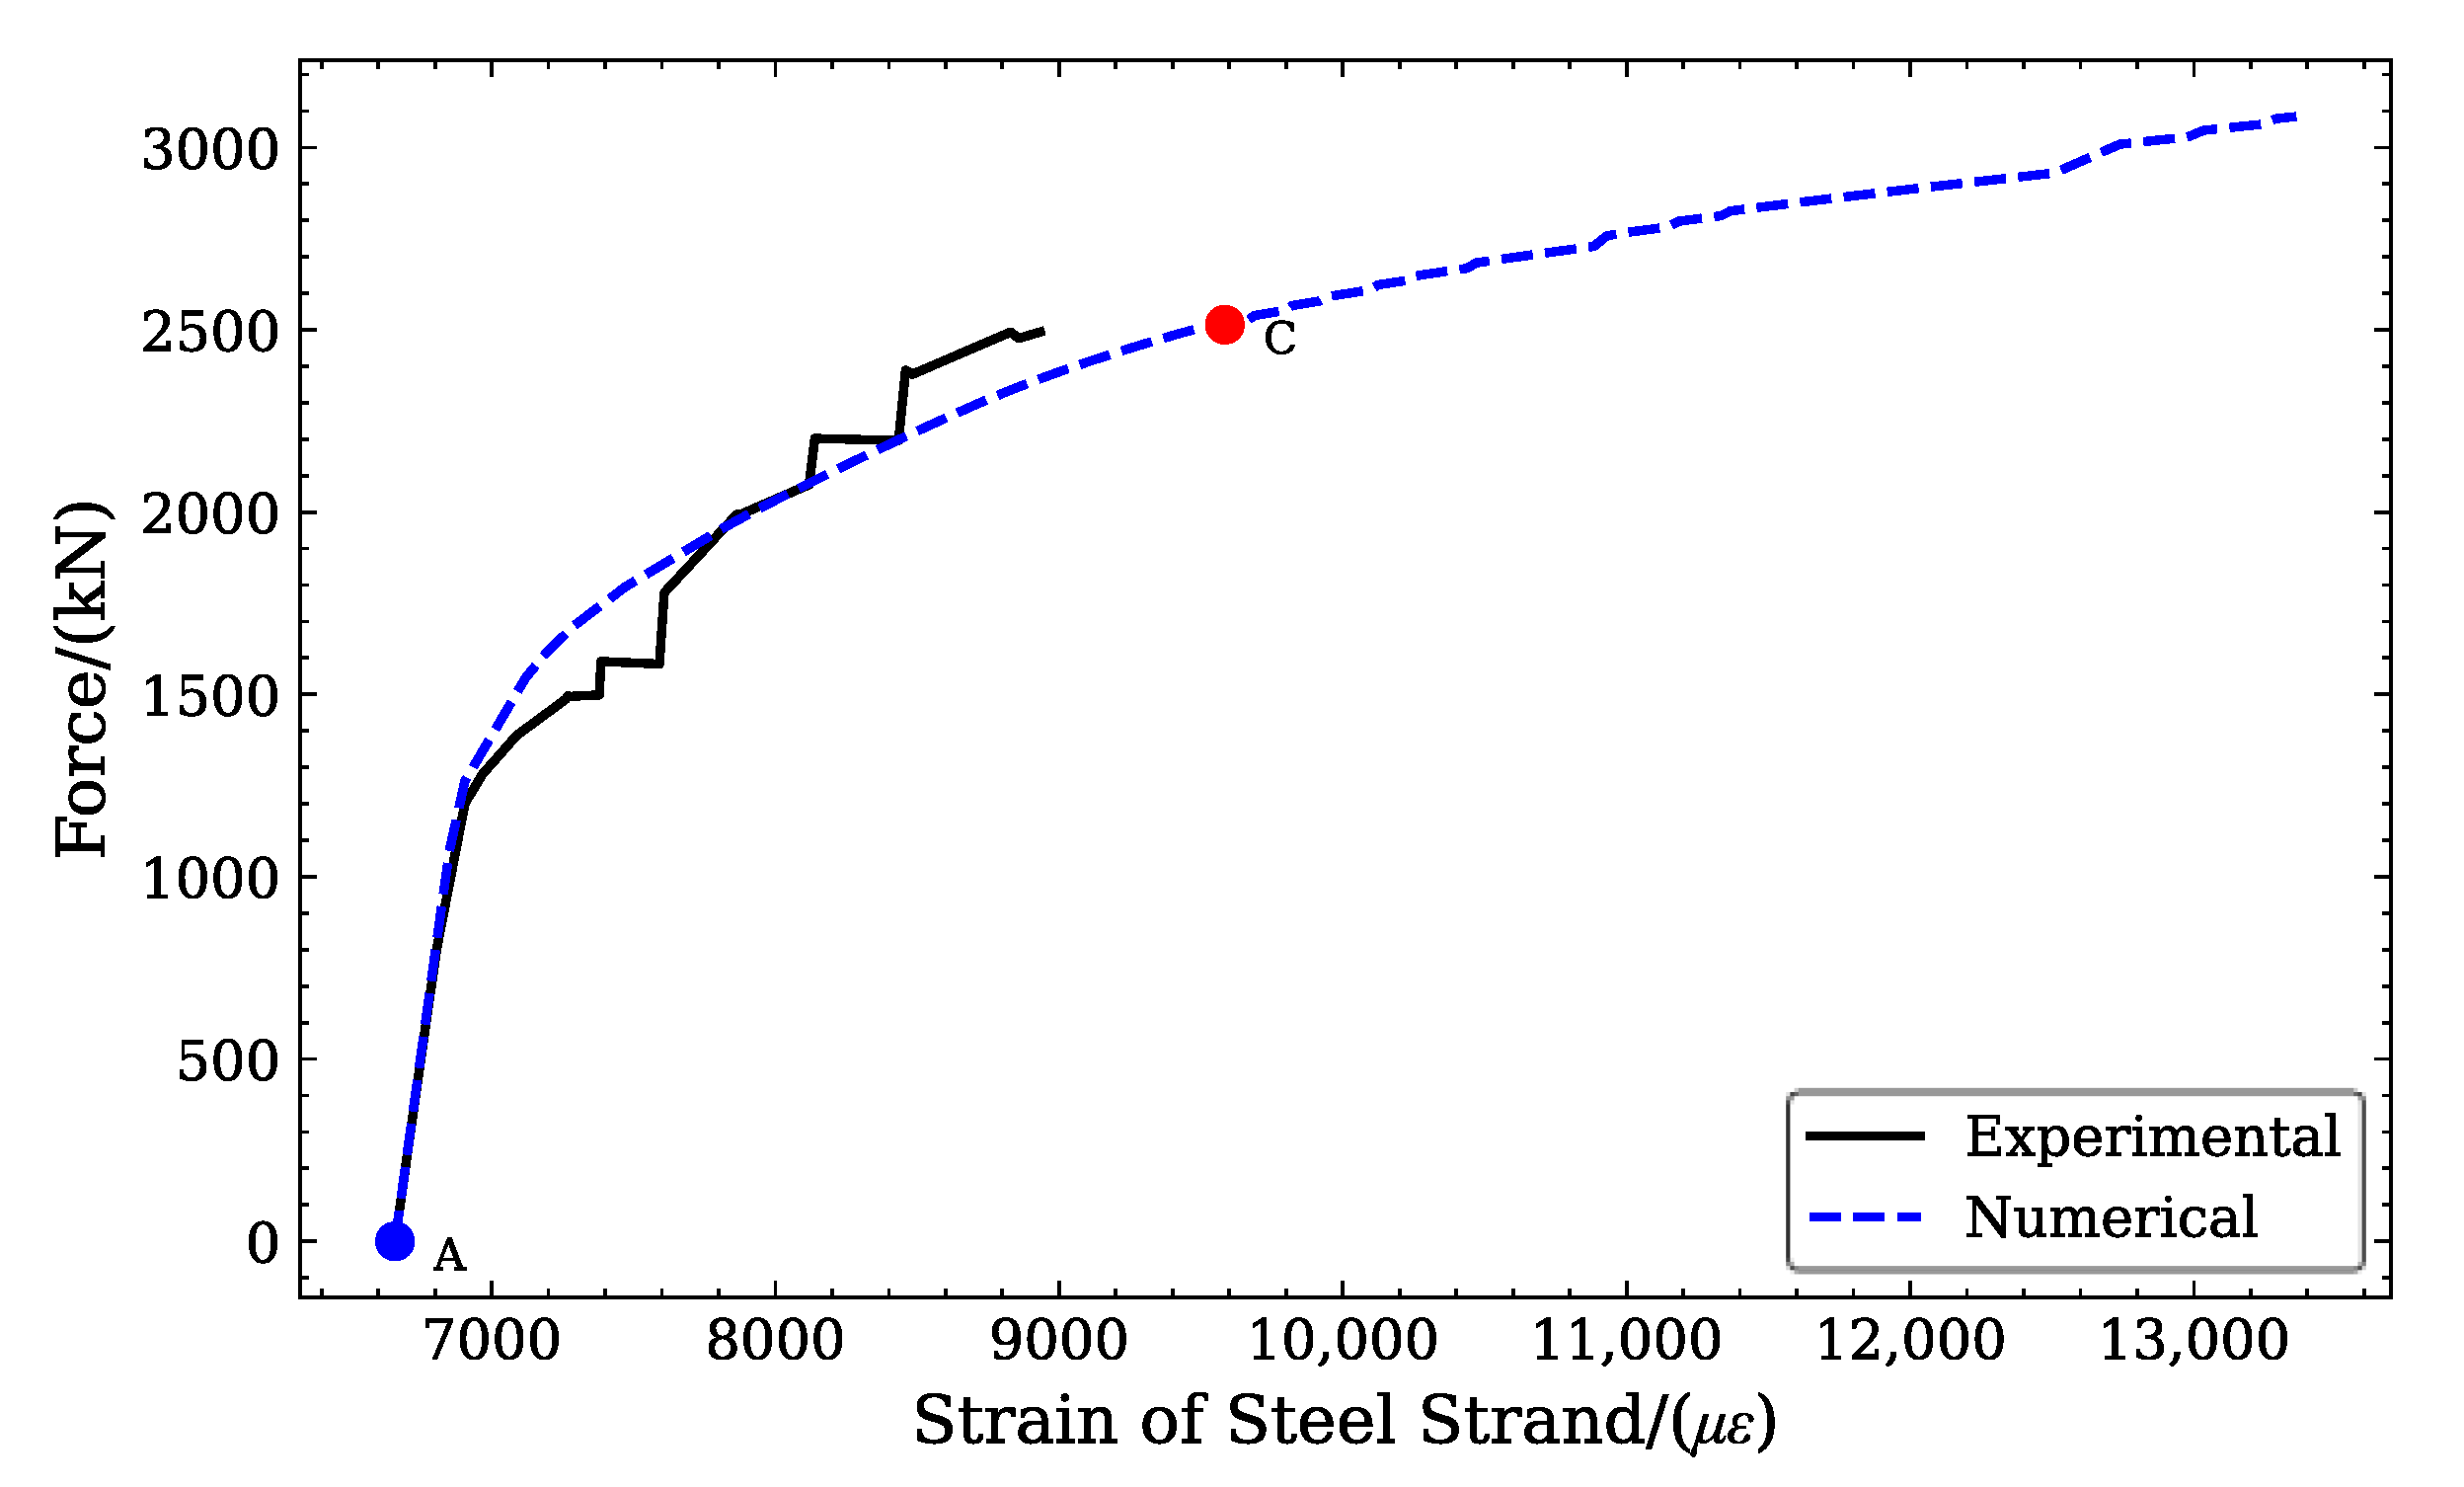
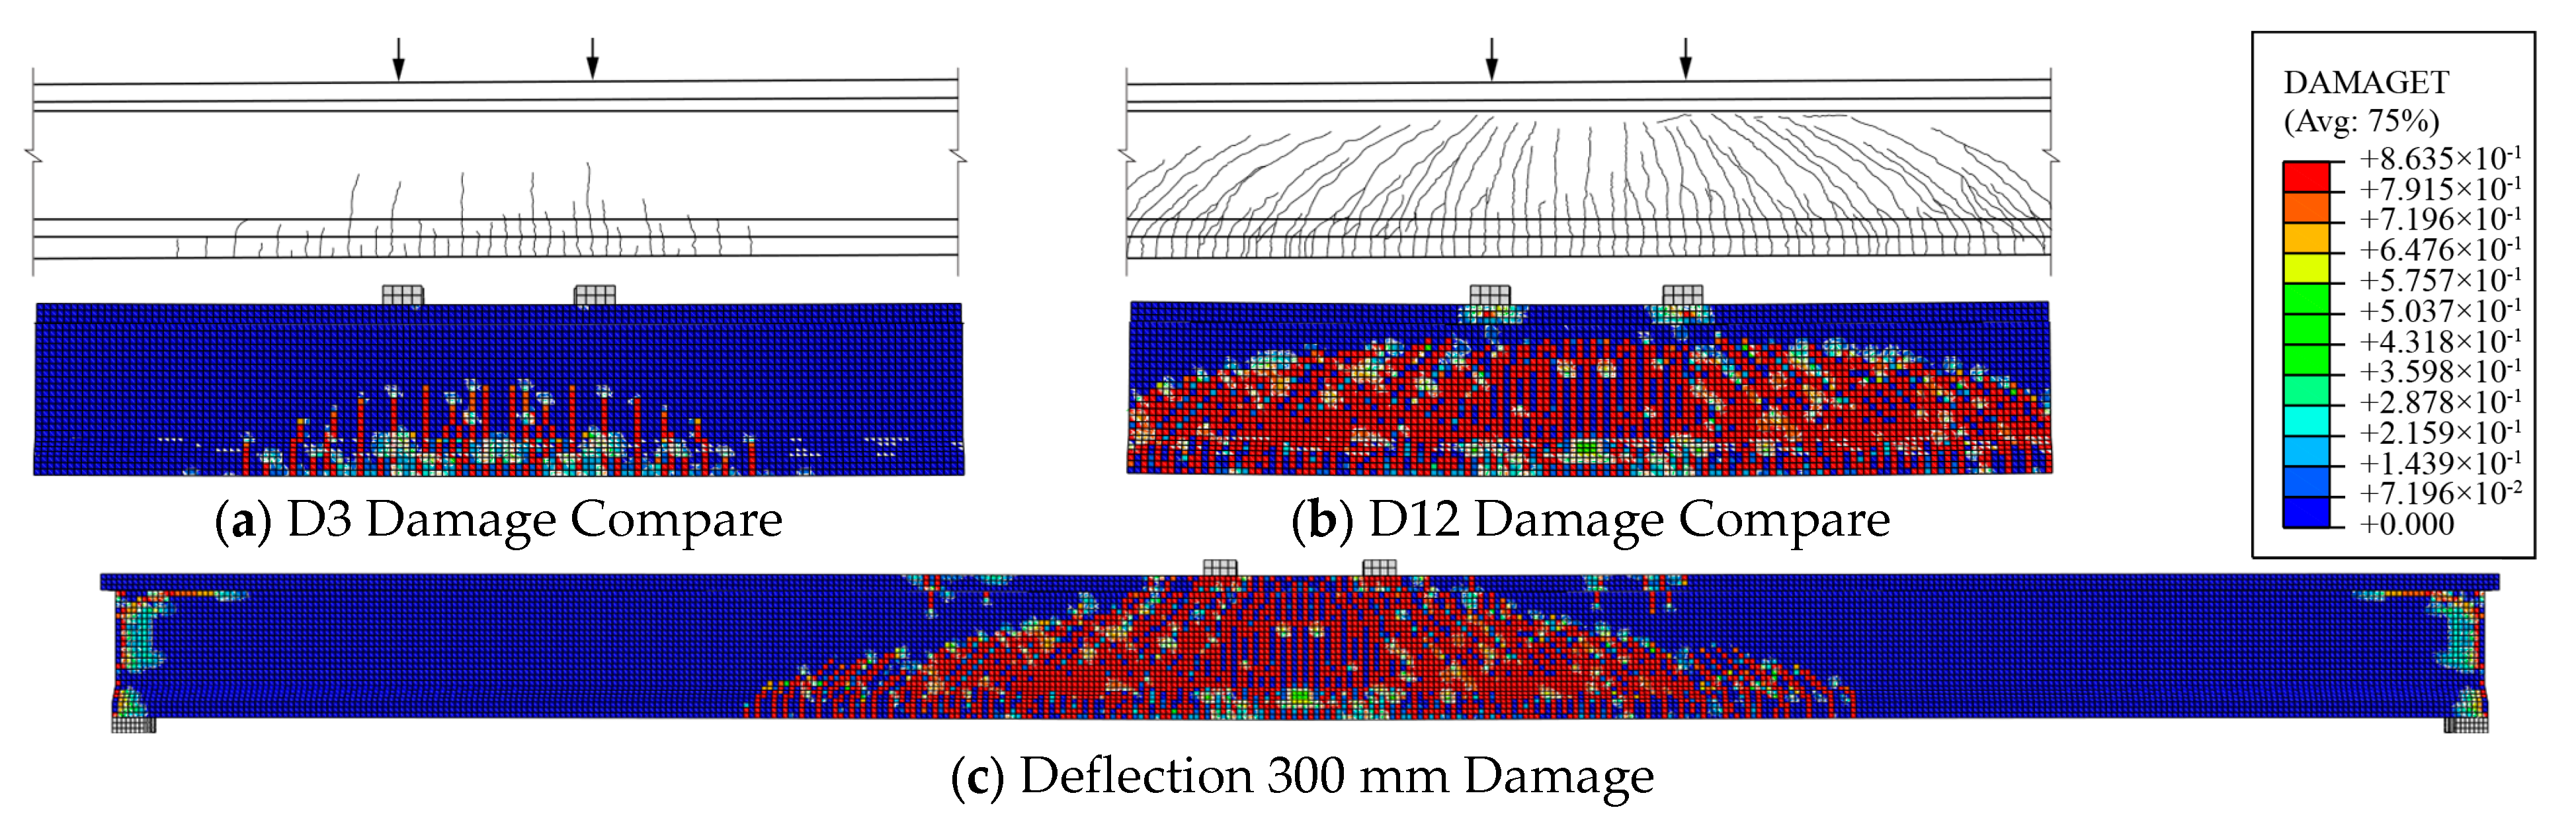
4.4.2. Strain and Damage

The tensile prestress of the steel strand (Point B on Figure 17) was applied to the concrete by setting ΔT to 572.22 °C during the first loading step. During this process, prestress losses occurred due to the elastic shortening of the concrete. On the stress–strain relationship of prestressed steel strand, the prestress of the steel strand (a loss of 40.47 MPa) decreased from Point B to Point C.
In the second loading step, loads were applied at the rigid blocks located in mid-span. On the stress–strain curve, the stress of the steel strand moved from Point B towards Point A. When the stress reached the Yield Strength (This was set for simplifying calculations, and it was not the real Yield Strength) at Point A, the applied load was 2523.81 kN. Figure 18 showed the comparison between the numerical and experimental results of the force-strain relationship for the steel strand. The overall trends were similar. When the strain increment of the steel strand reached 2300 με, the experimental load was 2476.79 kN, whereas the numerical simulation yielded a load of 2331.39 kN. This suggested that the numerical model could characterize the mechanical behavior of steel strands under loading to a certain extent, yet notable discrepancies persisted. These deviations were attributed to the frictional resistance at the deflector position during the experimental tensioning of the steel strands, which introduced a reduction in the initial stress of the strands and consequently resulted in a greater reserve of remaining strength compared to the temperature-reduction method adopted in the numerical simulation.
Figure 19a,b displayed the comparison of concrete damage patterns between the experiment and the numerical simulation under the D3 and the D12 loading stages. The degree of damage to concrete was indicated by a scalar value. A value of 0 means the concrete is intact, while 1 represents complete damage. Figure 19c illustrated the crack pattern at a mid-span deflection of 300 mm, where the compressive plastic strain in the top flange at mid-span reached 0.0016, approaching the crushing state.
As was evident from the figures, the orange-red area, where the damage value exceeded 0.8, corresponded to a high level of damage [30]. This area aligned well with the longitudinal and vertical crack distributions observed in the experiment. This consistency validated that the numerical model was capable of precisely simulating the crack propagation of the prestressed T-beam under external loads.

5. Conclusions

In this paper, a full-scale flexural performance test and numerical simulation were carried out on a novel pre-tensioned, prestressed concrete T-beam featuring polygonal tendons. The following conclusions were obtained:
  • The 30 m pre-tensioned, prestressed concrete T-beam in this research demonstrated outstanding flexural performance in terms of stiffness, crack resistance, and load-carrying capacity. During the serviceability phase, the measured mid-span deflection of the beam was notably smaller than the allowable value specified in codes. Visible cracks initiated when the load induced a mid-span calculated cross-sectional bending moment of 7916.85 kN·m, demonstrating excellent cracking resistance. The positive cross-section bending capacity at steel reinforcement yielding exceeded the theoretical design value, and the failure mode aligned with the flexural failure characteristics of the member.
  • Before reaching the cracking moment, the test beam remained in an elastic deformation state. The secant stiffness stayed relatively constant, with a linear correlation between load and deflection. As the load approached the cracking moment, secant stiffness began to gradually decline, and the load-deflection curve exhibited nonlinear changes. When the load reached the steel reinforcement yielding point, secant stiffness was 2.84 × 10¹⁶ N·mm2, and the slope of the load-deflection curve dropped sharply.
  • After loading the beam until steel reinforcement yielded and then unloading, most deflection could be recovered, leaving only a residual deflection of 10.68 mm. This benefited in maintaining structural performance after occasional overloading and subsequent structural utilization.
  • Numerical simulation results indicated that the finite element model developed in this paper effectively simulated the flexural mechanical properties of the experimental T-beam. It also verified that the pre-tensioned, prestressed concrete T-beam with polygonal tendons designed in this research possessed favorable ductility.

Author Contributions

Conceptualization, M.W. and H.Y.; Methodology, B.Y. and D.-H.Y.; Validation, H.P. and J.T.; Formal analysis, B.Y.; Investigation, B.Y.; Resources, G.L.; Data curation, B.Y.; Writing—original draft, B.Y.; Writing—review and editing, D.-H.Y. and Y.X.; Supervision, C.Z.; Project administration, H.P.; Funding acquisition, G.L. All authors have read and agreed to the published version of the manuscript.

Funding

This research was supported by the Jiangxi Provincial Department of Transportation Science and Technology Project, China (Grant No. 2024ZG001).

Data Availability Statement

The data presented in this study are shown in the paper.

Conflicts of Interest

Authors Chunlei Zhang, Hai Yan and Mingguang Wei are employed by the Shanghai Municipal Engineering Design Institute (Group) Co., Ltd. Authors Jinglin Tao and Huiteng Pei are employed by the Jiangxi Gan Yue Expressway Co., Ltd. Author Jinglin Tao is employed by the Jiangxi Communications Investment Group Co., Ltd. Author Huiteng Pei is employed by the Jiangxi Communications Design and Research Institute Co., Ltd. The remaining authors declare that the research was conducted in the absence of any commercial or financial relationships that could be construed as a potential conflict of interest.

References

  1. Akhnoukh, A.K. Accelerated Bridge Construction Projects Using High Performance Concrete. Case Stud. Constr. Mater. 2020, 12, e00313. [Google Scholar] [CrossRef]
  2. Zhou, X.; Zhang, X. Thoughts on the Development of Bridge Technology in China. Build. Struct. Mater. 2019, 5, 1120–1130. [Google Scholar] [CrossRef]
  3. Lantsoght, E.O.L.; Zarate Garnica, G.I.; Zhang, F.; Park, M.-K.; Yang, Y.; Sliedrecht, H. Shear Experiments of Pre-stressed Concrete Bridge Girders. ACI Struct. J. 2021, 118, 117–130. [Google Scholar] [CrossRef]
  4. Mustafa, S.; Lantsoght, E.O.L.; Yang, Y.; Sliedrecht, H. Numerical Analysis of Prestressed Concrete Bridge Girders Failing in Shear. ACI Struct. J. 2022, 119, 113–127. [Google Scholar] [CrossRef]
  5. Zhang, C. Research on the Application of Prestressing Technology with Pretensioned Draped Strands in Bridge Engineering. Shanghai Highw. 2020, 4, 41–44. [Google Scholar] [CrossRef]
  6. Liu, Z.; Lei, H.; Luo, J.; Zhang, C. Full-Scale Experimental Test on Flexural Behavior of a 30 m-Long Pretensioned Con-crete Double-Tee Girder. Bridge Constr. 2022, 52, 14–20. [Google Scholar]
  7. Wang, L.; Chen, J.; Yang, Y.; Zhu, Z.; Sun, B.; Shu, H. Full-scale Model Test on Flexural Performance of Double-broken Line Pre-tensioned High-strength Concrete I-beams. China J. Highw. Transp. 2023, 36, 169–179. [Google Scholar] [CrossRef]
  8. Wang, J.; Tang, S.; Zheng, H.; Zhou, C.; Zhu, M. Flexural Behavior of a 30-Meter Full-Scale Simply Supported Prestressed Concrete Box Girder. Appl. Sci. 2020, 10, 3076. [Google Scholar] [CrossRef]
  9. Garber, D.B.; Gallardo, J.M.; Deschenes, D.J.; Bayrak, O. Nontraditional Shear Failures in Bulb-T Prestressed Concrete Bridge Girders. J. Bridge Eng. 2016, 21, 04016030. [Google Scholar] [CrossRef]
  10. Hu, Z.; Lin, P.; Guo, H.; Xiang, Z. Evaluation of the Residual Bearing Capacity of Prestressed Concrete T-Girder Bridges Based on Bending Stiffness Reduction. J. Bridge Eng. 2025, 30, 04024107. [Google Scholar] [CrossRef]
  11. Yao, Z.; Wei, M.; Yan, H.; Yu, D.; Li, G.; Zhang, C.; Tao, J.; Pei, H. Experimental Study of Pre-Tensioned Polygonal Prestressed T-Beam Under Combined Loading Condition. Buildings 2025, 15, 1379. [Google Scholar] [CrossRef]
  12. Hussien, O.F.; Elafandy, T.H.K.; Abdelrahman, A.A.; Abdel Baky, S.A.; Nasr, E.A. Behavior of Bonded and Unbonded Prestressed Normal and High Strength Concrete Beams. HBRC J. 2012, 8, 239–251. [Google Scholar] [CrossRef]
  13. Singh, M. Experimental and Numerical Study of the Flexural Behaviour of Ultra-High Performance Fibre Reinforced Concrete Beams. Constr. Build. Mater. 2017, 138, 12–25. [Google Scholar] [CrossRef]
  14. Wang, H.-T.; Liu, X.-J.; Bai, J.; Yang, Y.; Xu, G.-W.; Chen, M.-S. Finite Element Modeling and Artificial Neural Network Analyses on the Flexural Capacity of Concrete T-Beams Reinforced with Prestressed Carbon Fiber Reinforced Polymer Strands and Non-Prestressed Steel Rebars. Buildings 2024, 14, 3592. [Google Scholar] [CrossRef]
  15. Yapar, O.; Basu, P.K.; Nordendale, N. Accurate Finite Element Modeling of Pretensioned Prestressed Concrete Beams. Eng. Struct. 2015, 101, 163–178. [Google Scholar] [CrossRef]
  16. Strauss, A.; Krug, B.; Slowik, O.; Novak, D. Combined Shear and Flexure Performance of Prestressing Concrete T-shaped Beams: Experiment and Deterministic Modeling. Struct. Concr. 2018, 19, 16–35. [Google Scholar] [CrossRef]
  17. Maghsoudi, M. Finite Element and Experimental Investigation on the Flexural Response of Pre-Tensioned T-Girders. Int. J. Civ. Eng. 2019, 17, 541–553. [Google Scholar] [CrossRef]
  18. ACI Committee. Building Code Requirements for Structural Concrete (ACI 318-19); American Concrete Institute: Farmington Hills, MI, USA, 2019. [Google Scholar]
  19. Long, Y.; Jiang, Z.; Zou, K.; Du, J.; Yang, J. Numerical Simulation Analysis of the Bending Performance of T-Beams Strengthened with Ultra-High-Performance Concrete Based on the CDP Model. Buildings 2024, 14, 1284. [Google Scholar] [CrossRef]
  20. Shen, J.; Zhang, X.; Wu, P.; Yue, K.; Chen, J. Experimental and Finite Element Analysis of Bending Performance of Web-Embedded Double Inverted T-Shaped Steel–Concrete Composite Beams. Buildings 2025, 15, 717. [Google Scholar] [CrossRef]
  21. Liu, J.; Cen, K.; Wang, Z.; Li, W.; Shi, L. Flexural Behavior of New Demountable Steel–Concrete Composite Beam with Novel Demountable Connectors. Buildings 2025, 15, 736. [Google Scholar] [CrossRef]
  22. GB/T 50152-2012; Standard for Test Methods of Concrete Structures. China Architecture & Building Press: Beijing, China, 2012.
  23. Hu, B.; Cai, Y.; Liu, H.; Wu, W.; He, B. The Stiffness Change in Pre-Stressed Concrete T-Beams during Their Life-Cycle Based on a Full-Scale Destructive Test. Appl. Sci. 2024, 14, 5200. [Google Scholar] [CrossRef]
  24. Nawy, E.G. Prestressed Concrete: A Fundamental Approach; Prentice Hall: Upper Saddle River, NJ, USA, 1999; ISBN 978-0-13-020593-3. [Google Scholar]
  25. GB/T 50010-2010; Specifications for Design of Concrete Structures. China Architecture & Building Press: Beijing, China, 2010.
  26. Lee, J.; Fellow, P.R. Plastic-Damage Model for Cyclic Loading of Concrete Structures. J. Eng. Mech. 1998, 124. [Google Scholar] [CrossRef]
  27. Li, Z.; Xu, Q.; Zeng, K.; Yu, X.; Gong, S.; Lu, Y. Flexural performance of pretensioned prestressed concrete solid square piles reinforced with steel strands and deformed steel bars. Struct. Concr. 2025, 1–23. [Google Scholar] [CrossRef]
  28. Li, X.-X.L. Parametric Study on Numerical Simulation of Missile Punching Test Using Concrete Damaged Plasticity (CDP) Model. Int. J. Impact Eng. 2020, 144, 103652. [Google Scholar] [CrossRef]
  29. Asgari, A.; Bagheri, M.; Hadizadeh, M. Advanced Seismic Analysis of Soil-Foundation-Structure Interaction for Shallow and Pile Foundations in Saturated and Dry Deposits: Insights from 3D Parallel Finite Element Modeling. Structures 2024, 69, 107503. [Google Scholar] [CrossRef]
  30. Bagheri, M.; Jamkhaneh, M.E.; Samali, B. Effect of Seismic Soil–Pile–Structure Interaction on Mid- and High-Rise Steel Buildings Resting on a Group of Pile Foundations. Int. J. Geomech. 2018, 18, 04018103. [Google Scholar] [CrossRef]
Figure 1. Structural diagram of 30 m T-beam.
Buildings 15 02595 g001
Figure 2. Loading device and loading test.
Buildings 15 02595 g002
Figure 3. Multi-sensor layout for the experiment.
Buildings 15 02595 g003
Figure 4. Load-deflection of the beam.
Buildings 15 02595 g004
Figure 5. Mid-span experimental load moment and deflection relationship.
Buildings 15 02595 g005
Figure 7. Concrete strain gauge data.
Buildings 15 02595 g007
Figure 8. Incremental strain distribution at mid-span section under load testing.
Buildings 15 02595 g008
Figure 9. Strain development under load in steel strand after prestress release.
Buildings 15 02595 g009
Figure 10. The first visible crack appeared in the D3 loading condition.
Buildings 15 02595 g010
Figure 11. Crack diagram of D10 loading condition.
Buildings 15 02595 g011
Figure 12. Crack development diagram of D12 loading condition.
Buildings 15 02595 g012
Figure 13. Finite element model.
Buildings 15 02595 g013
Figure 14. Initial stress of concrete.
Buildings 15 02595 g014
Figure 15. Experimental and numerical load-deflection curves. (a) Comparison of experimental and numerical results in the loading process; (b) Numerical simulation results continued after the experiment reached its limiting conditions.
Buildings 15 02595 g015
Figure 16. Experimental and numerical load-deflection along the length of the beam.
Buildings 15 02595 g016
Figure 17. Stress–strain relationship of prestressed steel strand with bilinear model.
Buildings 15 02595 g017
Figure 18. Experimental and numerical force-strain curves for steel strand.
Buildings 15 02595 g018
Figure 19. Concrete failure patterns in numerical simulation and experiment.
Buildings 15 02595 g019
Table 1. Steel bar parameters.
Rebar TypeYield Strength
(MPa)
Ultimate Strength
(MPa)
Modulus of Elasticity
(GPa)
HRB300Փ10332.0461.2200
HRB400Փ12418.0595.4200
HRB400Փ14446.0580.4200
HRB400Փ28432.0614.1200
Steel Strand-1860.0195
Table 2. Graded loading system.
Loading ClassTotal Load (kN)Holding Time (min)
Preloading——5
Unload05
D14005
D28005
D312005
D413005
D514005
D615005
D716005
D818005
D920005
D1022005
D1124005
D1225005
Unload05
Disclaimer/Publisher’s Note: The statements, opinions and data contained in all publications are solely those of the individual author(s) and contributor(s) and not of MDPI and/or the editor(s). MDPI and/or the editor(s) disclaim responsibility for any injury to people or property resulting from any ideas, methods, instructions or products referred to in the content.

