1. Introduction
During seismic events, structures designed to withstand seismic forces, as well as pre-code buildings and non-engineered constructions, are subjected to seismic loads. Structural damage, economic losses, irreversible harm to cultural heritage, and, most critically, human casualties tend to be significantly higher in developing and underdeveloped nations [
1]. In these regions, urban infrastructure is typically marked by unregulated and highly vulnerable building stocks that fail to comply with even basic national design standards, let alone seismic design codes. This challenge is further exacerbated in non-seismic regions, such as Brazil, where the widespread misconception that the country is impervious to moderate or strong earthquakes fosters a lack of preparedness and adherence to seismic safety measures. Recent research has highlighted the significance of accounting for seismic forces in structural design, even in areas traditionally considered to have low seismic risk [
2,
3].
Various facilities within the category of pre-code existing buildings, including complex monuments, museums, hospitals, schools, commercial establishments, and essential storage facilities, remain highly susceptible to severe damage during seismic events. Tools, including intuitive and user-friendly mobile applications, must account for the specific characteristics and requirements of diverse facilities during their deployment and practical application. This benefits all stakeholders, including engineers, government agencies, organizations, and disaster management authorities, by providing a dependable assessment of the vulnerability and risk of critical structures in advance. This, in turn, enables them to make informed decisions that reduce risks, safeguard communities, and ensure the resilience of community life [
4].
The evaluation of a set of buildings using analytical methods to obtain precise insights into their seismic behavior may be impractical or even infeasible. While advanced numerical approaches, such as those employing static or dynamic nonlinear analyses, enable accurate predictions of the seismic responses of typical structures, these methodologies are unsuitable for large-scale seismic vulnerability assessments. This limitation arises from the substantial level of knowledge required to construct reliable numerical models and the considerable computational demands associated with these techniques [
5].
Over the past five decades, numerous methodologies have been developed to analyze the behavior of existing structures under seismic events and to establish correlations between this behavior and the intensity of local seismic activity.
Rapid visual screening (RVS) methods represent streamlined and immediate approaches, functioning as qualitative procedures for the preliminary assessment of structural vulnerability. These methods serve as precursors to more precise evaluations, categorizing buildings according to their construction materials and structural systems. The framework is designed to identify key building parameters and compute a basic structural performance score, with the objective of prioritizing structures for potential interventions in future seismic risk mitigation efforts [
6]. Among the applications of RVS, variations include—but are not limited to—the earthquake disaster risk management programs of a city or a region, and to assist decision-makers in the implementation of seismic risk reduction strategies. According to [
5], the purpose of the RVS methodology is not to provide an exact prediction of the seismic performance of a structure. Nonetheless, the relevance of the methodology has been noted through the implementation of different RVS methods in several countries and its wide international acceptance, including its incorporation into remarkable national building codes, such as FEMA 154, which is used worldwide.
As highlighted in FEMA 154 [
7], its application has been adopted by many different people—including non-structural engineers in different jurisdictions throughout the United States—for over 35 years. The screening can be conducted quickly because it is based on a sidewalk survey, enabling the evaluation of a large building portfolio while requiring little expertise, and it is a cost-effective method.
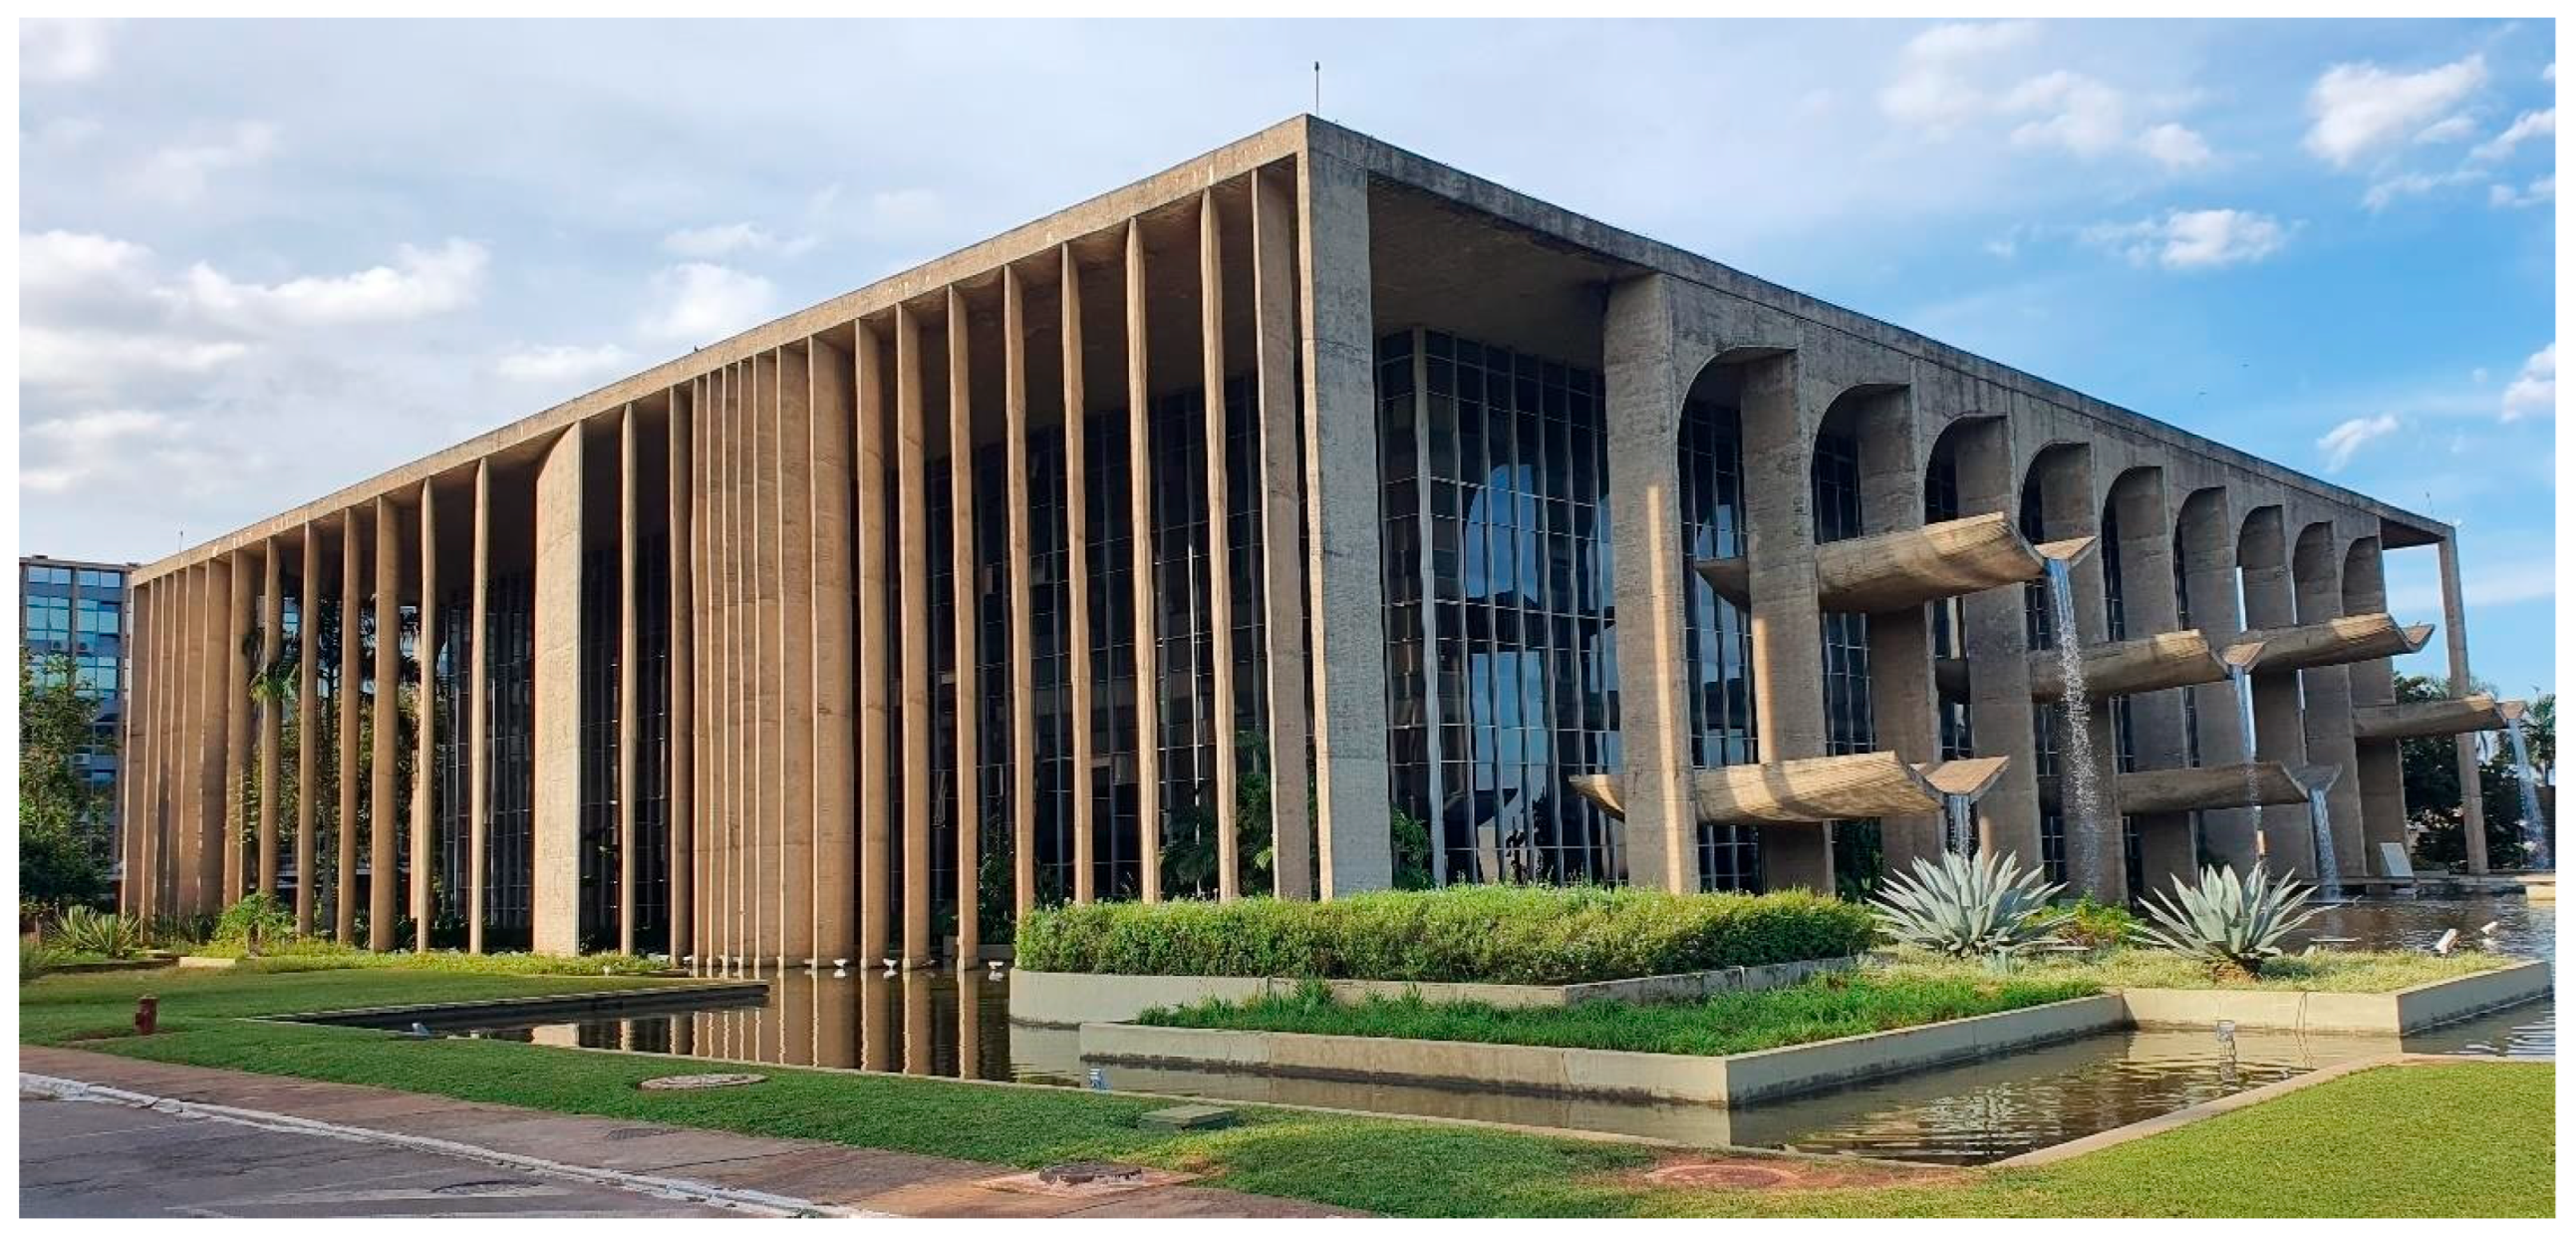
In alignment with this approach, this study presents a thorough seismic vulnerability assessment of a modern building in Brasilia, Brazil. At the same time, it introduces a suitable rapid visual screening mobile application based on a simplified method. This method was previously applied in Brazil by [
8,
9,
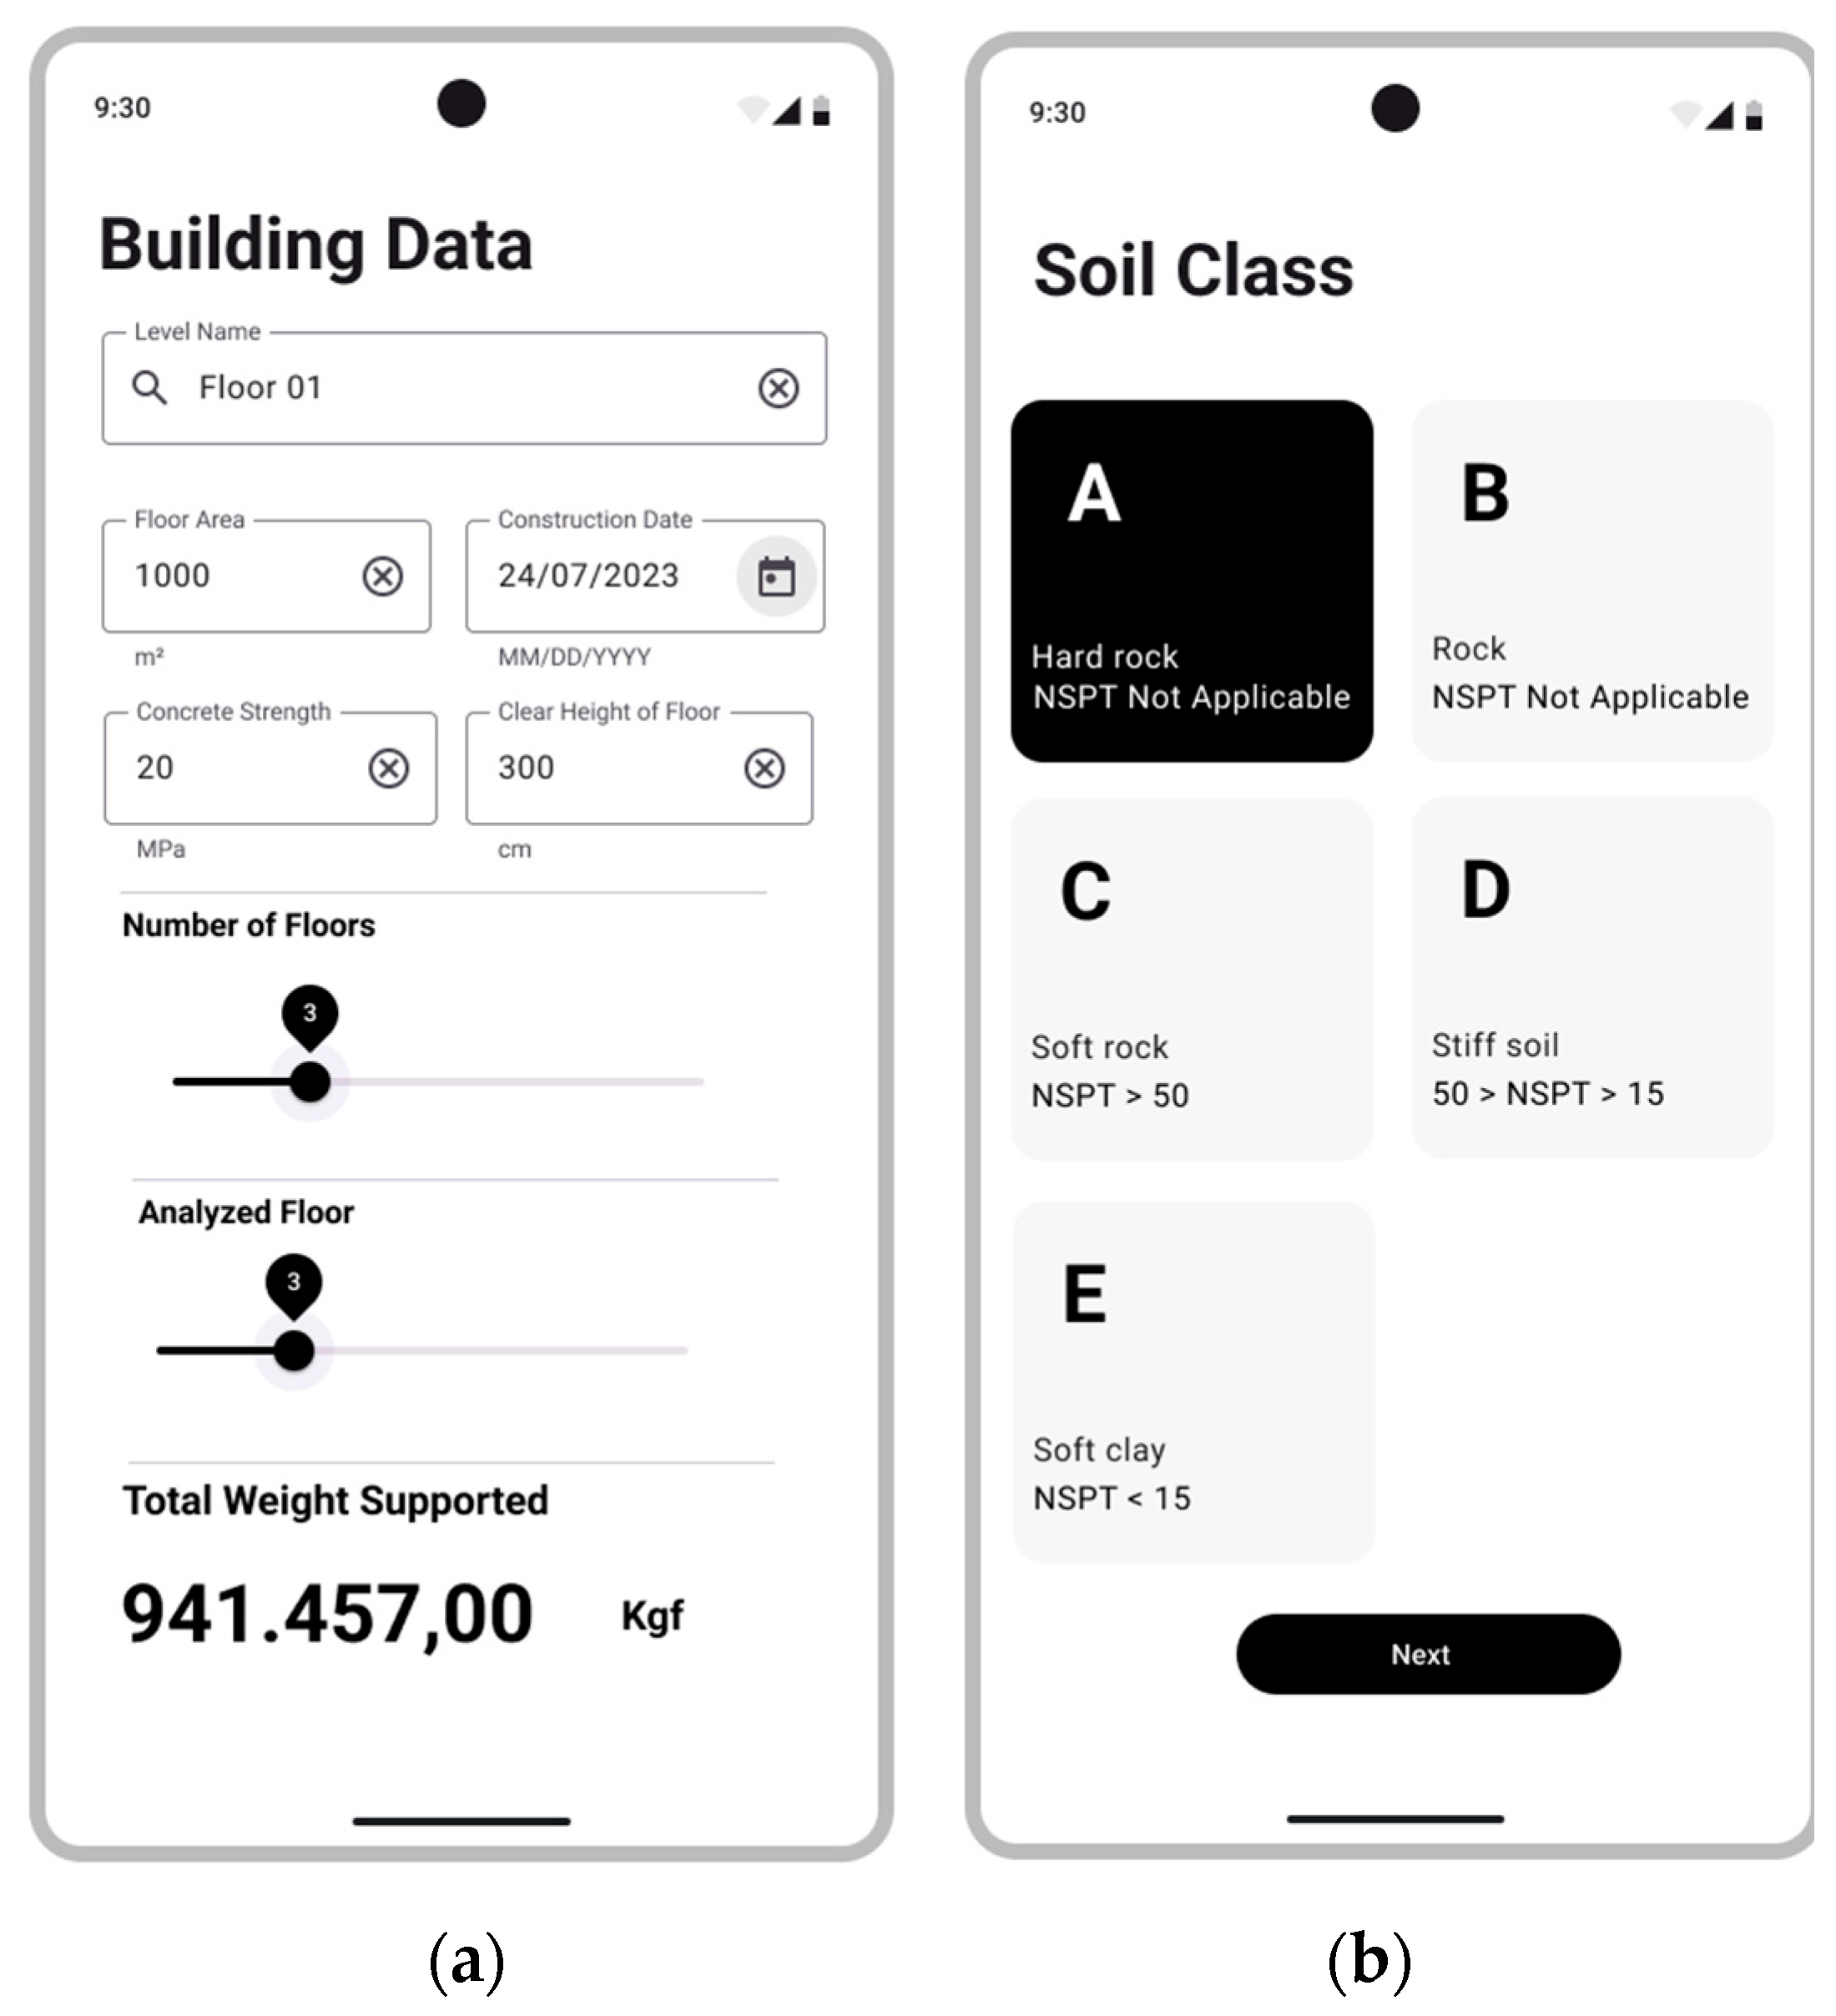
10]. Among all the methods available in the literature, the Japanese method is adopted and implemented as a mobile tool. It is worth noting that to assess the strength capacity of the studied building, the tool requests very little data concerning the building, such as geometrical data, mechanical properties of the materials, the age of construction, maintenance status, and type of horizontal and vertical structures, in order to estimate a safety factor and a qualitative assessment of the vulnerability [
11]. This study is structured to provide a full understanding of the rapid visual method, a description of the mobile application that allows for reproducibility, and a detailed description of the building’s geometry, structural system, construction materials, and the seismic context of the country. Finally, the seismic vulnerability of buildings in several scenarios is compared. The last part summarizes the key findings of the study. The tool is available on github repository.
2. Rapid Visual Screening Method
The Japanese framework for the pre-earthquake building evaluation employs a simplified qualitative methodology to assess the seismic vulnerability of existing structures. This approach is divided into three procedural levels, namely, the first, second, and third. The first-level procedure is the most basic, while the third-level procedure incorporates the most intricate calculations [
12]. According to [
13], the primary objective of the first-level procedure is to evaluate structural strength based on the average strength of walls and columns, verifying whether the building can resist seismic forces without requiring ductile behavior. The second level assesses seismic capacity by considering the dynamic properties of the columns, including their ductility and strength. At the third level, the assessment integrates the resistance and ductility of both vertical and horizontal structural elements, such as columns, walls, and beams, to determine the building’s overall seismic performance.
The evaluation method for the structural capacity of medium- and small-scale buildings, proposed by the Japanese Ministry in 1977, was designed to offer a practical and expeditious approach to the large-scale assessment of buildings subjected to intense seismic activity. Ref. [
14] reported that the seismic performance of both damaged and undamaged buildings—affected by multiple earthquakes—was analyzed to validate the method’s reliability. From these investigations, a seismic demand index—also interpreted as a seismic protection criterion—was derived.
Although the method is qualitative, its equations are based on nonlinear response analyses of single-degree-of-freedom structural models. In [
15], a simulation using a mass model supported by a parallel spring system was used, combining two hysteretic loops known as the origin-oriented model and the trilinear degradation model. The first represents structural walls or shear walls, while the second corresponds to columns or frames, which are the first to fail in shear and bending, respectively. For this dynamic analysis, Ref. [
15] selected the El Centro (1940) (north–south), Taft (1952) (east–west), and Hachinohe (1968) (north–south) earthquakes, and the peak acceleration of each event was adjusted to 30% of gravity. Since then, various strength values have been prescribed for structural walls and columns, with the ultimate displacement of the walls and the inelastic displacement of the columns considered constant. The natural periods ranged from 0.6 to 1 s.
In this study, the first-level evaluation method was adopted for reinforced concrete structures. The seismic index of the structure represents the maximum elastic response of the shear coefficient for each floor [
16], calculated using the following equation:
The seismic index of the structure is computed as the product of the basic seismic index of the structure (
), the irregularity index (
), and the time index (
), which accounts for the degradation of structural strength and ductility over time [
17]. These parameters were derived from on-site inspections of the building. Consequently, the methodology necessitates the prior identification of critical factors, such as structural irregularities, the presence of soft stories or short columns, soil conditions, the seismic zone, and the intended use of the building.
This seismic assessment methodology was adapted to the Brazilian context by [
18]. One of the earliest adaptations of the Japanese guidelines to the Brazilian context was its exclusive focus on concrete columns. This approach is justified by the fact that most reinforced concrete buildings up to eight stories do not contain concrete walls or short columns. It is important to recall that a short column is defined as a reinforced concrete column in which the ratio between the free height (
) and the section’s base dimension (D) is less than or equal to 2
).
Short columns exhibit brittle shear failure behavior, and their presence depends on the existence of horizontal elements that constrain the free height. In Brazil, except for some architectural requirements, the base dimension of columns is typically, at most, 30 cm. Therefore, a column with a free height of up to 60 cm may be classified as a short column. Such conditions often arise due to openings created for architectural functions when infill walls are assumed to be part of the structural system. However, this structural system is not addressed by the current method.
For buildings with short columns, the following equation is applied:
For those without, it remains as follows:
In the case of the Brazilian context, since no wall column is considered, Equation (3) is rewritten as follows:
It should be noted that the index of ductility now changes from to , which only takes into account the ductility of columns and does not consider the participation of walls () or short columns ().
It should be emphasized that another required adaptation involves the fact that the original Japanese method considered only concrete compressive strength values of up to 200 kgf/cm
2. In cases where
values go above this limit, Ref. [
19] introduces a modification in the formulation, from
.
Some limitations arise when adapting to the Brazilian context, such as in the case of shear strength, , since there is no exhaustive campaign of experiments with columns built in Brazil to determine the mean value of shear strength; hence, the original value of the method was used here. Also, the Brazilian methodology accounts for the seismic index, , in only one direction, given that the total cross-sectional area of the concrete columns remains invariant regardless of the direction under analysis. The two other factors, () and (, were kept the same, as recommended in the original guidelines.
The sub-index,
aims to assess the structural irregularity or stiffness, as well as the non-uniform distribution of mass and stiffness (Equation (6)). The building characteristics considered in this coefficient include the following: plan irregularity, the ratio between the building’s length and width, the presence of basements, irregularity in floor heights, and the ratio between the atrium area and the total floor area (
Table 1).
where
Items “a” through “j” must be checked for each floor, and the lowest value among all floors is applied to the entire structure. The following table details the calculation of each item (
Table 2).
Table 2.
Detailed description of each item of the
Table 2.
Detailed description of each item of the
| Item | Description |
|---|
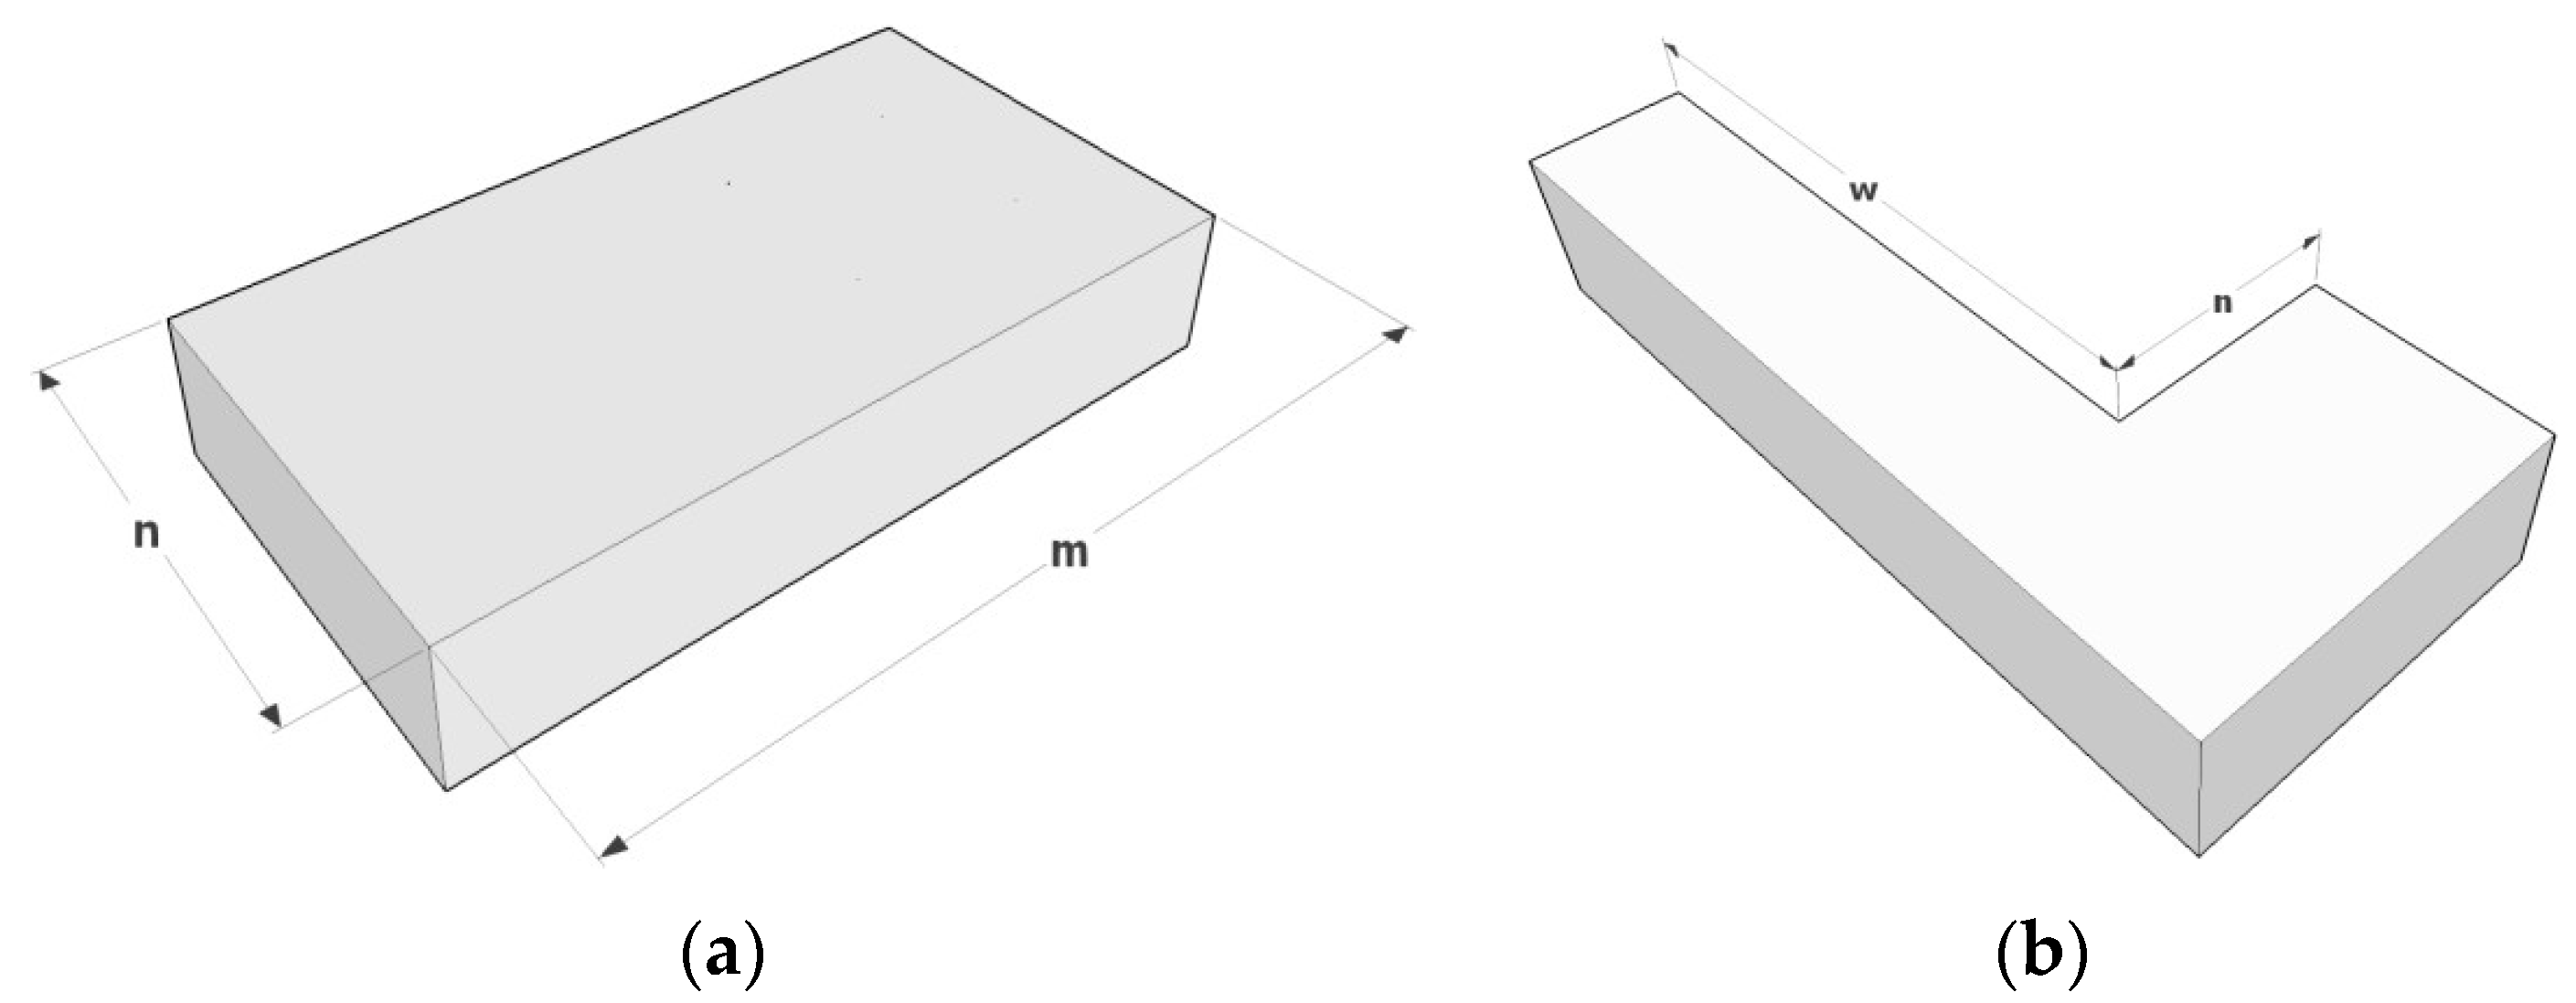
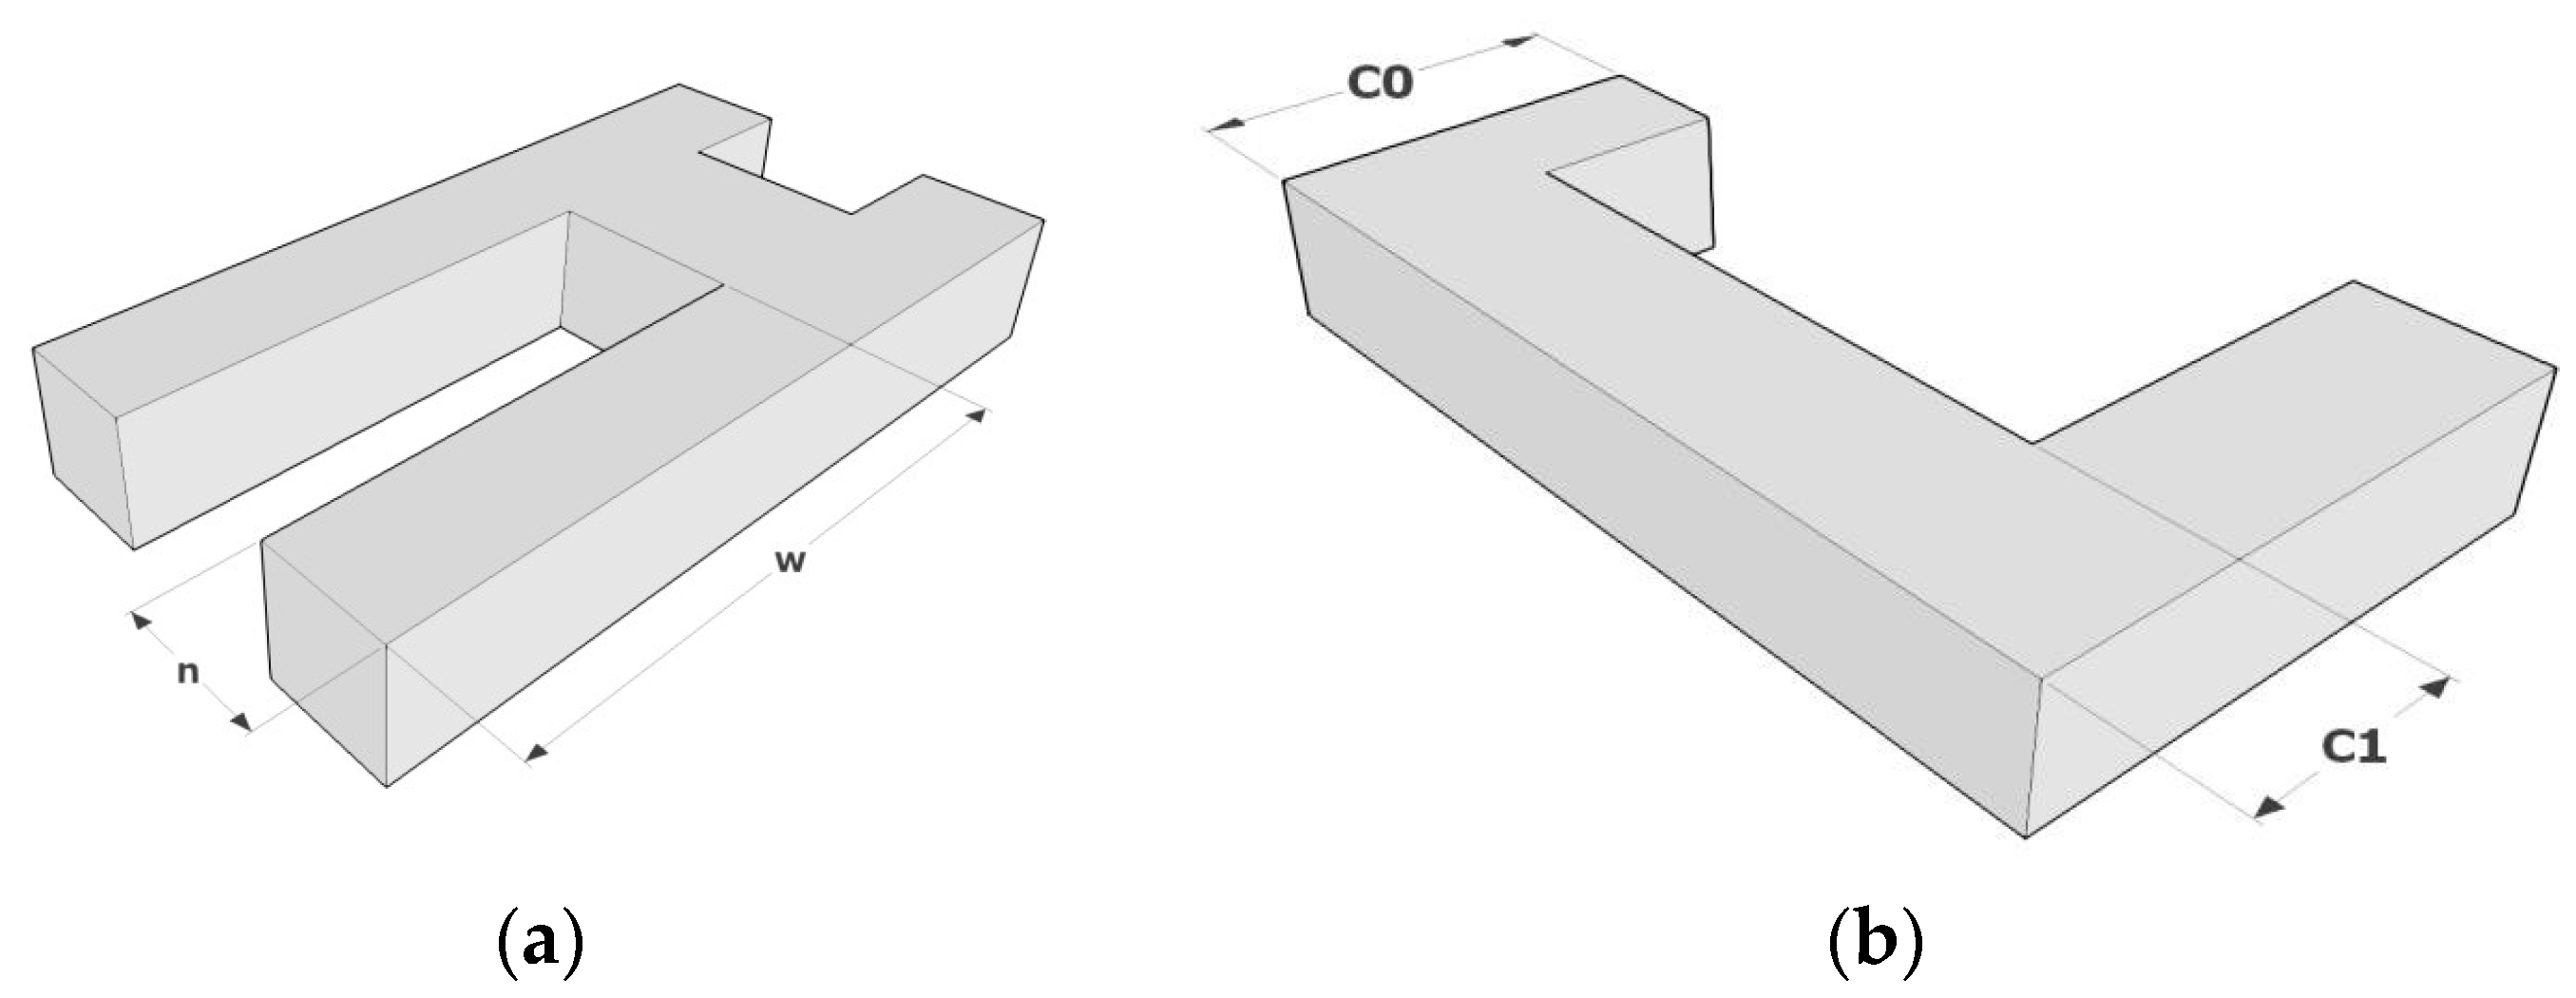
| a. Regularity | The floor plan exhibits bilateral symmetry along two axes (indicating a high degree of regularity), and any projection parts occupy less than 10% of the total floor area. ( Figure 1a). The structural balance is worse than a1, or the area of a projection part is no more than 30% of the floor area with an L-, T-, or U-shaped plan ( Figure 1b). The structural balance is worse than a2, or the area of a projection part is larger than 30% of the floor area with an L-, T-, or U-shaped plan ( Figure 2a).
|
| b. Aspect ratio of plan | Length of the long side/length of the short side. In case the plan is not rectangular, the length of the long side may be taken, ignoring the projection part when the area of the projection is less than 10% of the floor area; otherwise, it should be taken as the longer value of b1 = 2l and b2 (Figure 2b). |
| c. Contraction of the plan | It should be noted that the contraction of buildings are according the Figure 3 (c = C1/C0). |
| d. Expansion joint | D = the clear width of the expansion joint/the height from the base to the expansion joint. |
| e. Well-style area | E = (Well-style area/total floor area). A well-style area is a room or space that extends over two or more stories. However, if it is enclosed by reinforced concrete (RC) walls, it may not be considered a well-style area. |
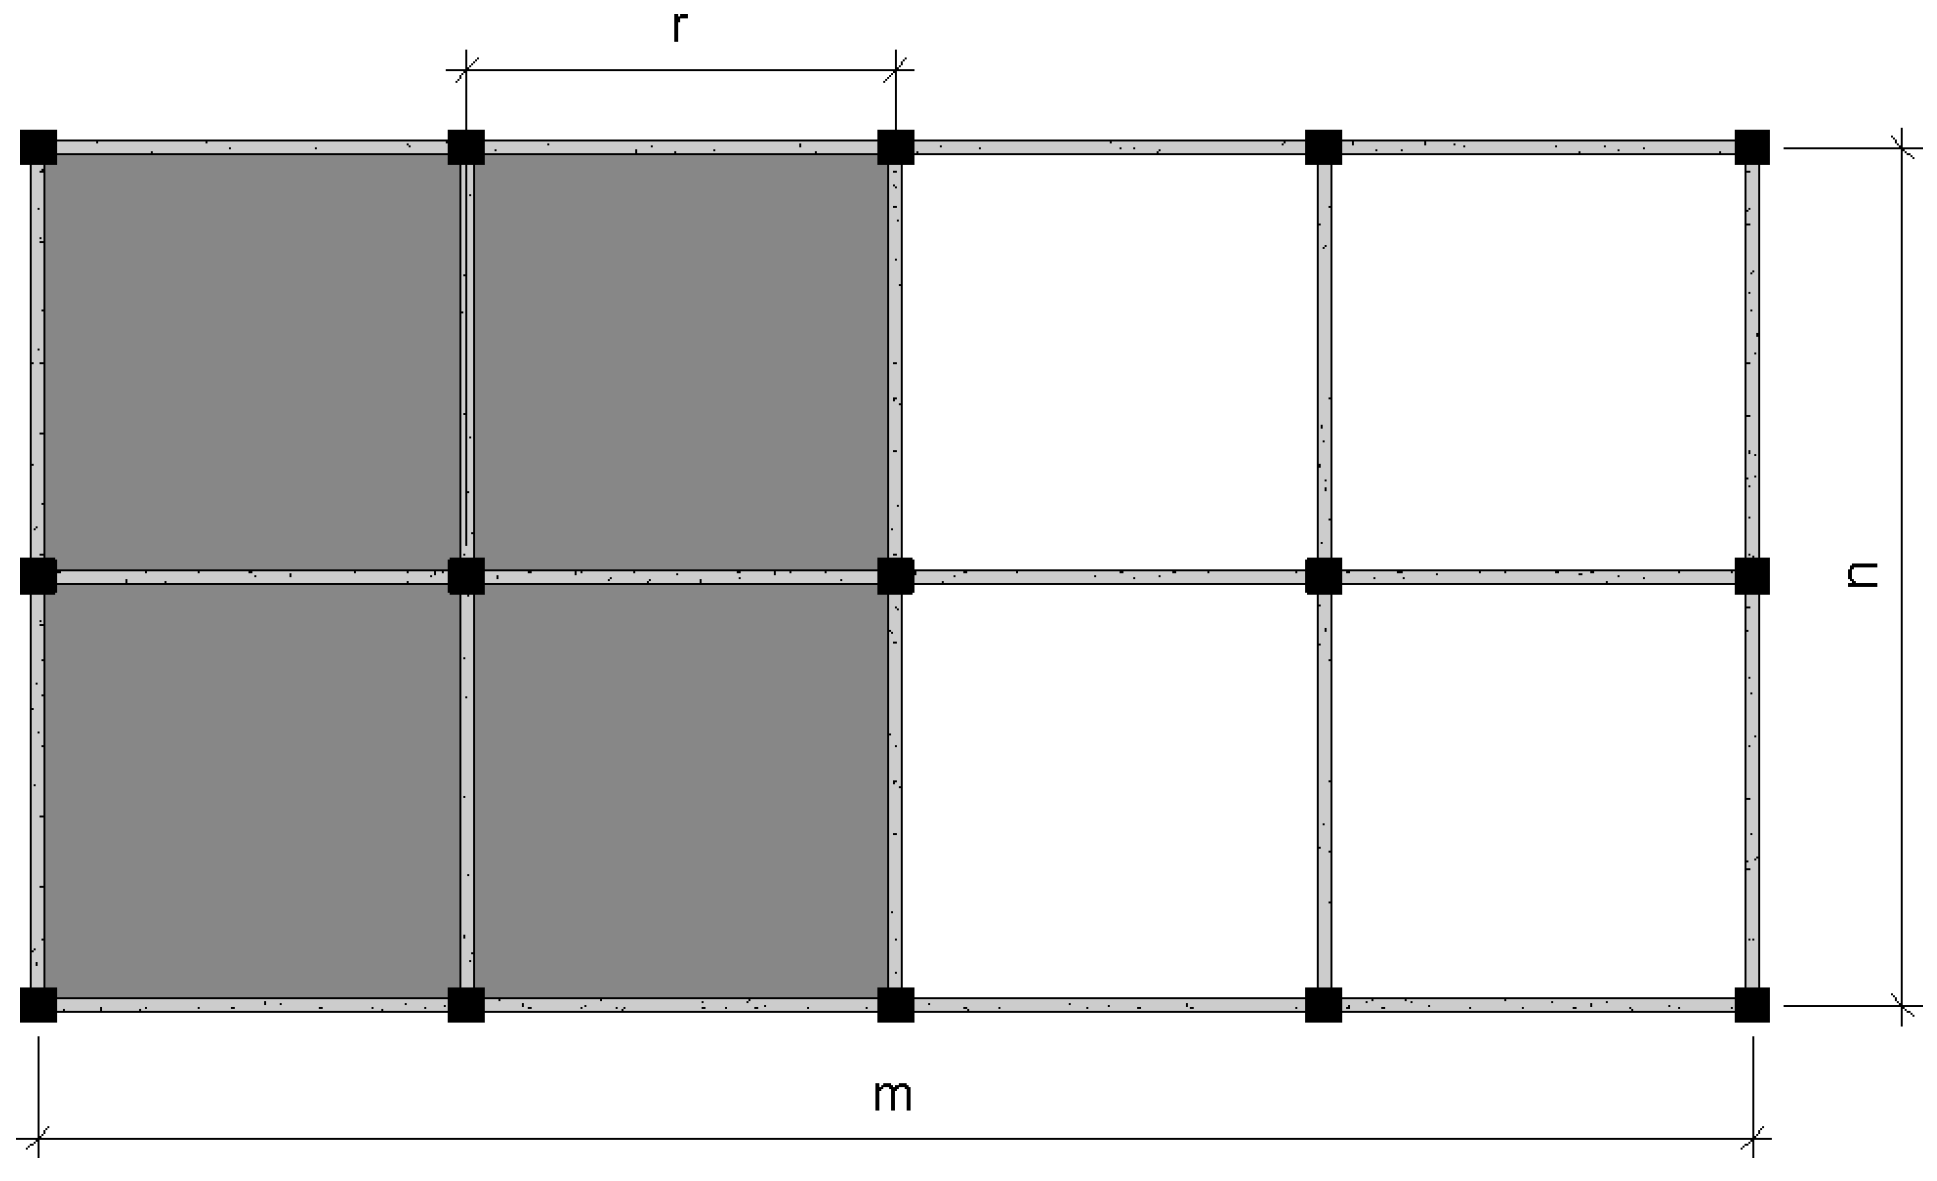
| f. Eccentric well-style area | : The distance between the center of the floor area and the center of the well-style area/the length of the short side of the building,
= ; : The distance between the center of the floor area and the center of the well-style area/the length of the long side of the building, = .
|
| h. Underground floor | (Area of the basement/area of the building). |
| i. Story height uniformity | (The height of the above story/the height of the story concerned). In the case of the top story, the height of the story below is taken instead of the above story in the equation. |
Figure 1.
Items a and b: (a) regular; (b) aspect ratio of the plan.
Figure 1.
Items a and b: (a) regular; (b) aspect ratio of the plan.
Figure 2.
Items b and c: (a) aspect ratio of the plan; (b) contraction of the floor plan.
Figure 2.
Items b and c: (a) aspect ratio of the plan; (b) contraction of the floor plan.
Figure 3.
Eccentric well-style area.
Figure 3.
Eccentric well-style area.
This index quantifies the effects of building deterioration over time, as well as the impacts of previous earthquakes or other damaging events. It is calculated based on data collected during on-site inspections and information provided by the building owner. The deterioration index,
, is determined using
Table 3. When a single value of
is assigned to the entire building, it must correspond to the lowest value obtained from
Table 3.
The seismic demand index (
is determined using the following equation:
The basic seismic demand index of the structure (
) represents a standard parameter, with a default value of
= 0.8 employed for first-level screening procedures. As deeply discussed in [
13,
15], the
index depends on the number of stories, the predominant period of ground in seconds, and the type of failure (shear failure/flexural failure) of a building. Hence, the formulation of
yields
The demonstration of the calibration of
can be viewed in [
18]. Briefly, in the Brazilian context, this index refers to the following:
For reinforced concrete frames, the response magnification factor (R) defined by Brazilian seismic code NBR 15421 [
20] is equal to 3.0. Consequently, the index
assumes a value of 0.83, which aligns with the original value used in the method.
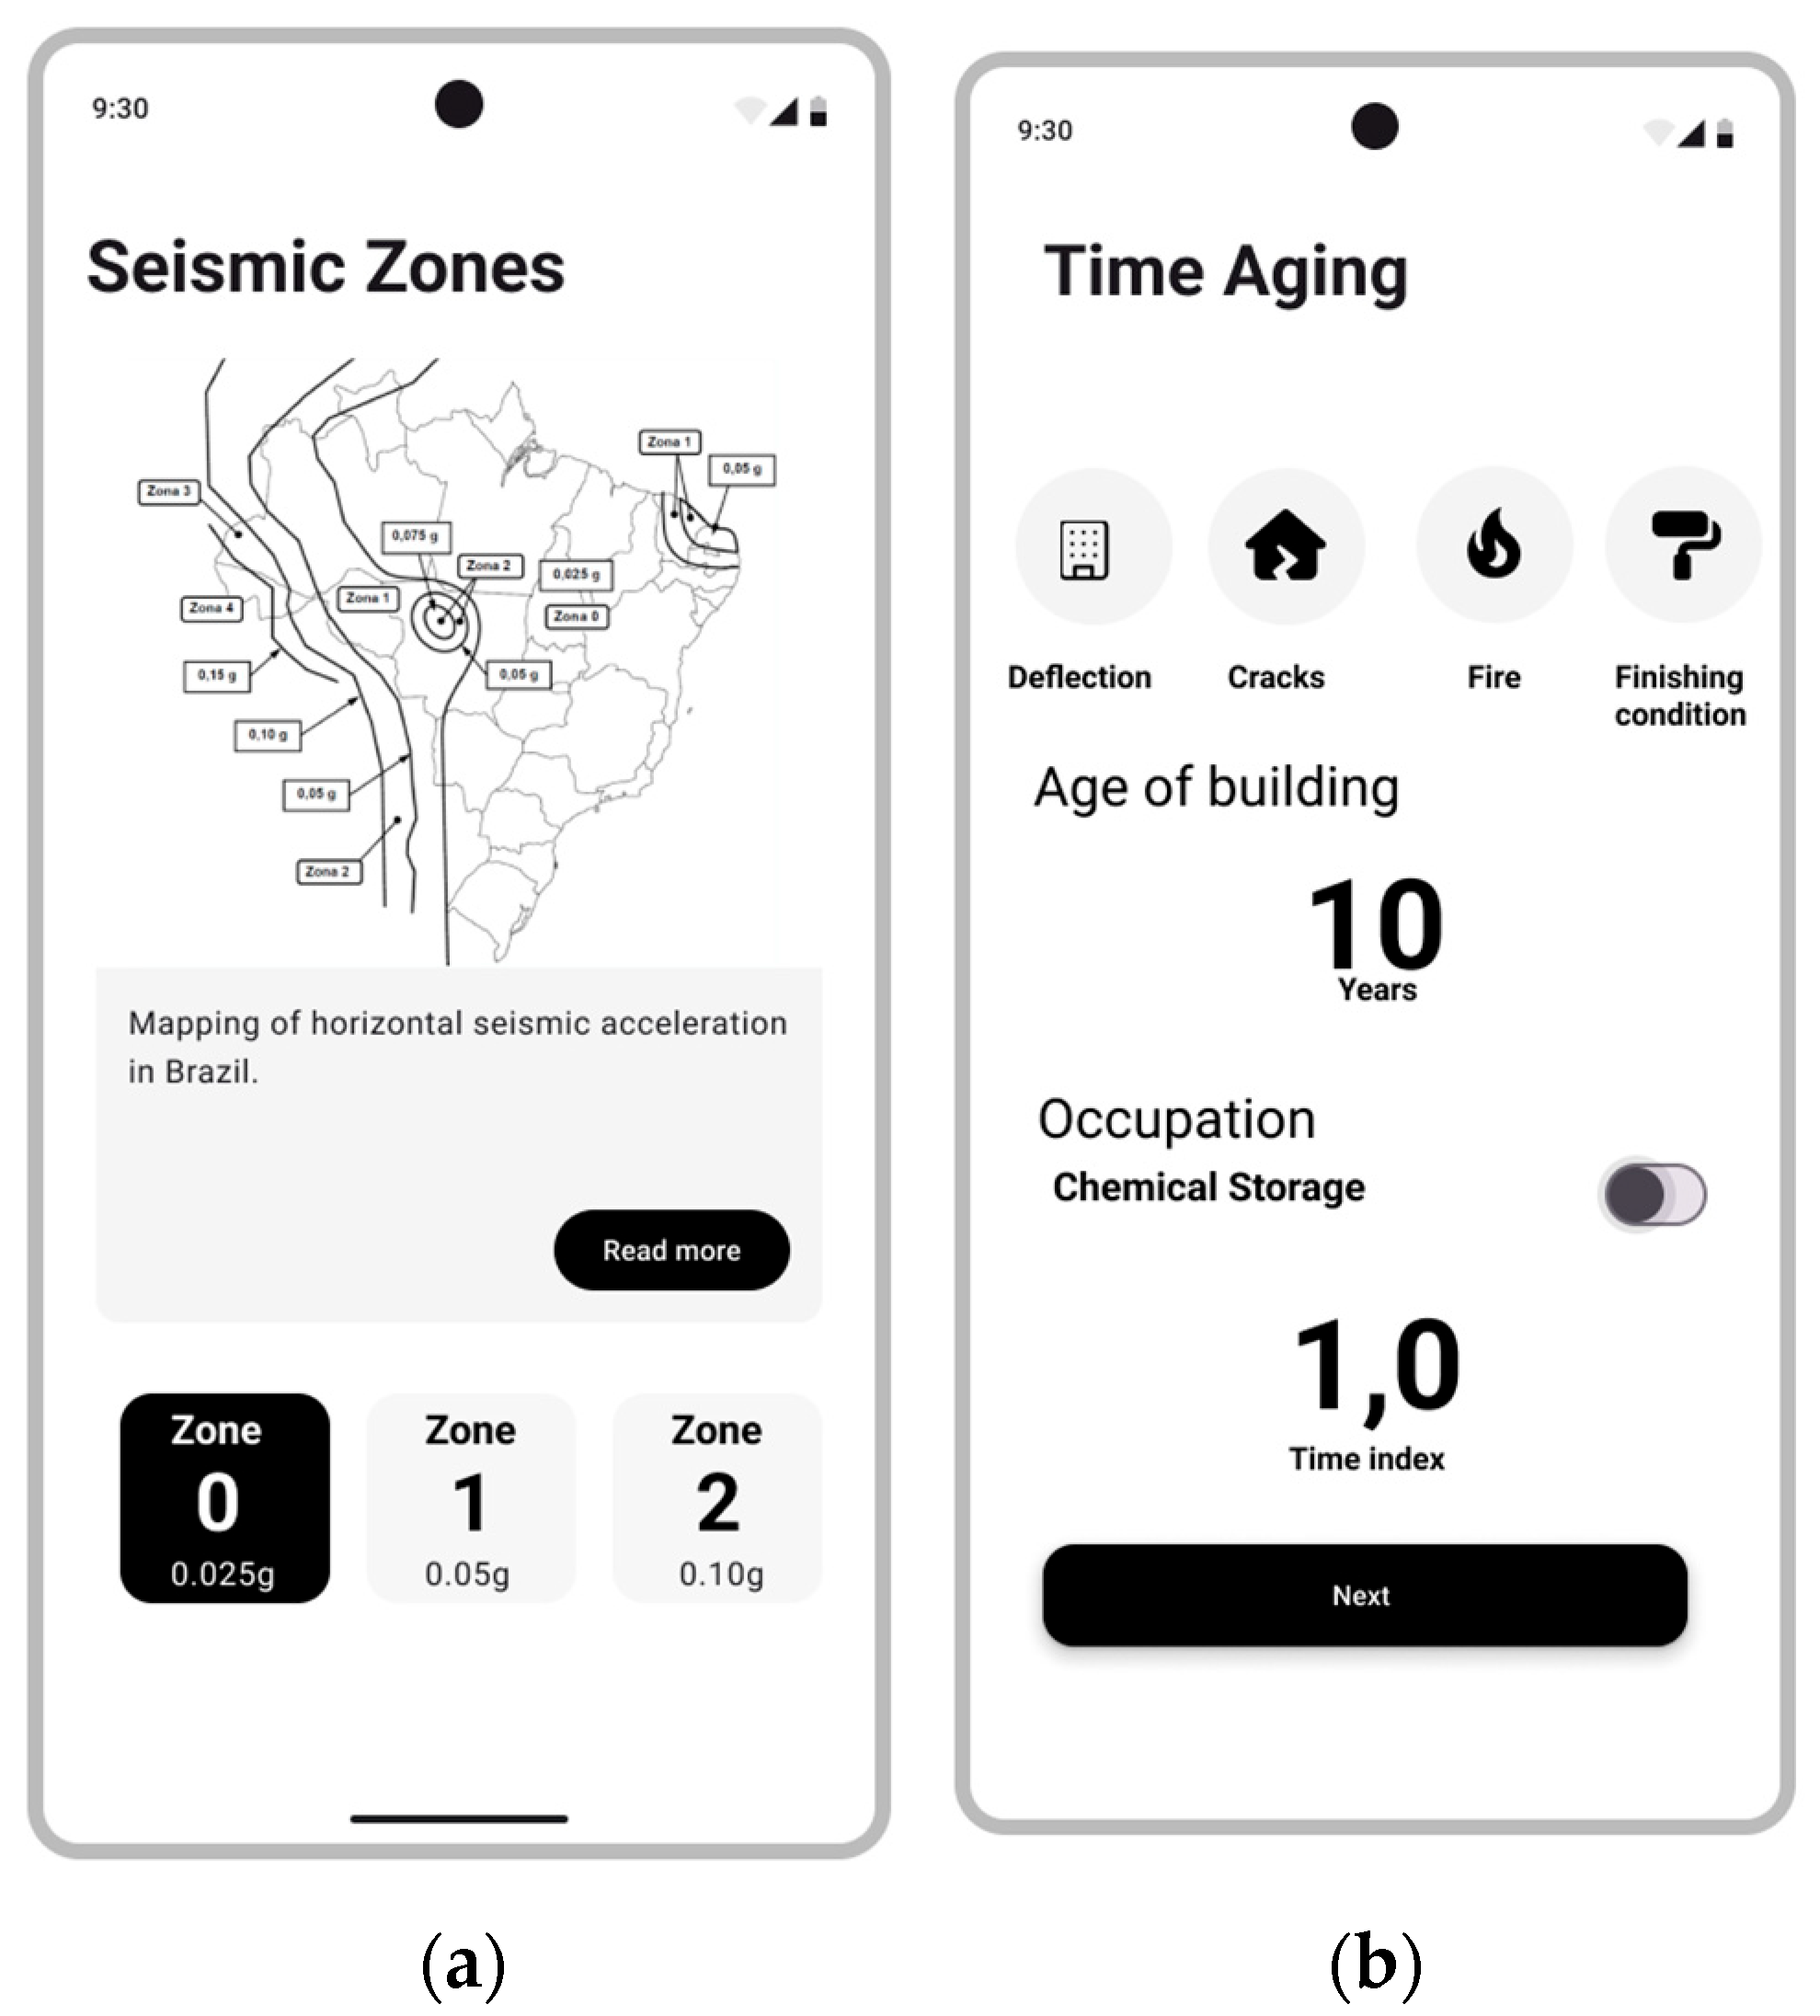
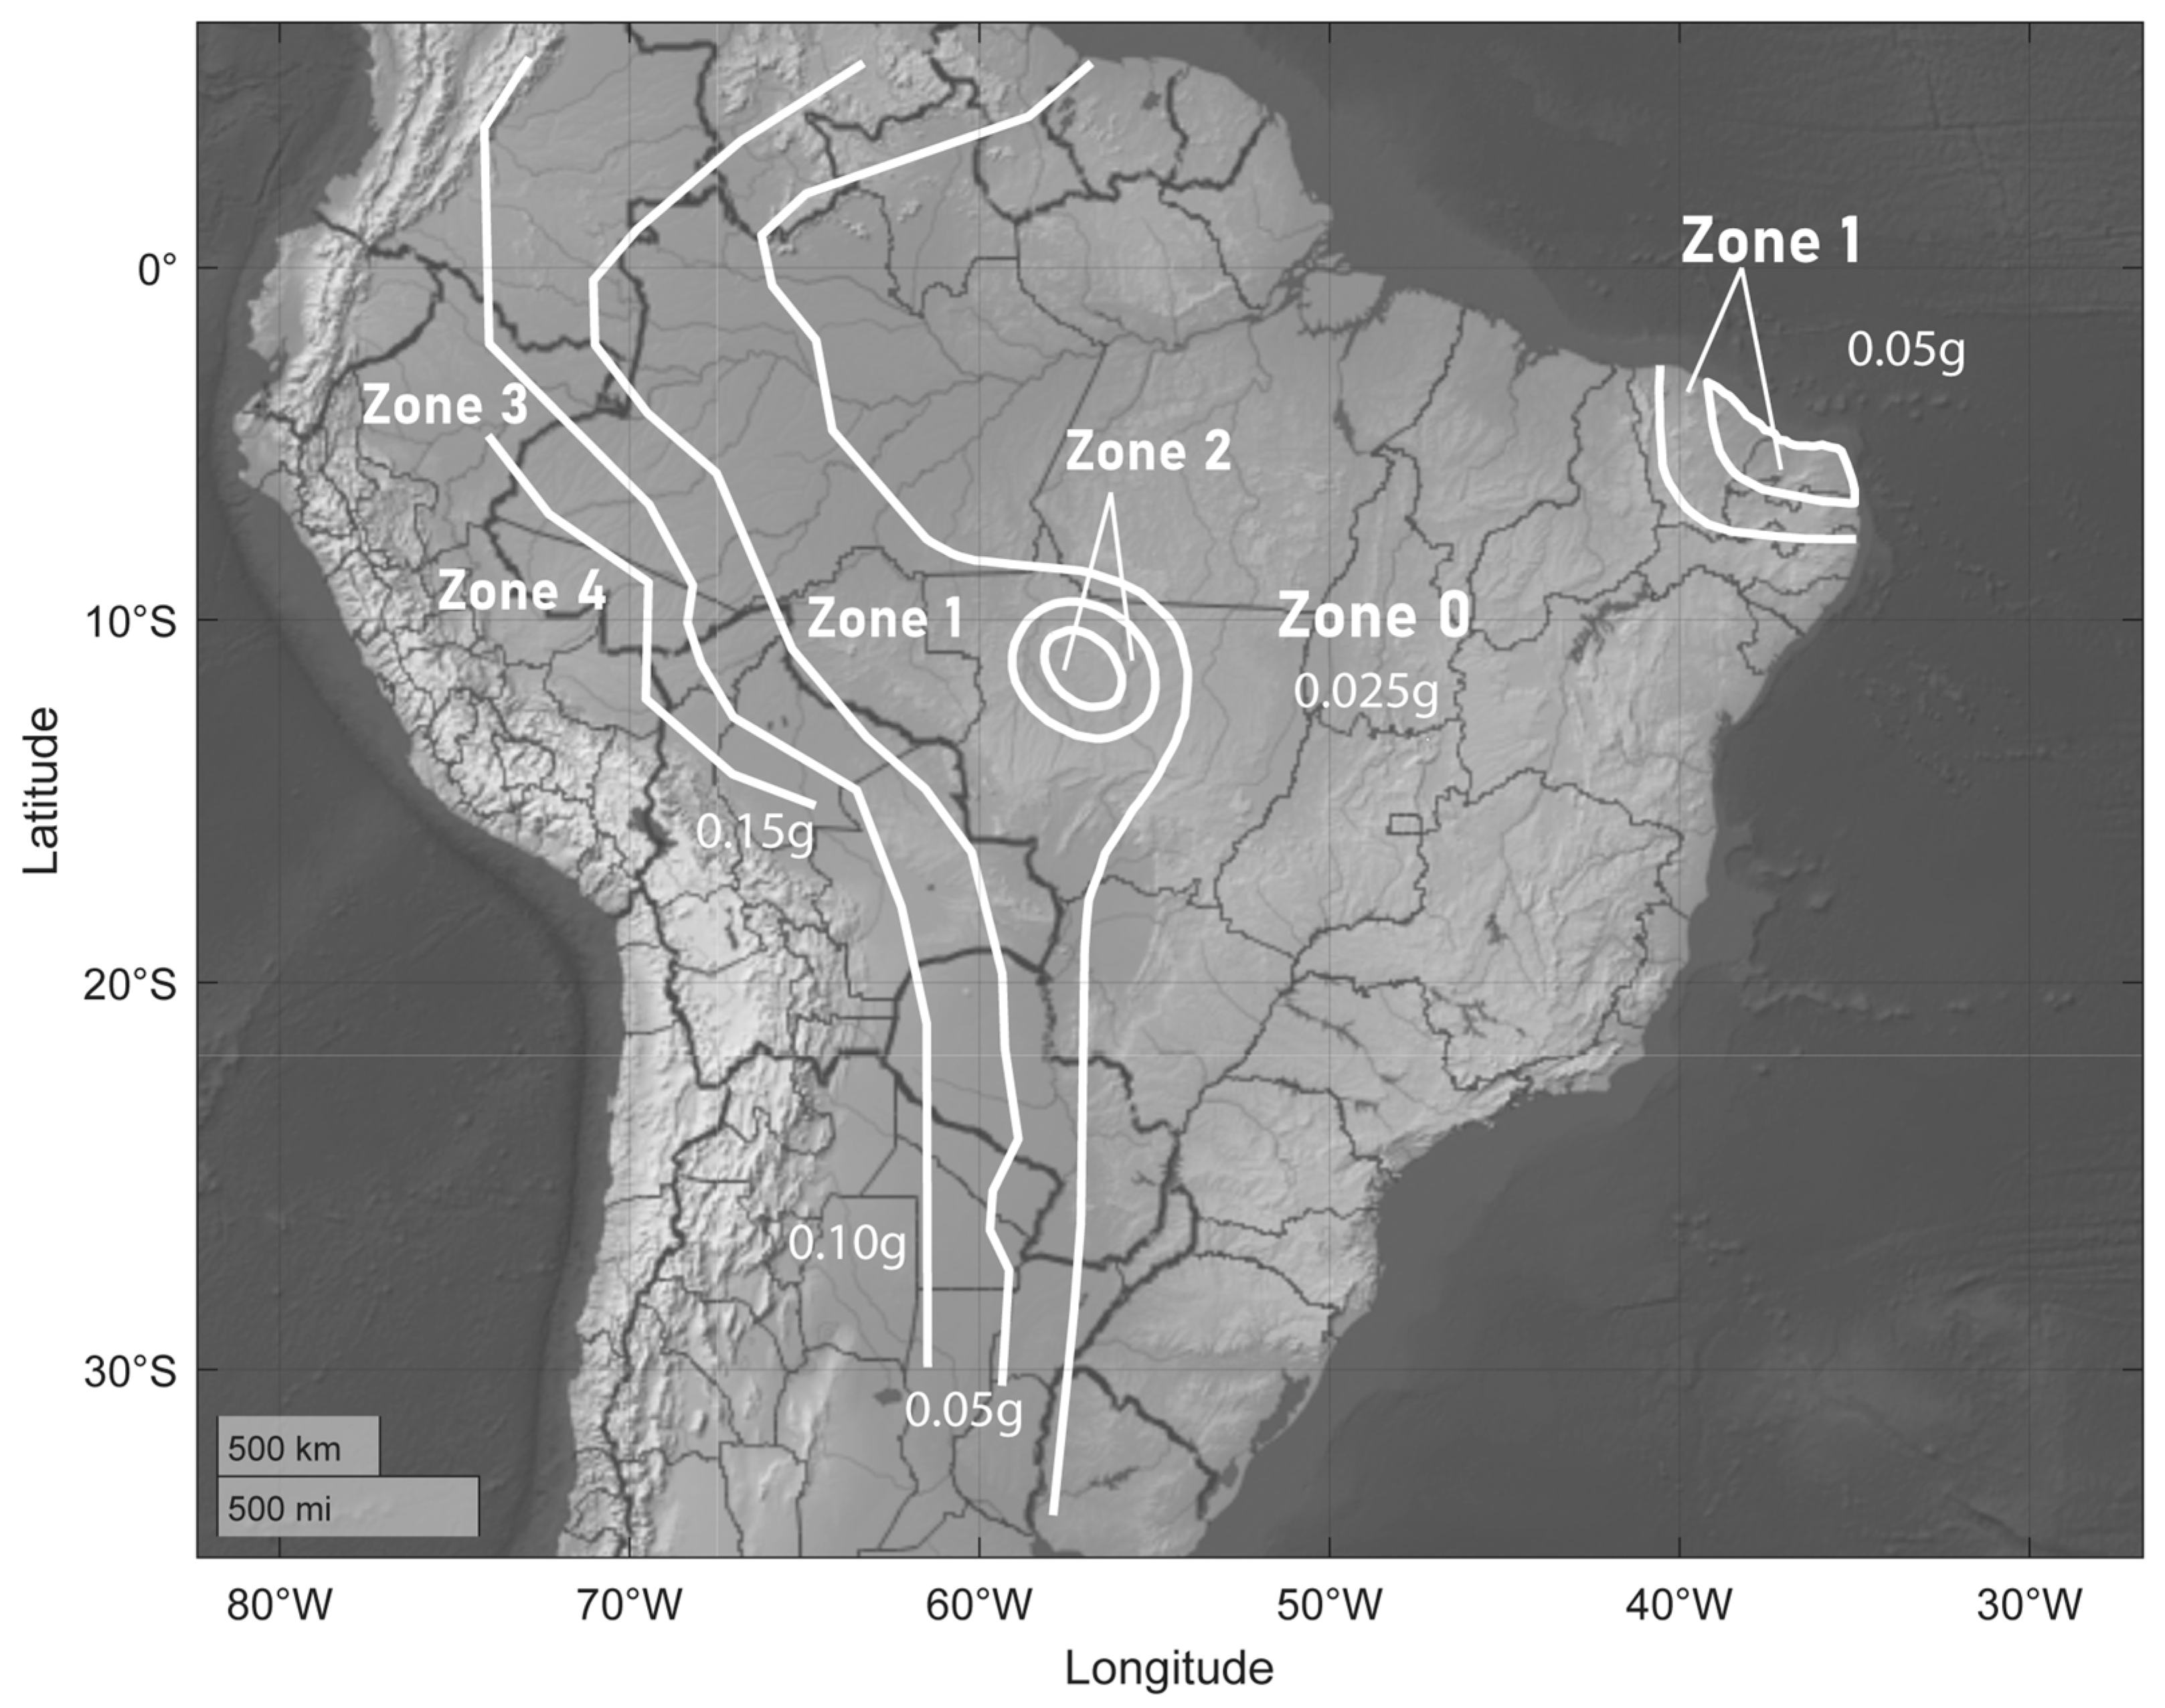
The factor (Z), or seismic zone factor, depends on the seismic hazard of the place where the building is located. Ref. [
20] classifies the Brazilian territory into five distinct seismic zones. Characterized by similar levels of seismicity, these zones establish the horizontal acceleration values standardized for Class B soil conditions, with magnitudes ranging from 0.025 g to 0.15 g, regardless of the structural period.
Table 4 details the corresponding
value intervals for each seismic zone.
The ground index (
) accounts for the influence of surface soil amplification, geological conditions, and soil–structure interaction on the expected seismic motion characteristics (
Table 5). These values correspond to the seismic soil amplification factors extracted from [
20]. The soil classification ranges from A to E, where A represents hard rock, B is rock, C is very dense soil and soft rock, D is stiff soil, and E is soft clay. The classification of the site should be based on the average shear wave velocity,
, and the average standard penetration resistance,
, as specified in [
20]. Each soil class is associated with specific values of
and
, following the classification criteria established in ASCE 7-10 [
21].
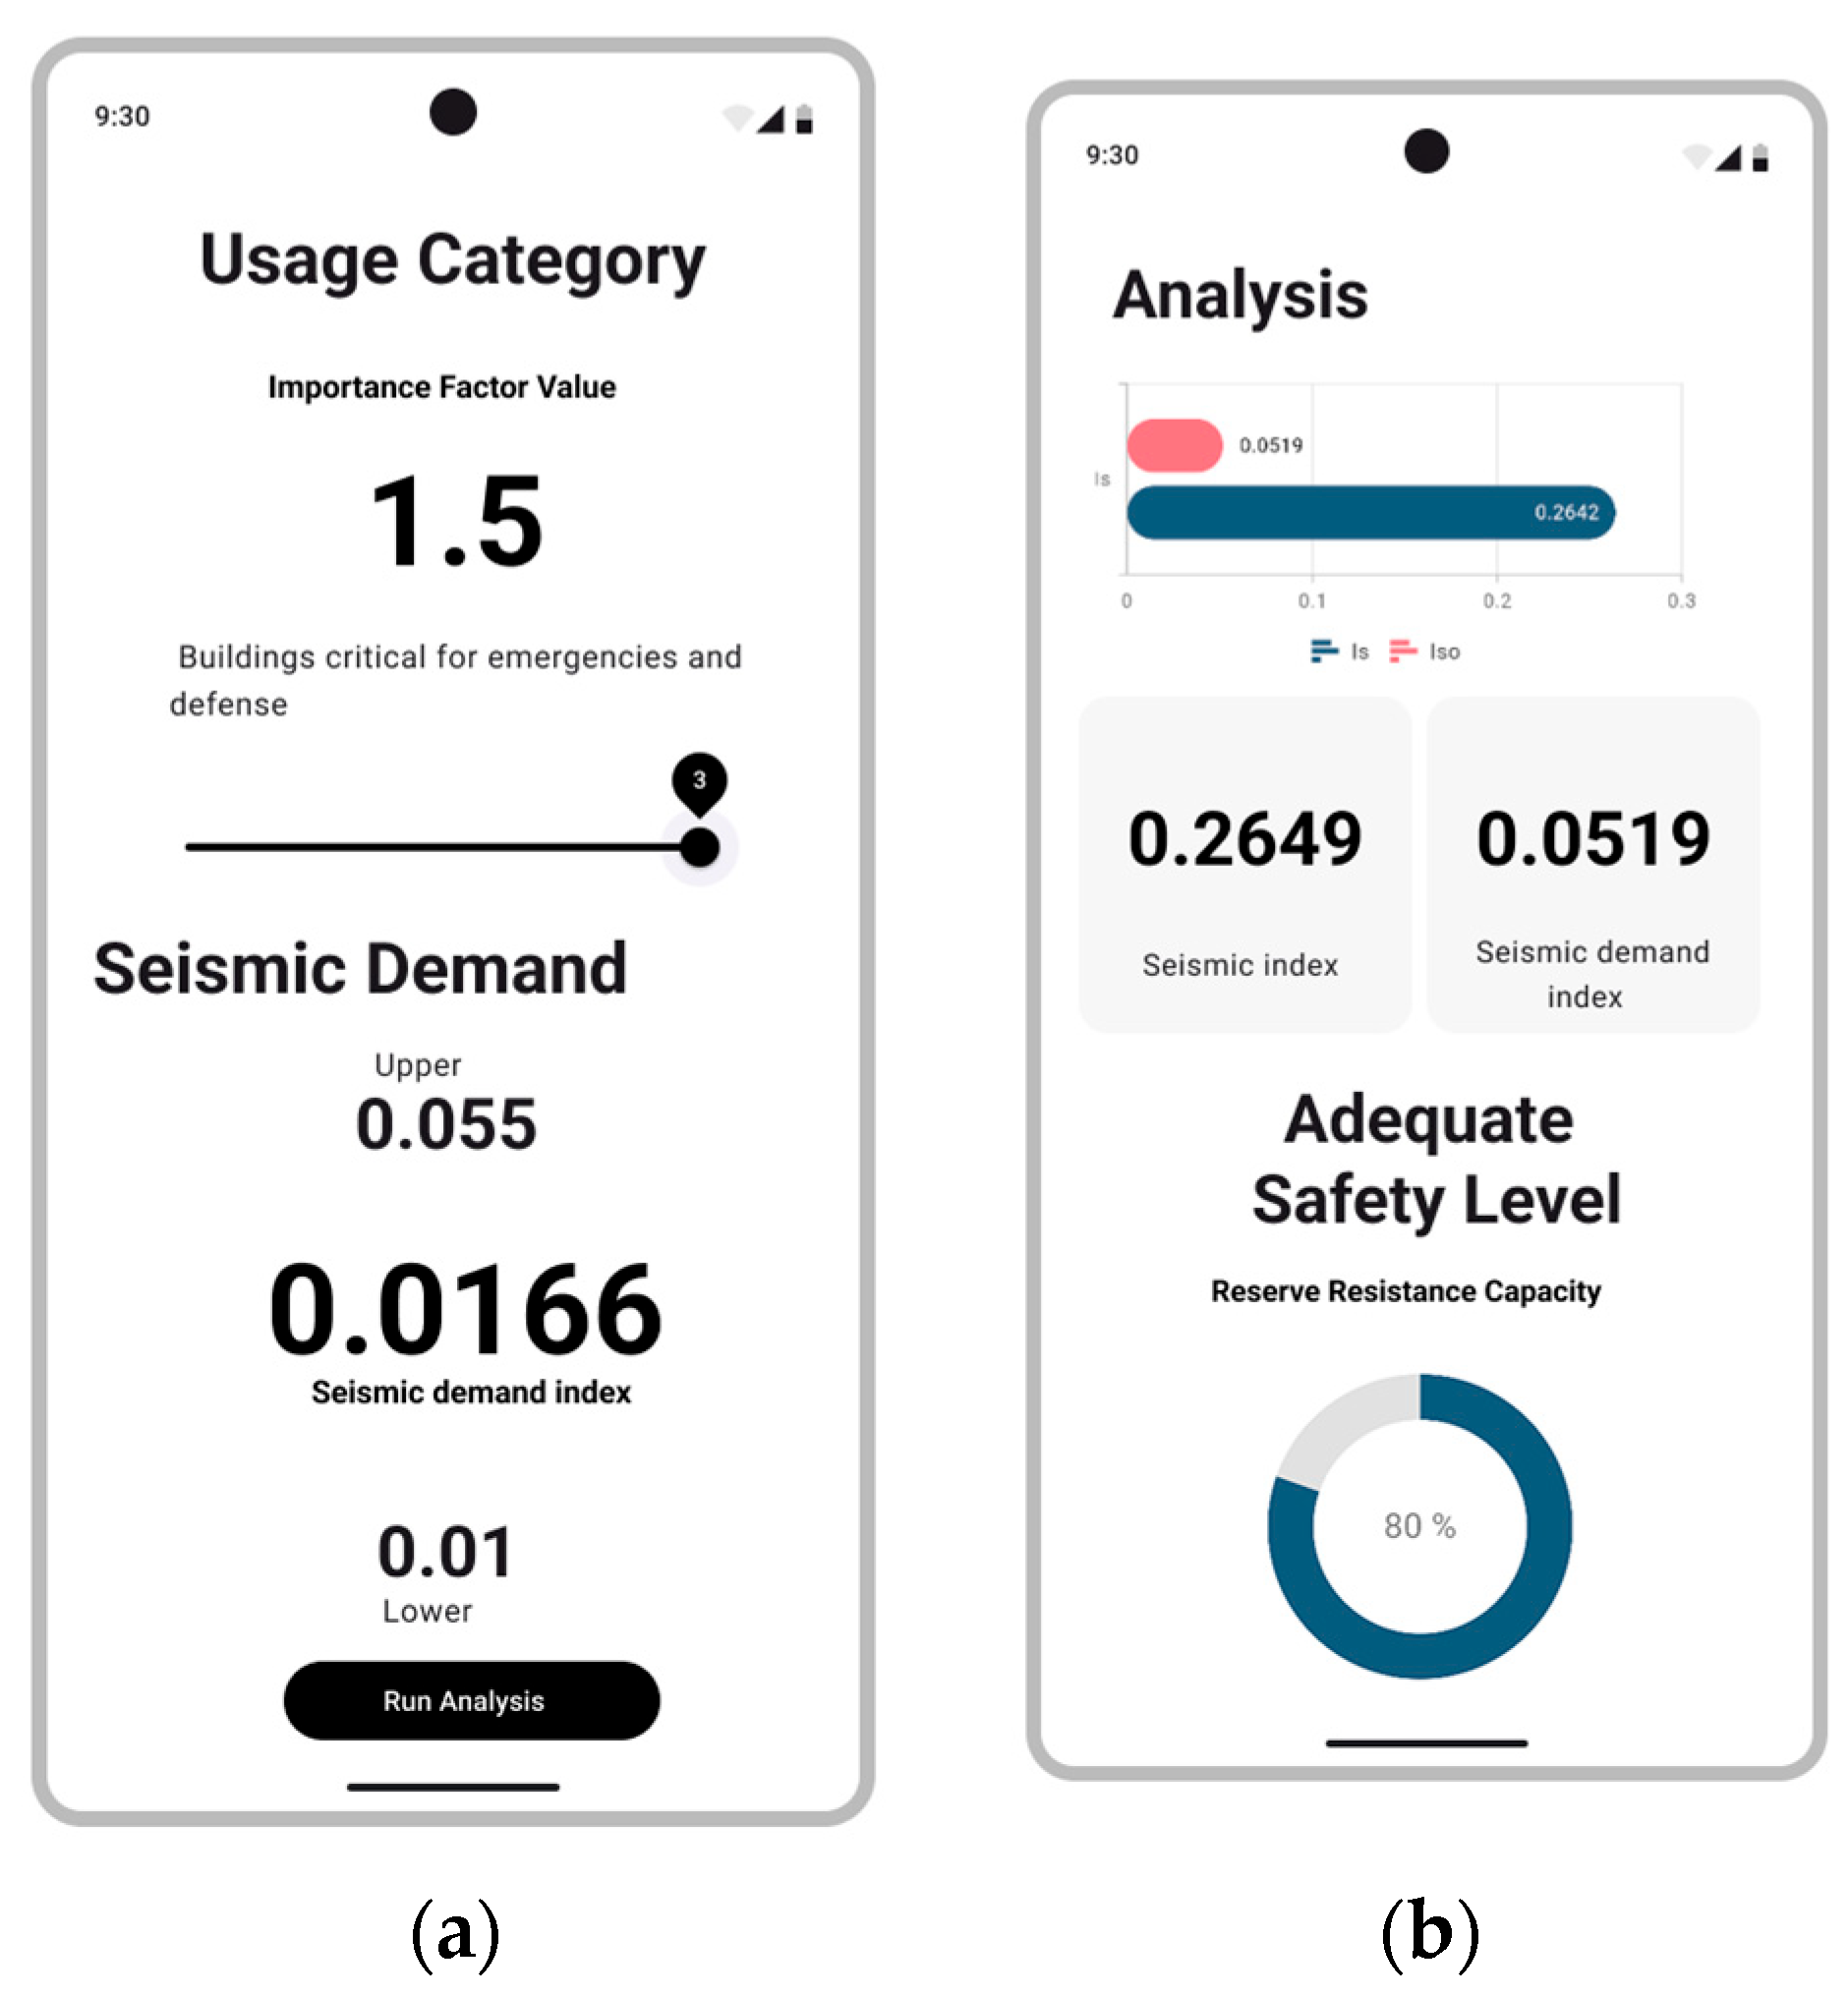
During seismic events, certain structures assume heightened importance due to their critical role in providing essential services to the population and supporting emergency response efforts. Representative examples include healthcare facilities with emergency care services, fire stations, power generation facilities, water treatment plants, and buildings that house highly hazardous chemical substances, such as nuclear power plants. To account for this elevated significance, an importance factor is applied, which amplifies the seismic forces considered in the structural design process, thereby ensuring an enhanced level of structural safety. This usage index (
) typically ranges from 1.0 to 1.5, with the highest values assigned to facilities of greatest criticality, as specified in
Table 6.
is compared with the seismic demand index of the structure. If the value of
is greater than or equal to
, the building is considered safe in the event of an earthquake. On the other hand, if
is lower than
, the building may have uncertain performance when subjected to the assumed seismic event [
17].
The structural reserve of load-bearing capacity (
) quantifies the difference between the seismic index (
) and the seismic demand index (
), represented as a percentage of
[
19]. This reserve capacity is calculated using the following equation:
The approximate fundamental period adopted in this work is calculated according to the method described in [
20]. Notably, the Brazilian seismic code employs the same formulation proposed by [
21]. Therefore, the fundamental period is determined using the following equation:
where
;
5. Results
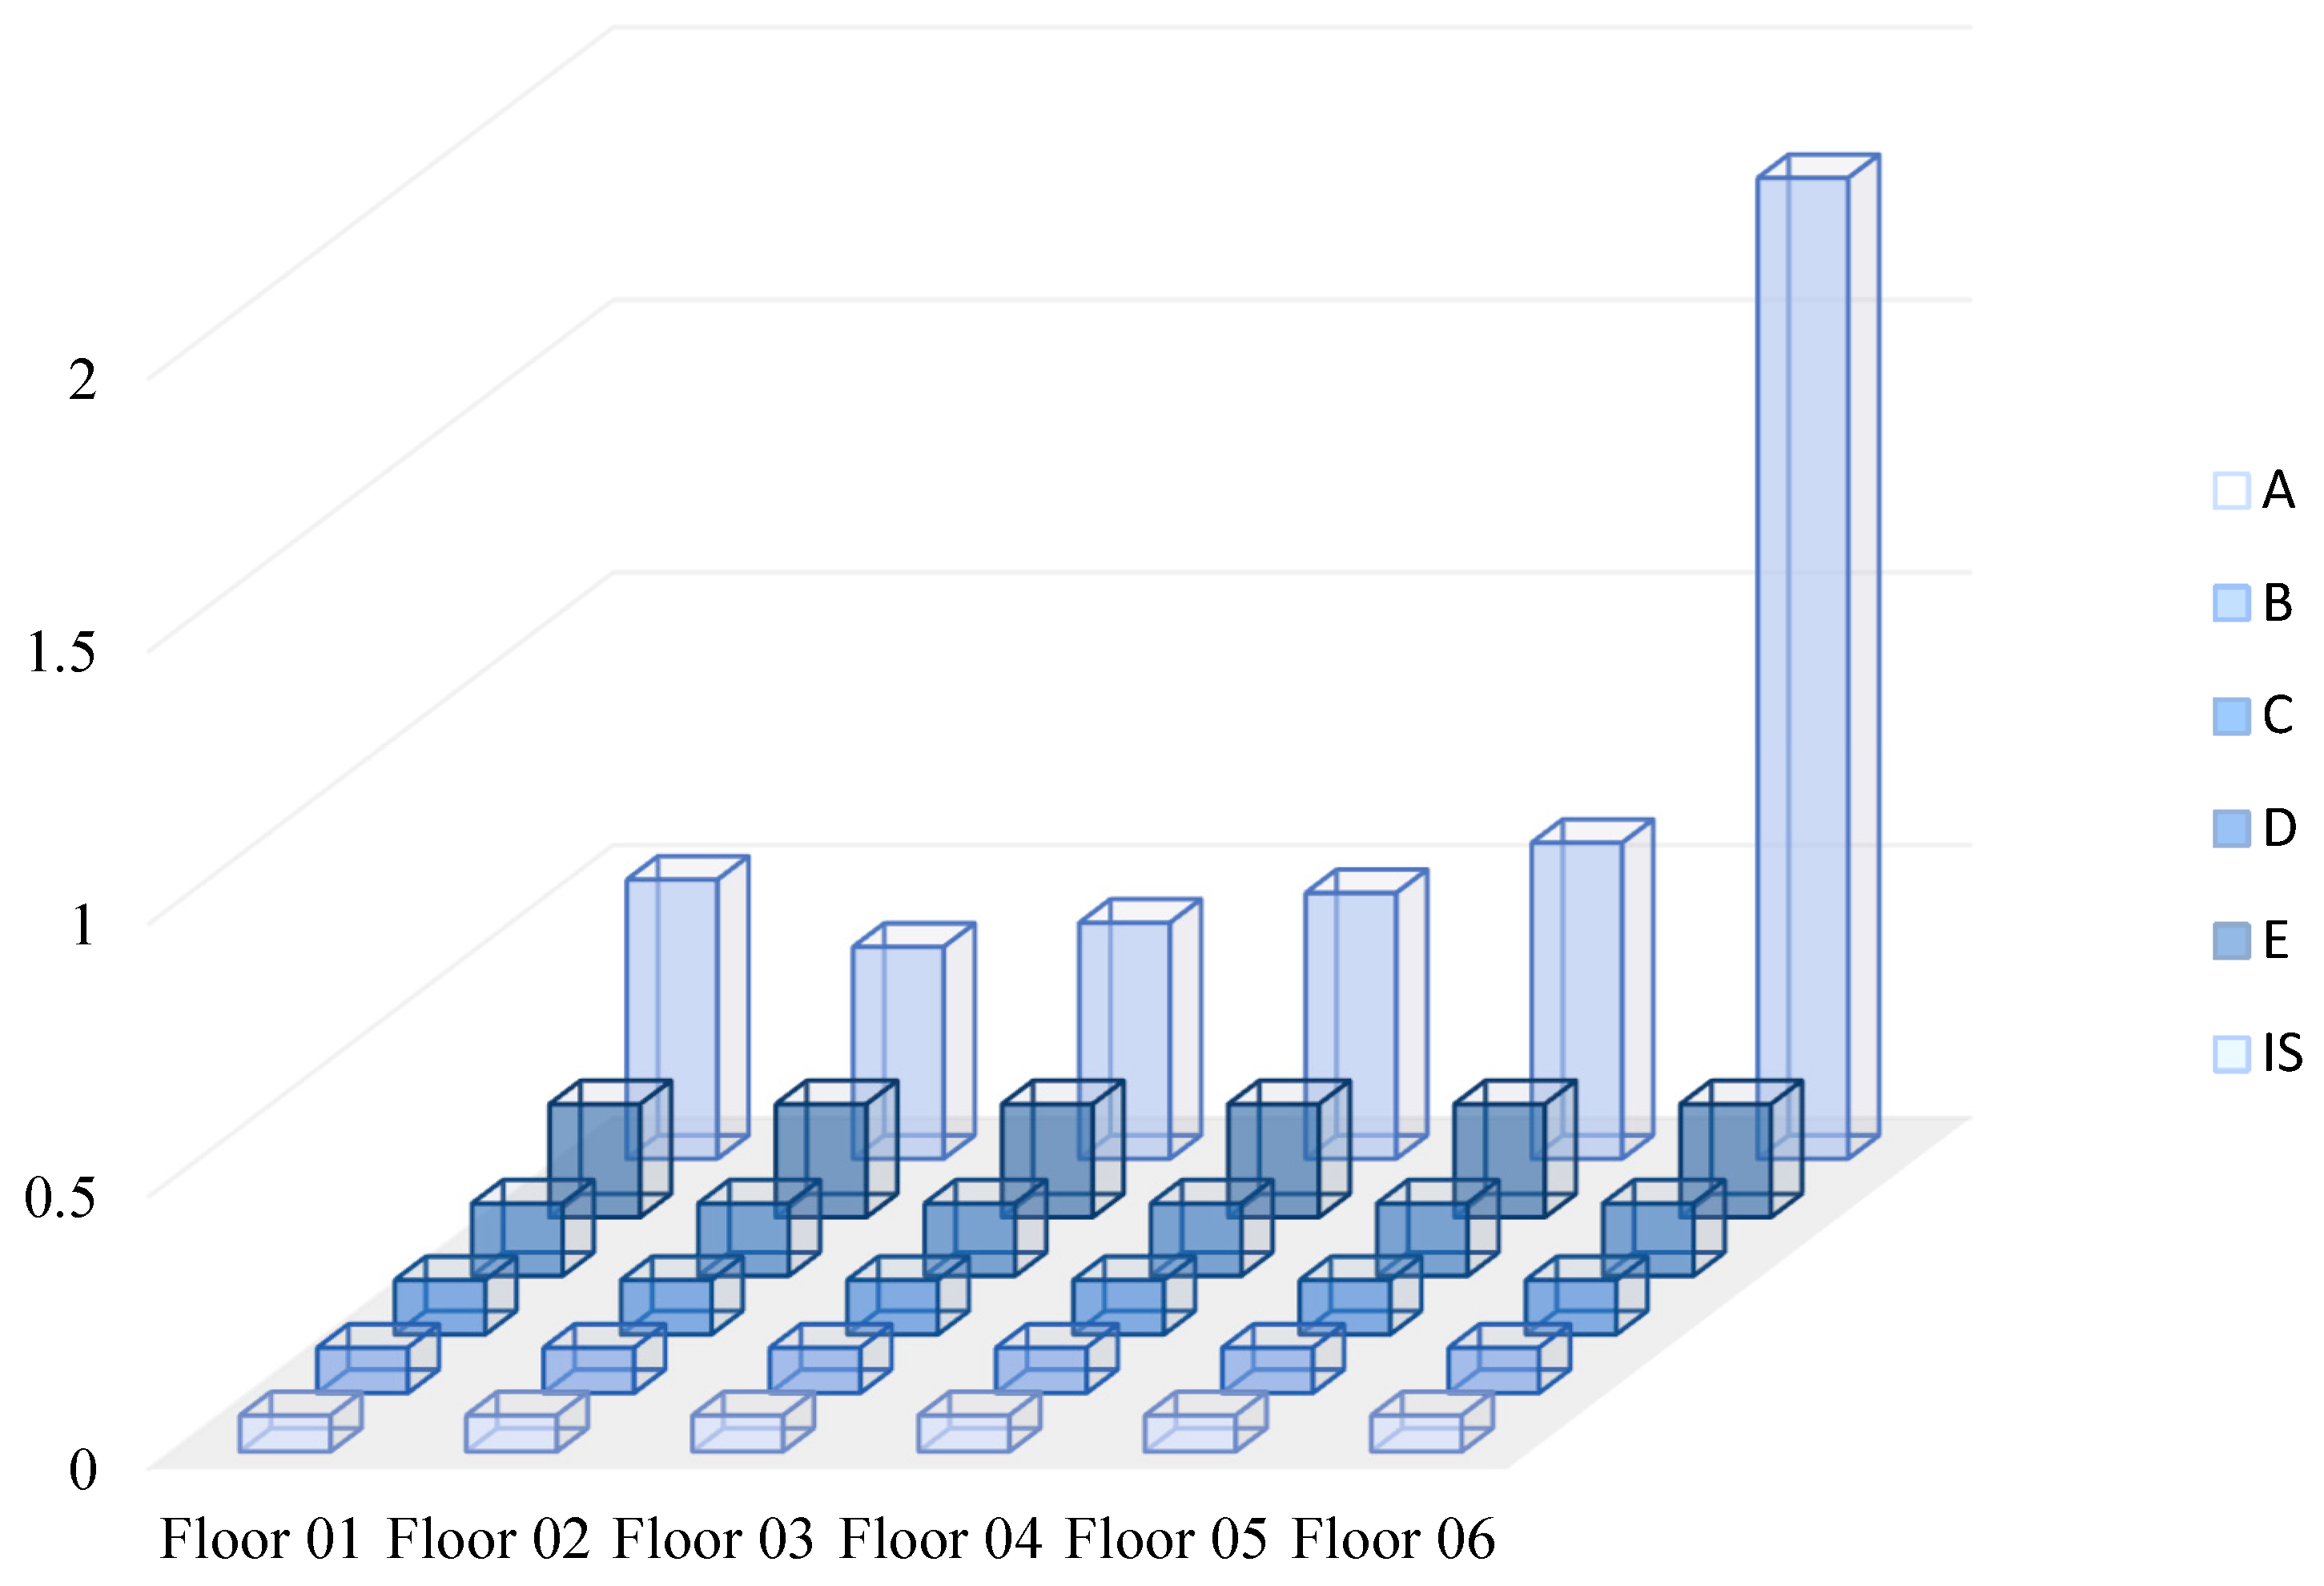
Table 10 presents a consolidated summary of the performance indices, including the basic structural performance sub-index, the structural configuration sub-index, and the structural deterioration sub-index, categorized by floor within the structure of the Palace.
A series of combinations of structural elements was proposed for comparative analysis. In the C1_AP typology, the focus is on the contribution of the internal columns to the structural behavior, while the concrete sections of the Brise Soleil columns are considered exclusively on the top floor due to their connection with the roof structure. The C2_APB (
Table 11) case extends the analysis to include both the internal columns and the concrete sections of the Brise Soleil columns across all floors. The C3_APW typology limits the analysis to the internal columns and the structural walls that constitute the rigid cores of the building, excluding the Brise Soleil columns between floors. The final typology, C4_APBW, integrates all previous scenarios, encompassing the contributions of the internal columns, the Brise Soleil columns at each floor level, and the structural walls.
In both the C1_AP and C2_APB (
Table 11) scenarios, the seismic performance sub-indices
are identical for the first and top floors. This equivalence arises from the absence of Brise Soleil columns on the first floor (basement) and the inclusion of these columns on the top floor, where they connect to the roof structure and are, therefore, accounted for in the analysis.
In the C1_AP typology, the values are relatively low, attributed to the reduced concrete cross-sectional area of the columns when compared to the C2_APB typology. The data presented for Case 01 indicate an increase in the values, driven by the variation in the number of columns per floor, specifically an addition of 92 columns starting from the third floor. This adjustment ensures the consistency of the total concrete area across the floors, underscoring the critical role of the variable “Ac2” within the framework of the adapted Hirosawa method. The Ac2 values for each floor are as follows: 229,125 cm2, 208,075 cm2, 194,275 cm2, 221,115 cm2, 221,115 cm2, and 645,975 cm2. The lowest seismic performance index () for the C1_AP case is observed on the second floor, with = 0.2733, whereas the highest seismic performance is achieved on the top floor, with = 1.5838.
Table 12 summarizes the values corresponding to the third typology, wherein the total cross-sectional area of the structural walls (
= 61,400 cm
2) remains consistent across all floors. A significant increase in the
sub-index is noted on the first floor. Nevertheless, the second floor exhibits the lowest seismic performance index, with
= 0.3885. This pattern mirrors the behavior observed on the first floor, characterized by an increase in
. However, the variable continues to be predominantly governed by the cumulative cross-sectional area of the columns.
As a combination of all previous cases, the final case (
Table 13) is characterized by the high seismic performance of the structure, with the lowest seismic performance index,
= 0.5116, recorded on the first floor.
The structural configuration sub-index () achieves its peak value exclusively on the first level. On subsequent floors, the presence of an internal courtyard, recesses, and openings adversely affects the seismic performance index ( = 0.972). The sole exception is the third floor ( = 1.08), which lacks any floor plan openings. Due to the geometry, challenges are encountered in determining the () sub-index and its associated factors (a, b, c, and j). These challenges arise due to the triple-height space commencing on the third floor to accommodate the garden, and the configuration of columns originating at this level, which imposes an irregular distribution of stiffness across the vertical structural elements.
The structural deterioration sub-index (
) is consistently set at 0.8 for the entire structure, which is a value attributed to the building’s age.
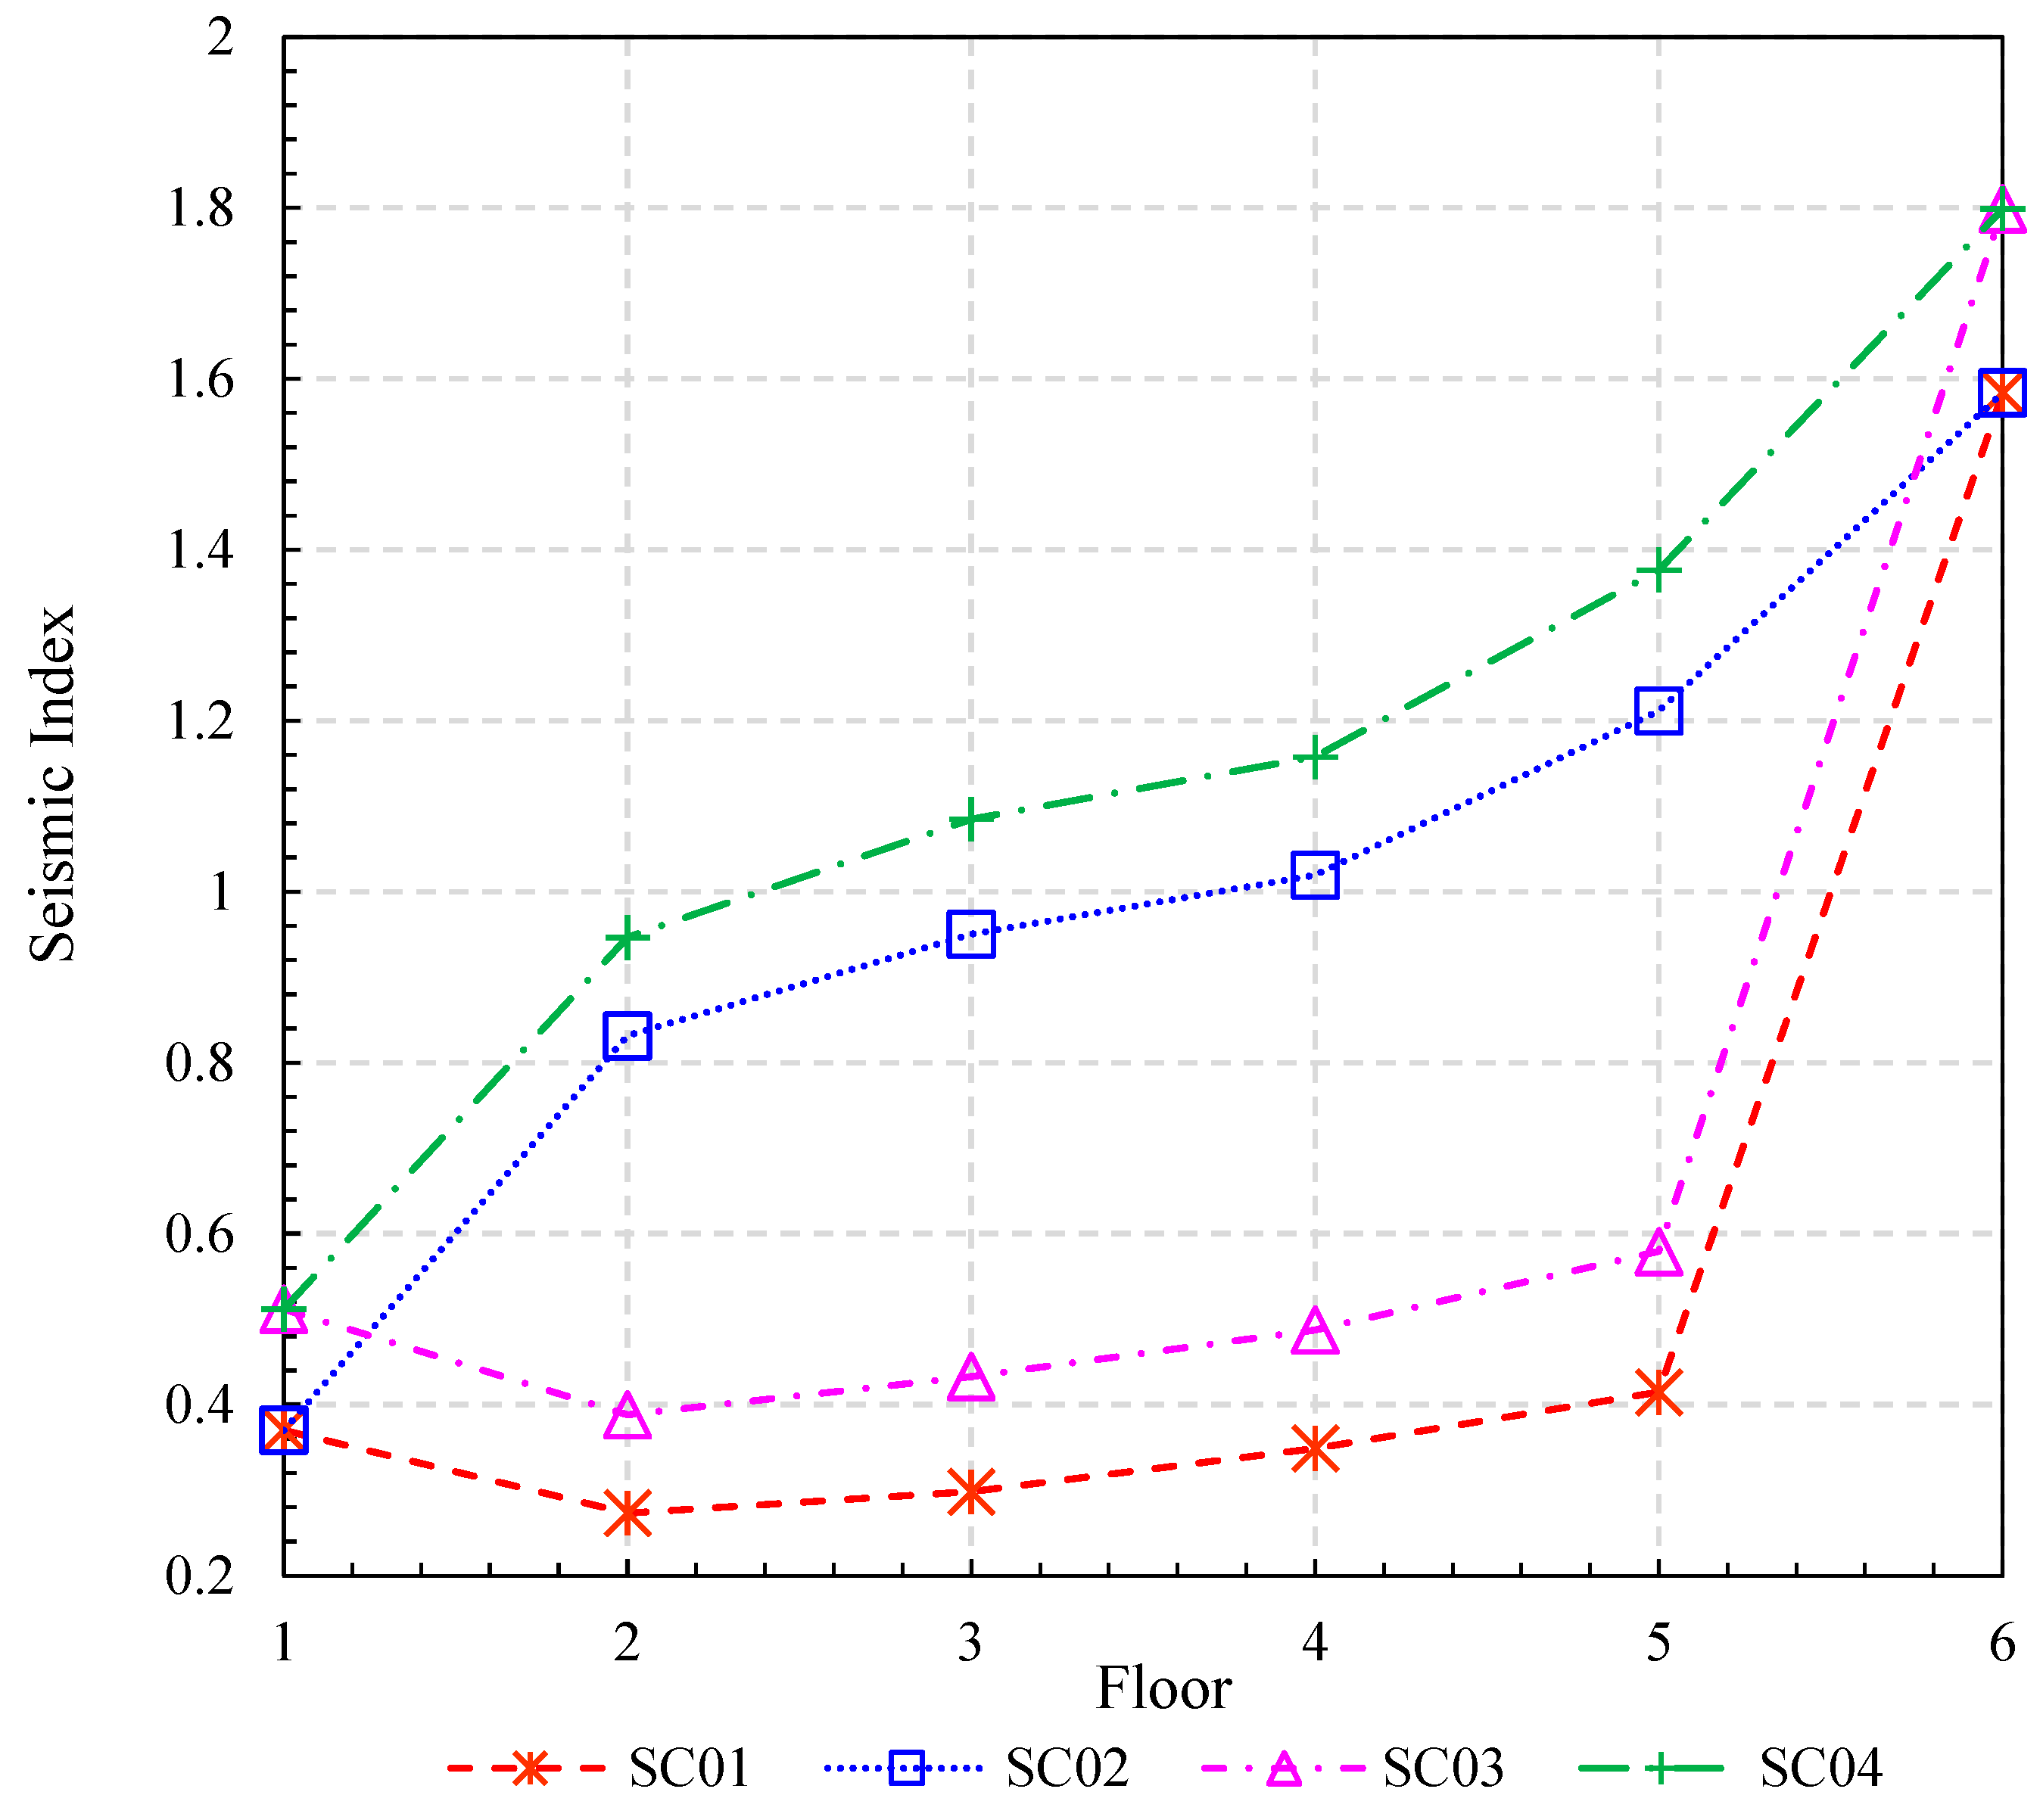
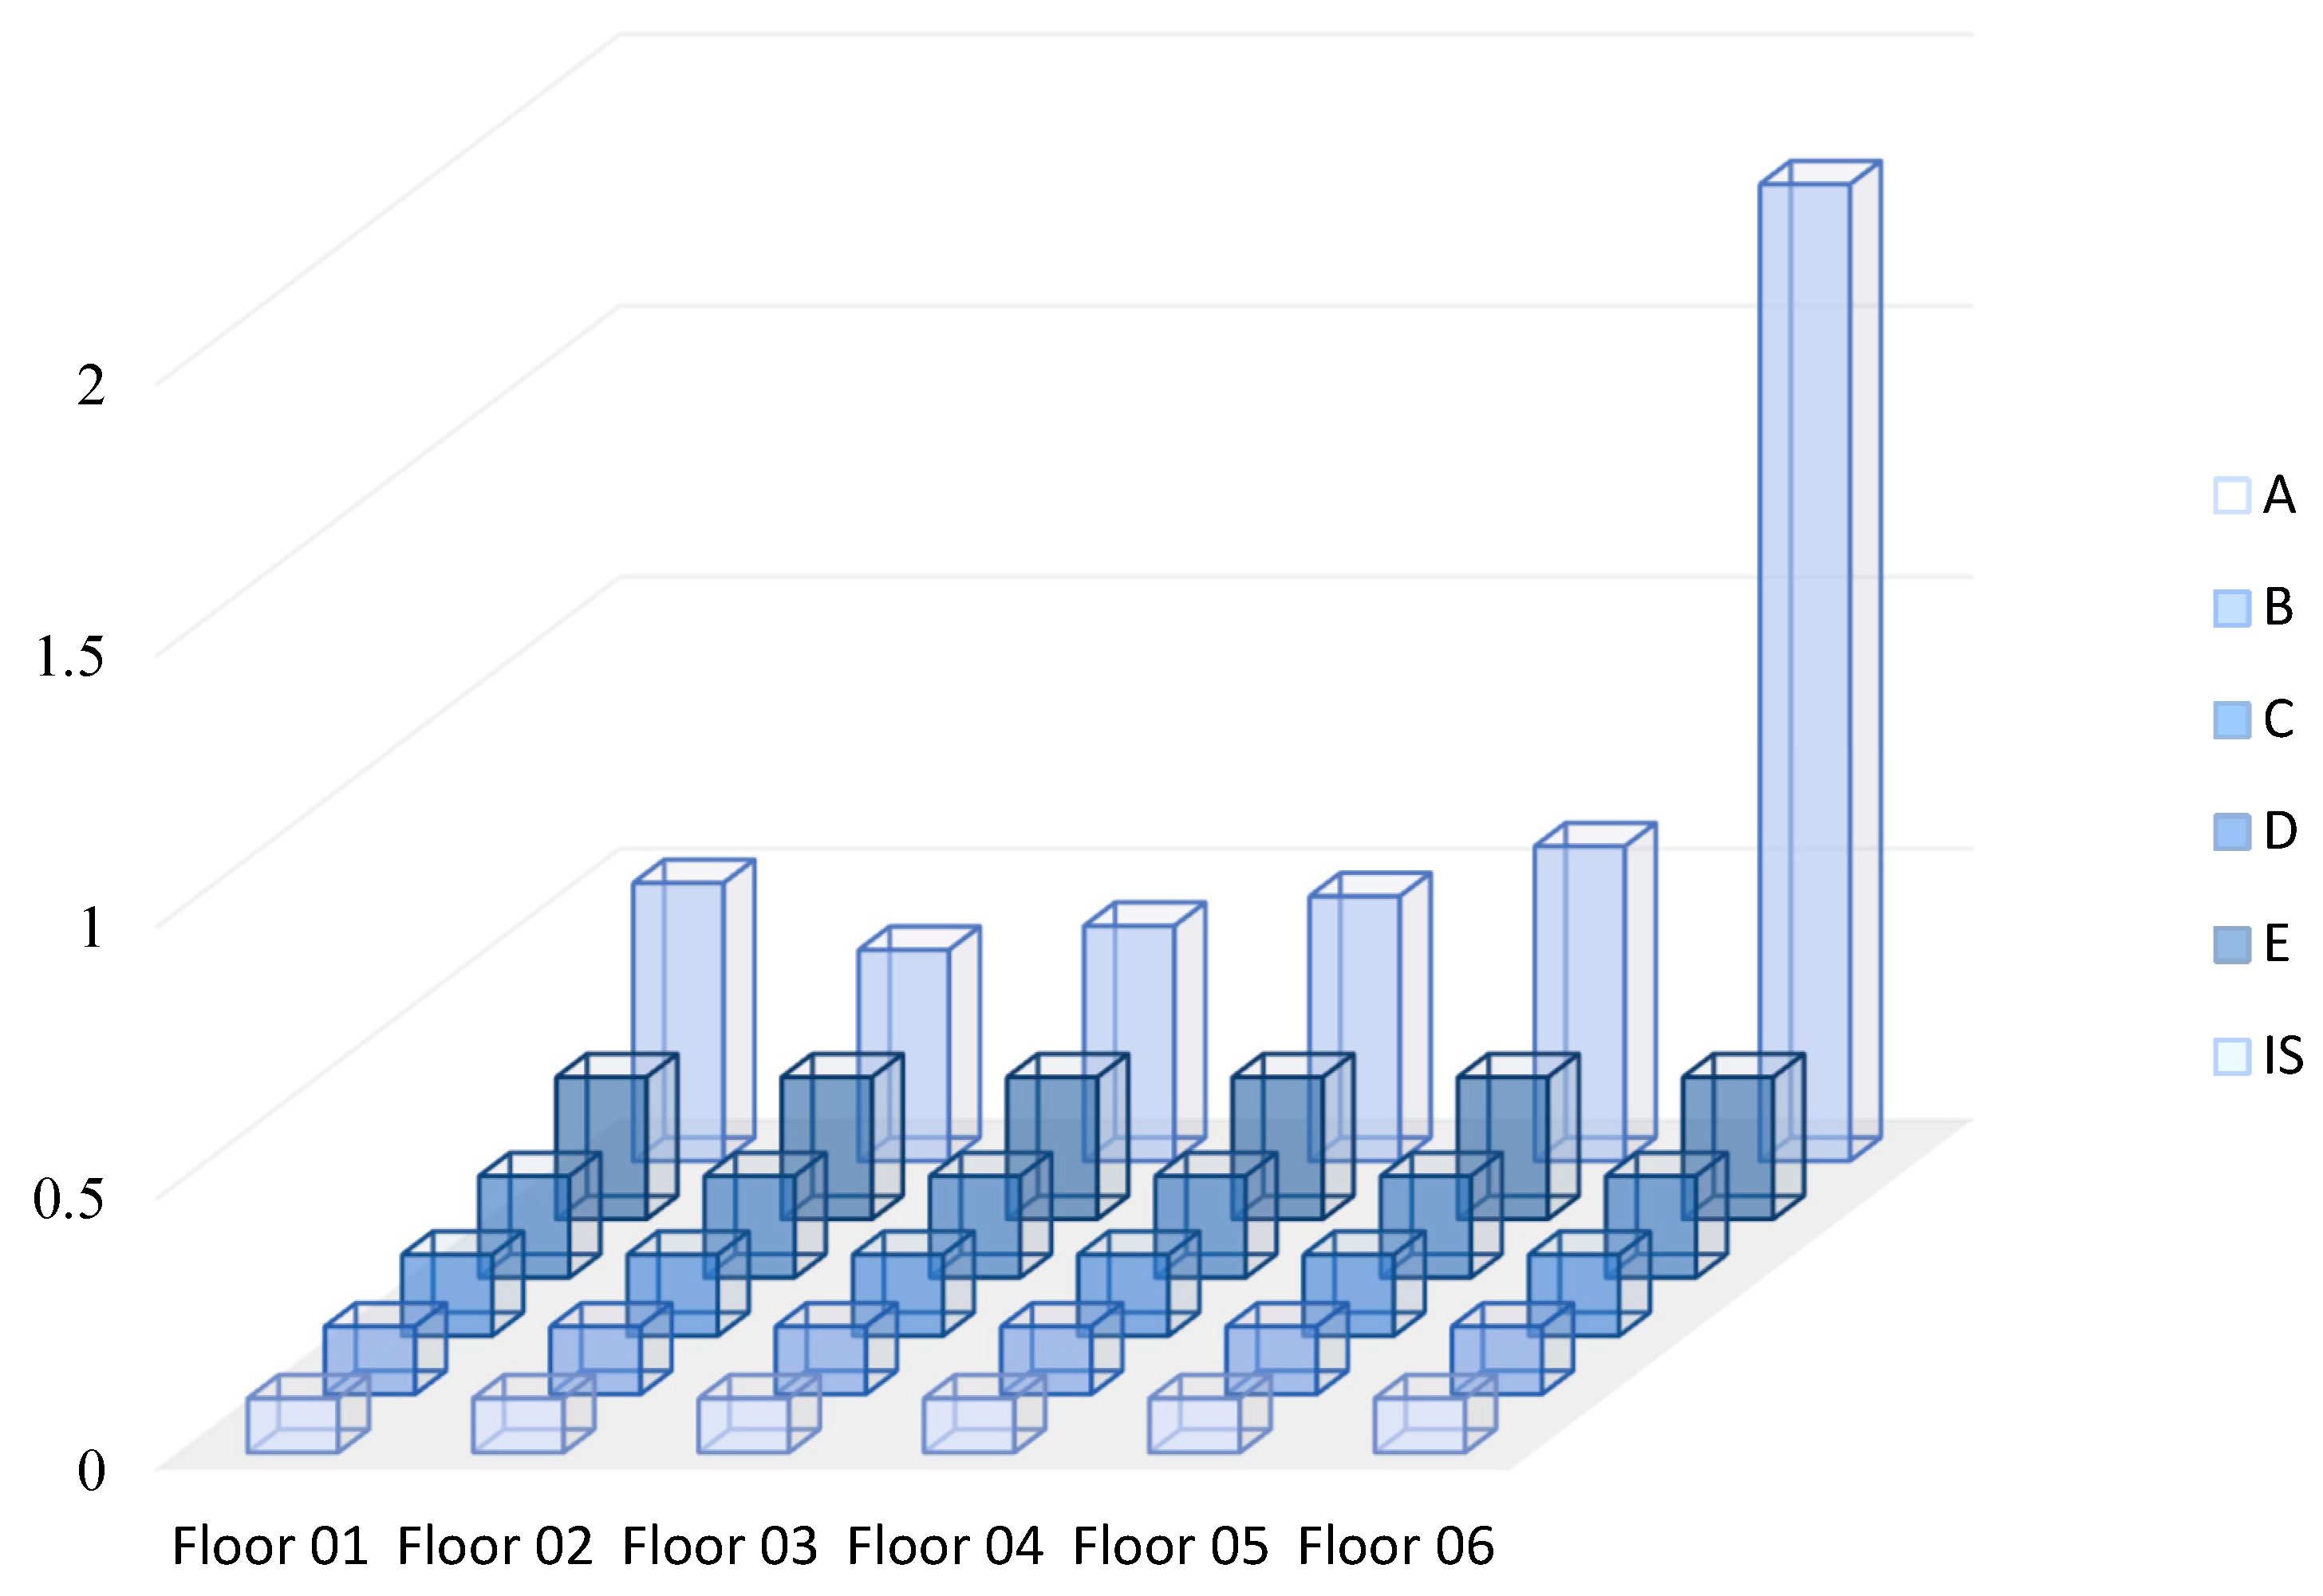
Figure 11 presents all combination scenarios alongside the seismic performance index (
) results for the respective floors.
In the subsequent analyses, the contribution of the cross-sectional area of the walls is taken into account, with the Brise pillars contributing exclusively on the top floor (typology C3_APW). The Palace of Justice’s structure is categorized under usage classification U = 1.0, consistent with the other palaces. Therefore, the values of the seismic demand index,
, spanning zones 0 through 4, are presented in
Table 14.
The seismic vulnerability of the Palace of Justice’s structure is not accounted for in any seismic zone, particularly in soft soils (Class E).
Figure 12,
Figure 13,
Figure 14 and
Figure 15 compare the seismic demand index and the seismic performance index of the structure.
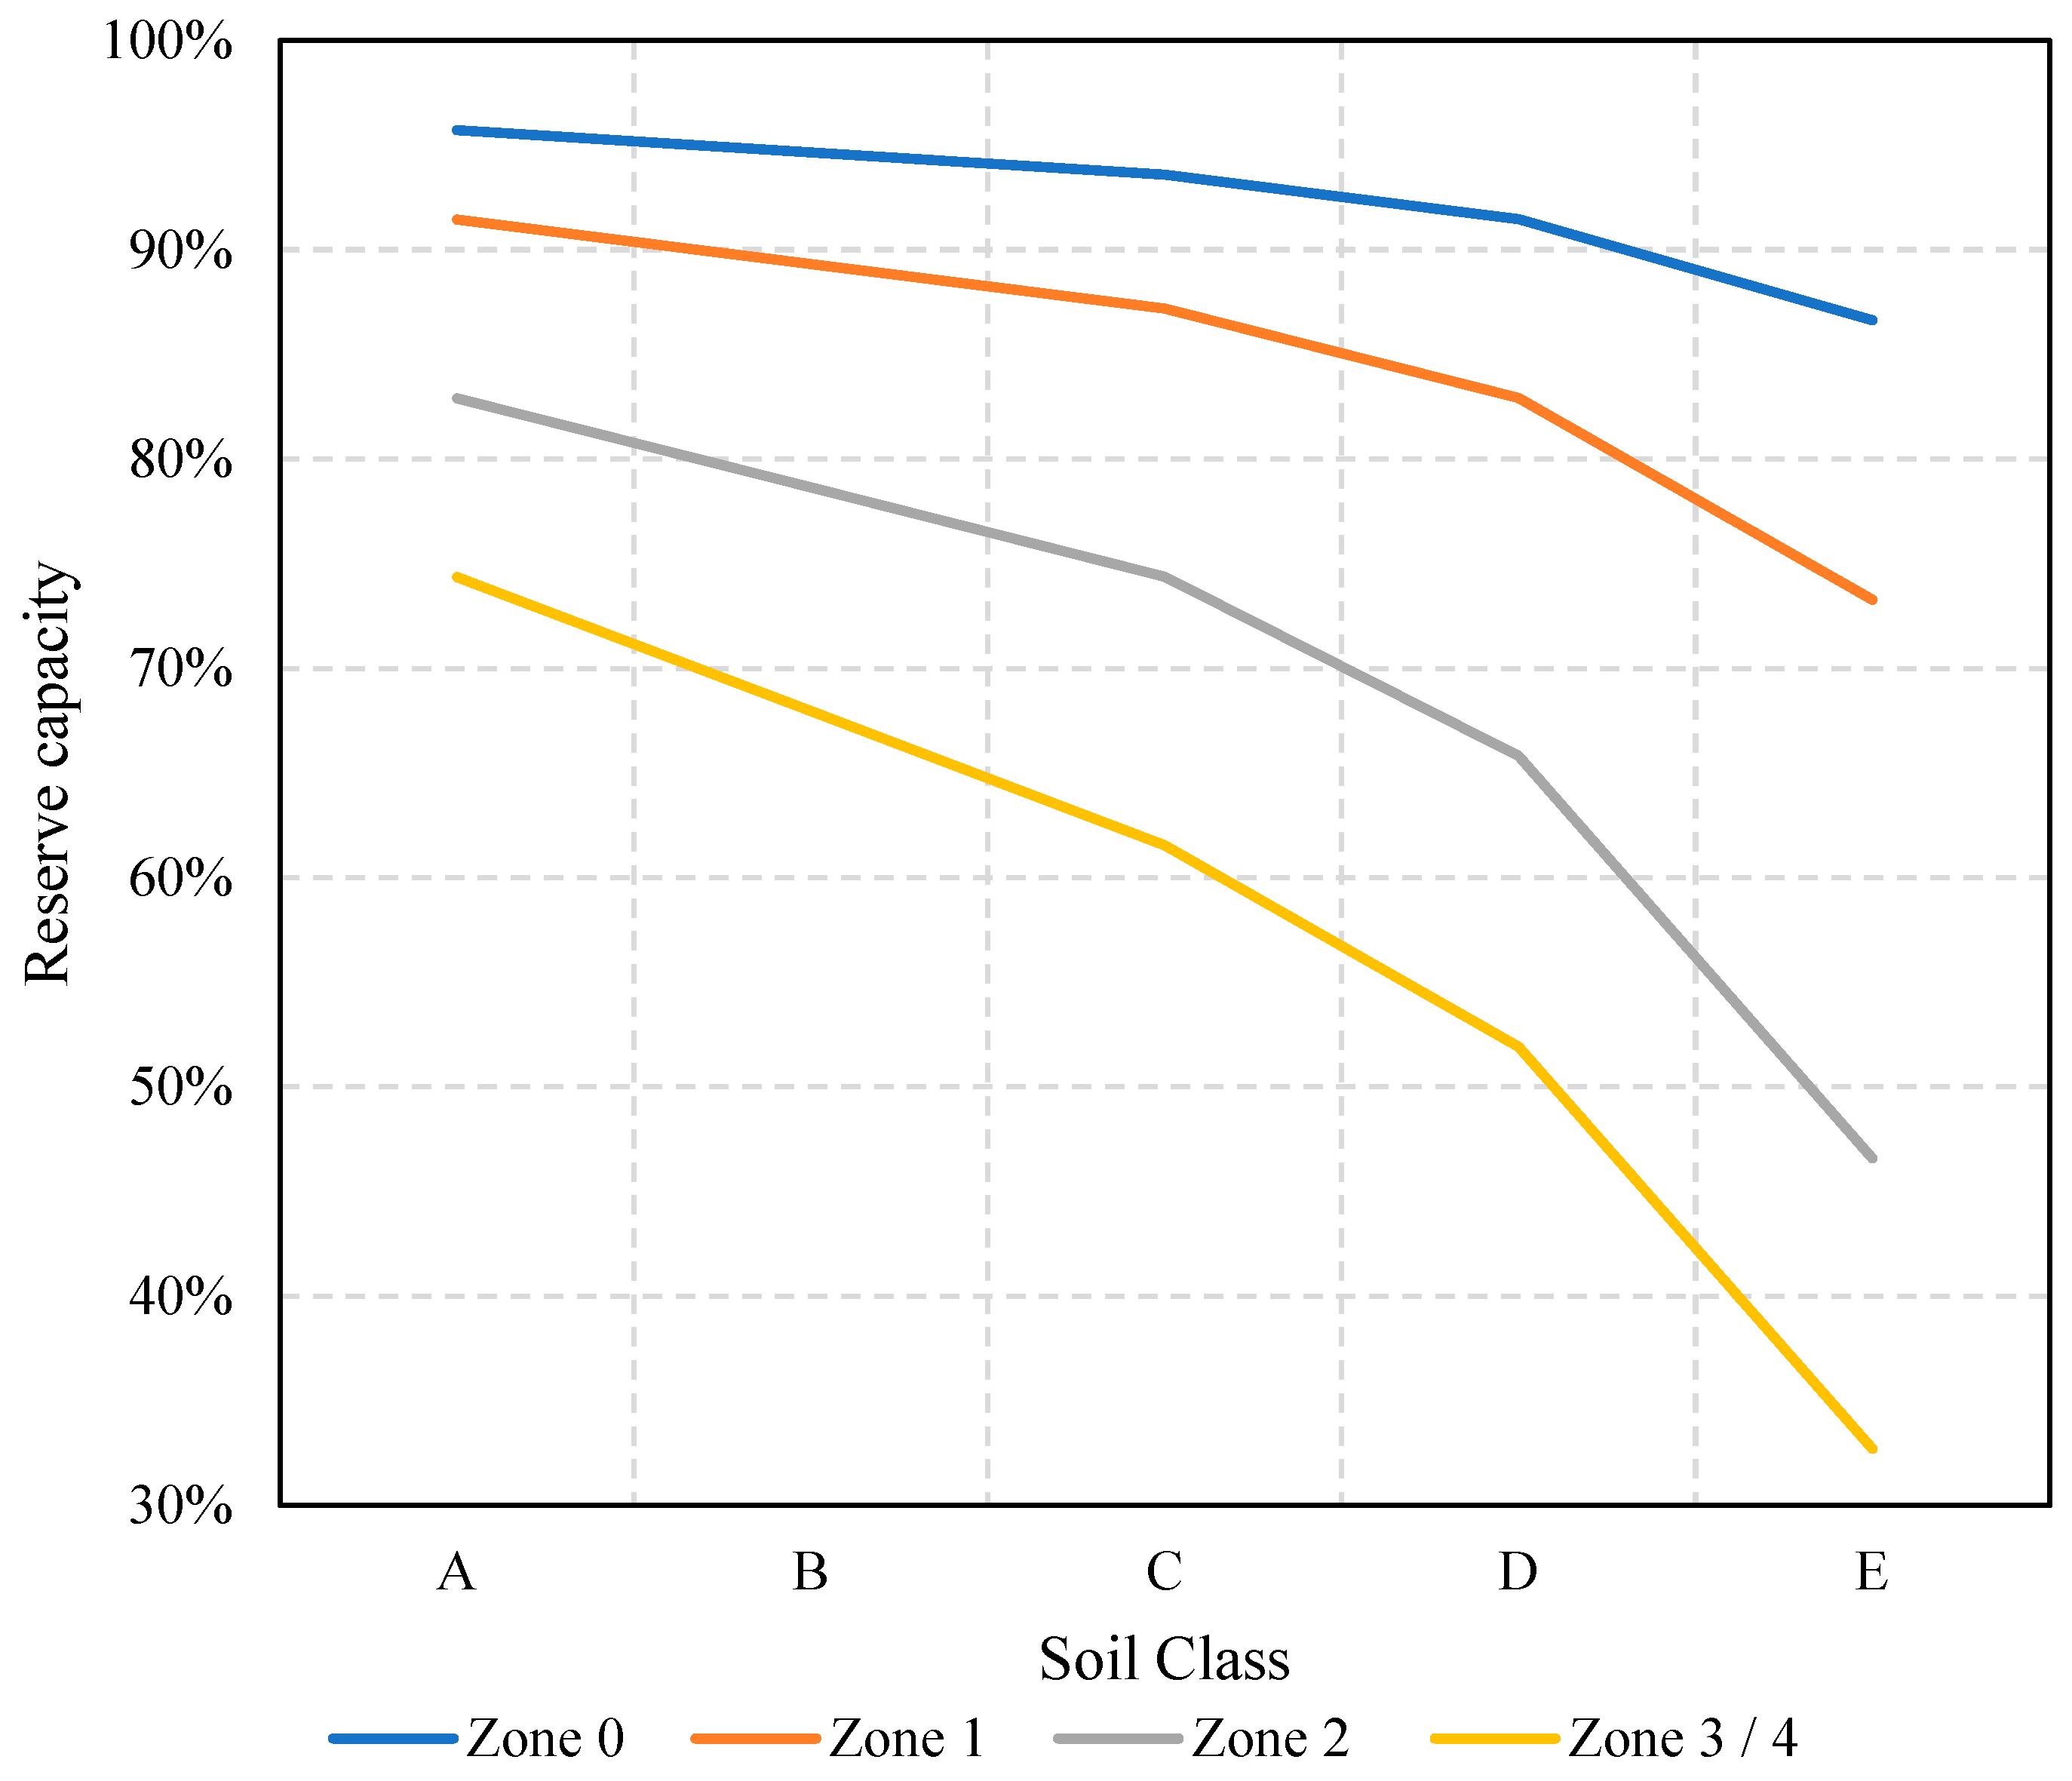
Figure 16 consolidates the resistant capacity reserves of the Palace of Justice, corresponding to
= 0.3885. Should the structure be assigned an importance factor of U = 1.5,
would be adversely affected, indicating structural vulnerability in seismic zones 3 and 4 under Class E soil conditions.
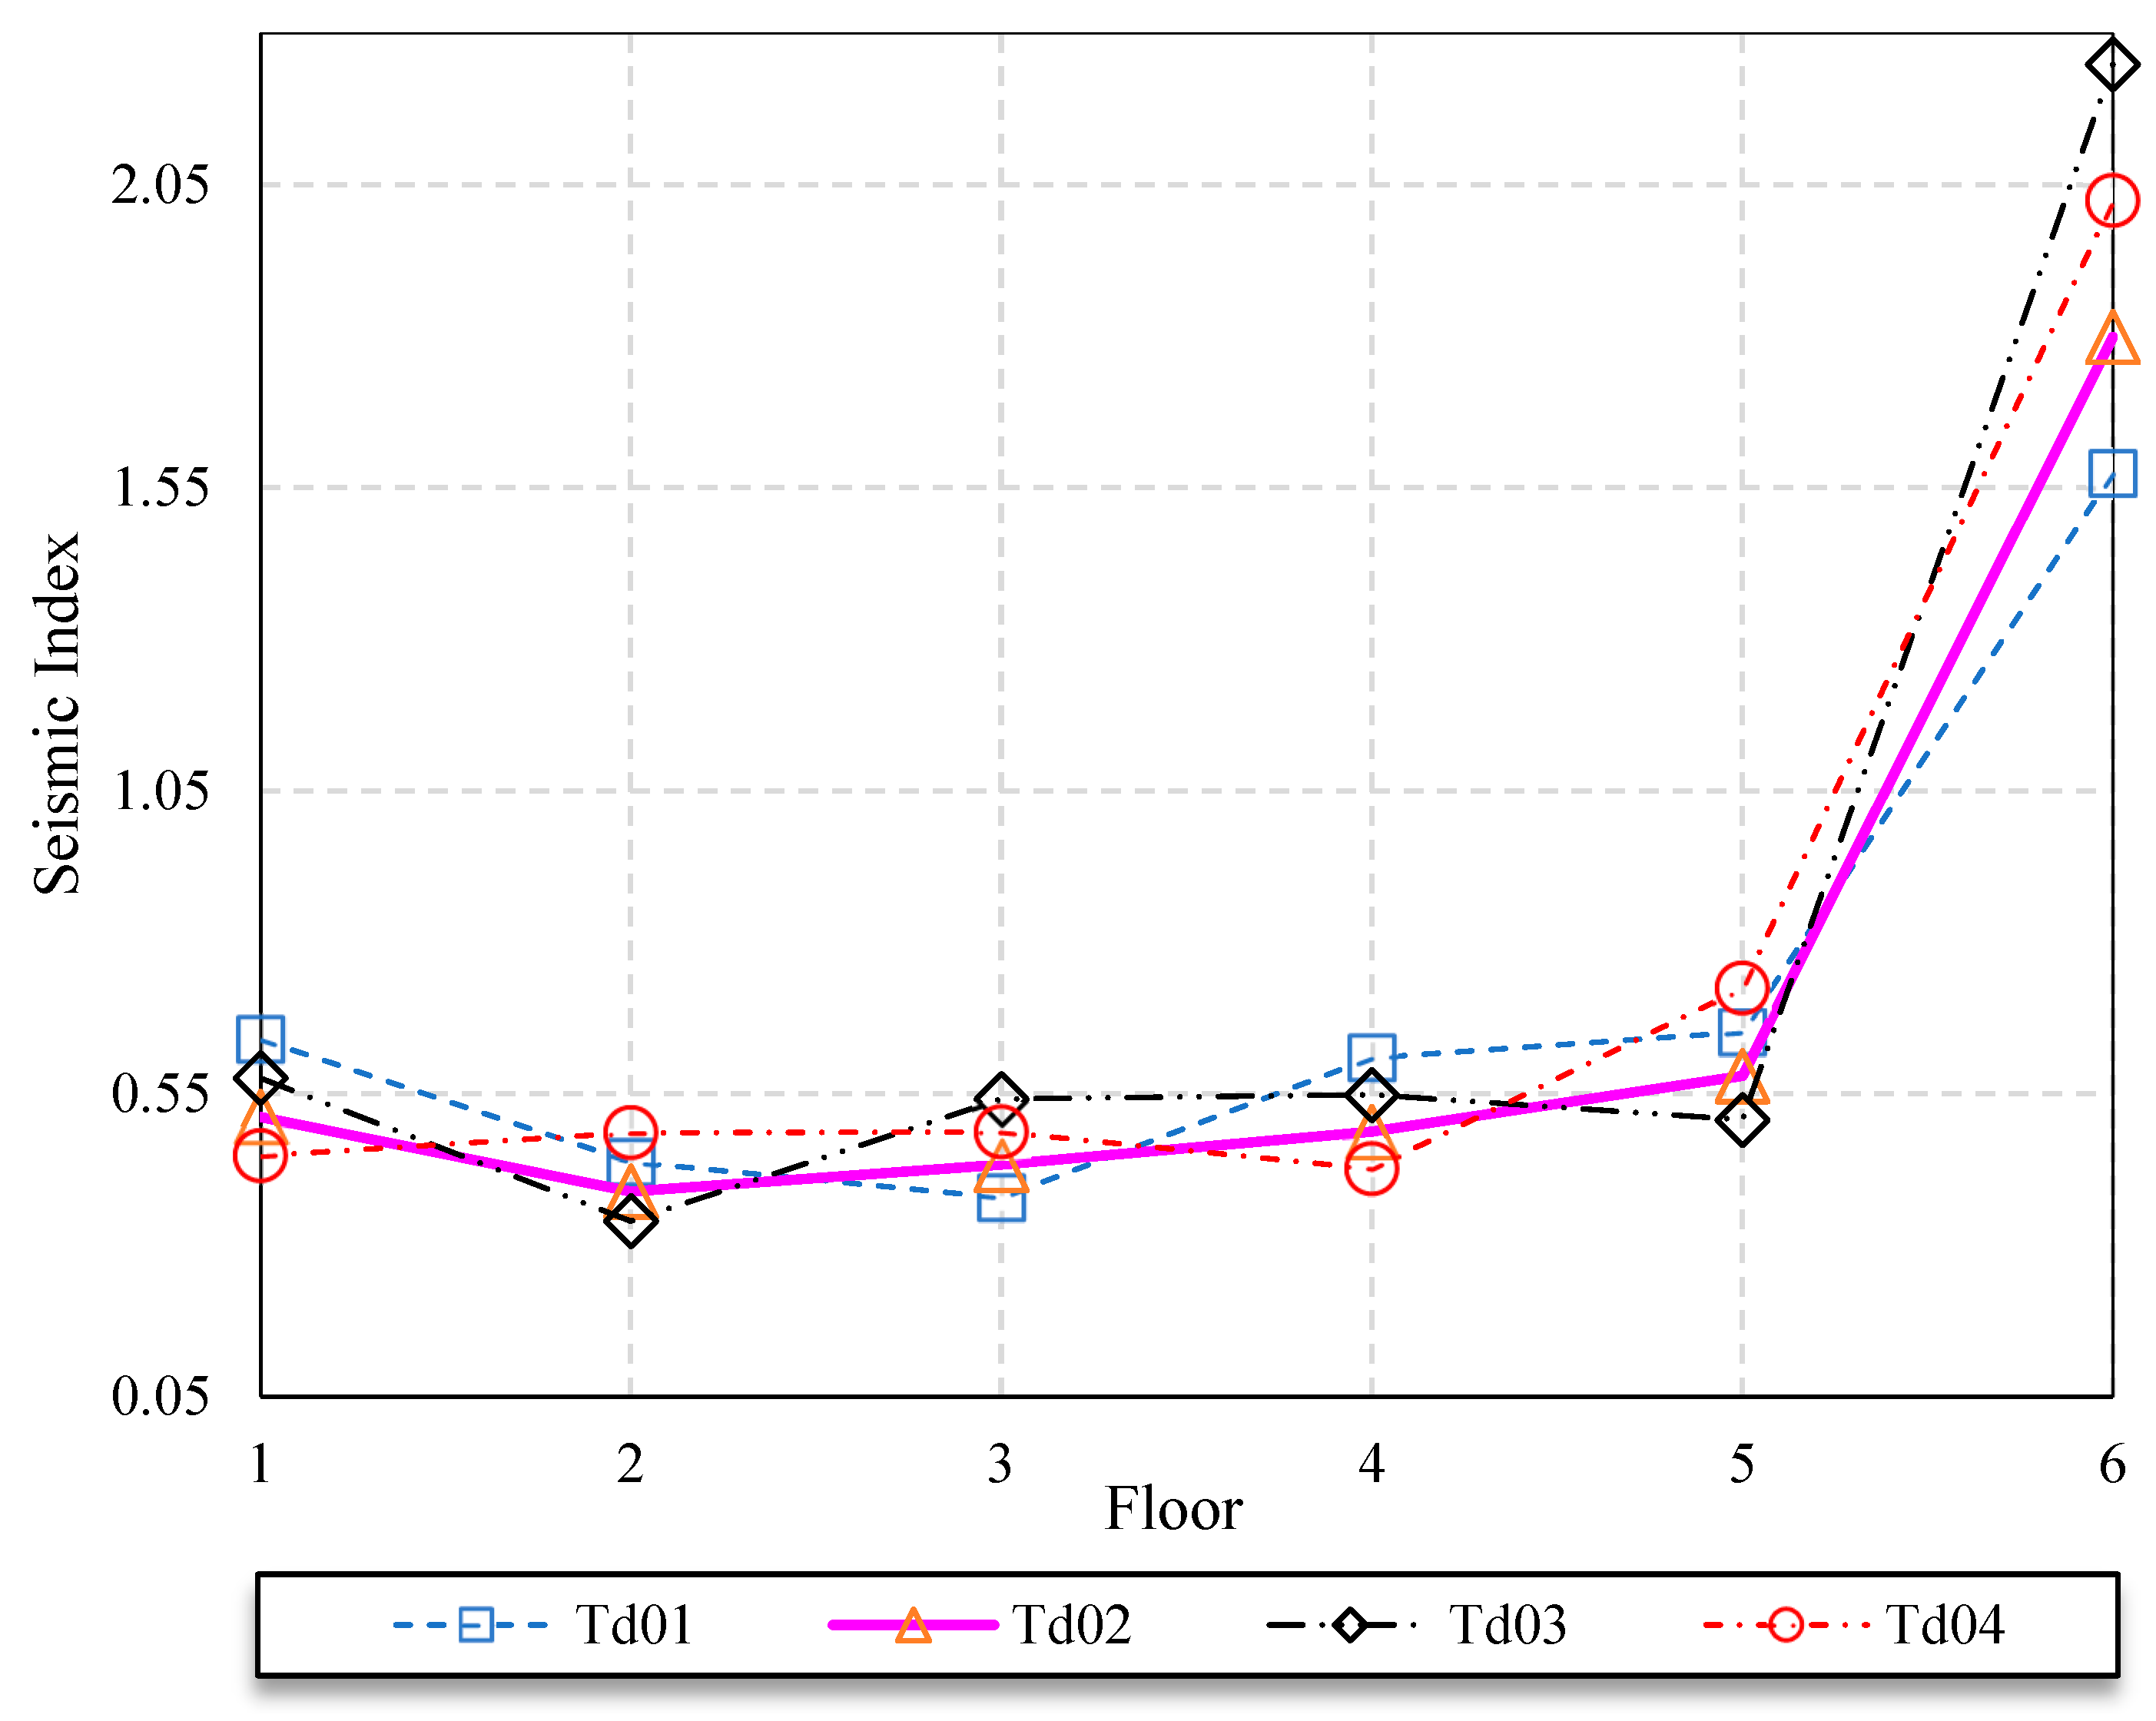
The degree of structural deterioration in the Palace of Justice is systematically varied to evaluate the maximum and minimum values of the seismic performance index
(
Table 15). Scenario 02 represents the actual condition of structural deterioration, where a sub-index of
= 0.7 reduces the seismic performance of the second floor to
= 0.3399. In Scenario 04, the lowest seismic performance index is observed on the fourth floor, whereas in Scenario 01, the least favorable performance occurs on the third floor (
= 0.378756). It is noteworthy that neither the first nor the topmost floors demonstrate the lowest seismic performance index, even under a sub-index of
= 0.7 (
Figure 17).
As discussed earlier, the structure of the Palace of Justice demonstrates a significant level of safety according to the Japanese method adapted to the Brazilian context. However, if the building were to be classified as vulnerable based on the aforementioned seismic evaluation, the results should be interpreted with caution. In such cases, it is advisable to apply more rigorous procedures, even those outlined in the original Japanese guidelines. As introduced in
Section 2, the original methodology comprises two additional levels of assessment, and it is recommended to proceed to these subsequent stages before considering any intervention or retrofitting strategies.
One of the current limitations of the SeismicV application is that it does not implement the second and third levels of the method, as these require more detailed data and complex calculations. Moreover, no studies have yet been conducted to adapt these advanced levels to the Brazilian context. It is important to emphasize that the method implemented in the tool is intended as an initial screening. As an alternative, advanced methodologies—such as incremental dynamic analysis [
35]—can be employed to confirm whether retrofitting is necessary.
An illustrative example of an intervention based on the original Japanese guidelines is the case of the National Museum of Western Art, a three-story reinforced concrete building designed according to the first-generation seismic code. In this case, the seismic index did not meet the required safety threshold [
36], which justified further evaluation and subsequent retrofitting measures.
The method presents certain limitations [
37], as it does not explicitly address aspects such as the post-earthquake usability of the structure, the efficiency of capacity recovery following repairs, or the long-term durability of the system. Consequently, the SeismicV tool, which is based on this method, inherits these same limitations.
As a limitation inherited from the original methodology, the tool is restricted to existing low-rise and mid-rise reinforced concrete (RC) buildings and does not account for masonry structures, even though RVS methodologies have been extensively proposed and applied to such buildings in various case studies [
38].


