Article

Investigation of the Mechanical and Physical Properties of Acidic Pumice Aggregate-Reinforced Lightweight Concrete Under High-Temperature Exposure

by
Belkis Elyigit
1,* and
Cevdet Emin Ekinci
2
1
Department of Civil Engineering, Firat University, 23119 Elazig, Türkiye
2
Department of Civil Engineering, Faculty of Technology, Firat University, 23119 Elazig, Türkiye
*
Author to whom correspondence should be addressed.
Buildings 2025, 15(14), 2505; https://doi.org/10.3390/buildings15142505
Submission received: 11 June 2025 / Revised: 10 July 2025 / Accepted: 14 July 2025 / Published: 17 July 2025
(This article belongs to the Section Building Materials, and Repair & Renovation)

Abstract

This study examines the mechanical and physical performance of lightweight concretes incorporating acidic pumice aggregate, with a particular focus on their behavior under thermal exposure. Pumice sourced from the Bitlis-Tatvan region was used as a partial replacement for limestone aggregate at volumetric substitution levels of 50%, 60%, and 70% (designated LC50, LC60, and LC70, respectively), alongside a conventional control mix (NC). Experimental investigations included flexural and compressive strength tests, capillary water absorption measurements, and mass loss assessments at elevated temperatures (100 °C, 200 °C, and 300 °C). The results indicate that increasing pumice content leads to a significant reduction in mechanical strength, as evidenced by a strong negative correlation (e.g., −0.994 for compressive strength), and results in increased water absorption due to the higher porosity of pumice. Thermal exposure caused more pronounced weight loss in pumice-rich mixtures, primarily attributable to moisture evaporation and the formation of surface voids, particularly in LC60 and LC70 specimens. Although the incorporation of pumice effectively reduces the unit weight of concrete, it compromises both strength and durability, highlighting a critical trade-off between weight reduction and structural performance. Future studies are recommended to quantitatively assess the relationship between compressive and flexural strengths to address current limitations. Additionally, advanced microstructural analyses (e.g., SEM, XRD), fire resistance evaluations at higher temperatures, and the development of hybrid mixes incorporating supplementary cementitious materials (SCMs) should be further explored.

1. Introduction

Pumice, known by various names across different languages, is a porous, volcanic rock. Its finer powdered form is often referred to as pumicite. In Turkish, it is commonly known as “sponge stone,” “foam stone,” or “callus stone” [1]. Turkey holds approximately 15% of the world’s pumice reserves, with nearly 45% located in the Bitlis province.
Pumice is a glassy volcanic rock with a highly porous structure, formed by rapid cooling and degassing during volcanic eruptions. Its micro- and macroporous structure—composed mostly of isolated pores—results in low permeability and provides excellent thermal and acoustic insulation. Compared to other volcanic rocks such as perlite, obsidian, and tuff, pumice is distinguished by its high porosity, lighter color, and absence of crystalline water [1].
According to the Mohs hardness scale, pumice has a hardness of 5 to 6 and contains up to 75% silica (SiO2). Its typical chemical composition includes 60–75% SiO2, 13–17% Al2O3, 1–3% Fe2O3, 1–2% CaO, 7–8% Na2O–K2O, and trace amounts of TiO2 and SO3. The high silica content contributes to its abrasiveness, allowing it to abrade even steel surfaces, while Al2O3 enhances fire and heat resistance. The presence of Na2O and K2O imparts chemical reactivity, making pumice particularly valuable in textile applications.
Volcanic activity produces two main types of pumice: acidic and basic. Basic pumice (also known as basaltic pumice or scoria) is typically dark brown to black and has a density of approximately 1–2 g/cm3. It is widely used in fertilizers and soil conditioning due to its higher content of aluminum, iron, calcium, and magnesium. In contrast, acidic pumice—off-white in color and rich in silica—is the more prevalent type and is extensively used in construction [2,3].
Extensive research has been conducted on lightweight concrete incorporating pumice as aggregate. For instance, Yildirim [4] evaluated pumice- and fly ash-based concretes with cement contents of 350 and 450 kg/m3 under different curing conditions, reporting compressive strength reductions of 12% and 17% in saline and acidic environments, respectively. Jianming et al. [5] found that the addition of steel fibers significantly improves flexural strength and fracture toughness, with moderate increases in compressive strength. Similarly, Ahn et al. [6] reported enhanced thermal resistance in lightweight concretes containing coal and fly ash. Badogiannis et al. [7] demonstrated that fiber reinforcement improves both flexural strength and fracture behavior. Wongsa et al. [8] investigated the fire resistance of pumice-reinforced lightweight concrete at 400 °C, 600 °C, and 800 °C, concluding that pumice and crushed clay brick aggregates offer better thermal insulation than conventional aggregates, especially when combined with geopolymer binders.
Further notable studies include Liu et al. [9], who explored the use of pumice as a substitute for river sand in Ultra-High-Performance Concrete (UHPC), showing its capacity for internal curing without compromising strength. Top and Vapur [10] produced fly ash-based geopolymer concrete using basaltic pumice, achieving compressive strengths between 20 and 55 MPa and water absorption rates from 1.05% to 17%. Turker and Kadiroglu [11] demonstrated that the inclusion of silica fume and fly ash enables the production of structurally lightweight concrete with compressive strengths exceeding 17.2 MPa. Yazıcıoğlu and Bozkurt [12] confirmed that silica fume-reinforced pumice concretes maintain consistent performance across different curing periods. Nayir et al. [13] emphasized the benefits of lightweight aggregates in reducing structural weight, improving thermal performance, and enhancing freeze–thaw durability. Sahan and Yilmaz [14] also explored the potential of pumice for the adsorption of Co(II) ions.
Additional studies have highlighted the effects of fiber reinforcement and lightweight aggregates on concrete’s toughness and ductility [15], bond strength [16], and the comparative behavior of lightweight versus normal-weight concretes [17,18]. According to RILEM classification, as cited by Gonen [19], lightweight concrete is categorized as structural, structural insulation, or non-structural insulation concrete, based on density and compressive strength. Production typically utilizes aggregates with low unit weight. Lightweight concrete is widely used in block production to reduce dead loads, offering benefits in thermal insulation, seismic resistance, fire protection, and aesthetics. However, pumice aggregates may also exhibit brittleness and reduced mechanical strength, as noted by Kockal and Camurlu [20].
Karahan et al. [21] reported that ground granulated pumice decreases the workability of fresh mortar mixes. By TS EN 206-1 [22], lightweight concrete is classified based on unit weight and compressive strength. TS 2511 [23] defines load-bearing lightweight concrete as having a density below 1800 kg/m3 and compressive strength above 17 MPa. Classification criteria and comparative values for specific gravity and compressive strength are summarized in Table 1, Table 2, Table 3 and Table 4.
This study experimentally investigates the mechanical and physical properties of lightweight concrete incorporating acidic pumice aggregate sourced from the Bitlis-Tatvan region, without using binders. Using a quantitative design, the study evaluates compressive strength, flexural strength, capillary water absorption, and thermal performance. The central hypothesis is that incorporating acidic pumice from Bitlis-Tatvan significantly affects strength, absorption, and thermal resistance at high temperatures, potentially enhancing thermal performance while reducing mechanical strength. While earlier research has shown pumice improves insulation and reduces density [7,8,13], its mechanical behavior under elevated temperatures remains inconclusive and warrants further study. This research aims to contribute a valuable reference for future work on pumice in concrete technology.
Beyond its technical merits, pumice as a lightweight aggregate offers clear environmental advantages. Its natural abundance and low density reduce transportation costs and associated carbon emissions. Although a full Life Cycle Assessment (LCA) was not conducted, the material’s low embodied energy and reduced transportation burden suggest a favorable sustainability profile.

2. Materials and Methods

2.1. Materials

The materials used in this experimental study and their key properties are outlined below.
Cement:
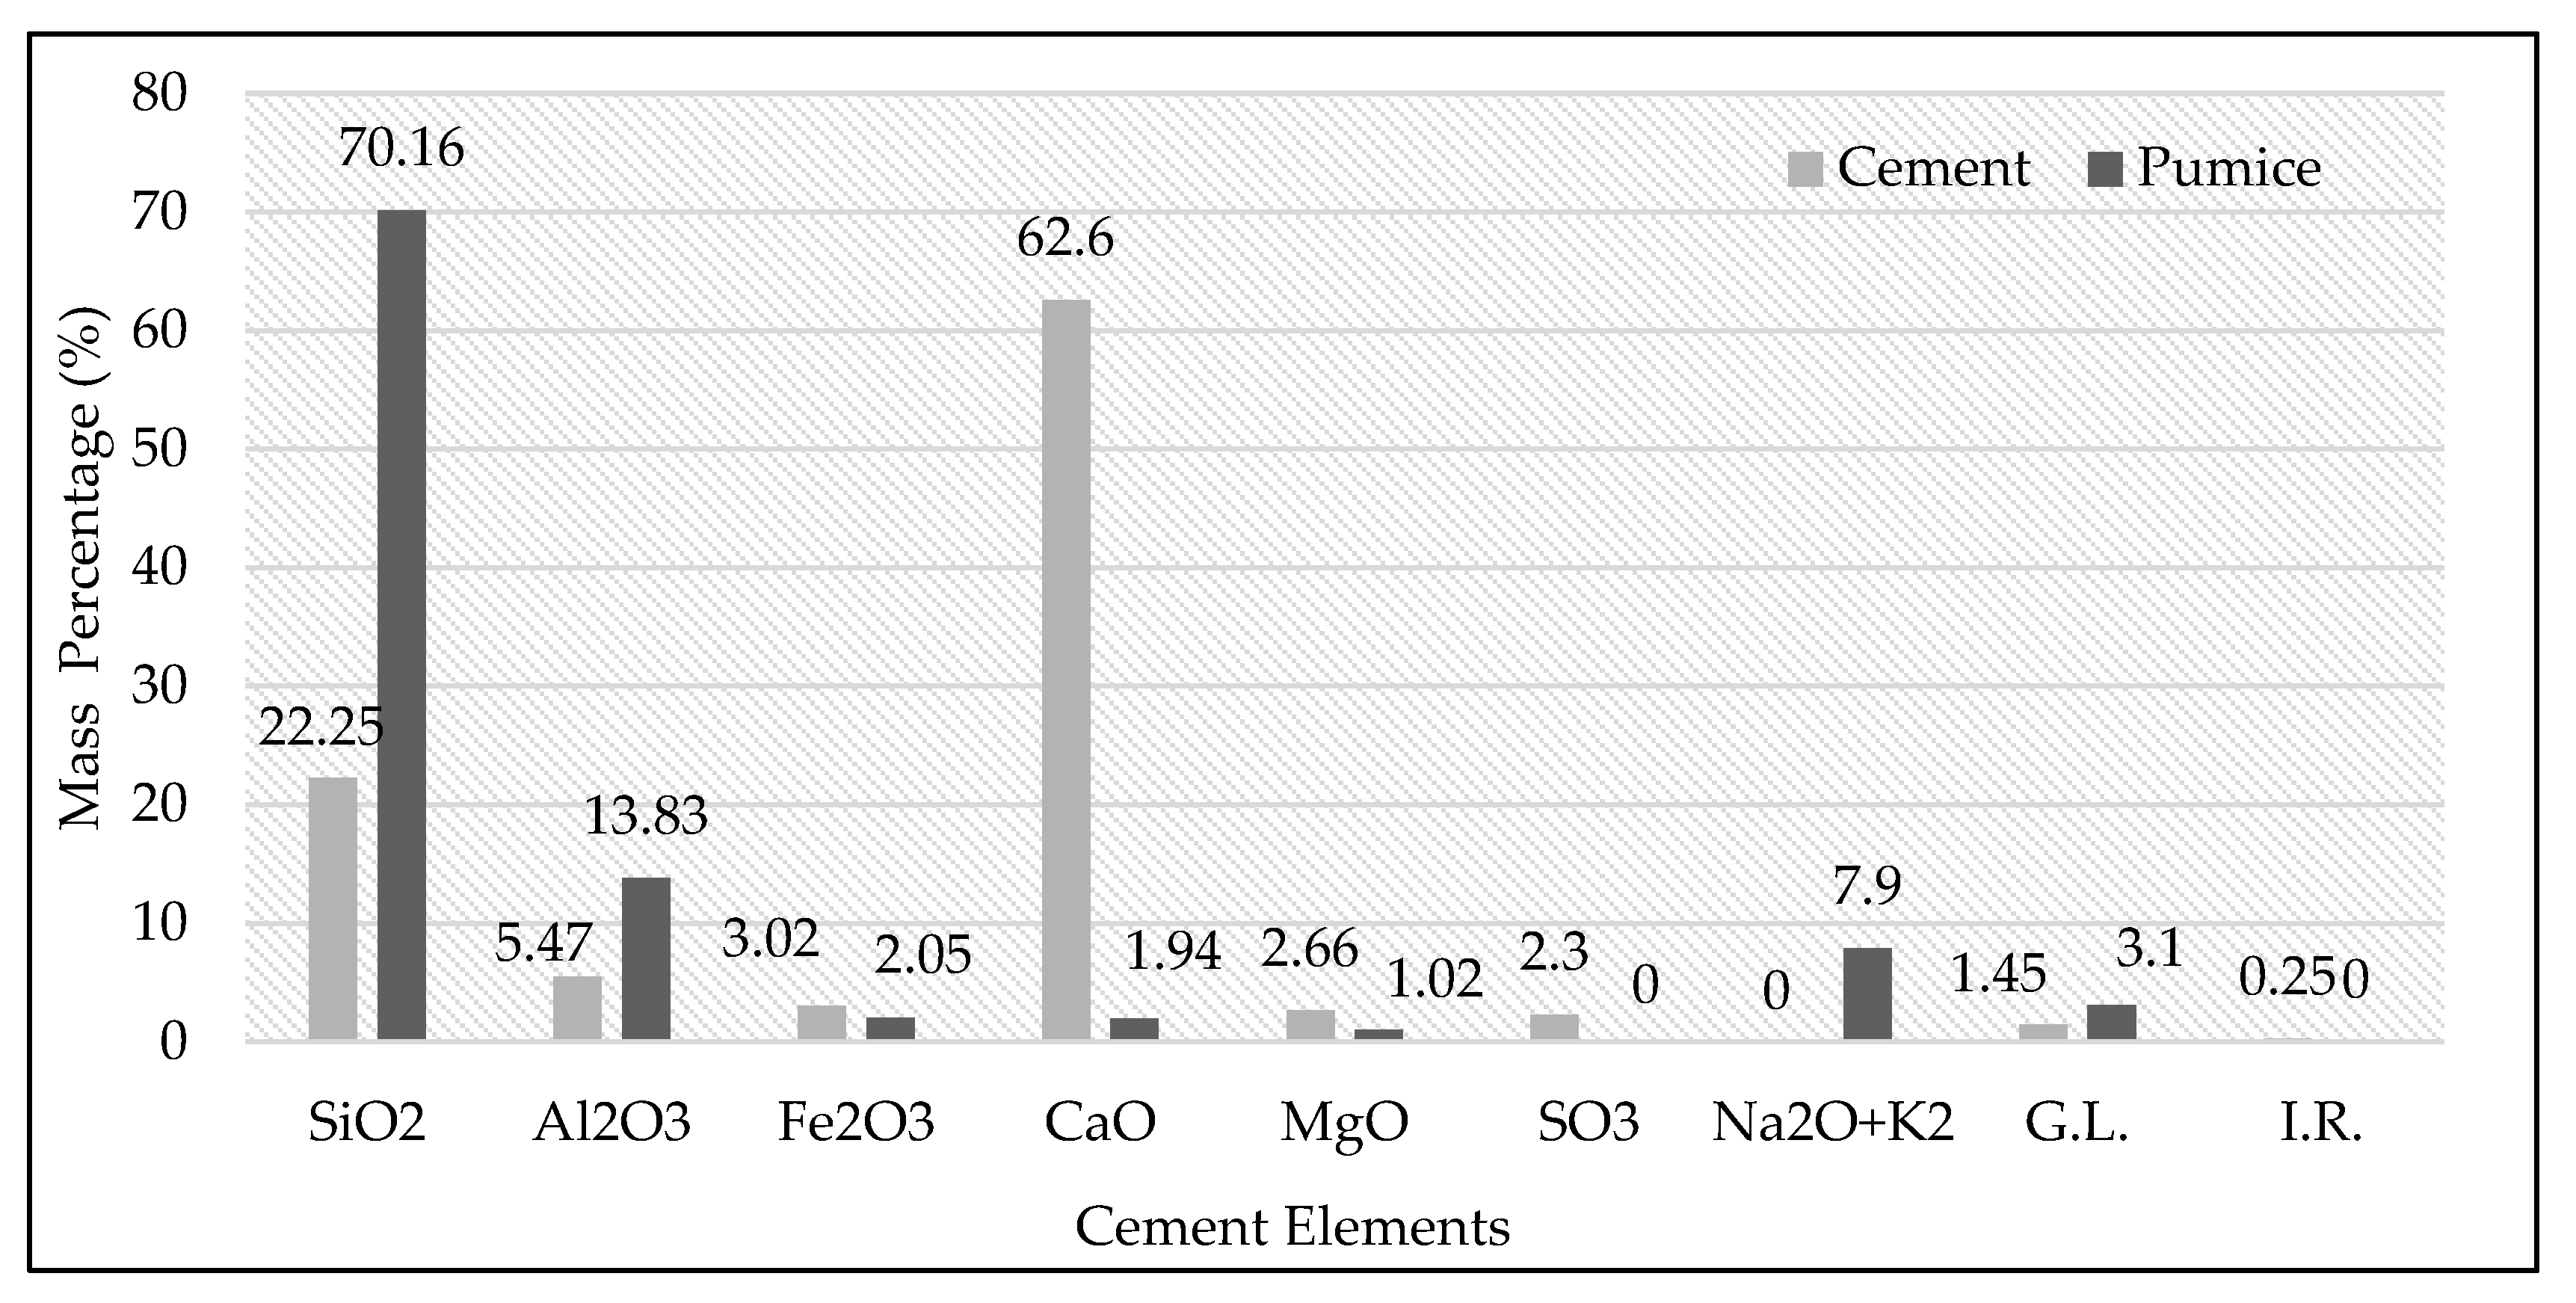
A commercially available CEM I 42.5N Portland cement, produced by Narli Cimko Cement Factory by TS EN 197-1 standards [28], was used throughout the study. The physical and chemical properties of the cement are presented in Figure 1.
Mixing Water and Water–Cement Ratio:
Tap water from the city of Elazığ, with a pH of 7.5, was used in all concrete mixes. A fixed water–cement ratio of 0.5 was maintained across all specimens to ensure consistency in mix design.
Crushed Stone Aggregate:
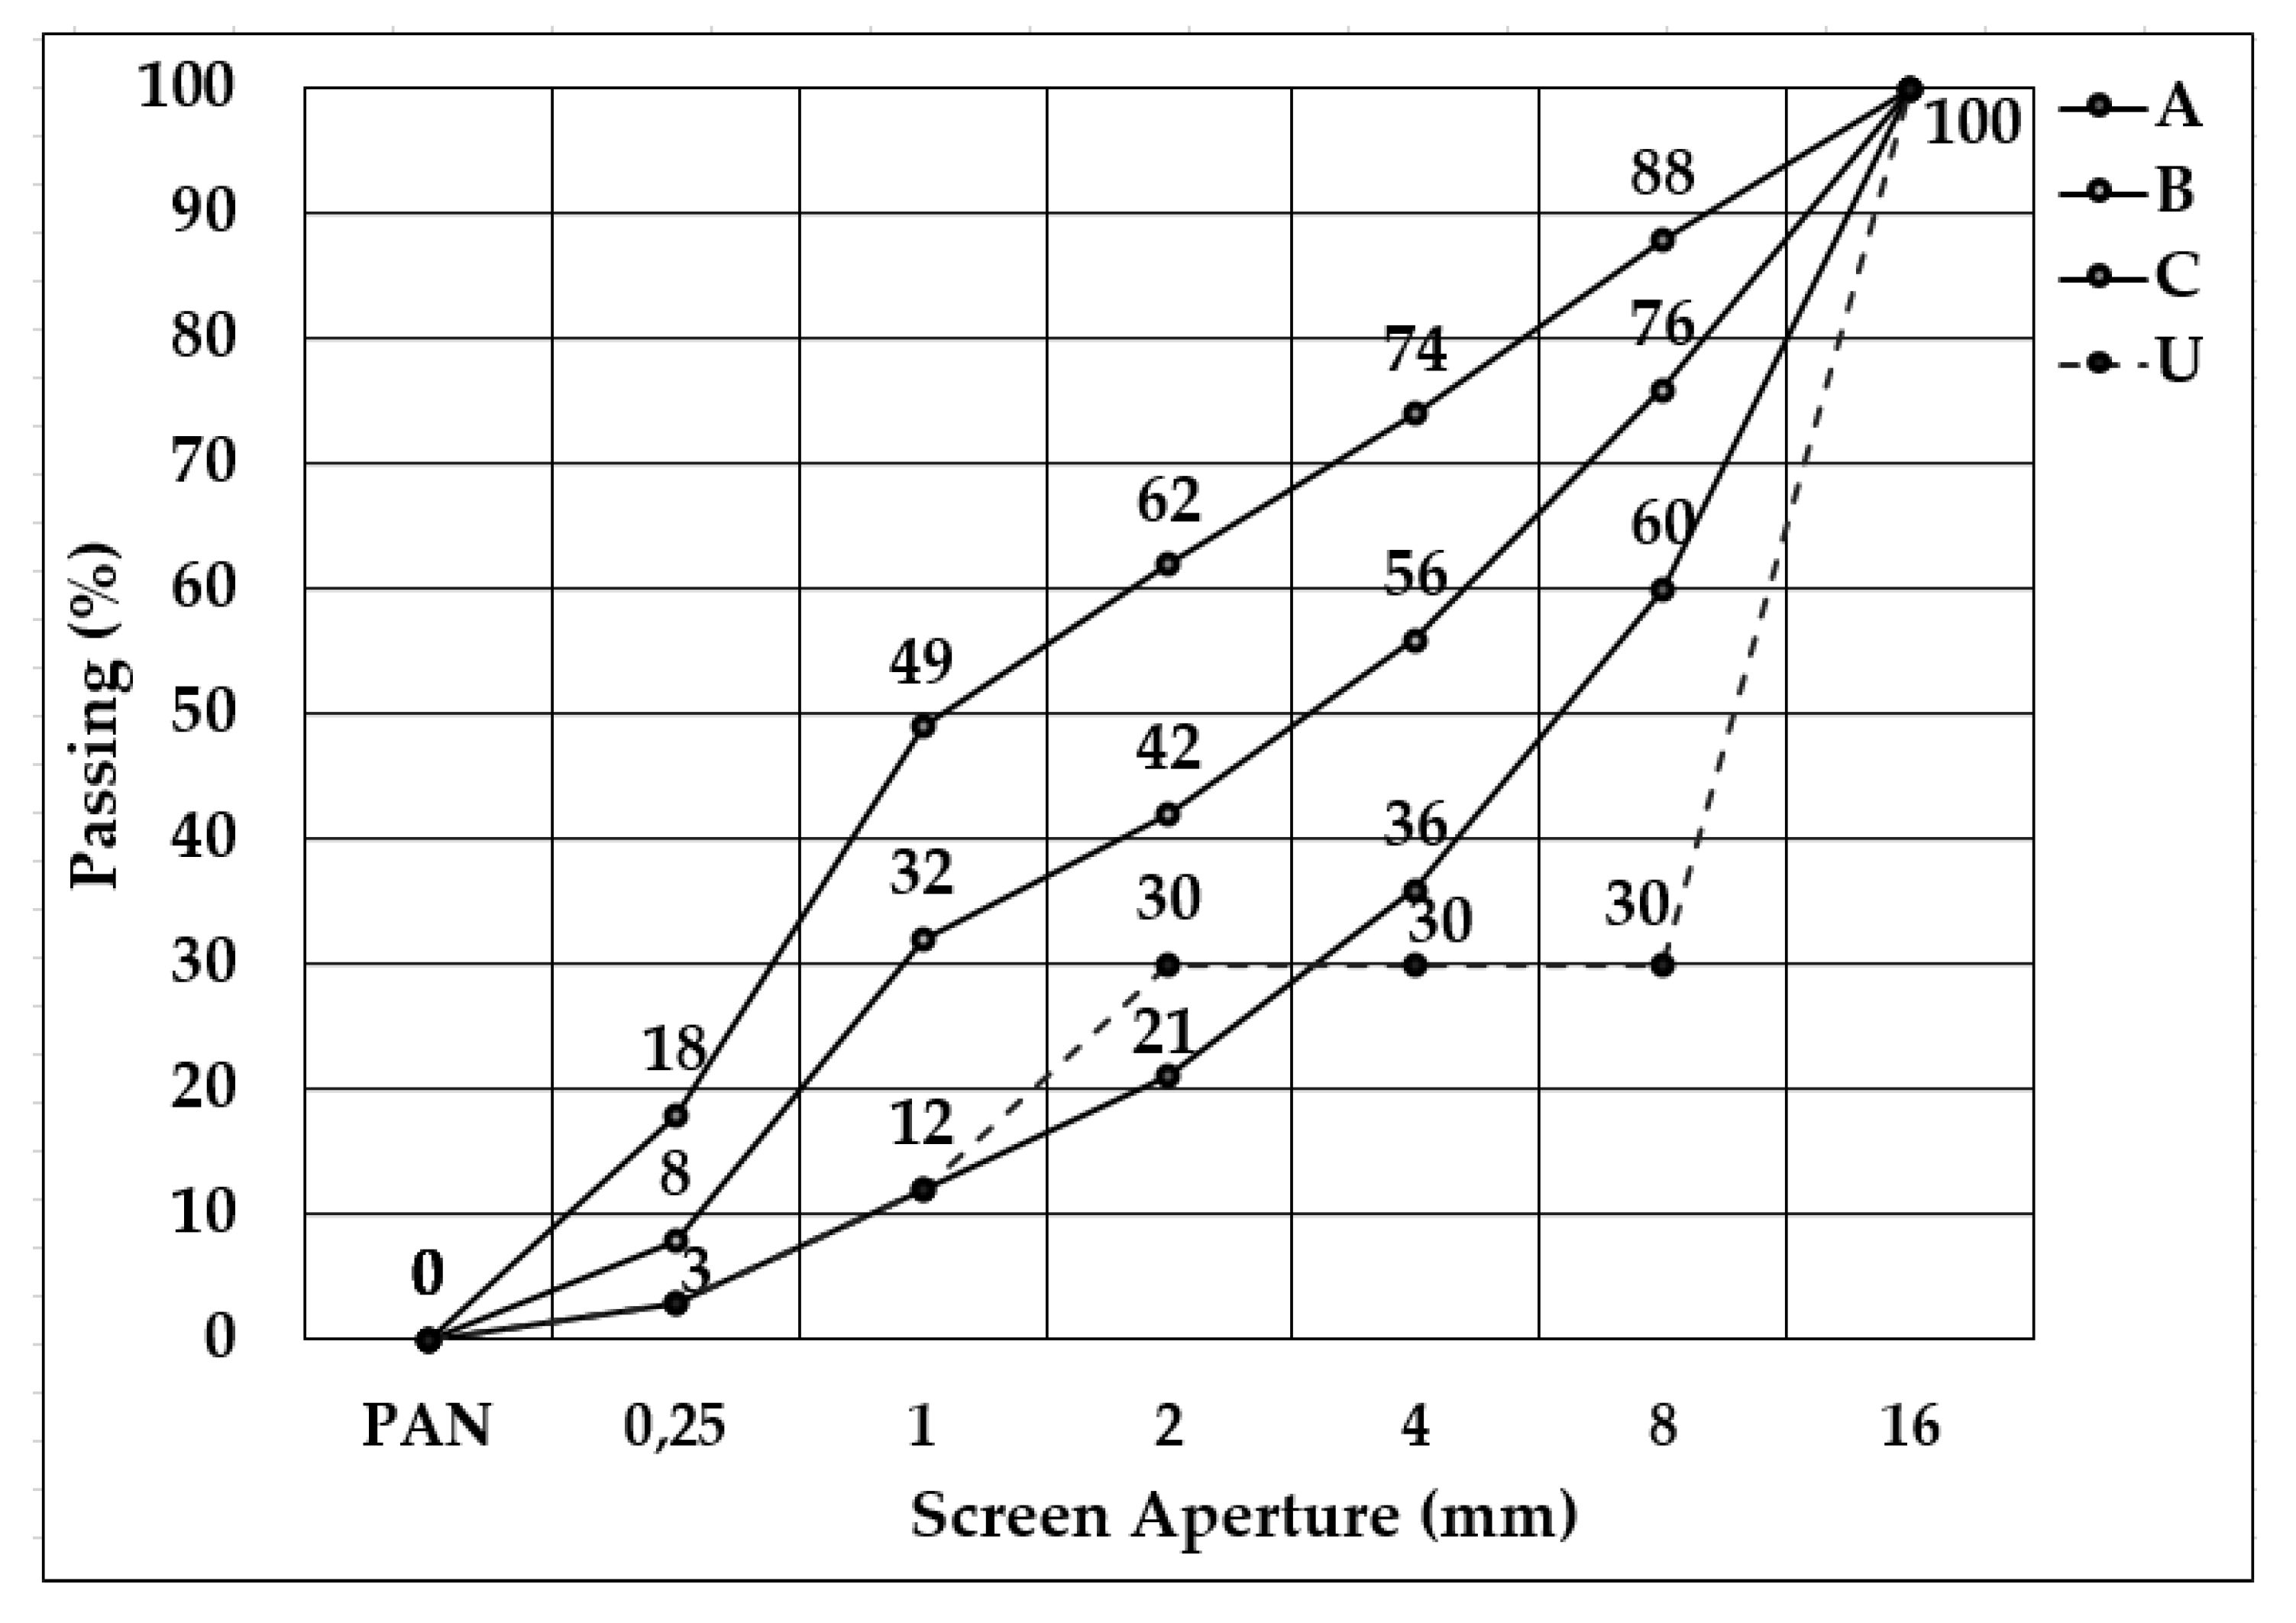
Limestone-based crushed stone, supplied by Elazığ Birlik Beton Co., was used as the coarse aggregate. Its physical properties are summarized in Table 5. Gradation curves for both crushed stone and pumice aggregates, based on sieve analyses in accordance with TS EN 933-1 [29], are shown in Figure 2.
Pumice Aggregate:
The pumice used in this study was sourced from the Bitlis-Tatvan region and exhibited an off-white to light gray color. After sieving through a 16 mm mesh, oversized particles were crushed to achieve a maximum aggregate size (Dmax) of 16 mm. The pumice had a Mohs hardness between 5 and 6, a bulk density of 0.5–1.0 g/cm3, and an estimated porosity of approximately 70%. Although pumice can absorb up to 15% of its weight in water, depending on its porosity and origin, the sample used in this study exhibited a water absorption rate of 4.25%, as shown in Table 5. Apart from sieving and crushing, no washing or drying procedures were applied. To reduce the influence of water absorption during mixing, a controlled pre-wetting process was implemented, as detailed in the concrete specimen preparation section.
Preparation of Concrete Specimens:
To standardize particle size distribution, both pumice and crushed stone aggregates were adjusted to a maximum size of 16 mm (Dmax). Mix designs were determined based on cement content, with a fixed water–cement ratio of 0.5. No fibers or chemical admixtures were included. Crushed limestone was preferred over basaltic or granitic aggregates due to its relatively lower density and availability in 0–5 mm and 5–15 mm fractions. Pumice aggregates were sieved to match the gradation profile of the crushed stone, ensuring consistency in particle size distribution.
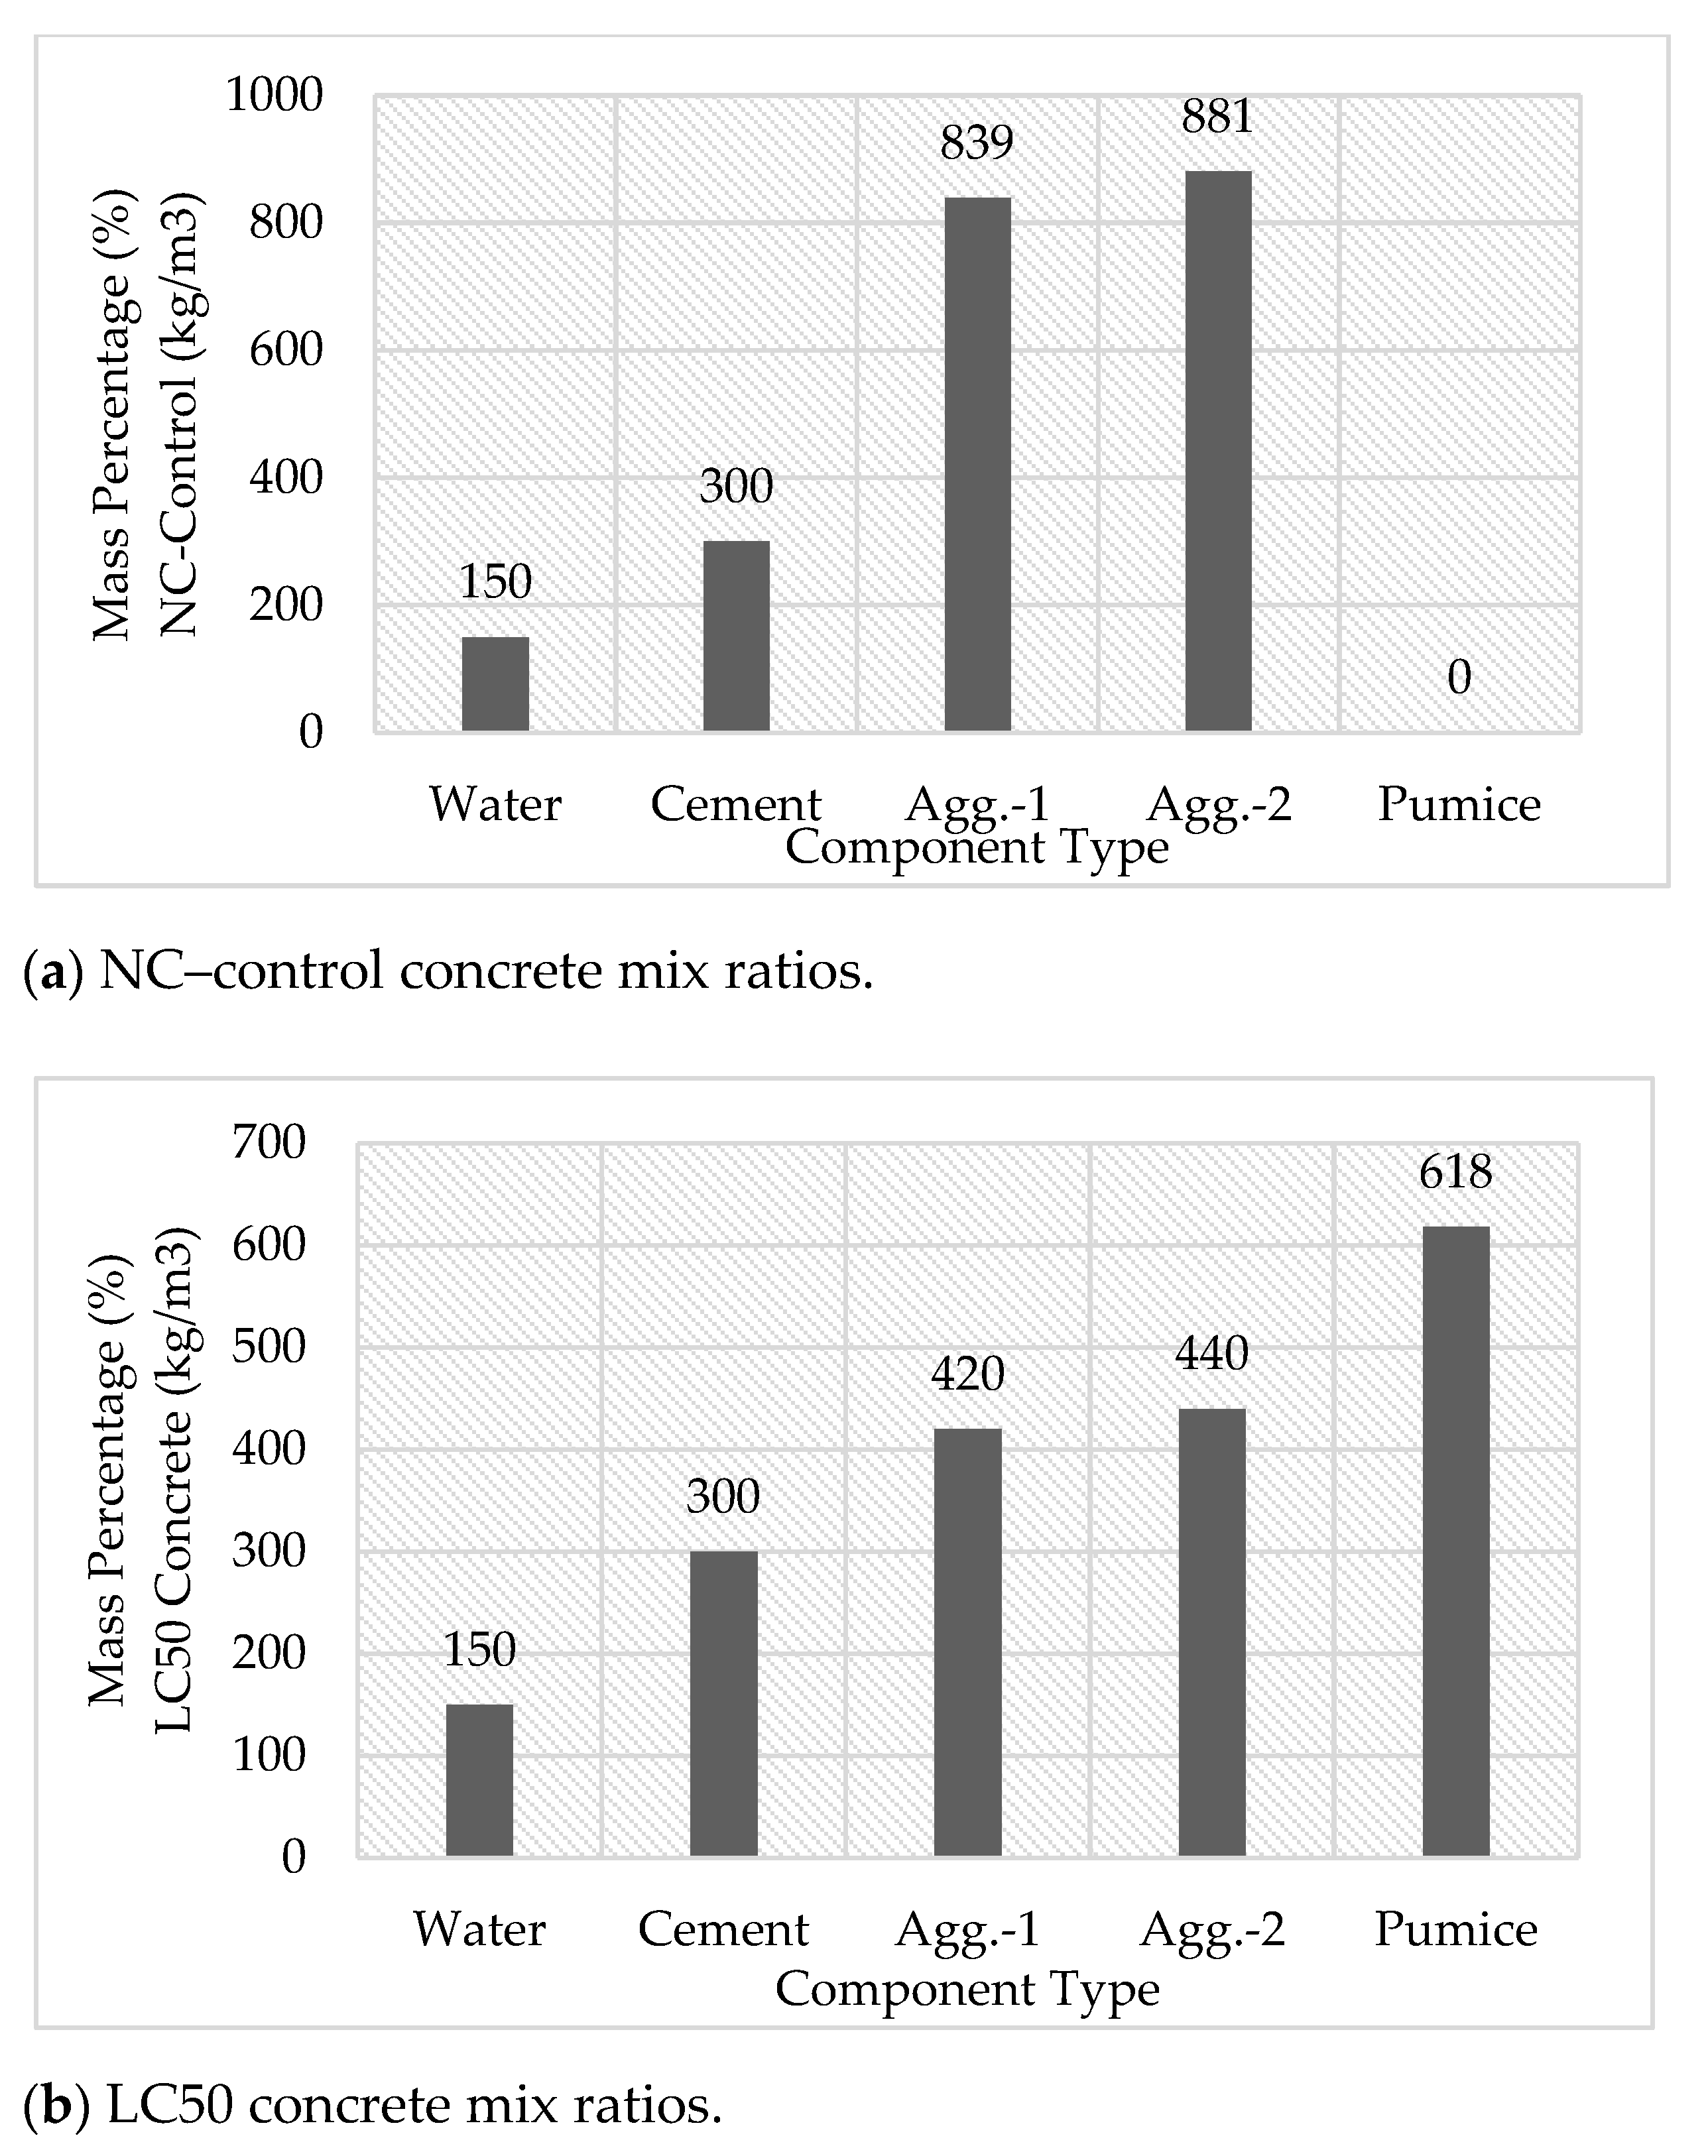
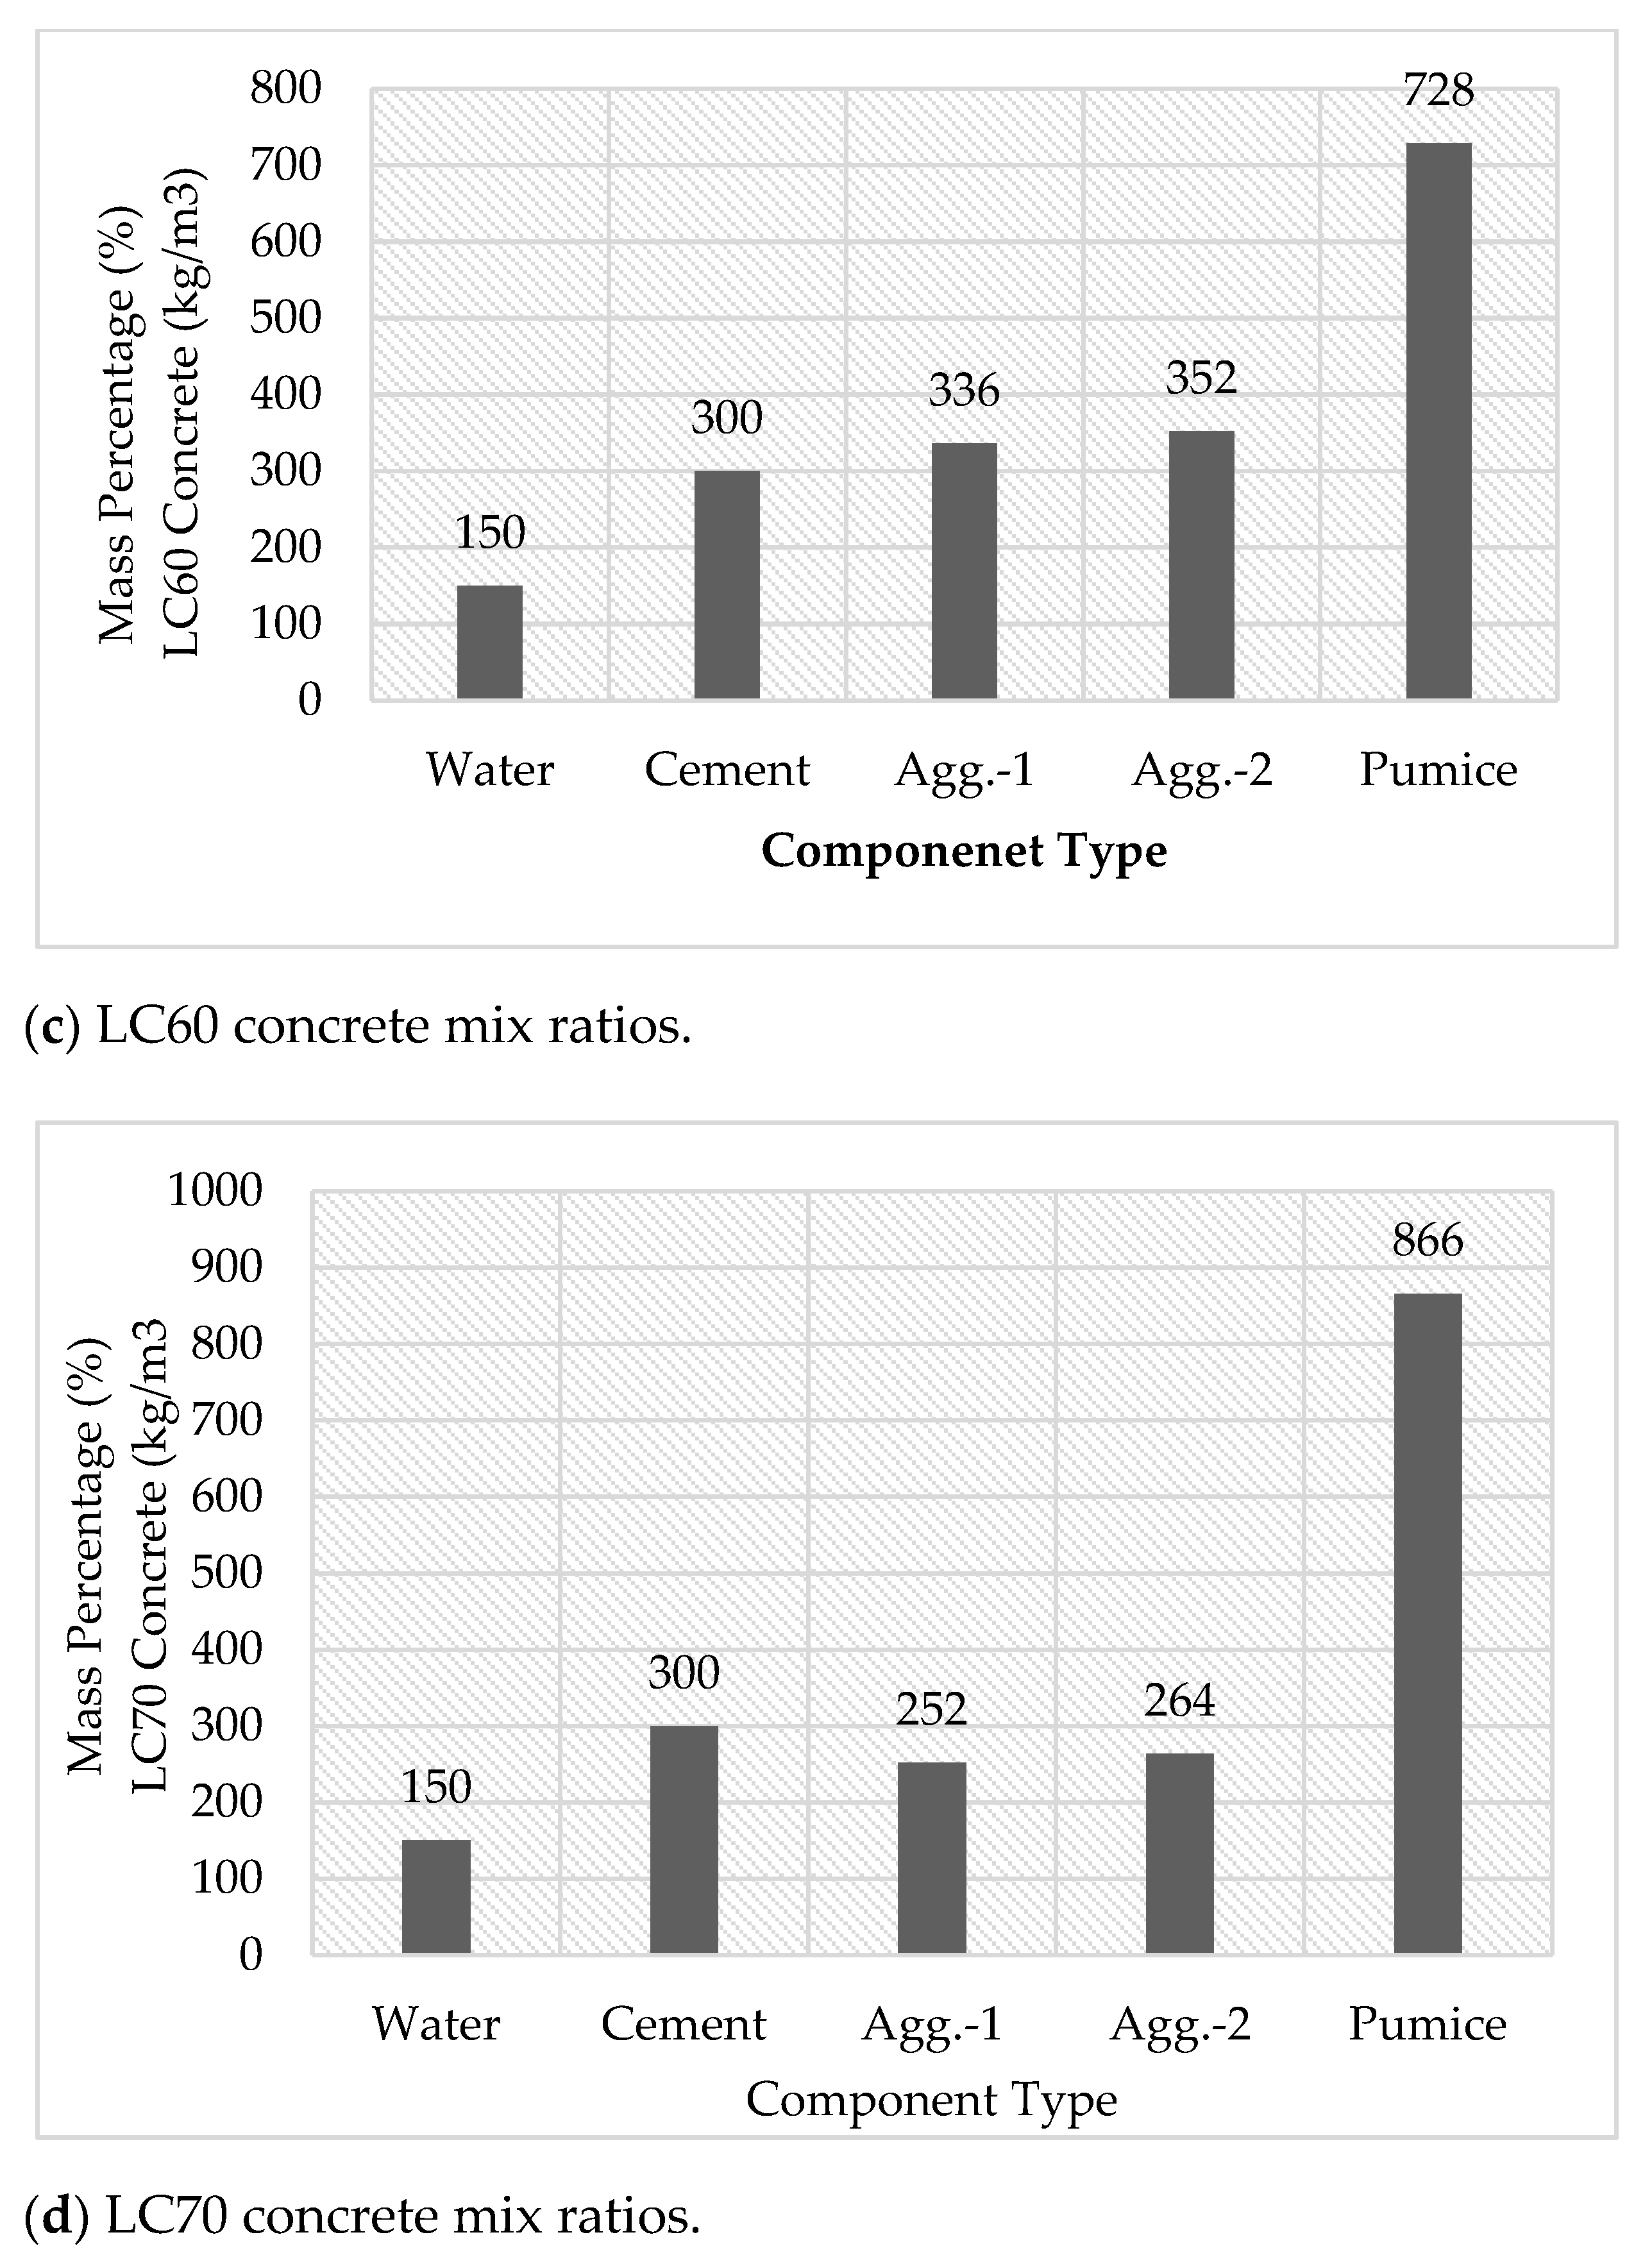
The physical properties of both aggregate types are summarized in Table 5. The chemical compositions of the cement and pumice aggregates are presented in Figure 1. Detailed mix proportions for each concrete series are shown in Figure 3a–d. The specific gravity of the cement was measured at 3.14 g/cm3, with a specific surface area of 3523 kg/m2.
As shown in Figure 1, the cement contained 65.3% SiO2, while the pumice aggregate consisted of approximately 70% silica, along with smaller amounts of Al2O3, Fe2O3, and alkali oxides. Table 6 shows the mixing ratios of the concretes used in the experiments.
No chemical admixtures or fibers were used in any of the concrete mixes. A fixed water–cement ratio of 0.5 and a constant cement dosage of 300 kg/m3 were maintained across all batches. Although the total volume of fresh lightweight concrete was kept consistent, the weight of each mix varied depending on the proportion of pumice aggregate. To maintain the target slump, adjustments were made to account for the inherent moisture content of the pumice aggregates.
To reduce the overall weight of the concrete, limestone aggregates were partially replaced with acidic pumice at substitution levels of 50%, 60%, and 70%, resulting in one control mix (normal concrete, NC) and three lightweight concretes, designated LC50, LC60, and LC70. The proportions of limestone aggregates used in these mixes are presented in Figure 3.
All concrete specimens were prepared using a standardized procedure to ensure consistency across batches. The air-void content was estimated according to TS 802 [30], using volumetric substitution principles and the displacement method. The total aggregate volume for each mix was calculated by subtracting the volumes of cement, water, and air from the total volume. The corresponding masses of each aggregate type were then determined by multiplying their respective volume fractions by their densities.
For each mix type, twelve prismatic specimens with dimensions of 10 × 10 × 30 cm were cast on the same day, yielding a total of 96 specimens. All batches were mixed in a vertical-shaft laboratory concrete mixer. Aggregates and cement were dry-mixed for one minute, followed by the gradual addition of water, and mixed for an additional 2 to 3 min until a homogeneous consistency was achieved.
Before casting, lightweight concrete mixes were subjected to a 10-min pre-wetting process, allowing the pumice aggregates to absorb water equivalent to 15% of their weight. This value was determined through preliminary absorption tests. Pre-wetting was critical to achieving the desired workability and to counteract the high absorption capacity of pumice, which could otherwise affect mix consistency.
Each batch had a total volume of 20 dm3. Specimens were compacted using a custom-built vibration-press unit, applying approximately 20% compression within 10 × 10 × 30 cm molds fitted with six-unit templates. After casting, the specimens were stored at 20 ± 2 °C and 60 ± 10% relative humidity for 24 h. They were then transferred to a curing room maintained at 20 °C and 90% relative humidity and subsequently cured in water tanks for 28 days before testing.

2.2. Method

2.2.1. Flexural Strength Method

The flexural strength of the concrete specimens was measured on the 28th day. On the testing day, specimens were removed from the curing water tanks, and any surface moisture was carefully wiped off using a dry cloth. Subsequently, the specimens were air-dried on a wire mesh grid for 24 h under laboratory conditions, allowing air circulation around all faces.
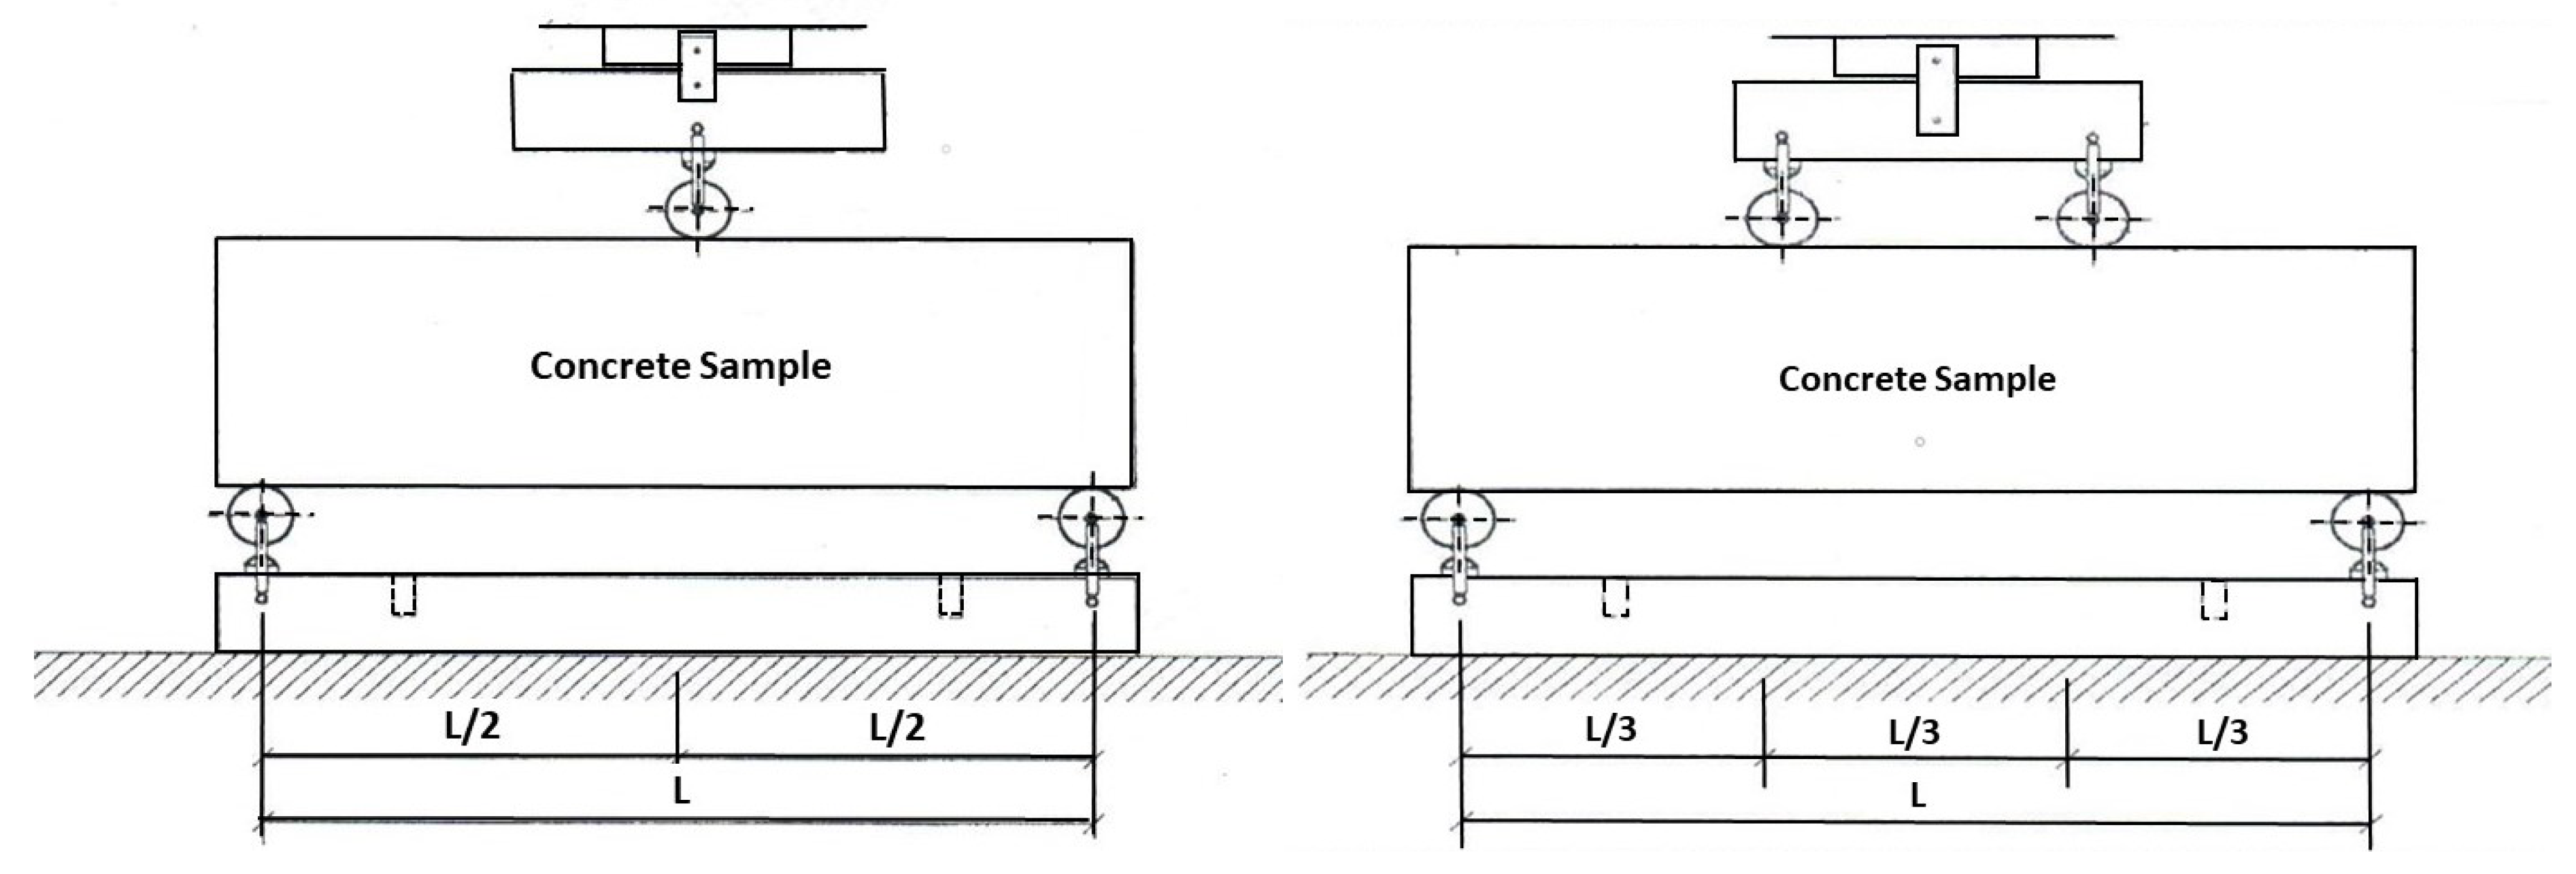
From each of the four concrete series, three specimens were tested using the three-point bending method, while another three specimens underwent the four-point bending test, as illustrated in Figure 4. To ensure statistical reliability, results from both three-point and four-point bending tests were later correlated with compressive strength data to evaluate the consistency of mechanical performance.
The three-point flexural strength (Fcf) was calculated using the following equation:
F c f = 3 . F . L m 2 . d 1 . d 2 2
The four-point flexural strength (Fcf) was calculated as:
F c f = F . L m d 1 . d 2 2
In Equations (1) and (2):
  • Fcf = Flexural strength (MPa)
  • F = Maximum load applied to the specimen (N)
  • Lm = Span length or clearance between support rollers (mm)
  • d1 and d2 = Cross-sectional dimensions (width and height) of the specimen (mm)

2.2.2. Compressive Strength Method

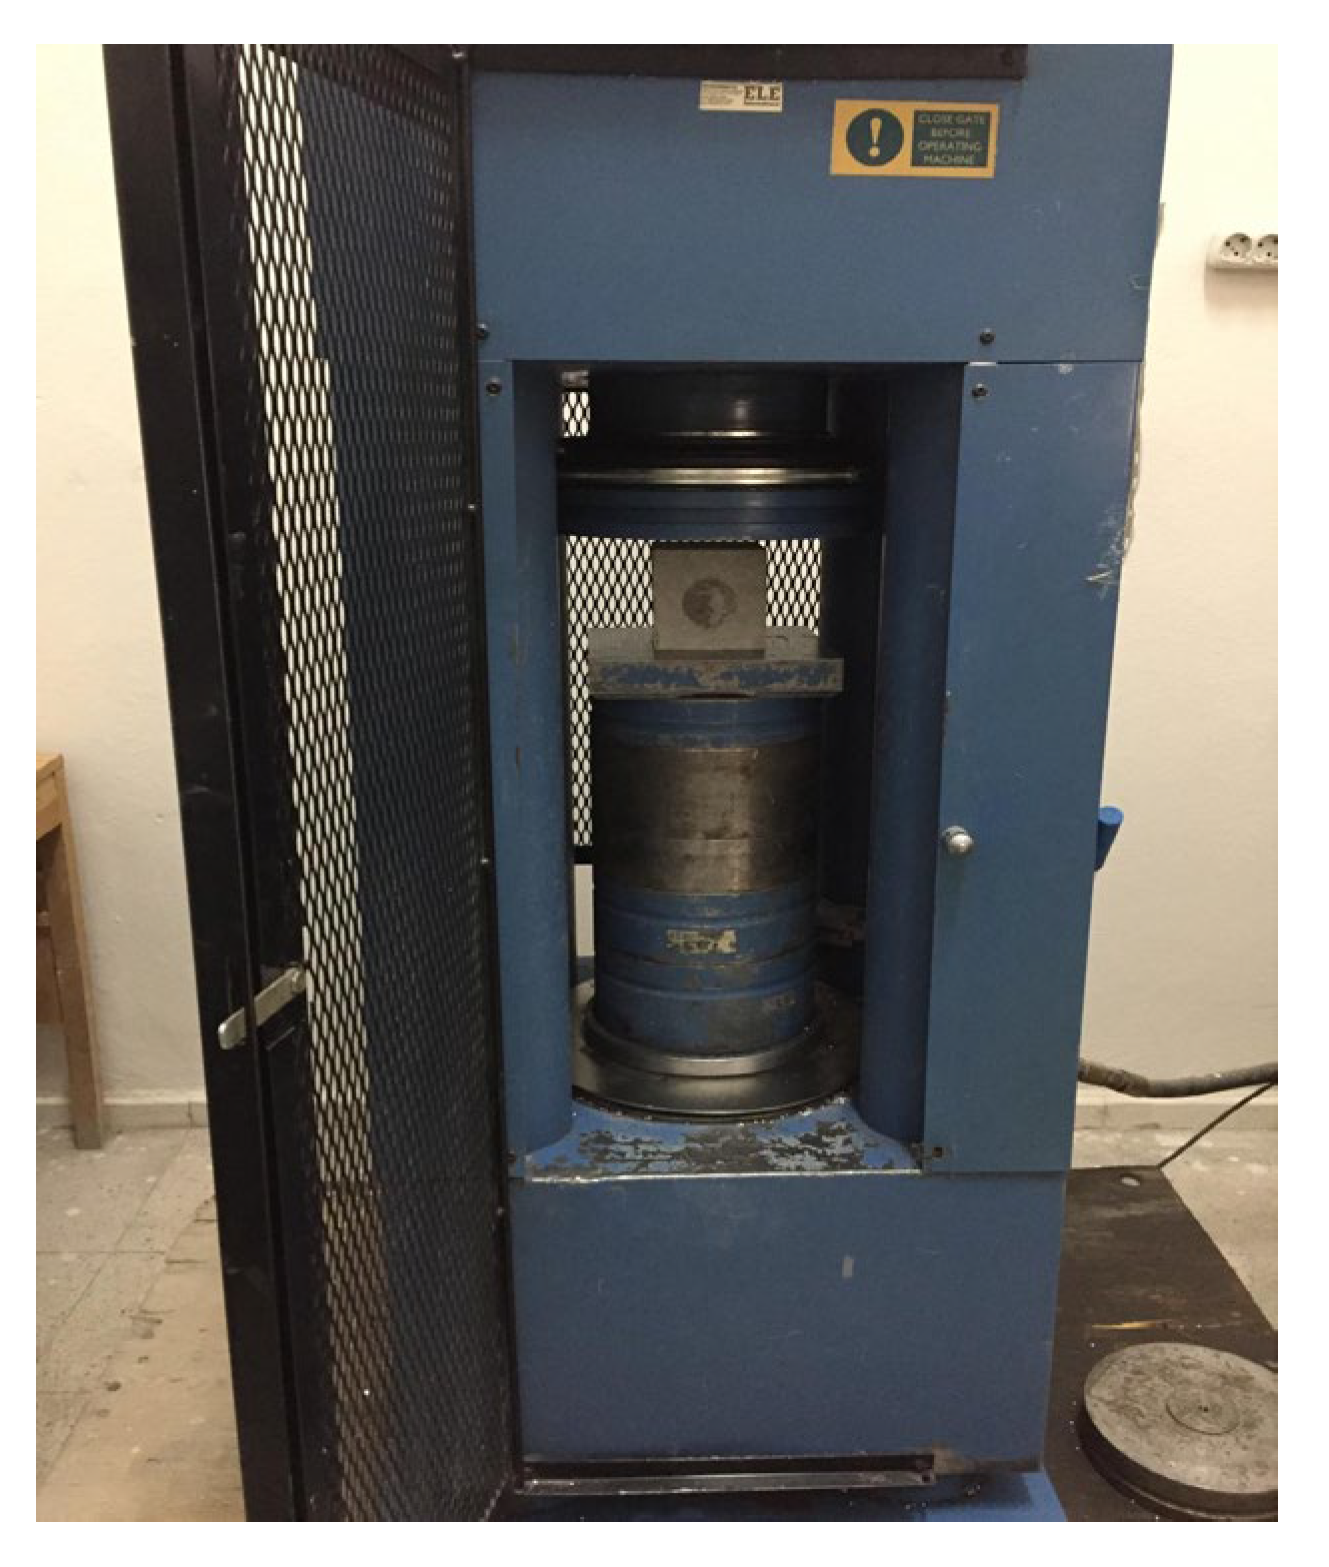
Compressive strength tests were conducted on six specimens from each 28-day concrete series by the TS EN 12390-3 standard [31]. A hydraulic, load-controlled digital press with a capacity of 3000 kN was used for these tests. For each concrete type, six cubic specimens measuring 10 cm × 10 cm × 10 cm were subjected to compression until failure. A visual of the compressive strength device is given in Figure 5.
The average compressive strength was calculated based on the results from these six specimens. The compressive strength (fc) was determined using the following equation:
C S = F A
In Equation (3):
  • CS = Compressive strength (MPa)
  • F = Maximum applied load at failure (N)
  • A = Cross-sectional area of the specimen (mm2)

2.2.3. Capillary Water Absorption Behavior Method

The capillary water absorption behavior of the concrete specimens was evaluated through a five-step sequential procedure:
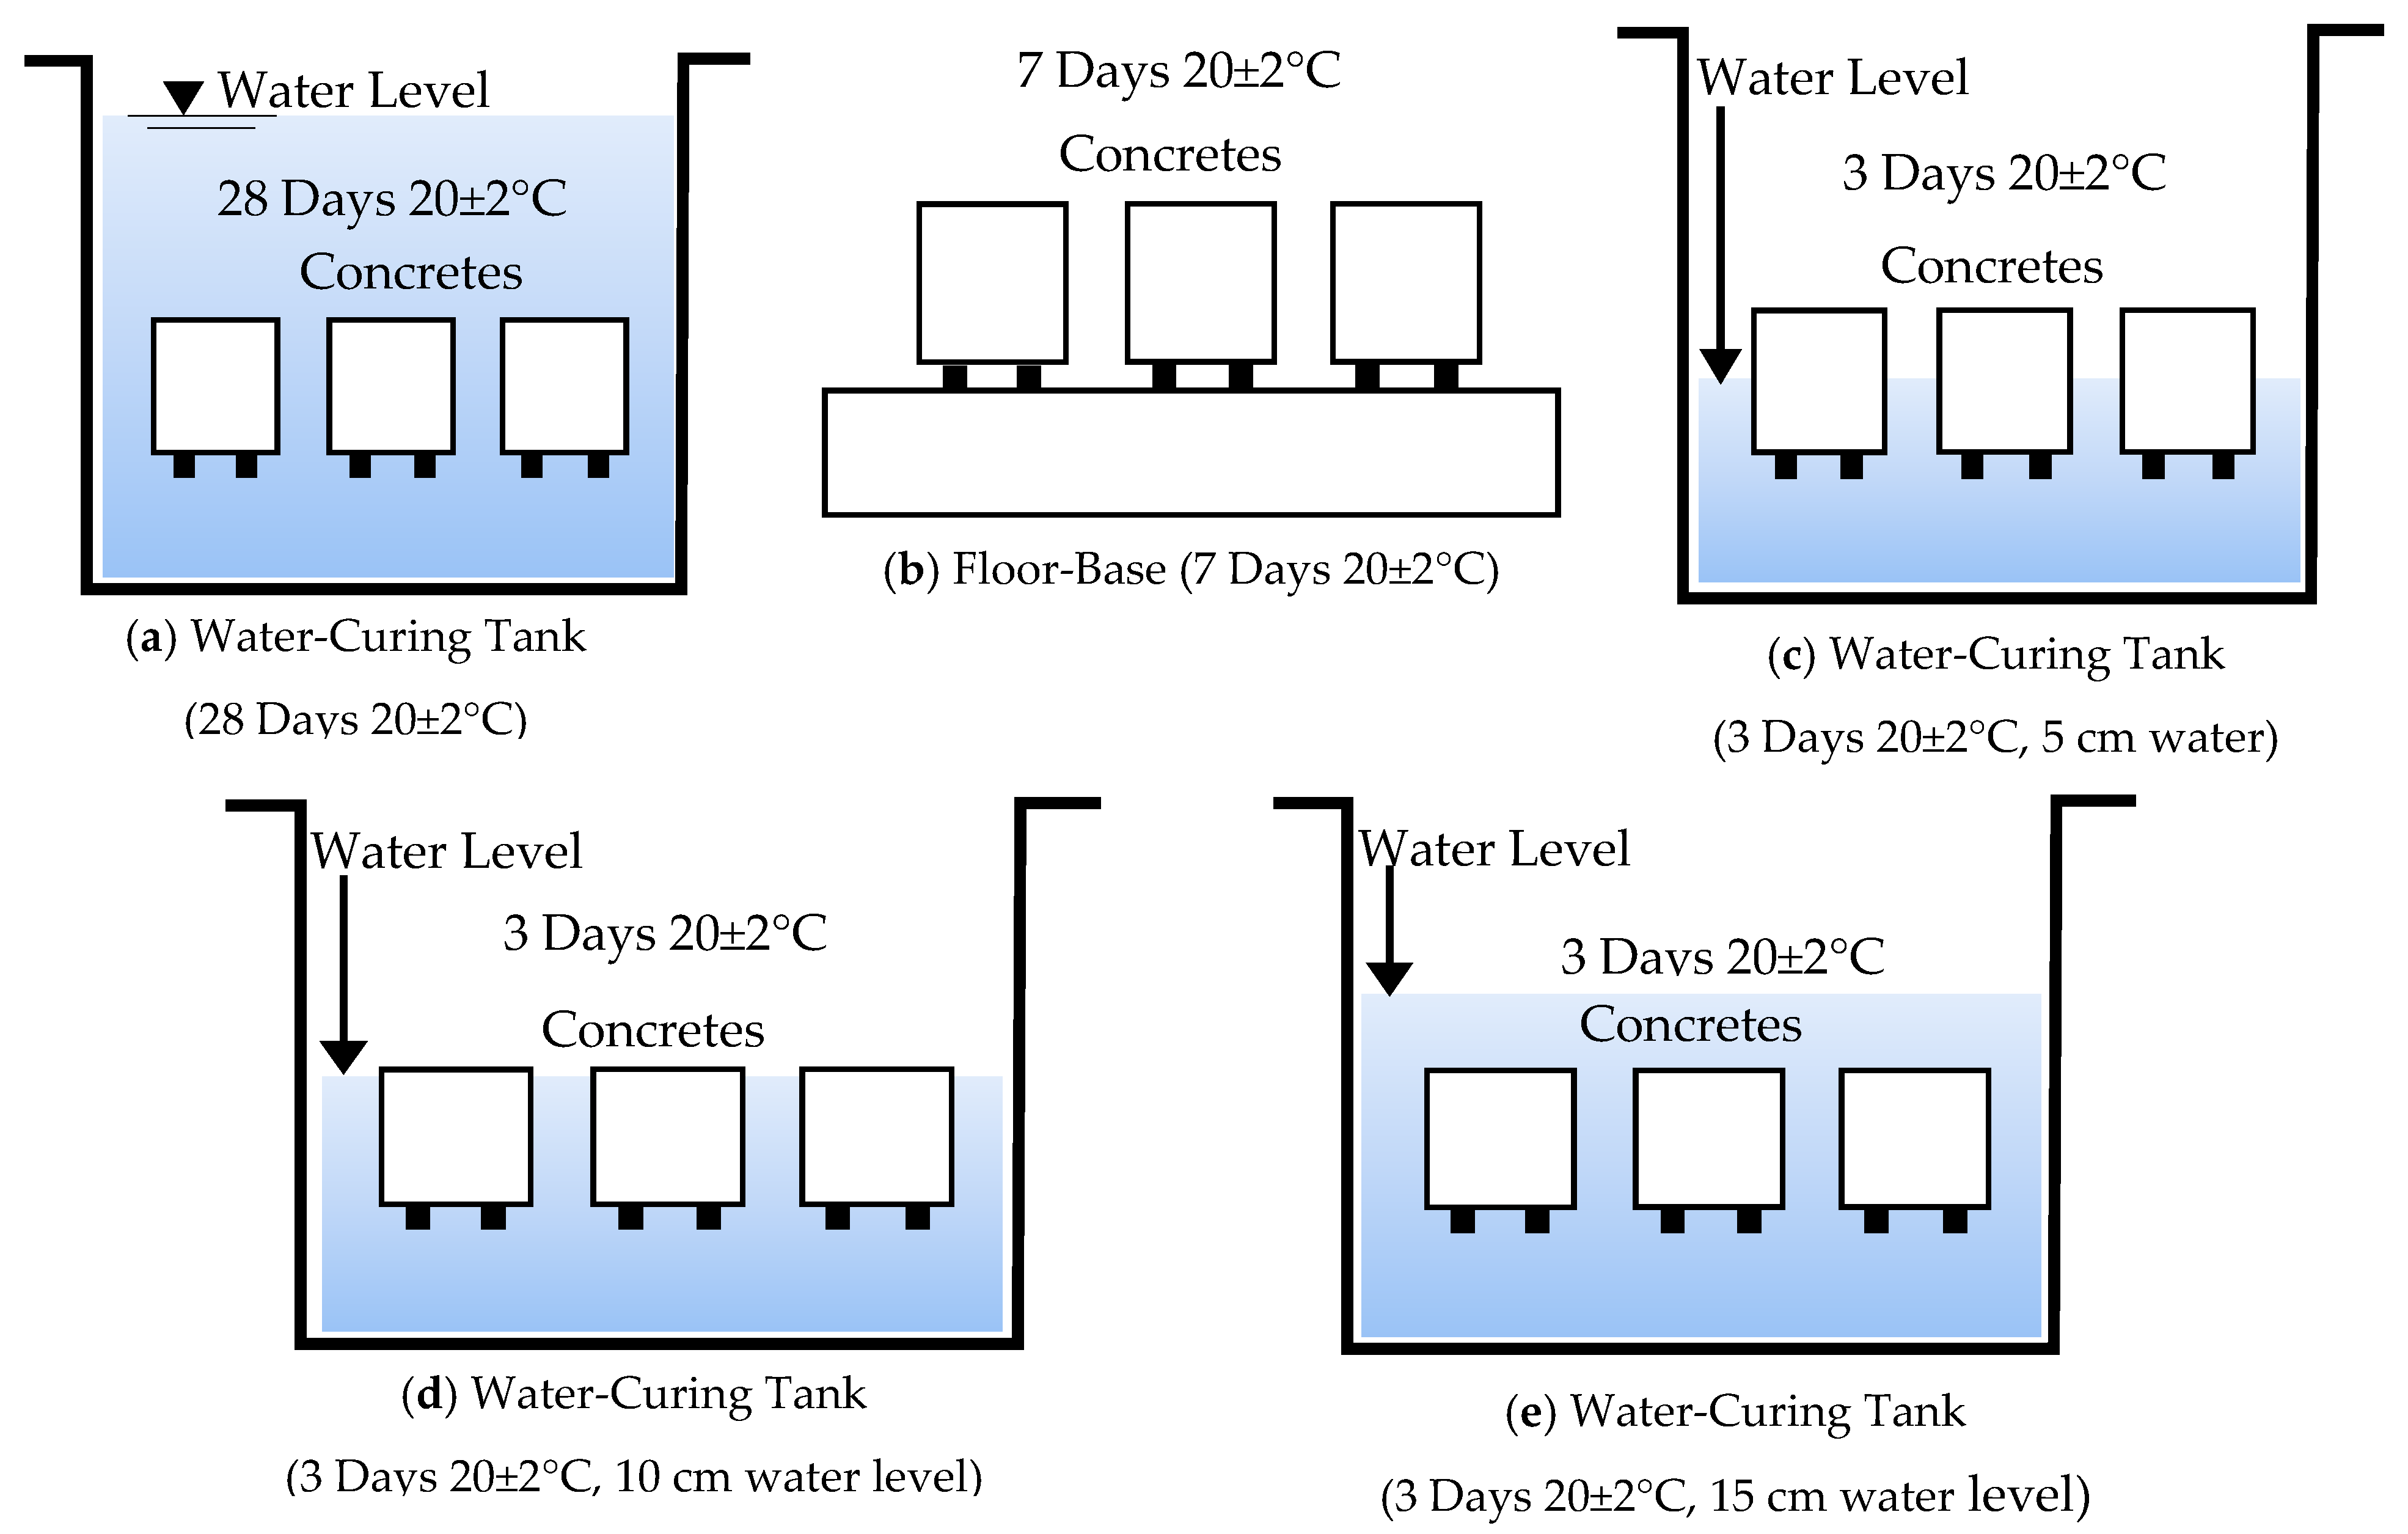
Initial Saturated Surface Dry (SSD) Weight Measurement: After 28 days of curing in water tanks at 20 ± 2 °C, specimens were removed from the curing environment. Surface moisture was carefully wiped off with a dry cloth, and the SSD weight of each specimen was recorded (Figure 6a).
Natural Air Drying: Specimens were then placed on a wooden grid exposed to laboratory air at 20 ± 2 °C for seven days (168 h) to allow natural drying (Figure 6b). After this period, specimens were weighed with an accuracy of 1 g to obtain their dry weight.
Water Immersion at 5 cm Depth: Specimens were immersed in water at a depth of 5 cm and a temperature of 20 ± 2 °C for 72 h (3 days) (Figure 6c). After immersion, surface water was removed with a dry cloth, and the weight was measured using a balance with 1-g sensitivity.
Water Immersion at 10 cm Depth: The immersion procedure was repeated with water depth increased to 10 cm for another 72 h (Figure 6d).
Water Immersion at 15 cm Depth: Finally, specimens were placed on a metal grid and submerged such that water level exceeded the highest point of the specimens by 5 cm (total 15 cm depth) for 72 h (Figure 6e).
The percentage of water absorption was calculated using the following equation:
W a t e r   A b s o r p t i o n   ( % ) = W f i n a l W d r y W d r y × 100
In Equation (4):
  • Wfinal = weight of the specimen after immersion (g)
  • Wdry = weight of the specimen after natural air drying (g)
This formula normalizes the water absorption, eliminating size dependency and allowing comparison across different specimen types. Capillary water absorption coefficients were further calculated following Equation (4), based on the method outlined in TS EN 13057 and ASTM C1585 standards [32,33].
The experimental setup for the capillary water absorption test is shown in Figure 5.
Capillary water absorption tests were performed on six cubic specimens (10 × 10 × 10 cm) from each concrete series. This test method was selected to specifically evaluate the material’s surface water absorption capacity, a critical parameter for assessing moisture transport behavior, freeze–thaw resistance, and surface durability. Unlike total water absorption tests such as ASTM C642 [34], which quantify overall porosity and long-term durability, this method focuses on capillary absorption driven by surface contact.
The relationship between the amount of absorbed water and time follows the equation:
Q A = k . t
In Equation (5):
  • Q = Amount of water absorbed (cm3)
  • A = Area of the surface in contact with water (cm2)
  • k = Capillary water absorption coefficient (cm/s1/2)
  • t = Time (s)
This formula (Equation (5)) allows determination of the capillary absorption coefficient k, which characterizes the rate of water uptake through capillary action.

2.2.4. Behavior of Concrete Specimens Subjected to High Temperatures

After 28 days of standard curing followed by seven days of air drying, the concrete specimens were subjected to thermal treatment in a laboratory oven at 100 °C, 200 °C, and 300 °C, each maintained for 72 h. These temperature levels were chosen to specifically simulate the evaporation of free and chemically bound water, as well as the dehydration processes within the concrete matrix.
It should be noted that this protocol does not replicate full-scale fire conditions, which typically involve much higher temperatures (600–800 °C) and different testing standards. While high-temperature tests in the literature often exceed 600 °C to simulate fire exposure, this study limits thermal treatment to 300 °C intentionally. This allows isolation of effects related to free and bound water loss, microcrack initiation, and early-stage dehydration, without inducing the extensive structural degradation or phase changes observed at higher temperatures.
Following each thermal exposure, specimens were weighed to determine mass loss, and percentage weight loss was calculated to assess the impact of elevated temperatures on the physical integrity of the lightweight concrete samples.

3. Results

3.1. Evaluation of Flexural Strength of Lightweight Concretes

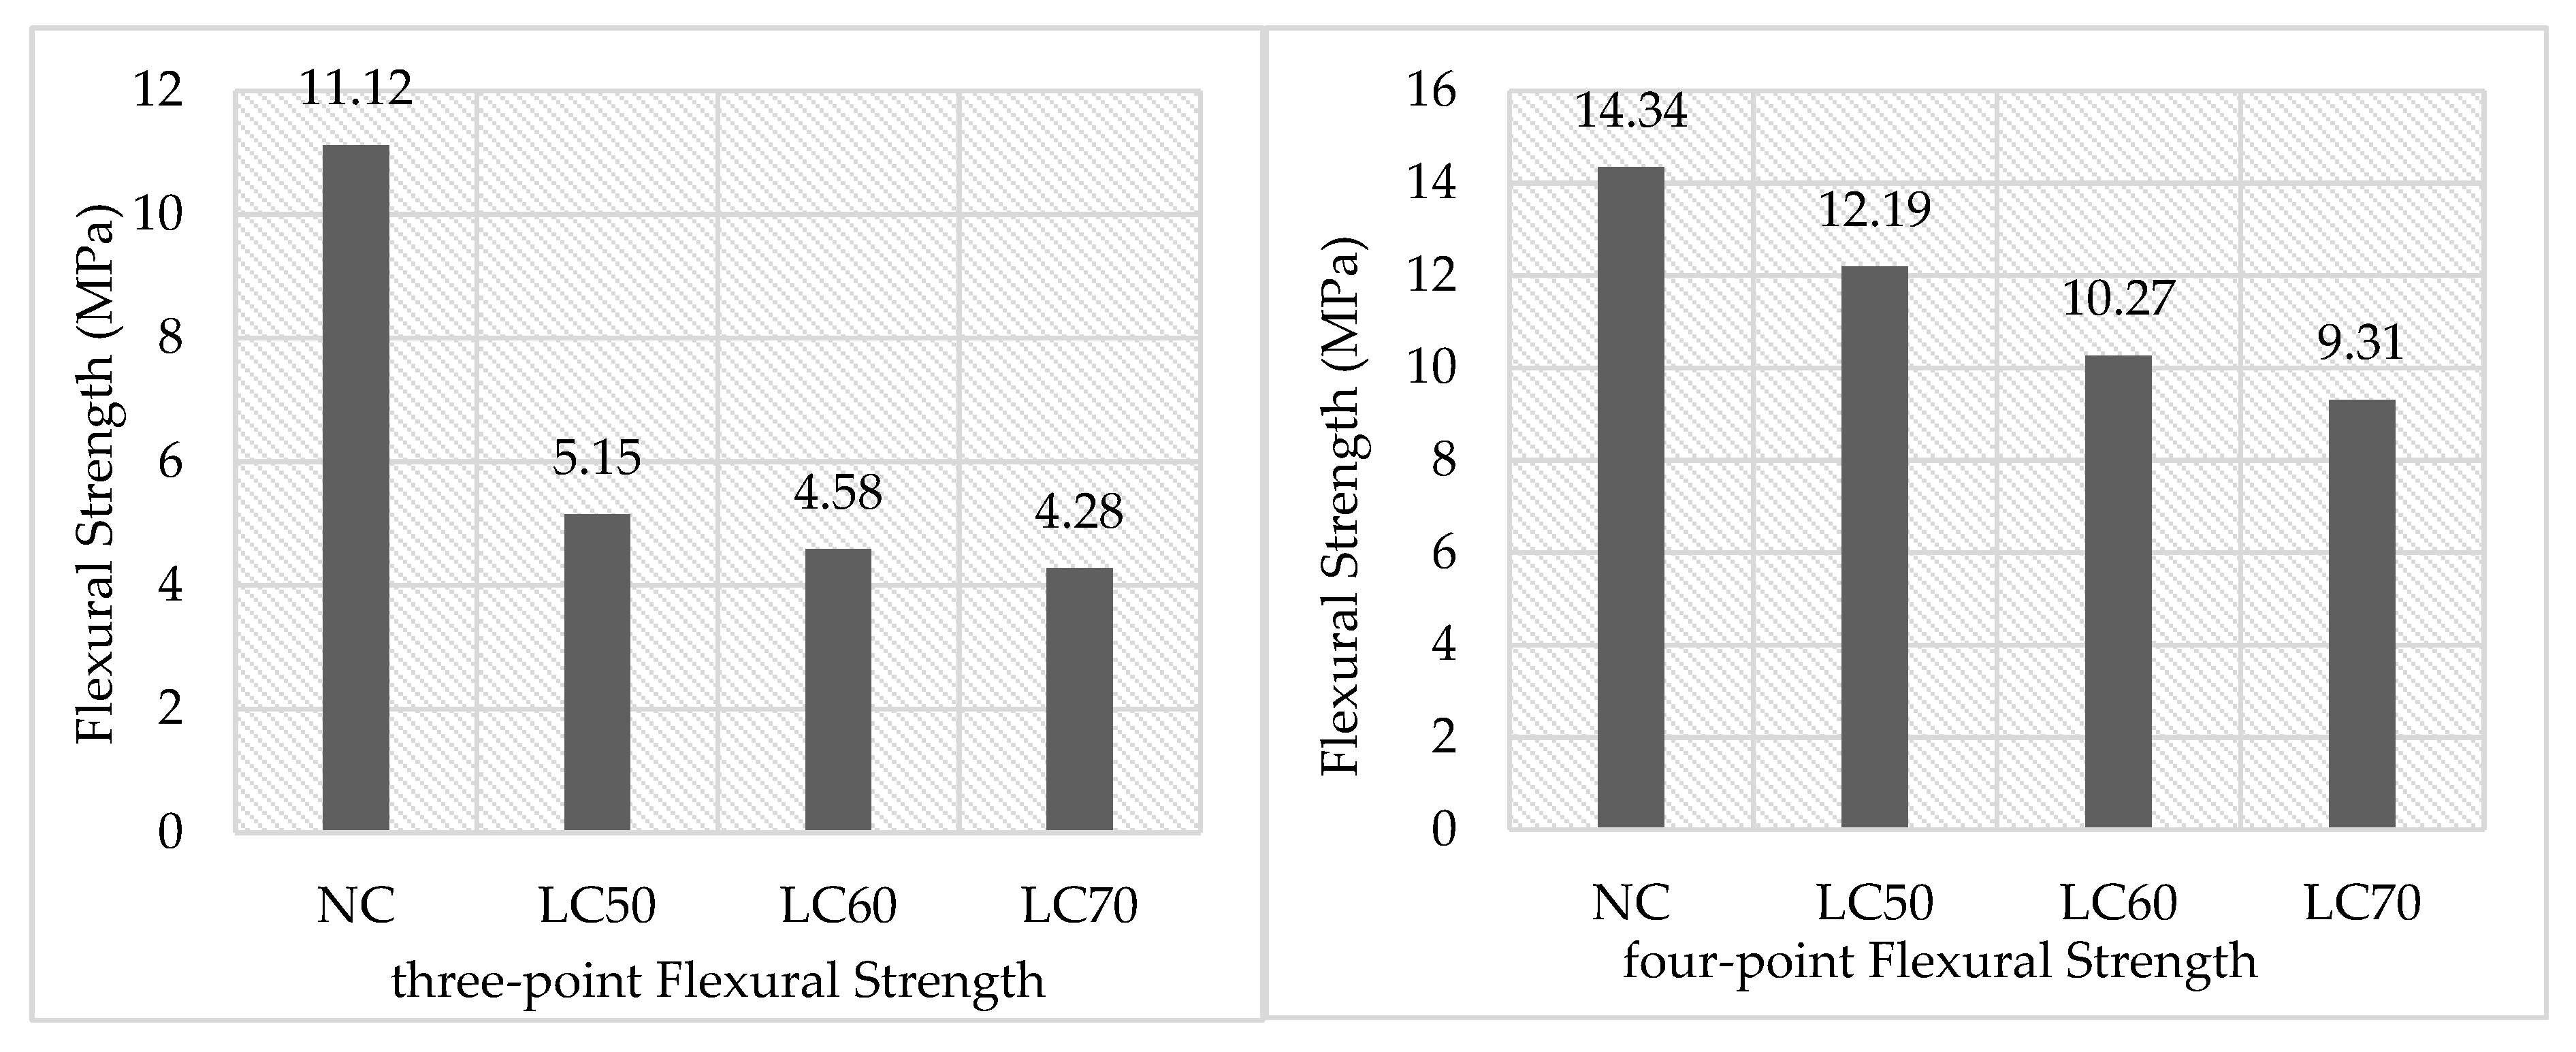
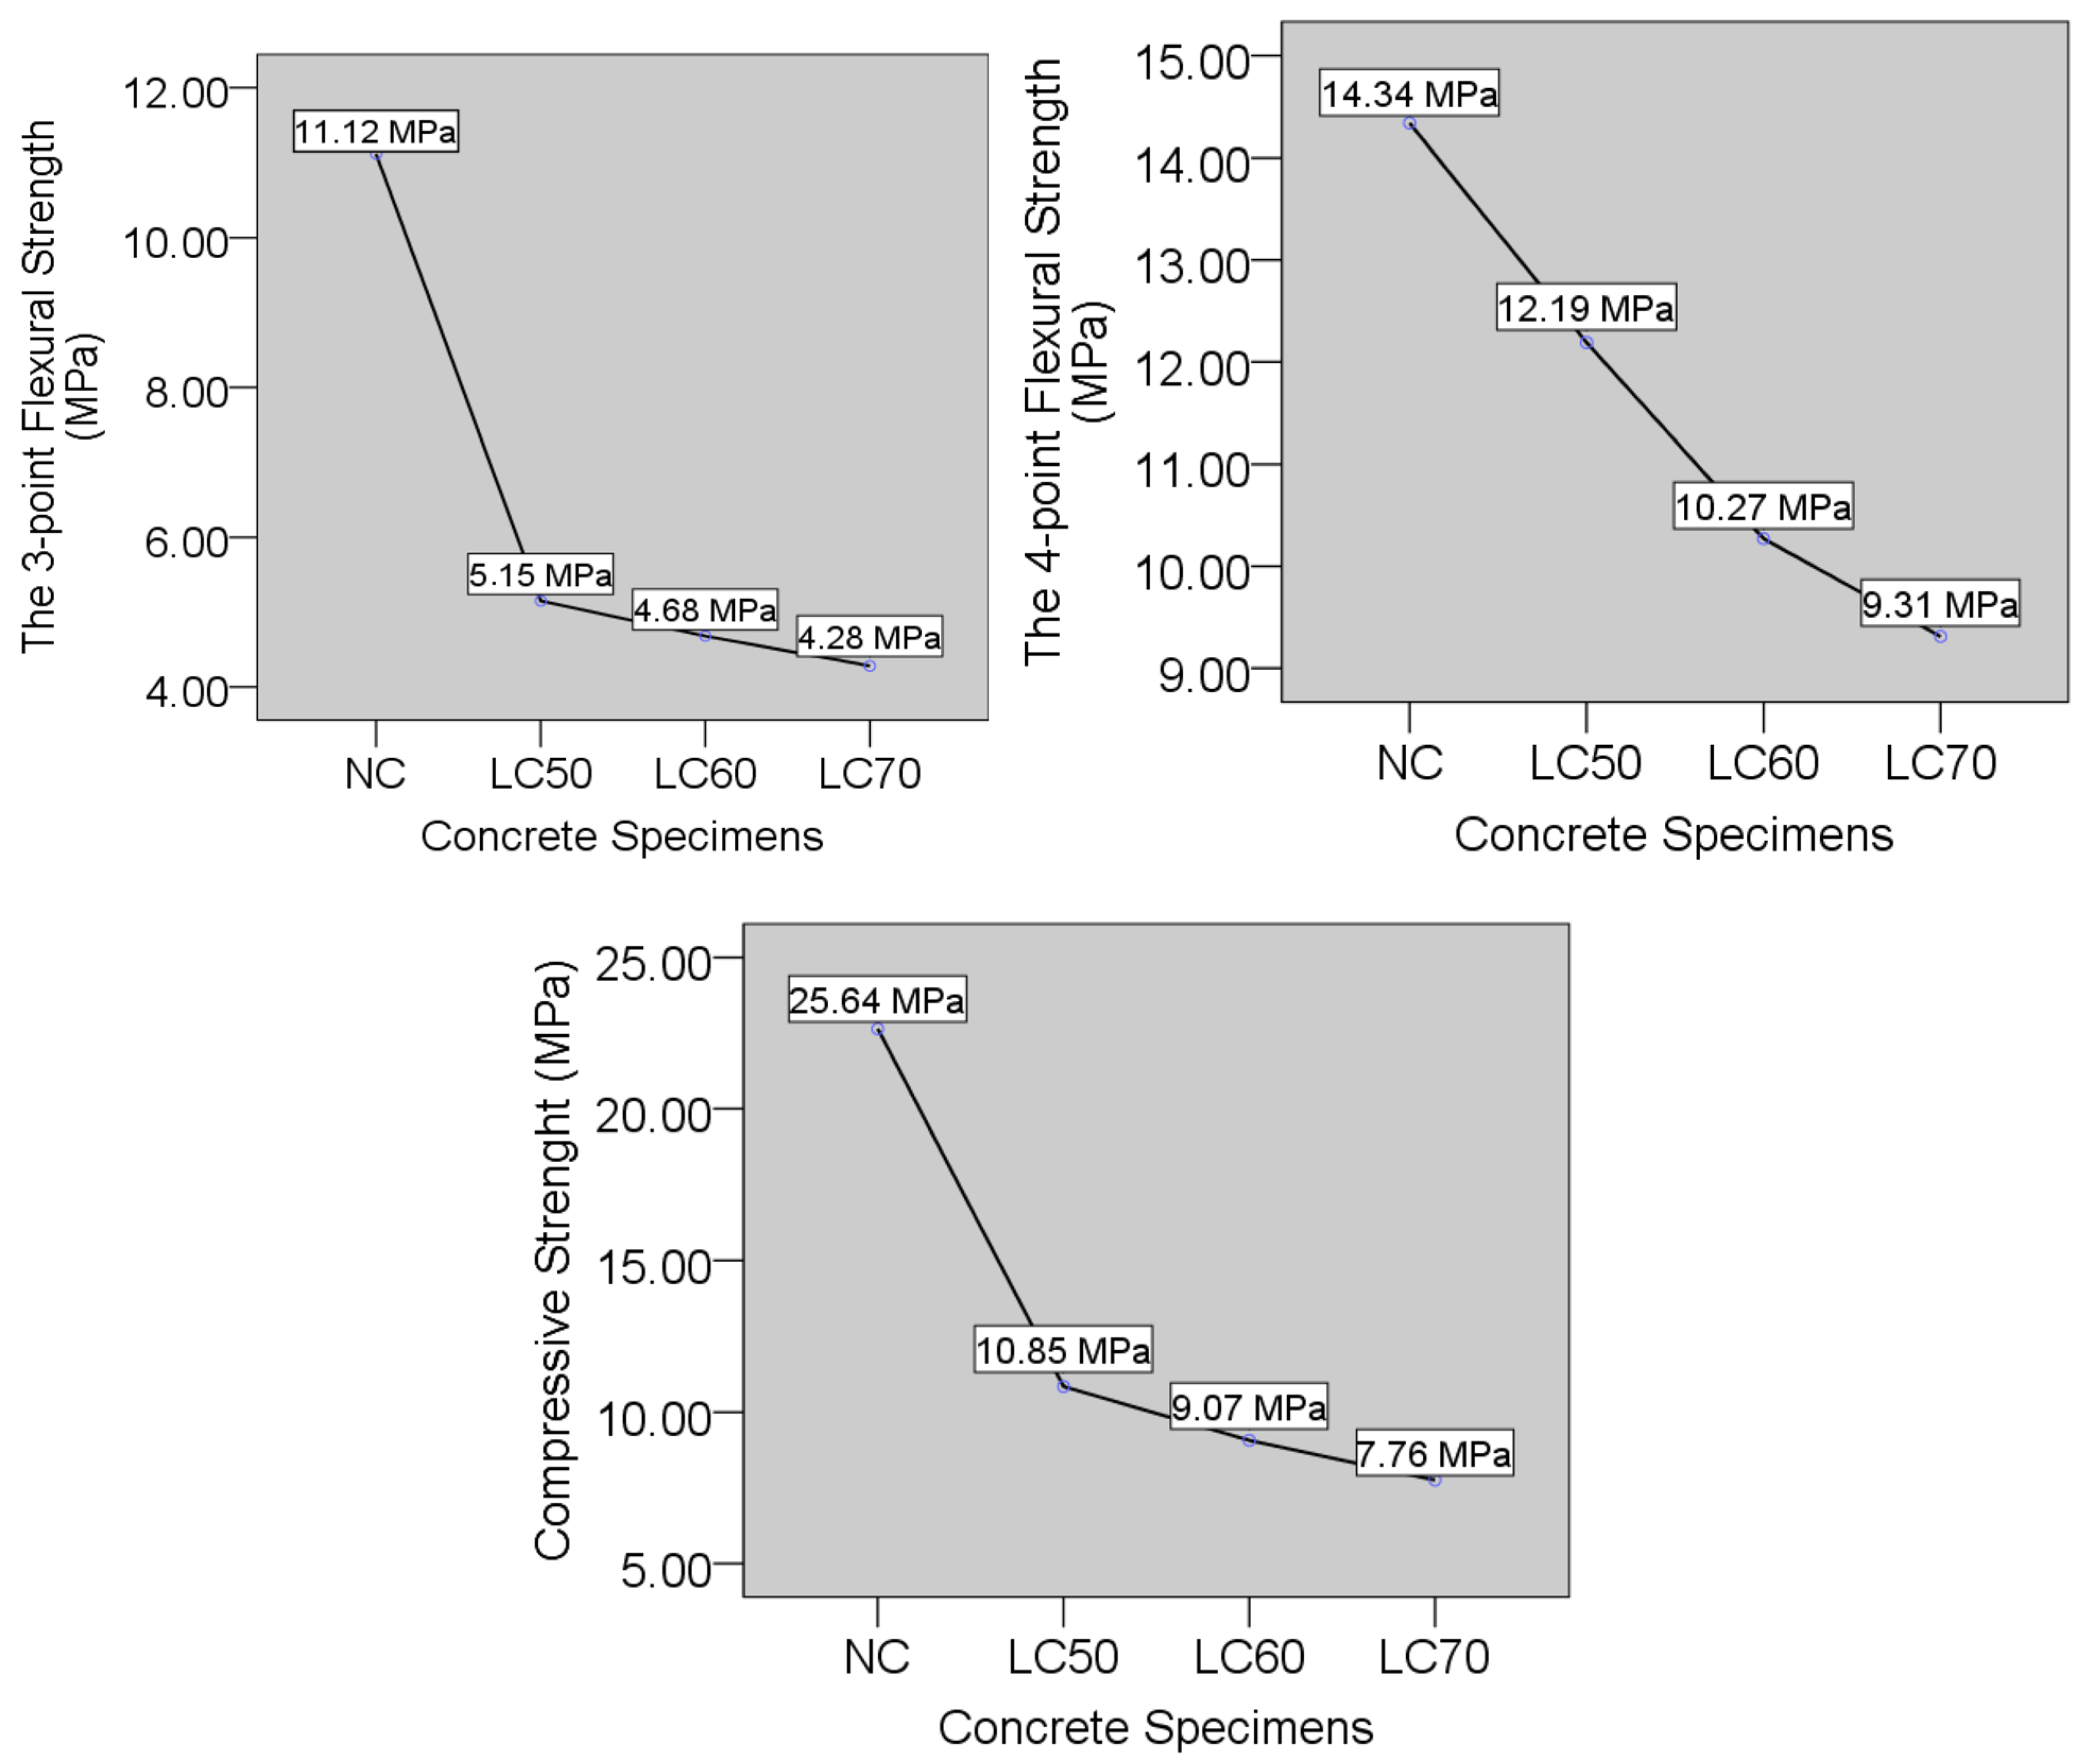
As shown in Figure 7, replacing limestone aggregate with acidic pumice aggregate resulted in a systematic reduction in both three-point and four-point flexural strengths of the concrete specimens. Specifically, the three-point flexural strength decreased from 11.12 MPa in the normal concrete (NC) mix to 4.28 MPa in the LC70 mix, representing an approximate 61.5% reduction. This significant decline highlights the critical impact of aggregate porosity and the weakened interfacial bond between the pumice particles and the cementitious matrix on the concrete’s flexural resistance.
The reduction in flexural performance is attributed not only to the lower density of the pumice aggregate but also to its high surface porosity, which negatively affects the integrity of the aggregate–matrix interface.
While such strength reductions are generally accepted as inherent trade-offs in lightweight concrete applications, the present results emphasize the importance of optimizing the interfacial transition zone (ITZ) between the aggregate and cement paste. Potential approaches to improve the tensile and flexural properties include the incorporation of fibers or other reinforcement methods.

3.2. Evaluation of Compressive Strength of Lightweight Concretes

As shown in Figure 8, increasing the proportion of acidic pumice aggregate in the concrete mix results in a significant decrease in compressive strength. The control concrete (NC) exhibited a compressive strength of 25.64 MPa, which decreased to 7.76 MPa in the LC70 mix containing 70% pumice aggregate. This corresponds to an approximate 69.7% reduction in compressive strength from the control to the highest pumice substitution level.
This substantial strength loss is consistent with previous studies that report a strong inverse correlation between aggregate porosity and compressive strength in lightweight concretes [35]. The high porosity and low density of pumice aggregates reduce mechanical interlocking and load-bearing capacity, thereby compromising the overall compressive performance.

3.3. Evaluation of Water Absorption Behavior of Lightweight Concretes

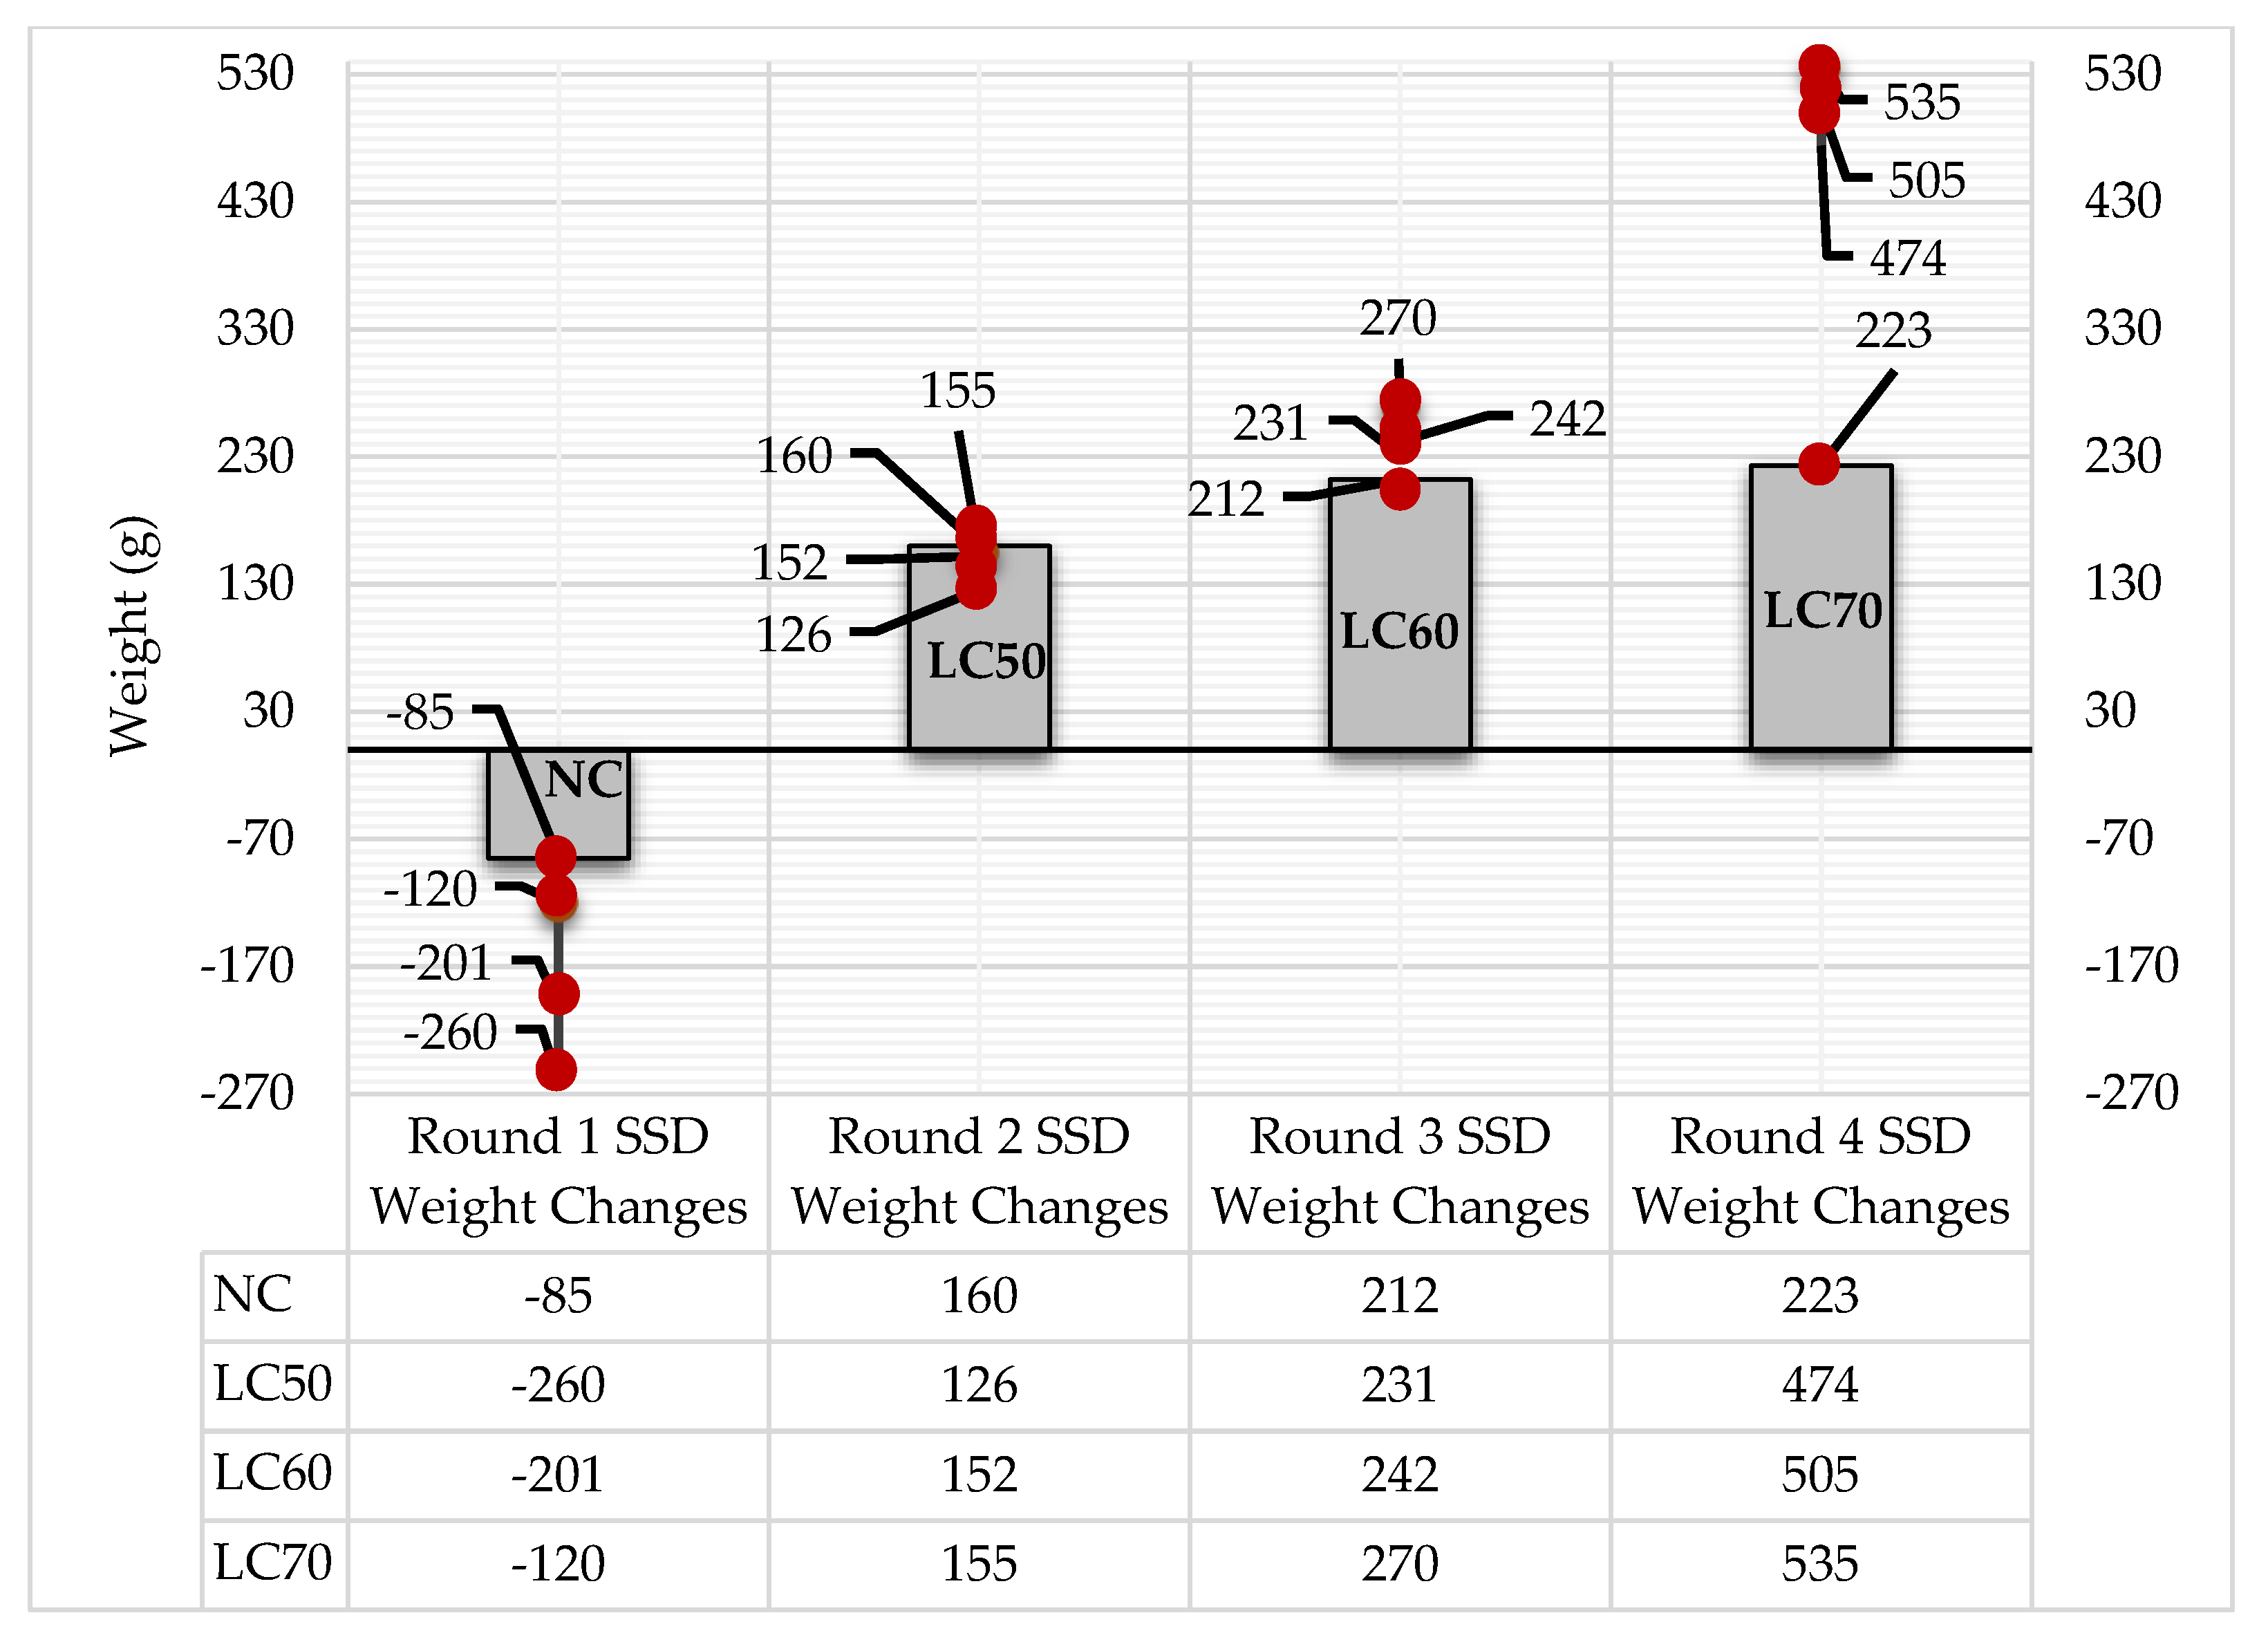
The results shown in Figure 9 illustrate the water absorption behavior. The initial reduction in water content caused by natural air drying, followed by subsequent increases in water absorption, is detailed in Figure 10.
As shown in Figure 10, the 28-day-old concrete specimens were first air-dried under laboratory conditions for 168 h. Following this period, a stepwise immersion procedure was applied to assess capillary water absorption behavior. The specimens were immersed in water at incremental depths of 5 cm, 10 cm, and 15 cm, each for a duration of 72 h. After each interval, the amount of water absorbed was measured using a precision scale with an accuracy of 0.01 g. This incremental immersion method was designed to simulate gradual and controlled water exposure conditions.
Throughout the testing, water temperature was maintained at 20 ± 2 °C to ensure consistency. At the end of the test, all concrete specimens exhibited increased water absorption, with the LC70 mix showing the highest value at 415 g. This elevated absorption is attributed to the higher porosity and greater volume fraction of pumice aggregate in the LC70 mix.
Following 168 h of exposure to ambient outdoor conditions, the 28-day-old normal concrete (NC) specimen exhibited a mass loss of 85 g, primarily due to the evaporation of pore water. Among all samples, the LC50 mix showed the highest moisture loss, with a mass reduction of 260 g. This finding suggests that lightweight concrete mixes with higher pumice content are more susceptible to moisture evaporation.
The significantly higher water absorption observed in the LC70 mix further supports the conclusion that the open pore structure of acidic pumice aggregates remains largely accessible even after curing. This behavior may be attributed to the limited penetration of cement paste into the interconnected pore network of the pumice during mixing. As a result, continuous capillary channels are likely to form, facilitating both water ingress and egress.

3.4. Mass Loss and Structural Changes in Lightweight Concrete Under High Temperatures

The thermal behavior of the concrete specimens was assessed 68 days after exposure to elevated temperatures of 100 °C, 200 °C, and 300 °C. As illustrated in Figure 11 and Figure 12, increasing the volumetric replacement of limestone with acidic pumice aggregate resulted in a consistent increase in mass loss across all temperature levels. This reduction in weight is primarily attributed to the evaporation of free and chemically bound water retained within the concrete’s porous matrix.
Specimens with higher pumice content exhibited more pronounced mass loss under thermal exposure, likely due to the amorphous and highly porous nature of pumice, which facilitates deeper heat penetration and accelerates internal moisture evaporation.
In addition to mass loss, visible structural changes were observed. After exposure to 200 °C and 300 °C, concretes containing 60% and 70% pumice developed distinct surface voids, typically ranging from 1 to 3 mm in depth. These voids were most prominent in the LC70 specimens, indicating that high pumice content increases susceptibility to thermally induced microstructural degradation and surface damage.

3.5. Correlation and Discrepancy Analysis of Mechanical Strengths

To comprehensively assess the relationship between the measured mechanical properties, a correlation analysis was conducted between compressive and flexural strength. Compressive strength values decreased from 25.64 MPa in the normal concrete (NC) mix to 7.76 MPa in the LC70 mix. Similarly, three-point flexural strength declined from 11.12 MPa to 4.28 MPa, while the four-point flexural test followed the same downward trend, consistently yielding slightly higher values.
As shown in Figure 7 and Figure 8, a clear linear relationship exists between compressive and flexural strengths. Increasing the proportion of pumice aggregate results in simultaneous reductions in both, indicating that flexural strength diminishes in parallel with compressive strength.
For a quantitative evaluation, the Pearson correlation coefficient was calculated as r = 0.88, indicating a strong positive linear correlation. In other words, as compressive strength decreases, flexural strength also declines in a directly proportional manner. A linear regression analysis further confirmed this relationship, and the following equation was derived to model it:
Yflexural = 0.15 × Xcompressive + 2.25
In this equation, Yflexural represents flexural strength (MPa), and Xcompressive represents compressive strength (MPa). The regression line exhibits a high degree of fit to the data points, which is visually supported in Figure 7 and Figure 8 and statistically substantiated by an R2 = 0.77 value.

3.6. Relationship Between Compressive and Flexural Strength

In conventional concrete, flexural strength typically represents 10–15% of compressive strength. However, the flexural-to-compressive strength ratios observed in this study ranged from 25% to 35%, indicating relatively enhanced flexural performance. This improvement may be attributed to the unique morphology of the acidic pumice aggregate and the resulting microstructural characteristics of the concrete, which may contribute to better crack-bridging and energy dissipation under bending-induced tensile stresses.
Nevertheless, as detailed in Section 3.1 and Section 3.2, the general reduction in both compressive and flexural strengths with increasing pumice content reflects an inherent trade-off in the use of lightweight aggregates. These reductions are primarily linked to the high porosity of pumice and the associated weakening of the aggregate–matrix interface.
From an engineering standpoint, the existence of a predictable and robust correlation between these two fundamental mechanical properties simplifies structural design and improves reliability in performance predictions under various loading conditions. However, the reduction in absolute strength values must be carefully considered when selecting lightweight concrete for structural applications. In cases where tensile bending resistance is critical—such as pavements, slabs, or precast components—the relatively strong flexural performance of the pumice-based mixtures, even at lower compressive strengths, presents a promising advantage.
These findings highlight the need for continued optimization and deeper investigation into the effects of lightweight aggregate characteristics on the structural performance of concrete.

4. Analysis of Findings

As quantitatively demonstrated in Section 3.6—through a Pearson correlation coefficient of r = 0.88 and a high coefficient of determination (R2) from regression analysis—a strong and positive correlation was established between compressive and flexural strengths. This relationship underscores a critical aspect of the mechanical behavior of the lightweight concrete mixtures investigated. While it aligns with the general understanding that higher compressive strength often correlates with greater bending resistance, the proportional behavior observed in this study remains notable despite the substantial strength reductions associated with acidic pumice-based mixtures.
This analysis systematically evaluates the impact of pumice content on the mechanical and durability properties of concrete, based on the quantitative data presented in the preceding sections.
All correlations were found to be statistically significant, with p-values of p = 0.000, well below the standard α-level of 0.05 (see Table 7). These findings are further illustrated in Figure 13, which highlights substantial reductions in compressive and flexural strengths in the LC50, LC60, and LC70 mixtures relative to the normal concrete (NC).
The correlation coefficient between three-point flexural strength and pumice content was calculated as r = −0.988, indicating a very strong negative correlation—well beyond the conventional threshold of |r| > 0.70. This clearly demonstrates that increasing the volume fraction of pumice aggregate significantly reduces three-point flexural strength. Similarly strong inverse relationships were identified for four-point flexural strength (r = −0.952) and compressive strength (r = −0.994), confirming that the mechanical performance of concrete is highly sensitive to pumice incorporation. These results are summarized in Table 8.
The near-perfect negative correlation coefficients suggest a quasi-deterministic relationship, establishing pumice content as a key predictive variable in determining mechanical performance in lightweight concrete systems.
Beyond strength-related parameters, strong correlations were also observed in durability metrics. Specifically, water absorption and capillary-driven weight changes showed correlation coefficients of r = 0.983 and r = −0.987, respectively. These values underscore the dual functionality of pumice—as both a lightweight aggregate and a moisture-responsive material—highlighting its complex role in long-term durability under environmental stressors such as heat and water exposure.
In summary, the statistical analyses reveal the inherent trade-offs in the use of acidic pumice aggregates: while they lower density and enhance thermal insulation, they simultaneously reduce mechanical strength and increase sensitivity to moisture and thermal degradation.
For the concrete specimens, the correlation coefficients for weight change over 28 days and 168 h were calculated as r = −0.997 and r = −0.953, respectively. Both values represent strong negative correlations, well exceeding the commonly accepted threshold of |r| > 0.70. These results indicate that weight loss over time is closely and inversely related to the pumice content in the concrete mixtures.
Similarly, the correlation coefficients between water absorption and weight gain during incremental immersion at water depths of 5 cm, 10 cm, and 15 cm (each for 72 h) were found to be r = 0.951, r = 0.963, and r = 0.983, respectively. These values confirm a strong positive relationship between water absorption and weight gain during immersion: as concrete absorbs more water, its weight correspondingly increases.
In terms of high-temperature exposure, LC70 concrete exhibited more pronounced mass loss than NC concrete, primarily due to its higher pumice content. This aligns with the trend observed across all mixtures: as the proportion of pumice increases, both water absorption and susceptibility to moisture-related mass loss also rise. Table 9 shows a statistically significant correlation (p = 0.003) between water absorption and specimen weight, confirming the reliability of this relationship at a significance level of p < 0.05. These results are detailed in Table 10.
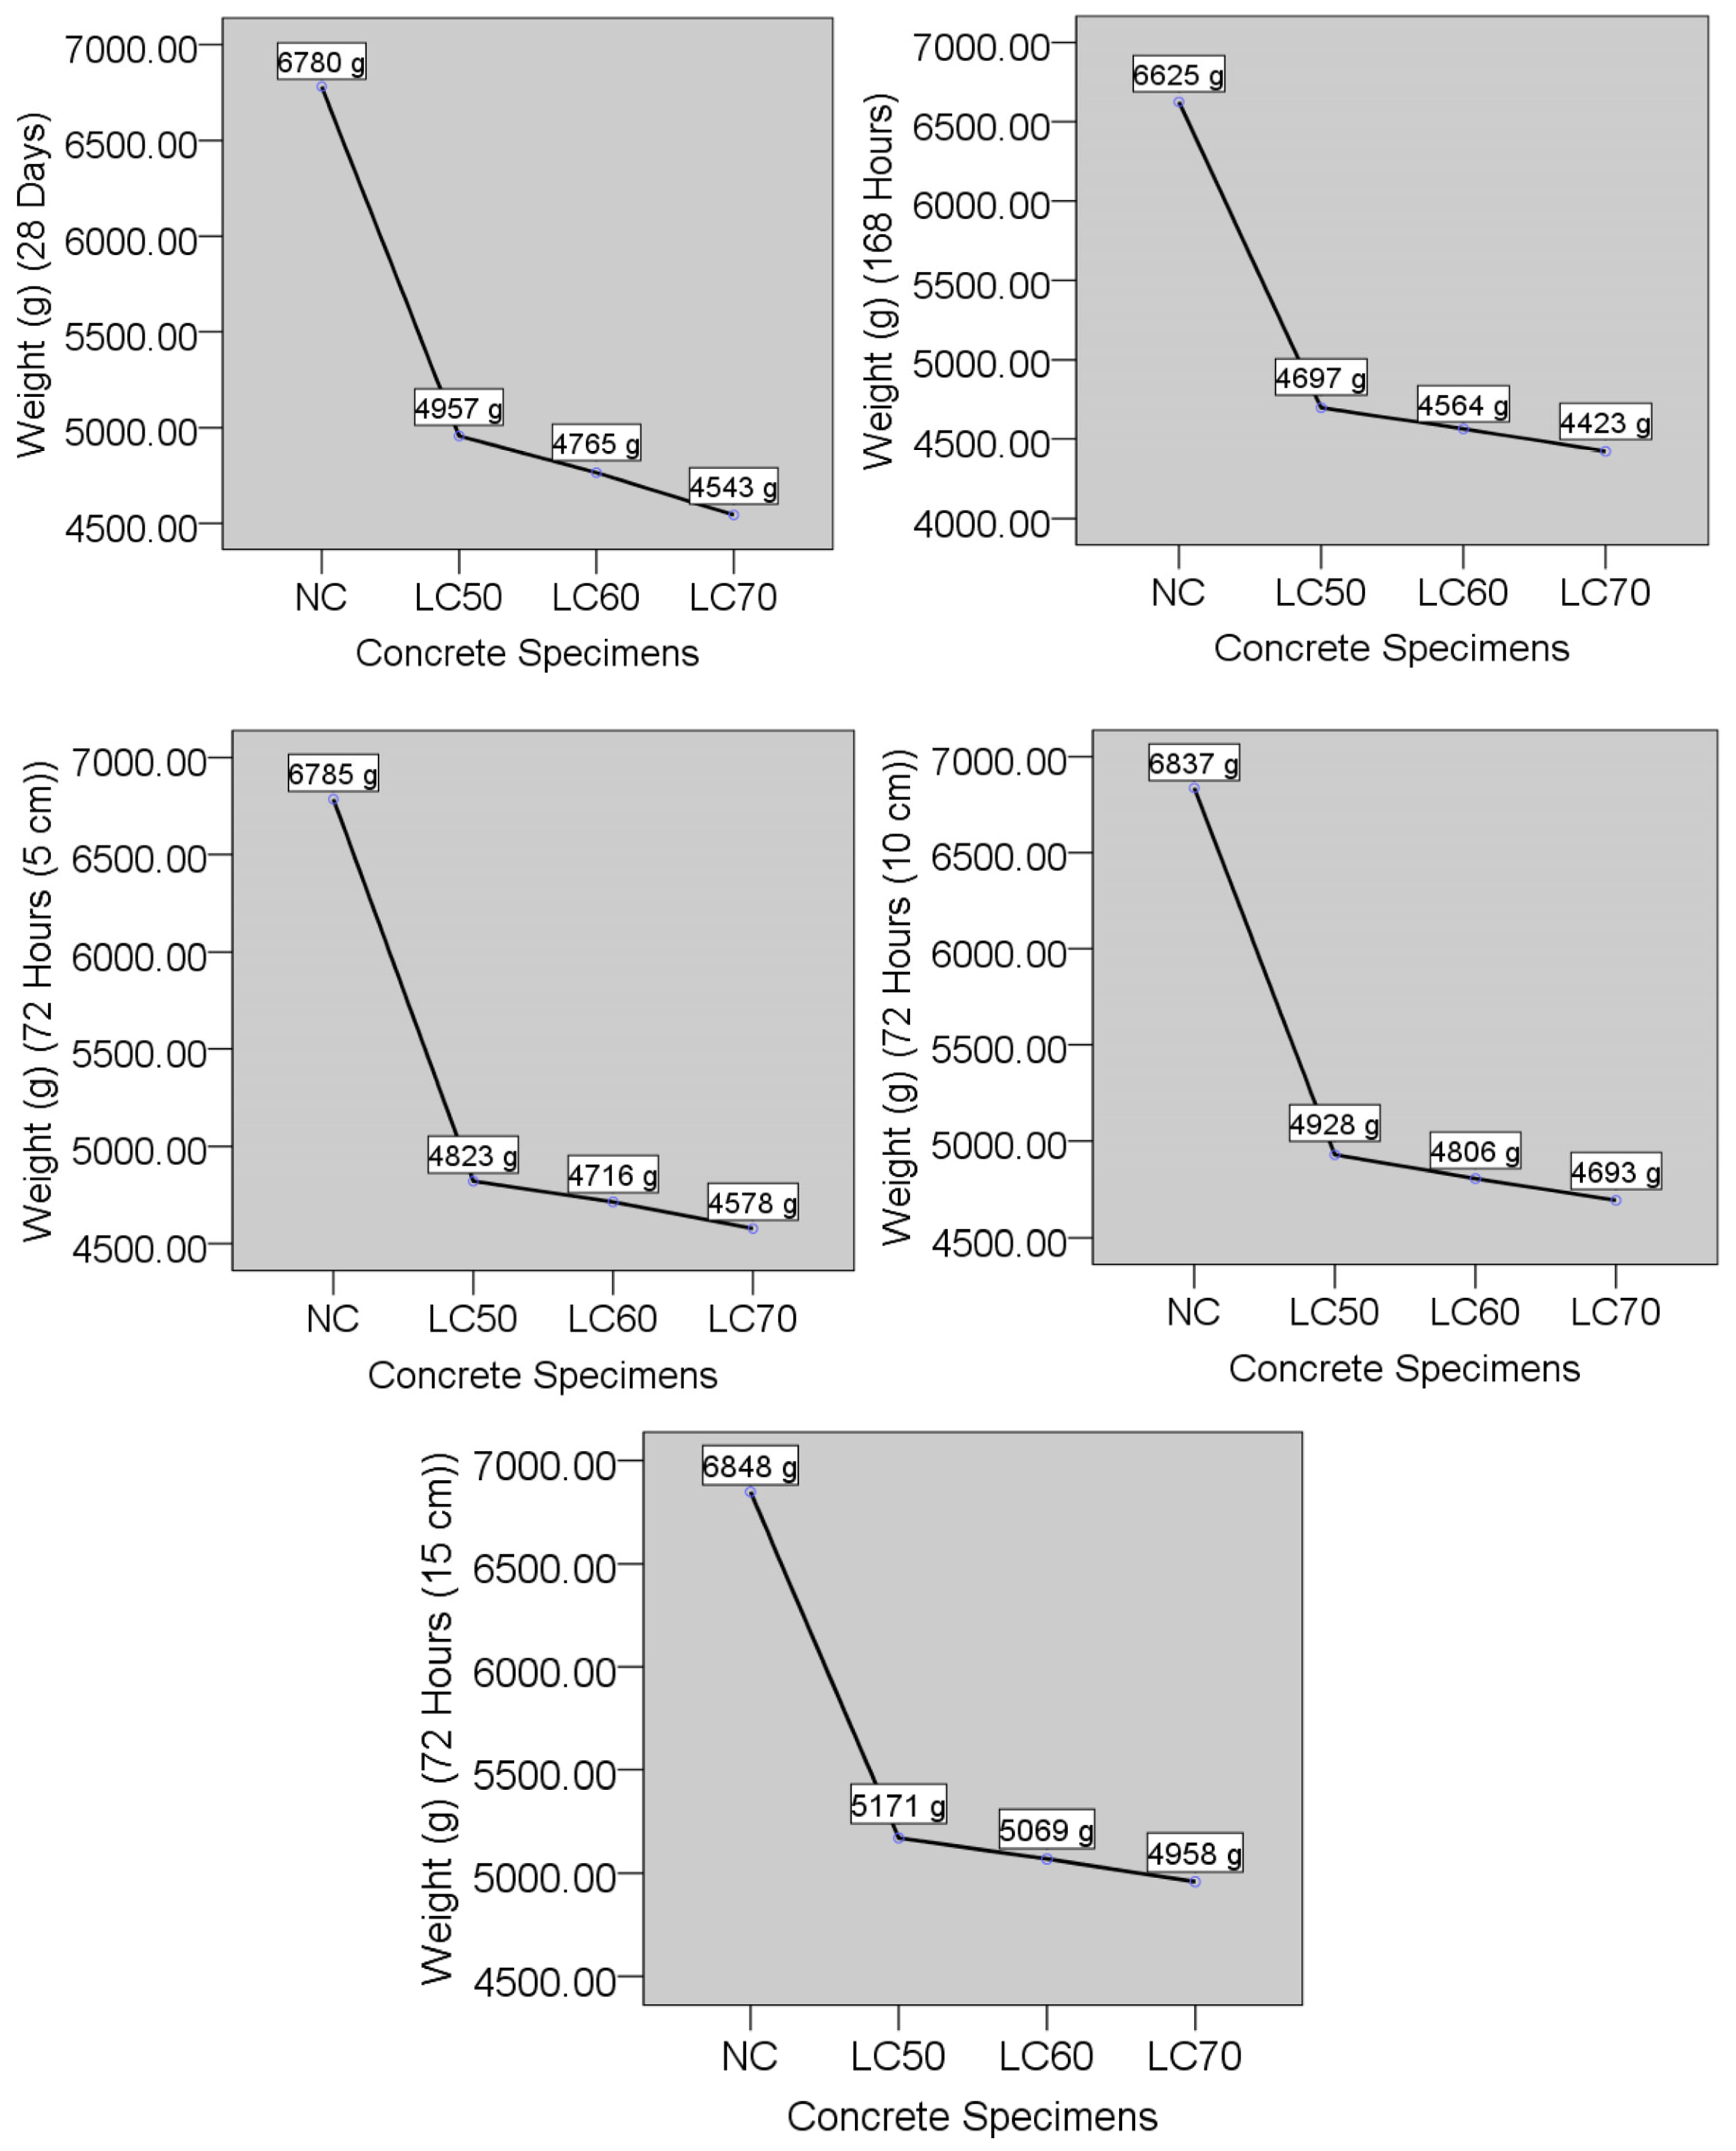
As depicted in Figure 14, after 168 h of natural air drying, the mass of the NC specimen decreased from 6710 g to 6625 g, LC50 from 4957 g to 4697 g, and LC70 from 3150 g to 2890 g. These observations clearly demonstrate the enhanced moisture loss in pumice-based concretes, attributable to their higher porosity and more open internal structure.
The correlation coefficients between concrete weight changes measured at 28 days and after 168 h—both under ambient conditions of 20 ± 2 °C—were found to be r = −0.911 and r = −0.920, respectively. These strong negative correlations (|r| > 0.70) indicate that increasing thermal exposure leads to a significant reduction in specimen mass.
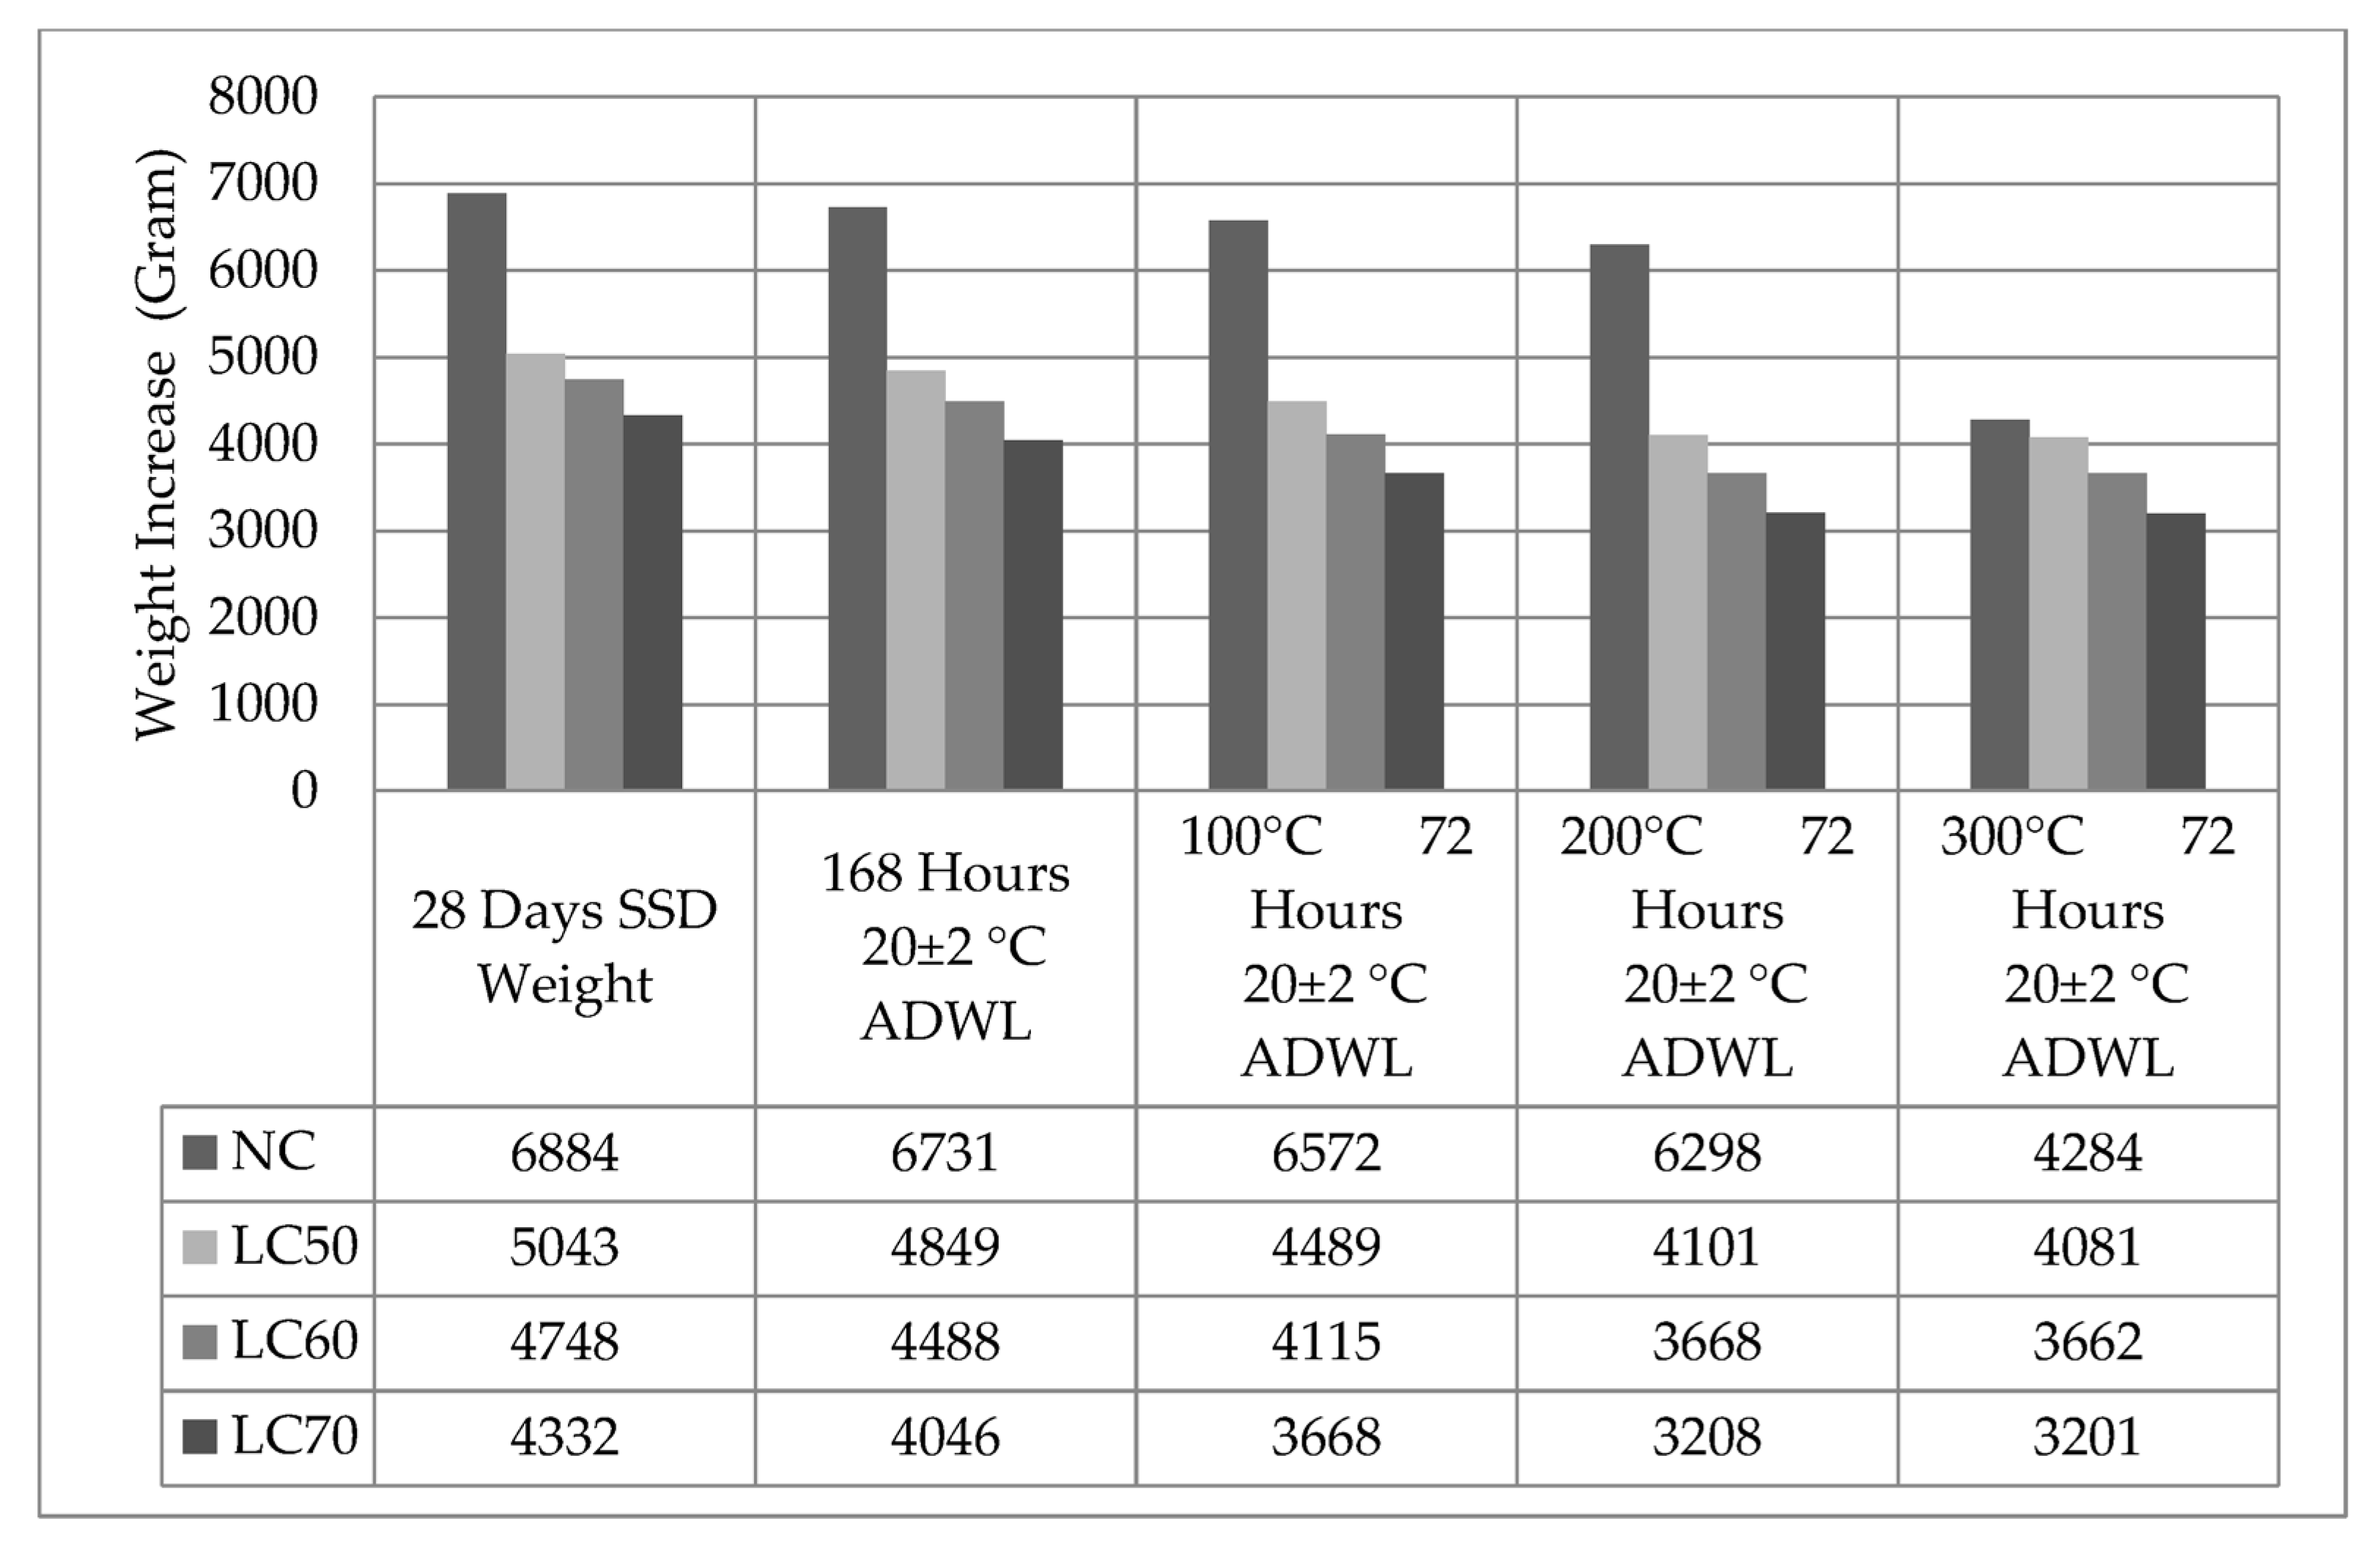
For example, the mass of the normal concrete (NC) decreased from 6884 g to 4284 g after exposure to 300 °C, while the LC70 mix showed a reduction from 4332 g to 3201 g under the same conditions. This confirms that elevated temperatures accelerate moisture loss and drive off bound water, particularly in mixtures with higher pumice content.
Increased pumice content was also found to negatively impact the thermal resistance of the concrete. The correlation coefficients between temperature and mass loss for NC, LC50, LC60, and LC70 exposed to 100 °C, 200 °C, and 300 °C were −0.913, −0.915, and −0.987, respectively. The LC70 mix exhibited the highest weight loss, attributable to its greater porosity and lower thermal stability.
As detailed in Table 11, higher pumice proportions were also associated with increased water absorption capacity. Correlations between elevated temperature and weight loss were all statistically significant (p = 0.000, see Table 12), confirming the reliability of these observations.
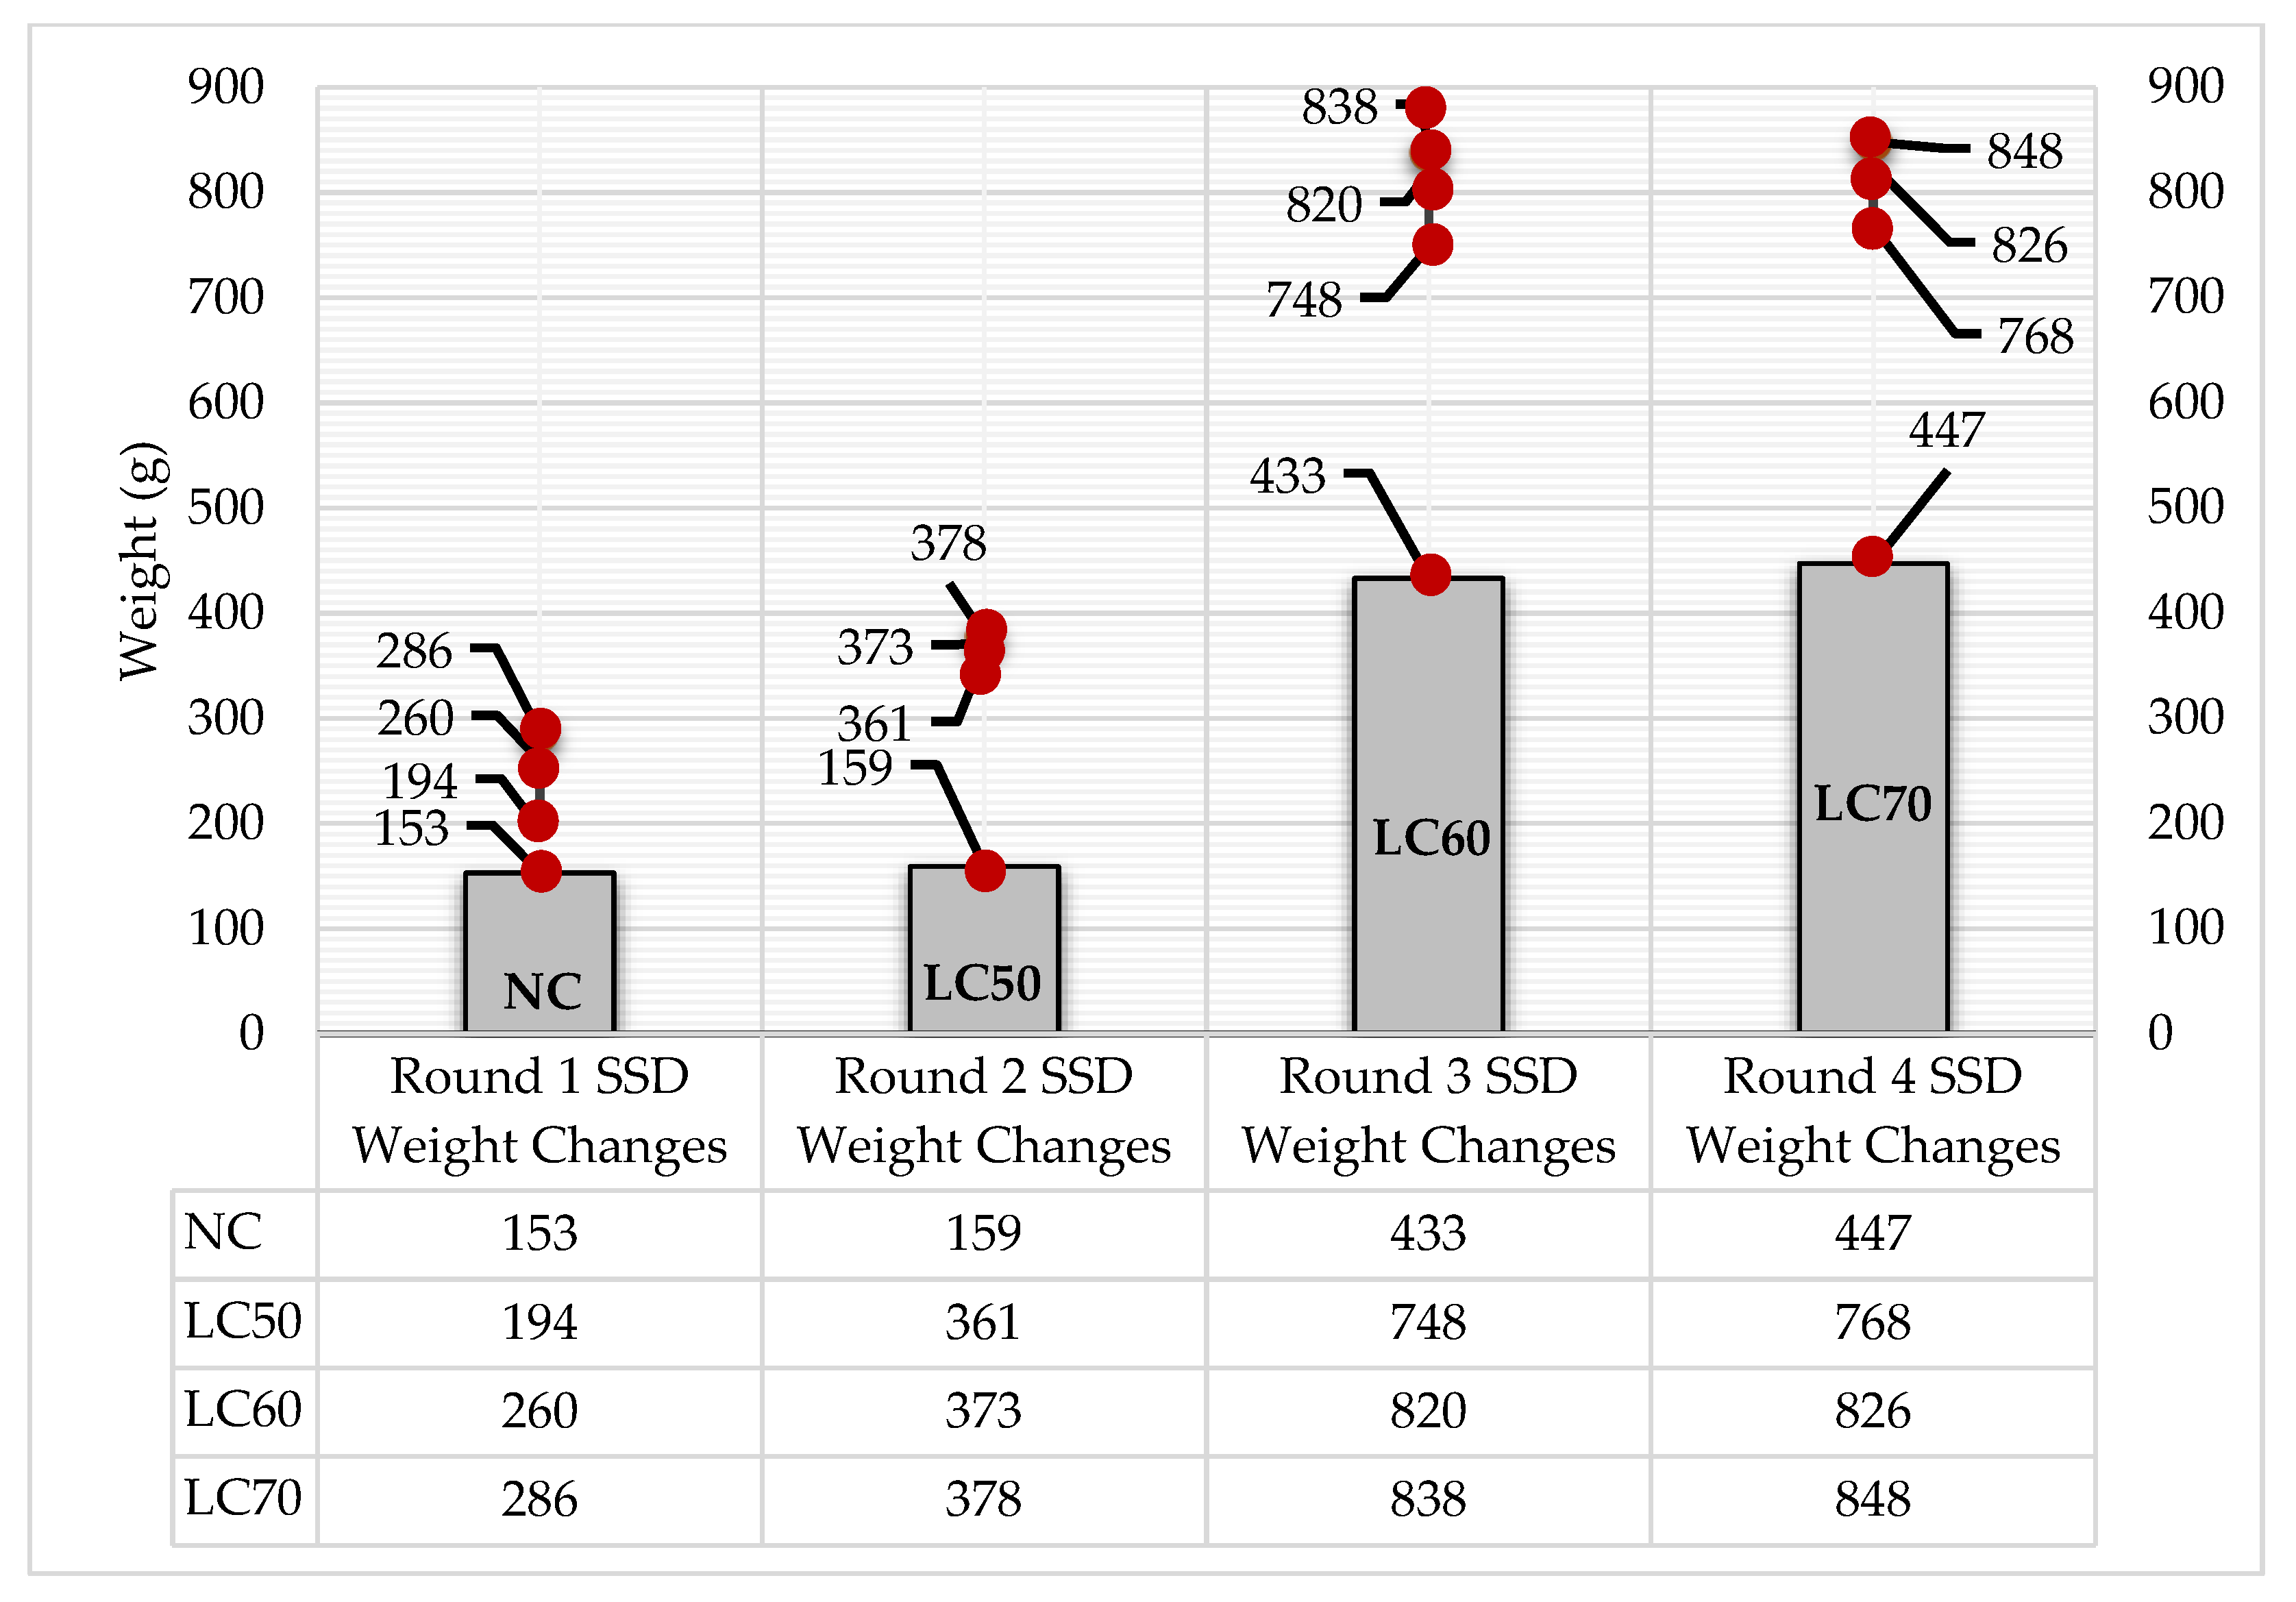
Furthermore, mass loss in NC concrete increased from 153 g at ambient conditions to 447 g after 72 h at 300 °C. For LC70, mass loss rose from 286 g to 846 g under the same thermal regime (Figure 15). These results clearly indicate that higher pumice content substantially reduces thermal durability.
In addition, the results underscore a cumulative pattern of water ingress and retention in porous matrices. The stepwise immersion method effectively simulates capillary-driven saturation, revealing that water uptake increases more aggressively with higher pumice content.
Discussion of Results with Literature
The results obtained from this experimental study show both convergence and divergence with existing literature on lightweight concretes incorporating pumice or other porous aggregates.
Mechanical Strength: The observed reduction in compressive strength from 25.64 MPa (NC) to 7.76 MPa (LC70) aligns with earlier findings by Topcu and Uygunoglu (2007), who reported significant strength loss in lightweight concretes due to the porous nature and weak mechanical interlocking of pumice aggregates [35]. Similarly, Kilic et al. (2003) demonstrated that increasing pumice content reduces the internal cohesion and interfacial bond strength, resulting in decreased compressive and flexural capacities [36]. The high correlation coefficients (r > 0.98) obtained in this study reinforce these trends, further quantifying the sensitivity of strength parameters to pumice substitution levels.
Flexural Behavior: The distinction between three-point and four-point flexural strength in this study also supports findings from Neville (2012), who emphasized that four-point bending tends to produce higher strength values due to distributed load application [37]. The flexural strength reduction of up to 61.5% in LC70 also reflects the conclusions of Demirboga and Gul (2003), who highlighted that porous lightweight aggregates compromise tensile resistance, particularly at the aggregate–paste interface [38].
Water Absorption and Moisture Transport: Water absorption values increasing up to 10.90% in LC70 are consistent with ASTM C642 [34] based studies such as those by Chandra and Berntsson (2003), which confirmed that volcanic aggregates such as pumice exhibit high open porosity, resulting in substantial moisture uptake [39]. The strong correlation (r = 0.983) between immersion depth and water absorption observed here complements the capillary rise patterns documented in TS EN 13057 [32] and ASTM C1585 [33], further validating the experimental method used.
High-Temperature Behavior: While most studies examine thermal resistance above 600 °C [40], the present study focuses on early-stage thermal degradation (100–300 °C), providing a novel approach to understanding the role of bound water loss and pore evaporation. Surface void formation observed in LC60 and LC70 after exposure to 300 °C is in agreement with the microcrack patterns reported by Hager (2013), who noted that lightweight concretes with high porosity are more prone to thermal spalling and dehydration-related deterioration [41].
Density and Structural Implications: The reduction in density from 2170 kg/m3 (NC) to 1832 kg/m3 (LC70) confirms the classification of these mixes as lightweight concrete per ACI 213R-14 [42] and EN 206-1 [43], and supports the suitability of pumice concrete for non-load-bearing applications as emphasized by Short and Kinniburgh (1963) and later reinforced in Mehta and Monteiro (2014) [44,45].
Novelty and Differentiation: Although previous works [35,39] have investigated pumice-based concretes, this study distinguishes itself by: quantifying the correlation coefficients between thermal exposure, weight loss, and pumice content, comparing flexural test types (three-point vs. four-point) systematically and statistically, and employing a multi-step capillary absorption protocol, which better simulates field-like moisture behavior.

5. Conclusions

This experimental study examined the mechanical and physical performance of lightweight concrete incorporating acidic pumice aggregate under elevated temperature conditions. The key findings are summarized below:
Mechanical Properties:
Increasing the proportion of acidic pumice aggregate significantly reduced both compressive and flexural strengths. Correlation coefficients of −0.994 (compressive strength) and −0.988 (three-point flexural strength) confirm a strong inverse relationship between pumice content and mechanical performance. The compressive strength of the LC70 mix was approximately 69.7% lower than that of the control mix (NC).
Water Absorption:
Specimens with higher pumice content exhibited substantially greater water absorption, attributed to the aggregate’s high intrinsic porosity. A correlation coefficient of 0.983 (at 15 cm immersion) highlights the direct relationship between pumice substitution and moisture uptake. The LC70 mix recorded a water absorption of 10.90%, compared to 1.21% for NC.
High-Temperature Behavior:
Exposure to temperatures of 100 °C, 200 °C, and 300 °C resulted in increased mass loss in concretes with higher pumice content due to the evaporation of free and chemically bound water. The porous structure of pumice facilitated deeper heat penetration, intensifying moisture loss. Surface voids ranging from 1 to 3 mm were observed in LC60 and LC70 mixes after thermal exposure, indicating early-stage microstructural degradation.
Practical Implications:
While acidic pumice aggregates reduce the unit weight of concrete and enhance its thermal characteristics, they lead to reductions in mechanical strength. These concretes are best suited for non-load-bearing applications—such as insulation layers, partition walls, screeds, and filler elements—where lightweight and thermal performance are prioritized over structural capacity.
Recommendations for Future Research:
To offset mechanical strength reductions, future studies should explore the use of high-temperature-resistant fibers and supplementary cementitious materials (SCMs), such as fly ash and slag. Microstructural analyses (e.g., SEM, XRD) are recommended to investigate pore structure evolution and mineralogical changes under thermal exposure. Evaluations at higher temperatures (600–800 °C), representative of fire conditions, would provide further insight into fire resistance. Comparative studies using inert lightweight aggregates would help isolate pumice-specific effects.
This study goes beyond previous research by integrating quantitative mass loss measurements with surface damage observations, offering a more complete understanding of early thermal degradation mechanisms in lightweight concrete. The results provide a solid experimental basis for optimizing the balance between weight, mechanical performance, and thermal behavior in pumice-based lightweight concrete systems. Table 13 shows a comparison of acidic pumice concrete results with the literature.
Author Contributions

Conceptualization, B.E. and C.E.E.; Methodology, B.E.; Formal Analysis, C.E.E.; Investigation, B.E.; Resources, C.E.E.; Data Curation, B.E.; Writing—Original Draft Preparation, B.E. and C.E.E.; Writing—Review & Editing, B.E. and C.E.E.; Visualization, B.E. All authors have read and agreed to the published version of the manuscript.

Funding

This research received no external funding.

Informed Consent Statement

All authors of the manuscript confirm ethical approval and consent to participate following the Journal’s policies.

Data Availability Statement

The data that support the findings of this study are available from the corresponding author upon reasonable request.

Conflicts of Interest

The authors declare no conflicts of interest.

References

  1. MTA. Pomza. Available online: http://www.mta.gov.tr/v3.0/bilgi-merkezi/pomza (accessed on 24 December 2024).
  2. Varol, O.O. An overview of pumice mining in Bitlis and Van provinces. J. Sci. Min. 2016, 55, 27–34. [Google Scholar]
  3. Ekinci, C.E. Maroon Book: The Architect and Engineer’s Construction Handbook, 13th ed.; Data Publications: Ankara, Türkiye, 2024. [Google Scholar]
  4. Yildirim, A.N. Investigation of Mechanical Properties of Lightweight Concrete Manufactured Using Pumice and Fly Ash in Aggressive Water Environments. Master’s Thesis, Selcuk University, Konya, Türkiye, 2007. [Google Scholar]
  5. Jianming, G.; Wei, S.; Keiji, M. Mechanical properties of steel fiber-reinforced, high-strength, lightweight concrete. Cem. Concr. Compos. 1997, 19, 307–313. [Google Scholar]
  6. Ahn, Y.B.; Jang, J.G.; Lee, H.K. Mechanical properties of lightweight concrete made with coal ashes after exposure to elevated temperatures. Cem. Concr. Compos. 2016, 72, 27–38. [Google Scholar] [CrossRef]
  7. Badogiannis, E.G.; Christidis, K.I.; Tzanetatos, G.E. Evaluation of the mechanical behavior of pumice lightweight concrete reinforced with steel and polypropylene fibers. Constr. Build. Mater. 2019, 196, 443–456. [Google Scholar] [CrossRef]
  8. Wongsa, W.; Sataa, V.; Nuaklonga, P.; Chindaprasirtab, P. Use of crushed clay brick and pumice aggregates in lightweight geopolymer concrete. Constr. Build. Mater. 2019, 188, 1025–1034. [Google Scholar] [CrossRef]
  9. Liu, K.; Yu, R.; Shui, Z.; Li, X.; Ling, X.; He, W.; Yi, S.; Wu, S.S. Effects of pumice-based porous material on hydration characteristics and persistent shrinkage of ultra-high performance concrete (UHPC). Materials 2018, 12, 11. [Google Scholar] [CrossRef] [PubMed]
  10. Top, S.; Vapur, H. Effect of basaltic pumice aggregate addition on the material properties of fly ash based lightweight geopolymer concrete. J. Mol. Struct. 2018, 1163, 10–17. [Google Scholar] [CrossRef]
  11. Turkel, S.; Kadiroglu, B. Investigation of mechanical properties of pumice aggregate carrier lightweight concrete. Pamukkale Univ. J. Eng. Sci. 2007, 13, 353–359. [Google Scholar]
  12. Yazıcıoglu, S.; Bozkurt, N. Investigation of mechanical properties of pumice and mineral additive carrier lightweight concrete. Gazi Univ. J. Fac. Eng. Archit. 2006, 21, 675–680. [Google Scholar]
  13. Nayir, S.; Bahadir, U.; Erdoğdu, S.; Toğan, V. Evaluation of structural lightweight concrete in terms of energy performance: A case study. Pamukkale Univ. J. Eng. Sci. 2021, 27, 696–702. [Google Scholar] [CrossRef]
  14. Sahan, T.; Yilmaz, S. Application of response surface method for optimization of Co(II) adsorption conditions with natural pumice mineral. Pamukkale Univ. J. Eng. Sci. 2017, 23, 887–892. Available online: https://pajes.pau.edu.tr/en/jvi.aspx?pdir=pajes&plng=eng&un=PAJES-87902 (accessed on 13 July 2025). [CrossRef]
  15. Rico, S.; Farshidpour, R.; Tehrani, F.M. State-of-the-art report on fiber-reinforced lightweight aggregate concrete masonry. Adv. Civ. Eng. 2017, 2017, 8078346. [Google Scholar] [CrossRef]
  16. Cicek, H.; Gonul, I.A. Comparison of lightweight and normal-weight aggregate concrete. Dicle Univ. J. Eng. 2022, 13, 619–626. [Google Scholar] [CrossRef]
  17. Bogas, J.A.; Gomes, M.G.; Gomes, A. Compressive strength evaluation of structural lightweight concrete by non-destructive ultrasonic pulse velocity method. Ultrasonics 2013, 53, 962–972. [Google Scholar] [CrossRef] [PubMed]
  18. Sim, J.I.; Yang, K.H.; Kim, H.Y.; Choi, B.J. Size and shape effects on compressive strength of lightweight concrete. Constr. Build. Mater. 2013, 38, 854–864. [Google Scholar] [CrossRef]
  19. Gonen, T. Investigation of Properties of Durability and Mechanical of Self Compacting Structural Lightweight Concrete. Ph.D. Thesis, Fırat Universitesi, Elazig, Türkiye, 2009. [Google Scholar]
  20. Kockal, N.U.; Camurlu, H.E. Lightweight pumice mortars with polypropylene fiber reinforcement. Arab. J. Sci. Eng. 2020, 45, 8087–8097. [Google Scholar] [CrossRef]
  21. Karahan, O.; Hossin, K.M.A.; Atis, C.D.; Ozbay, M.E.L. Ground granulated pumice-based cement mortars exposed to abrasion and fire. Arab. J. Sci. Eng. 2017, 42, 1321–1326. [Google Scholar] [CrossRef]
  22. TS EN 206-1; Concrete—Part 1: Specification, Performance, Production and Conformity. Turkish Standards Institute: Ankara, Türkiye, 2002.
  23. TS 2511; Mix Design for Structural Lightweight Aggregate Concrete. Turkish Standards Institute: Ankara, Türkiye, 2017.
  24. CEB-FIB; Manual of Lightweight Aggregate Concrete and Technology. CEB-FIB: Lausanne, Switzerland, 1977.
  25. DIN1045; German Reinforced Concrete Code. German Institute for Standardization: Berlin, Germany, 1990.
  26. ASTM C330; Standard Specification for Lightweight Aggregates for Structural Concrete. ASTM International: West Conshohocken, PA, USA, 2004.
  27. ACI213R-03; Guide for Structural Lightweight-Aggregate Concrete. American Concrete Institute: Farmington Hills, MI, USA, 2003.
  28. TS EN 197-1; Cement—Part 1: Composition, specifications and conformity criteria for common cements. Turkish Standards Institution (TSE): Ankara, Türkiye, 2011.
  29. TS EN 933-1; Determination of Geometric Properties of Aggregates—Part 1: Determination of Particle Size Distribution—Sieving Method. Turkish Standards Institution: Ankara, Türkiye, 2012.
  30. TS 802; Design Concrete Mixes. Turkish Standards Institute: Ankara, Türkiye, 2009.
  31. TS EN 12390-3; Testing Hardened Concrete—Part 3: Compressive Strength of Test Specimens. Turkish Standards Institute: Ankara, Türkiye, 2009.
  32. TS EN 13057; Concrete Structures—Products and Systems for the Protection and Repair of Concrete Structures—Test Methods—Determination of Resistance to Capillary Water Absorption. Turkish Standards Institute: Ankara, Türkiye, 2004.
  33. ASTM C1585-20; Standard Test Method for Measurement of Rate of Absorption of Water by Hydraulic-Cement Concretes. ASTM International: West Conshohocken, PA, USA, 2020.
  34. ASTM C642-21; Standard Test Method for Density, Absorption, and Voids in Hardened Concrete. ASTM International: West Conshohocken, PA, USA, 2021.
  35. Topcu, I.B.; Uygunoglu, T. Properties of autoclaved lightweight aggregate concrete. Build. Environ. 2007, 29, 143–148. [Google Scholar] [CrossRef]
  36. Kilic, A.; Atis, C.D.; Yasar, E.; Ozcan, F. High-strength lightweight concrete made with scoria aggregate containing mineral admixtures. Cem. Concr. Res. 2003, 33, 1595–1599. [Google Scholar] [CrossRef]
  37. Neville, A.M. Properties of Concrete, 5th ed.; Pearson Education Limited: London, UK, 2012. [Google Scholar]
  38. Demirboga, R.; Gul, R. The effects of expanded perlite aggregate, silica fume and fly ash on the thermal conductivity of lightweight concrete. Cem. Concr. Res. 2003, 33, 723–727. [Google Scholar] [CrossRef]
  39. Chandra, S.; Berntsson, L. Lightweight Aggregate Concrete: Science, Technology and Applications; Noyes Publications: Park Ridge, NJ, USA, 2003. [Google Scholar]
  40. Gencel, O.; Ozel, C.; Brostow, W.; Martínez-Barrera, G. Mechanical properties of self-compacting concrete reinforced with polypropylene fibres. Mater. Res. Innov. 2011, 15 (Suppl. S2), s216–s225. [Google Scholar] [CrossRef]
  41. Hager, I. Behaviour of cement concrete at high temperature. Bull. Pol. Acad. Sci. Tech. Sci. 2013, 61, 145–154. [Google Scholar] [CrossRef]
  42. ACI 213R-14; Guide for Structural Lightweight Aggregate Concrete. American Concrete Institute: Farmington Hills, MI, USA, 2014.
  43. EN 206-1; Concrete—Part 1: Specification, Performance, Production and Conformity. European Committee for Standardization: Brussels, Belgium, 2000.
  44. Short, A.; Kinniburgh, W. Lightweight Concrete; Cleaver-Hume Press: London, UK, 1963. [Google Scholar]
  45. Mehta, P.K.; Monteiro, P.J.M. Concrete: Microstructure, Properties, and Materials, 4th ed.; McGraw-Hill Education: New York, NY, USA, 2014. [Google Scholar]
  46. Karaca, E.; Öztürk, F.; Çelik, T. Water absorption and thermal resistance of lightweight concrete with natural pumice aggregates. Buildings 2022, 12, 589. [Google Scholar] [CrossRef]
Figure 1. The chemical properties of pumice and cement used.
Buildings 15 02505 g001
Figure 2. Mixed aggregate granulometry curves for Dmax 16 mm, according to TS EN 933-1 (Preferred curve: B) [29].
Buildings 15 02505 g002
Figure 3. Concrete mix ratios and aggregate proportions (ad).
Buildings 15 02505 g003aBuildings 15 02505 g003b
Figure 4. The setup of flexural strength measurement experiments.
Buildings 15 02505 g004
Figure 5. The setup of compressive strength measurement experiments.
Buildings 15 02505 g005
Figure 6. The stages of the water absorption experiments.
Buildings 15 02505 g006
Figure 7. Flexural strength test results (MPa).
Buildings 15 02505 g007
Figure 8. Compressive strength test results (MPa).
Buildings 15 02505 g008
Figure 9. Water absorption behavior of the concrete specimens.
Buildings 15 02505 g009
Figure 10. Weight changes in concrete specimens across different exposure periods.
Buildings 15 02505 g010
Figure 11. The behaviors of the concrete specimens following 100 °C, 200 °C, and 300 °C high-temperature treatments.
Buildings 15 02505 g011
Figure 12. Concrete specimen weight reduction behaviors following 100 °C, 200 °C, and 300 °C high-temperature treatment.
Buildings 15 02505 g012
Figure 13. Changes in the three-point and four-point flexural strength and compressive strength values of NC, LC50, LC60, and LC70 concretes.
Buildings 15 02505 g013
Figure 14. Weight changes of concrete specimens during natural air drying and water absorption experiments.
Buildings 15 02505 g014
Figure 15. Weight changes of NC, LC50, LC60, and LC70 concretes due to high temperature.
Buildings 15 02505 g015
Table 1. Classification of lightweight concretes [22].
Light Concrete TypeDry Unit Volume Weight (kg/m3)Compressive Strength (MPa)Thermal Conductivity (W/m°C)
Very Light Insulation Concrete<800<2<0.16
Very Light Concrete<800>2<0.16
Light Bearing Insulation Concrete800–1400>10<0.80
Light Bearing Concrete>1200>20-
High Strength Lightweight Concrete>1200>30-
Table 2. Classification of lightweight concretes according to compressive strength [22].
Compressive Strength ClassMinimum Characteristic Cylinder Strength (MPa)Minimum Characteristic Cube Strength (MPa)
LC 8/989
LC 12/131213
LC 16/181618
LC 20/222022
LC 25/282528
LC 30/333033
LC 35/383538
LC 40/444044
LC 45/504550
LC 50/555055
LC 55/605560
LC 60/666066
LC 70/777077
LC 80/888088
Table 3. Classification of lightweight concretes according to unit volume weight [22].
ClassD 1.0D 1.2D 1.4D 1.6D 1.8D 2.0
Density Range (kg/m3)800–10001000–12001200–14001400–16001600–18001800–2000
Table 4. Specific gravity and compressive strengths of carrier lightweight concretes according to various standards.
StandardsSpecific Mass (kg/m3)Standard Cylinder Characteristic Compressive Strength (MPa)
CEB-FIB [24]<1900≥16
DIN1045 [25]≤2000≥16
ASTM C330 [26]≤1840≥17
ACI 213R-03 [27]<1840≥17
TS 2511 [23]<1900≥17
Table 5. Physical properties of crushed stone and pumice aggregates.
Aggregate and Pumice Grain ClassUnit Weight
(Compacted) (kg/m3)
Specific Weight
(SSD) (g/cm3)
Water Absorption
(%)
Current Humidity
(%)
Aggregate-1: 0–5.0 mm17602.242.100.70
Aggregate-2: 5.0–15.0 mm17252.351.500.45
Pumice: 0–15 mm12501.654.25---
Table 6. Mixing ratios of the concretes used in the experiments.
ConcretesAggregatePumice (0–16 mm)
Aggregate-1 (0–5 mm)Aggregate-2 (5–16 mm)
NC-Control5050-
LC50252550
LC60202060
LC70151570
Table 7. ANOVA results of three-point and four-point flexural strength and compressive strength values of NC, LC50, LC60, and LC70 concretes.
Source Degrees of Freedom (f)Sum of SquaresMean SquareFp
Concretes3185.061.72.81 0.000
Error8175.521.9
S = 4.684R-Sq = 51.32%R-Sq(adj) = 33.06%
Table 8. Correlation of three-point and four-point bending and compressive strength values of NC, LC50, LC60, and LC70 concretes.
ExplanationPearson Correlation
ConcretesCompressive strength values−0.994
The three-point flexural strength values−0.988
The four-point flexural strength values−0.952
Table 9. ANOVA results of water absorption properties and weight changes of NC, LC50, LC60, and LC70 concretes.
SourceDegrees of Freedom
(f)
Sum of SquaresMean SquareFp
Concretes342.21714.0723.300.003
Error160.45420.0284
S = 2.065R-Sq = 29.21%R-Sq(adj) = 20.36%
Table 10. Correlation of water absorption properties and weight changes of NC, LC50, LC60, and LC70 concretes.
ExplanationPearson Correlation
Concretes 28 Days−0.997
168 h−0.953
72 h (5 cm)0.951
72 h (10 cm)0.963
72 h (15 cm)0.983
Table 11. ANOVA results of high temperature and weight changes of NC, LC50, LC60, and LC70 concretes.
Source Degrees of Freedom (f) Sum of SquaresMean SquareFp
Concretes317.2615.75412.66 0.000
Error167.2710.454
S = 0.6741R-Sq = 70.36%R-Sq(adj) = 64.80%
Table 12. Correlation of high temperature and weight changes of NC, LC50, LC60, and LC70 concretes.
ExplanationPearson Correlation
Concretes28 Days (20  ±  2 °C)−0.911
168 h (20  ±  2 °C)−0.920
72 h (5 cm) (100 °C)−0.913
72 h (10 cm) (200 °C)−0.915
72 h (15 cm) (300 °C)−0.987
Table 13. Comparison of acidic pumice concrete results with literature [3,46].
ParameterObserved ResultsLiterature FindingsRemarks
DensityDecreased from 2170 to 1832 kg/m3 with 70% replacementSimilar reduction in lightweight concretes with pumiceConsistent with lightweight concrete behavior
Compressive StrengthDecreased significantly with increased pumice, e.g., 25.64 MPa (NC) to 7.76 MPa (LC70)Reported decreases due to porous pumice structureStrength reduction attributed to pumice porosity and cement content
Flexural Strength
(3-pt, 4-pt)
Reduced by 54–62% (three-point) and 15–35% (four-point) with pumice substitutionDecrease in flexural strength with lightweight aggregates documentedfour-point tests yield higher strength than three-point tests
Water AbsorptionIncreased with pumice content; highest in LC70Similar trend of increased absorption due to porosityRelated to pumice’s porous nature
Weight Loss at High Temperature (General Trend)Increased weight loss with pumice substitution at 100–300 °CConsistent with evaporation and pore structure effects
Application RecommendationsSuitable for lightweight insulation, wall and floor screeds, and filler materialLightweight concretes are recommended for insulation and non-structural usesMatches with literature on practical applications
Weight Loss at High Temperature (Quantitative Trend) Progressive increase from NC to LC70Generally reported but seldom quantified in stagesSurface voids and correlation with pumice ratio provide additional insight
Disclaimer/Publisher’s Note: The statements, opinions and data contained in all publications are solely those of the individual author(s) and contributor(s) and not of MDPI and/or the editor(s). MDPI and/or the editor(s) disclaim responsibility for any injury to people or property resulting from any ideas, methods, instructions or products referred to in the content.