Article

Seismic Performance and Moment–Rotation Relationship Modeling of Novel Prefabricated Frame Joints

1
College of Civil Science and Engineering, Yangzhou University, Yangzhou 225127, China
2
Jiangsu Yangjian Group Co., Ltd., Yangzhou 225002, China
3
China Construction Civil Engineering Co., Ltd., Beijing 100071, China
*
Author to whom correspondence should be addressed.
Buildings 2025, 15(14), 2504; https://doi.org/10.3390/buildings15142504
Submission received: 24 June 2025 / Revised: 11 July 2025 / Accepted: 15 July 2025 / Published: 16 July 2025
(This article belongs to the Special Issue Research on Industrialization and Intelligence in Building Structures)

Abstract

This study investigates two novel prefabricated frame joints: prestressed steel sleeve-connected prefabricated reinforced concrete joints (PSFRC) and non-prestressed steel sleeve-connected prefabricated reinforced concrete joints (SSFRC). A total of three PSFRC specimens, four SSFRC specimens, and one cast-in-place joint were designed and fabricated. Seismic performance tests were conducted using different end-plate thicknesses, grout strengths, stiffener configurations, and prestressing tendon configurations. The experimental results showed that all specimens experienced beam end failures, and three failure modes occurred: (1) failure of the end plate of the beam sleeve, (2) failure of the variable cross-section of the prefabricated beam, and (3) failure of prefabricated beams at the connection with the steel sleeves. The load-bearing capacity and initial stiffness of the structure are increased by 35.41% and 32.64%, respectively, by increasing the thickness of the end plate. Specimens utilizing C80 grout exhibited a 39.05% higher load capacity than those with lower-grade materials. Adding stiffening ribs improved the initial stiffness substantially. Specimen XF2 had 219.08% higher initial stiffness than XF1, confirming the efficacy of stiffeners in enhancing joint rigidity. The configuration of the prestressed tendons significantly influenced the load-bearing capacity. Specimen YL2 with symmetrical double tendon bundles demonstrated a 27.27% higher ultimate load capacity than specimen YL1 with single centrally placed tendon bundles. An analytical model to calculate the moment–rotation relationship was established following the evaluation criteria specified in Eurocode 3. The results demonstrated a good agreement, providing empirical references for practical engineering applications.

1. Introduction

Global economic growth has accelerated construction sector expansion, driving the widespread deployment of timber, steel, and reinforced concrete (RC) structures. Timber offers sustainable material solutions [1], steel provides superior load-bearing capacity [2], while RC enables flexible configurations meeting diverse functional demands [3]. Typical applications include frame systems for low-rise buildings and shear wall/tube-in-tube systems for high-rises [4,5]. However, conventional RC’s labor-intensive cast-in situ practices generate substantial dust emissions and construction waste [6,7], contradicting green development principles. This necessitates increasing reliance on prefabricated building technology to resolve environmental challenges. Advances in intelligent manufacturing and construction technologies have accelerated prefabricated structure development [8,9,10,11]. Global prefabrication factories emerged in the early 21st century, including Lafarge Holcim (Europe, modular construction), Katerra (US, digitalized production workflows), and China’s Broad Group (high-rise concrete modular systems). Nevertheless, as a critical construction industry transformation direction, prefabricated buildings face application barriers from high component costs and insufficient design standardization. Global scholars have extensively investigated these constraints, prioritizing beam–column joint design research [12].
The design of beam–column joints in prefabricated structures can be classified into wet and dry connections based on on-site construction procedures [13,14]. Wet connections typically require cast-in-place concrete operations, with common types including grouted sleeves and monolithic precast connections [15]. Dry connections require minimal on-site grouting for assembly and include post-tensioned and bolted end-plate connections. Typical configurations of wet and dry connections are illustrated in Figure 1. Dry connections require less on-site concrete than wet connections, streamlining construction processes and shortening timelines. However, dry connections exhibit disadvantages, such as lower structural integrity and inadequate seismic performance. Global research has focused extensively on addressing these limitations.
The 1988 Precast Seismic Structural System Research Program (PRESSS), a joint U.S.–Japan research initiative, proposed post-tensioned connections for prefabricated beam-column joints [16,17,18]. This method employs prestressing to connect precast components. Subsequent investigations by researchers, including Liu [19], Chong [20], and Cai [21], on post-tensioned precast frame joints revealed that these connections exhibited superior deformation recovery and load-bearing capacities than cast-in-place concrete frames. However, experimental results demonstrated significant pinching effects in hysteretic loops and inferior energy dissipation performance. In 1976, Prof. Reinhardt proposed the demountable assembly design [22]. In 2016, Aninthaneni [23] and Wang [24] introduced bolted end-plate connections for precast beam–column joints to achieve demountable assembly. However, these connections exhibit lower rotational stiffness, requiring stringent preload control during construction. Subsequent research has focused on integrating energy-dissipating elements into connection zones to enhance the energy dissipation capacity of dry connections. Morgen [25] developed an innovative beam-end configuration that incorporated friction dampers to enhance structural performance.
In summary, global research innovations on dry connections have primarily focused on two approaches: (1) adopting post-tensioned connections to provide self-centering capabilities and (2) incorporating energy-dissipating components in beam–column joint zones to improve energy dissipation capacity. Regarding post-tensioned joints, such connections inherently exhibit limitations in structural integrity and energy dissipation capacity. These shortcomings similarly represent inherent deficiencies of dry connections when compared to cast-in-place monolithic joints. Concerning energy-dissipating joints, the associated detailing requirements for energy-dissipation components often introduce significant complexity. Such complexity could potentially compromise the construction efficiency advantage inherent to dry connections.
Establishing a rational moment–rotation model is critical in dry connection applications. Current models include linear, polynomial, B-spline, exponential, and power-law formulations [26,27]. The linear model is the simplest and most widely used, requiring only the determination of the initial rotational stiffness and peak moment capacity to define the moment–rotation curve. Many researchers have established systematic theoretical frameworks and computational methodologies to evaluate the initial rotational stiffness in cast-in-place joints, steel connections, and bolted end-plate beam–column joints [28]. The component method, part of Eurocode 3 [29], is the predominant analytical approach. However, applying its series or parallel assembly principles to novel dry connections requires further investigation.
Based on our team’s research experience [30,31,32], we propose two novel prefabricated frame joints: prestressed steel sleeve-connected prefabricated reinforcement concrete joints (PSFRC) and non-prestressed steel sleeve-connected prefabricated reinforcement concrete joints (SSFRC). A key advantage of this structure is the low complexity of manufacturing prefabricated components. In PSFRC and SSFRC frame structures, the reinforcement of beams and columns is discontinuous, and the entire structure can be disassembled into precast beams, precast upper columns, precast lower columns, and steel sleeves. This facilitates post-earthquake structural repair, allowing the localized replacement of damaged components. Figure 2 and Figure 3 illustrate the details of the joint. They utilize steel sleeves and prestressed tendons for assembly.
Our previous results provide a preliminary understanding of the shear mechanism in the core zone of the new joints and the new frame’s seismic performance. However, experimental research and theoretical analysis on the seismic performance of beam ends are relatively scarce. The theoretical research on the bearing capacity of the beam end of the node under bending failure and the theoretical research on the rotational stiffness of the joints will contribute to the better application of this type of node in engineering practice.
This paper further simplifies the joints and integrates the connection area into the lower column section, making the installation of the upper column more convenient. This study systematically examines the seismic performance of the PSFRC and SSFRC joints using experiments and theoretical analyses. We utilize the European steel structure codes and concrete design specifications, evaluate the initial rotational stiffness and flexural load-bearing capacity of both joint types, and establish moment–rotation relationship models.

2. Experimental Programs

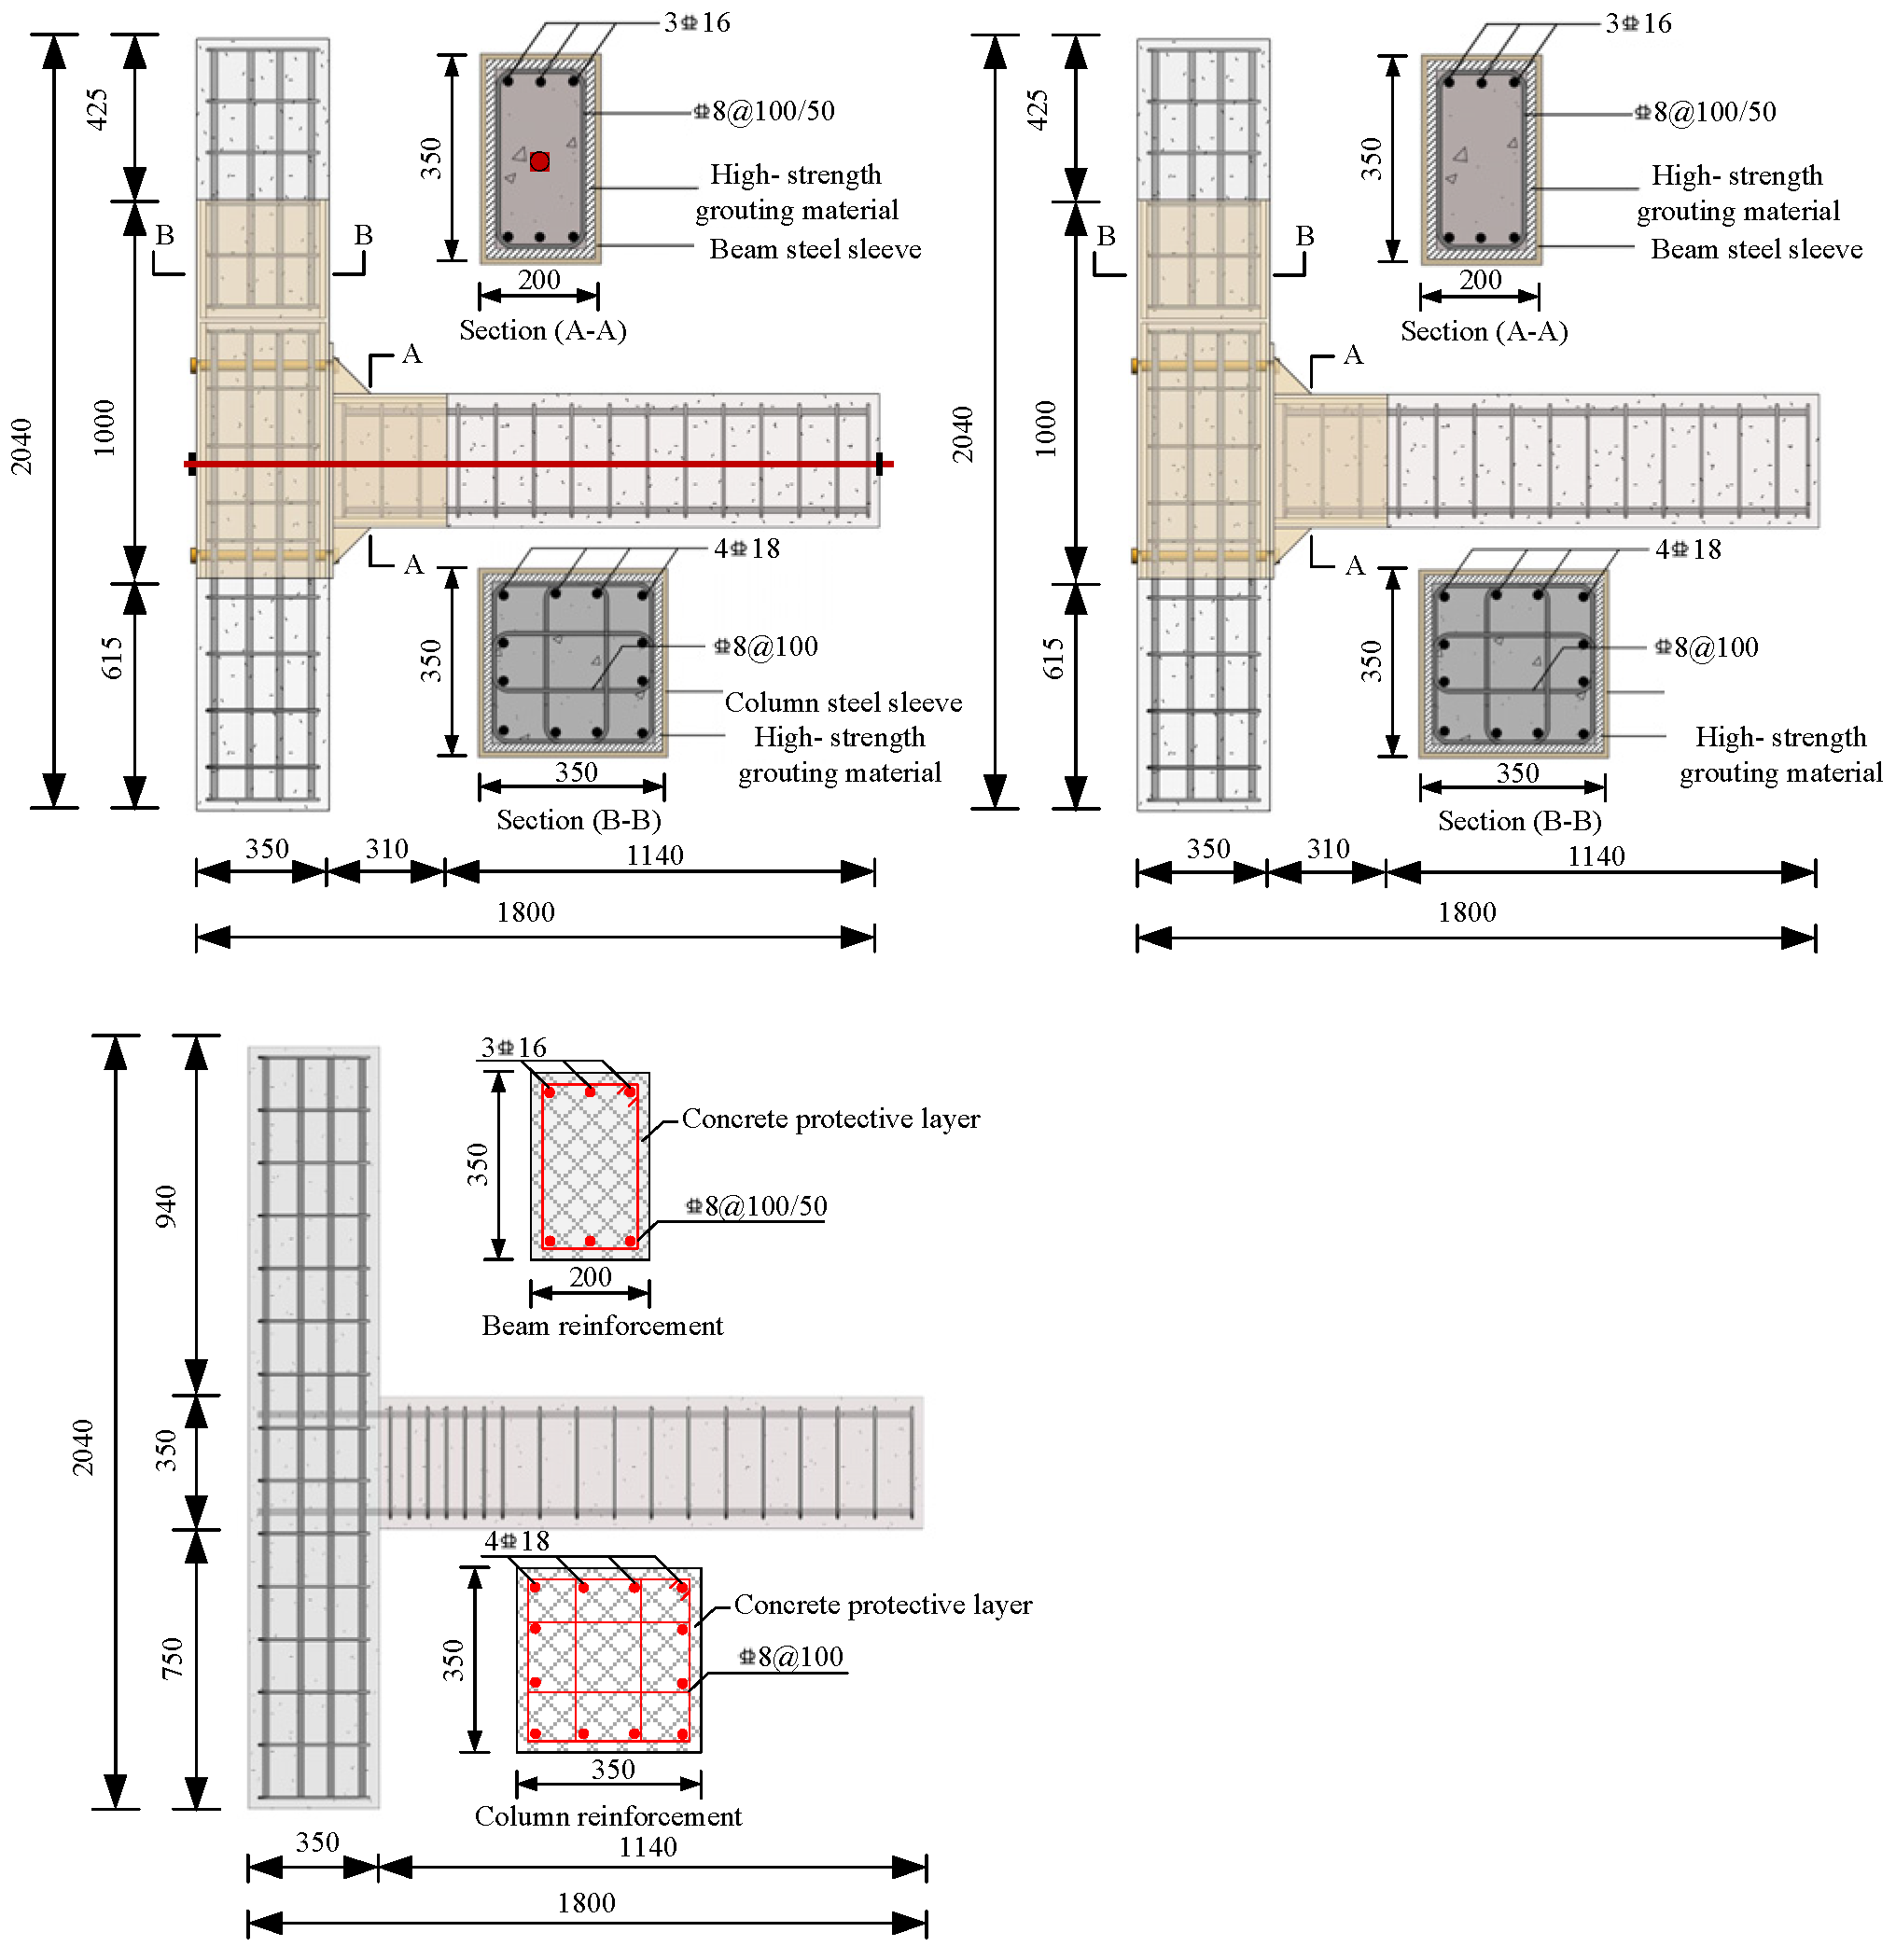
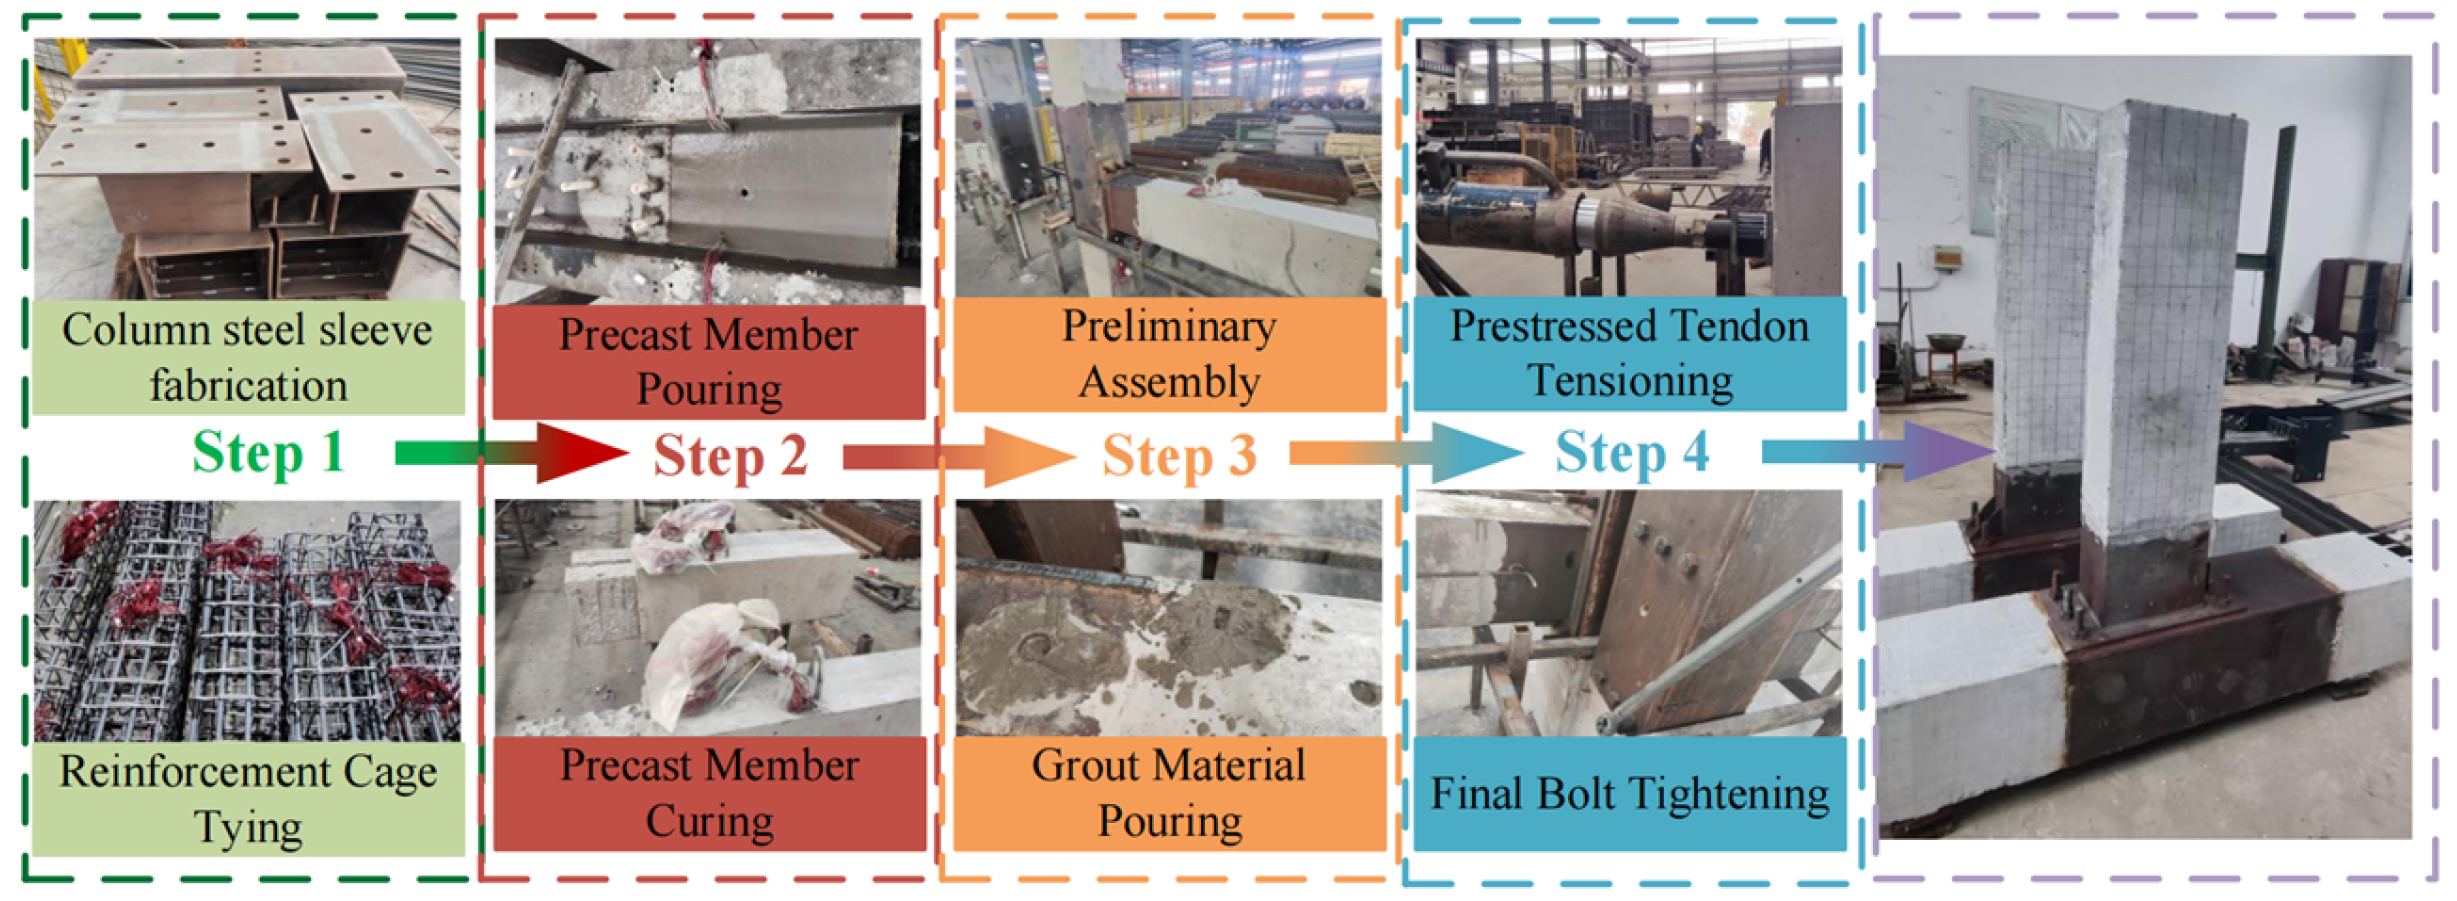
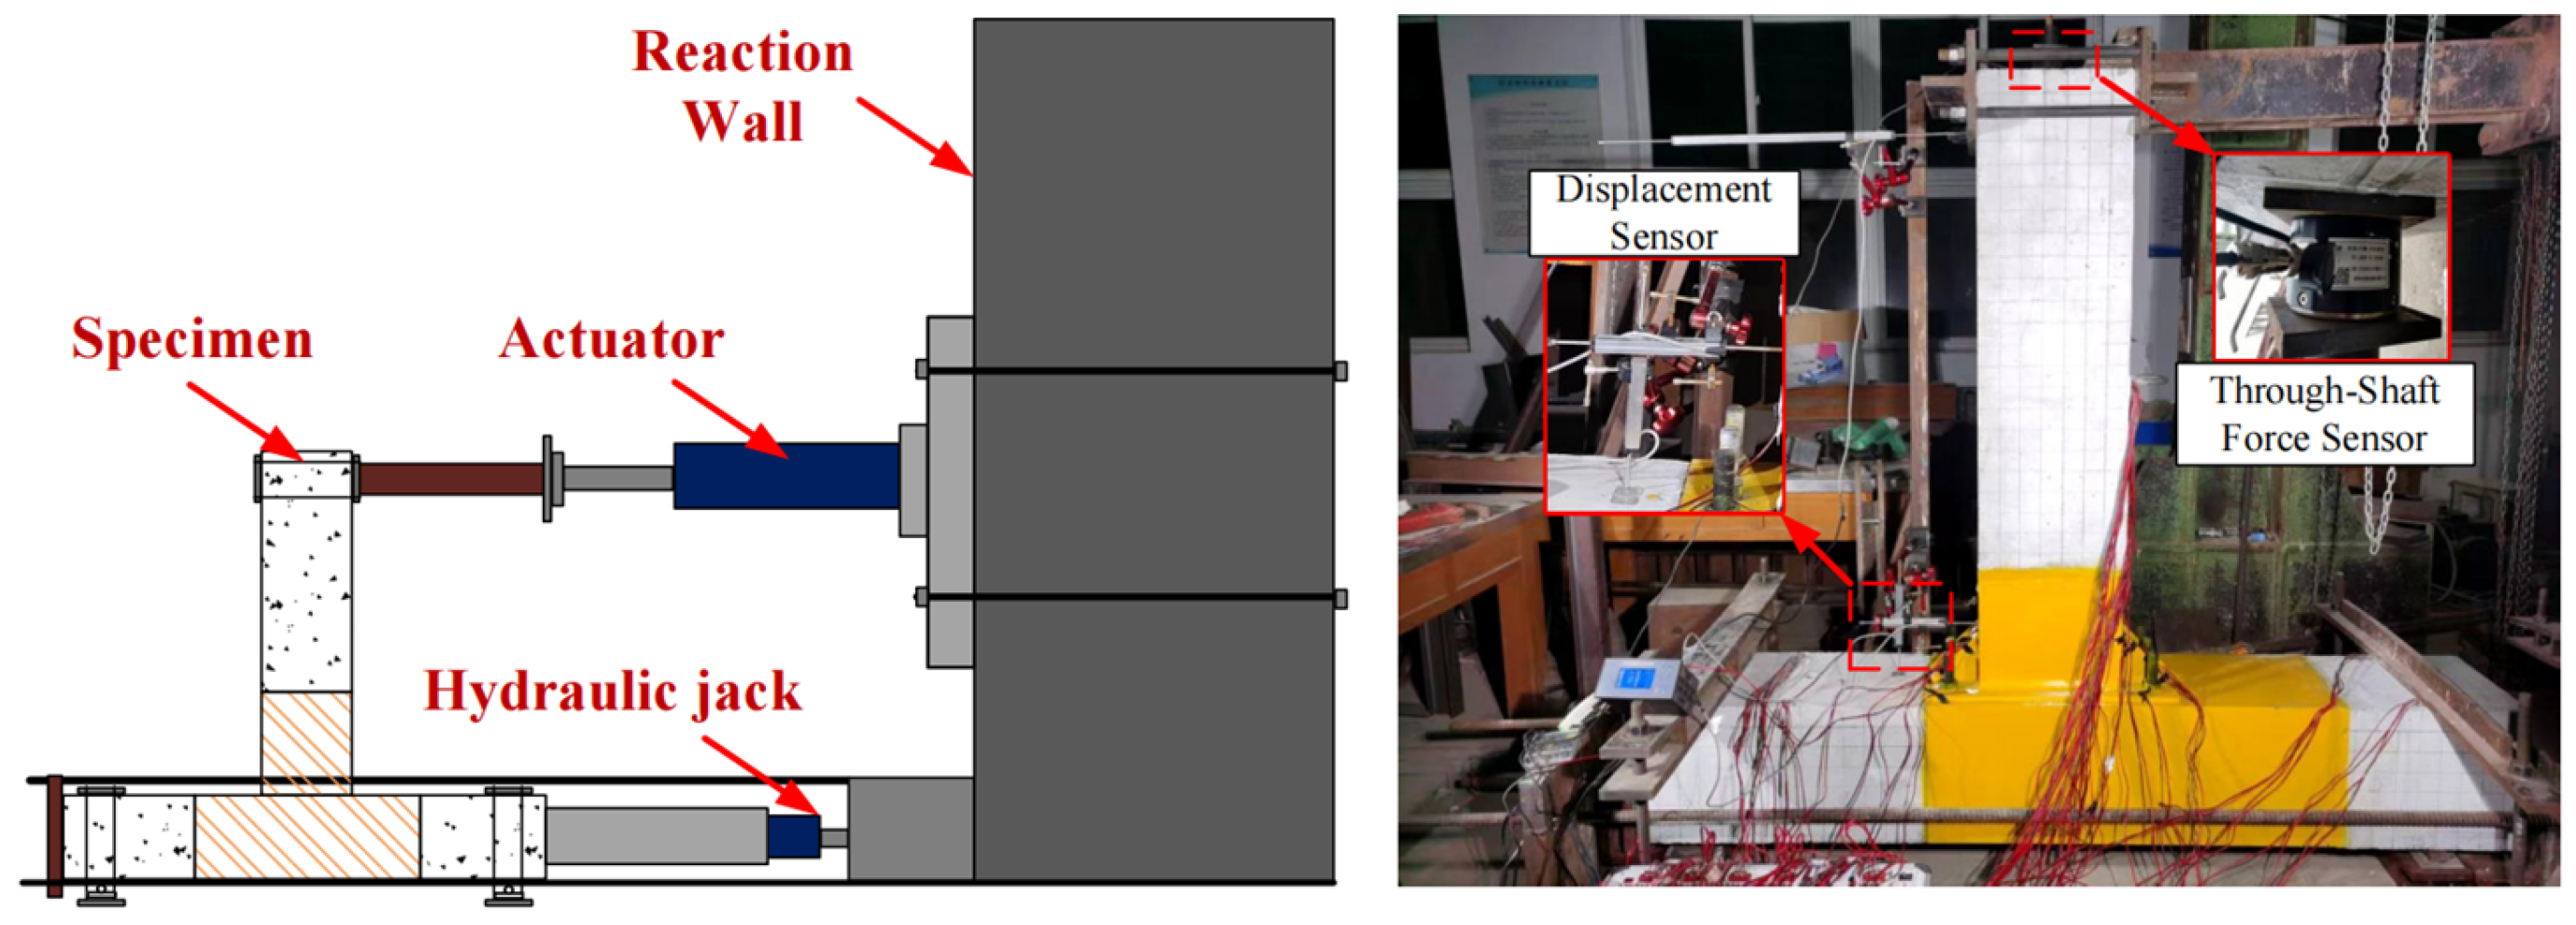
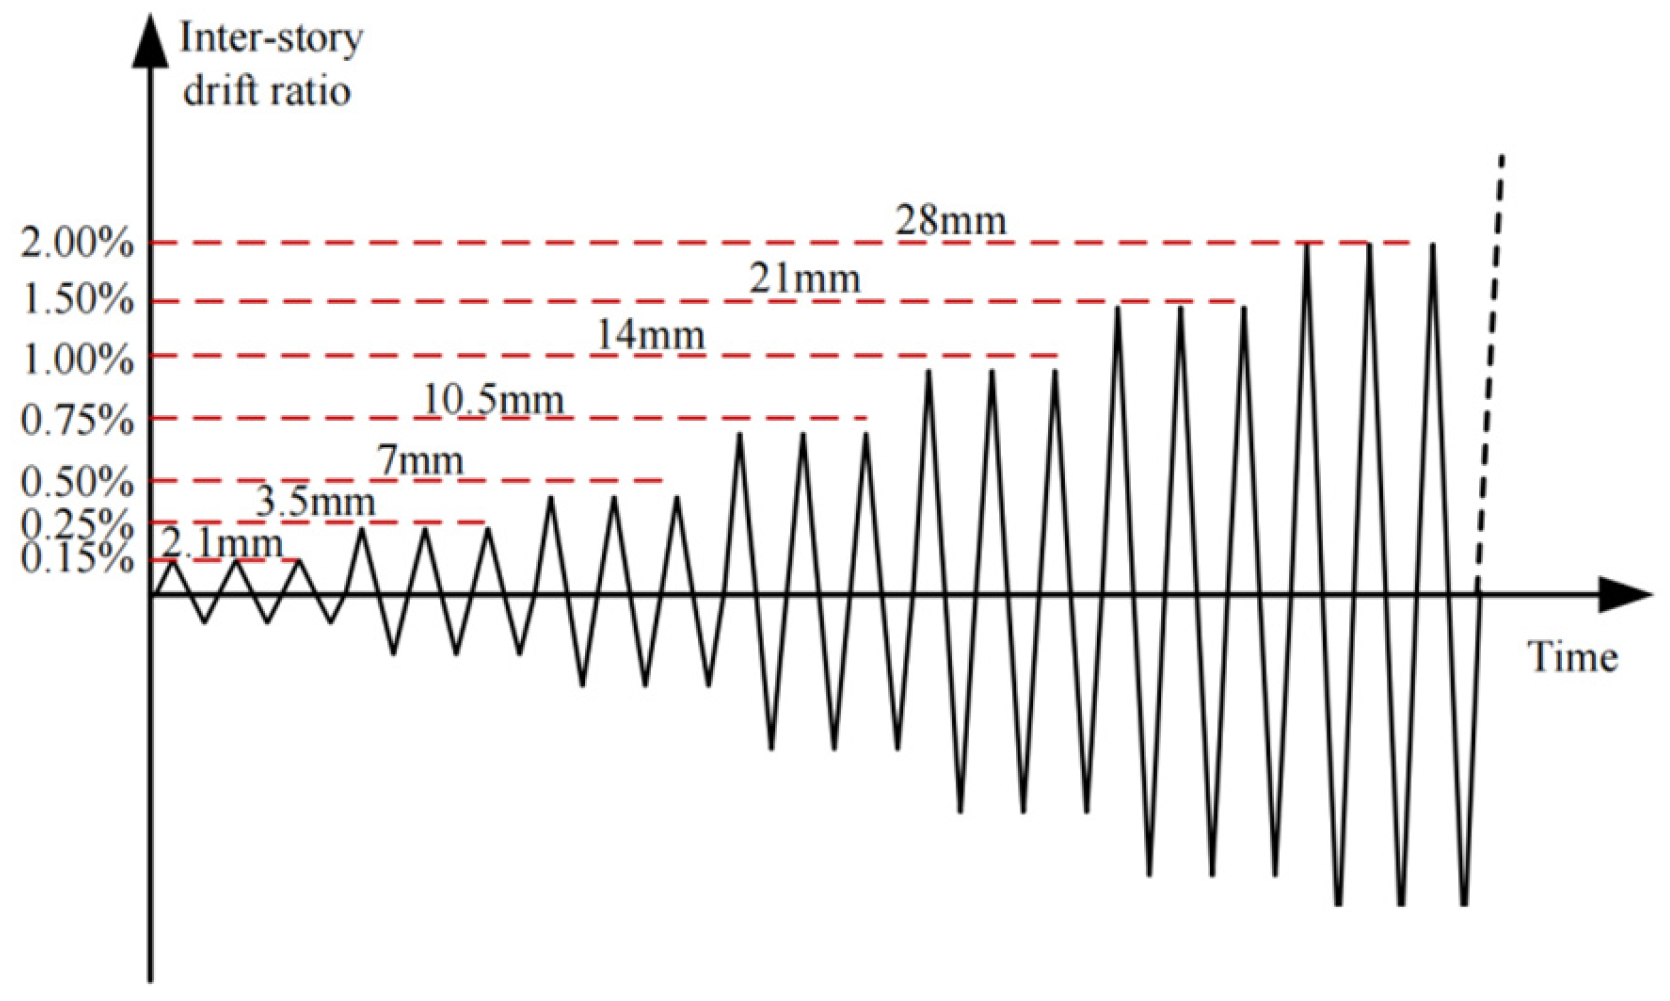
Specimen Design and Testing Program

Eight specimens were tested seismically: four SSFRC, three PSFRC, and one cast-in-place RC joint. Materials included C40 concrete, HRB400 bars (ϕs 15.2 strands), C60 and C80 grout, and Q355 steel sleeves. To ensure grouting compaction, material was injected through pre-opened cover plate holes until emergence at openings. Key design parameters appear in Figure 4; material properties are tabulated in Table 1, Table 2, Table 3 and Table 4. Concrete testing followed GB/T 50152-2012 [33], grout per GB/T 50448-2008 [34] and GB/T 50081-2019 [35], and steel per GB/T 228.1-2021 [36]. Specimen fabrication and the loading device (applying 360 kN of vertical column pressure via hydraulic jack) are shown in Figure 5 and Figure 6.
JGJ/T 101-2015 [37] stipulates that an appropriate loading system must be used in low-cycle reciprocating load tests, depending on the test’s purpose and conditions, i.e., force control, displacement control, or mixed force–displacement loading. We used displacement control for specimen loading. When evaluating the hysteretic performance curves and progressive damage evolution characteristics of specimens, the displacement-controlled cyclic loading method is the most commonly used. It has the following advantages: (1) It compels specimens to undergo pre-set deformation levels, ensuring stable loading until failure. (2) Directly comparing changes in load (strength), stiffness, and energy dissipation at identical displacement levels (deformation levels), clearly quantifying the damage evolution process. (3) Accurately corresponding damage states to specific displacement levels facilitates revealing the deformation–damage relationship [38]. The loading regime is illustrated in Figure 7.

3. Experimental Results of Tests

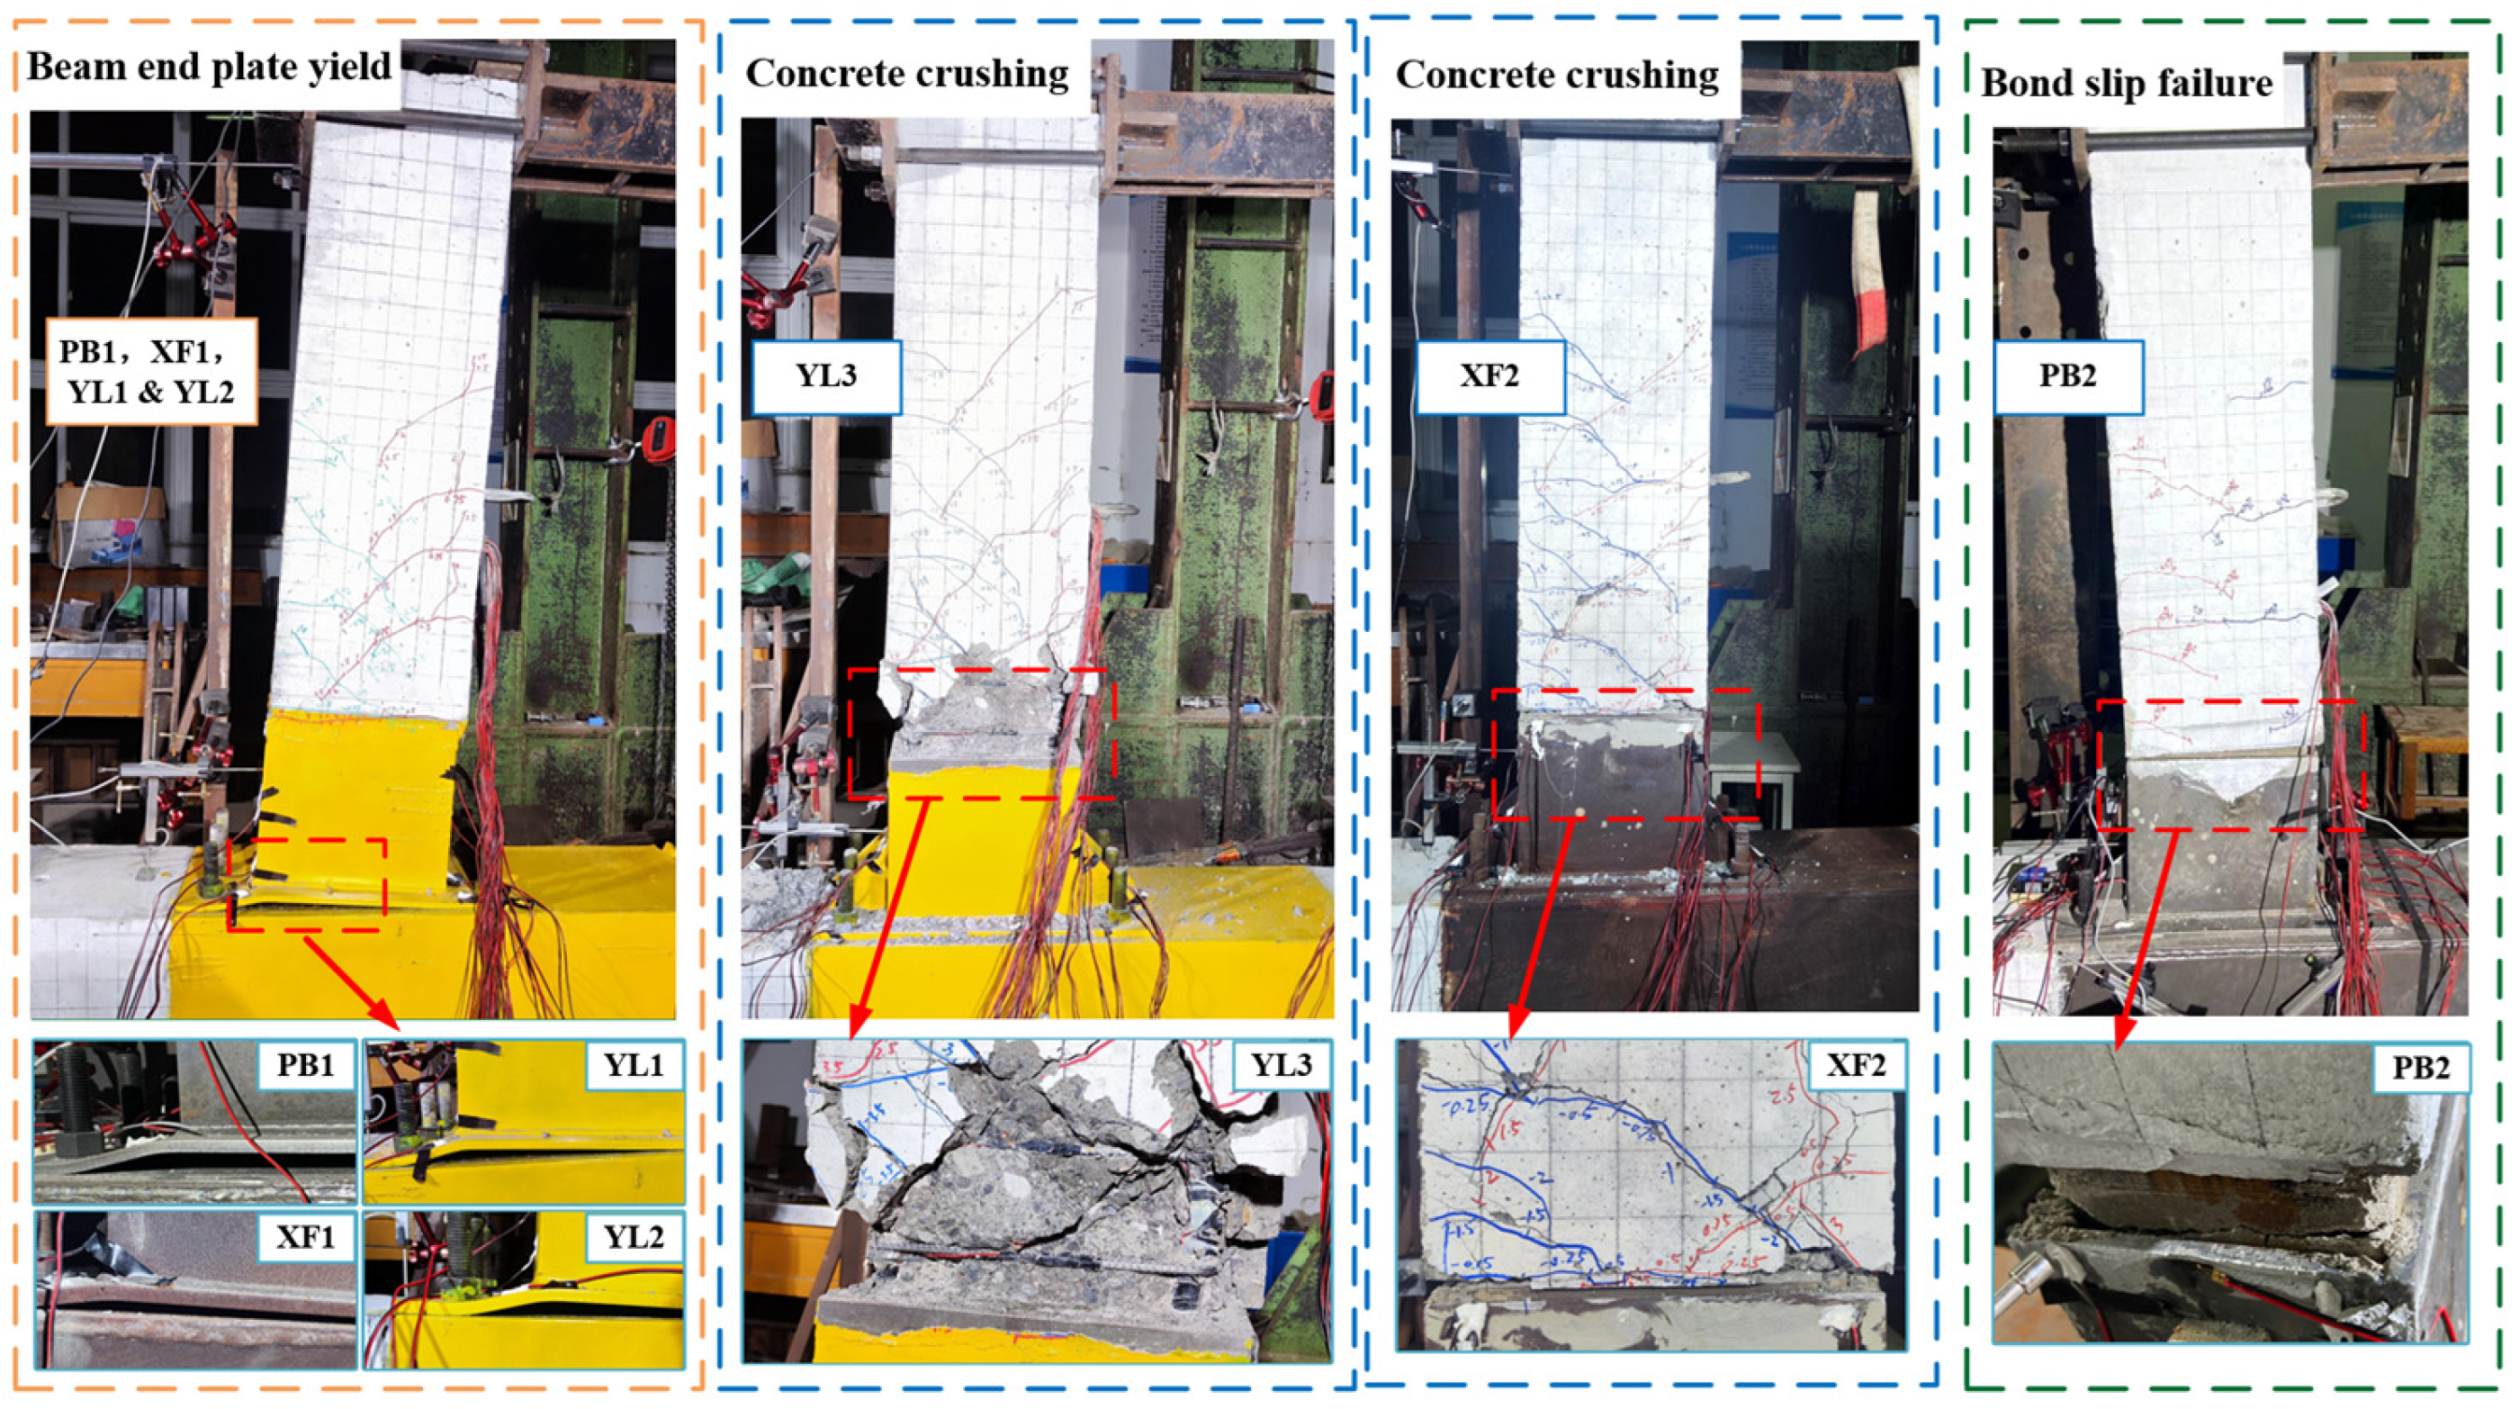
3.1. Damage Phenomena and Analysis

Three failure modes were observed in the test: (1) member failure due to excessive deformation of the beam’s end plate, (2) member failure due to damage to the bonding area between the steel jacket and the precast concrete beam, and (3) member failure due to concrete crushing. Specimens PB1, XF1, YL1, and YL2 exhibited the first failure type, specimen PB2 showed the second failure type, and specimens XJ, XF2, and YL3 exhibited the third failure type. The failure conditions are illustrated in Figure 8.
The three failure modes exhibited different progression characteristics. A systematic classification is provided in subsequent sections.
Three behavioral phases occurred in failure mode I: (1) During initial loading (0–14.4 mm), specimens remained elastic with mostly recoverable deformation, while microcracks (<0.1 mm) appeared in precast beams, concentrated at steel sleeve–concrete interfaces. (2) In the intermediate loading phase (21.6–43.2 mm), specimens transitioned to the elastoplastic stage, revealing a marked deformation difference in steel sleeve end plates between prestressed specimens (YL1/YL2, lower deformation) and non-prestressed ones (PB1/XF1). (3) At final loading (43.2 mm to failure), specimens entered plastic development with a rapid increase in end-plate deformation, though precast beam cracks did not propagate, indicating concentrated deformation at sleeve ends, ultimately leading all specimens to fail due to the yielding of steel sleeve end plates.
The most distinctive characteristic of failure mode II was the rapid post-peak load capacity degradation. After crack initiation at the precast beam–steel sleeve interface, the precast beam exhibited progressive slippage of the steel sleeve. This failure type was attributed to insufficient grout strength and an inadequate transfer of flexural and shear forces from the precast beam to the steel sleeve. During failure, only minor cracking was observed in the precast beam.
The relocation of plastic hinges occurred in failure mode III. During the initial loading stage, beam-end deformation remained relatively minor. The first crack developed at the interface between the precast beam and steel sleeve. As displacement loading continued, cracks propagated progressively in the precast beam. At ultimate failure, the concrete on the compression side reached its ultimate compressive strain, whereas the reinforcement on the tension side attained its ultimate tensile stress.

3.2. Parametric Analysis of the Specimens’ Seismic Performance

The hysteresis curves of the joints are shown in Figure 9. We extracted the extreme points at different inter-story drift ratios to create the skeleton curve (Figure 10) and determine the specimen’s load capacity under different displacements, the characteristic load values, and the performance indicators (Table 5).
Table 5 presents the specimens’ load-bearing capacities. The following results were observed:
(1)
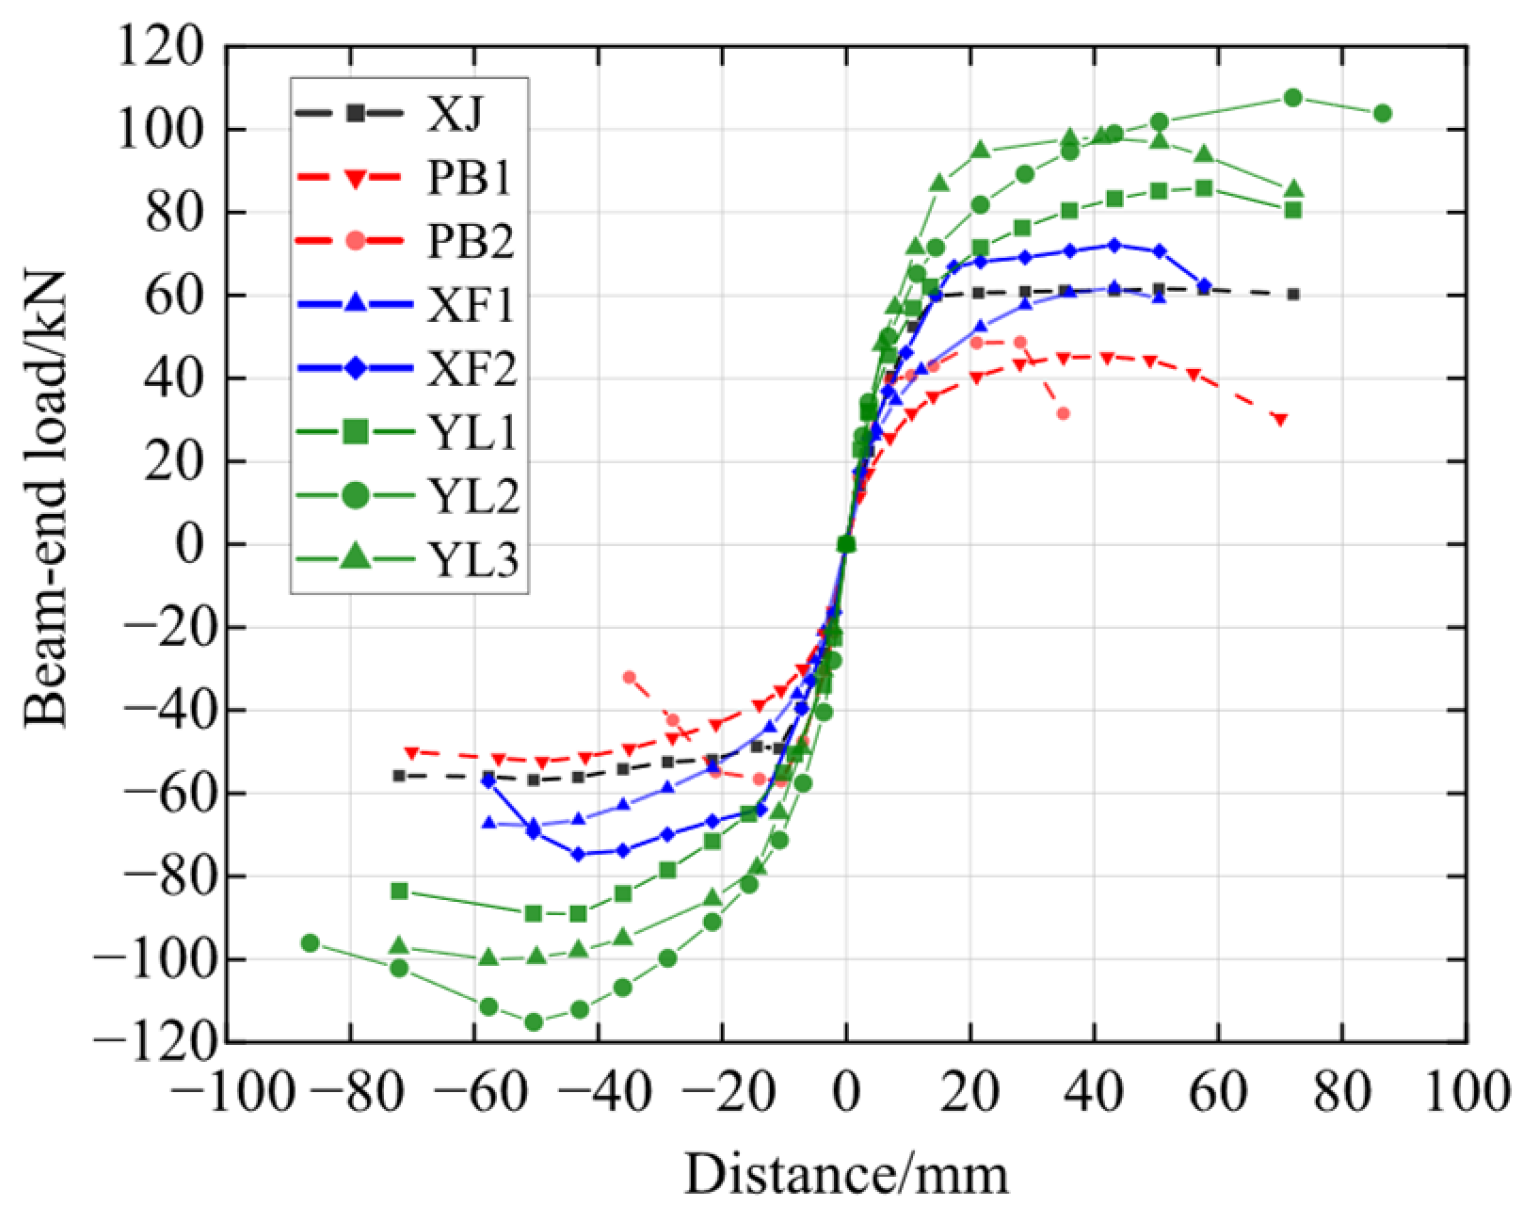
The non-optimized joints of XJ, PB1, and PB2 exhibited marginally lower peak load-bearing capacities than the cast-in situ concrete (RC) joints. PB1 and PB2 had 20.49% and 13.93% lower peak load-bearing capacity than XJ. However, their strength-to-yield ratios (1.20 and 1.13, respectively) exceeded that of the cast-in situ joint (1.10).
(2)
The analysis of PB1, XF1, and YL1 indicated the effectiveness of the SSFRC joint optimization. Increasing the end-plate thickness improved the bearing capacity by 35.41%, whereas employing prestressed tendon reinforcement achieved an 82.29% improvement in load-bearing performance.
(3)
The evaluation of PB2, XF2, and YL3 demonstrated the critical influence of the grout’s strength on the SSFRC joints with stiffening ribs. The grout strength affected the bonding performance between precast beams and steel sleeves and the subsequent joint failure mode. Utilizing C80-grade grout resulted in a 39.05% higher bearing capacity. Applying prestressing increased the bearing capacity by 88.57%.
(4)
A comparison of YL1 and YL2 highlighted the impact of prestressing tendons. The dual symmetrical tendon configuration of YL2 provided 27.27% higher bearing capacity than the central single-tendon configuration of YL1. This improvement was attributed to the longer distance between the prestressed tendons and the section’s neutral axis, enhancing structural moment capacity.
The stiffness degradation coefficient [39] reflects the structure’s ability to maintain residual stiffness despite developing plastic deformation and sustaining seismic damage during earthquake excitation. Figure 11 shows the secant stiffness of the specimens at various loading stages during the experiment. The following was observed:
(1)
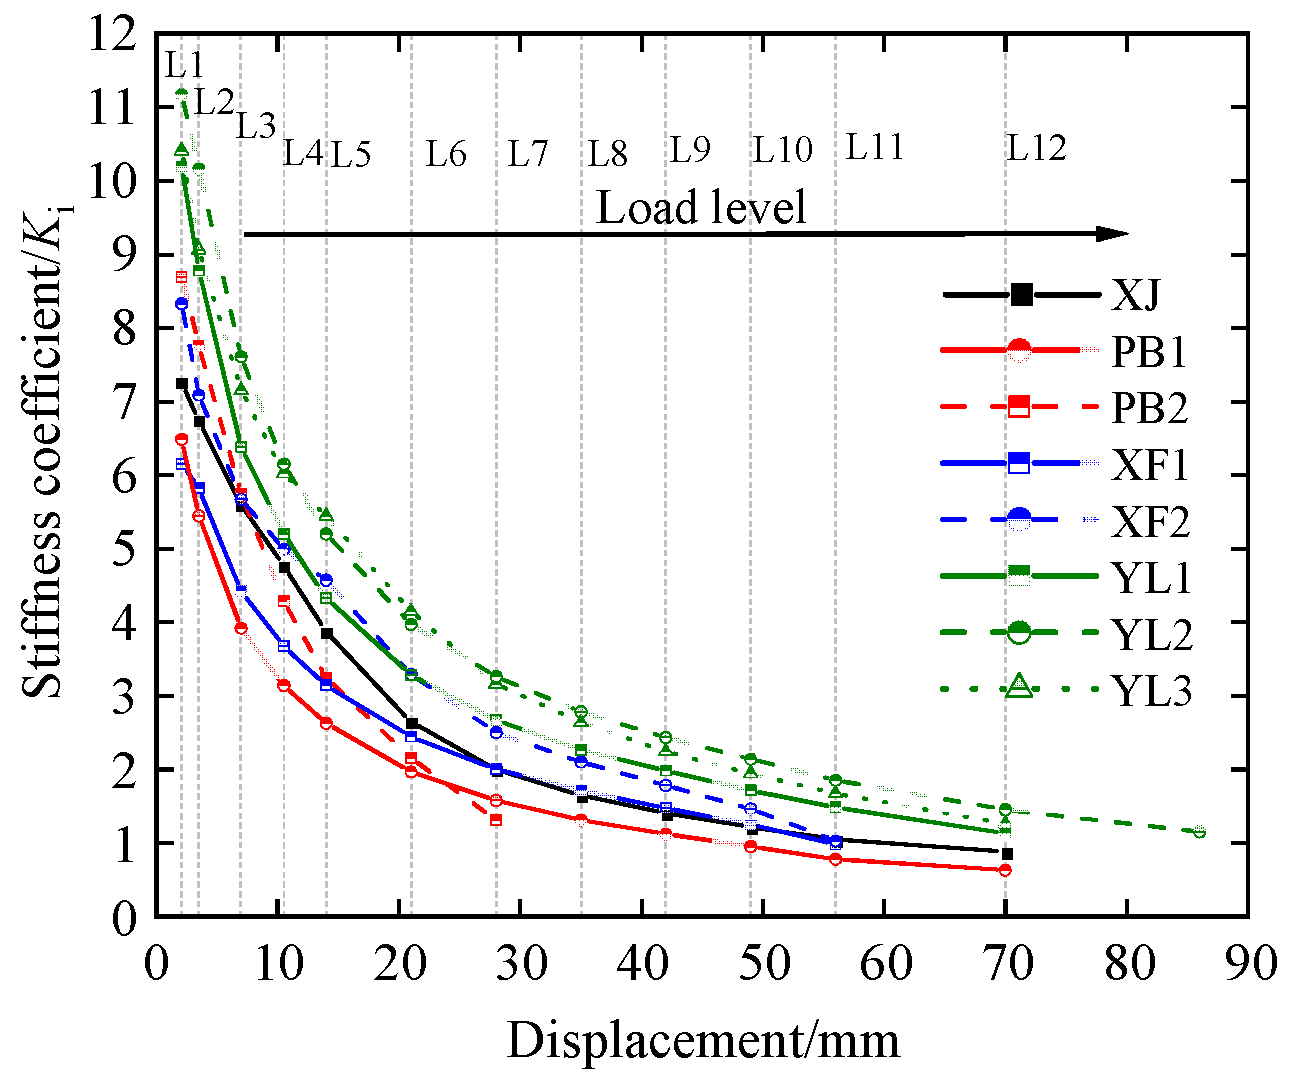
During the initial loading phase, the prestressed specimens YL1, YL2, and YL3 demonstrated the highest initial stiffness, exhibiting stiffness improvements of 40.49%, 54.01%, and 43.53%, respectively, compared to the cast-in situ joint specimen. Specimens with stiffening ribs (PB2, XF2) had 23.67% and 17.74% higher initial stiffness than the cast-in situ joint specimen. These experimental results indicated that prestressing tendons and stiffening ribs substantially increased the initial structural stiffness, with the former contributing the most.
(2)
All specimens exhibited marked stiffness degradation during advanced loading stages, indicating progressive accumulation of irreversible plastic damage. Prestressed joints (YL1, YL2, YL3) demonstrated higher residual stiffness than conventional cast-in situ joints due to the self-centering effect of tendons, thus reducing the proportion of plastic deformation to total displacement. Consequently, PSFRC joints showed enhanced stiffness retention under equivalent displacement cycles. Although specimen XF1 had lower initial stiffness, it marginally exceeded XJ in later stages, demonstrating that optimized SSFRC joints improve resistance to stiffness degradation mechanisms.
The equivalent viscous damping coefficient [40] is a critical indicator of structural energy dissipation capacity. Figure 12 presents the equivalent viscous damping coefficients of the specimens under different load–displacement cycles. During the initial loading phases, the equivalent viscous damping coefficients remained relatively low for all specimens because structural responses are primarily governed by elastic deformation. As cyclic loading progressed, the plastic deformation of structural components improved hysteretic energy dissipation, resulting in higher coefficients. The following is observed in Figure 12:
(1)
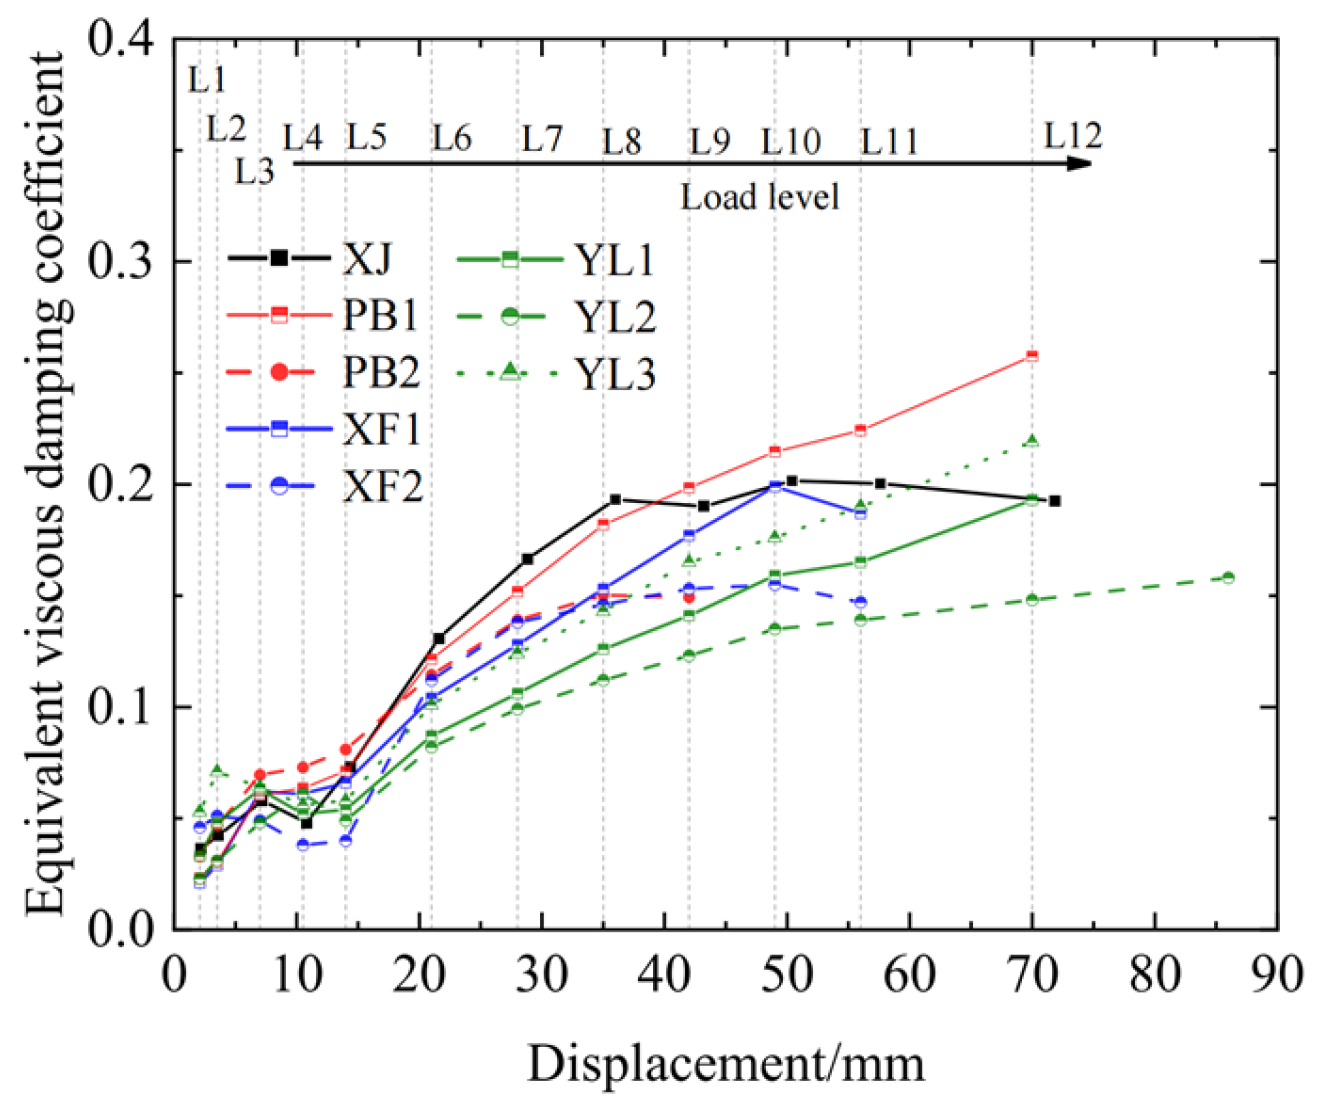
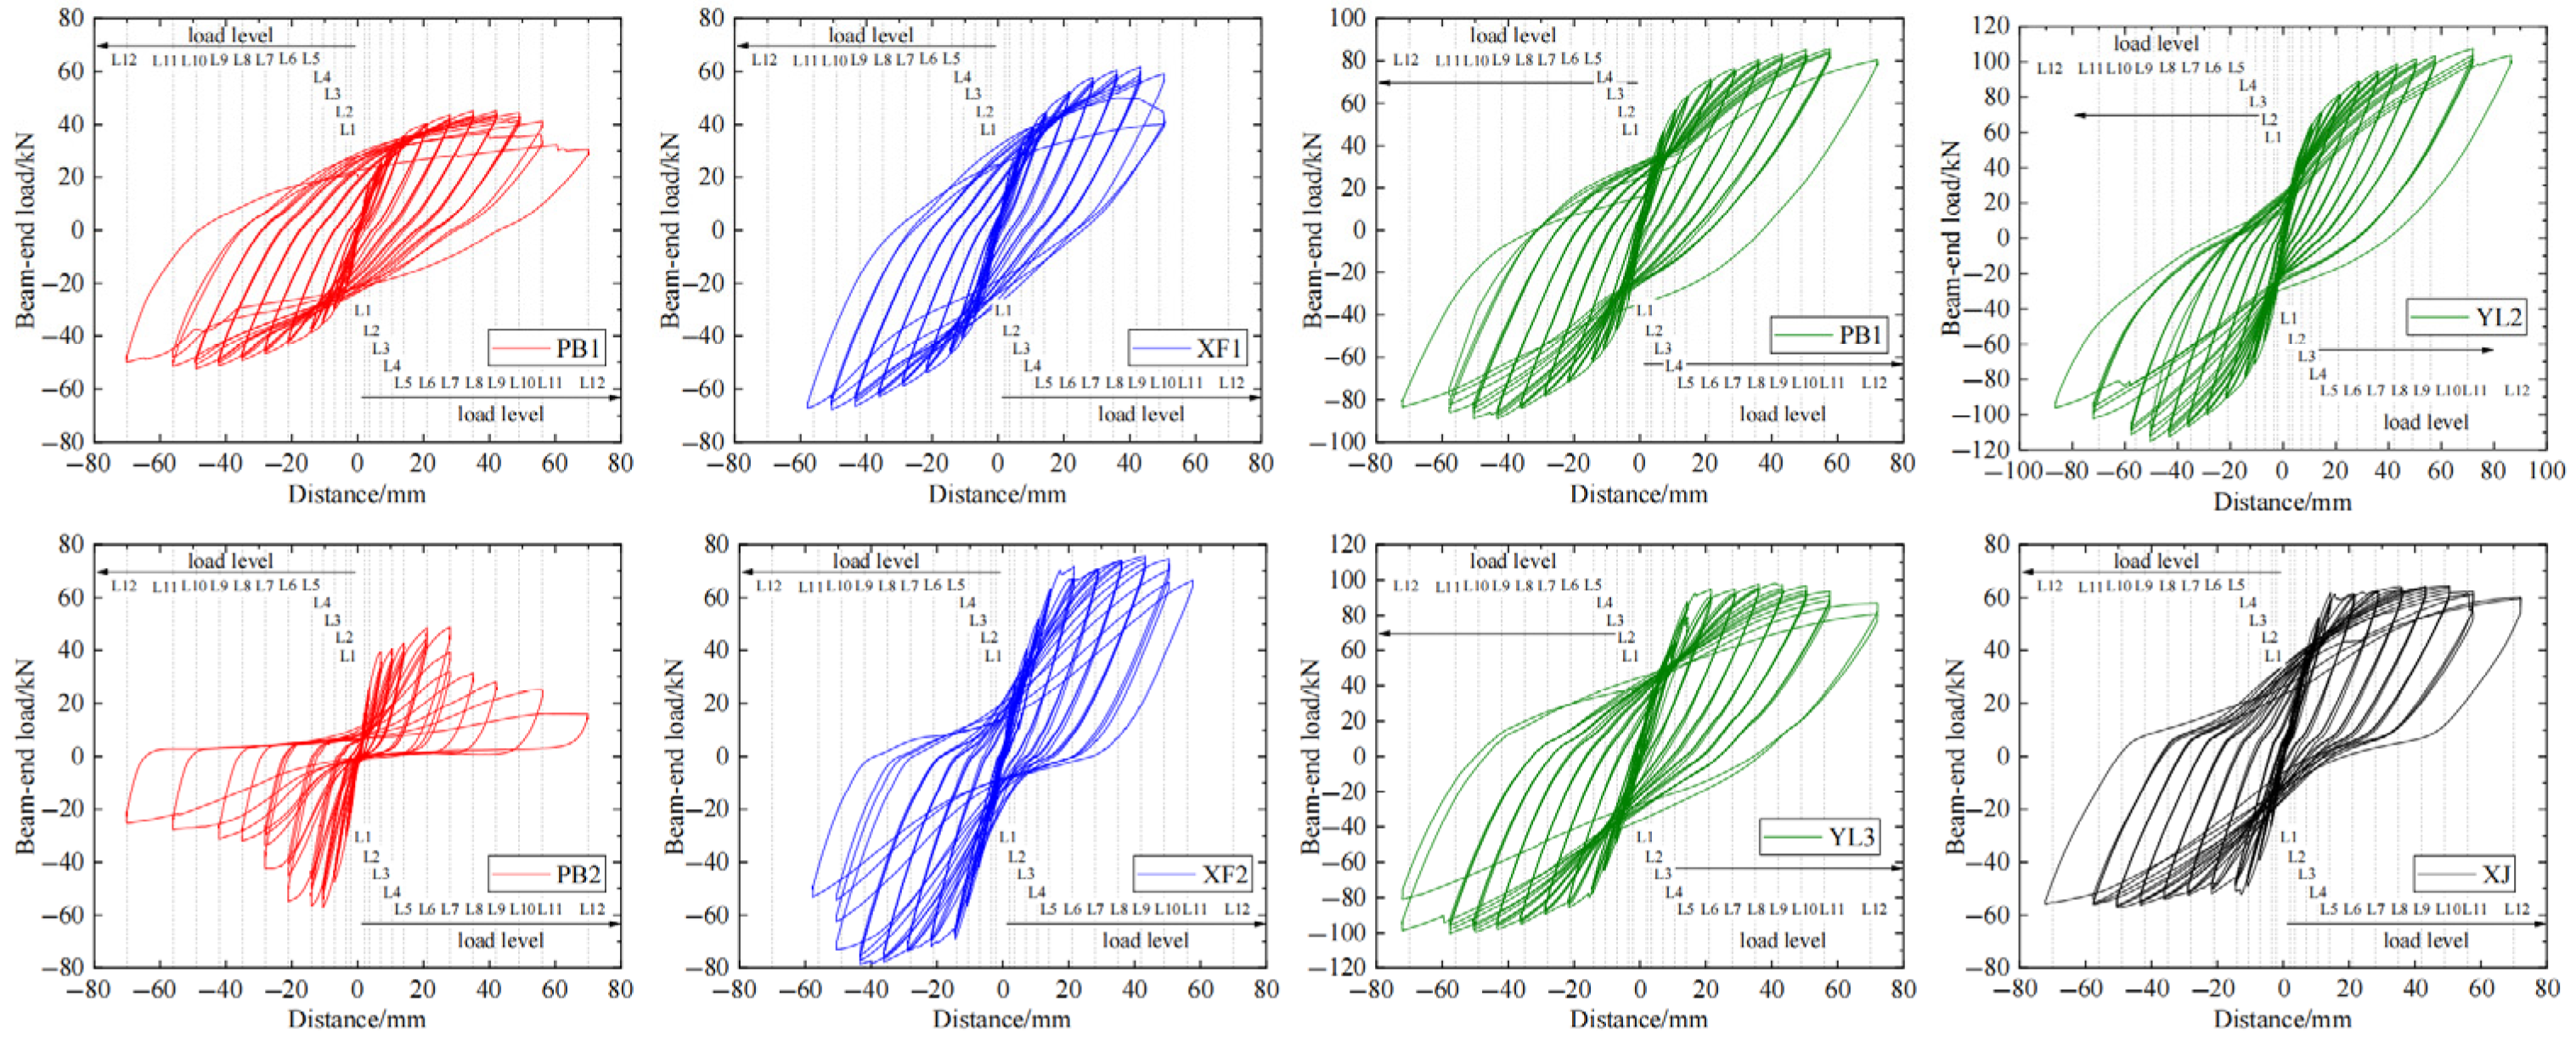
The cast-in situ joint XJ and the precast specimens exhibited different energy dissipation characteristics. During the mid-loading phase (20 mm–40 mm displacement range), the cast-in situ joint had higher energy dissipation capacity than its precast counterpart. However, during advanced loading stages, specimens PB1 and YL3 exhibited hysteretic energy dissipation exceeding that of the XJ benchmark specimen.
(2)
Although prestressing increased the joint load-bearing capacity and stiffness of YL1, YL2, and YL3, it negatively impacted energy dissipation capacity. This result highlights the necessity of stiffening ribs in PSFRC joints. Specimen YL3 with the stiffening ribs had 13.47% and 47.97% higher energy dissipation capacity than YL1 and YL2, respectively.
Figure 12. Equivalent viscous damping coefficients.
Buildings 15 02504 g012
Table 6 presents the specimens’ yield and ultimate displacements. Ductility is a critical parameter [41] for evaluating structural seismic performance and is a safety factor. In skeleton curves, the ductility coefficient is correlated with the slope of the post-peak descending branch. Generally, a gentler slope corresponds to slower structural degradation, higher ductility coefficients, and higher safety. The ductility coefficient is the ratio of ultimate displacement to yield displacement. The following is observed in Table 6.
(1)
The cast-in situ concrete joint specimen XJ exhibited the highest ductility coefficient (5.39). SSFRC joint specimen PB2 had the lowest value (3.09), attributable to grout failure, which compromised the bond between the precast beams and steel sleeves, resulting in rapid post-peak deterioration. This finding underscores the importance of grout strength in SSFRC joint design to prevent premature failure. The precast joints exhibit lower ductility coefficients than the cast-in-place joint. This is primarily due to the superior integrity of cast-in situ specimens. After the yielding of reinforcement, the plastic hinge can undergo significant plastic rotation. In contrast, precast specimens possess multiple connecting components at their joint regions. This results in less smooth force transfer compared to cast-in situ structures. Consequently, after reaching the peak load-carrying capacity, the strength deteriorates more rapidly, leading to somewhat inferior ductility.
(2)
Comparative analysis of the PSFRC and SSFRC joint specimens revealed the significant influence of the prestressed tendon configuration on joint ductility. The central single-strand tendon configuration provided limited ductility enhancement, with specimen YL1 showing a 3.53% improvement over XF1. Conversely, the symmetrical two-strand configuration substantially improved ductility. Specimen YL2 had an 18.75% higher ductility coefficient than YL1.
(3)
The stiffening ribs substantially increased structural ductility. For the PSFRC joints, specimen YL3 exhibited 26.14% higher ductility than YL1. Similarly, SSFRC joint XF2 showed 16.76% ductility improvement over XF1. These results indicated that the stiffening ribs significantly increased the ductility of the prestressed structures, demonstrating they are critical PSFRC components requiring careful design consideration.
(4)
Comparing specimens PB2 (C60 grout, μ = 3.09) and XF2 (C80 grout, μ = 3.97) reveals grout strength’s ductility impact. Prior tests with PB1/XF1 confirm that end-plate thickness variations (present in PB2/XF2) minimally affect ductility. The 28.47% higher ductility in XF2 demonstrates C80 grout’s efficacy. Mechanistically, higher-strength grout improves steel sleeve-to-beam bonding, enabling the efficient transfer of beam-end bending stresses to the sleeve. This synergy optimizes material utilization, enhancing joint capacity and ductility.

3.3. Evolution of the Prestressing Force

Figure 13 illustrates the temporal evolution of the prestressing force of the PSFRC joint specimens (YL1, YL2, and YL3) during cyclic testing. Data were obtained from annular sensors installed at the beam ends. All specimens exhibited an initial tension stress of 0.45 fptk, corresponding to a tensioning force of 117 kN. Specimens YL1 and YL3 demonstrated an initial prestressing force of 116 kN with minimal prestress loss at test commencement. In contrast, specimen YL2 exhibited an initial prestressing force of 110 kN at the start of the experiment, indicating a minor loss in prestressing force while remaining within the tolerance range (≥104 kN). Fluctuations in the prestressing force occurred during cyclic loading in response to the applied cyclic forces.
The following is observed in Figure 13.
(1)
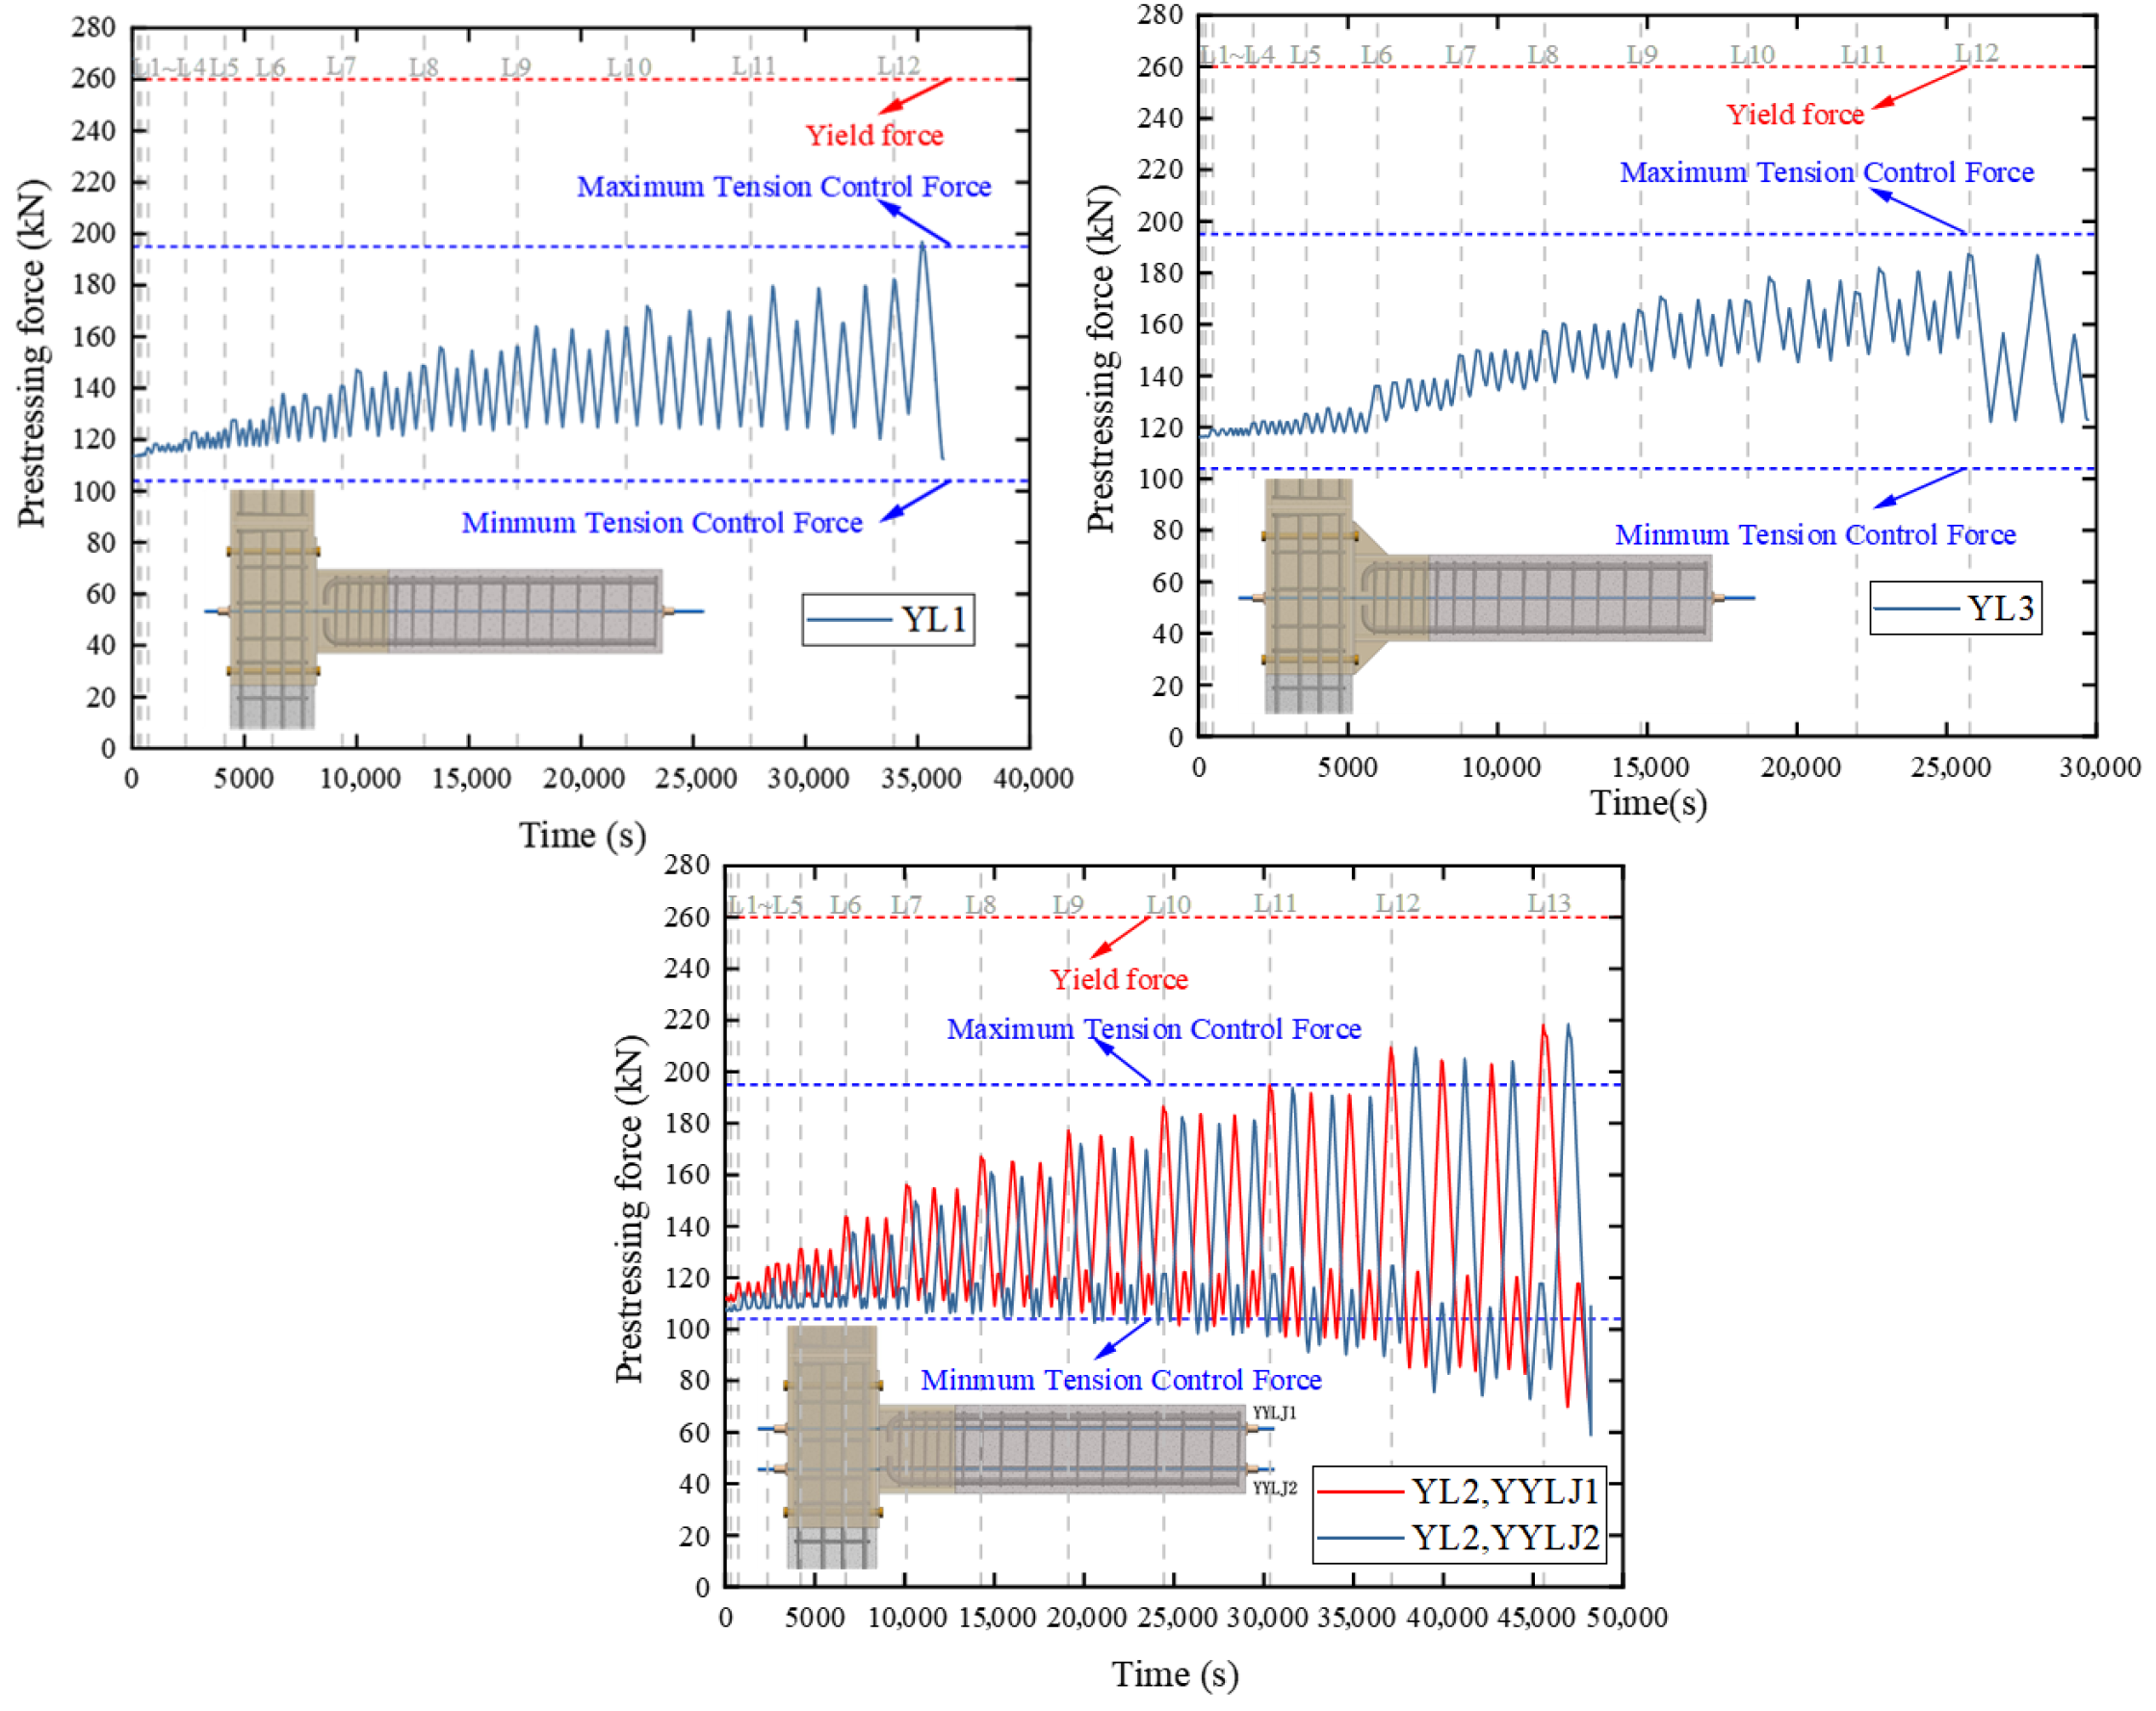
Comparative analysis of YL1 and YL3 demonstrates that both specimens exhibited a minimal loss in the prestressing force during loading, with the prestressed tendons functioning effectively within their elastic working range. Although the curves of both specimens exhibited fluctuations, their characteristics differed. (A) The prestressing force curve of specimen YL1 exhibited higher amplitudes and was more symmetrical. (B) The curve of specimen YL3 exhibited lower amplitudes and an upward trend in proportion to the load. The reasons were as follows: (A) The absence of stiffening ribs in YL1 resulted in lower joint stiffness and larger beam-end rotations at the same load, increasing the elongation of the prestressed tendons and the amplitude of YL1’s curve. (B) The stiffening ribs in YL3 improved the rotational stiffness. Joint deformation occurred predominantly at the interface between the precast beam and steel sleeve. This configuration caused higher plastic deformation during loading, generating significant residual deformation. Consequently, YL3’s curve exhibited an increasing trend.
(2)
YL1 and YL2 had different joint configurations, specifically the prestressed tendon configuration. The two symmetrical tendon bundles in YL2 enhanced force participation at the beam ends during loading. At a displacement of 72 mm (12 L), the prestressing force was 210 kN for YL2 and 190 kN for YL1 under equivalent loading conditions. The symmetrical tendon configuration improved the prestressing efficiency and adversely affected prestress loss. Under cyclic loading, YL2 exhibited an initial prestressing force of 110 kN and a final value of 60 kN, representing a 45.45% loss.

4. Moment–Rotation Relationship Curve Analysis of Joints

4.1. Differences in Curves for Different Joint Types

The moment–rotation curve is used to analyze the mechanical properties of joints in structural engineering, a field of particular importance in assessing combined structures. The curve is utilized in the structural elastic–plastic analysis to define nonlinear spring or connector units, affecting the accuracy of the analysis. According to the classification method based on Eurocode 3 criteria, a connection is categorized as pinned when its rotational stiffness is less than 0.5 times the linear stiffness of the beam. For braced frames, a connection is rigid when rotational stiffness exceeds 25 times the beam’s linear stiffness; for unbraced frames, a connection is rigid when rotational stiffness exceeds eight times the beam’s linear stiffness. Connections with rotational stiffness between these values are classified as semi-rigid. This paper imposes specific constraints on applying the Eurocode for joint classification: the frame structure is considered a braced frame.
The moment–rotation curves at the beam end are shown in Figure 14.
The moment values were obtained by multiplying the load values at each loading cycle in the skeleton curve by the distance from the loading end to the core region. The rotation values were calculated using the data from displacement transducers at the beam end. The following is observed in Figure 14:
(1)
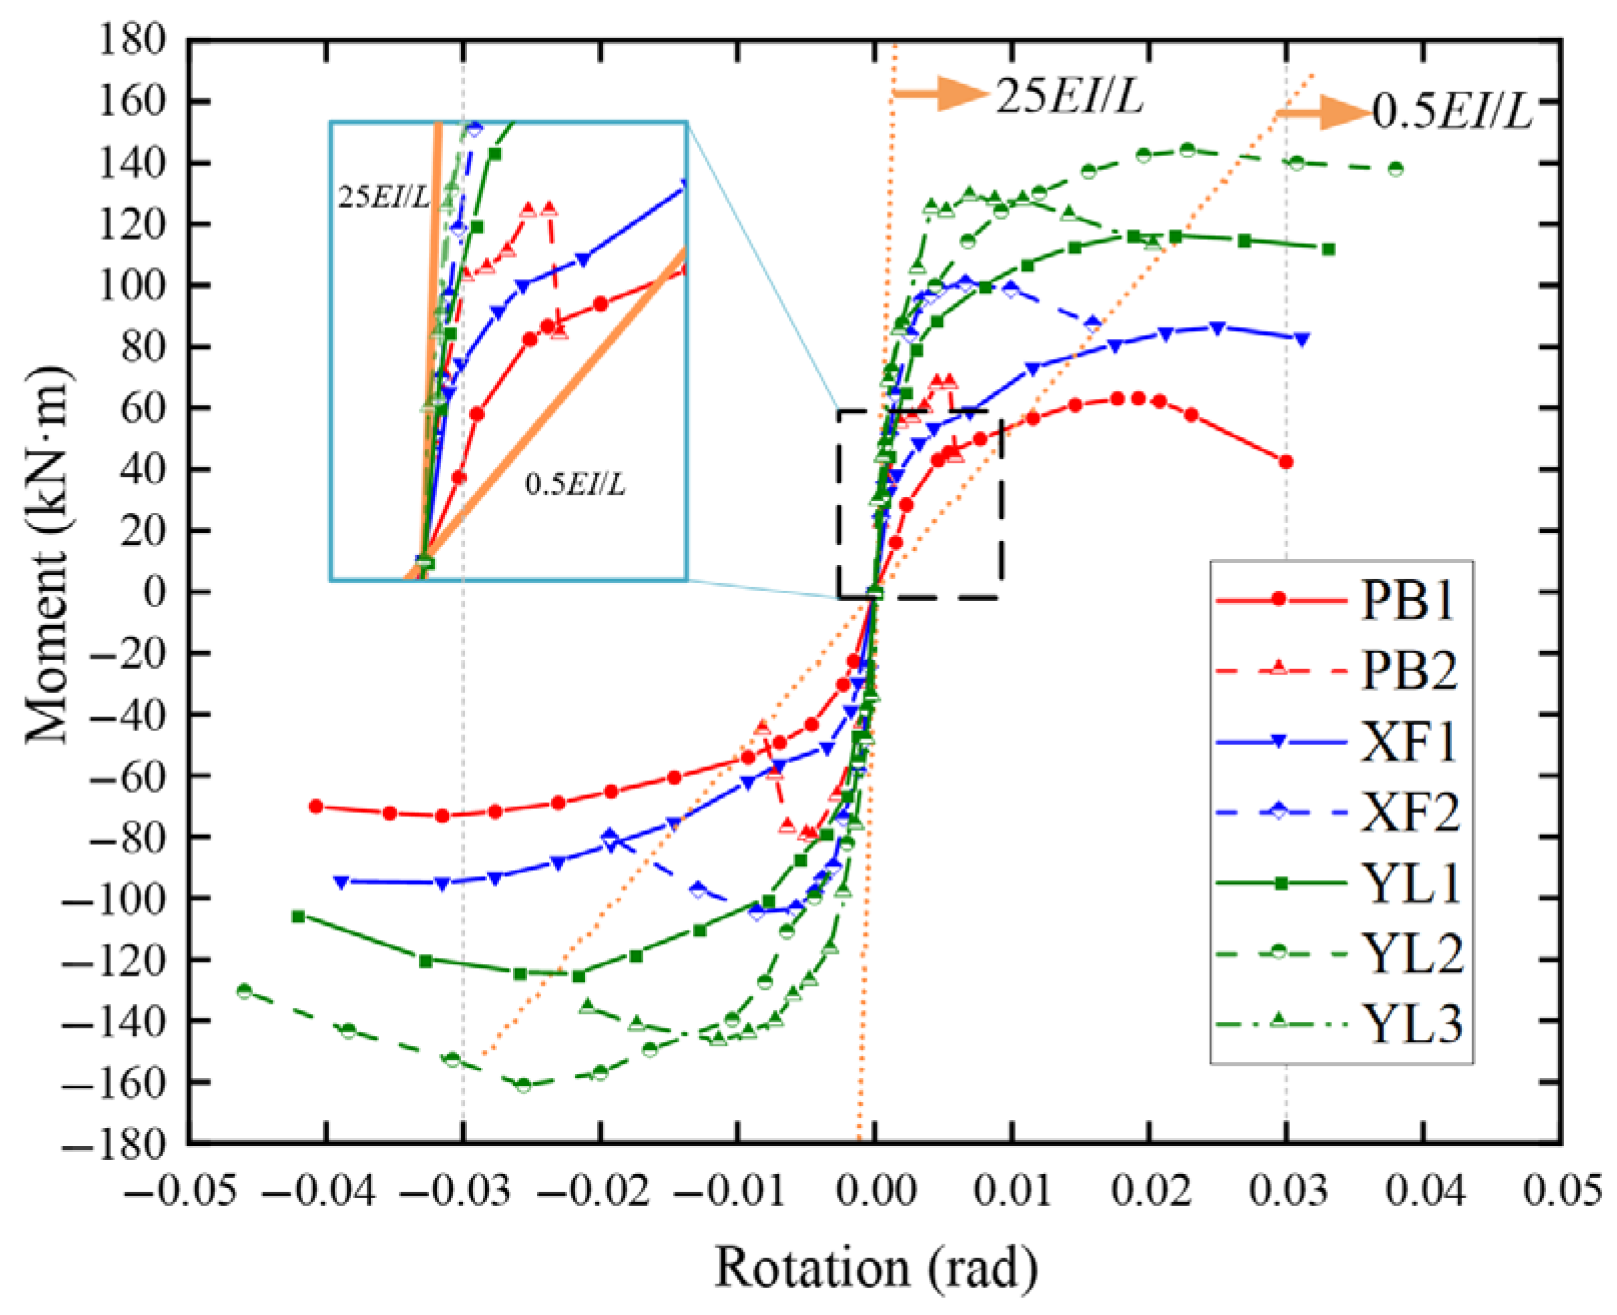
The rigid and pinned connection boundaries were determined according to the Eurocode. All specimens exhibited initial rotational stiffness between rigid and pinned connections, indicating semi-rigid connections.
(2)
The initial rotational stiffness of the joints exhibited a trend similar to the initial stiffness of the joint skeleton curve discussed earlier. Specimens PB1 and XF1 without stiffeners or prestressed tendons demonstrated lower initial rotational stiffness, approaching the pinned connection boundary. In contrast, specimens with stiffeners and prestressed tendons exhibited higher initial rotational stiffness, approaching the rigid connection boundary.
We developed a trilinear moment–rotation curve model for PSFRC joints and SSFRC joints using Eurocode EC3, focusing on initial rotational stiffness and flexural capacity. The trilinear moment–rotation curve model based on the EC3 component method presented herein involves certain simplifications and constraints:
(1)
Material damage is neglected, assuming ideal elastic–plastic material behavior;
(2)
Coupling effects between components are disregarded, assuming mutual independence among components;
(3)
The component-based method ignores complex three-dimensional effects, post-buckling behaviors, residual stresses, specific manufacturing imperfections, and highly non-uniform stress distributions.
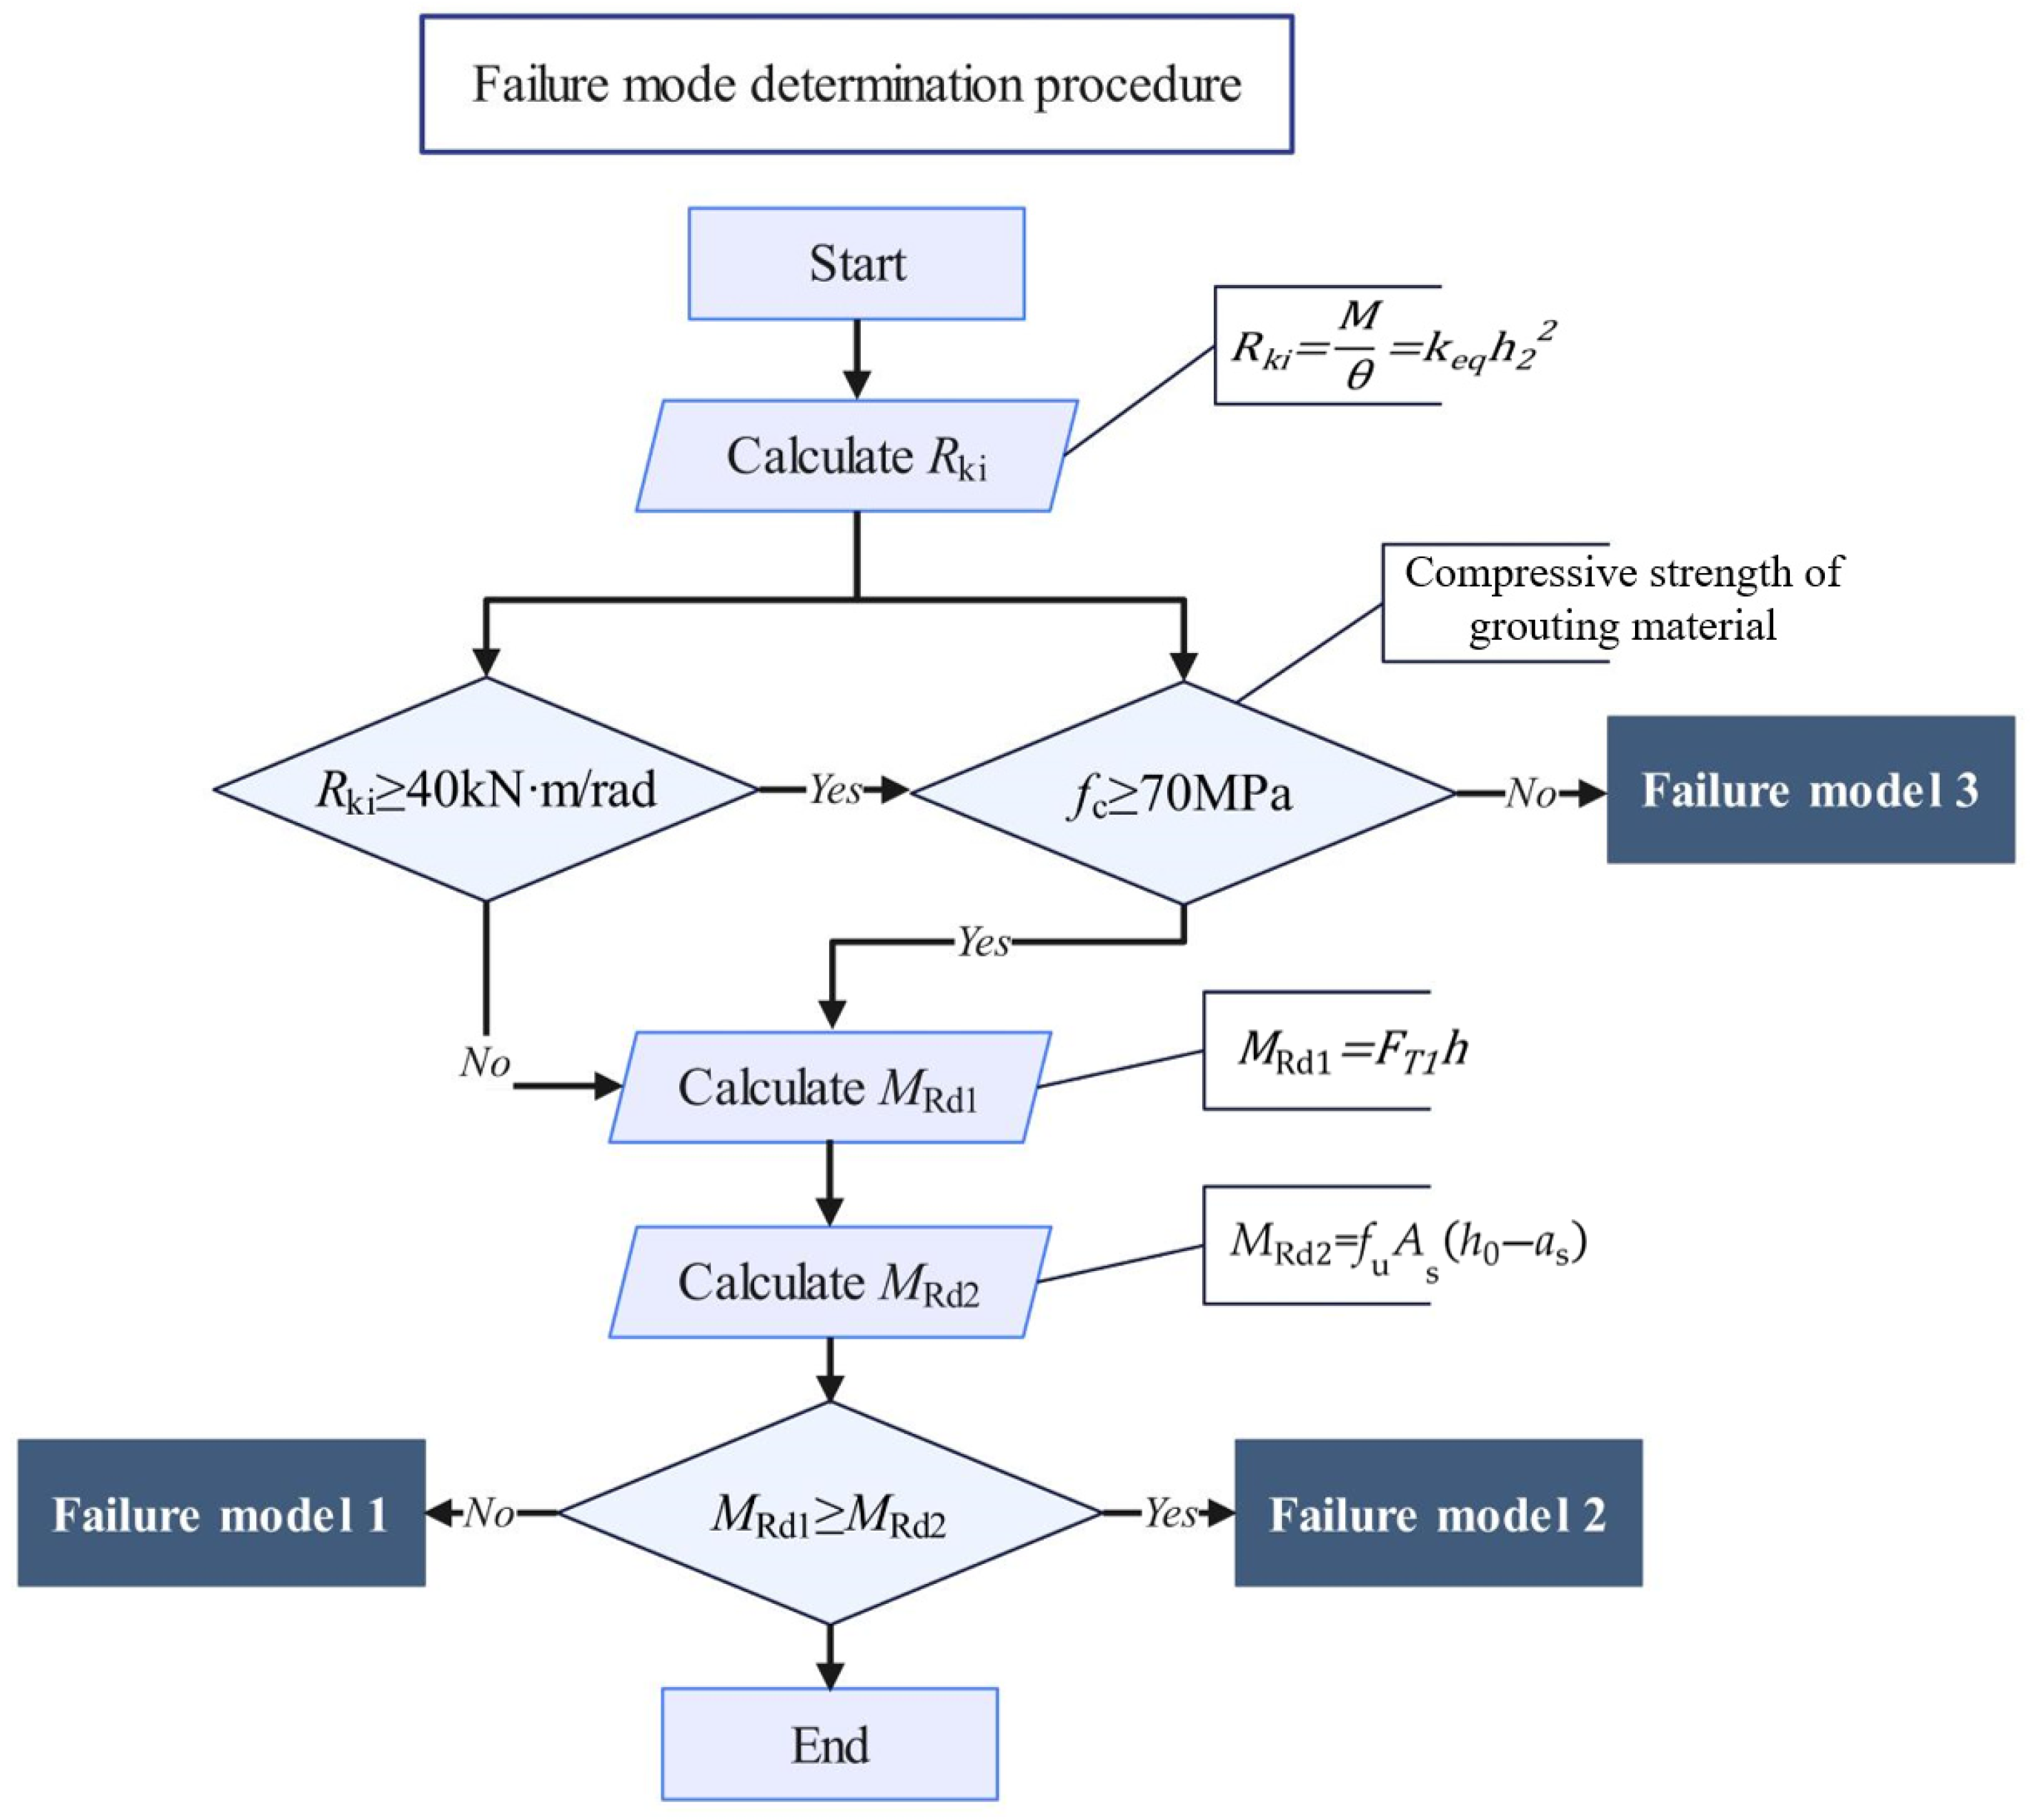
The modeling procedure was as follows:
(1)
Calculate the initial rotational stiffness Rki of the SSFRC and PSFRC joints.
(2)
Determine the flexural capacity Mrd of the SSFRC and PSFRC joints.
(3)
The yield moment My of the joint was calculated using Equation (1) based on the design standard. The rotational stiffness had the initial value Rki when the moment at the joint was less than My.
M y = 2 3 M rd
(4)
The rotational stiffness was adjusted using the following expression when the bending moment affecting the joint exceeded the yield moment My but remained below the flexural capacity Mrd:
kj = R ki μ
μ = 3 × 1.5 η 1
where η is the modification factor for joint rotational stiffness. It depends on the connection configuration, and it was 4 in this study.
(5)
The linear hardening phase was entered when the bending moment at the joint exceeded the flexural capacity Mrd. The post-hardening stiffness kp was 0.02 Rki.
The simplified moment–rotation curve models for the PSFRC joints and SSFRC joints are defined as follows:
M = R ki θ                                                                     θ y θ < θ y 2 3 M y + ( θ θ y ) k j                                     θ p θ < θ y θ y θ < θ p M y + ( θ θ p ) k p                                             θ u θ < θ p θ p θ < θ u
where θy is the joint rotation corresponding to the yield moment, θp is the joint rotation corresponding to the flexural resistance, and θu is the ultimate joint rotation.

4.2. Theoretical Calculation of Initial Rotational Stiffness of Structural Joints

The proposed connections for the SSFRC and PSFRC joints include the (1) joint core zone, (2) high-strength bolts, (3) beam-end steel plate, (4) and prestressed tendons. A simplified analytical model of the joint is illustrated in Figure 15. The tensile stiffnesses of the four components were calculated to determine the joint’s initial rotational stiffness. The total rotational stiffness was derived using the component-based method [42] to obtain the stiffness contributions (parallel or series relationships).

4.2.1. Flexural and Shear Stiffness of the Joint Core Zone

The bending moment at the beam end is transferred to the joint core zone through the contact surfaces of the bolts and the beam-to-column connection. It causes flexural deformation and shear deformation in the joint core zone, resulting in rotational displacement that directly influences the joint’s initial rotational stiffness. A schematic diagram of the force-deformation mechanism in the joint core zone is illustrated in Figure 16.
The total deformation of the joint core zone consists of flexural and shear deformation. The total stiffness of the joint core zone was derived by calculating the stiffness values for different deformation modes and combining them, as shown in Equations (5)–(10):
K c = 1 1 ρ ( k cwsmv + k cwsms )
k cwsmv = T Δ 1 = G sc A v h l
k cwsms = T Δ 2 = 12 E sc I sc h l 3
ρ = h l H c
G sc = E sc 2 ( 1 + μ )
E sc = E s A s + E c A c A s + A c
where T is the total moment applied to the joint core zone, Δ is the total deformation of the joint core zone, Δ1 is the shear deformation component of the joint core zone, Δ2 is the flexural deformation component of the joint core zone, h1 is the height of the joint core zone. In this study, it is defined as the spacing between the bolts’ centers. Gsc is the equivalent shear modulus of the joint panel zone, Esc is the equivalent elastic modulus of the joint panel zone, μ is the Poisson’s ratio (which is 0.2 in this study), Ec is the elastic modulus of concrete, Es is the elastic modulus of steel reinforcement and structural steel, As is the area of steel reinforcement and steel, Ac is the area of concrete, Av is the area of the joint core region, Isc is the moment of inertia of the joint core zone about the bending axis, “ρ” is the enhancement factor accounting for the stiffening effect of column-end shear forces on the joint panel zone stiffness [43,44], and Hc is the height of the column.

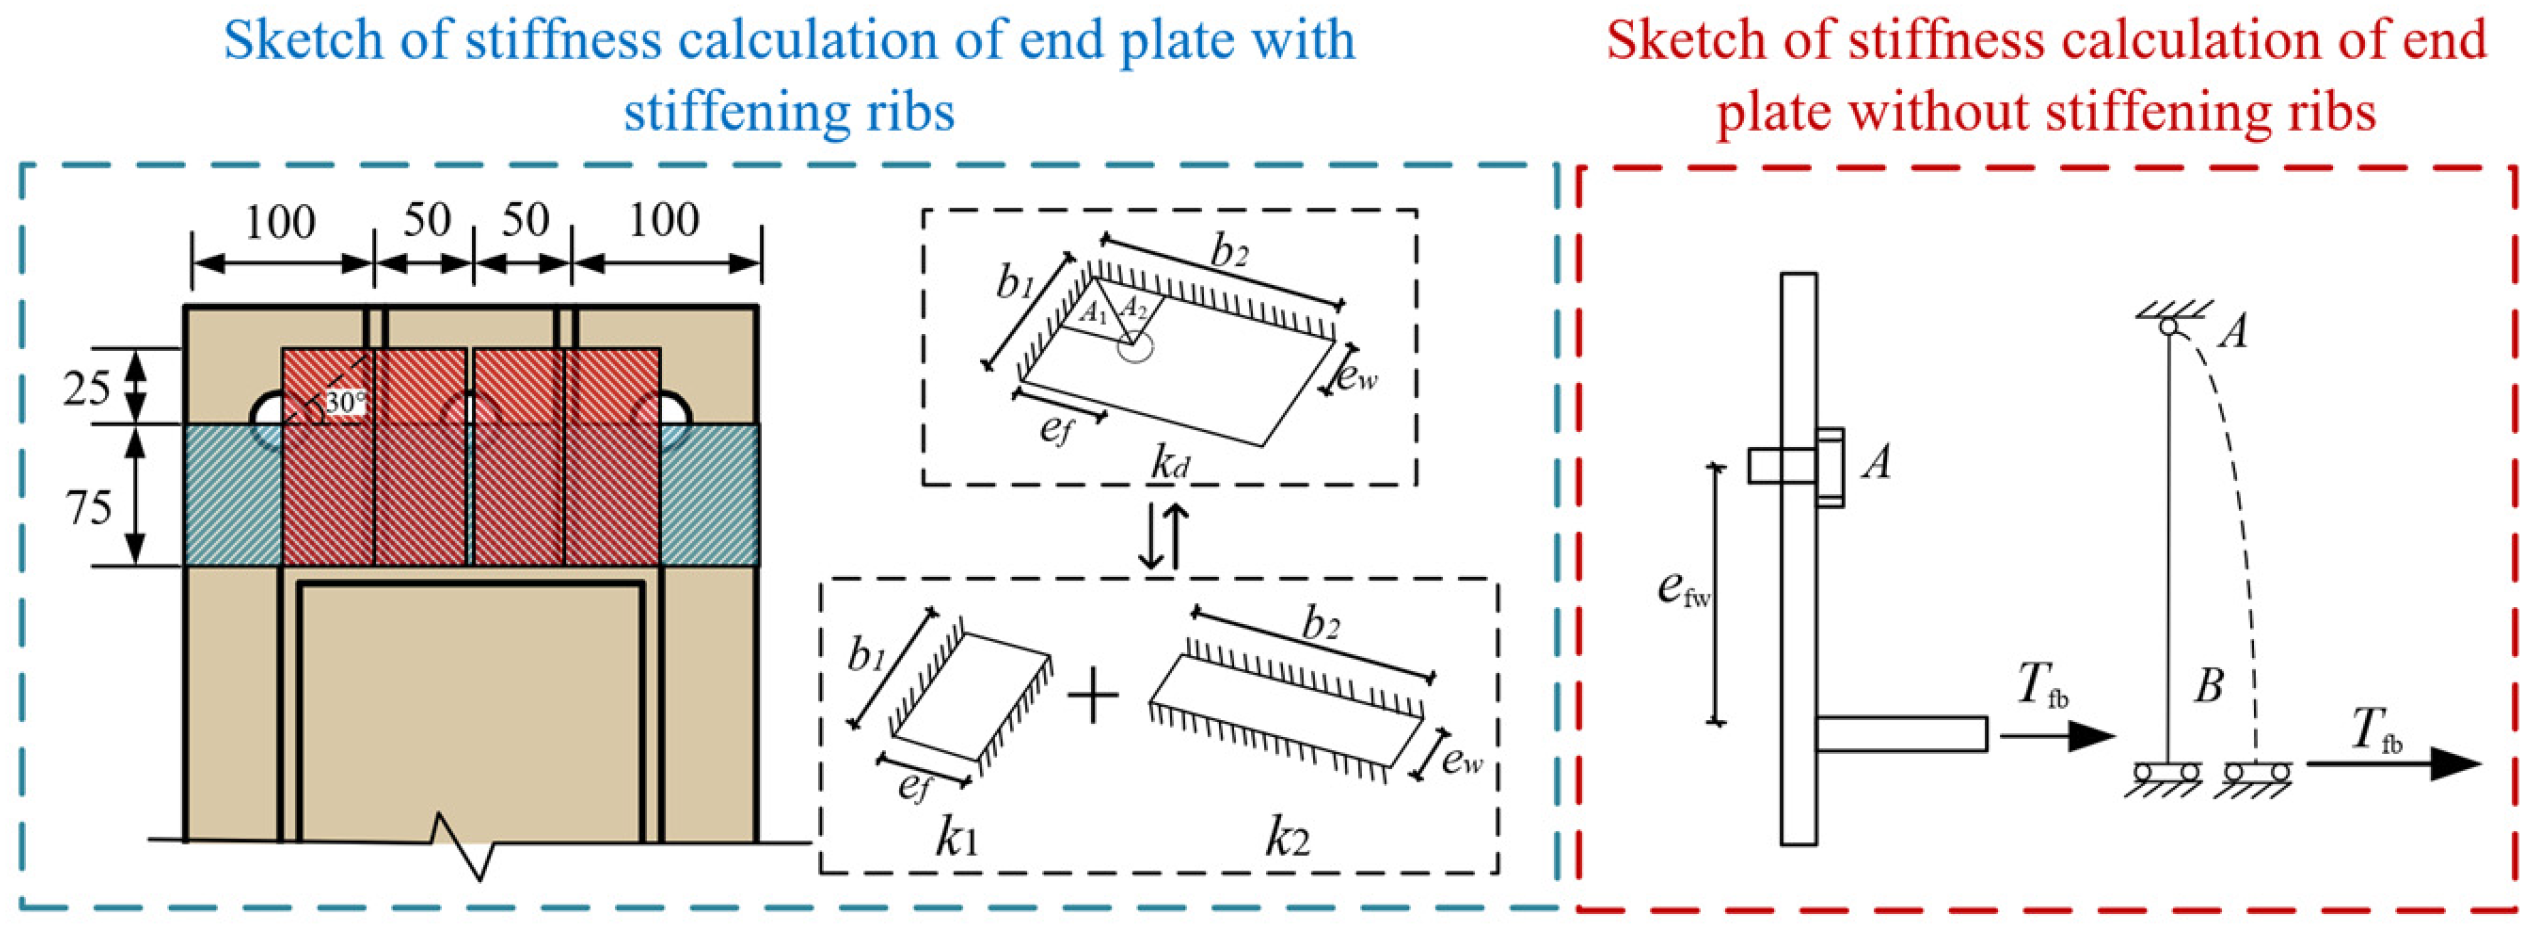
4.2.2. Calculation of Tensile Stiffness of End Plates in Steel Sleeve Beams

The proposed PSFRC and SSFRC joints have stiffened and unstiffened steel sleeve beam end plates. The computational diagrams of the two end plate configurations are presented in Figure 17.
(1)
Calculation of tensile stiffness of unstiffened end plates
The end plate was assumed to be a structural member to calculate the stiffness of the unstiffened end plates. The bolt side was modeled as a fixed hinge support, and the end plate side was represented as a sliding support. The tensile stiffness provided by the end plate under these boundary conditions is expressed by Equation (11).
k m = T Δ = 6 E s I bs e f 3
(2)
Calculation of tensile stiffness of stiffened end plates in steel sleeve beams
The presence of stiffening ribs significantly alters the force transfer mechanism of end plates, necessitating a revised analytical approach for calculating the tensile stiffness of stiffened configurations. Following the methodology proposed in the study of [45], the stiffened region is treated as an additional deformation boundary. The computational domain is subdivided into two distinct regions for separate stiffness analysis, with a subsequent superposition of results. Both subdivided plates maintain consistent boundary conditions with the previous model: a fixed hinge support at the bolt side and an equivalent sliding support at the opposing edge. Under this refined mechanical model, the resultant tensile stiffness provided by the stiffened end plate system is formulated as Equation (12).
k m = 4 ( β 1 k 1 + β 2 k 2 )
k 1 = 1 e f 3 6 E s I + α e f G s A = 1 2 e f 3 E s b 1 t ep 3 + α e f G s b 1 t ep
k 2 = 1 e w 3 6 E s I + α e w G s A = 1 2 e w 3 E s b 2 t ep 3 + α e w G s b 2 t ep
β 1 = 1 A 2 b 1 e f
β 2 = 1 A 1 b 2 e w
where ef is the distance from the bolt’s center to the beam’s upper flange, ew is the distance from the bolt’s center to the stiffening rib, α is the section’s shape factor (it is 1.5 based on a rectangular cross-section), Gs is the shear modulus of the steel, b1 and b2 are the effective lengths in the boundary region, and β1 and β2 are the coefficients accounting for regional overlap effects.

4.2.3. Calculation of Tensile Stiffness of High-Strength Bolts

During the transfer of the beam-end bending moments to the column through the high-strength bolts, the bolts’ deformation significantly influences the joint’s rotational stiffness. We used the tensile stiffness equation specified in Eurocode 3 for high-strength bolts, as expressed in Equation (17).
k b = 1.6 E b A s L b
where Eb is the elastic modulus of the high-strength bolt, As is the nominal cross-sectional area of the bolt, and Lb is the effective bolt length, which is calculated as follows: Lb = column section depth + 0.5 × (bolt head height + nut height).

4.2.4. Calculation of Tensile Stiffness of Prestressed Tendons

The prestressed tendons are part of the joint deformation during rotational loading and are connected in series with the other three components (steel sleeve end plates, high-strength bolts, and concrete reinforcement). The tensile stiffness of the prestressed tendons was combined with that of the three primary components to obtain the composite stiffness. We employed the tensile stiffness equation for prestressed tendons derived from [46] (Equation (18)).
k p = n p E p A p 0.4 L ups
where Ep is the elastic modulus of the prestressed tendons, np is the number of prestressed tendons, Ap is the cross-sectional area of a single tendon, and Lups is the effective length of the prestressed tendons.

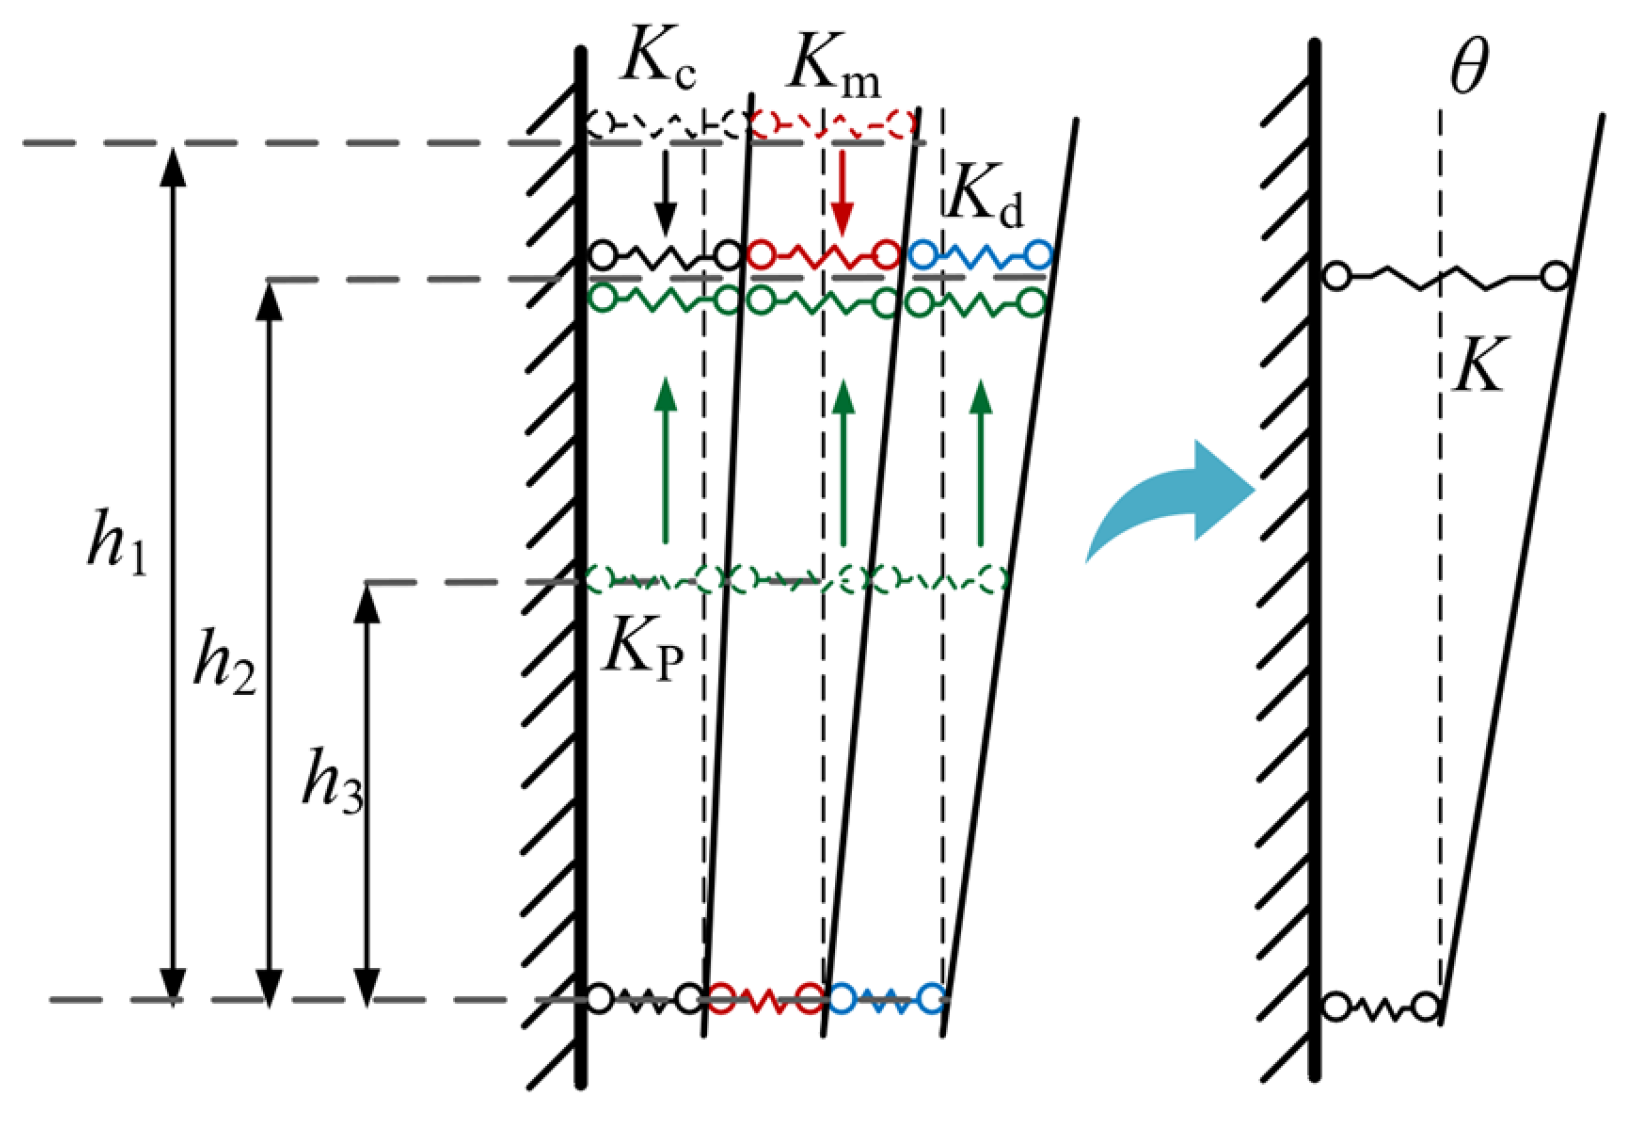
4.2.5. Analysis of Joint Rotational Stiffness

The rotational stiffness of the joint was determined by combining the stiffnesses of the components. The schematic diagram of the joint’s rotational stiffness is shown in Figure 18.
The stiffness properties of components at different heights were obtained by using a common reference height and coordinate translation. The equivalent stiffness after height adjustment was determined by Equation (19).
k eq 1 = h 1 K c h 2 + h 3 K p h 2
k eq 2 = h 1 K m h 2 + h 3 K p h 2
k eq 3 = K d + h 3 K p h 2
The initial rotational stiffness keq of the joint was determined by combining the component’s equivalent stiffness values:
k eq = 1 1 k eq 1 + 1 k eq 2 + 1 k eq 3
The initial rotational stiffness Rki of the joint is finally determined through superposition of equivalent stiffness components, expressed as follows:
R ki = M θ = k eq h 2 2
The calculated and experimental initial rotational stiffness Rki of the test specimens are presented in Table 7.

4.3. Theoretical Calculation of the Structural Joint’s Flexural Capacity

The flexural load capacity of the SSFRC and PSFRC joints for different cross-sections was derived for the following three cases: (1) failure of the beam’s steel sleeve end plate, (2) failure of the prefabricated beam section with an intact bond with the steel sleeve, and (3) failure of the variable cross-section part of the prefabricated beam under bond failure. The cross-sections are shown in Figure 19.

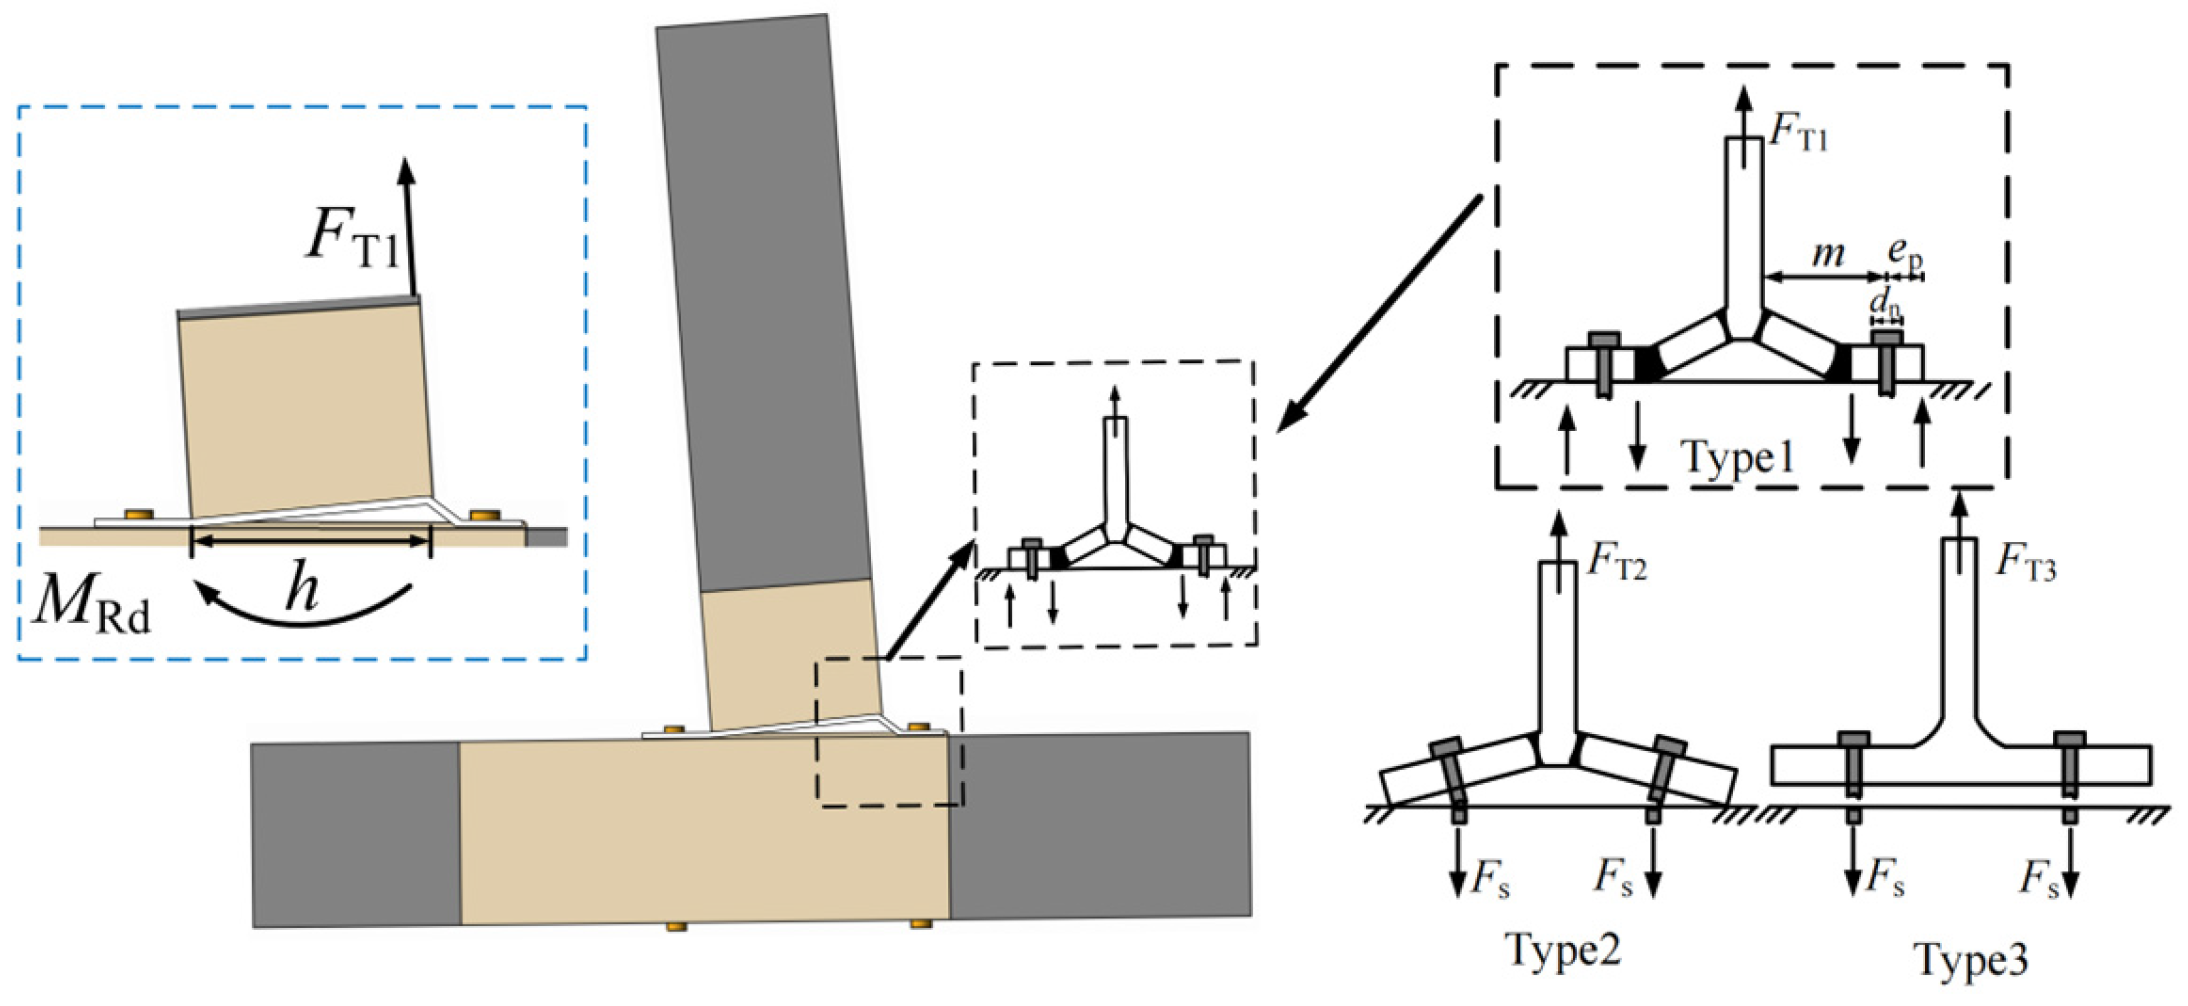
4.3.1. Flexural Load Capacity During the Failure of the Beam’s Steel Sleeve End Plate

The flexural load capacity was calculated using the European code 3, which is based on an equivalent T-piece mode. It was assumed that the upper cover plate and end plates of the beam steel jacket were equivalent T-pieces, as shown in Figure 20. The flexural load capacity was derived based on failure mode 1, as shown in Figure 20
The equation for the flexural load capacity is as follows:
M Rd = F T 1 h
F T 1 = 8 n 2 e w 2 m e e w m e + n M Tp
n = min e p , 1.25 m e
e w = 0.25 d n
M Tp = 0.25 l eff t e 2 f u
where MTp is the bending moment generated by the plastic hinge line at the flange of the equivalent T-piece, me is the effective distance between the plastic hinge lines (taken as 190 mm), leff is the effective length of the plastic hinge line of the equivalent T-piece (700 mm), and te is the thickness of the end plate of the beam’s steel sleeve.

4.3.2. Flexural Load Capacity During the Failure of the Prefabricated Beam

According to the GB 50010-2010 [47], the equilibrium conditions can be obtained using the following equation:
α 1 f c bx + f u A s = f u A s
where α1 is the ratio of the equivalent and axial compressive strengths of concrete, fc is the axial compressive strength of concrete, b is the section width of the precast beam, x is the height of the concrete compression zone, fu and f u are the tensile and compressive stresses, respectively, of the reinforcing bar at the peak load (500 MPa), and As and A s are the areas of tensile and compression reinforcement of precast beam, respectively.
Since the precast beams have symmetrical reinforcement, fuAs = f u A s . The flexural load capacity at the end of the beam is expressed as follows:
M Rd = f u A s h 0 a s
where h0 is the effective height of the precast beam; as is the distance from the compression reinforcement to the edge of the compression section.

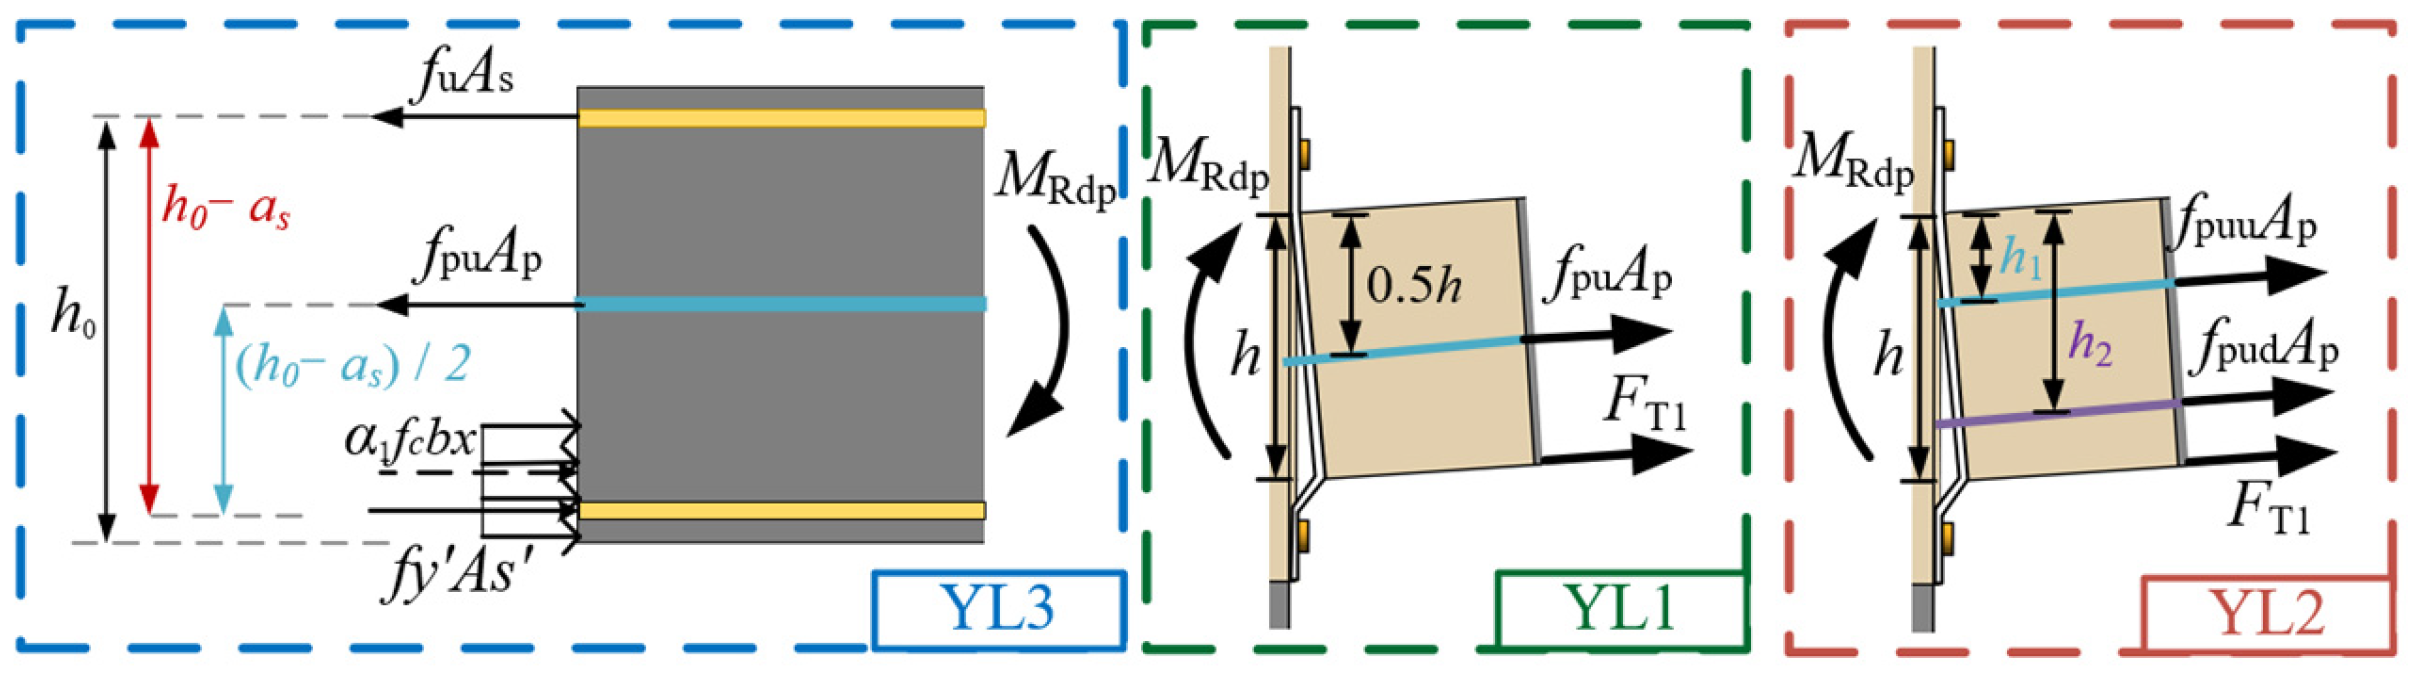
4.3.3. Flexural Load Capacity During the Failure of the Prefabricated Beam’s Variable Cross-Section

The overall formula with the same Formula (30). However, the yield stress of the rebar must be adjusted according to its material properties. It is 400 MPa. The flexural load capacity is expressed as follows:
M Rd = f xu A s h 0 a s
where fxu is the stress of the tensile reinforcement at the moment of peak load, and 400 MPa is taken in this paper.

4.3.4. The Flexural Capacity Provided by the Prestressed Tendons

Experimental observations revealed that specimens YL1 and YL2 with prestressed tendons exhibited failure due to the yielding of the steel sleeve end plates, whereas YL3 failed due to the flexure of a precast beam. Since we utilized post-tensioned, unbonded, and prestressed tendons, their flexural capacities were calculated separately and integrated into the baseline models without prestressing to determine the specimen’s ultimate flexural capacity. The schematic for quantifying the contributions of the prestressed tendons to the prestressing force for the three specimens is shown in Figure 21.
For the flexural capacity contributed by unbonded prestressed tendons, the calculation method proposed in the study of [48] can be referenced. The analytical formulation is expressed as follows:
M Rdp = f pu A p h p
where hp denotes distance of the lever arm from the centroid of the prestressing resultant force to the point of the flexural moment calculation point, the value of which is determined based on the geometric configuration illustrated in Figure 21, fpu denotes the ultimate stress of unbonded prestressed tendons, which is correlated with the initial effective prestress σpe and reinforcement ratio. Based on the methodology recommended in the study of [47], this parameter is calculated using 1.45σpe.

4.3.5. The Flexural Capacity of Specimens

To facilitate differentiation between distinct failure modes, this paper establishes the following identification procedure:
(1)
The Type 3 failure mode must first be isolated from the three categories, as it constitutes brittle failure and must be avoided.
The occurrence of this failure mode can be attributed to two factors based on experimental analysis: (a) the steel sleeve of the beam has greater stiffness due to the presence of stiffeners, while the precast beam has smaller stiffness; (b) the low-strength grade of the grouting material causes continuous crushing during cyclic loading.
Based on the above reasons, the failure criterion for this type of joint can be determined as follows: joint rotational stiffness Rki ≥ 40 kN∙m/rad while adopting grout material compressive strength fc ≤ 70 MPa.
(2)
Secondly, distinguish between the Type 1 and Type 2 failure modes. Both failure modes are acceptable and belong to ductile failure. Before failure occurs, there is an obvious premonitory indication.
The determination of these two modes can proceed from the perspective of theoretical calculation, separately calculating the moment value that can be provided at the steel sleeve section of the specimen and the moment value that can be provided at the precast concrete beam section of the specimen; by comparing the magnitudes of these two moment values, the determination can be made.
Through the above determination conditions, the schematic diagram of the determination process for distinguishing three failure modes can be obtained, as shown in the figure below (Figure 22):
The experimental and calculated flexural load capacities of the eight specimens are listed in Table 8.

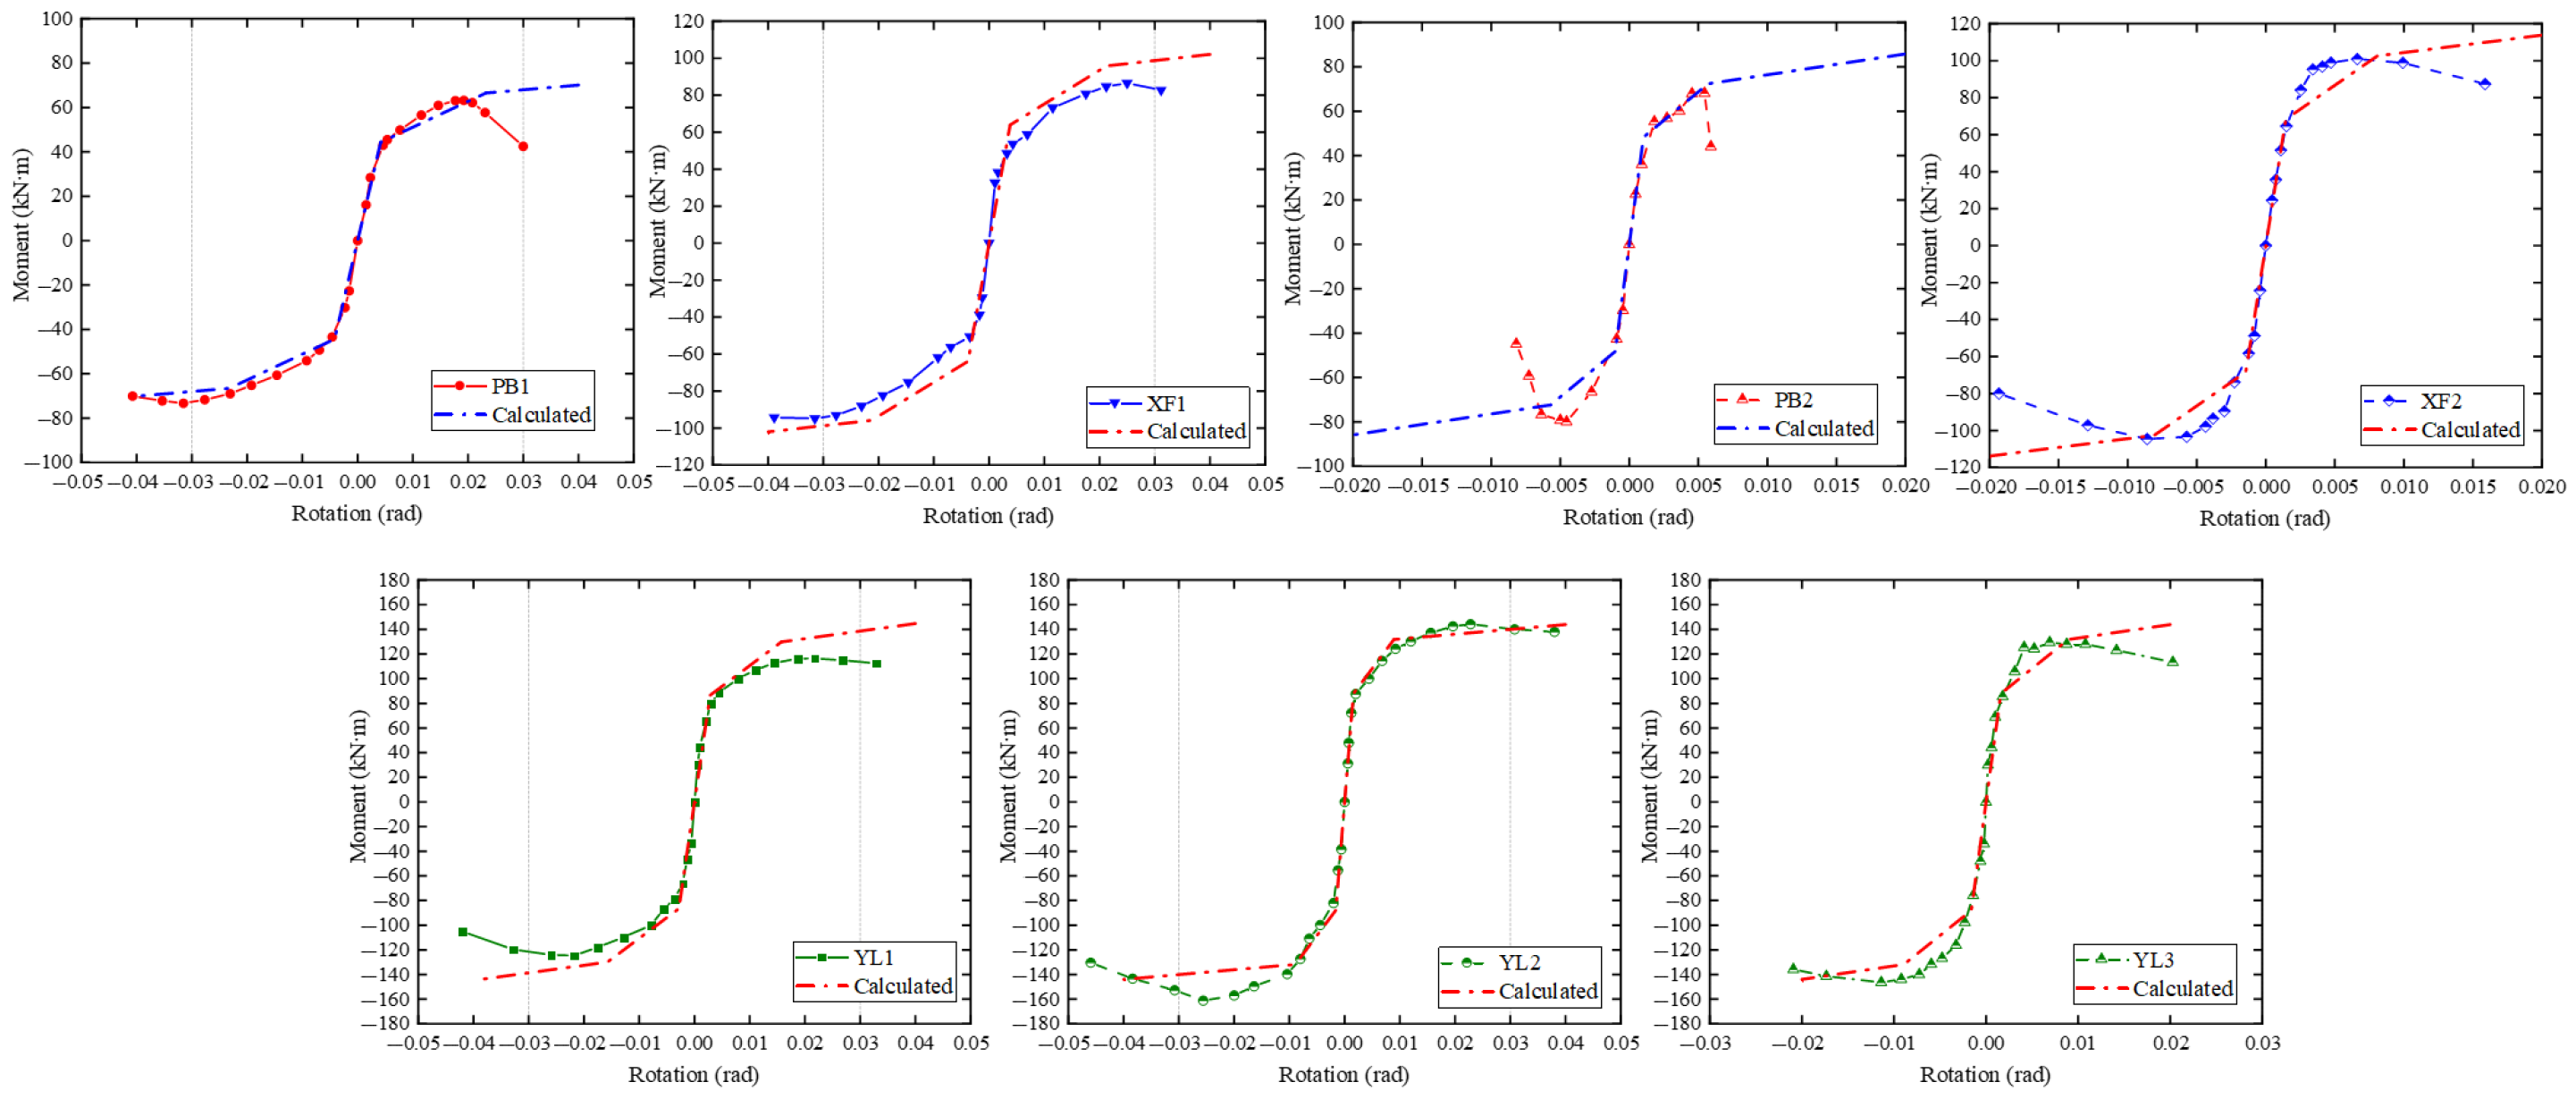
4.4. Curve Fitting Results of Moment–Rotation Relationship

The results derived from the fitting equation recommended in Eurocode 3 are presented in Figure 23.
All specimens demonstrate a satisfactory agreement between the experimental and theoretical results. The initial stiffness and peak load of the theoretical curves exhibit close correspondence with the experimental curves. Thus, the proposed moment–rotation hysteretic model based on Eurocode 3 is an effective methodology.

5. Discussion

This section will examine notable details and limitations present in this paper, with the expectation that future scholars may refine this work based on these foundations:
(1)
Firstly, discussions regarding the dimensions of components and variables involved in this paper: as the theoretical derivations were based on experimental studies, although theoretical calculation formulas were derived, their applicability to structures of all sizes and material strengths still requires verification through numerical simulations or supplementary tests. Moreover, the derived formulas incorporate certain assumptions and boundary conditions, such as the thickness of end plates in beam steel sleeves. Generally, thicker end plates increase bearing capacity; however, in this study, when end plate thickness exceeds a specific threshold, the failure plane shifts to the precast beam. Further increasing plate thickness under such conditions proves ineffective and uneconomical. Boundary conditions for plate thickness can be determined using the failure mode discrimination formula provided earlier, with the engineering practice limiting thickness to ≤30 mm.
(2)
Adopting the component method recommended by EC3 is a simplified method for deriving joint rotational stiffness. When simulating the refined nonlinear behavior of components and realistic progressive damage evolution processes under strong earthquakes, its modeling limitations are evident [49]. It simplifies complex physical interactions between components but struggles to precisely describe microscopic locations and physical mechanisms of damage.
(3)
Prestressing inherently limits energy dissipation due to non-yielding tendons with minimal plastic deformation capacity. While providing beneficial self-centering, this results in slender hysteresis loops with a reduced enclosed area (representing energy dissipated via inelastic processes). Optimization aims to augment energy dissipation without compromising stiffness/strength. Below are some effective methods considered by the authors: (a) Employing dedicated energy dissipation devices: As implemented with stiffeners in this paper, such devices impart energy dissipation capacity to the structure without altering its inherent characteristics. (b) Adopting shape memory alloys (SMAs): Utilizing the superplastic effect of SMAs. After unloading within a specific strain range, deformation can be almost fully recovered (superior self-centering capacity), while considerable energy is dissipated through phase transformation during cyclic loading (full hysteresis loops).
(4)
For the design and practical construction scenarios of the novel prefabricated frame structure proposed in this paper, C80 grout and stiffeners are critical elements. However, both indeed present generalizability concerns. For grout, increasing the strength grade typically reduces its fluidity. Thus, this paper recommends adopting pressure grouting methods in practical construction. Regarding stiffeners, while their presence provides excellent energy dissipation capacity, they cause difficulties in floor slab installation during construction. In subsequent research, the authors will further investigate floor slabs suitable for this joint type, such as precast notched slabs.

6. Conclusions

This paper investigates two innovative prefabricated structures: PSFRC and SSFRC. A critical feature is using bolts and steel sleeves in the joint regions to improve the joint’s stability and durability. Experimental tests and theoretical analyses were conducted, resulting in the following conclusions:
(1)
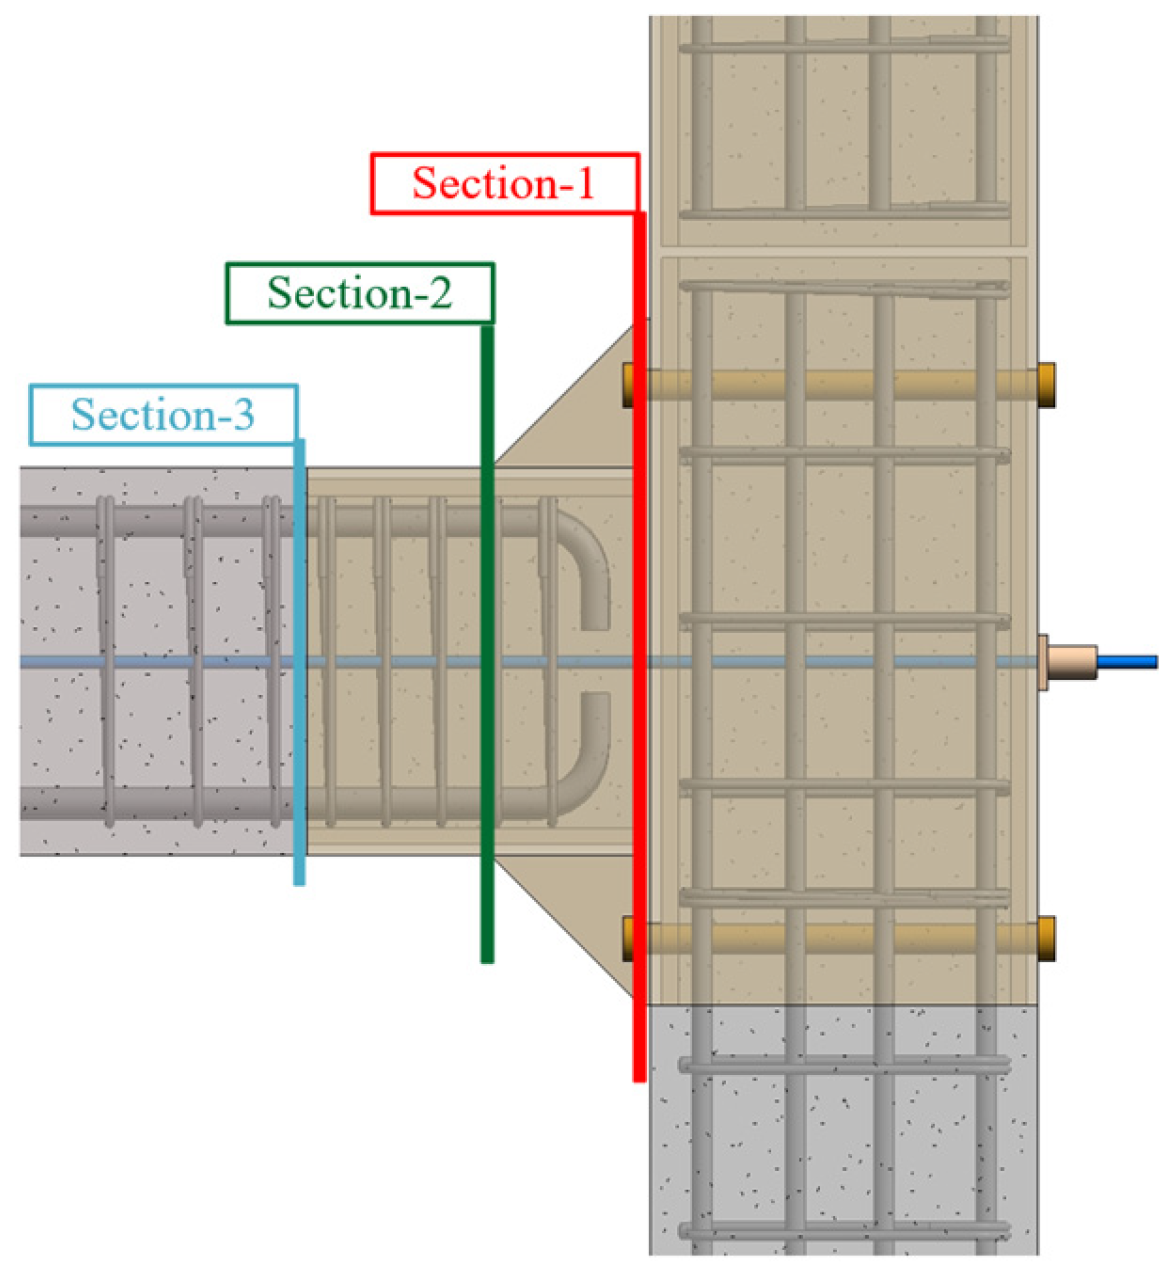
All specimens exhibited failure at the beam end in both rounds of tests, which is consistent with the design concept of strong columns and weak beams. The seismic performance test indicated three failure modes: (1) failure of the beam sleeve’s end plate, (2) failure of the variable cross-section of the prefabricated beam caused by the slip of the interface between the steel plate and the prefabricated beam, and (3) failure of prefabricated beams at the connection with the steel sleeves. Differences in the stiffnesses of the beam–steel sleeve–end-plate connections and in the bond between the beam–steel sleeve and the precast girder caused different failure modes. The third type of failure mode needs to be avoided.
(2)
Increasing the end-plate thickness of the SSFRC joints improved the load-bearing capacity and initial stiffness significantly. Specimen XF1 demonstrated a 35.41% higher ultimate load capacity and a 32.64% higher initial stiffness than specimen PB1. Specimens with C80-grade grout exhibited a 39.05% higher load capacity than those with lower-grade materials. Specimen PB2, constructed with C60-grade grout, failed prematurely due to an inadequate moment and shear transfer between the steel sleeve and precast beam. Specimen XF2 had a 219.08% higher initial stiffness than XF1, confirming the efficacy of stiffeners in enhancing joint rigidity.
(3)
Prestressing tendon configuration significantly affected PSFRC joint load capacity. YL2 (symmetrical double bundles) had 27.27% higher ultimate load than YL1 (single central bundle). While prestressing enhanced load capacity and stiffness, it reduced energy dissipation. Stiffeners proved critical: YL3 exhibited 13.47% and 47.97% higher energy dissipation than YL1 and YL2, respectively, plus 26.14% greater ductility coefficient than YL1.
(4)
The component method of Eurocode 3 was utilized to develop an analytical model for calculating the joint’s initial rotational stiffness, and a design equation for this parameter was subsequently derived. The moment resistance of the joints was systematically evaluated under different failure modes. Close agreement between theoretical and experimental results was demonstrated, providing empirical references for practical engineering applications.
(5)
This paper recommends a minimum grout strength of C80 and minimum stiffener dimensions of 100 mm × 100 mm. The use of higher-strength C80 grout can better bond the steel sleeve and precast beam together, so that the stress generated by the bending moment at the beam end can be better transmitted to the beam steel sleeve.

Author Contributions

Conceptualization, D.C.; Methodology, J.L., K.W., W.W., H.Y., H.Z. and C.J.; Investigation, J.L., K.W., W.W., H.Y., H.Z. and C.J.; Resources, D.C.; Writing—original draft, J.L.; Writing—review & editing, J.L. All authors have read and agreed to the published version of the manuscript.

Funding

The authors would like to thank the financial support provided by the National Natural Science Foundation of China (Grant 52378201), Yangzhou Science and Technology Plan Project (YZ2024223), and the Yangzhou City-Yangzhou University Cooperation to Create a Science and Technology Innovation Platform for New Prefabricated Building Structures 2022 (YZZP202201).

Data Availability Statement

The original contributions presented in this study are included in the article. Further inquiries can be directed to the corresponding author.

Conflicts of Interest

Author Houcun Zou was employed by the company Jiangsu Yangjian Group Co., Ltd. Author Changhong Jiang was employed by the company China Construction Civil Engineering Co., Ltd. The remaining authors declare that the research was conducted in the absence of any commercial or financial relationships that could be construed as a potential conflict of interest.

References

  1. Dong, Y.; Qin, T.Y.; Zhou, S.Y.; Huang, L.; Bo, R.; Guo, H.B.; Yin, X.Z. Comparative Whole Building Life Cycle Assessment of Energy Saving and Carbon Reduction Performance of Reinforced Concrete and Timber Stadiums-A Case Study in China. Sustainability 2020, 12, 1566. [Google Scholar] [CrossRef]
  2. Guo, J.; Zhang, X.W.; Cui, Y.H. Estimation of Fatigue Parameters and Life Prediction for Orthotropic Steel Deck Based on Reverse Markov Theory. J. Struct. Eng. 2025, 151, 04025037. [Google Scholar] [CrossRef]
  3. Nie, G.; Wang, W.; Zhang, C.X.; Zhi, X.D.; Liu, K. Seismic evaluation of isolation performance on single layer cylindrical reticulated shells supported along four sides. Eng. Struct. 2024, 301, 117279. [Google Scholar] [CrossRef]
  4. Yao, C.H.; Liu, J.P.; Li, J.; Chen, Y.F. Shear behavior of thin-walled concrete-filled steel tubular columns. Eng. Struct. 2024, 314, 118357. [Google Scholar] [CrossRef]
  5. Zhou, H.M.; Shao, X.Y.; Zhang, J.W.; Yao, H.C.; Liu, Y.H.; Tan, P.; Chen, Y.Y.; Xu, L.; Zhang, Y.; Gong, W. Real-time hybrid model test to replicate high-rise building resonant vibration under wind loads. Thin-Walled Struct. 2024, 197, 111559. [Google Scholar]
  6. Lacey, A.W.; Chen, W.; Hao, H.; Bi, K. Structural response of modular buildings–An overview. J. Build. Eng. 2018, 16, 45–56. [Google Scholar] [CrossRef]
  7. Ferdous, W.; Bai, Y.; Ngo, T.D.; Manalo, A.; Mendis, P. New advancements, challenges and opportunities of multi-storey modular buildings–A state-of-the-art review. Eng. Struct. 2019, 183, 883–893. [Google Scholar] [CrossRef]
  8. Aghasizadeh, S.; Tabadkani, A.; Hajirasouli, A. Environmental and economic performance of prefabricated construction: A review. Environ. Impact Assess. Rev. 2022, 97, 106897. [Google Scholar] [CrossRef]
  9. Wen, Y.F. Research on the intelligent construction of prefabricated building and personnel training based on BIM5D. J. Intell. Fuzzy Syst. 2021, 40, 8033–8041. [Google Scholar] [CrossRef]
  10. Wang, Y.L.; Li, Y.L.; Zhuang, J.X. Research on the green development path of prefabricated building industry based on intelligent technology. Eng. Constr. Archit. Manag. 2024; ahead-of-print. [Google Scholar] [CrossRef]
  11. Bao, Y.X.; Xiang, C.Y. Integration of BIPV technology with modular prefabricated building-A review. J. Build. Eng. 2025, 102, 111940. [Google Scholar] [CrossRef]
  12. Zhang, Z.W.; Li, D.; Wang, H.J.; Qian, H.L.; Fang, W.Q.; Jing, X.F.; Fan, F. Study of mechanical properties of a novel column-beam-column prefabricated steel frame joint. Adv. Steel Constr. 2024, 20, 330–344. [Google Scholar]
  13. Yang, H.; Wu, J.; Guo, Z. Experimental research on seismic performance of dry-wet combined precast concrete beam-to-column connections. J. Build. Eng. 2024, 91, 109716. [Google Scholar] [CrossRef]
  14. Ghayeb, H.H.; Sulong, N.H.R.; Razak, H.A.; Mo, K.H.; Ismail, Z.; Hashim, H.; Gordan, M. A review of the seismic performance behaviour of hybrid precast beam-to-column connections. Arch. Civ. Mech. Eng. 2022, 23, 35. [Google Scholar] [CrossRef]
  15. Ren, H.H.; Bahrami, A.; Cehlin, M.; Wallhagen, M. A state-of-the-art review on connection systems, rolling shear performance, and sustainability assessment of cross-laminated timber. Eng. Struct. 2024, 317, 118552. [Google Scholar] [CrossRef]
  16. Priestley, M.J.N.; Sritharan, S.; Conley, J.R.; Pampanin, S. Preliminary results and conclusions from the PRESSS five-story precast concrete test building. PCI J. 1999, 44, 42. [Google Scholar] [CrossRef]
  17. Priestley, M.J.N. Overview of PRESSS Research Program. PCI J. 1991, 36, 50–57. [Google Scholar] [CrossRef]
  18. Priestley, M.J.N.; Tao, J.R. Seismic Response of Precast Prestressed Concrete Frames with Partially Deboned Tendons. PCI J. 1993, 38, 58–69. [Google Scholar] [CrossRef]
  19. Liu, B.K.; Song, M.R.; Jiang, Y.Q.; Huang, S.J.; Zhou, A. Experimental study on seismic performance of post-tensioned precast prestressed concrete frame. J. Build. Struct. 2011, 32, 24–32. [Google Scholar]
  20. Chong, X.; Meng, S.P.; Pan, Q.J.; Zhang, L.Z. Research on seismic behavior of partially unbonded precast prestressed concrete frames and beam-column subassemblies. J. Earthq. Eng. Eng. Vib. 2007, 4, 55–60. [Google Scholar]
  21. Cai, X.N.; Meng, S.P.; Sun, W.W. Experimental study on behaviors of beam-column connections for self-centering post-tensioned precast frame. China Civ. Eng. J. 2012, 45, 29–45. [Google Scholar]
  22. Reinhardt, H.W. Demountable concrete structures—An energy and material saving building concept. Int. J. Sustain. Mater. Struct. Syst. 2012, 1, 18. [Google Scholar] [CrossRef]
  23. Aninthaneni, P.K.; Dhakal, R.P.; Marshall, J.; Bothar, J. Experimental investigation of “dry” jointed precast concrete frame sub-assemblies with steel angle and tube connections. Build. Earthq. Eng. 2020, 18, 3659–3681. [Google Scholar] [CrossRef]
  24. Wang, K.H.; Li, Z.Y.; Rong, B.; Zhang, R.Y.; Sun, Y.L.; Zhang, W.C.; Wu, H.L. Experimental and numerical research on hysteretic behavior of bolted end-plate connections. Structures 2025, 73, 108397. [Google Scholar] [CrossRef]
  25. Morgen, B.G.; Kurama, Y.C.; Asce, M. Seismic Design of Friction-Damped Precast Concrete Frame Structures. J. Struct. Eng. 2007, 133, 1501–1511. [Google Scholar] [CrossRef]
  26. San, B.B.; Xu, S.Z.; Shan, Z.W.; Chen, W.; Daniel, T.W.L. Investigation on probability model of bending moment-rotation relationship for bolt-ball joints. J. Constr. Steel Res. 2025, 226, 109193. [Google Scholar] [CrossRef]
  27. Park, S.; Clayton, P.; Williamson, E.B.; Helwig, T.A.; Engelhardt, M.D. Cyclic moment-rotation model for bolted double-angle connections with composite floor systems. J. Build. Eng. 2024, 96, 110460. [Google Scholar] [CrossRef]
  28. Ma, K.; Ye, X.H.; Wu, R.Y.; Yu, H.F.; Wang, Z.; Jin, T.J.; Ji, W.J.; Zhao, Y. Seismic behavior and initial rotational stiffness of beam-to-column composite connection in steel frame. Structures 2024, 62, 106069. [Google Scholar] [CrossRef]
  29. BS EN 1993-1-8; Eurocode 3: Design of Steel Structures-Part 1–8: Design of Joints. European Committee for Standardization: Brussels, Belgium, 2004.
  30. Xue, H.Y.; Ashour, A.; Ge, W.J.; Cao, D.F.; Sun, C.Z.; Cao, S.Q. Seismic response of prestressed precast reinforced concrete beam-column joints assembled by steel sleeves. Eng. Struct. 2023, 276, 115328. [Google Scholar] [CrossRef]
  31. Liu, J.Q.; Cao, D.F.; Wang, K.; Zhou, Y.L.; Xue, H.Y. Study on seismic performance of prestressed fabricated reinforced concrete frame structure assembled by steel sleeves. Eng. Struct. 2025, 322, 119222. [Google Scholar] [CrossRef]
  32. Wang, X.; Wan, P.P.; Zhu, Z.Y.; Wang, K.; Cao, D.F.; Yang, Y.; Yang, D.D.; Zhang, L.F. Research on seismic performance of new prestressed precast beam-column sleeve concrete frame joints. Structures 2024, 61, 105954. [Google Scholar] [CrossRef]
  33. GB/T 50152-2012; Standard for Test Method of Concrete Structures. China Architecture and Building Press: Beijing, China, 2012.
  34. GB/T50448-2008; Code for Application Technique of Cementitious Grout. China Planning Press: Beijing, China, 2008.
  35. GB/T 50081-2019; Standard for Test Methods of Concrete Physical and Mechanical Properties. China Architecture and Building Press: Beijing, China, 2019.
  36. GB/T 228.1-2021; Metallic materials-Tensile Testing-Part 1:Method of Test at Room Temperature. Standards Press of China: Beijing, China, 2021.
  37. JGJ/T 101-2015; Specification of Seismic Test of Buildings. China Architecture and Building Press: Beijing, China, 2015.
  38. Bagheri, M.; Jamkhaneh, M.E.; Samali, B. Effect of Seismic Soil-Pile-Structure Interaction on Mid- and High-Rise Steel Buildings Resting on a Group of Pile Foundations. Int. J. Geomech. 2018, 18, 04018103.1–04018103.27. [Google Scholar] [CrossRef]
  39. Kulkarni, S.A.; Li, B.; Yip, W.K. Finite element analysis of precast hybrid-steel concrete joints under cyclic loading. J. Constr. Steel Res. 2008, 64, 190–201. [Google Scholar] [CrossRef]
  40. Ghayeb, H.H.; Razak, H.A.; Sulong, R.N.R. Seismic performance of innovative hybrid precast reinforced concrete beam-to-column joints. Eng. Struct. 2020, 202, 109886. [Google Scholar] [CrossRef]
  41. Guo, Z.H.; Shi, X.D. Reinforced Concrete Theory and Analyze; Tsinghua University Press: Beijing, China, 2006. [Google Scholar]
  42. Zhao, J.H.; Fan, J.H.; Gao, W.Q. Calculation model for initial rotational stiffness of steel beam to concrete-filled steel tube column joints with extended end-plate. J. Build. Struct. 2021, 42, 103–111. [Google Scholar]
  43. Castro, J.M.; Elghazouli, A.Y.; Izzuddin, B.A. Modelling of the panel zone in steel and composite moment frames. Eng. Struct. 2005, 27, 129–144. [Google Scholar] [CrossRef]
  44. Kim, K.-D.; Engelhardt, M.D. Monotonic and cyclic loading models for panel zones in steel moment frames. J. Constr. Steel Res. 2002, 58, 605–635. [Google Scholar] [CrossRef]
  45. Shi, G.; Shi, Y.J.; Wang, Y.Q. Calculation method on Moment-Rotation curves of Beam-to-column semirigid end-plate connections. Eng. Mech. 2006, 23, 67–73. [Google Scholar] [CrossRef]
  46. Pampanin, S. PRESSS Design Handbook; New Zealand Concrete Society: Wellington, New Zealand, 2010. [Google Scholar]
  47. GB 50010-2010; Code for design of concrete structures. China Architecture and Building Press: Beijing, China, 2010.
  48. Lv, Z.T. Modern Prestressed Structure System and Design Method; Phoenix Publishing Press: Nanjing, China, 2010. [Google Scholar]
  49. Asgari, A.; Bagheri, M.; Hadizadeh, M. Advanced seismic analysis of soil-foundation-structure interaction for shallow and pile foundations in saturated and dry deposits: Insights from 3D parallel finite element modeling. Structures 2024, 69, 107503. [Google Scholar] [CrossRef]
Figure 1. Schematic of prefabricated beam–column joints.
Buildings 15 02504 g001
Figure 2. Schematic of the novel beam–column joints.
Buildings 15 02504 g002
Figure 3. Details of PSFRC and SSFRC joints.
Buildings 15 02504 g003
Figure 4. Dimensions and details of test specimens (unit: mm).
Buildings 15 02504 g004
Figure 5. Fabrication process of test specimens.
Buildings 15 02504 g005
Figure 6. Loading device of the test.
Buildings 15 02504 g006
Figure 7. Loading regime of the test.
Buildings 15 02504 g007
Figure 8. Specific failure patterns of specimens.
Buildings 15 02504 g008
Figure 9. Load–displacement hysteresis curves of specimens.
Buildings 15 02504 g009
Figure 10. Skeleton curves of specimens.
Buildings 15 02504 g010
Figure 11. Stiffness coefficient of specimens.
Buildings 15 02504 g011
Figure 13. The temporal evolution of the prestressing force of the PSFRC joint specimens.
Buildings 15 02504 g013
Figure 14. Moment–rotation curves of structural joints.
Buildings 15 02504 g014
Figure 15. Initial rotational stiffness of structural joints.
Buildings 15 02504 g015
Figure 16. The schematic diagram of the force-deformation mechanism in the joint core zone.
Buildings 15 02504 g016
Figure 17. The computational diagrams for two end-plate configurations.
Buildings 15 02504 g017
Figure 18. Diagram of the joint’s rotational stiffness.
Buildings 15 02504 g018
Figure 19. The cross-section for different failure conditions.
Buildings 15 02504 g019
Figure 20. The schematic diagram of equivalent T-piece mode.
Buildings 15 02504 g020
Figure 21. The schematic for quantifying the contributions of the prestressed tendons.
Buildings 15 02504 g021
Figure 22. Flowchart of determination under different failure conditions.
Buildings 15 02504 g022
Figure 23. Computed and Experimental Moment–Rotation Curves.
Buildings 15 02504 g023
Table 1. Size parameters of the specimens.
SpecimenJoint TypePrestressing TendonSteel Plate Thickness (mm)Length of Stiffening Rib (mm)Grade of High-Strength Grouts
PB1SSFRC/10/C60
PB2SSFRC/10100C60
XF1SSFRC/12/C80
XF2SSFRC/12135C80
YL1PSFRC1 × 0.45 fptk12/C80
YL2PSFRC2 × 0.45 fptk12/C80
YL3PSFRC1 × 0.45 fptk12135C80
XJcast-in-place////
Table 2. Concrete properties.
SpecimenCube Compressive Strength (MPa)Axial Compressive Strength (MPa)Modulus of Elasticity (GPa)
C4048.9037.1034.36
Table 3. High-strength grout properties.
SpecimenCube Compressive Strength (MPa)Paste Fluidity (mm)
C6067.30334
C8085.50322
Table 4. Material properties of steel materials.
ComponentsDiameter and Thickness
(mm)
Yield Strength
(MPa)
Ultimate Strength
(MPa)
Elastic Modulus
(GPa)
M27 bolt27935.201035.00206.10
Steel plate10401.00510.00205.00
Steel bars8442.20541.30204.00
16445.00533.40203.20
18436.00522.00201.50
Table 5. The characteristic value of the load capacity of specimens.
SpecimenLoad DirectionPy
(kN)
Pu
(kN)
Pu/PyAverage
(Pu/Py)
XJPositive56.0462.541.111.10
Negative55.7860.871.09
PB1Positive38.2046.141.211.20
Negative42.9351.351.20
PB2Positive43.0949.681.151.13
Negative49.5355.071.11
XF1Positive51.3361.801.201.21
Negative55.5767.811.22
XF2Positive65.3672.111.101.11
Negative66.6174.691.12
YL1Positive71.585.81.201.21
Negative72.289.11.23
YL2Positive89.4107.61.201.21
Negative94.1115.21.22
YL3Positive89.498.01.091.13
Negative85.7100.31.17
Table 6. The ductility coefficient of the load capacity of specimens.
SpecimenLoad DirectionΔy
(mm)
Δu
(mm)
μAverage
(μ)
PB1Positive16.7159.773.583.53
Negative20.4670.083.48
PB2Positive9.8530.063.053.09
Negative7.8324.563.13
XF1Positive16.8757.703.423.40
Negative17.3358.583.38
XF2Positive14.7057.763.923.97
Negative14.1356.754.01
YL1Positive20.0272.323.613.52
Negative21.1372.253.42
YL2Positive21.8587.944.024.18
Negative20.0687.104.34
YL3Positive15.7172.204.594.44
Negative16.8972.444.29
XJPositive13.3472.135.415.39
Negative13.7573.845.37
Table 7. Comparison of calculated results with test values.
SpecimenExperimental Value
(kN∙m/rad)
Calculated Value
(kN∙m/rad)
Calculated Value/Experimental ValueErrors
PB111.0310.620.96 4%
PB243.8847.061.07 7%
XF114.6316.731.14 14%
XF247.4847.060.99 1%
YL131.2730.580.98 2%
YL242.3942.391.00 1%
YL350.8654.781.08 8%
Table 8. Experimental and calculated flexural load capacities.
SpecimenExperimental Value
(kN∙m)
Calculated Value
(kN∙m)
Calculated Value/Experimental ValueErrors
PB170.3366.550.955%
PB273.5372.390.982%
XF194.9895.821.011%
XF2102.28102.601.011%
YL1120.00129.901.088%
YL2152.51148.900.973%
YL3137.50131.810.964%
Disclaimer/Publisher’s Note: The statements, opinions and data contained in all publications are solely those of the individual author(s) and contributor(s) and not of MDPI and/or the editor(s). MDPI and/or the editor(s) disclaim responsibility for any injury to people or property resulting from any ideas, methods, instructions or products referred to in the content.

