Article

Research on the Deterioration Mechanism of PPF Mortar-Masonry Stone Structures Under Freeze–Thaw Conditions

1
College of Civil Engineering, Hebei University of Architecture, Zhangjiakou 075000, China
2
Hebei Innovation Center of Transportation Infrastructure in Cold Region, Zhangjiakou 075000, China
3
Hebei Academy of Building Research, Shijiazhuang 050227, China
4
Railway Engineering Research Institute, China Academy of Railway Sciences Corporation Limited, Beijing 100081, China
5
State Key Laboratory for Track Technology of High-Speed Railway, Beijing 100081, China
*
Author to whom correspondence should be addressed.
Buildings 2025, 15(14), 2468; https://doi.org/10.3390/buildings15142468
Submission received: 27 May 2025 / Revised: 28 June 2025 / Accepted: 11 July 2025 / Published: 14 July 2025

Abstract

Significant progress has been made in the low-temperature toughness and crack resistance of polypropylene fiber-reinforced composites. However, there is still a gap in the research on damage evolution under freeze–thaw cycles and complex stress ratios. To solve the problem of durability degradation of traditional rubble masonry in cold regions, this paper focuses on the study of polypropylene fiber-mortar-masonry blocks with different fiber contents. Using acoustic emission and digital image technology, the paper conducts a series of tests on the scaled-down polypropylene fiber-mortar-masonry structure, including uniaxial compressive tests, three-point bending tests, freeze–thaw cycle tests, and tests with different stress ratios. Based on the Kupfer criterion, a biaxial failure criterion for polypropylene fiber mortar-masonry stone (PPF-MMS) was established under different freeze–thaw cycles. A freeze–thaw damage evolution model was also developed under different stress ratios. The failure mechanism of PPF-MMS structures was analyzed using normalized average deviation (NAD), RA-AF, and other parameters. The results show that when the dosage of PPF is 0.9–1.1 kg/m3, it is the optimal content. The vertical stress shows a trend of increasing first and then decreasing with the increase in the stress ratio, and when α = 0.5, the degree of strength increase reaches the maximum. However, the freeze–thaw cycle has an adverse effect on the internal structure of the specimens. Under the same number of freeze–thaw cycles, the strength of the specimens without fiber addition decreases more rapidly than that with fiber addition. The NAD evolution rate exhibits significant fluctuations during the middle loading period and near the damage failure, which can be considered precursors to specimen cracking and failure. RA-AF results showed that the specimens mainly exhibited tensile failure, but the occurrence of tensile failure gradually decreased as the stress ratio increased.

1. Introduction

MMS (mortar-masonry stone) is widely used in engineering fields such as slope protection due to its numerous advantages, including cost-effectiveness and ease of construction [1,2]. According to national data, the seasonal freezing zone in China accounts for approximately 49.6% of the total area. As a result, MMS slope protection structures are extensively applied in China’s cold and seasonal freezing regions. These structures are susceptible to varying degrees of freeze–thaw damage. Additionally, MMS has a relatively high brittleness, which can easily lead to cracking during use and affect slope stability. Adding fibers is a widely recognized method to improve the structural performance of MMS [3,4]. PPF, known for its high strength and toughness, can enhance MMS’s crack resistance and improve its mechanical properties [5,6]. In recent years, several studies [7,8,9] have investigated PPF reinforcement, finding that PPF performs well and exhibits excellent freeze–thaw resistance. It has been widely applied as a reinforcement material in modifying silicate materials. Furthermore, some researchers [10,11,12,13,14] have studied the mechanical properties of materials with added PPF through uniaxial compression, four-point bending tests, splitting tensile strength, and SHPB impact tests. Wu Jian [15] studied the effects of different fiber dosages on compressive strength, porosity, and low-temperature performance. Shi Jianzhe [16] clarified the mechanical behaviors of fiber-reinforced cement-based composites and fiber-reinforced polymers in infrastructure, concluding that PPF can effectively improve the mechanical properties of materials and enhance the deformation resistance of silicate materials.
In practical MMS slope protection structures, the stones are typically subjected to biaxial or other complex stress states, which may lead to damage or failure under pressure [17,18]. Therefore, Zhou et al. [19] studied the mechanical properties of concrete specimens with different strengths under uniaxial and biaxial loading, finding that biaxial loading significantly improves strength compared with uniaxial compression strength and establishing a biaxial loading failure criterion. Cheng [20] combined freeze–thaw cycles with different lateral pressures and concluded that lateral pressure increases the peak stress of MMS, but freeze–thaw cycles accelerate the failure process of specimens. Li et al. [21] further examined biaxial tests under five different stress ratio loading conditions and found that when the stress ratio exceeds 0.7, the biaxial strength exhibits a negative effect. However, most of the studies were conducted on specimens at ambient temperature, and research on the impact of freeze–thaw cycles on the strength and mechanical properties of specimens remains limited. Therefore, it is necessary to study the mechanical properties of stone masonry under cold conditions.
The damage to structures during the loading process is gradual, and traditional testing methods do not accurately reflect the damage characteristics of MMS during loading. Therefore, non-destructive testing techniques have been widely applied to monitor the entire loading process continuously. Some researchers commonly use digital image correlation (DIC) and acoustic emission (AE) technologies for detection due to their high sensitivity and wide resolution, making them broadly applicable in monitoring specimen deformation, structural damage, and crack development [22,23,24,25]. For instance, Chen et al. [26] proposed a two-step extended digital image correlation method to directly measure full-field displacements with discontinuous displacement fields and validated that this method can be used for measuring and analyzing deformation fields in certain discontinuous regions. Gajewski et al. [27] combined inverse analysis with DIC to determine the fracture mechanical parameters of concrete. Skarzynski et al. [28] used DIC to measure the three-dimensional deformation of beam surfaces and studied the effects of length and aggregate size on crack length. Golewski [29] employed DIC technology to determine the critical stress intensity factor and the critical crack tip opening displacement of concrete, thereby assessing the fracture toughness under Mode I loading. Chen Chen et al. [30] utilized AE technology to evaluate the fracture damage characteristics of concrete under three-point bending tests, and based on energy evolution principles, they verified the relationship between crack energy evolution and AE energy evolution, establishing a crack damage function. Yang Liyun et al. [31] used AE signals to identify the fracture mode of basalt fiber-reinforced concrete. Xargay et al. [32] studied the effects of different experimental variables on AE damage and evaluated the relationship between failure behavior and damage levels of beams. Additionally, some researchers have combined AE and DIC to analyze the failure mechanisms of cement-based composite materials [33,34,35,36,37]. During the loading process, the stone masonry structure may undergo cracking and eventual structural failure, exhibiting substantial differences between its pre-damage and post-damage states. To study the actual damage condition of the specimens, this study combines digital image correlation (DIC) and acoustic emission (AE) technologies for experimental analysis.
This paper systematically investigates PPF-MMS using DIC and AE technologies. The study encompasses uniaxial compressive tests, durability assessments, three-point bending tests, and experiments involving various stress ratios under freeze–thaw cycling conditions. The impact of different freeze–thaw cycles and loading methods on the durability and mechanical performance of PPF-MMS is explored, and the damage evolution mechanism is analyzed. The biaxial failure criteria of polypropylene fiber mortar rubble under different freeze–thaw cycle times are explored as well.

2. Materials and Methods

2.1. Experimental Materials

Based on existing research, granite is selected as the coarse aggregate for the scaled model of MMS [38], as it exhibits the highest structural strength when used as a masonry stone aggregate. The particle size of the masonry stone aggregate in practical engineering applications should be around 160 mm. Based on the similarity theory in model scaling [39], the particle size of the granite aggregate is 50–60 mm. The basic mechanical properties of granite are shown in Table 1. The cement used is PO 42.5 cement produced by Jinyu Cement Factory, with the cement parameters provided in Table 2. Based on existing scholarly research [40], the length of polypropylene fibers also affects the mechanical properties of the specimen. When the length of the PPF is 16 mm, the specimen strength is the highest. Therefore, 16 mm PPF is chosen as the reinforcing material in this study, and its basic properties are shown in Table 3.

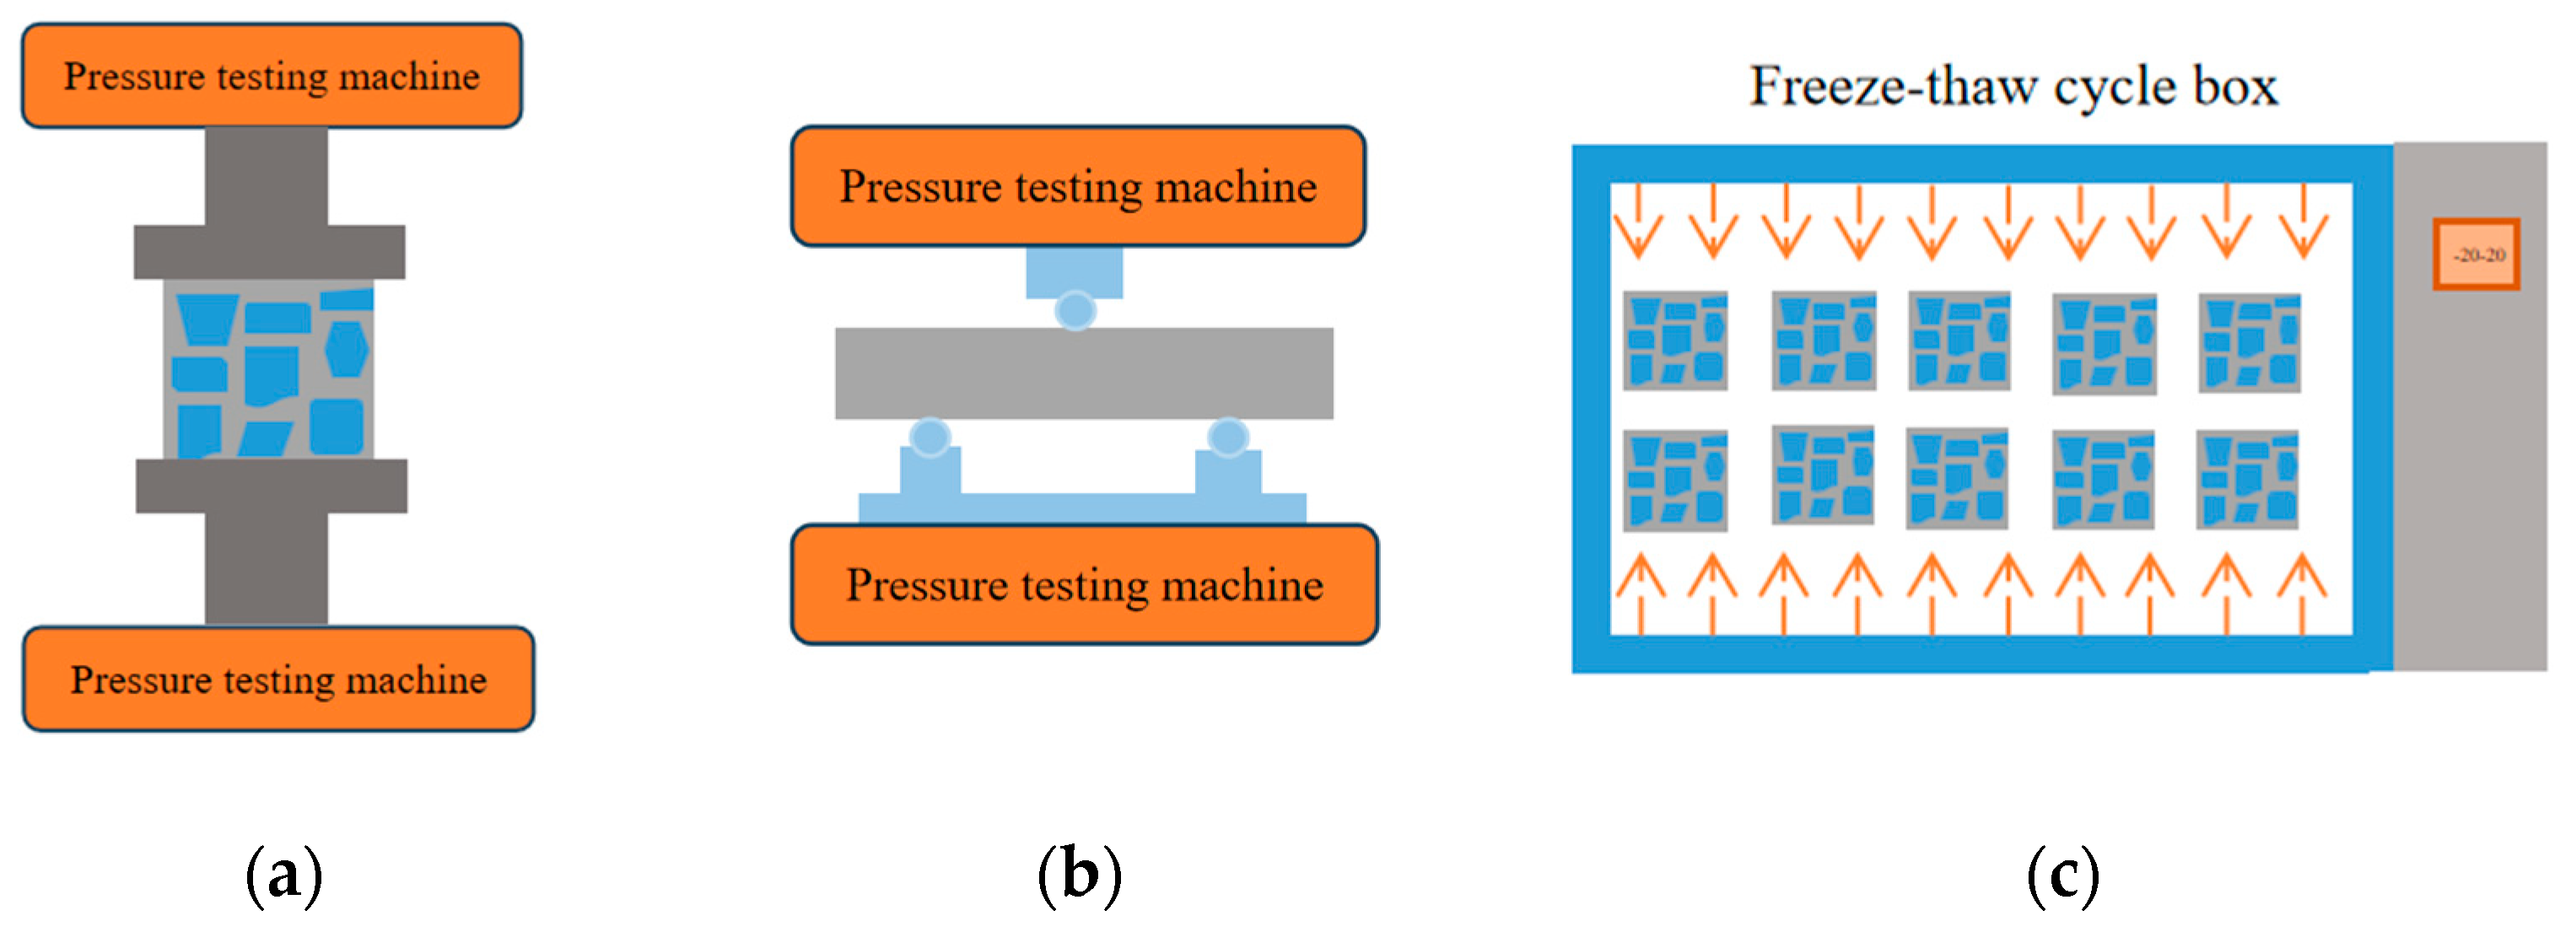
2.2. Testing Methods’ Experimental Design

Taking the volume of the specimen as a standard, polypropylene fiber contents of 0.5 kg/m3, 0.75 kg/m3, 1 kg/m3, 1.25 kg/m3, and 1.5 kg/m3 were selected for the experiment. Uniaxial compression tests, three-point bending tests, and freeze–thaw cycle tests were conducted on the stone masonry specimens with different PPF contents. The test results were recorded, and the optimal PPF content was determined. Then, the characteristics of the PPF stone masonry specimens with the optimal fiber content were comprehensively evaluated under different stress ratio loading conditions. Among them, three specimens are set for each test condition. The test results are determined by taking the average of the three specimens. When the difference between the maximum and minimum strength values and the median value in a group of specimens does not exceed 15% of the median value, it is used as the basis for calculating the average value. The material dosage of the specimens is presented in Table 4. The specific experimental processes are illustrated in Figure 1 and Figure 2, and the detailed experimental scheme is presented in Table 5. In the table, specimens with different fiber contents will undergo four different freeze–thaw cycle times. In the loading tests with different stress ratios, specimens with each loading ratio will also have four different freeze–thaw cycle times.
Specimen preparation process: The cement and sand were mixed in a mixer for 1 min. Then, the polypropylene fibers were added and dispersed, followed by another 1 min mixing to ensure uniform dispersion. After adding the appropriate amount of water, the mixture was stirred for 2 min to form a mortar and fiber mixture. The stone masonry molds were sized 300 mm × 300 mm × 80 mm and 400 mm × 100 mm × 100 mm (rectangular. Granite stone aggregates were placed into the molds, ensuring that the proportion of stone aggregates was 70%. The mortar–fiber mixture was then poured into the molds and compacted using a vibrating table. According to the preparation standards, the specimens were left to stand for 24 h before demolding and placed in a standard curing room for 28 days.
After curing, the specimens were dried, weighed, and placed in a high–low temperature alternating humidity and heat test chamber. The temperature settings were based on the average environmental temperatures (ranging from −20 °C to 20 °C) during the spring and winter seasons in North China, with a 24 h cycle, where the freezing and thawing times were set to 12 h each. The freeze–thaw cycles were set to 0, 40, 80, and 120 cycles. After the freeze–thaw process, the specimens were allowed to dry, and their mass loss rate was measured. The mass loss rate was calculated according to the following Equation (1):
Δ W = m 0 m n m 0 × 100 %
where ΔW is the mass loss rate of the mortar rubble specimen after n freeze–thaw cycles, %; m0 is the mass of the mortar rubble specimen before the freeze–thaw cycles, g; and mn is the mass of the mortar rubble specimen after n freeze–thaw cycles, g.
Mechanical tests were conducted following the standard experimental procedures. The compressive strength tests were conducted using an electro-hydraulic servo pressure testing machine with a loading rate of 0.5 mm/min, as shown in Figure 1a. A WAW-600 universal testing machine manufactured by Jinan Zhongluchang Co., Ltd. in Jinan, China, was used for the bending tests. The specimens were placed in the machine for flexural strength testing, with a loading rate of 0.5 mm/min until failure occurred, as shown in Figure 1b.
For the different stress ratio loading tests, both horizontal and vertical loading were applied simultaneously. The horizontal and vertical directions were loaded at a ratio of σxz = 0.25, 0.5, 0.75, and 1. The vertical direction was loaded at 40 kN/min, while the horizontal direction was loaded at 10 kN/min, 20 kN/min, 30 kN/min, and 40 kN/min, corresponding to the predefined ratios. The compressive strength at different stress ratios was determined. The loading schematic is shown in Figure 3.

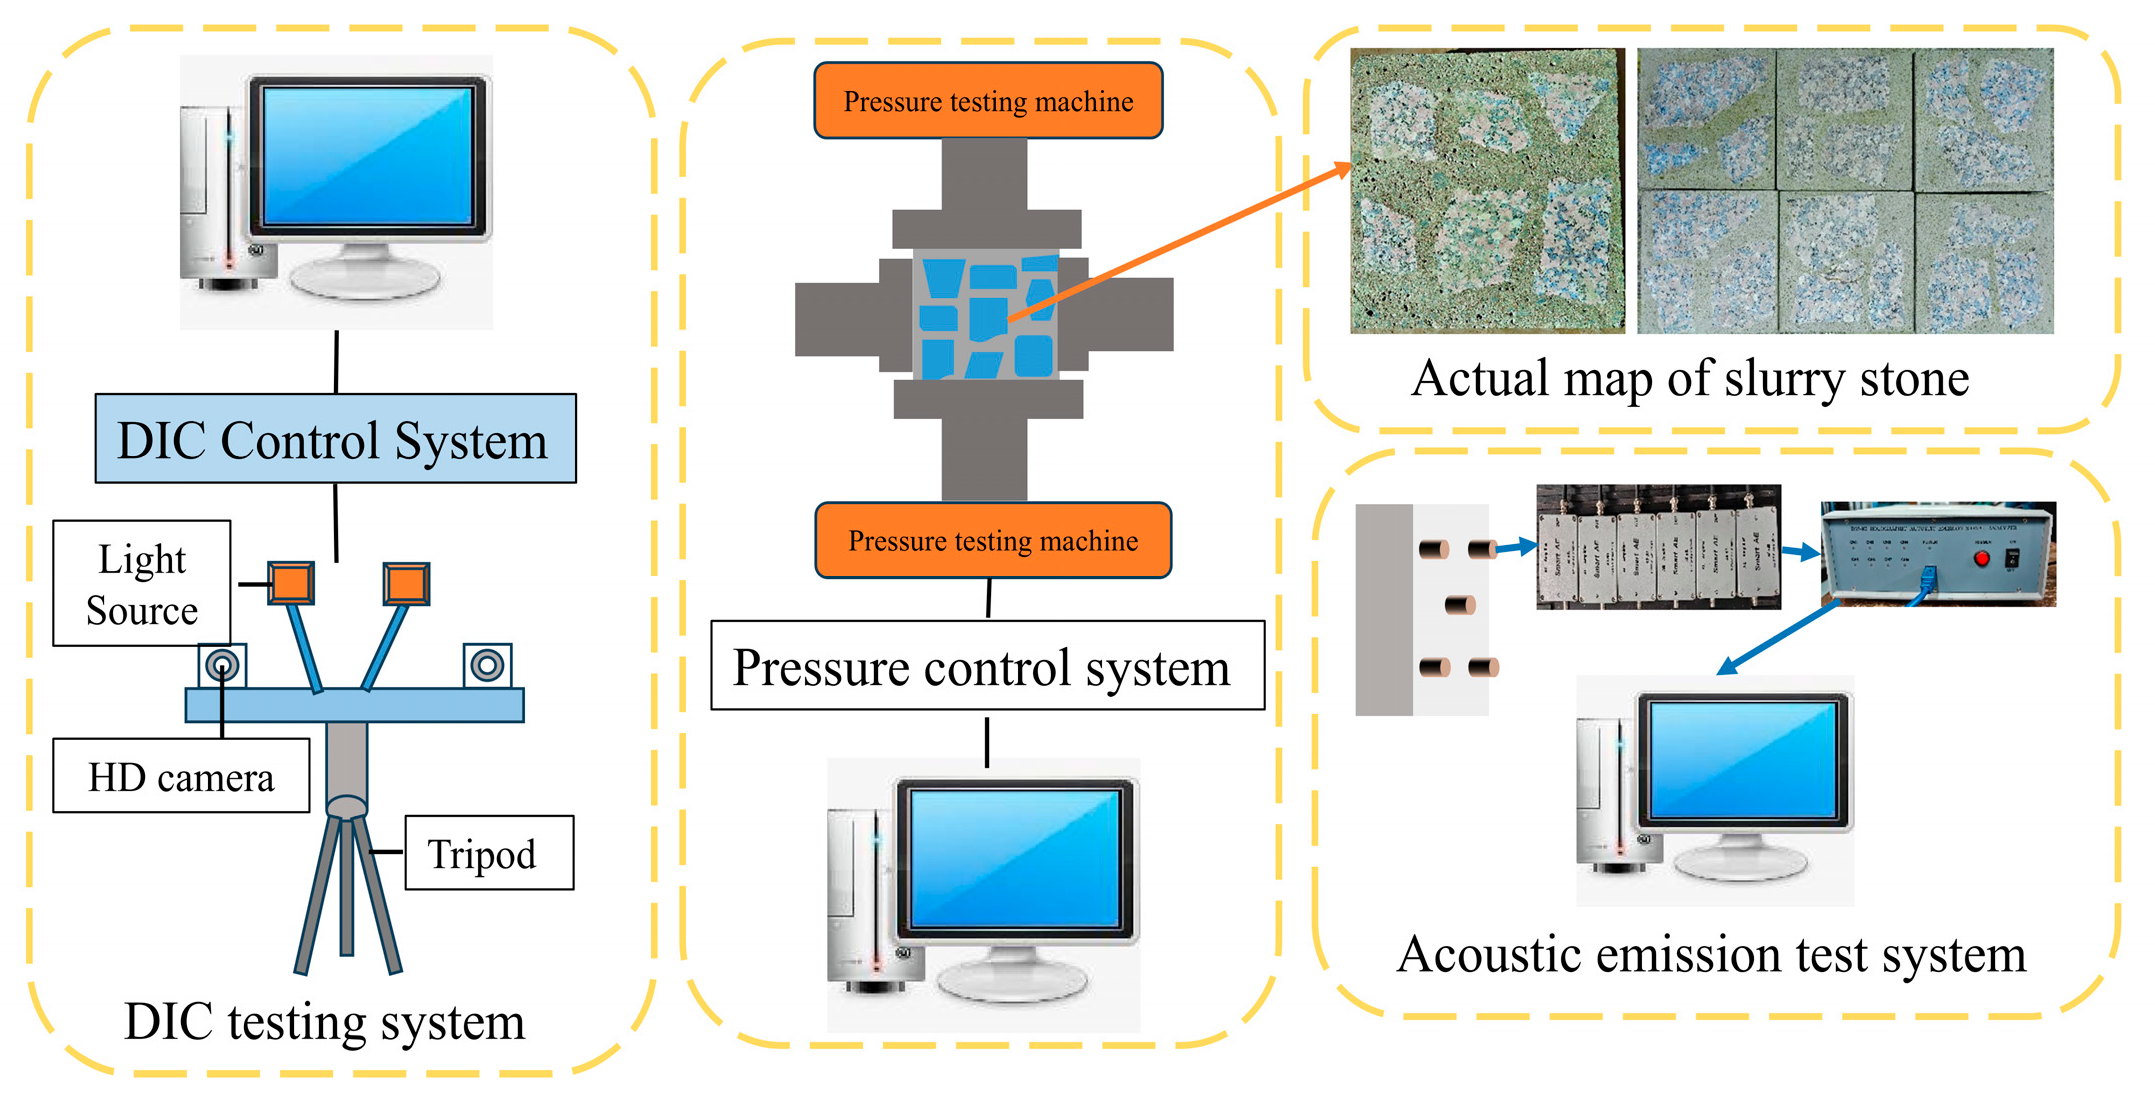
2.3. Testing Methods

2.3.1. DIC Test Method Acoustic Emission Test Method

The three-dimensional strain testing system is a high-precision, non-contact full-range strain measurement instrument produced by Shenzhen Xintuo 3D Co., Ltd. in Shenzhen, China. It can achieve real-time monitoring and analysis of the surface strain of materials and obtain the deformation information of specimens, and calculate by using Equation (2) to obtain the displacement and strain on the material surface. The DIC test system mainly consists of five parts: the digital image processing system, the control box, the lens, the pan-tilt, the tripod, and the light source. The main parameters of the three-dimensional speckle digital image correlation test system are shown in Table 6.
ε xx = 1 2 2 u x + u x 2 + v x 2 ε yy = 1 2 2 u y + u y 2 + v y 2 ε zz = 1 2 2 u z + u z 2 + v z 2
where εxx represents the transverse strain, εyy represents the longitudinal strain, εzz represents the shear strain, u represents the X-axis displacement field, and v is the displacement field on the Y-axis.

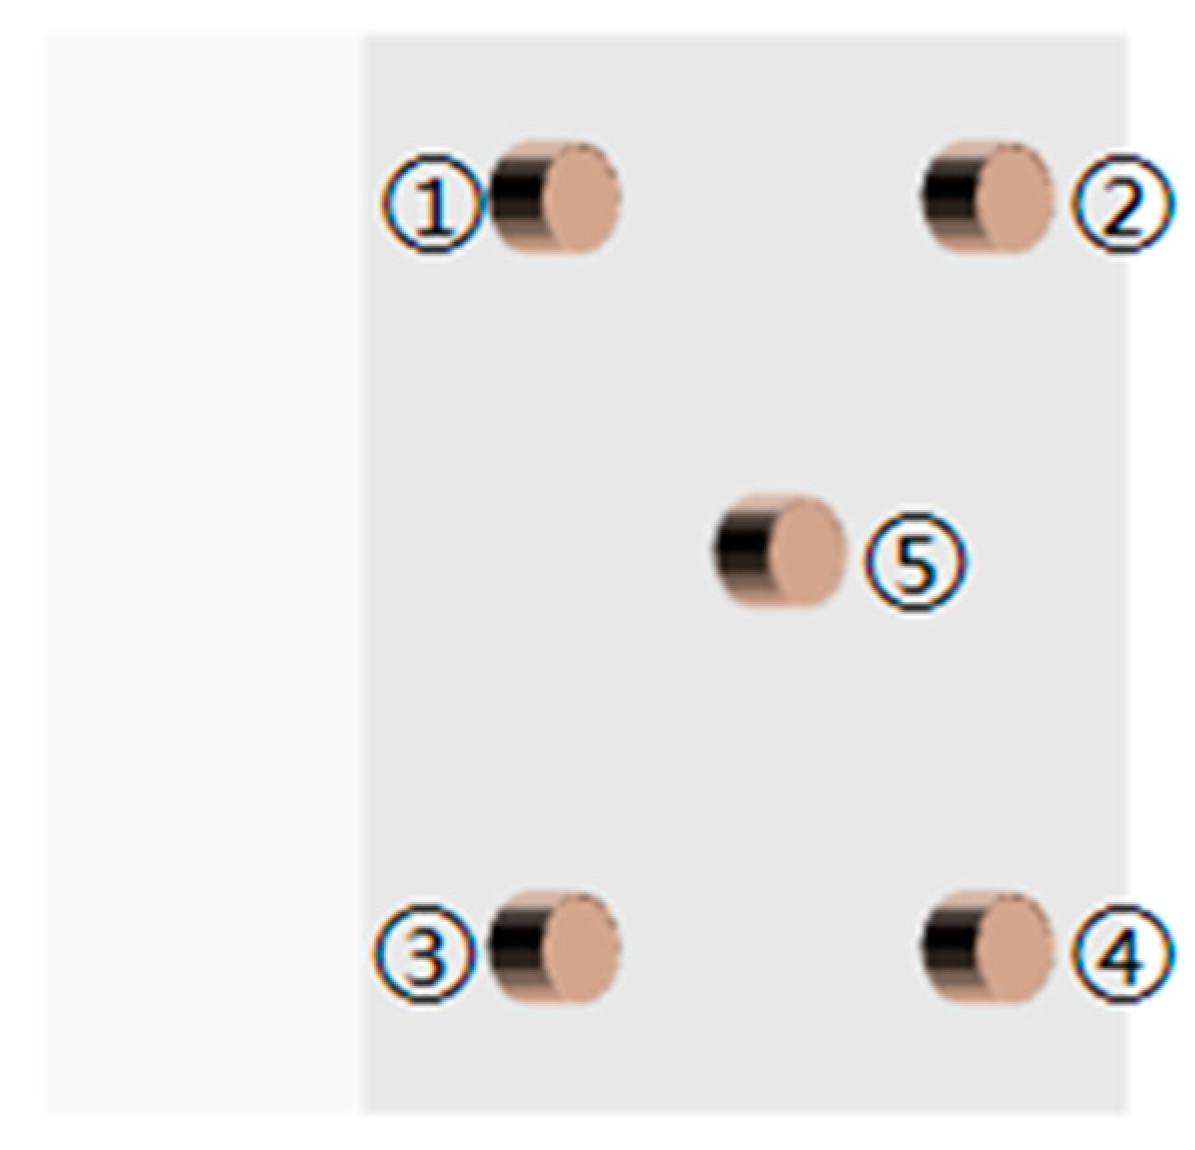
2.3.2. Acoustic Emission Test Method

Acoustic emission monitoring equipment is a dynamic monitoring method for monitoring the emission energy of the test piece itself. Compared with traditional test monitoring methods, acoustic emission technology can monitor weaker signals. Multiple parameters of acoustic emission data can be obtained. The main parameters are set as shown in Table 7. The instrument mainly consists of four parts: the DS-8A acoustic emission signal analyzer, the preamplifier, the sensor, and the computer system. Considering the rationality of the sensor distance in combination with the size of the specimen to enhance the acoustic emission positioning effect and reasonably reduce the sensor positioning error, five channels were adopted for acoustic emission monitoring in this experiment. A layout diagram of the acoustic emission sensor channels is shown in Figure 4.

3. Results and Analysis

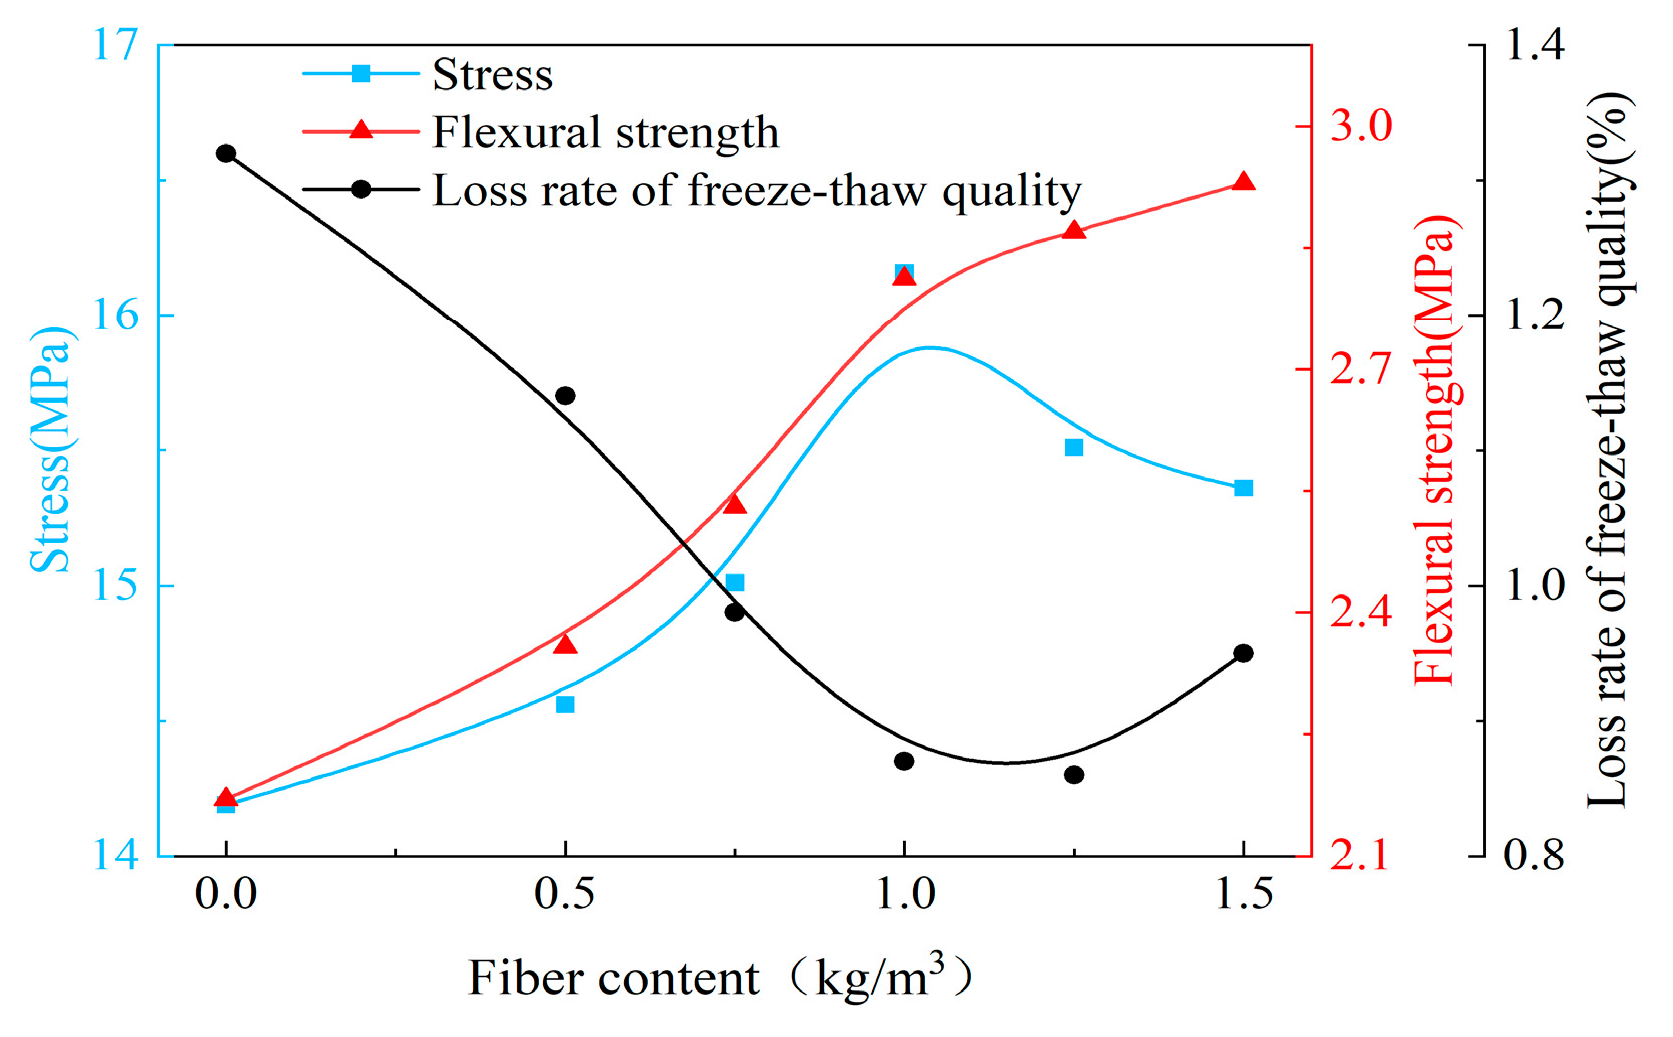
3.1. Study on the Optimal Fiber Content

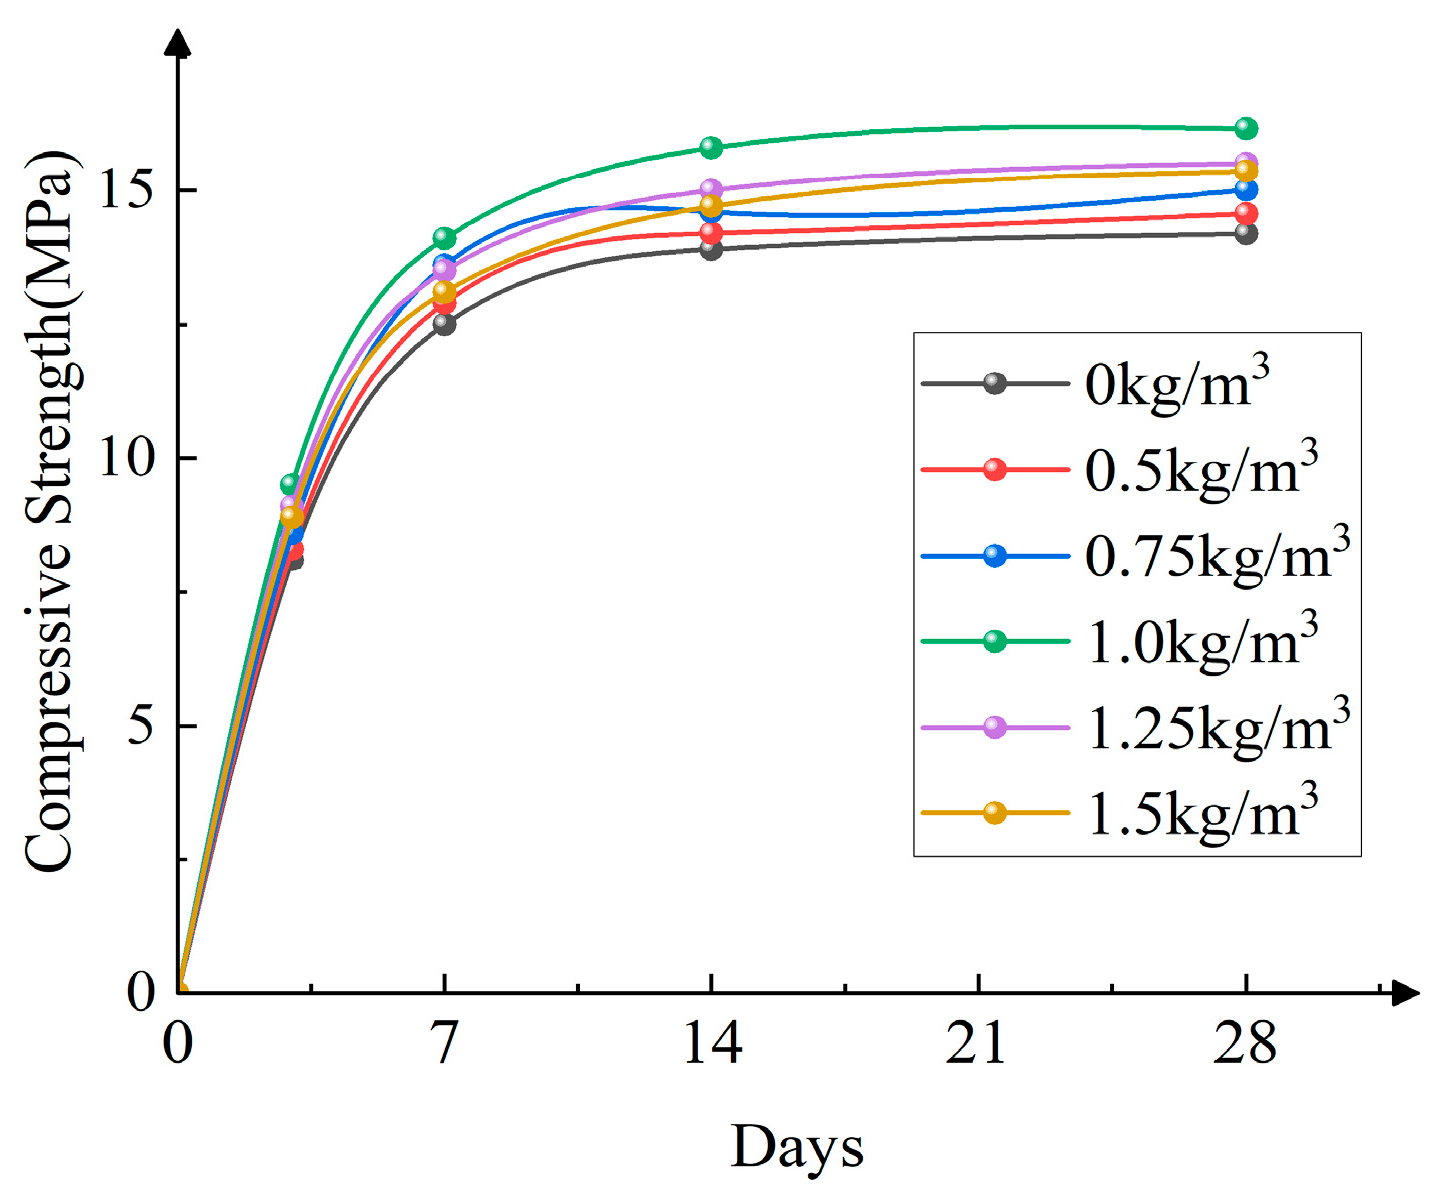
3.1.1. Analysis of Uniaxial Compression Test Results

As shown in Figure 5, the uniaxial ultimate compressive strength curves of MMS with different PPF contents are presented. The specimen without fiber was used as the control group, with a compressive strength of 14.19 MPa. As the PPF content increased, the compressive strength of the MMS gradually increased. At fiber contents of 0.5 kg/m3 and 0.75 kg/m3, the compressive strengths were 14.56 MPa and 15.01 MPa, respectively, showing improvements of about 2.61% and 5.78% compared with the control group. When the fiber content reached 1 kg/m3, the compressive strength peaked at 16.16 MPa, representing a 13.89% improvement over the control group. This enhancement can be attributed to the increased fiber content, which effectively filled the voids between mortar particles and promoted densification, thereby significantly improving the compressive performance of the MMS specimens. Additionally, the polypropylene fibers in the mortar-masonry stone specimens contributed to energy loss through fiber rupture and pullout, further improving the compressive strength.
However, when the fiber content exceeded 1 kg/m3, the compressive strength of the MMS slightly decreased. At fiber contents of 1.25 kg/m3 and 1.5 kg/m3, the compressive strengths were 15.51 MPa and 15.36 MPa, showing increases of about 9.30% and 8.25%, respectively, compared with the control group. Nevertheless, compared with the peak compressive strength, there was a decrease of approximately 4.20% and 4.95%. This reduction can be attributed to forming fiber clumps within the mortar as the fiber content increases. These clumps diminished the adhesion between mortar particles and compromised the structural stability, resulting in lower compressive strength of the specimens.
The study shows that adding polypropylene fibers contributes to an increase in the strength of MMS, generally presenting a trend of first increasing and then decreasing. However, the strength of the fiber-added mortar-masonry stone specimens remains higher than that of the control group. This trend is because PPF has specific frictional properties, which help bear part of the loading pressure. When the load is transferred from the mortar to the polypropylene fibers, the fibers deform and absorb some of the applied pressure, increasing the load at which the MMS specimens crack and reducing the degree of failure of the specimens.

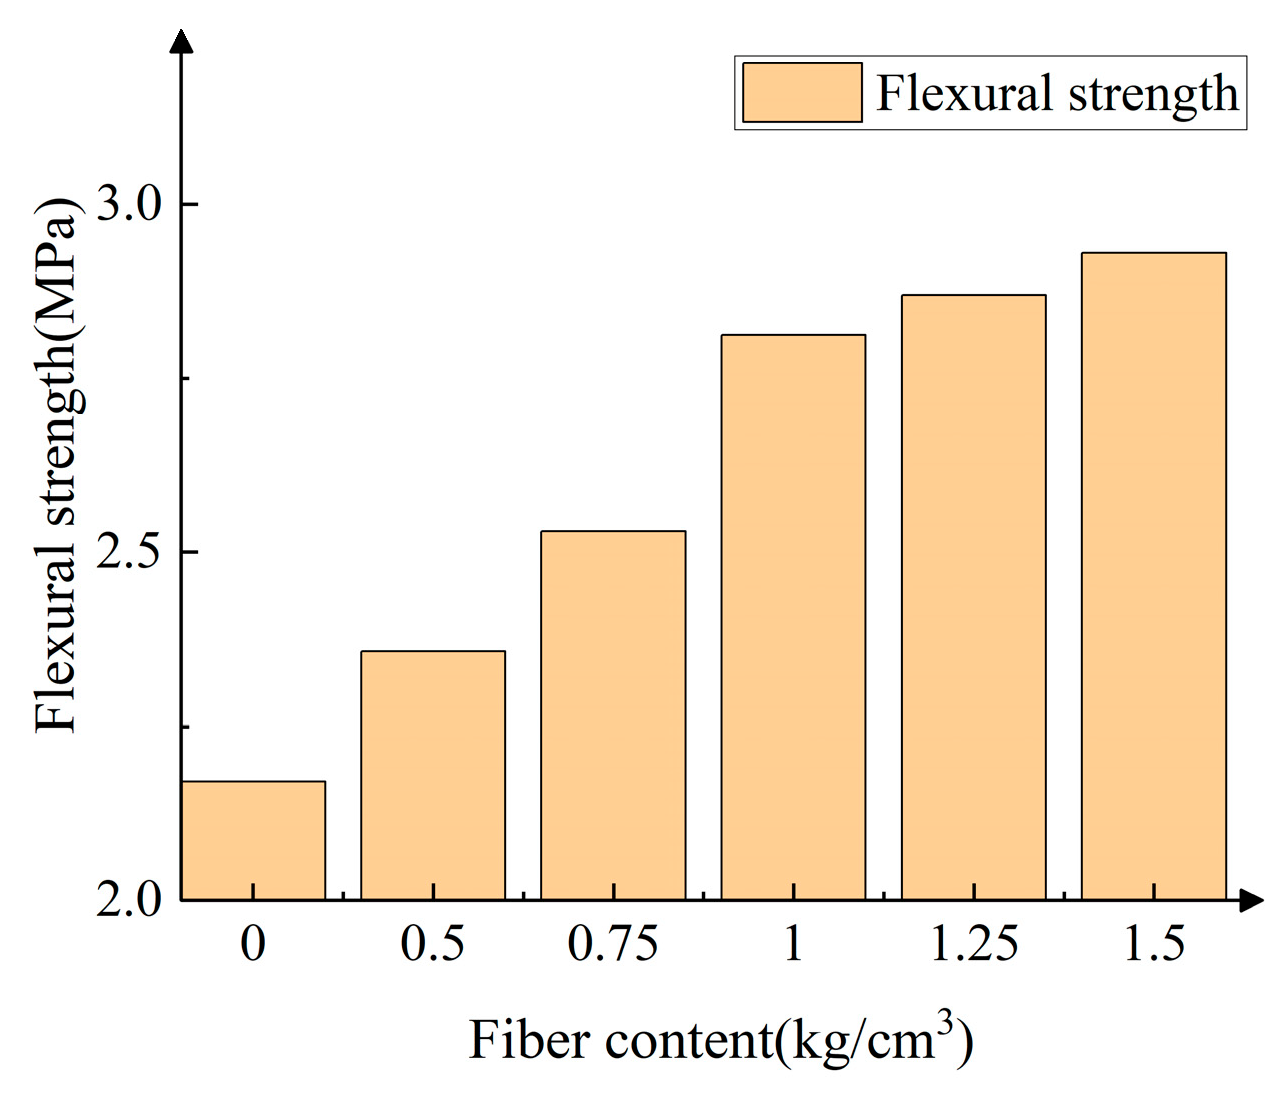
3.1.2. Flexural Strength Study

The bending test results of mortar-masonry stone with different PPF contents are shown in Figure 6. The experiment shows that the bending strength continuously increases as the fiber content increases. When the fiber content reaches 1.5 kg/cm3, the bending strength attains (2.93 Mpa) its peak value, approximately 35.02% higher than the specimens without fibers (2.17 Mpa). However, when the PPF content exceeds 1 kg/cm3, the increase in bending strength noticeably decreases, indicating that the addition of PPF positively affects the bending performance of the mortar masonry. PPF can effectively enhance the bonding ability between the mortars. However, as the fiber content increases, it indirectly reduces the bonding strength between the mortars, leading to internal defects in the specimen, which ultimately results in a decrease in the increase in the bending strength of the specimen.
The photos of the specimens after bending failure are shown in Figure 7. By observing the failure interface of the specimens, it is evident that the cracking of the aggregate is not noticeable or does not occur. It can be concluded that the bending failure mode of the PPF-MMS is primarily interfacial failure.

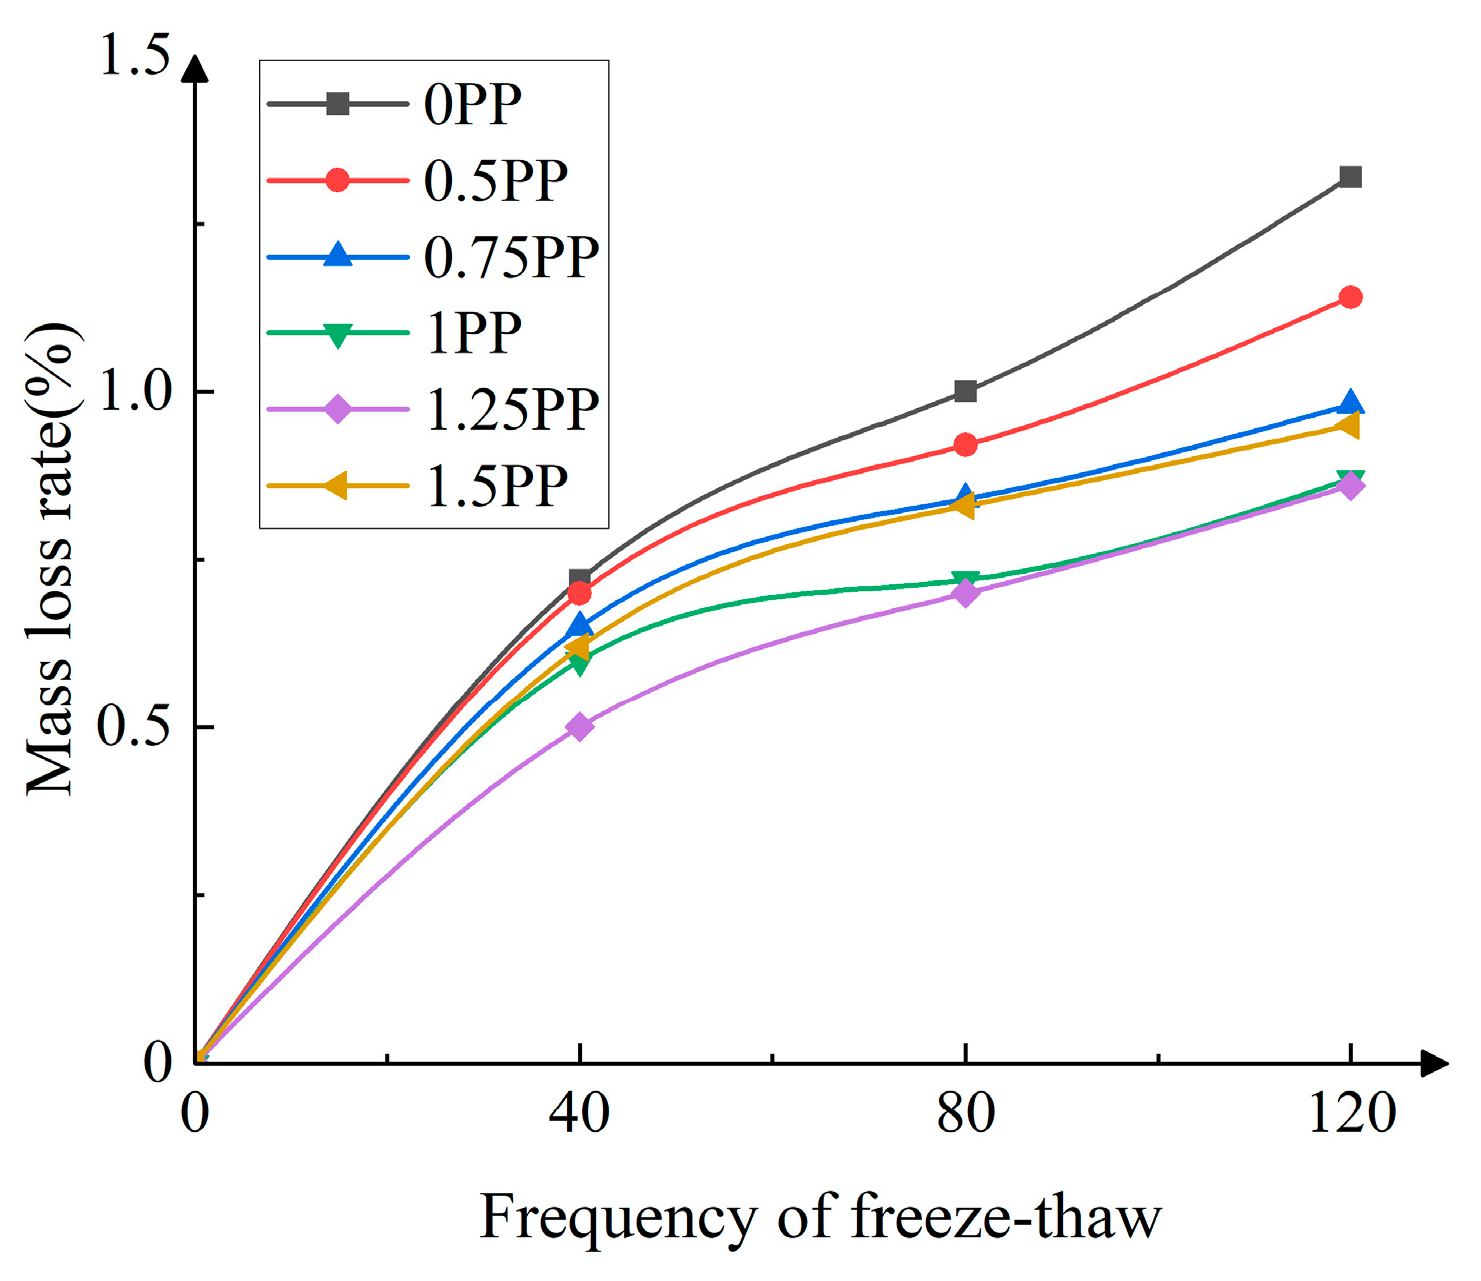
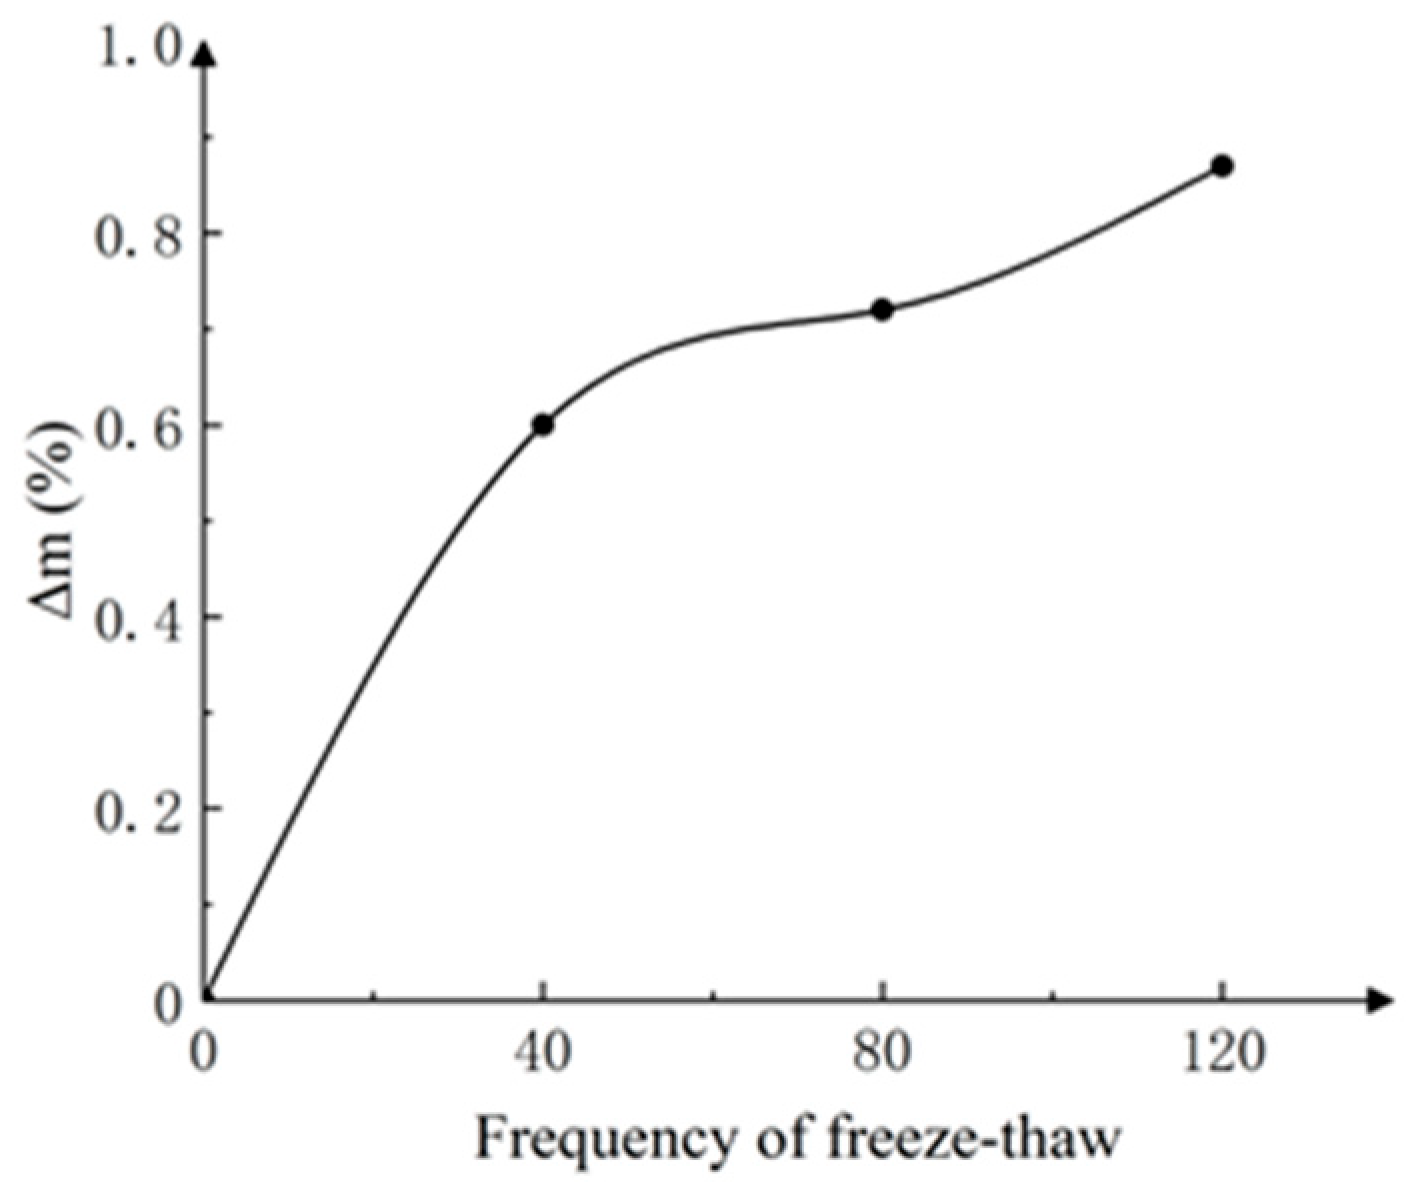
3.1.3. Freeze–Thaw Mass Loss

After conducting freeze–thaw cycles on the mortar-masonry stone with different PPF contents, the mass of the specimens was measured. The average mass loss rate of the specimens concerning the number of freeze–thaw cycles is shown in Figure 8.
The experimental results indicate that as the number of freeze–thaw cycles increases, the PPF-MMS demonstrates a progressively higher mass loss rate across various fiber content levels. Compared with unreinforced stone masonry, the mass loss rate of polypropylene fiber-reinforced stone masonry with a fiber dosage of 1.0 kg/m3 is reduced by approximately 34.09%. When a small amount of fiber is added, the mass loss rate of the PPF-MMS decreases. However, when the fiber content reaches 1 kg/m3, the mass loss rate of the specimen gradually increases. This phenomenon can be attributed to internal voids within the specimen. The freeze–thaw cycles contribute to the continuous formation and propagation of microcracks, ultimately leading to increased mortar degradation. Adding PPF enhances the bonding between the mortars, reducing the mass loss rate. However, as the fiber content increases, fiber agglomeration becomes more prevalent, diminishing the bonding performance between the mortar and fibers. This ultimately results in an increased mass loss rate of the specimen.

3.1.4. Optimal Fiber Content

The effect of different fiber contents on the performance of the MMS is shown in Figure 9. Considering multiple aspects, such as the compressive strength, flexural strength, and freeze–thaw mass loss rate of the PPF-MMS, the optimal fiber content should be between 0.9 and 1.1 kg/m3. At this optimal dosage, both the compressive and flexural strengths of the MMS are significantly improved, and the mass loss rate after freeze–thaw cycles is relatively low, resulting in better durability of the specimen. Moreover, as the fiber content increases, the compressive and flexural strengths of the specimen show an increasing trend, while the freeze–thaw mass loss rate shows a decreasing trend. It indicates a strong correlation between the mechanical properties and durability of the PPF-MMS.

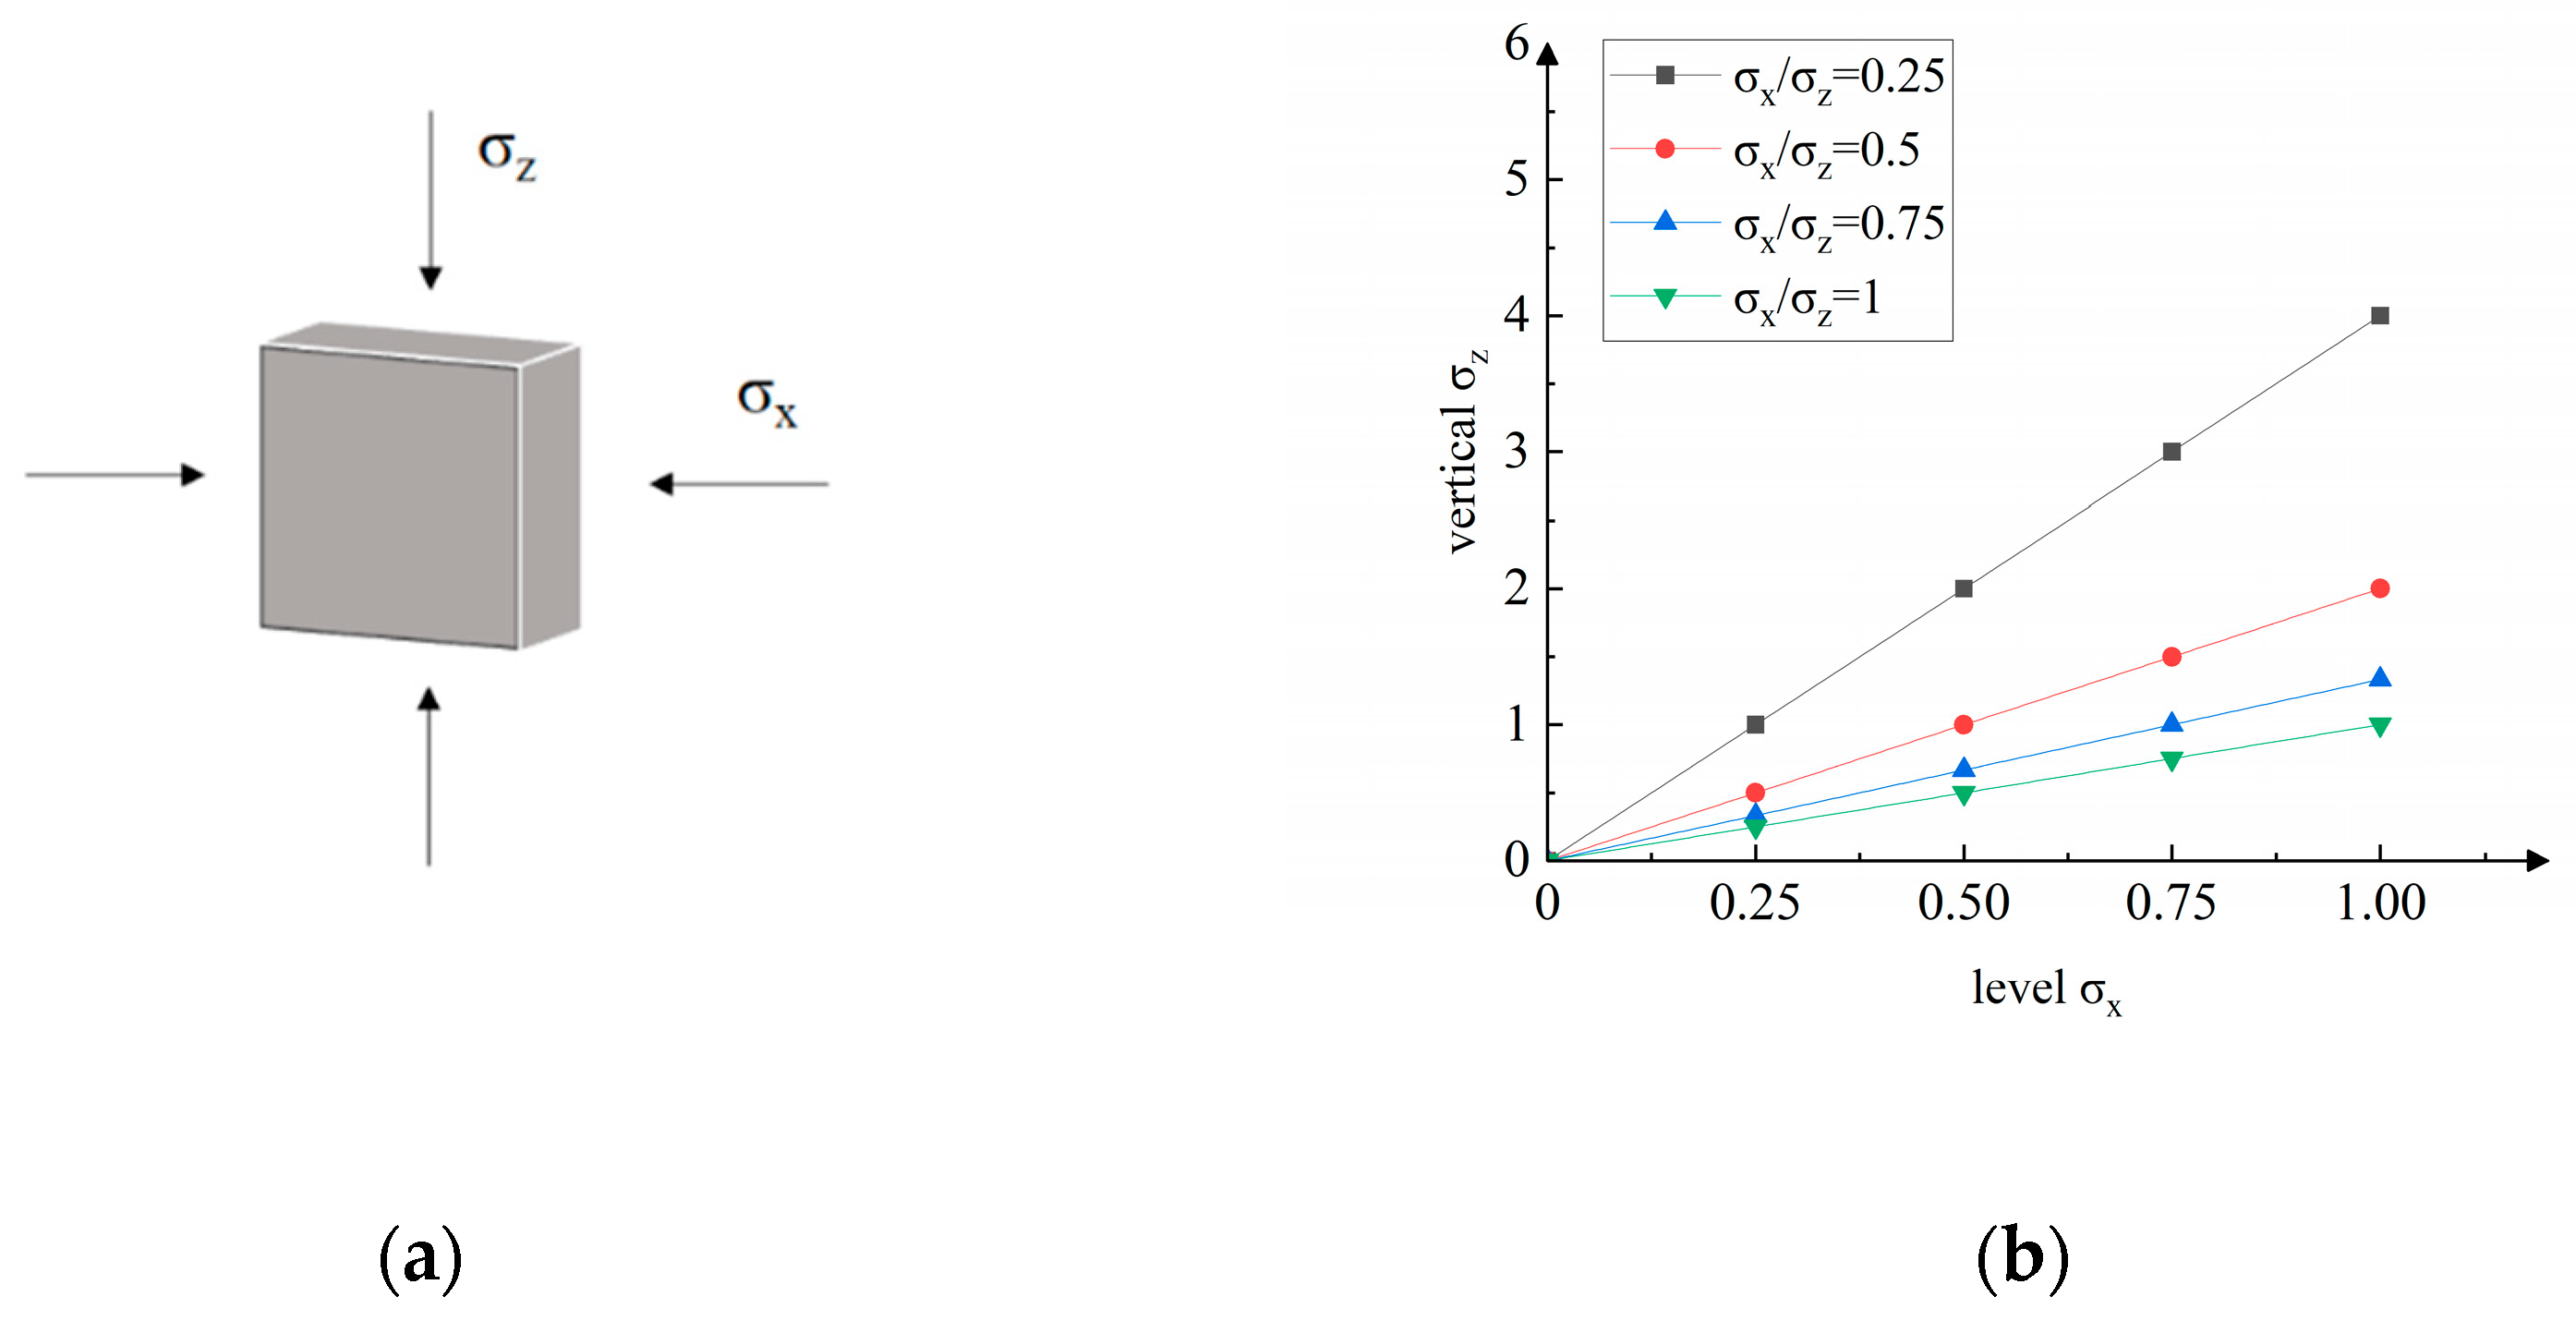
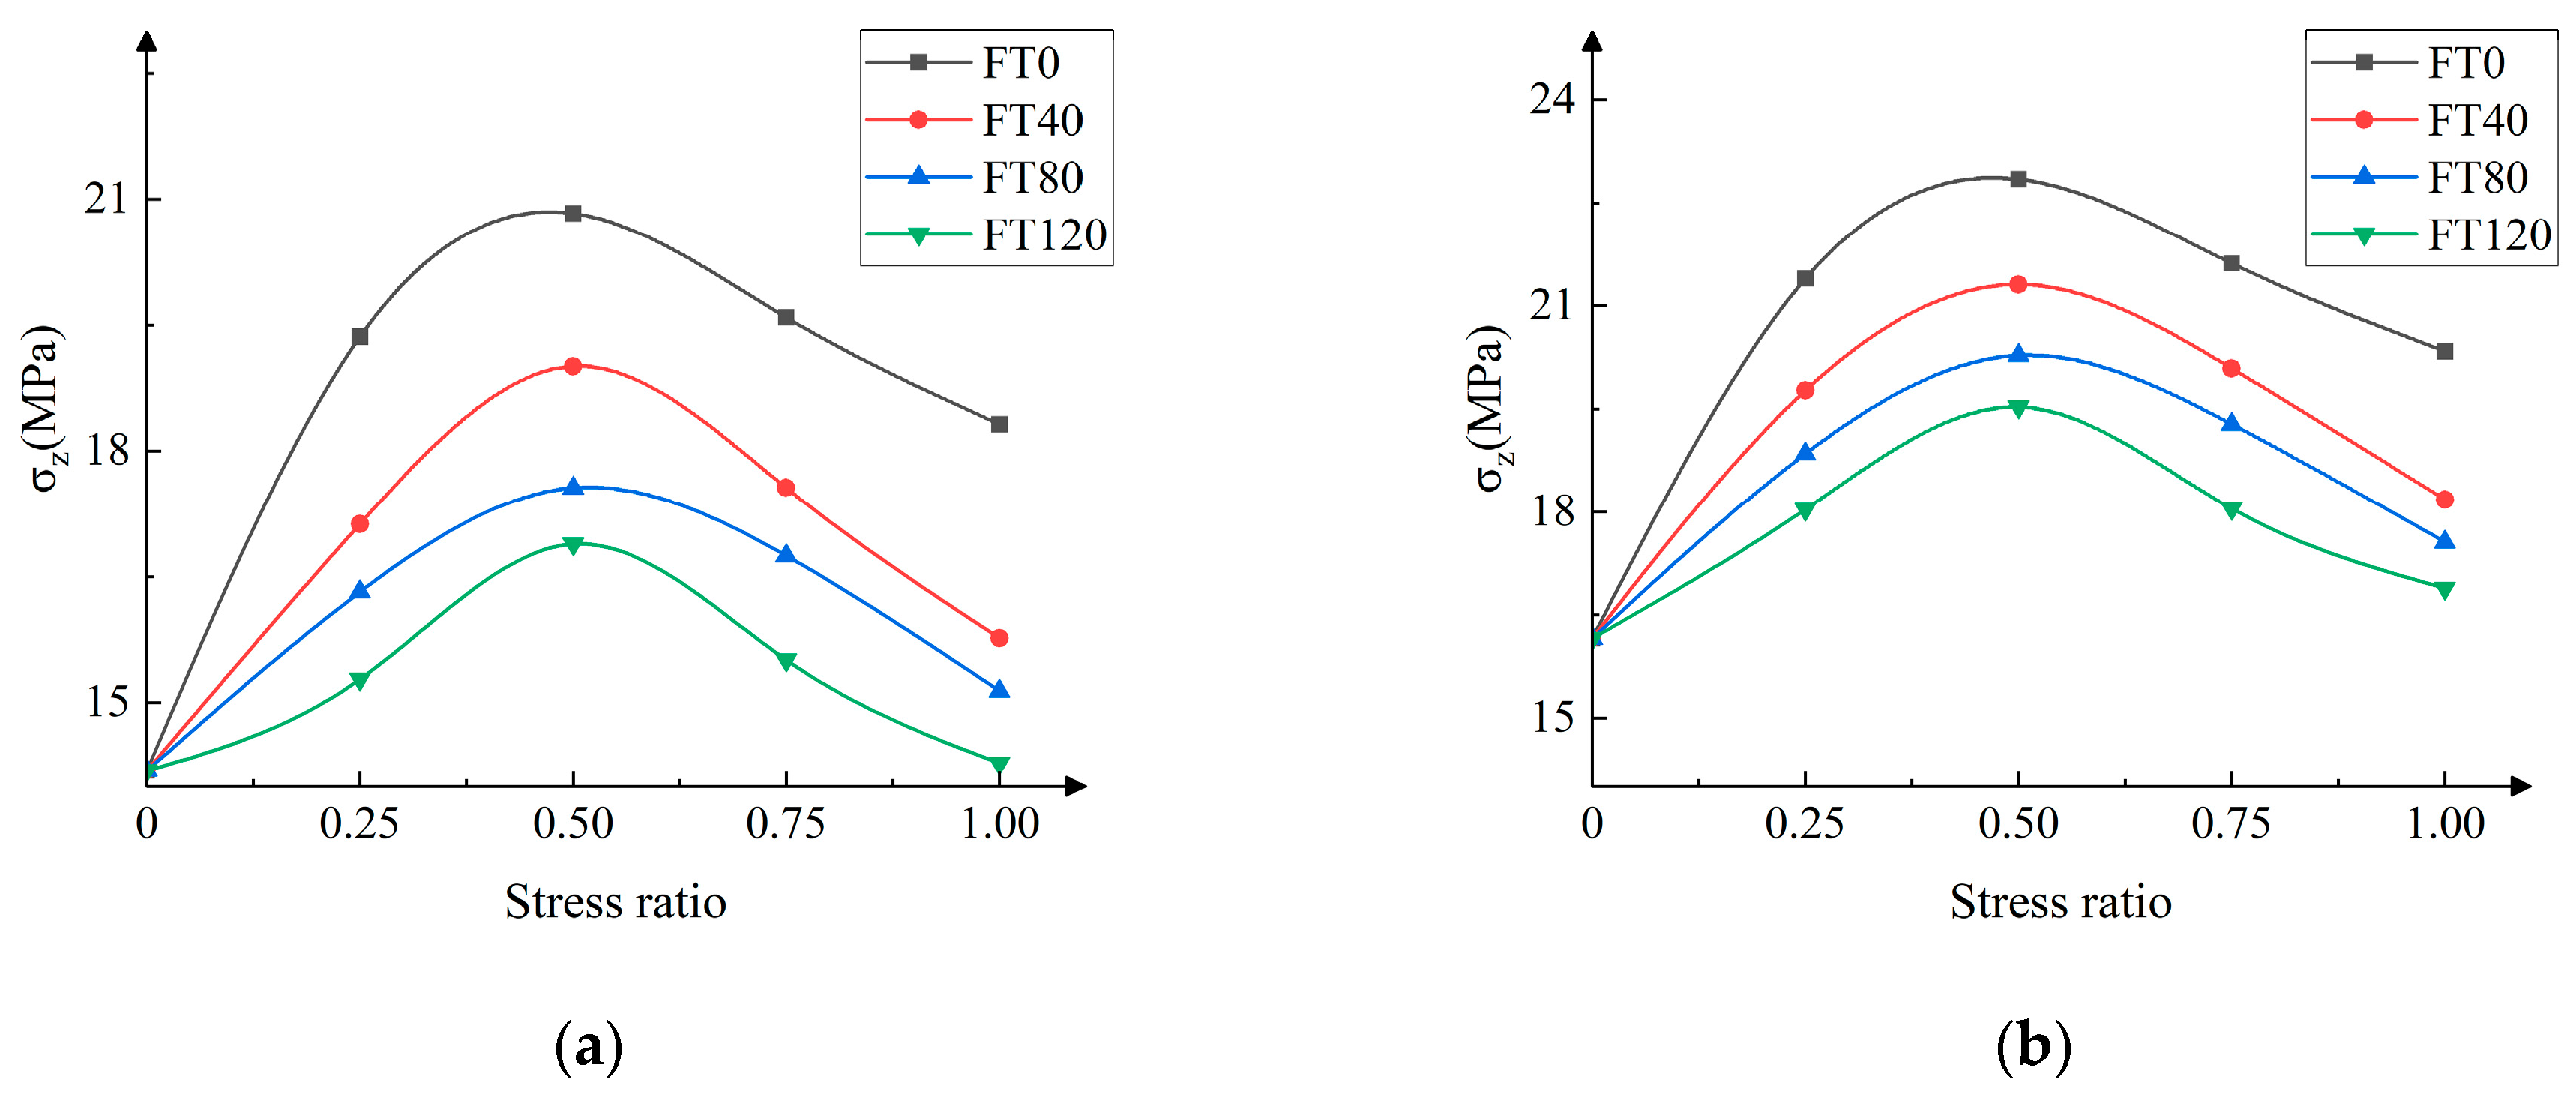
3.2. Different Stress Ratio Loading Test Study
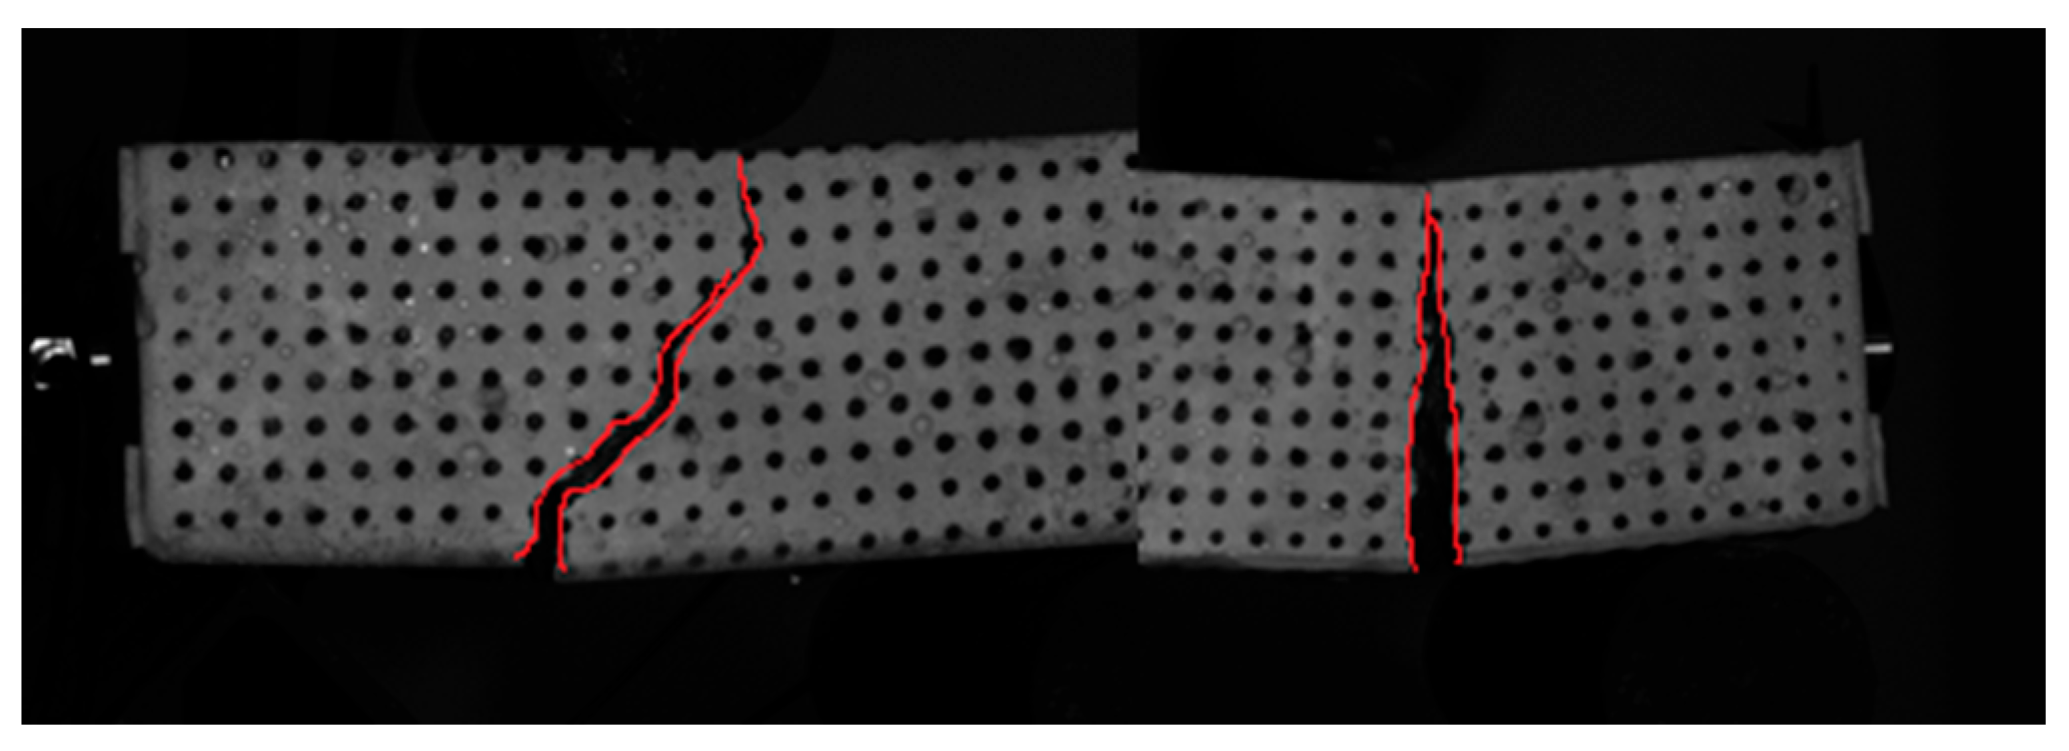
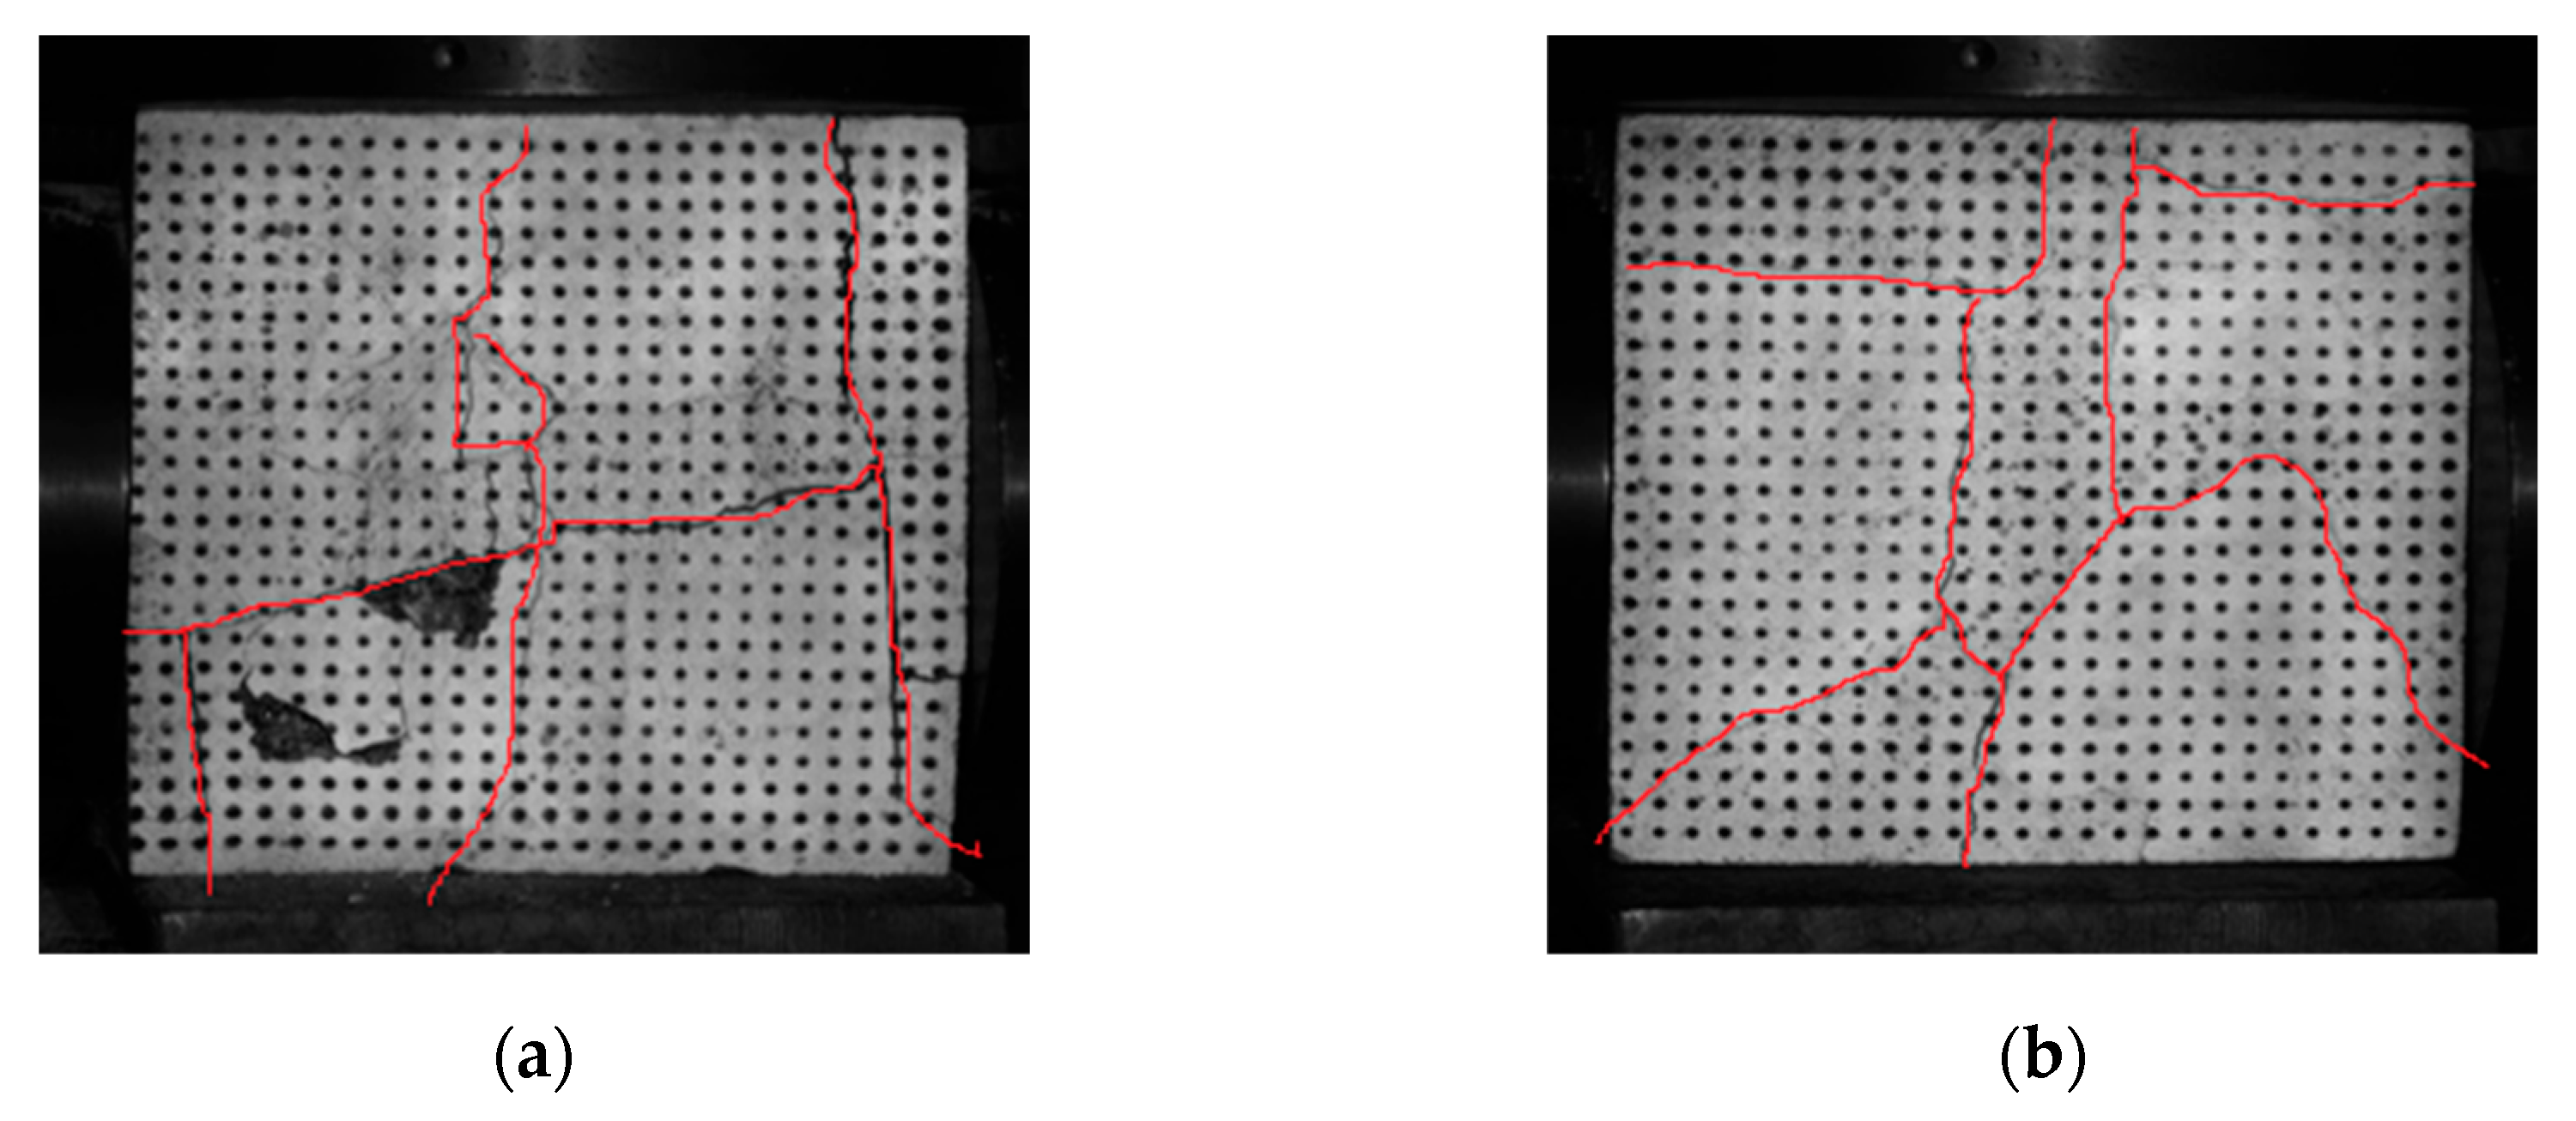
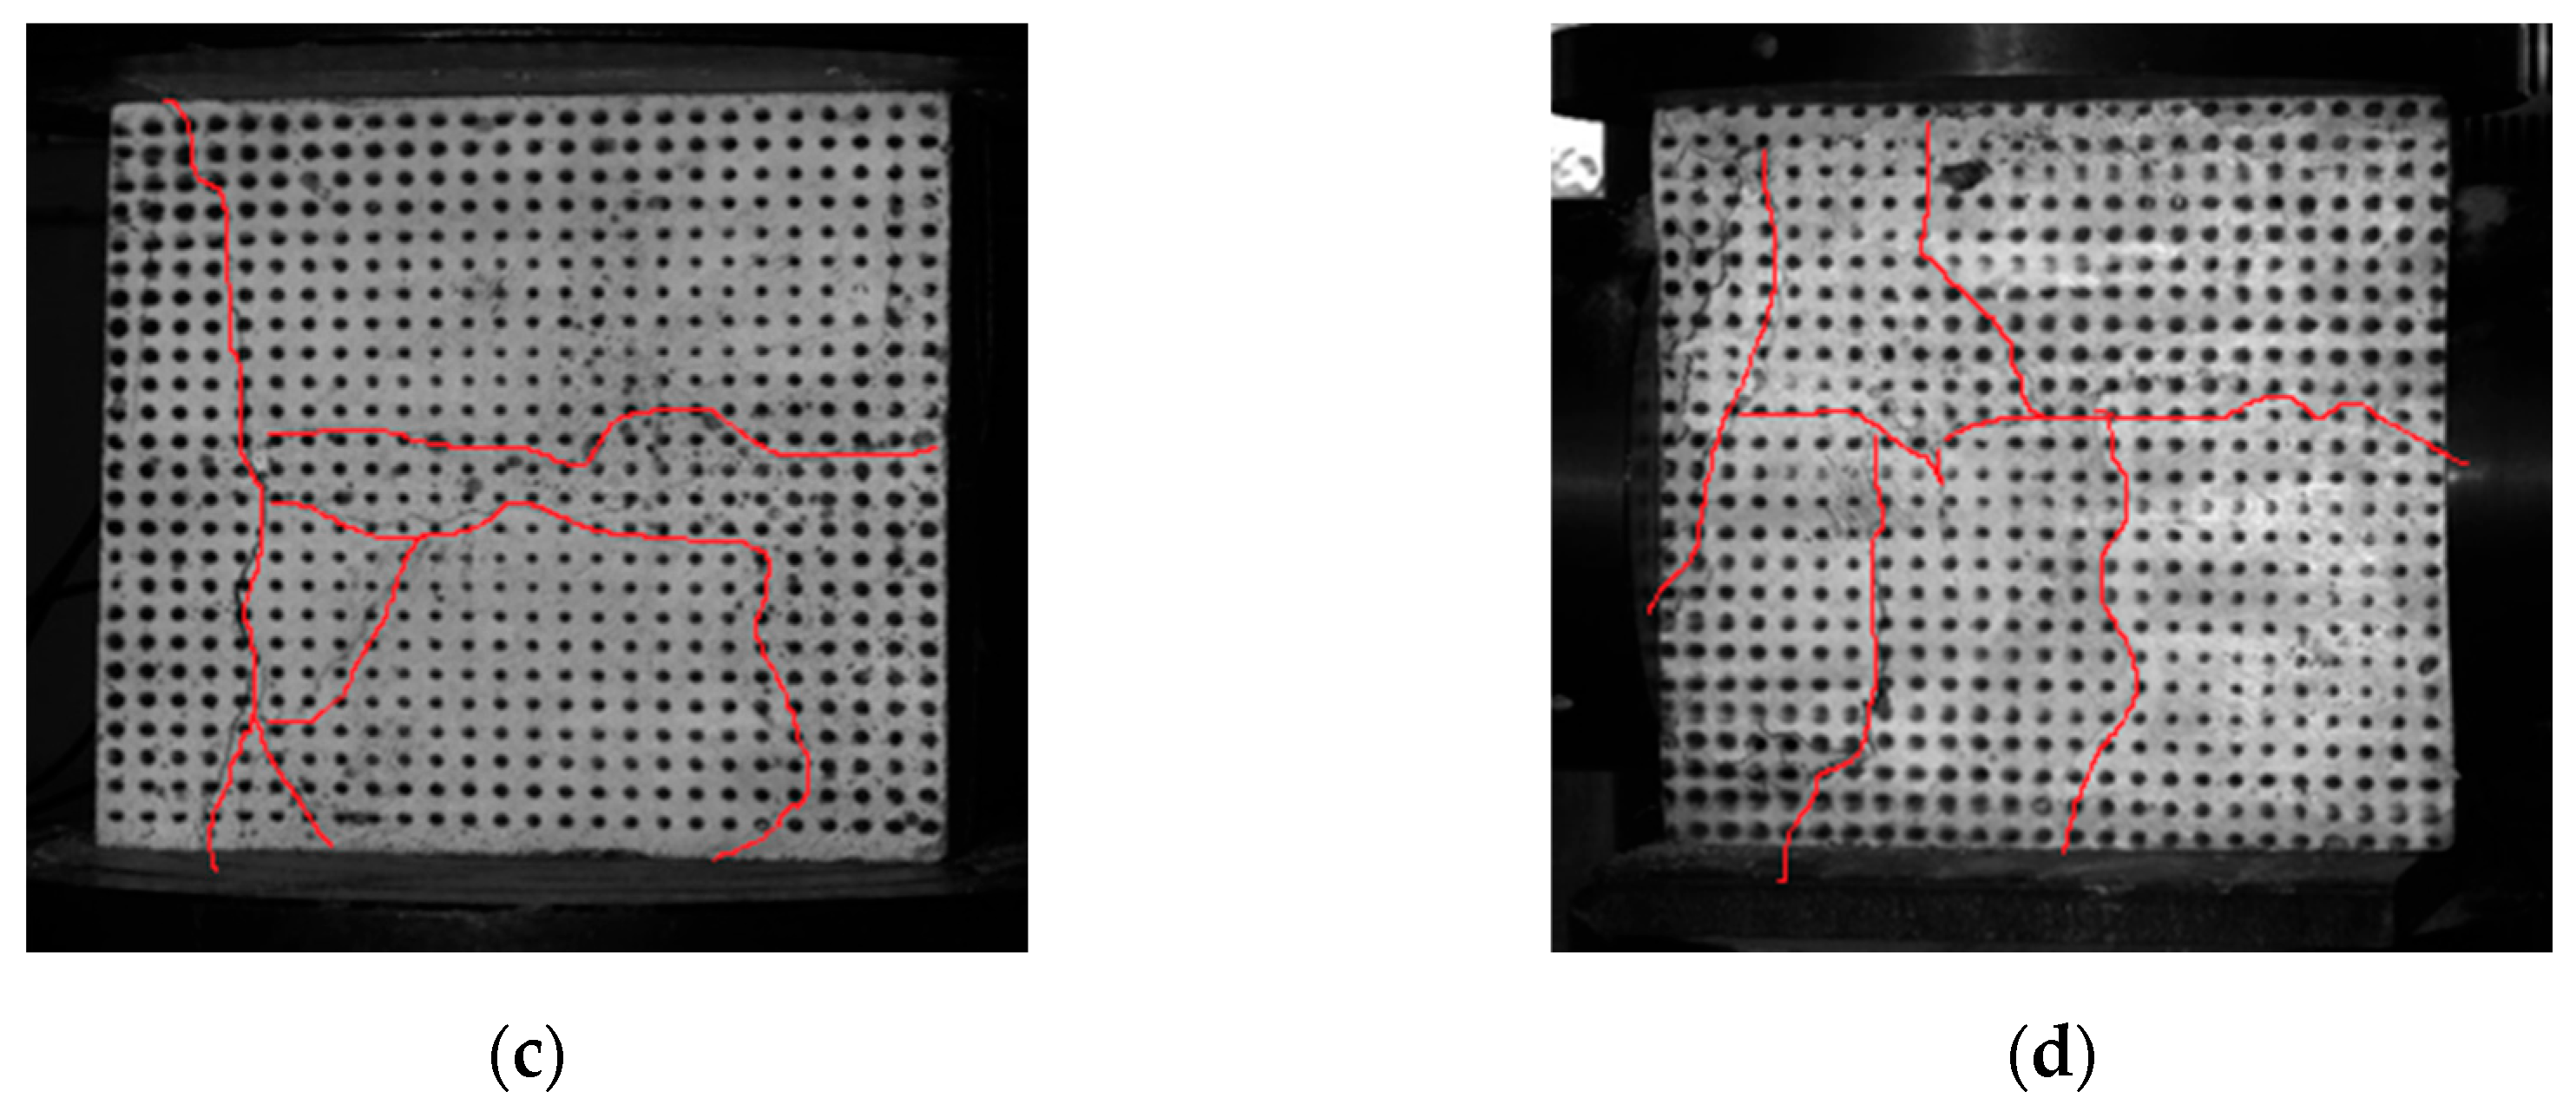
3.2.1. Failure Mode

In the preparation of MMS specimens with 1 kg/m3 PPF mixed into the mortar, the failure modes under biaxial different stress ratio loading conditions are shown in Figure 10.
The figure shows that, under biaxial different stress ratio loading conditions, the failure forms of PPF mortar rubble under different stress ratio loadings are all failures along the aggregates and joints. Among them, the red line in the figure represents the interface line between the aggregate and the mortar. During the loading process, cracks first appear at the compressed position. With the increase in the load, the cracks gradually extend towards the middle. When the cracks expand to the position of the aggregate, they start to extend along the periphery of the aggregate and develop to penetrate. When the loading ratio is minor (σxz = 0.25, σxz = 0.5), the horizontal pressure increases slowly, and the specimen exhibits tensile strain in both the horizontal and vertical directions. As σz increases, the failure ultimately occurs along the interface between the aggregate and the mortar. With the increase in the loading ratio, multiple tensile splitting cracks appear along the surface parallel to the free face of the specimen, and several microcracks develop on the loading surface. This trend can be attributed to the fact that a higher stress ratio inhibits the formation of tensile splitting cracks along the x-direction during specimen failure. Therefore, under the combined action of σx and σz, the specimen exhibits significant tensile strain in the y-direction, gradually forming multiple cracks along the surface parallel to the x–z plane. This results in splitting failure, which differs from the failure mode under lower stress ratio loading. This inclination is caused by the differences in the physical properties and structural organization between the granite stone aggregate and the mortar, leading to stress concentration. This concentration eventually develops into cracks at the interface and causes failure.

3.2.2. Principal Stress Law
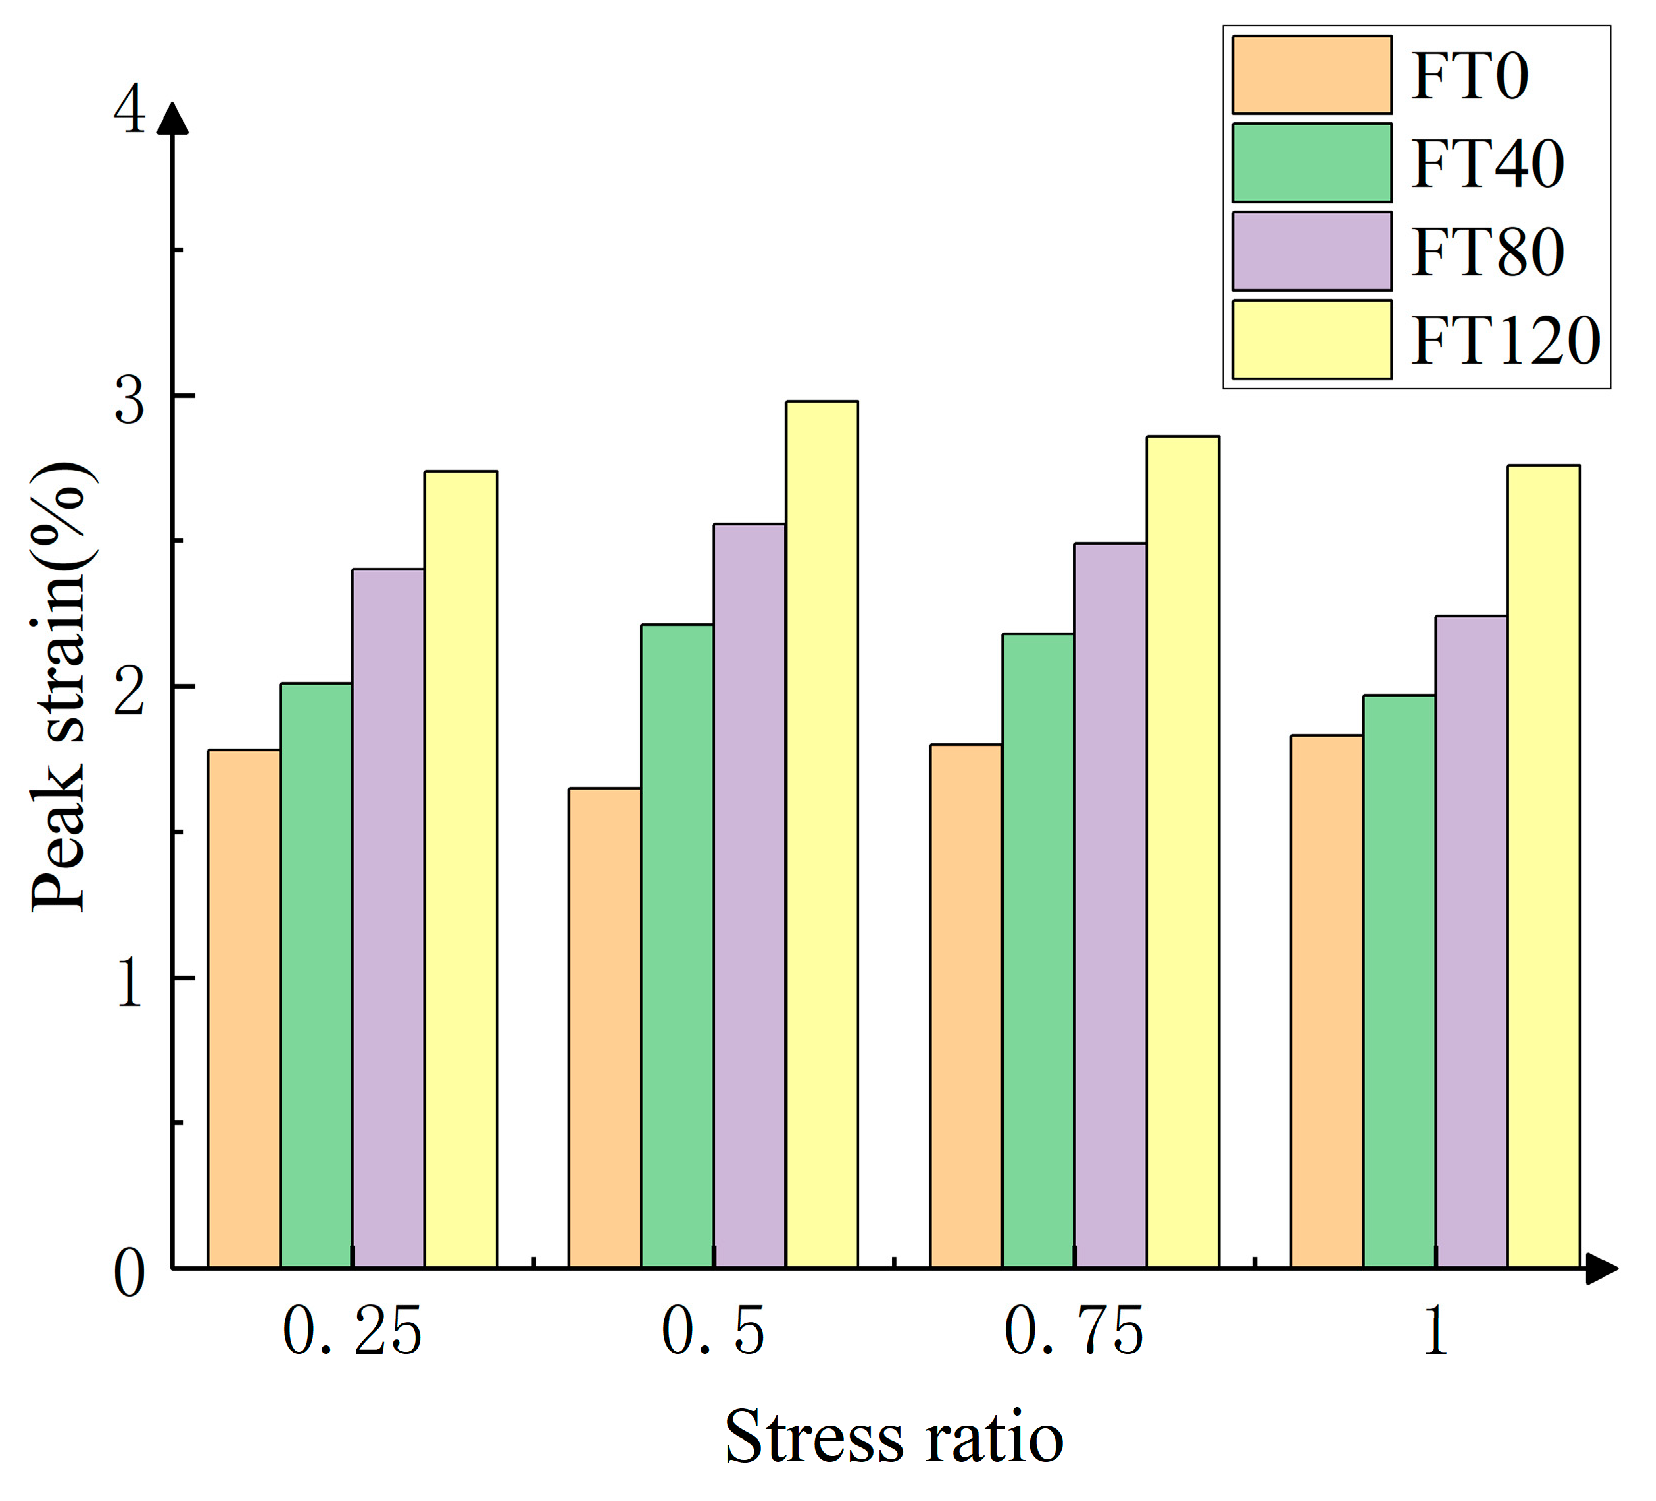
Under different stress ratio loading conditions, the change of principal stress with the stress ratio of the PPF-MMS under various stress states is shown in Figure 11.
The figure shows that the vertical pressure-to-stress ratio (σxz) development trend of the PPF-MMS presents a parabolic shape [17]. When σxz < 0.5, as the stress ratio increases, the strength of the PPF-MMS in the z-axis increases significantly. When σx/σz is around 0.5, the z-axis strength reaches its maximum. When σxz > 0.5, with the stress ratio increasing, the PPF-MMS strength decreases. As analyzed above, at low-stress ratios, the tensile stress on the free surface of the stone is relatively small, leading to a significant improvement in the principal strength. However, as the stress ratio increases, the horizontal load becomes progressively more significant, resulting in substantial tensile stresses on the free surface of the stone. This, in conjunction with other factors, ultimately leads to a reduction in overall strength. Therefore, the vertical stress exhibits a trend of first increasing and then decreasing as the stress ratio increases. Furthermore, the number of freeze–thaw cycles does not affect the changing trend of the strength of the MMS at different stress ratios, but the change amplitude is slightly different.
Additionally, the data in the figure show that, with the increase in freeze–thaw cycles, the ultimate compressive strength of the PPF-MMS shows a decreasing trend under the same stress ratio. It is worth noting that the specimens without added fibers have a faster rate of strength decline as the number of freeze–thaw cycles increases compared with those with added fibers. This phenomenon can be attributed to the freezing process during the freeze–thaw cycle, wherein water molecules within the specimen undergo freezing and subsequent expansion, thereby increasing the porosity. After melting, new voids form, and the specimen absorbs water again. This repetitive process causes the internal structure of the MMS to loosen, reducing the internal bonding and gradually decreasing the ultimate compressive strength. However, the addition of polypropylene fibers enhances the bonding performance of the mortar and slows down the rate of strength reduction of the specimens. Under the same PPF content, the increase in the ultimate compressive strength under biaxial compressive loading compared with uniaxial compressive strength depends on the size of the stress ratio, showing a trend of first increasing and then decreasing. For specimens with zero freeze–thaw cycles, the ultimate compressive strengths at stress ratios of σxz = 0.25, 0.5, 0.75, and 1 are 21.4 MPa, 22.85 MPa, 21.62 MPa, and 20.34 MPa, respectively, which represent increases of 32.43%, 41.40%, 33.79%, and 25.87% compared with the uniaxial ultimate compressive strength. These data show that, at a stress ratio of α = 0.5, the ultimate compressive strength reaches its maximum and gradually decreases thereafter. Under different freeze–thaw cycles, the maximum ultimate compressive strength also occurs at a stress ratio of α = 0.5.

3.2.3. Peak Strain

Figure 12 shows the variation of peak strain of PPF-MMS with freeze–thaw cycles under different stress ratios. The data from the figure reveal that, under the same stress ratio, as the number of freeze–thaw cycles increases, the peak strain of the PPF-MMS shows an increasing trend. This phenomenon can be attributed to the accumulation of internal damage and increased porosity resulting from repeated freeze–thaw cycles, which weakens the bond between aggregates and increases the strain. Specifically, when the stress ratio α = 0.5, as the freeze–thaw cycles increase from 0 to 120, the peak strains are 1.9%, 2.21%, 2.56%, and 2.98%. It can be observed that the peak strains have increased by 16.32%, 34.74%, and 56.84%, respectively, compared with the strain at zero freeze–thaw cycles.
Additionally, it is noted that, under the same freeze–thaw cycles, the peak strain of the PPF-MMS shows a trend of initially increasing and then decreasing with the increase in the stress ratio. The maximum strain in the specimens also occurs at a stress ratio of α = 0.5 because the lateral pressure is relatively tiny at low-stress ratios, and thus, the lateral constraint on the specimen during loading is also tiny. In this case, the peak strain of the PPF-MMS is mainly influenced by the vertical load, leading to a gradual increase in the peak strain in the early stage. However, as the stress ratio increases, the lateral pressure becomes relatively large, causing a more substantial constraining effect, limiting the displacement and decreasing the peak strain.

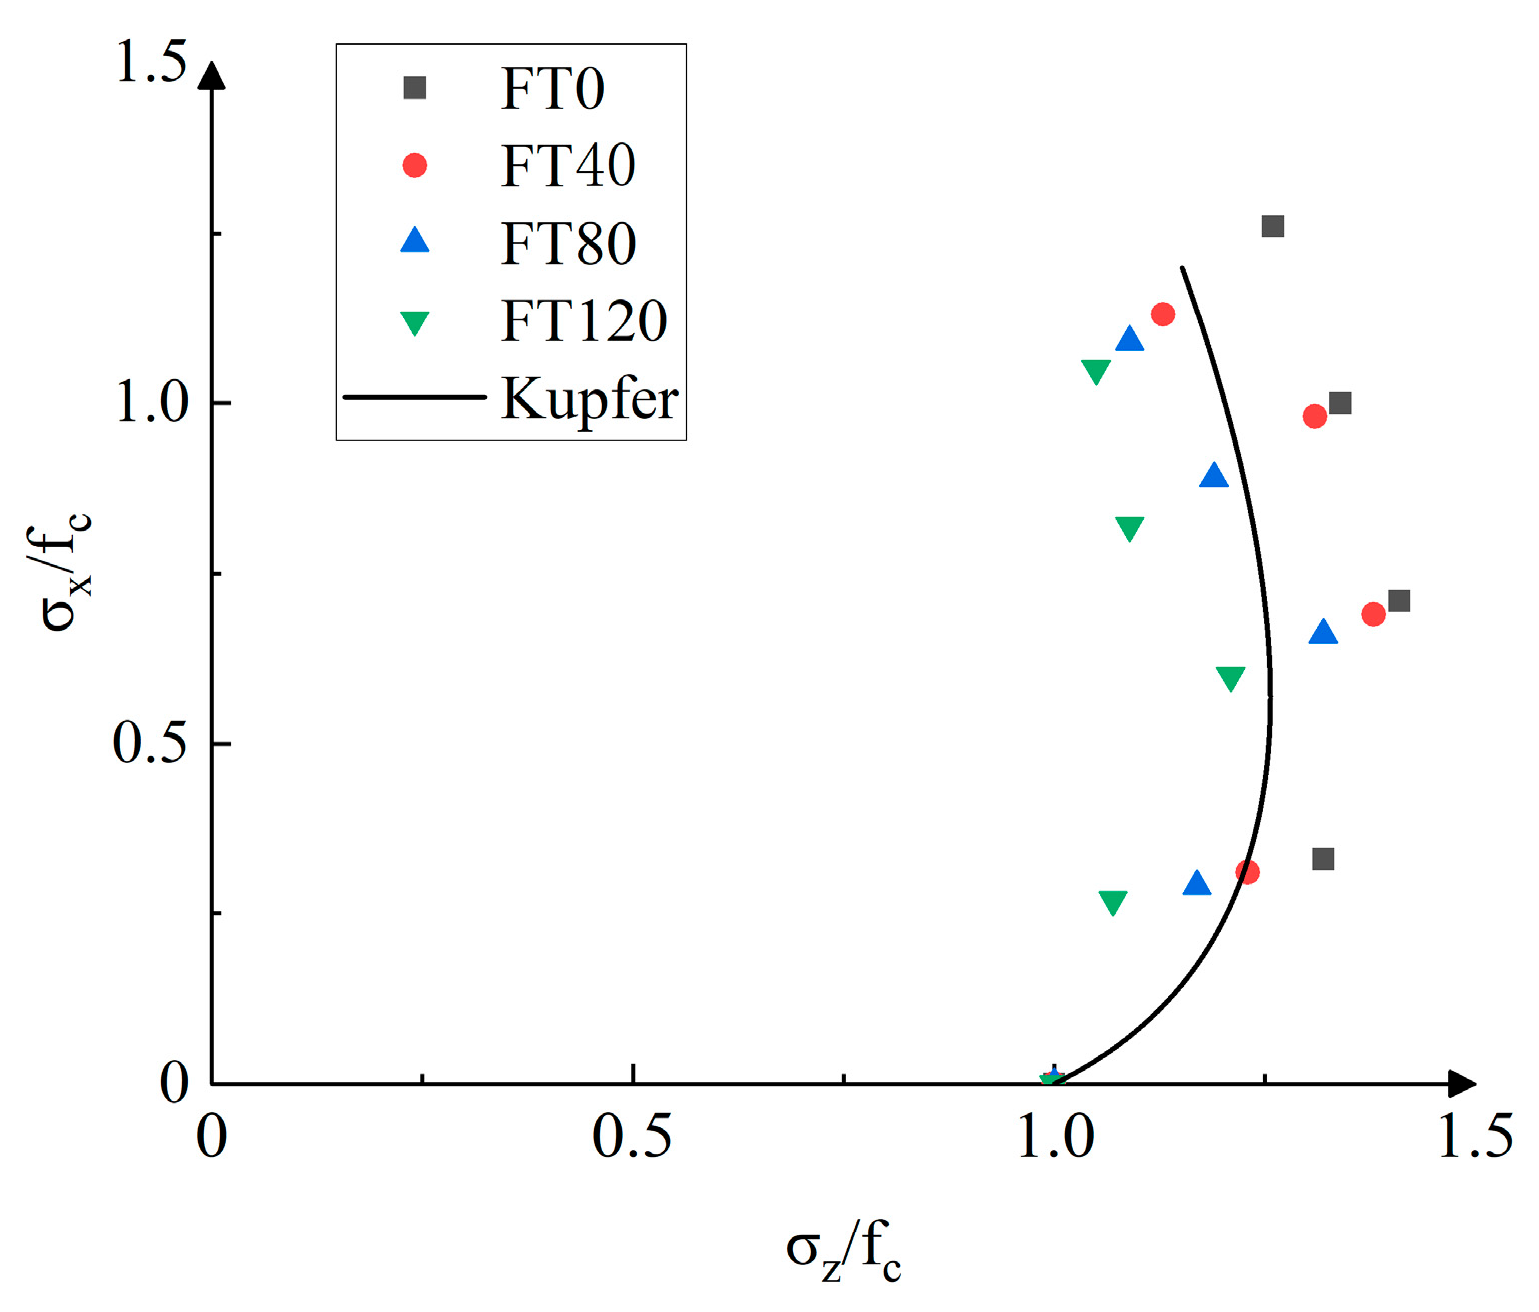
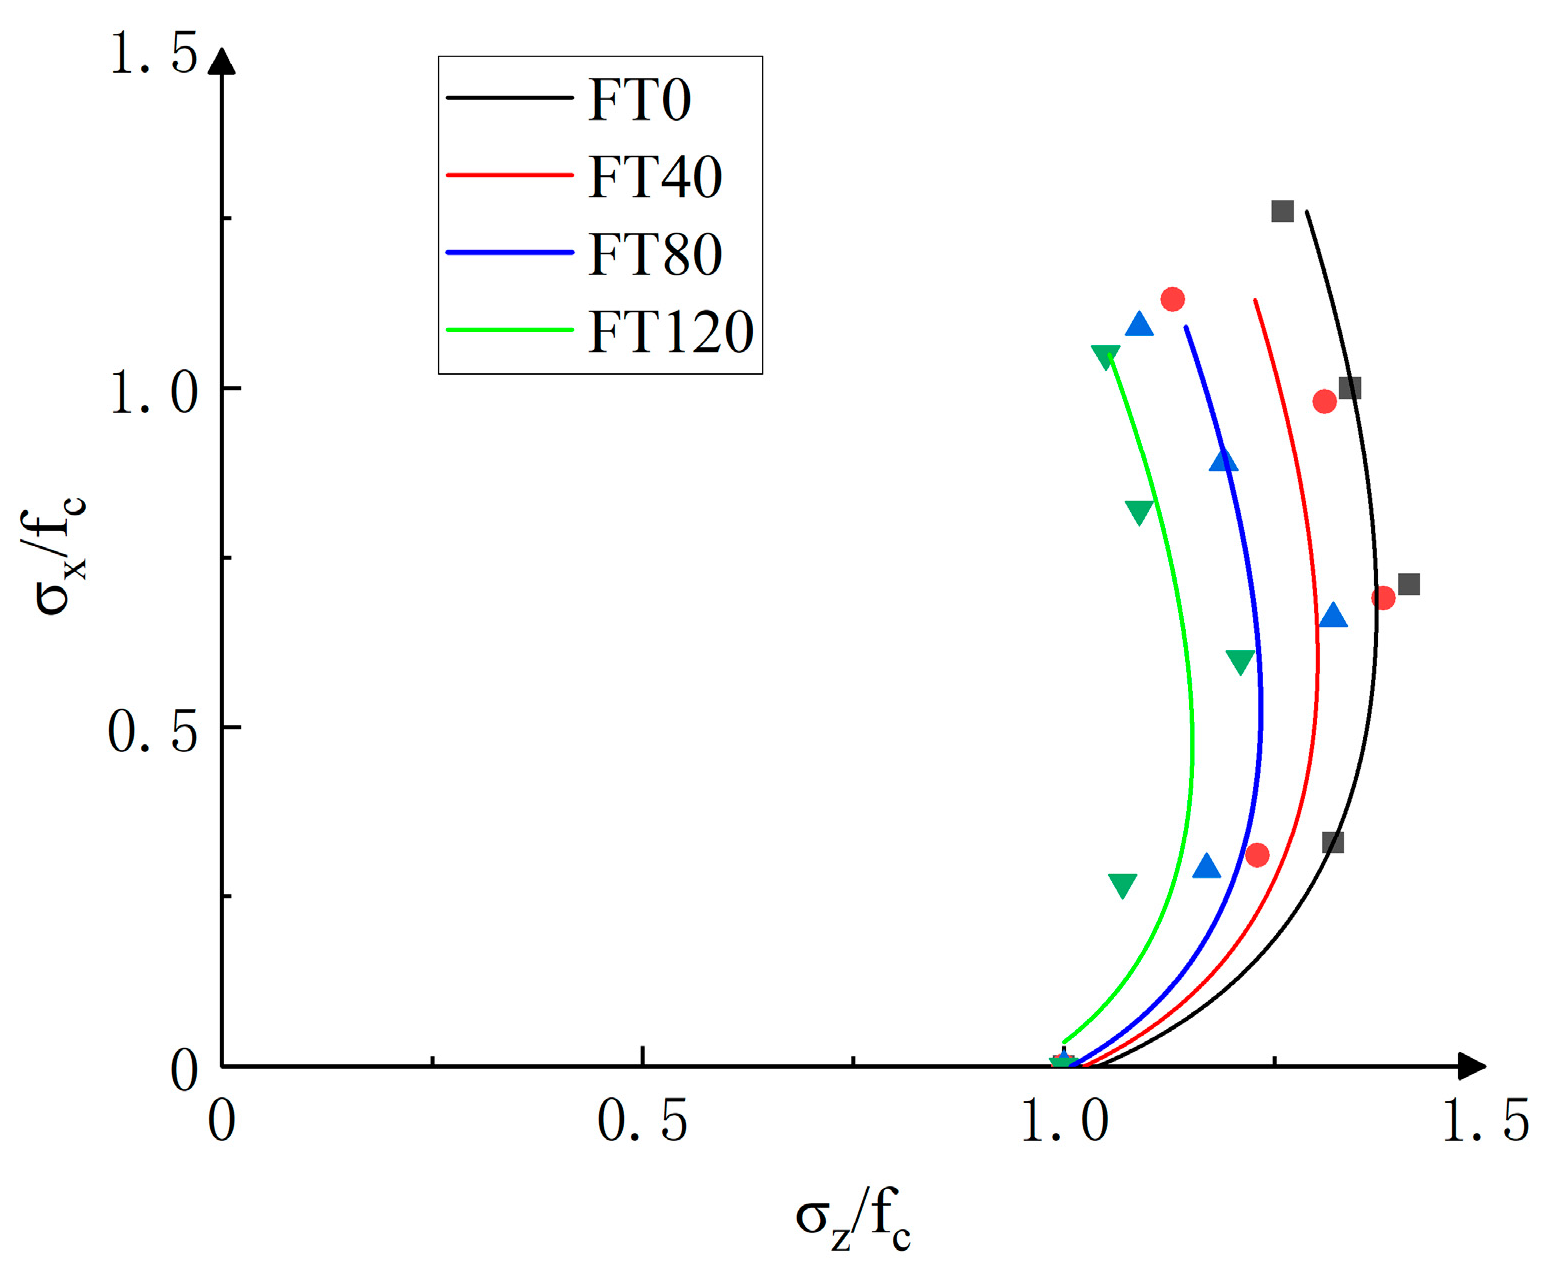
3.2.4. Failure Criterion

To investigate the failure criterion under static biaxial stress conditions, some researchers [41] have compared the Kupfer criterion, Ottosen criterion, and Bresler–Pister criterion to validate their accuracy. The comparison showed that the curve obtained using the Kupfer criterion most closely matched their experimental results. Therefore, this study establishes an expression for the PPF-MMS under biaxial loading with different stress ratios based on the Kupfer criterion, as follows:
Kupfer criterion [42]:
σ z f c + σ x f c 2 σ z f c 3.65 σ x f c = 0
Upon comparison, it is found that the curve obtained from the Kupfer criterion closely matches the experimental results of this study, as shown in Figure 13. The figure shows that the variation trend of the PPF-MMS concerning the stress ratio is consistent with the Kupfer criterion, although there are slight discrepancies. Therefore, based on the Kupfer biaxial compressive strength formula, a strength criterion suitable for PPF-MMS under different stress ratios is established as follows:
σ z f c = a + b α ( 1 + α ) 2
where α = σxz, σzz is the vertical stress (MPa), fc is the uniaxial compressive strength (MPa), a and b are undetermined parameters.
Based on the experimental data, regression analysis was conducted using Formula (4), and the parameter values of the PPF-MMS under different stress ratio loading conditions for various freeze–thaw cycles are shown in Table 8. Figure 14 compares the theoretical and experimental values of the failure criterion of the PPF-MMS under different stress ratios.
The analysis above shows that the data points generally lie close to the fitted curve, and the correlation coefficient (R2) is above 0.97. Therefore, the improved biaxial failure criterion based on the Kupfer criterion can effectively describe the strength variation of the PPF-MMS under different stress ratio loading conditions. Moreover, the values of a and b in the four loading ratios show a decreasing trend with the increase in freeze–thaw cycles, indicating a negative correlation between the values of a and b and the strength. As shown in the figure, the curve tilts inward with the increase in freeze–thaw cycles, suggesting that the increment of the MMS strength decreases. This implies that freeze–thaw cycles should be carefully considered when designing the PPF-MMS engineering projects.

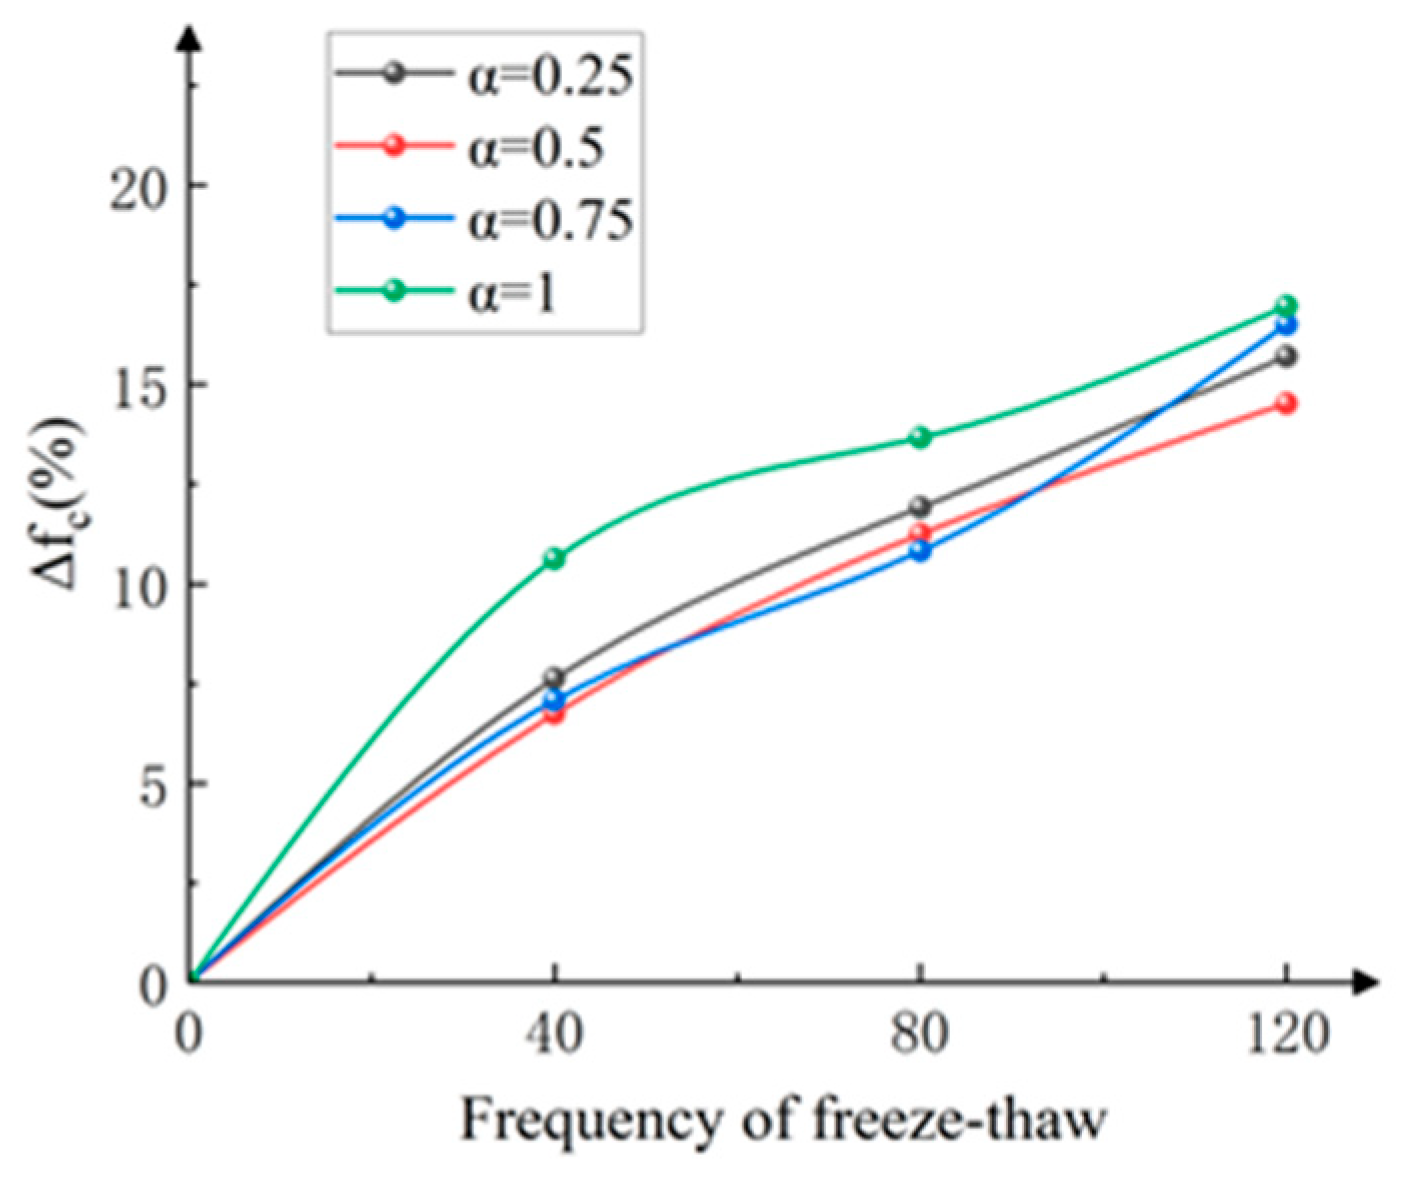
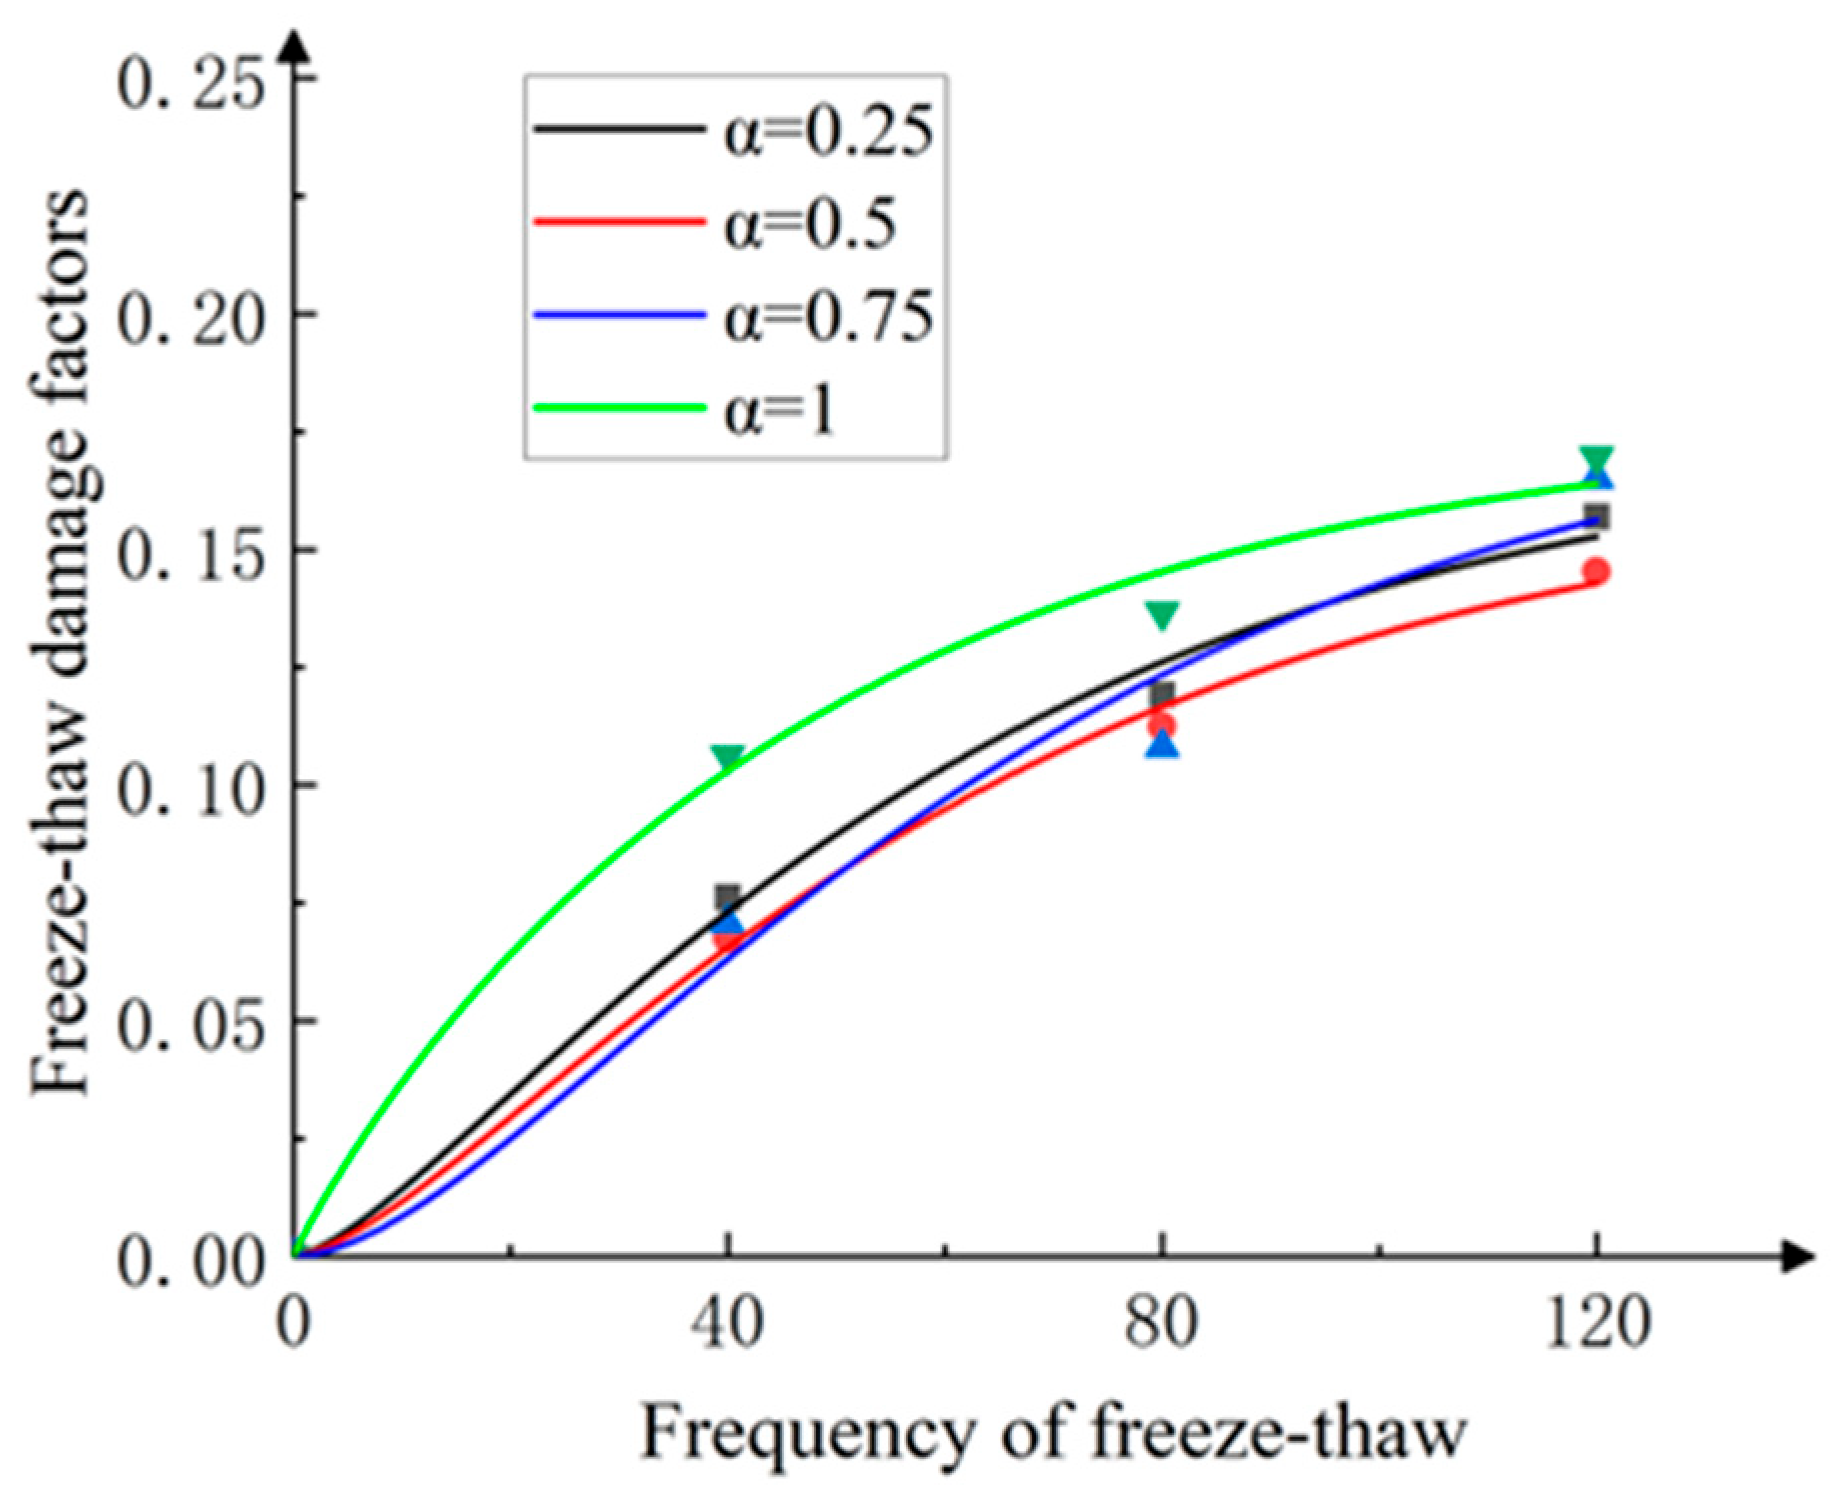
3.2.5. Freeze–Thaw Damage Evolution Model

Given the homogeneity of the test specimens, three samples from the PPF-MMS group were randomly selected for each set of freeze–thaw cycles. The average mass of each group before and after the freeze–thaw cycles was measured. The mass loss rate (ΔW) of the PPF-MMS is shown in Figure 15, and the relationship between the strength loss rate (Δfc) of the PPF-MMS and the number of freeze–thaw cycles under different stress ratio loading conditions is shown in Figure 16.
When the polypropylene fiber content is 1 kg/m3, the mass loss rates of the MMS specimens after 40, 80, and 120 freeze–thaw cycles are 0.6%, 0.72%, and 0.87%, respectively. This indicates that as the number of freeze–thaw cycles increases, the surface mortar of the specimens gradually spalls, and small pits appear, exposing the fine aggregates to the air.
Figure 16 shows the relationship between the compressive strength loss rate (Δfc) of the PPF-MMS and the number of freeze–thaw cycles under different stress ratios. The results show that as the number of freeze–thaw cycles increases, the strength loss rate increases to varying degrees. After 120 freeze–thaw cycles, the strength loss rates of the PPF-MMS specimens under four different loading ratios are 15.7%, 14.53%, 16.51%, and 16.96%, respectively. Among them, at α = 0.5, the strength is least affected by freeze–thaw cycles.
Studies have shown that the strength degradation of silicate materials after freeze–thaw cycles follows the Weibull damage model [38]. The model’s parameters are revised in this study based on statistical principles. Using the experimental data above, a theoretical model for the freeze–thaw damage strength of the PPF-MMS after n freeze–thaw cycles is established, as shown in Equation (5). The model is fitted with experimental data, and the fitting parameters and correlations are presented in Table 9.
D n f = 1 f 0 f n = a 1 e 0.02 n b
where Dnf is the compressive strength damage factor of the PPF-MMS after n freeze–thaw cycles; f0 is the initial uniaxial compressive strength, MPa; fn is the strength after n freeze–thaw cycles; and a and b are the strength attenuation influencing coefficients.
Figure 17 presents the relationship between the fitted freeze–thaw damage factor and the number of freeze–thaw cycles for the PPF-MMS. It can be seen that the data points are generally distributed around the fitted curve, with a correlation coefficient (R2) greater than 0.97, indicating that the model can effectively simulate the freeze–thaw damage factor of the PPF-MMS at different freeze–thaw cycles. Therefore, the model is considered reasonable. The fitting parameters for the PPF-MMS freeze–thaw damage model are shown in Table 6. The values for the four loading ratios are approximately the same, but the b values show significant deviation. A comparison with Figure 15 indicates that the fitting coefficient significantly affects the strength loss rate of the specimens after freeze–thaw cycles.

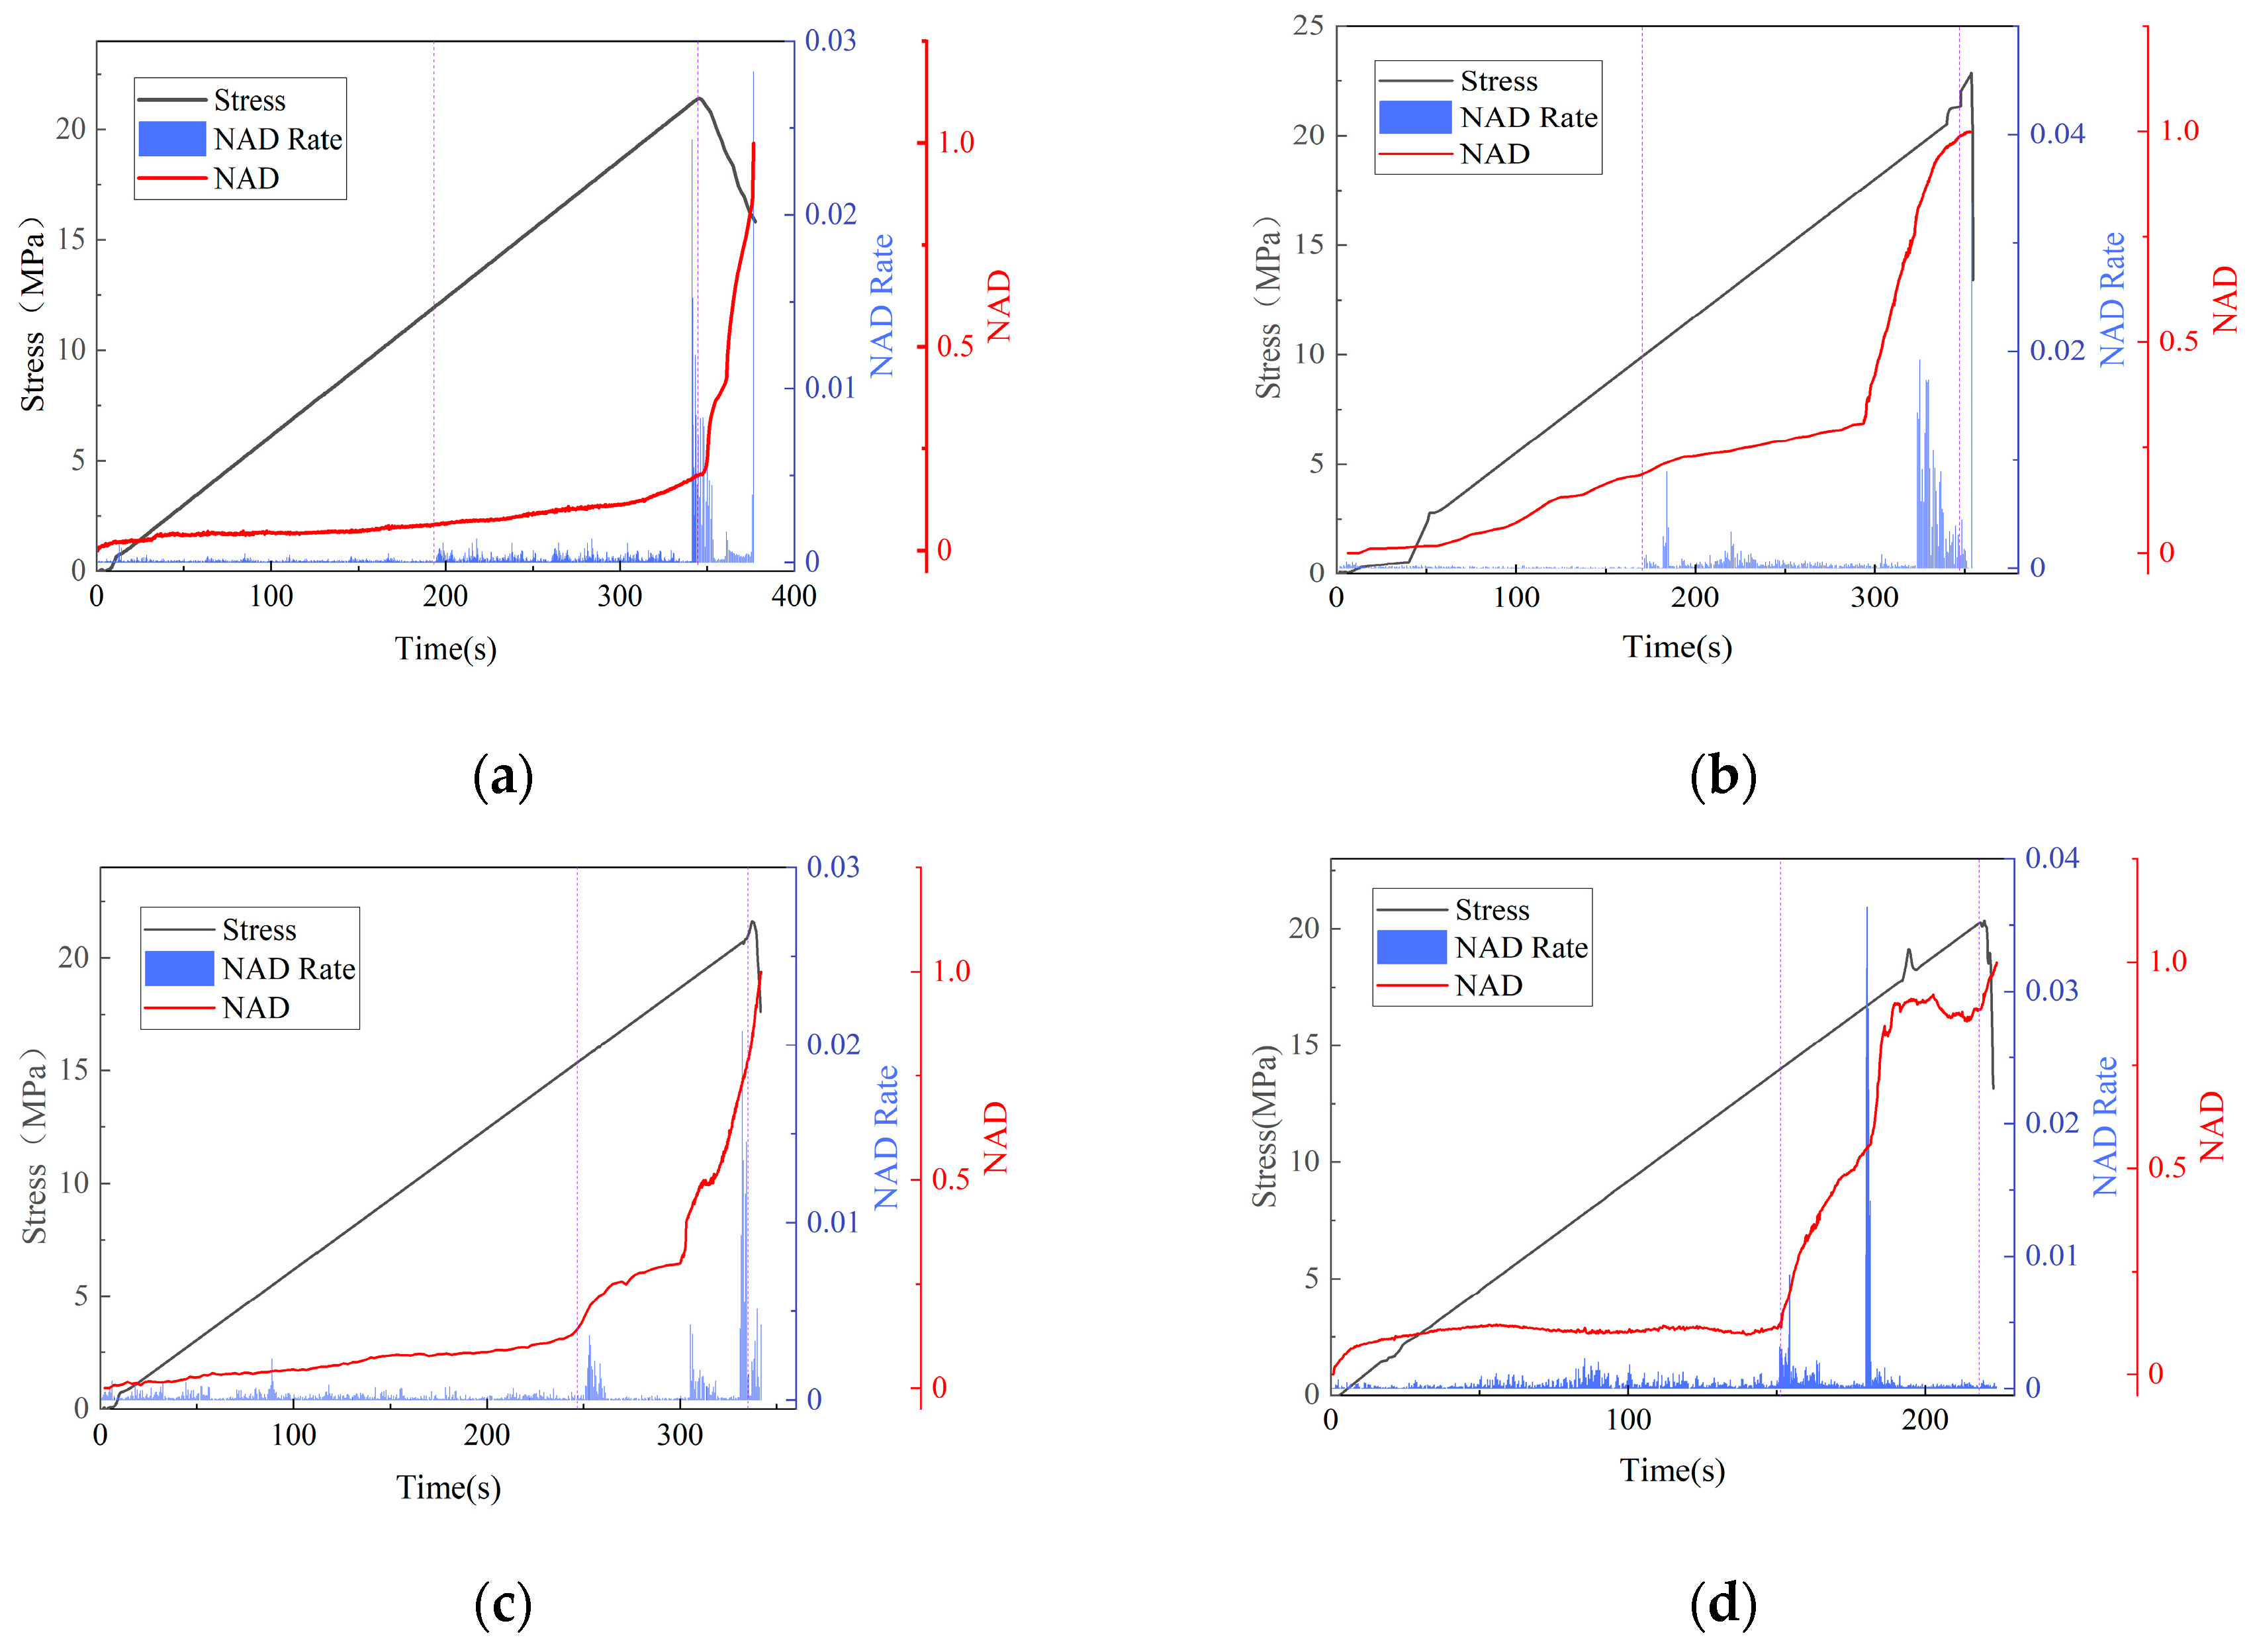
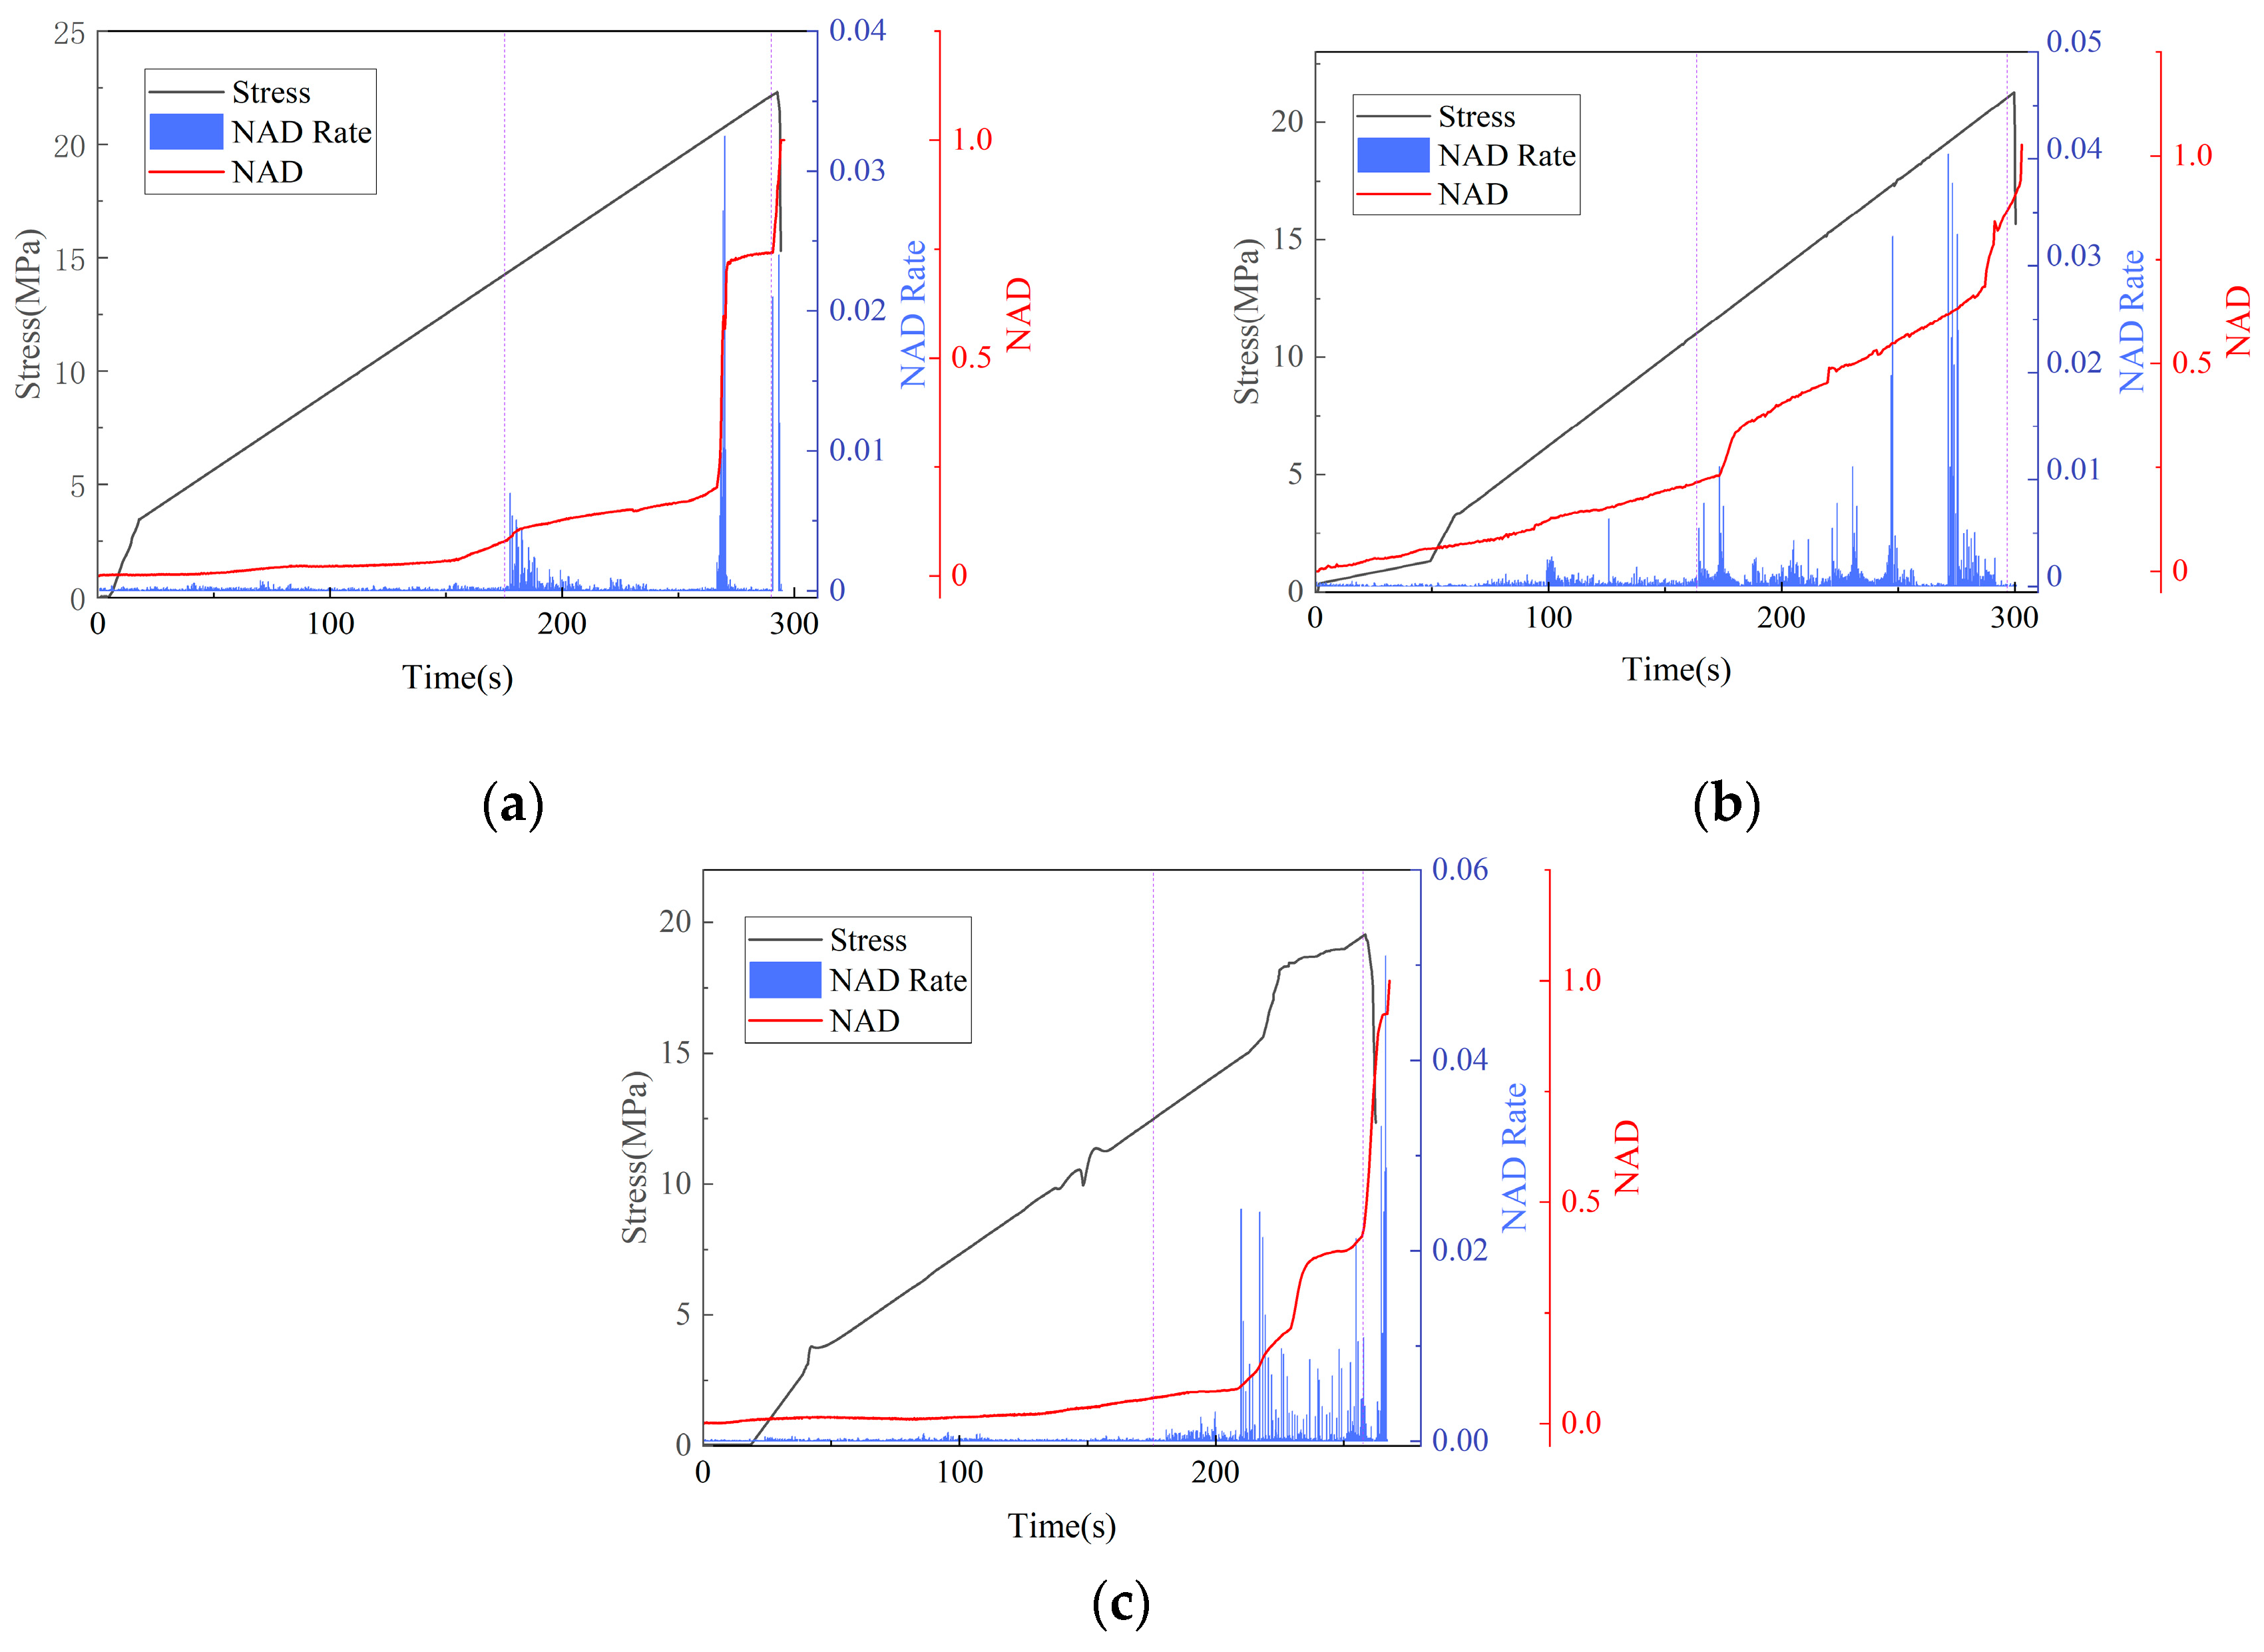
3.3. Analysis Based on NAD Damage Degree

According to relevant studies [43], it has been found that analyzing the more prominent strain points on the specimen surface can serve as an important parameter for material damage. The parameter information helps to investigate the internal relationship between the failure characteristics of the test material and its damage evolution. The average value of the relatively more significant strain points on the specimen surface can better represent the local damage characteristics of the specimen. In contrast, the average value of all strain points on the specimen surface can more effectively characterize the overall failure characteristics over time. The difference between these averages can describe the damaged evolution characteristics of the PPF-MMS. In this study, the damage degree of the specimen is expressed as the difference ( ε ¯ ) between the average value of the most significant 25% strain points on the surface and the average value of all strain points on the specimen surface, as follows:
ε ¯ = 1 M i = 1 M ( ε i ) 1 N i = 1 N ( ε i )
where M refers to the number of strain points corresponding to the first 25% of more enormous strains, N refers to the total number of strain points on the surface of the specimen, and εi denotes the strain value at the i-th point.
ε ¯ is the difference between the average value of the M most significant strain points and the average value of all N strain points on the surface of the specimen. Thus, the normalized average deviation (NAD), which characterizes the degree of damage, is given by
N A D = ε ¯ ε ¯ max
where ε ¯ max is the maximum value of ε ¯ .
Figure 18 shows the normalized strain average deviation response curve for the PPF-MMS under different stress ratios. This graphical representation facilitates a comprehensive analysis of the surface heterogeneity of the specimen. From the graph, it is evident that, during the early loading phase, NAD shows only minor changes, with a slightly increasing trend, and the rate of NAD evolution is relatively small, indicating that stress is uniformly applied to the specimen. As the stress increases, the rate of NAD evolution begins to fluctuate significantly, and NAD steadily rises. During this phase, the difference between the average value of the top 25% larger strain points and the overall strain average increases, intensifying the localization of more enormous strains in the stone. Finally, when the specimen reaches the peak stress and enters the yielding stage, the NAD value experiences a sudden increase and reaches its maximum. Simultaneously, the rate of NAD evolution exhibits a marked increase, yet fluctuations in its values are also observed. This phenomenon can be attributed to severe cracking within the specimen, which results in surface spalling and fiber rupture. Consequently, localized significant strain points experience data loss. However, the specimen has not entirely failed at this stage, reflecting that, after significant damage, stress redistribution occurs internally in the specimen, allowing it to continue bearing the load until failure. The NAD response curve, in combination with the mechanical response curve and its rate of change, can effectively reflect the damage evolution characteristics of the MMS.
Figure 19 illustrates the normalized strain mean deviation response curves of the PPF-MMS under different freeze–thaw cycles at a stress ratio of σxz = 0.5. The figure shows that the early-stage NAD (normalized average deviation) evolution rate fluctuates relatively mildly, and the NAD change is stable, with the surface strain increasing uniformly. As the stress increases, the NAD evolution rate starts to fluctuate significantly, and there is a sharp increase in NAD, indicating severe surface damage and the development of larger cracks. When the stress on the specimen reaches its maximum value, the NAD also reaches its maximum during this stage, indicating that the damage is most severe. The NAD evolution rate can reflect the worsening surface damage of the specimen. Furthermore, as the number of freeze–thaw cycles increases, the fluctuations in the NAD evolution rate become more pronounced. This indicates that repeated freeze–thaw cycles diminish the specimen’s resistance to deformation, thereby facilitating the propagation of local cracks and accelerating the divergence between the average strain values of the most prominent strain points in the initial 25% and the overall average strain. Consequently, this exacerbates strain localization.

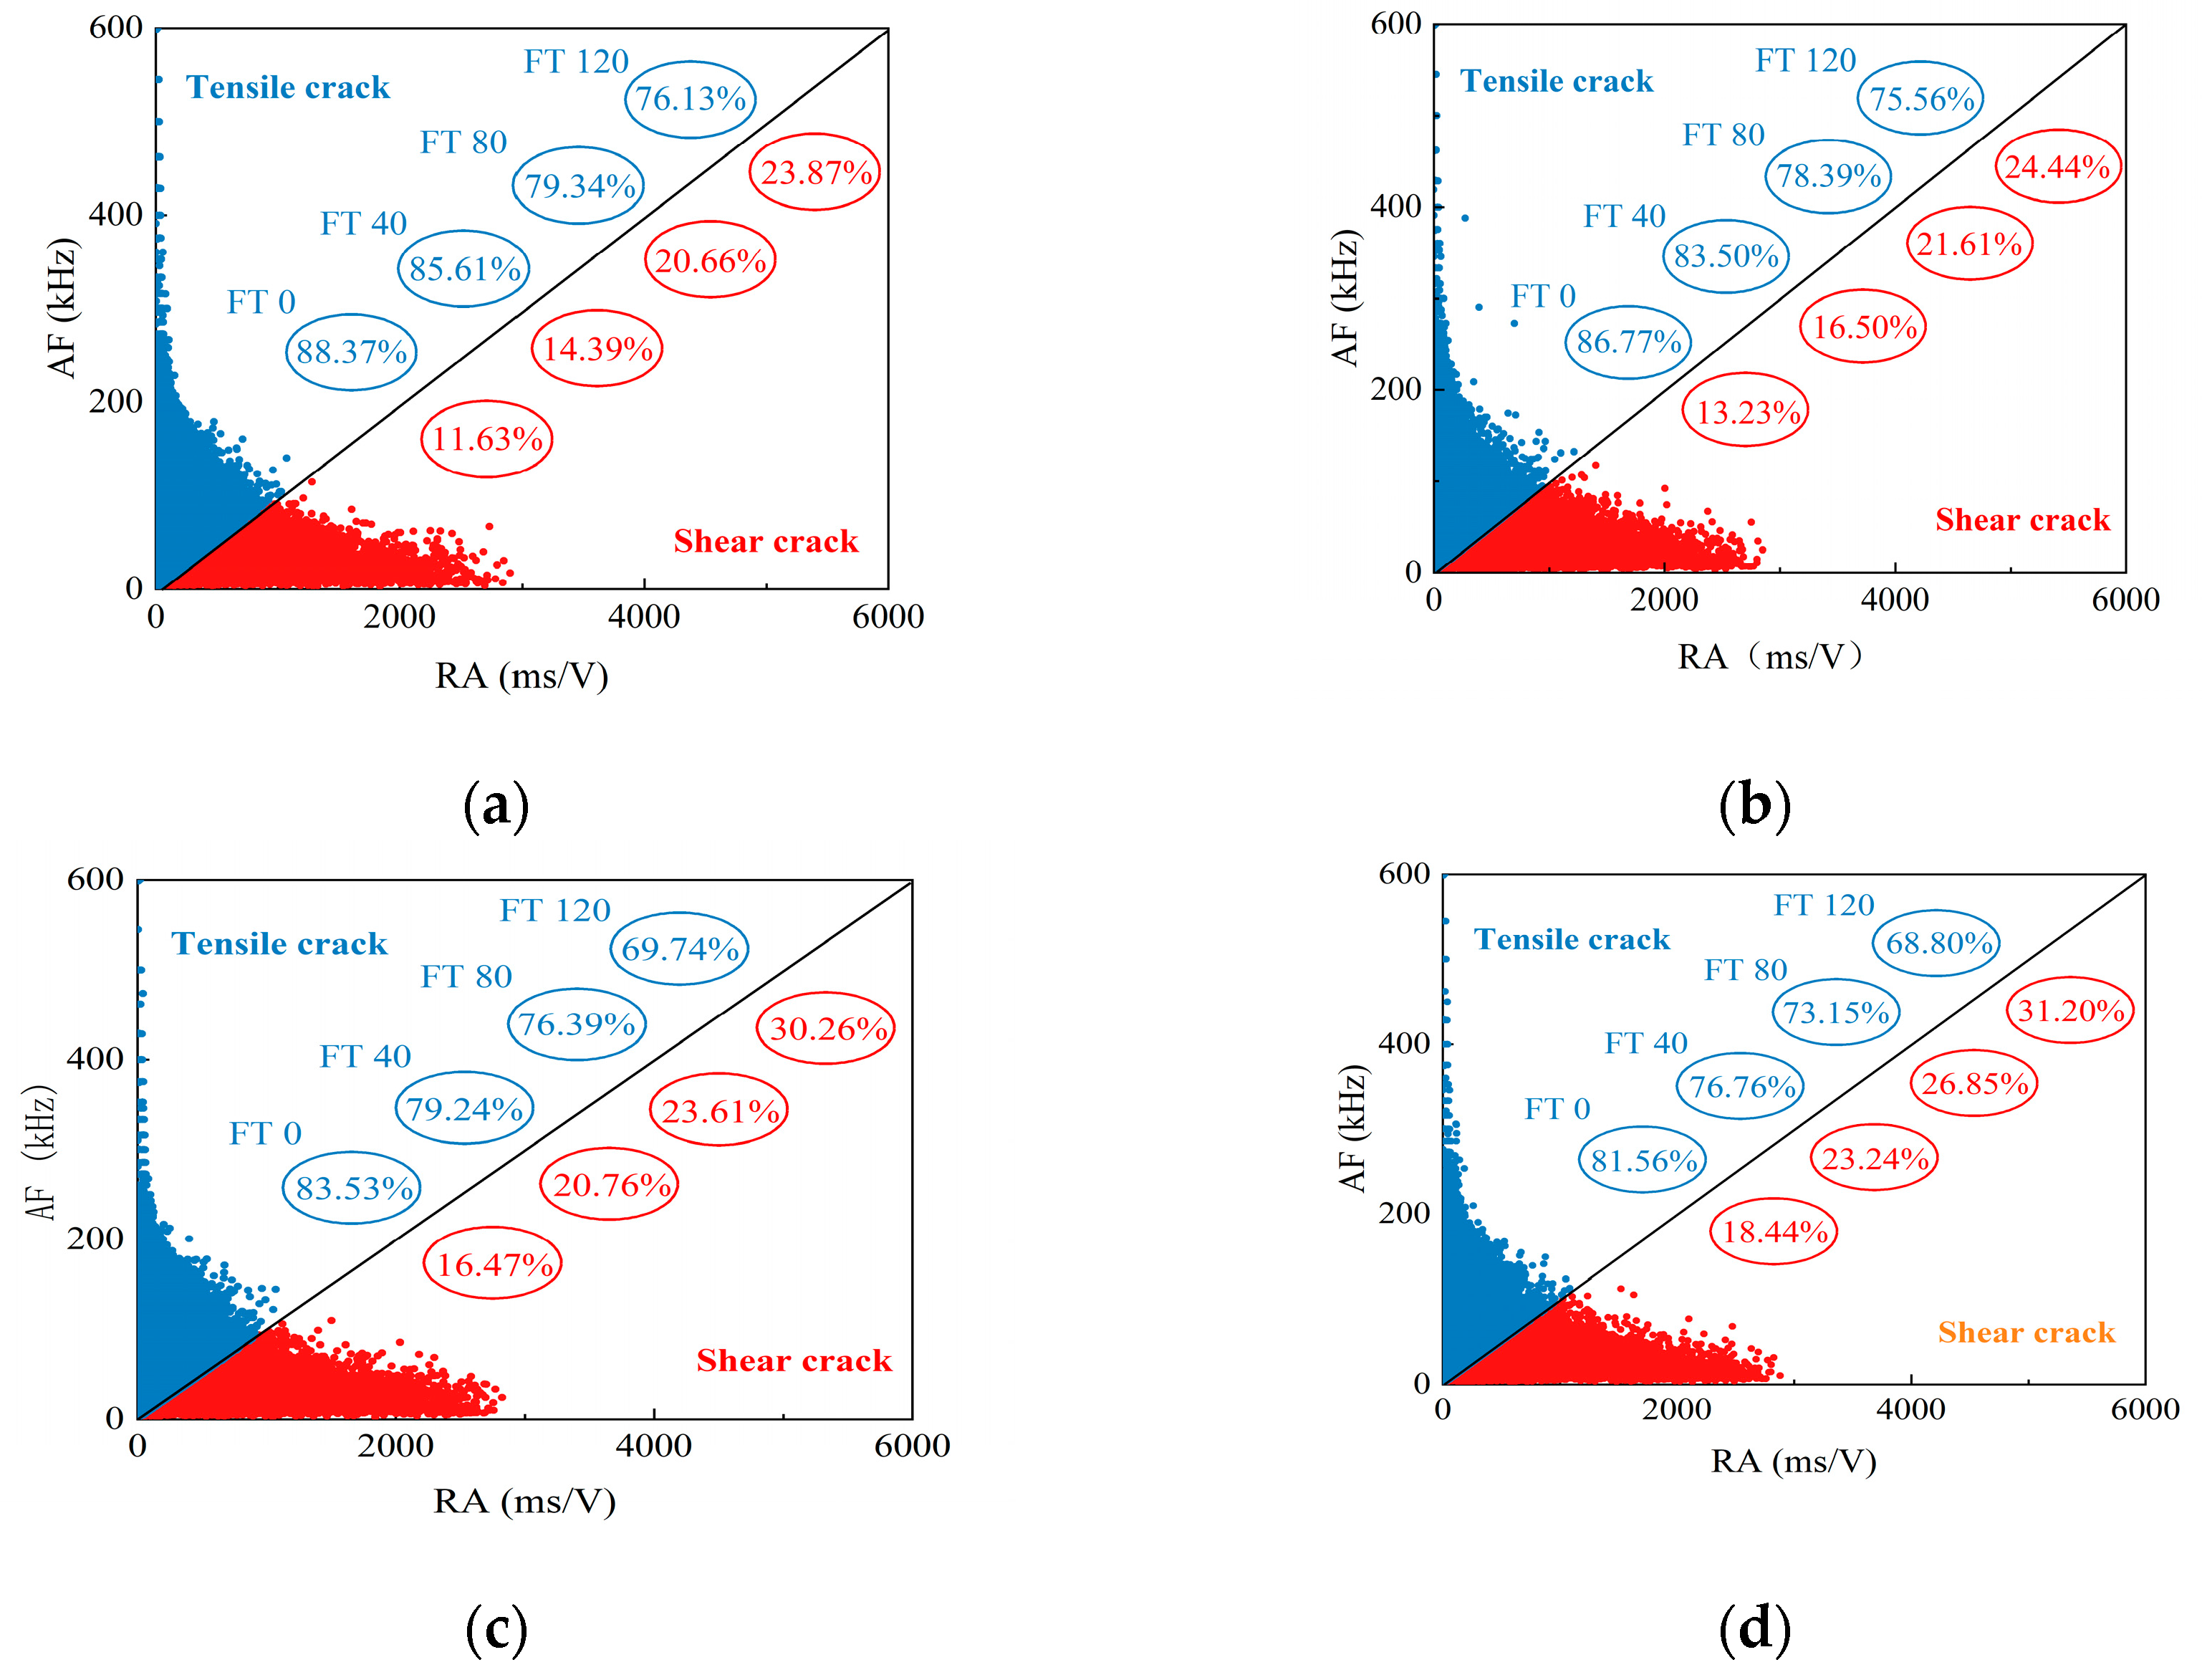
3.4. Acoustic Emission RA-AF Analysis

The expansion and penetration of internal microcracks primarily cause the failure of the PPF-MMS. Studies have shown [36] that the failure modes of the MMS are mainly tensile and shear failure under load. During the loading process, the development of tensile and shear cracks and their relative proportions continuously change over time. Therefore, studying these changes is crucial for understanding the failure mechanism of the PPF-MMS.
This section analyzes the failure types of specimens based on the correlation between RA-AF values. Here, RA represents the ratio of the rise time to the amplitude of the acoustic emission (AE) event, as shown in Formula (8), where the rise time refers to the time it takes for the AE signal to reach its peak value from the start. The amplitude represents the severity of the internal damage of the specimen. AF represents the ratio of the ringing count to the duration of the AE event, as shown in Formula (9), where the ringing count is the number of times the amplitude exceeds the threshold value during the duration of an AE event, and the duration refers to the time from the start to the end of the AE signal. Based on the RA-AF values, the PPF-MMS can be classified into tensile and shear failures.
R A = R i s e t i m e / A m p l i t u d e
A F = C ounts / Duration
The appearance of tensile cracks typically releases a large amount of energy instantaneously, characterized by a short rise time, large amplitude, high ringing frequency, and high AF value. In contrast, shear cracks exhibit longer rise times and durations, fewer ringing occurrences, and higher RA values. The ratio of the average frequency AF to the RA parameter is commonly used to assess the cracking mode of microcracks under tensile loading. A more considerable AR value indicates tensile cracking, while a smaller value corresponds to shear cracking. To investigate the damage modes of the PPF-MMS under freeze–thaw cycles, AE signals are analyzed by calculating RA-AF values under various loading conditions in a freeze–thaw environment. The ratio of RA to AF is affected by the properties of the detected material. Based on empirical values, the ratio is taken as 30.
Figure 20 shows the RA-AF relationship values for the PPF-MMS under different stress ratio loading conditions in a freeze–thaw environment. Figure 21 illustrates the schematic of the microcracks at the interface of fiber-reinforced stone masonry. It can be observed that the overall fracture mode of the specimens is primarily tensile failure, with shear failure being less frequent. Specifically, when the lateral pressure is constant, as the number of freeze–thaw cycles increases, the number of AE events with high RA values increases during biaxial compression, indicating a higher proportion of shear failure. In contrast, the number of AE events with high AF values decreases, indicating a reduced proportion of tensile failure. For example, when the stress ratio is 0.5, the tensile failure proportion of the PPF-MMS in compression decreases from 86.77% to 83.50%, 78.39%, and 75.56%.
In comparison, the proportion of shear failures increases from 13.23% to 16.50%, 21.60%, and 24.44%. The remaining specimens demonstrate a similar trend. This is attributed to the fact that shear cracks are predominantly initiated by the propagation of microcracks, which subsequently lead to sliding and friction. As the freeze–thaw cycles increase, the internal structure of the specimen becomes more porous, making it more prone to microcracking under load, which in turn leads to a higher proportion of shear failure.
When the number of freeze–thaw cycles is held constant, an increase in lateral pressure results in a decrease in the proportion of tensile failure and a corresponding increase in the proportion of shear failure. This phenomenon can be attributed to the fact that lateral pressure constrains the lateral expansion of the specimen during compression. Consequently, tremendous lateral pressure exerts stronger confinement on tensile cracks, thereby reducing their formation.

4. Conclusions

This study conducts three-point bending tests, uniaxial compression tests, loading with different stress ratios, and freeze–thaw cycling tests. Combined with digital image technology and acoustic emission technology, the damage evolution mode of PPF mortar rubble under loading with different stress ratios was detected throughout the process. Experimental studies were conducted to analyze its failure mode, fracture mode, mechanical properties, frost resistance performance, and damage evolution mechanism. The strength criteria and freeze–thaw damage evolution model of PPF mortar rubble under biaxial different stress ratio loading under freeze–thaw cycling conditions were obtained. The main conclusions are as follows:
  • Comprehensively considering the three characteristics of uniaxial compressive strength, flexural strength, and freeze–thaw mass loss rate, it is concluded that when the PPF mortar rubble is between 0.9 and 1.1 kg/m3, both the compressive strength and the flexural strength of the rubble are relatively large, and the mass loss rate is relatively small. The durability of the specimens is good.
  • Compared with the uniaxial compression test, the ultimate compressive strength of different stress ratio loading methods all showed an increasing trend. Moreover, as the stress ratio increases, the development trend of the vertical pressure of the ultimate compressive strength exhibits a parabolic shape. When α = 0.5, the strength reaches the maximum. By correcting the parameters in the Kupfer criterion and establishing the biaxial failure criterion of PPF mortar rubble under different freeze–thaw cycle times, the test results were fitted, and the fitting effect was good.
  • The freeze–thaw cycle leads to intensified damage and failure of PPF mortar rubble specimens. Under the same number of freeze–thaw cycles, the strength attenuation amplitude of the specimens without fiber addition was significantly increased compared with that of the specimens with fiber addition. To a certain extent, the existence of lateral pressure can inhibit the development of slate damage, increase the compressive strength of the specimen, provide specific stability, and delay the occurrence of failure. Based on the test results, a freeze–thaw damage evolution model was established. By fitting the test results, this model has a good fitting effect on PP fiber mortar rubble.
  • Based on the theory of statistical analysis, it is concluded that the sharp fluctuations in the evolution rate of NAD in the middle stage can be regarded as the signal of specimen cracking, and the sharp fluctuations in the latter stage can be regarded as the signal of specimen failure. Moreover, with the increase in the number of freeze–thaw cycles, the fluctuation degree of the evolution rate of NAD becomes larger and larger, and the process of damage is accelerated simultaneously.
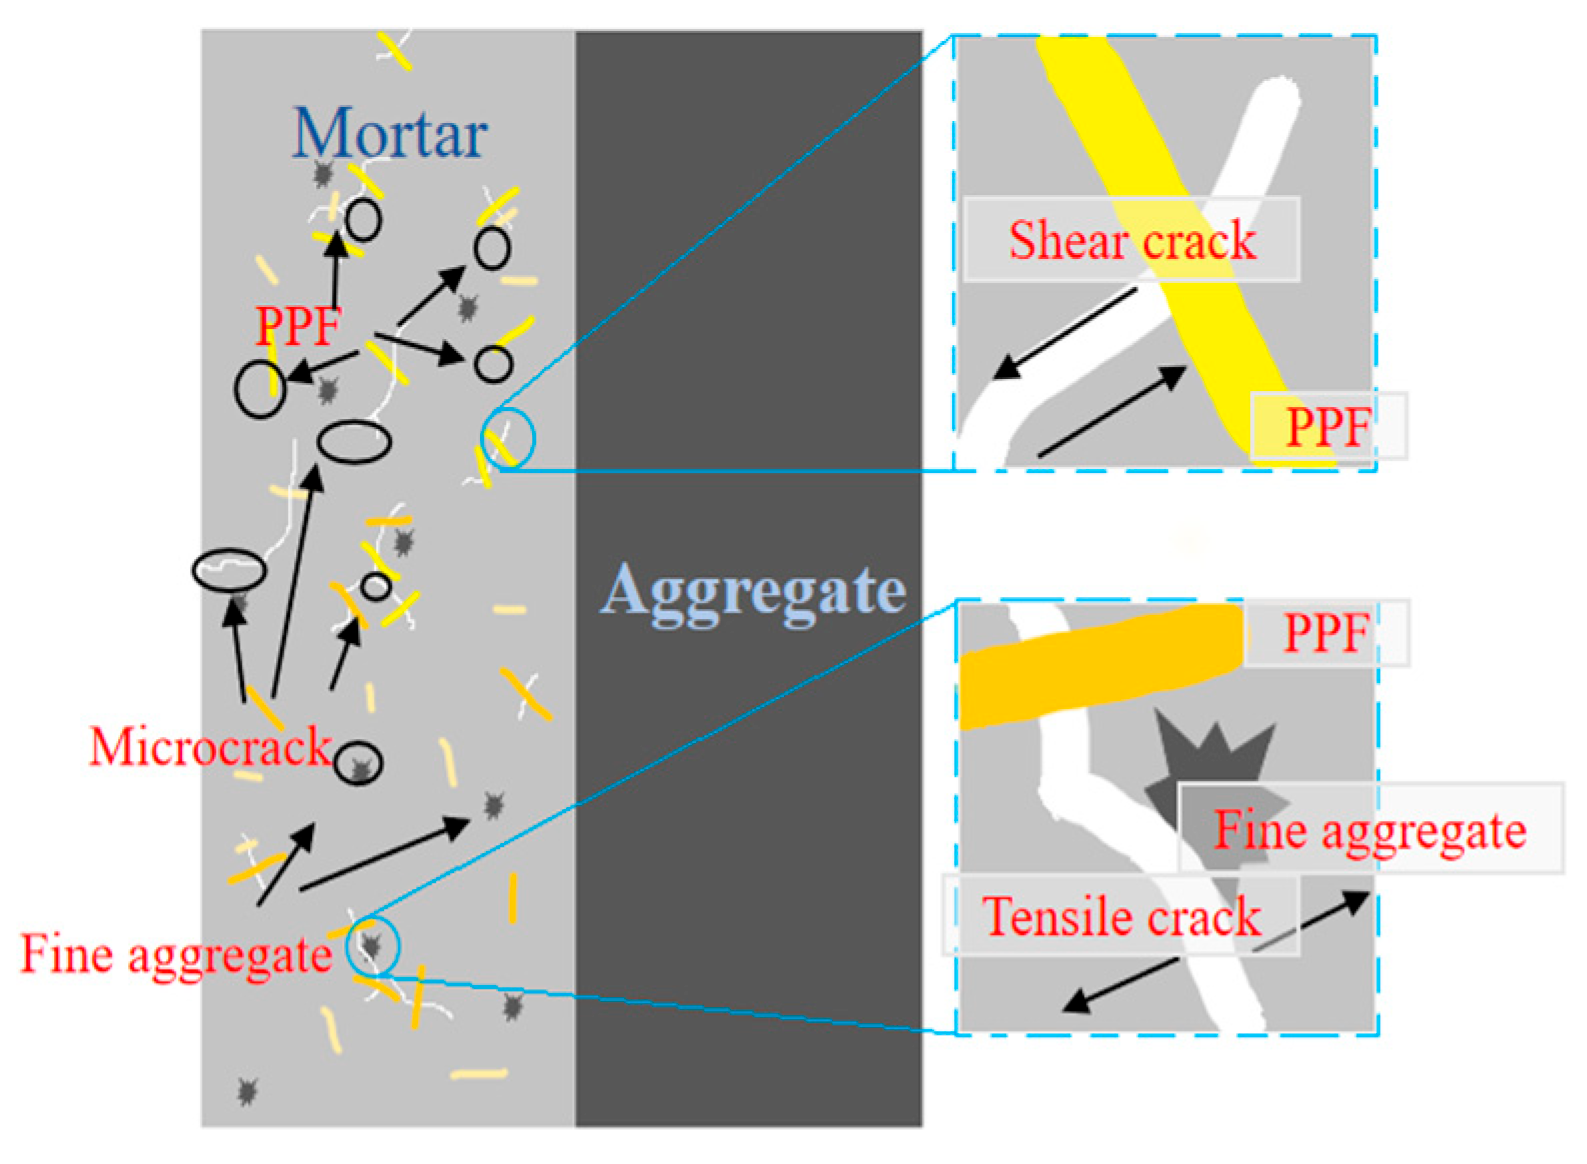
  • Through the analysis of the distribution of RA-AF values, the specimens mainly suffered tensile failure during the failure process, while shear failure was relatively rare. Meanwhile, the increase in the stress ratio will weaken the lateral expansion effect generated during the loading process of the principal stress. With an increase in the number of freeze–thaw cycles, this will cause damage to the internal structure of the rubble, resulting in a decrease in the number of tensile cracks.

Author Contributions

Conceptualization, J.D.; methodology, J.D. and H.Z.; validation, J.D. and H.Z.; formal analysis, Z.J. and Z.Y.; investigation, L.G. and H.C.; resources, S.Z., S.C. and J.C.; data curation, Z.J.; writing—original draft preparation, H.Z.; writing—review and editing, H.Z. and Z.J.; visualization, Z.Y. and J.C.; supervision, S.Z. and S.C.; funding acquisition, J.D. All authors have read and agreed to the published version of the manuscript.

Funding

The research described in this paper was financially supported by the Natural Science Foundation of China (No. 51878242) and the Natural Science Foundation of Hebei Province of China (Nos. E2020404007 and E2024404006).

Data Availability Statement

The data presented in this study are available on request from the corresponding author.

Conflicts of Interest

Author Jinfei Chai was employed by the company China Academy of Railway Sciences Corporation Limited. The remaining authors declare that the research was conducted in the absence of any commercial or financial relationships that could be construed as a potential conflict of interest.

Abbreviations

The following abbreviations are used in this manuscript:
MMSmortar-masonry stone
PPFpolypropylene fiber
NADnormalized average deviation
DICdigital image correlation
AEacoustic emission
RArise time/amplitude
AFcounts/duration

References

  1. Sun, Z.; Ma, W.; Li, D. In situ test on cooling effectiveness of the air convection embankment with crushed rock slope protection in permafrost regions. Terra Nostra 2005, 19, 38–51. [Google Scholar]
  2. Zhu, X.; Chen, Z.; Ren, Y. The application of ecological treatment technology of bolt and lattice beam in highway mountain slope support. Geotech. Geol. Eng. 2019, 37, 1891–1896. [Google Scholar] [CrossRef]
  3. Hong, L.; Chen, Y.D.; Li, T.D.; Gao, P.; Sun, L.Z. Microstructure and bonding behavior of fiber-mortar interface in fiber-reinforced concrete. Constr. Build. Mater. 2020, 232, 117235. [Google Scholar] [CrossRef]
  4. Ahmad, J.; Zhou, Z. Mechanical Properties of Natural as well as Synthetic Fiber Reinforced Concrete: A Review. Constr. Build. Mater. 2022, 333, 127353. [Google Scholar] [CrossRef]
  5. Zhao, C.; Wang, Z.; Zhu, Z.; Guo, Q.; Wu, X.; Zhao, R. Research on different types of fiber reinforced concrete in recent years: An overview. Constr. Build. Mater. 2023, 365, 130075. [Google Scholar] [CrossRef]
  6. Shafei, B.; Kazemian, M.; Dopko, M.; Najimi, M. State-of-the-Art Review of Capabilities and Limitations of Polymer and Glass Fibers Used for Fiber-Reinforced Concrete. Materials 2021, 14, 409. [Google Scholar] [CrossRef] [PubMed]
  7. Akid, A.S.M.; Hossain, S.; Munshi, I.U.; Elahi, M.A.; Sobuz, H.R.; Tam, V.W.; Islam, S. Assessing the influence of fly ash and polypropylene fiber on fresh, mechanical and durability properties of concrete. J. King Saud Univ. Eng. Sci. 2023, 35, 474–484. [Google Scholar] [CrossRef]
  8. El Ouni, M.H.; Shah, S.H.; Ali, A.; Muhammad, S.; Mahmood, M.S.; Ali, B.; Marzouki, R.; Raza, A. Mechanical performance, water and chloride permeability of hybrid steel-polypropylene fiber-reinforced recycled aggregate concrete. Case Stud. Constr. Mater. 2022, 16, e831. [Google Scholar] [CrossRef]
  9. Ja, I.A.; Muda, Z.C.; Amran, M.; Syamsir, A.; Amaechi, C.V.; Al-Qadami, E.H.H.; Huenchuan, M.A.D.; Avudaiappan, S. Modelling and optimisation of the structural performance of lightweight polypropylene fibre-reinforced LECA concrete. Results Eng. 2024, 24, 103149. [Google Scholar] [CrossRef]
  10. Zhang, H.; Gao, Y.; Li, F.; Lu, F.; Sun, H. Experimental study on dynamic properties and constitutive model of polypropylene fibre concrete under high-strain rates. Eur. J. Environ. Civ. Eng. 2013, 17 (Suppl. S1), s294–s303. [Google Scholar] [CrossRef]
  11. Zhang, Y.F.; Liu, H.; Chen, J.P.; Yang, Y. Numerical Simulation on PPFRC with Different Contents. Appl. Mech. Mater. 2014, 477, 1019–1025. [Google Scholar] [CrossRef]
  12. Li, L.; Sun, H.-X.; Zhang, Y.; Yu, B. Surface Cracking and Fractal Characteristics of Bending Fractured Polypropylene Fiber-Reinforced Geopolymer Mortar. Fractal Fract. 2021, 5, 142. [Google Scholar] [CrossRef]
  13. Li, B.; Chi, Y.; Xu, L.; Shi, Y.; Li, C. Experimental investigation on the flexural behavior of steel-polypropylene hybrid fiber reinforced concrete. Constr. Build. Mater. 2018, 191, 80–94. [Google Scholar] [CrossRef]
  14. Latifi, M.R.; Biricik, Ö.; Mardani Aghabaglou, A. Effect of the addition of polypropylene fiber on concrete properties. J. Adhes. Sci. Technol. 2022, 36, 345–369. [Google Scholar] [CrossRef]
  15. Wu, J.; Hu, L.; Hu, C.; Wang, Y.; Zhou, J.; Li, X. Impact of Polypropylene Fiber on the Mechanical and Physical Properties of Pervious Concrete: An Experimental Investigation. Buildings 2023, 13, 1966. [Google Scholar] [CrossRef]
  16. Shi, J.; Wang, H.; Cao, X. Mechanical Behavior and Innovative Applications of Fiber-Reinforced Cementitious Composite and Fiber-Reinforced Polymer in Infrastructures. Buildings 2024, 14, 3993. [Google Scholar] [CrossRef]
  17. Xu, J.; Niu, X.; Yao, Z. Mechanical properties and acoustic emission data analyses of crumb rubber concrete under biaxial compression stress states. Constr. Build. Mater. 2021, 298, 123778. [Google Scholar] [CrossRef]
  18. Wang, H.C.; Zhao, J.; Li, J.; Liu, K.; Braithwaite, C.H.; Zhang, Q.B. Dynamic mechanical properties and fracturing behaviour of concrete under biaxial compression. Constr. Build. Mater. 2021, 301, 124085. [Google Scholar] [CrossRef]
  19. Zhou, J.; Pan, J.; Zhang, L.; Zhao, J.; Li, Z. Experimental study on mechanical behavior of high-strength high-performance concrete under biaxial loading. Constr. Build. Mater. 2020, 258, 119681. [Google Scholar] [CrossRef]
  20. Dong, J.; Cheng, S.; Chen, H.; Zhang, H.; Zhao, Y.; Zhang, G.; Gong, F. Examination of Damage Evolution in Slurry Masonry Schist Subjected to Biaxial Compressive Stresses. Buildings 2024, 14, 1942. [Google Scholar] [CrossRef]
  21. Li, P.; Li, S.; Liu, Z.; Lu, Y.; Yang, F. Study on the biaxial mechanical behavior of steel fiber reinforced recycled aggregate concrete. Constr. Build. Mater. 2024, 428, 136372. [Google Scholar] [CrossRef]
  22. Li, H.; Sun, H.; Tian, J.; Yang, Q.; Wan, Q. Mechanical and Ultrasonic Testing of Self-Compacting Concrete. Energies 2019, 12, 2187. [Google Scholar] [CrossRef]
  23. Skarżyński, A.; Suchorzewski, J. Mechanical and fracture properties of concrete reinforced with recycled and industrial steel fibers using Digital Image Correlation technique and X-ray micro computed tomography. Constr. Build. Mater. 2018, 183, 283–299. [Google Scholar] [CrossRef]
  24. Liu, Y.; Zeng, L.; Xiang, S.; Mo, J.; Zhang, J.; Chen, J.; Cheng, G. Compressive performance evaluation of concrete confined by stirrups at elevated temperature using DIC technology. Constr. Build. Mater. 2020, 260, 119883. [Google Scholar] [CrossRef]
  25. Li, D.; Huang, P.; Chen, Z.; Yao, G.; Guo, X.; Zheng, X.; Yang, Y. Experimental study on fracture and fatigue crack propagation processes in concrete based on DIC technology. Eng. Fract. Mech. 2020, 235, 107166. [Google Scholar] [CrossRef]
  26. Chen, J.; Zhang, X.; Zhan, N.; Hu, X. Deformation measurement across crack using two-step extended digital image correlation method. Opt. Lasers Eng. 2010, 48, 1126–1131. [Google Scholar] [CrossRef]
  27. Gajewski, T.; Garbowski, T. Calibration of concrete parameters based on digital image correlation and inverse analysis. Arch. Civ. Mech. Eng. 2014, 14, 170–180. [Google Scholar] [CrossRef]
  28. Skarżyński, A.; Syroka, E.; Tejchman, J. Measurements and Calculations of the Width of the Fracture Process Zones on the Surface of Notched Concrete Beams. Strain 2011, 47 (Suppl. S1), e319–e332. [Google Scholar] [CrossRef]
  29. Golewski, G.L. Measurement of fracture mechanics parameters of concrete containing fly ash thanks to use of Digital Image Correlation (DIC) method. Measurement. J. Int. Meas. Confed. 2019, 135, 96–105. [Google Scholar] [CrossRef]
  30. Chen, C.; Chen, X. Experimental study of fracture damage characteristics in steel slag porous concrete based on acoustic emission technique. Constr. Build. Mater. 2024, 456, 139127. [Google Scholar] [CrossRef]
  31. Yang, L.; Xie, H.; Zhang, D.; Zhang, F.; Lin, C.; Fang, S. Acoustic emission characteristics and crack resistance of basalt fiber reinforced concrete under tensile load. Constr. Build. Mater. 2021, 312, 125442. [Google Scholar] [CrossRef]
  32. Xargay, H.; Ripani, M.; Folino, P.; Núñez, N.; Caggiano, A. Acoustic emission and damage evolution in steel fiber-reinforced concrete beams under cyclic loading. Constr. Build. Mater. 2021, 274, 121831. [Google Scholar] [CrossRef]
  33. Bu, J.; Wu, X.; Xu, H.; Chen, X. The rate effect on fracture mechanics of dam concrete based on DIC and AE techniques. J. Strain Anal. Eng. Des. 2022, 57, 496–510. [Google Scholar] [CrossRef]
  34. Luo, T.; Pan, X.; Tang, L.; Sun, Q.; Pan, J. Research on Splitting-Tensile Properties and Failure Mechanism of Steel-Fiber-Reinforced Concrete Based on DIC and AE Techniques. Materials 2022, 15, 7150. [Google Scholar] [CrossRef] [PubMed]
  35. Xu, X.; Jin, Z.; Yu, Y.; Li, N. Damage source and its evolution of ultra-high performance concrete monitoring by digital image correlation and acoustic emission technologies. J. Build. Eng. 2023, 65, 105734. [Google Scholar] [CrossRef]
  36. Bu, J.; Xu, H.; Wu, X.; Chen, X.; Xu, B. Experimental study on fracture properties of dam concrete under post-peak cyclic loading based on DIC and acoustic emission techniques. Fatigue Fract. Eng. Mater. Struct. 2022, 45, 2646–2661. [Google Scholar] [CrossRef]
  37. Li, Z.-Q.; Chen, H.; Dong, J.; Yan, X.; Zhao, S.-R.; Zheng, Y.-H.; Liu, Y. Study of the Failure Mechanism of Mortar Rubble Using Digital Image Correlation, Acoustic Emission and Scanning Electron Microscopy. Buildings 2022, 12, 1313. [Google Scholar] [CrossRef]
  38. Dong, J.; Li, Z.-Q.; Yan, X.; Liu, Y.; Zhao, S.-R.; Qian, R.; Zheng, Y.-H.; Jiang, T. Effects of coarse aggregates on the mechanical properties, durability and microscopic behaviour of mortar rubble. Constr. Build. Mater. 2022, 354, 129187. [Google Scholar] [CrossRef]
  39. Korol, E.; Tejchman, J.; Mróz, Z. Experimental and numerical assessment of size effect in geometrically similar slender concrete beams with basalt reinforcement. Eng. Struct. 2017, 141, 272–291. [Google Scholar] [CrossRef]
  40. Xu, Y.; Xing, G.; Zhao, J.; Zhang, Y. The effect of polypropylene fiber with different length and dosage on the performance of alkali-activated slag mortar. Constr. Build. Mater. 2021, 307, 124978. [Google Scholar] [CrossRef]
  41. Yang, H.; Li, H.; Li, C.; Yang, Q.; Jiang, J. Biaxial compressive failure criteria and constitutive model of high-strength geopolymer concrete after high temperature. Constr. Build. Mater. 2024, 426, 136165. [Google Scholar] [CrossRef]
  42. Kupfer, H.B. Nonlinear behavior of concrete under biaxial stresses. Beton Stahlbetonbau 1973, 11, 269–274. (In German) [Google Scholar]
  43. Zhang, H.; Huang, G.; Song, H.; Kang, Y. Experimental characterization of strain localization in rock. Geophys. J. Int. 2013, 194, 1554–1558. [Google Scholar] [CrossRef]
Figure 1. Tests related to the optimal fiber content: (a) uniaxial compression test, (b) three-point bending test, and (c) freeze–thaw cycle test.
Buildings 15 02468 g001
Figure 2. Schematic diagram of loading test with different stress ratios.
Buildings 15 02468 g002
Figure 3. Loading schematic: (a) loading path and (b) loading ratio schematic.
Buildings 15 02468 g003
Figure 4. Acoustic emission sensor channel layout.
Buildings 15 02468 g004
Figure 5. Compressive strength of PPF slurry flake stones at different ages.
Buildings 15 02468 g005
Figure 6. Bending strength.
Buildings 15 02468 g006
Figure 7. Bending failure mode.
Buildings 15 02468 g007
Figure 8. Relationship between the quality loss rate and the number of freeze–thaw cycles.
Buildings 15 02468 g008
Figure 9. Optimum dosage of polypropylene fiber.
Buildings 15 02468 g009
Figure 10. Loading failure modes with different stress ratios: (a) σxz = 0.25, (b) σxz = 0.5, (c) σxz = 0.75, and (d) σxz = 1.
Buildings 15 02468 g010aBuildings 15 02468 g010b
Figure 11. Changes of principal stress with stress ratio under different stress ratios. (a) Add 0 kg/m3 of fibers. (b) Add 1 kg/m3 of fibers.
Buildings 15 02468 g011
Figure 12. Peak strain curves under different freeze–thaw cycles.
Buildings 15 02468 g012
Figure 13. Comparison between Kupfer criterion curve and test results.
Buildings 15 02468 g013
Figure 14. Biaxial failure criterion under loading modes with different stress ratios.
Buildings 15 02468 g014
Figure 15. Mass loss rate and freeze–thaw cycle.
Buildings 15 02468 g015
Figure 16. Strength loss rate and freeze–thaw cycle relationship.
Buildings 15 02468 g016
Figure 17. Relationship between freeze–thaw damage factors and freeze–thaw times.
Buildings 15 02468 g017
Figure 18. Normalized mean deviation: (a) σxz = 0.25, (b) σxz = 0.5, (c) σxz = 0.75, and (d) σxz = 1.
Buildings 15 02468 g018
Figure 19. Normalized mean deviation: (a) 40, (b) 80, and (c) 120.
Buildings 15 02468 g019
Figure 20. Fracture mechanism of different loading modes under freeze–thaw conditions: (a) σxz = 0.25, (b) σxz = 0.5, (c) σxz = 0.75, and (d) σxz = 1.
Buildings 15 02468 g020
Figure 21. Crack classification based on RA-AF values.
Buildings 15 02468 g021
Table 1. Physical and mechanical parameters of granite.
Aggregate TypeCompressive
Strength
(MPa)
Bending
Strength
(MPa)
Water
Absorption
(%)
Density
(kg/m3)
Granite120150.302650
Table 2. Basic parameters of PO. 42.5 cement.
ParameterCompressive Strength (MPa)Bending Strength (MPa)Fineness
(mm)
3d28d3d28d
Value18434.26.60.03
Table 3. Basic parameters of polypropylene fiber.
Physical
Properties
Diameter (µm)Specific Gravity (g/cm3)Tensile Strength (MPa)Elastic Modulus (MPa)ColorShape
Polypropylene fiber300.905574100WhiteFasciculate
monofilament
Table 4. Proportion of rubble masonry materials used.
GroupMix Ratio (kg/m3)Fiber
Dosage (kg/m3)
CementSandWaterAggregateWater
Reducer
146272417515121.620
20.5
30.75
41
51.25
61.5
Table 5. Testing conditions.
Loading MethodFiber Content (kg/m3)Freeze–Thaw
Cycles
Stress
Ratio
Quantity of Specimens
Three-point
bending
0, 0.5, 0.75, 1, 1.25, 1.5 Three specimens for each case
Uniaxial compression0, 0.5, 0.75, 1, 1.25, 1.50, 40,
80, 120
Different stress ratio loading10, 40,
80, 120
0.25, 0.5
0.75, 1
Table 6. Digital image correlation test system.
Iterate the Residual ThresholdDistinguish TypesCapture FrequencySearch RadiusIterative ThresholdPixel
40Bilinear interpolation1.2 Hz750.12000
Table 7. Acoustic emission system parameters.
ParametersPDT/µsHDT/µsHLT/µsAmplification Gain ValueSampling Rate
Numerical value300850650303
Table 8. Analysis results of failure criterion parameters under different freeze–thaw cycles.
Freeze–Thaw CyclesabR2
0−1.04055−4.089990.99692
40−1.0243−3.804010.97388
80−1.00868−3.522670.98017
120−0.95719−3.25490.98436
Table 9. Fitting parameters of freeze–thaw damage model of polypropylene fiber slurry masonry.
Loading ModeabR2
α = 0.250.175691.469960.99446
α = 0.50.165571.554430.99775
α = 0.750.185551.808840.9743
α = 10.179060.926150.99285
Disclaimer/Publisher’s Note: The statements, opinions and data contained in all publications are solely those of the individual author(s) and contributor(s) and not of MDPI and/or the editor(s). MDPI and/or the editor(s) disclaim responsibility for any injury to people or property resulting from any ideas, methods, instructions or products referred to in the content.

