Abstract
To address the challenges of slow construction and high self-weight in steel–concrete composite floors for rural light steel frame structures in China, a new prefabricated floor system was developed. This system features prefabricated slabs made from recycled concrete, connected via reinforced shear pocket joints. In seismic environments, assembly floor joints often become vulnerable points, making their shear resistance particularly crucial. This study investigated the shear performance of this new type of floor joint, examining the effects of various parameters such as joint configuration, stud diameter, recycled concrete strength, and grout strength. A refined finite element model was established for an in-depth parameter analysis. The research revealed stud–shear failure as the mode of floor joint failure under different design parameters. The detailed design of the new joint structure ensures safety in the floor joint area. Increasing stud diameter, recycled concrete strength, and grout strength all contributed to enhancing the joint’s shear capacity and stiffness, with stud diameter having the most significant impact. Higher recycled concrete strength improved shear capacity, although its influence decreased beyond a certain threshold. Optimal reserved hole diameter proved beneficial for enhancing joint shear performance, with a diameter of 40 mm showing superior performance.
1. Introduction
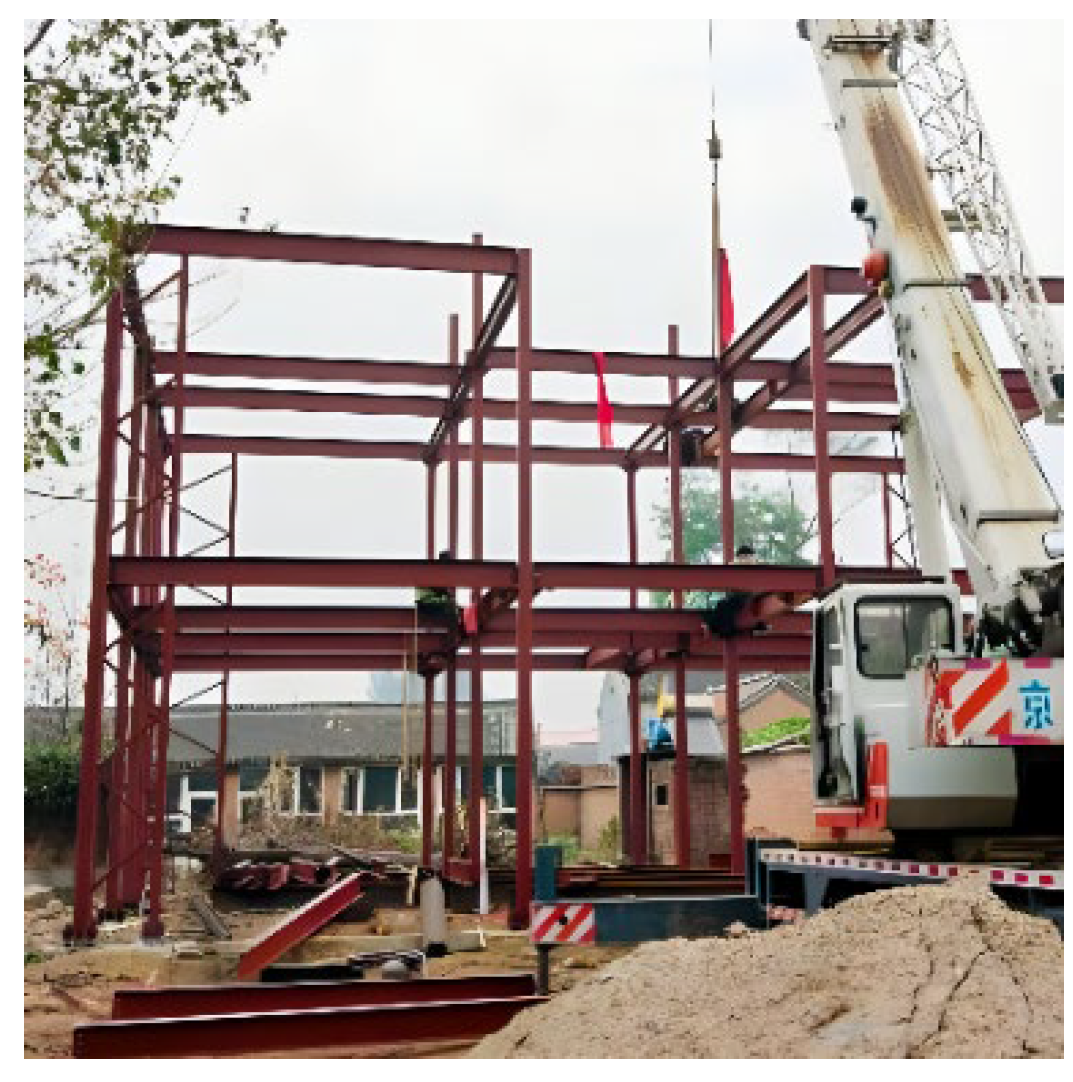
China is one of the countries most severely affected by seismic activity worldwide. Destructive earthquakes mostly occur in rural areas, where buildings are vulnerable to seismic disasters, leading to collapsed houses and casualties [1]. Prefabricated components of light steel composite frame structures (Figure 1) are lightweight, possess good seismic resistance, and are easy to construct. They can effectively enhance the seismic performance of rural residences in China [2,3].

Figure 1.
Prefabricated light steel composite frame structure.
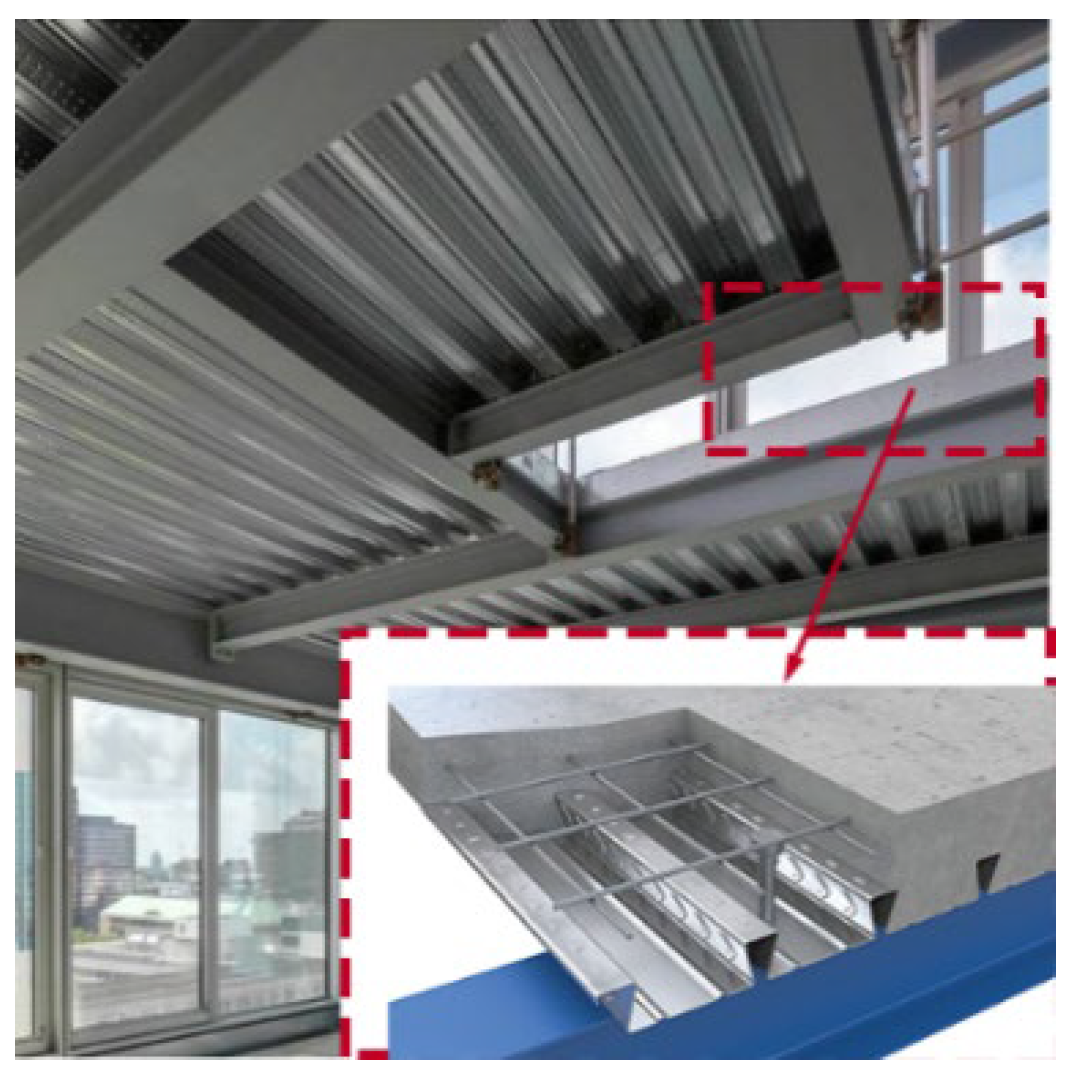
Composite steel deck slabs are commonly used in prefabricated light steel composite frame structures. These slabs consist of profiled steel sheets and concrete that work together and deform in a coordinated manner through the use of shear connectors (Figure 2). Porter and Ekberg [4] conducted 353 full-scale tests to study the typical failure modes and mechanical behaviors of floors, finding that the primary failure mode of composite floors is shear–bond failure. Daniels and Crisinel [5], using a combination of node testing and numerical calculations, identified that the shear–span ratio is a critical factor affecting the longitudinal shear capacity of composite floors. Tenhovuori and Leskela [6] concluded that thicker composite floors and smaller shear spans result in higher longitudinal shear capacities. Marciukaitis et al. [7] proposed methods to calculate the deflections of composite floors under different bending limit states.
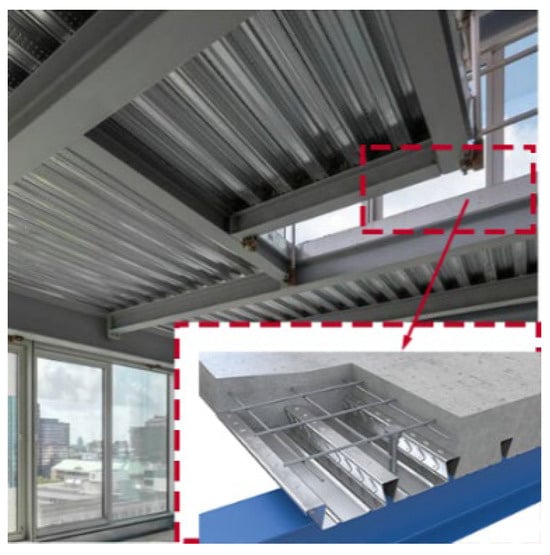
Figure 2.
Composite steel deck slab structure.
While profiled steel sheet composite floors exhibit good load-bearing performance, their construction requires rebar placement and concrete pouring, which prolongs overall construction cycles. Moreover, the need for larger floor thickness, substantial support moduli, and extensive wet operations work against the economical and rapid construction benefits of light steel composite structures for rural housing. There is an urgent need in these contexts for innovative floor and joint designs that offer superior safety performance and faster construction speeds.
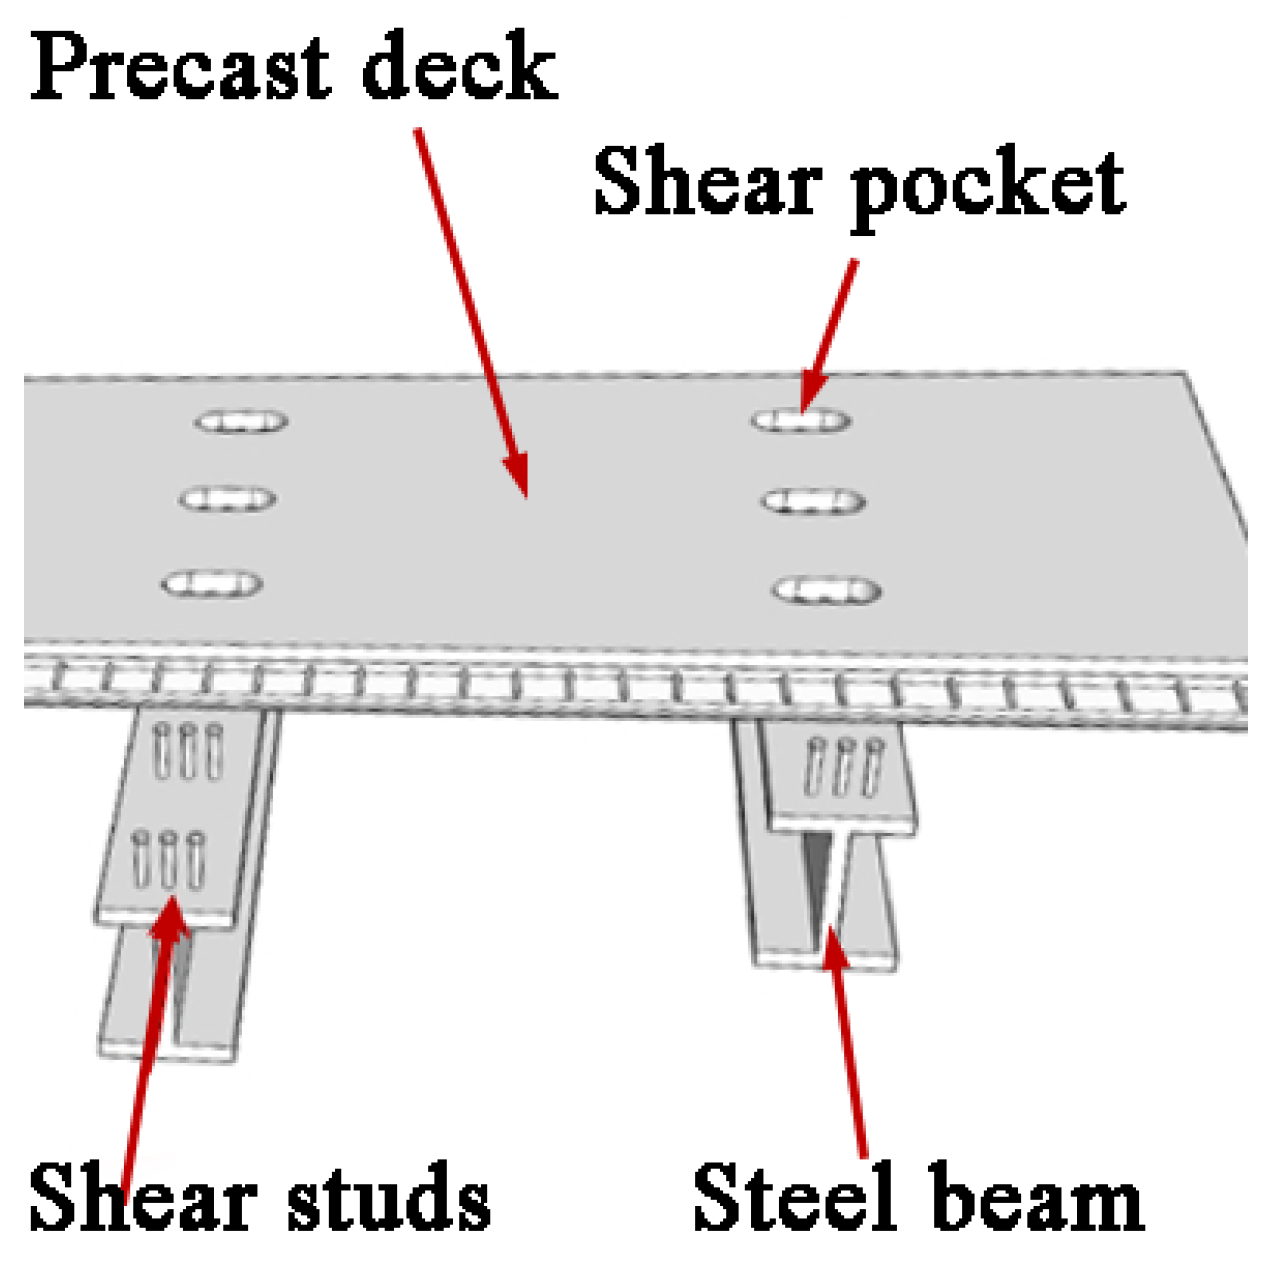
Shear pocket connections are a crucial technique in prefabricated bridge deck technology, as shown in Figure 3. These connections involve pre-designed and reserved holes in prefabricated bridge decks. These pockets are installed by positioning shear studs on steel beams, followed by pouring high-strength grout to complete the connection between the prefabricated panels and the steel beams [8,9,10]. The performance of shear pocket connections at nodes is critical, and international scholars have validated their effectiveness and reliability in bridge structures through experimental studies and numerical simulations. Raed et al. [11] developed criteria and procedures for shear pocket connections in full-depth precast concrete deck systems. These design standards aid in determining the dimensions of shear connectors, shear pocket size, and thickness, as well as necessary anchorage and reinforcement to maximize connection capacity and ensure construction tolerances. Zhao et al. [12] investigated the shear performance of steel–wood screw connectors in grout bags, proposing a novel connection method where screw tips anchor within the grout bags, achieving a consistent dual plastic–hinge failure mode. This method not only enhances connection strength and ductility but also provides an environmentally friendly and efficient solution for steel–wood composite structures. El-Khier et al. [13] explored a new bridge construction method using Ultra-High Performance Concrete (UHPC) to connect precast concrete bridge decks and bridge girders. They evaluated UHPC interface shear resistance through L-shaped push-off tests, double shear tests, and full-scale push-off tests. Hu et al. [14] studied the flexural performance of steel–UHPC composite beams using shear pockets, noting the absence of splitting cracks in UHPC and of concrete crushing of the UHPC slab surface during beam–specimen failure. Steel and UHPC showed good composite action, significantly improving the flexural performance of steel–UHPC composite beams. Shim et al. [15,16] conducted experimental studies demonstrating that shear-resistant connectors show better ductility in the composite beams of prefabricated concrete slabs compared to cast-in-place concrete composite beams. Applying prestress effectively suppressed crack growth at the transverse joints of prefabricated slabs.

Figure 3.
Shear pocket–joint connection structure.
The research team adapted the shear pocket connection technique by applying precast floor slabs in light steel composite frame structures, forming light steel composite floor systems that significantly increase construction speed (Figure 4). The prefabricated slabs can be quickly positioned onto the studs of the light steel beams via the shear pocket joints, and a rapid connection is achieved by filling with high-strength grout. The high degree of prefabrication and simplified construction process significantly enhance the installation speed of the floor system, thereby addressing the issue of low construction efficiency in rural buildings. In Figure 4, the reserved holes in the floor system are close to the edges of the precast slabs. To enhance the safety and shear resistance of the joints, we propose a reinforced shear pocket (RSP) joint. This joint incorporates built-in steel plates and corrugated steel pipes at the shear pockets of the precast floor slabs to improve shear resistance. The technology of recycled aggregate concrete (RAC) reuses waste resources, which contributes to the sustainable development of building materials. Extensive research has been conducted on RAC slabs [17], beams [18,19], columns [20], and walls [21,22], revealing differences in mechanical properties between recycled and ordinary concrete components. RAC components that are appropriately designed can be applied in engineering projects, and RAC technology is further used in light steel composite floor systems. The application of prefabricated RAC slabs not only promotes resourceful utilization of construction waste but also reduces the cost of the floor system, meeting the economic requirements of rural construction. Additionally, the absence of a cast-in-place layer allows the prefabricated slab thickness to be minimized according to structural capacity demands, which in turn reduces the self-weight of the floor and lowers the seismic response of the overall structure.
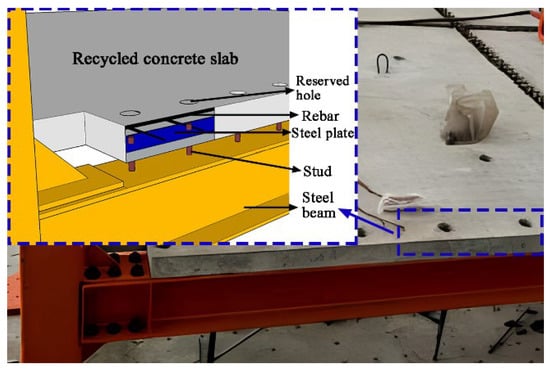
Figure 4.
Prefabricated light steel–recycled concrete composite floor.
In conclusion, our research group has integrated shear pocket connection joints with RAC technology to propose a novel light steel composite floor system. This system utilizes prefabricated RAC slabs with RSP joints. The slabs are positioned and installed on steel beams using these joints, and high-strength grout is used for rapid connection. This composite floor system is suitable for low- to mid-rise light steel composite frame structures in rural regions of China. Prefabricated floor systems can become weak points under seismic forces [23]. To ensure the overall integrity and reliable transmission of horizontal forces within the floor, the shear performance of the floor system’s connection nodes is crucial. In the new light steel composite floor system, the shear pocket joints have been optimized through the incorporation of embedded steel plates and corrugated tubes to enhance safety. However there has been little research on the shear performance of the RSP joints. Therefore, this paper conducts an in-depth study on the shear performance of RSP joints in steel–recycled concrete composite floor systems, discussing the effects of different parameters on the shear capacity and stiffness of the joints. This provides a theoretical foundation for the design and application of joints in new prefabricated light steel composite floor systems.
2. Experimental Program
2.1. Test Specimens
This study investigates the shear performance of RSP joints through push-out tests, examining parameters such as joint configuration, stud diameter, concrete strength, grout strength, and reserved hole diameter on the shear capacity of the joints. The experiment comprises six groups of parameters, each with two specimens, for a total of twelve specimens. Table 1 presents the specific test parameter design. Table 1 includes one group of ordinary shear pocket joint specimens and five groups of RSP joint specimens. Different test parameters are used for specimen numbering, with the format (W, B)i-Cj-Gk-Dm-(a, b). Here, W represents the ordinary shear pocket joint, B represents the RSP joint, i indicates the stud diameter size (mm), Cj represents the recycled concrete strength (MPa), Gk represents the grout strength (MPa), Dm represents the diameter of the reserved hole in the shear pocket joint, and a and b denote the two specimens for each group of parameters, respectively.

Table 1.
Grouping of Push-Out Specimens.
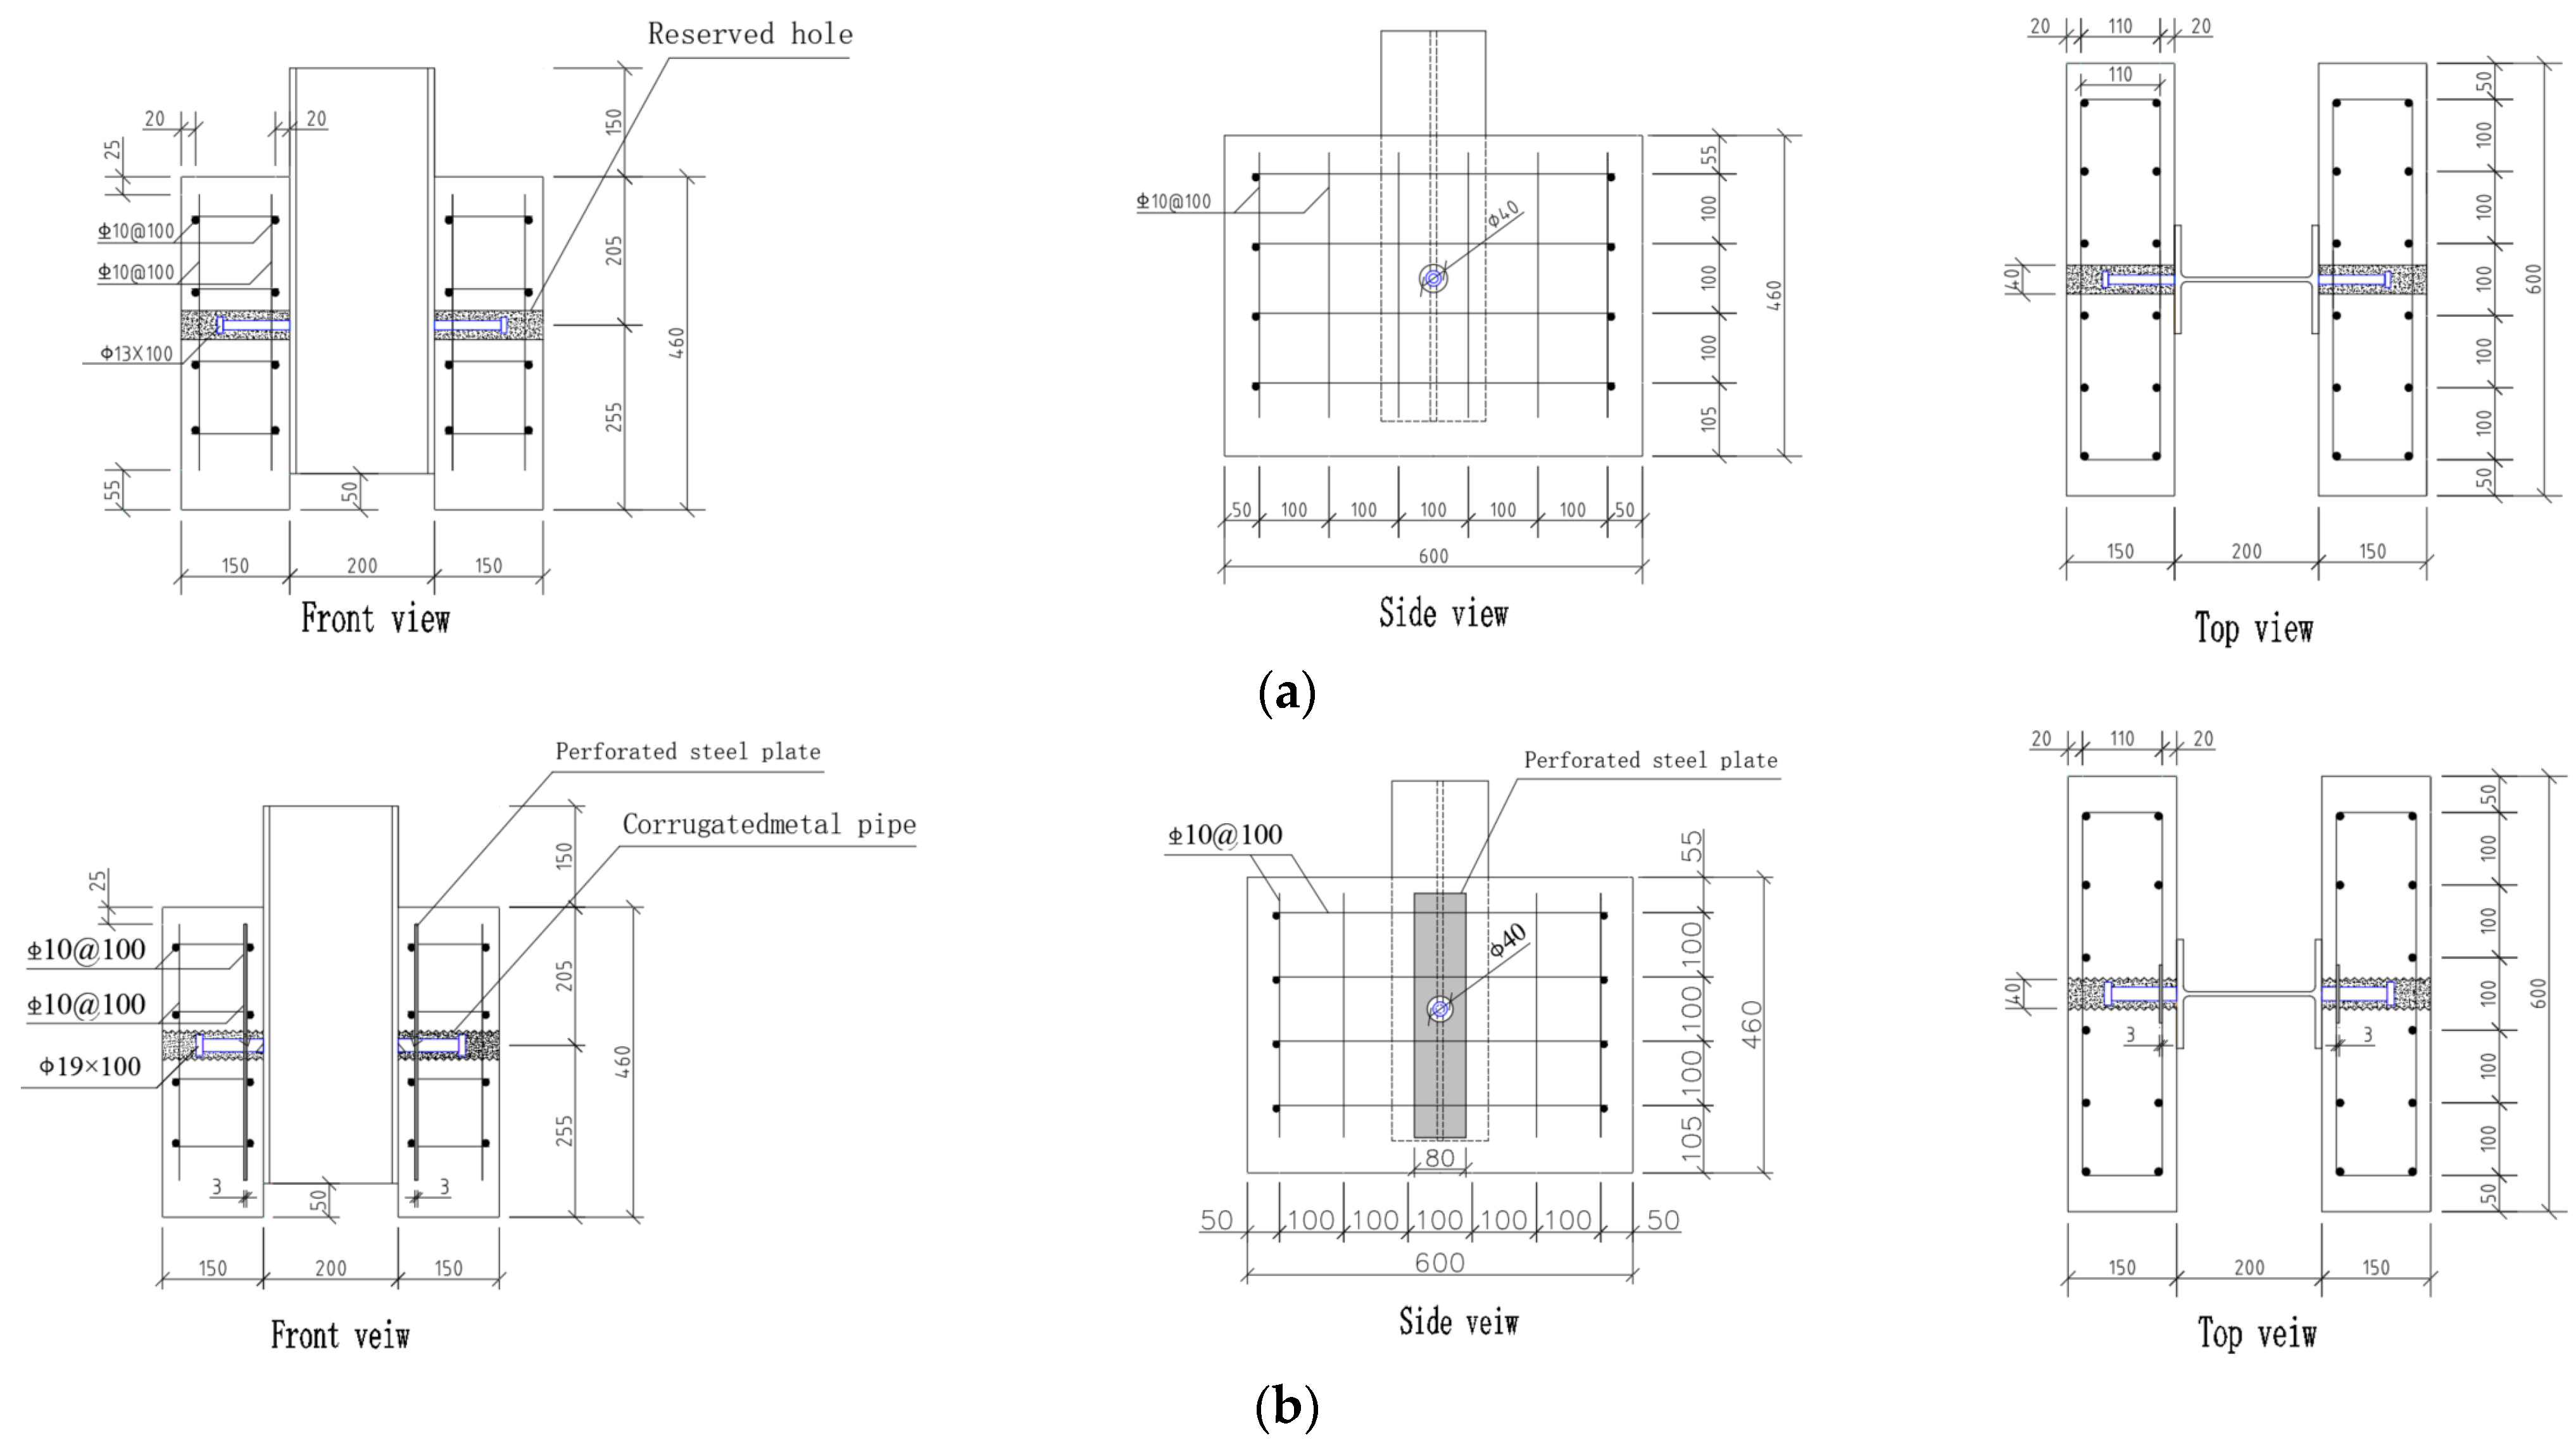
Referencing the structural characteristics of shear pocket connections and the Eurocode4-2004 [24] standard, the dimensions of the test specimens are shown in Figure 5. Each individual RAC slab has dimensions of 600 mm × 150 mm × 460 mm. The longitudinal and stirrup reinforcement within the concrete slabs uses HRB335 steel bars with a diameter of 10 mm, and the thickness of the protective layer was set at 15 mm. The H-beam was an HM 200 mm × 150 mm × 6 mm × 9 mm, made of Q355 steel, with a length of 560 mm. The studs have a length of 100 mm, are made of ML15 material, and are welded to the beam at a distance of 255 mm from the bottom of the specimen.
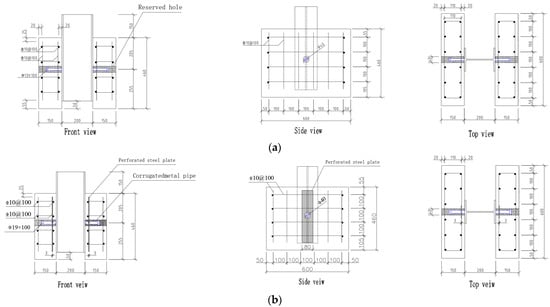
Figure 5.
Specimen dimensions: (a) Ordinary Shear Pocket Joint; (b) Reinforced Shear Pocket Joint.
For the ordinary shear pocket joint specimens, during the production of the prefabricated floor slabs, 40 mm diameter PVC pipes are fixed to the steel mesh within the slab. When the concrete appears solid, the PVC pipes are removed, creating reserved holes in the precast slab. For the RSP joint specimens, perforated steel plates are installed on the steel mesh at the bottom of the prefabricated slab. The perforations of steel plates match the diameter of the corrugated metal pipes, and the steel plates are 3 mm thick, with dimensions of 80 mm × 380 mm × 3 mm. During the production of the specimens, the corrugated metal pipes are inserted through the perforated steel plates. These pipes are not removed after pouring the RAC into the slab, thereby forming holes within the slab.
2.2. Material Test
2.2.1. Recycled Concrete and Grouting Material
The precast slabs used in the specimens are constructed from RAC, utilizing 100% recycled coarse aggregate in place of traditional coarse aggregate. The target compressive strengths of the RAC are RC40 and RC50. The reserved holes in the slabs are filled with high-strength grout, designed to achieve strengths of C60 and C80. For the testing, recycled concrete cubes measuring 150 mm × 150 mm × 150 mm and grouting material cubes measuring 100 mm × 100 mm × 100 mm are cast alongside the specimens and cured under identical conditions for 28 days. The mechanical properties of these cubes are evaluated in accordance with the “Standard for test methods of mechanical properties of ordinary concrete” [25]. The compressive strengths are 43.9 MPa for RC40, 48.3 MPa for RC50, 59.9 MPa for C60, and 79.8 MPa for C80.
2.2.2. Steel Materials
The H-beams used in the study are of HM 200 mm × 150 mm × 6 mm × 9 mm specification, with flange and web thicknesses of 9 mm and 6 mm, respectively. The embedded perforated steel plates have a thickness of 3 mm, as illustrated in Figure 6a. The studs, which have diameters of 13 mm and 19 mm and a length of 100 mm, were made from ML15 steel, as shown in Figure 6b. The longitudinal and stirrup reinforcements in the concrete slabs are HRB335 steel bars with a diameter of 10 mm. The corrugated metal pipes, made of galvanized Q195 steel, have diameters of 40 mm and 60 mm with a wall thickness of 0.5 mm, as shown in Figure 6c. The mechanical properties of the H-beam steel, studs, and reinforcements are determined following the standards for “Metallic materials—tensile testing—part 1: method of test at room temperature” [26]. The steel mechanical performances of the specimens are shown in Table 2. The yield strength and elastic modulus of the corrugated metal pipes, as provided by the manufacturer, are 195 MPa and 2.01 × 10⁵ MPa, respectively.
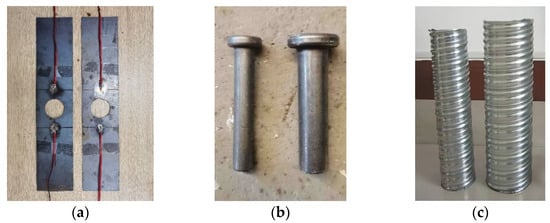
Figure 6.
Metal Materials: (a) Perforated steel plate; (b) Studs; (c) Corrugated metal pipe.
Table 2.
Mechanical properties of steel materials.
2.3. Test Setup
The testing was conducted using an electro-hydraulic servo pressure testing machine, as shown in Figure 7a. During the test, the load was applied from the bottom upwards through the loading system. The specimen was positioned centrally on the loading plate of the testing machine. Prior to applying the load, a layer of fine sand was placed beneath the concrete slabs to ensure uniform stress distribution across the slabs. A level was used to ensure the specimen was perfectly aligned in all directions, as depicted in Figure 7b.
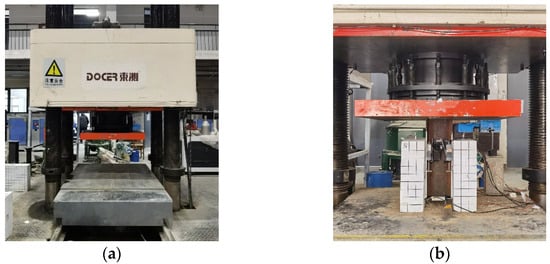
Figure 7.
Test setup: (a) Electro-hydraulic servo pressure testing machine; (b) Test photograph.
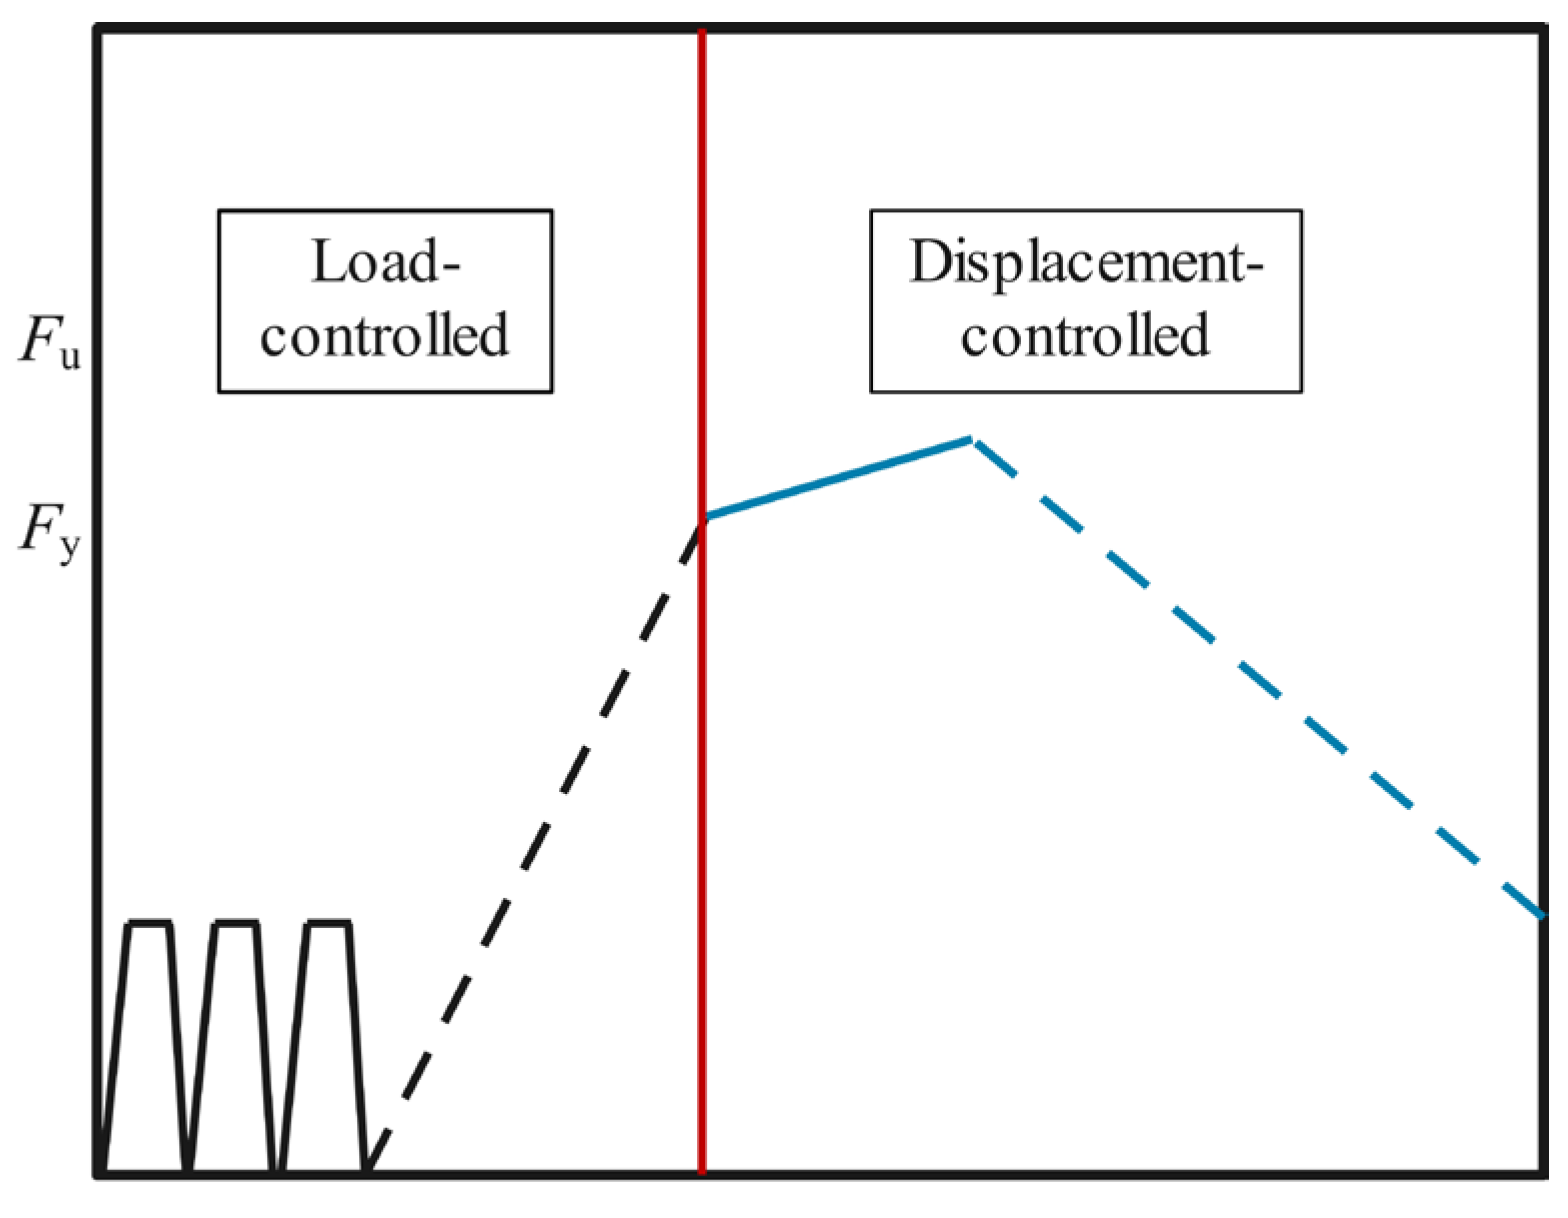
Before the main loading phase, the specimen was preloaded with 30% of the theoretical ultimate load. This preload was applied in three cycles to ensure full contact between all parts of the specimen and to verify the proper functioning of the loading equipment and sensors. Following the preload, formal loading was conducted in two main stages.
In the first stage, load-controlled loading was performed with a rate of 1 kN/s, increasing by 15 kN per stage, with each stage maintained for 5 min. Surface cracks on the concrete slab were monitored and documented during this phase. When the load-displacement curve reached the yield load (Fy), the loading method transitioned to displacement-controlled loading. In this stage, the rate was set at 0.1 mm/min, with increments of 0.5 mm per stage, and each stage held for 5 min while observations of the test phenomena continued. The test concluded when the specimen experienced sudden failure or when the capacity dropped to 85% of the ultimate load. The load at this failure point was recorded as the failure load. The loading protocol is illustrated in Figure 8, where Fu represents the ultimate load and Fy represents the yield load.
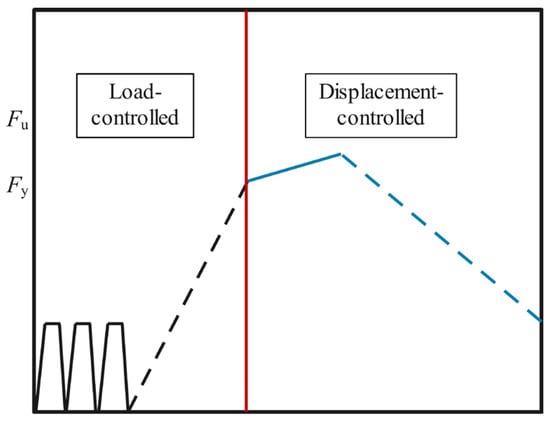
Figure 8.
Loading protocol.
2.4. Measurements
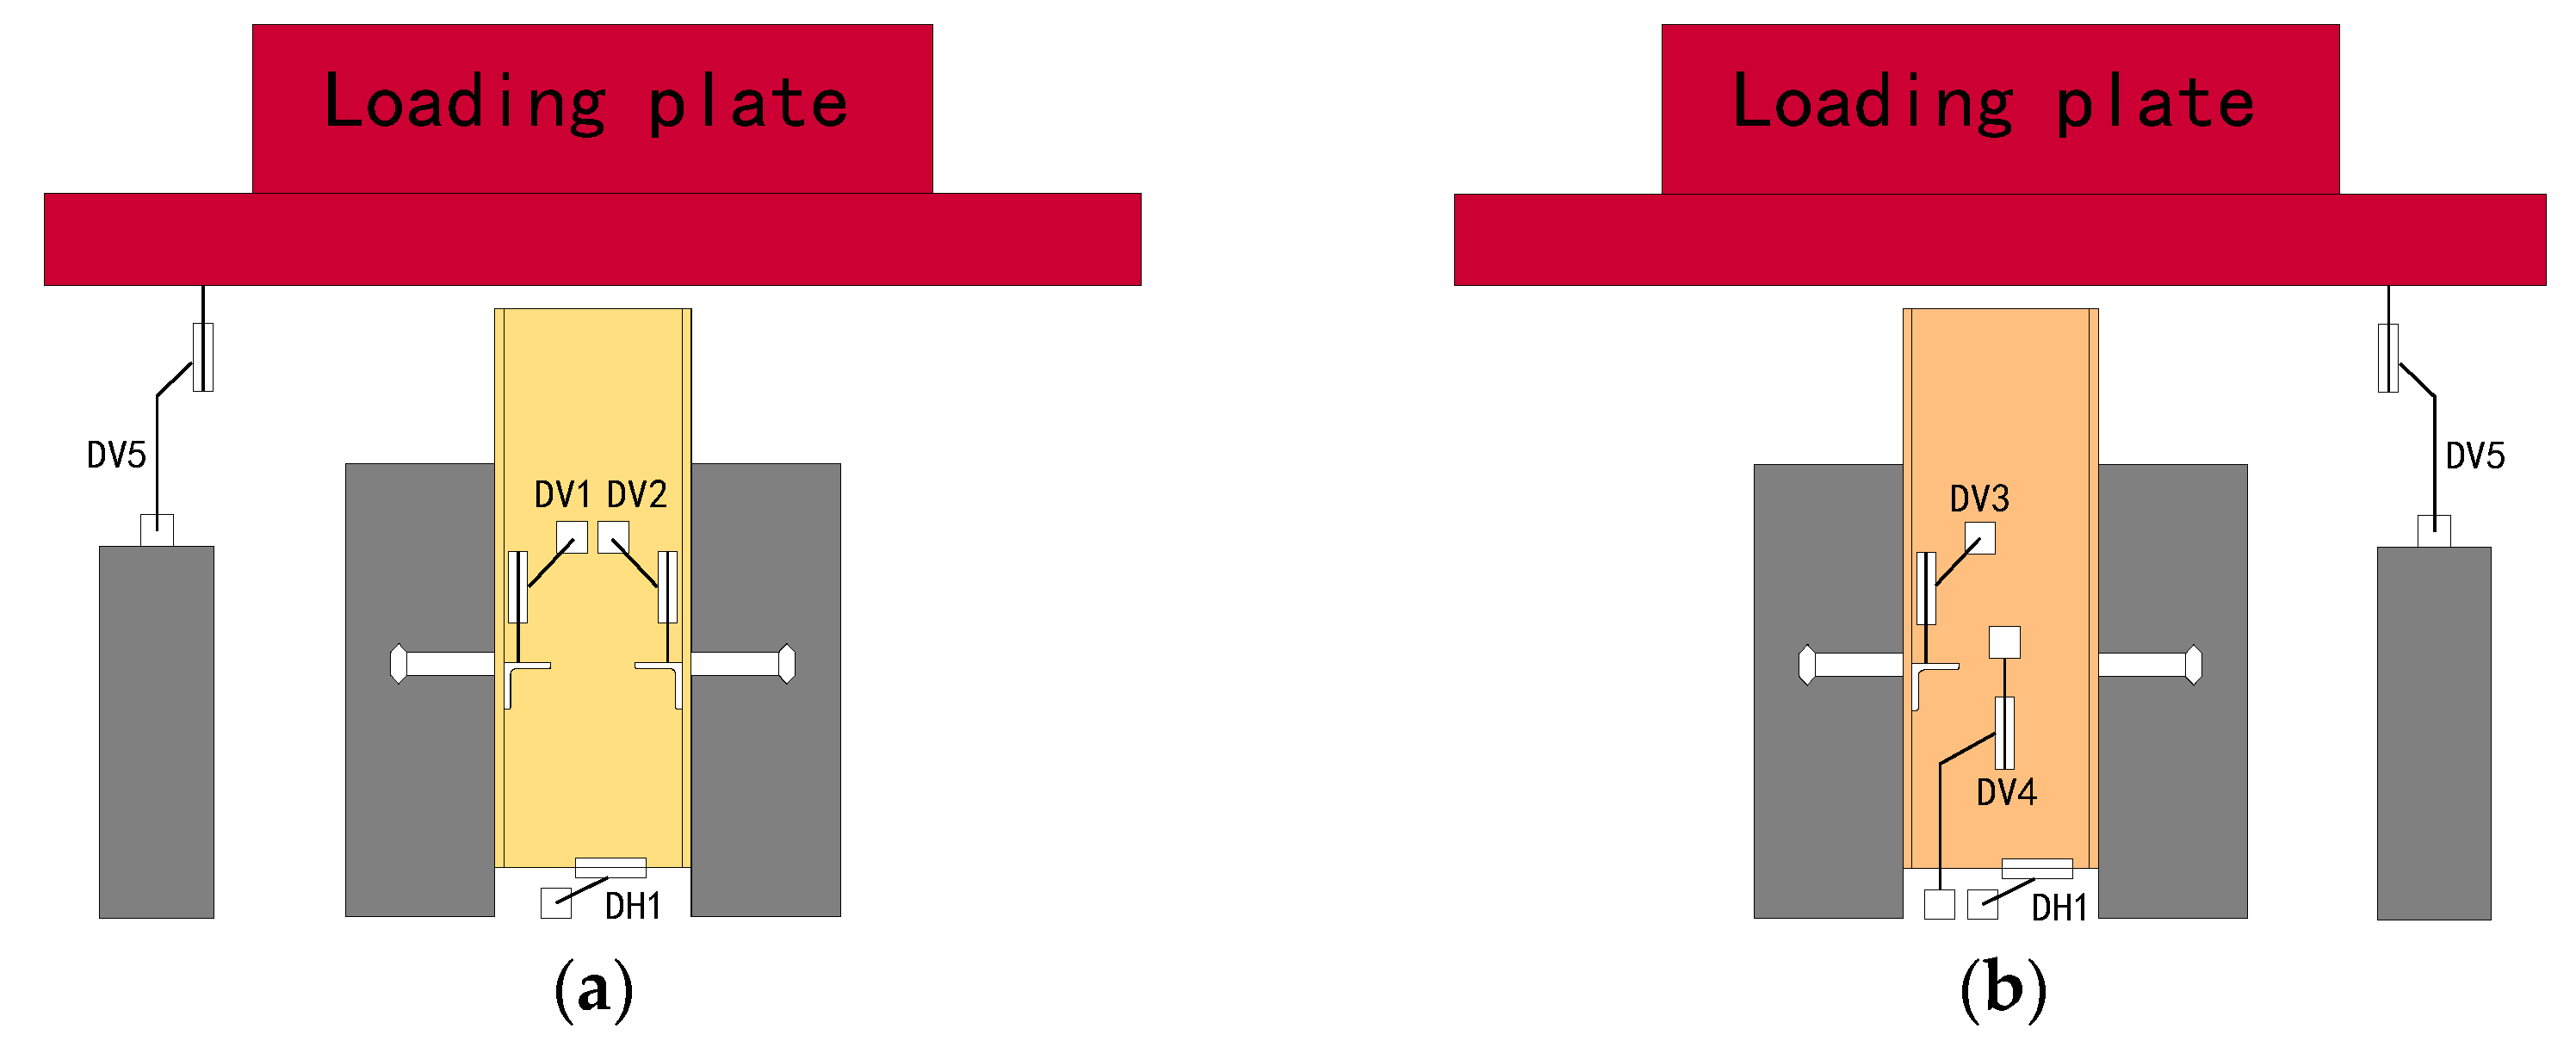
To accurately monitor the shear performance during the test, various displacement and strain gauges were utilized. The setup for displacement measurements is depicted in Figure 9. Three vertical displacement gauges (DV1 to DV3) were positioned at the studs to record the relative slip between the H-steel and the concrete slab. An additional vertical displacement gauge (DV4) was used to measure the absolute vertical displacement of the H-steel. Another gauge (DV5) was installed to capture the absolute vertical displacement of the loading plate. Furthermore, two transverse displacement gauges (DH1 and DH2) were placed on the concrete slab to monitor its transverse displacement throughout the loading process.
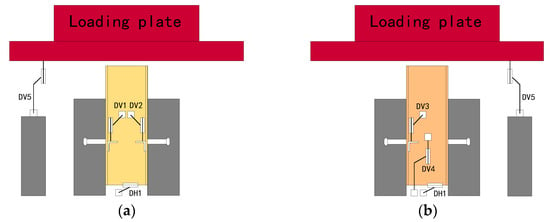
Figure 9.
Displacement gauge arrangement: (a) Front view; (b) Back view.
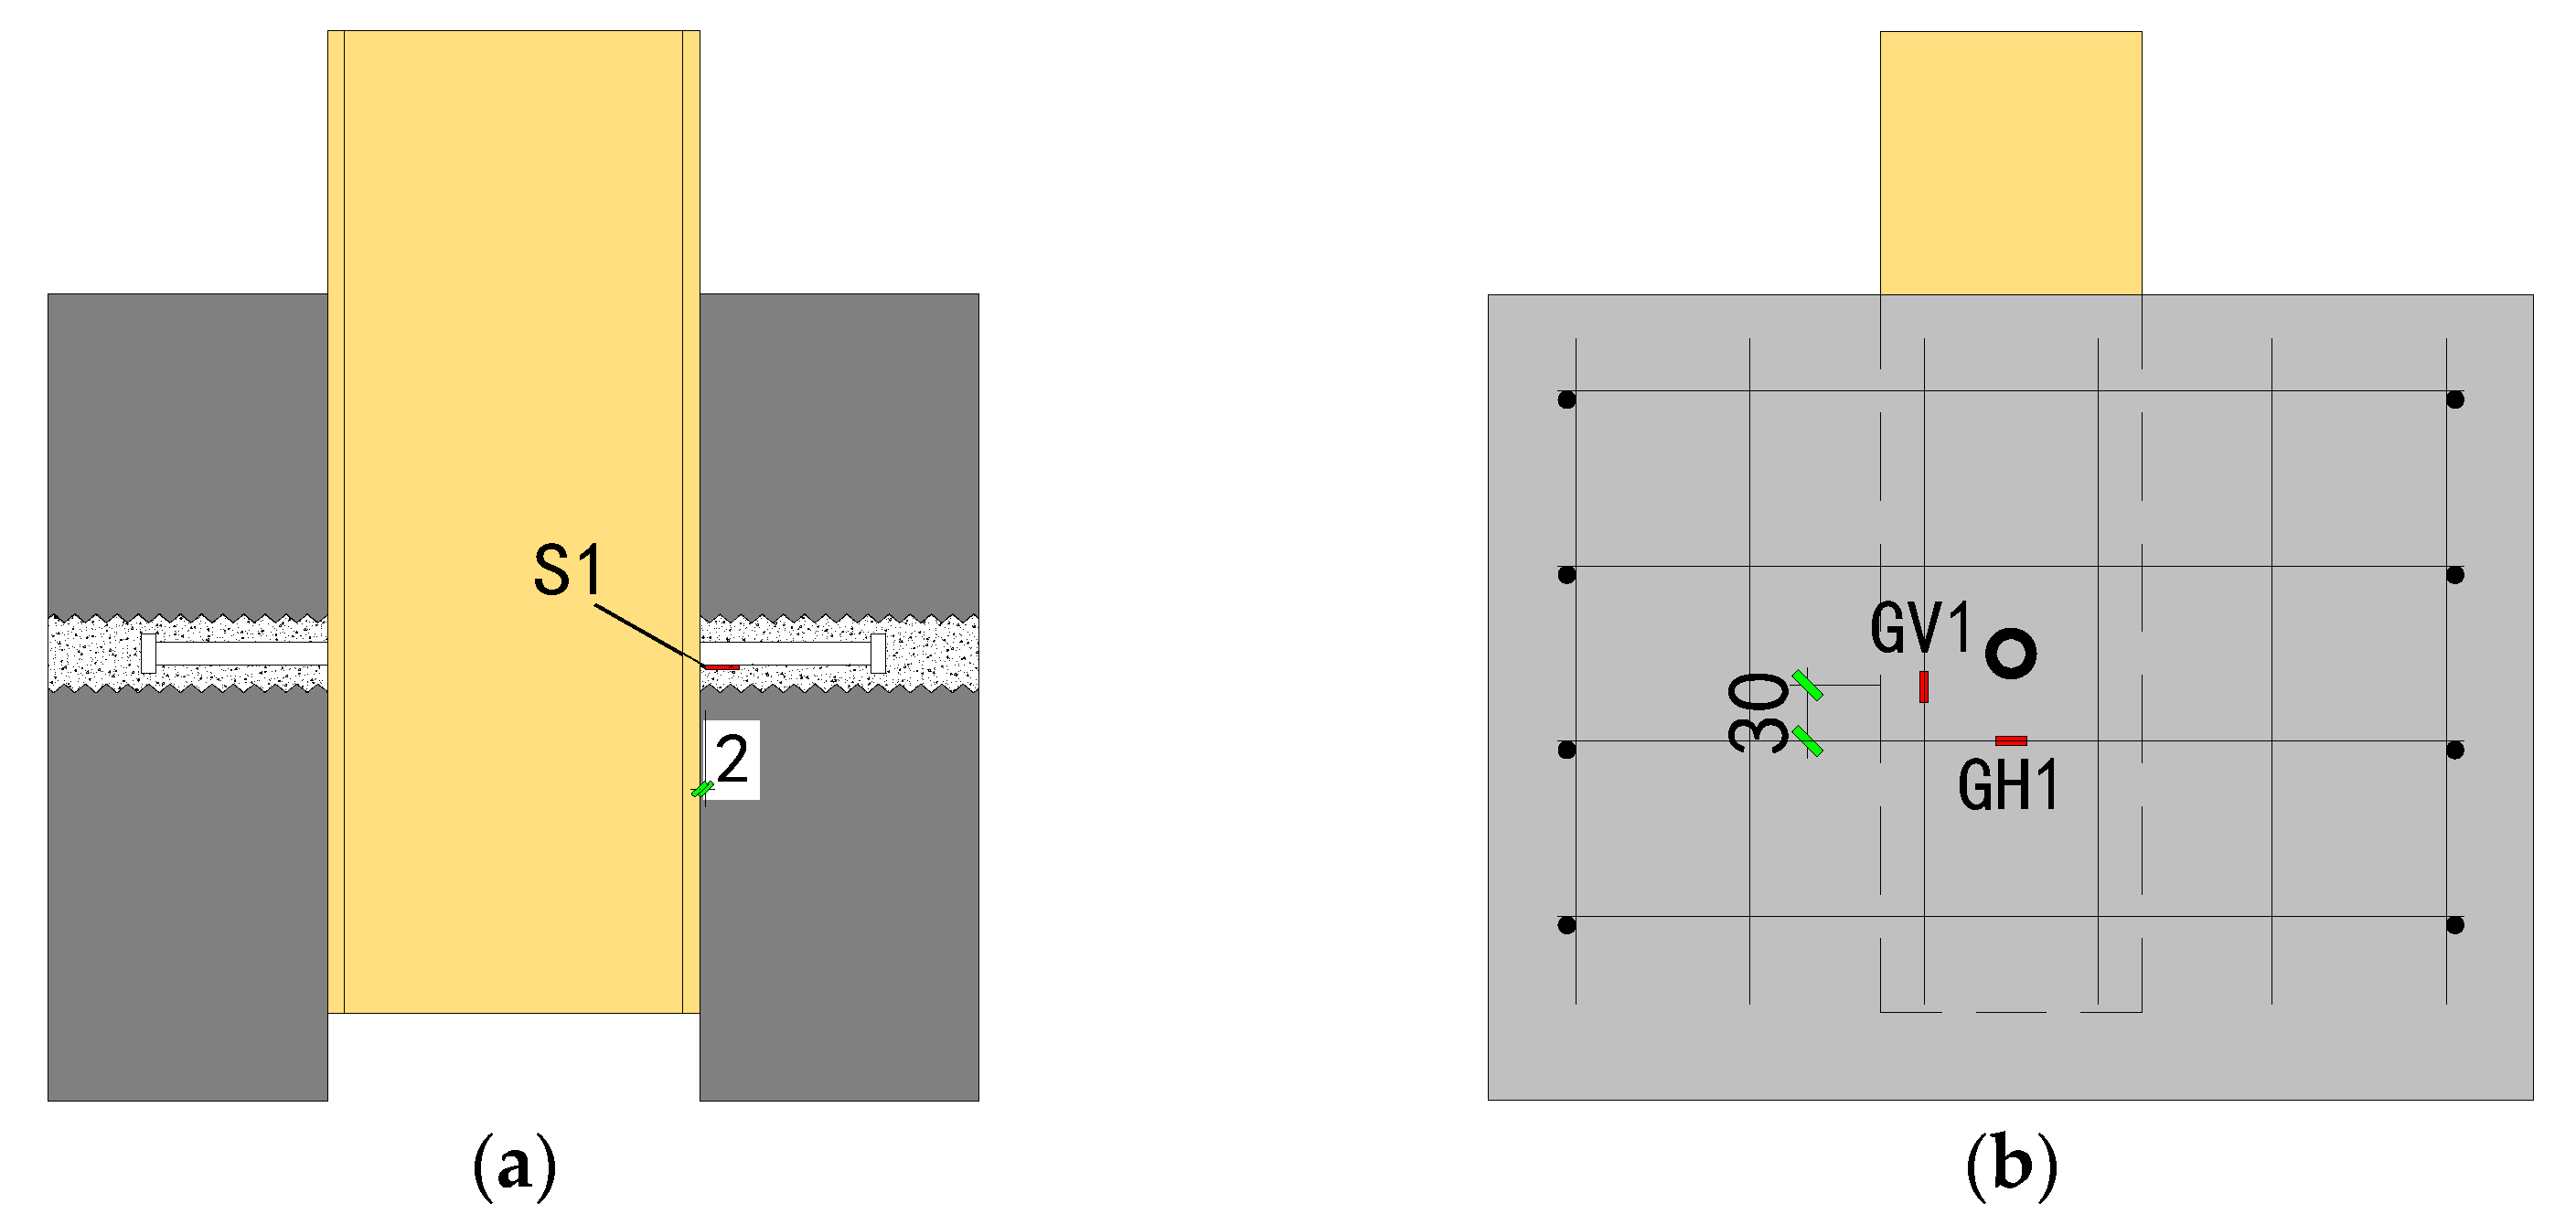
For stress analysis, strain gauges were strategically placed on the specimen, as illustrated in Figure 10. A strain gauge, labeled S1, was attached to the end of the underside of the single-sided stud. Additionally, strain gauges GV1 and GH1 were positioned on the steel mesh near the stud, measuring vertical and horizontal strains, respectively.
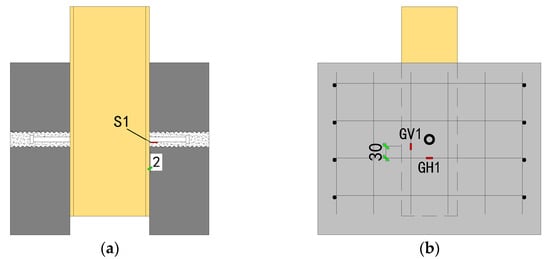
Figure 10.
Arrangement of the strain gauges: (a) Stud Strain; (b) Rebar Strain.
3. Experimental Results and Analysis
3.1. Failure Characteristics
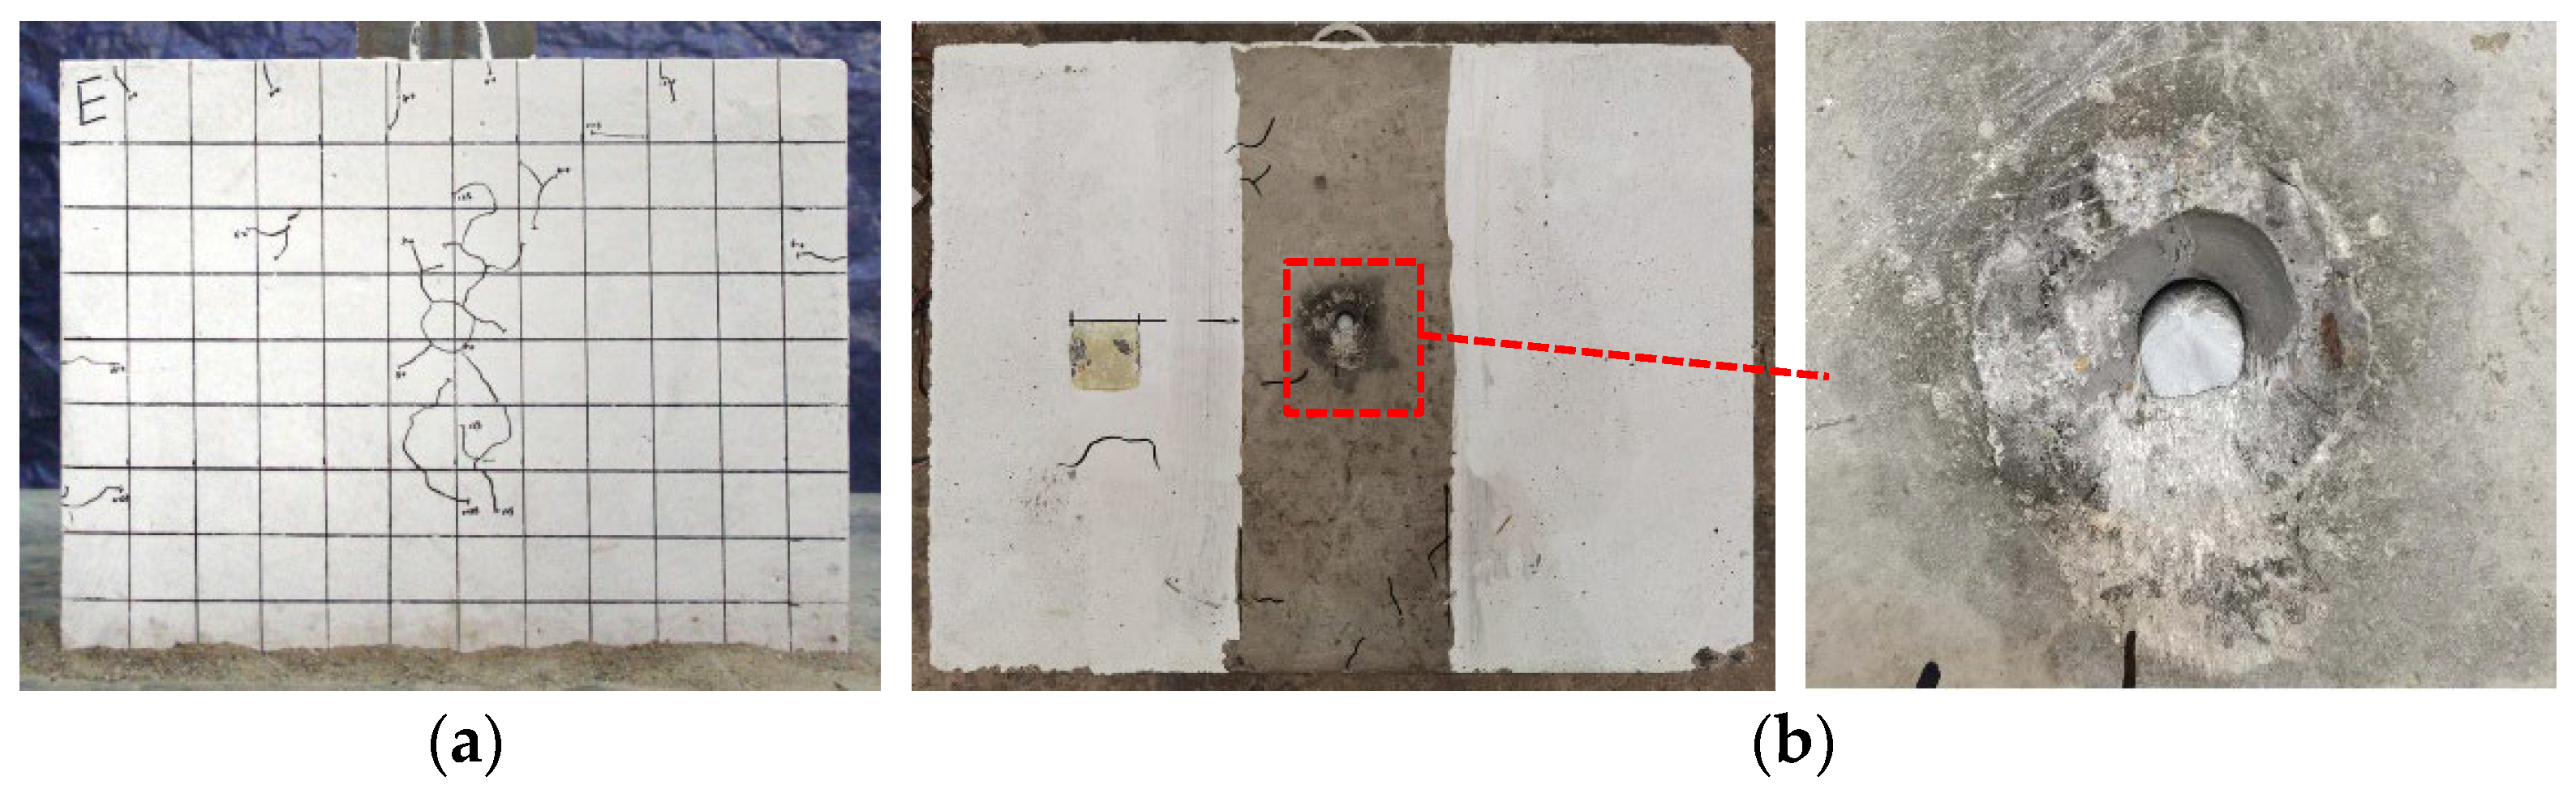
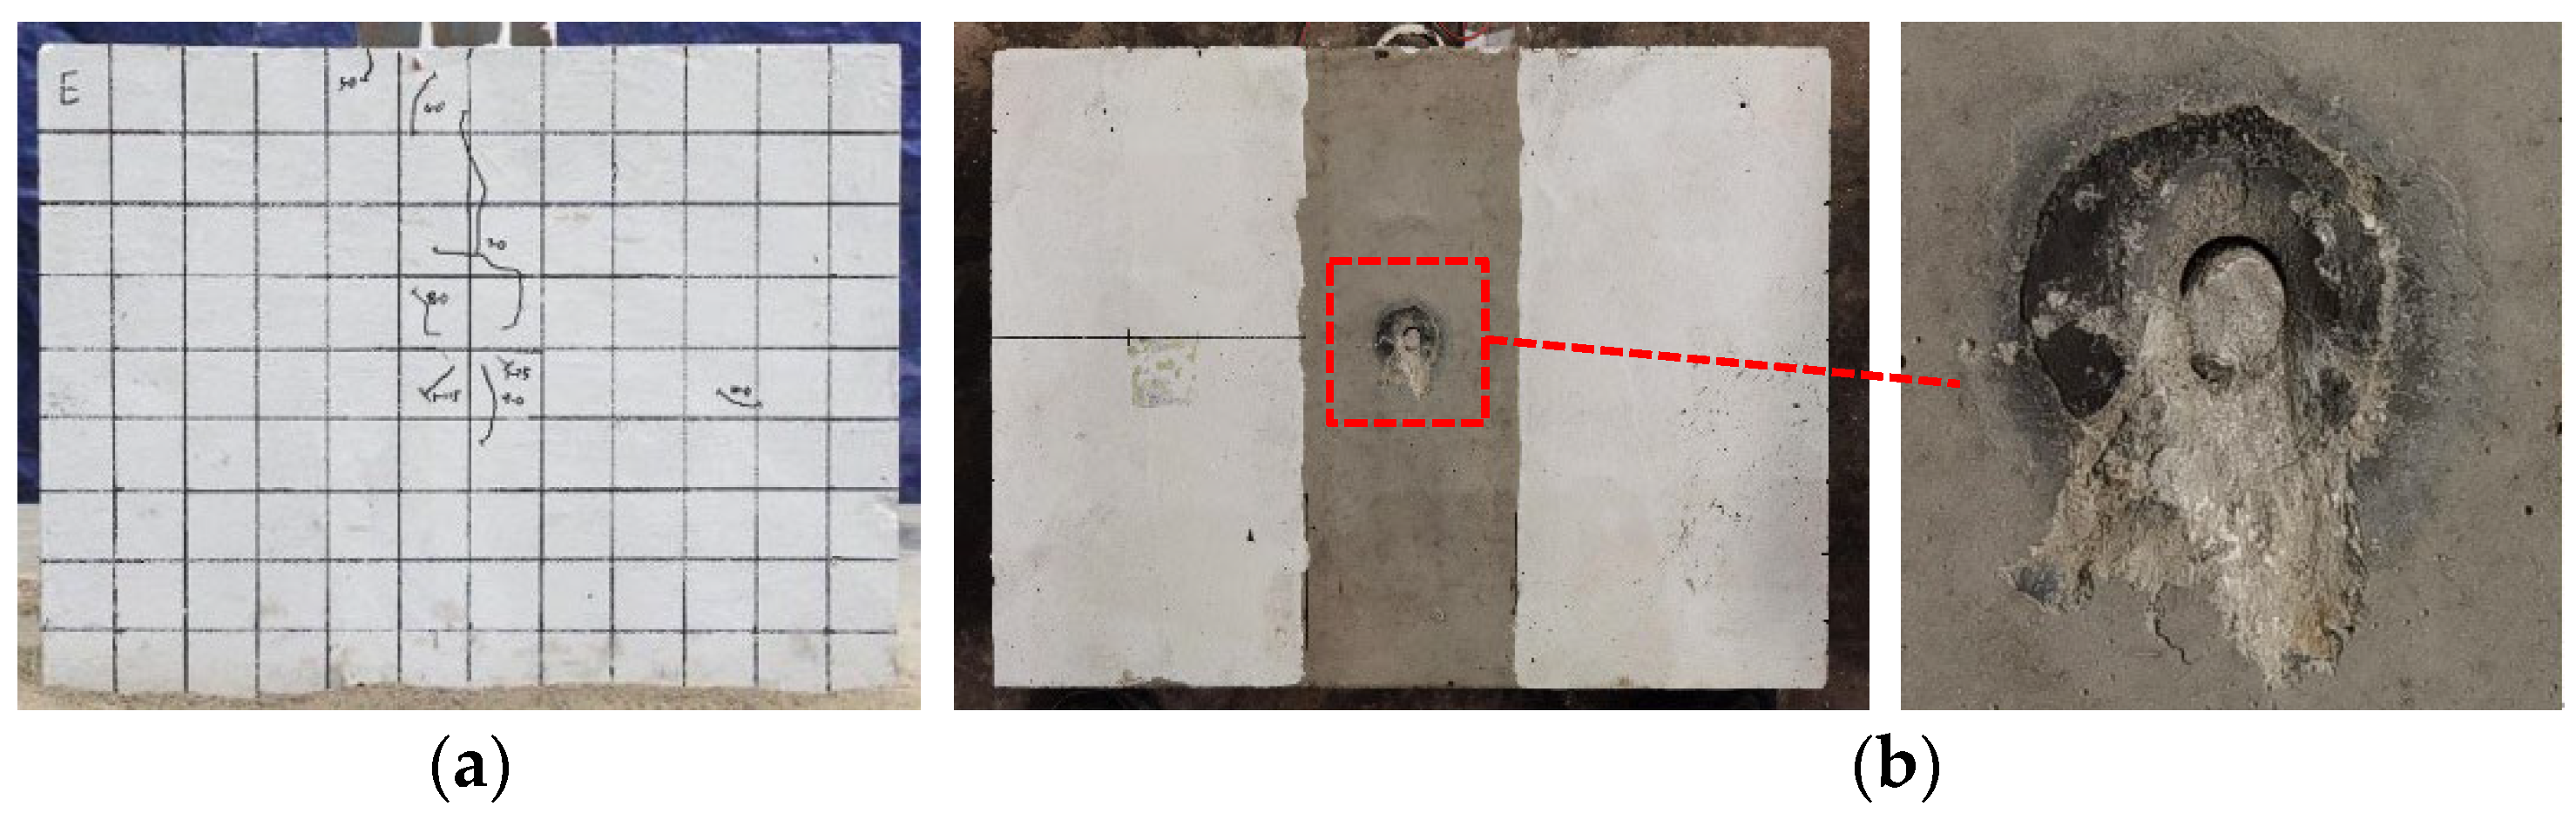
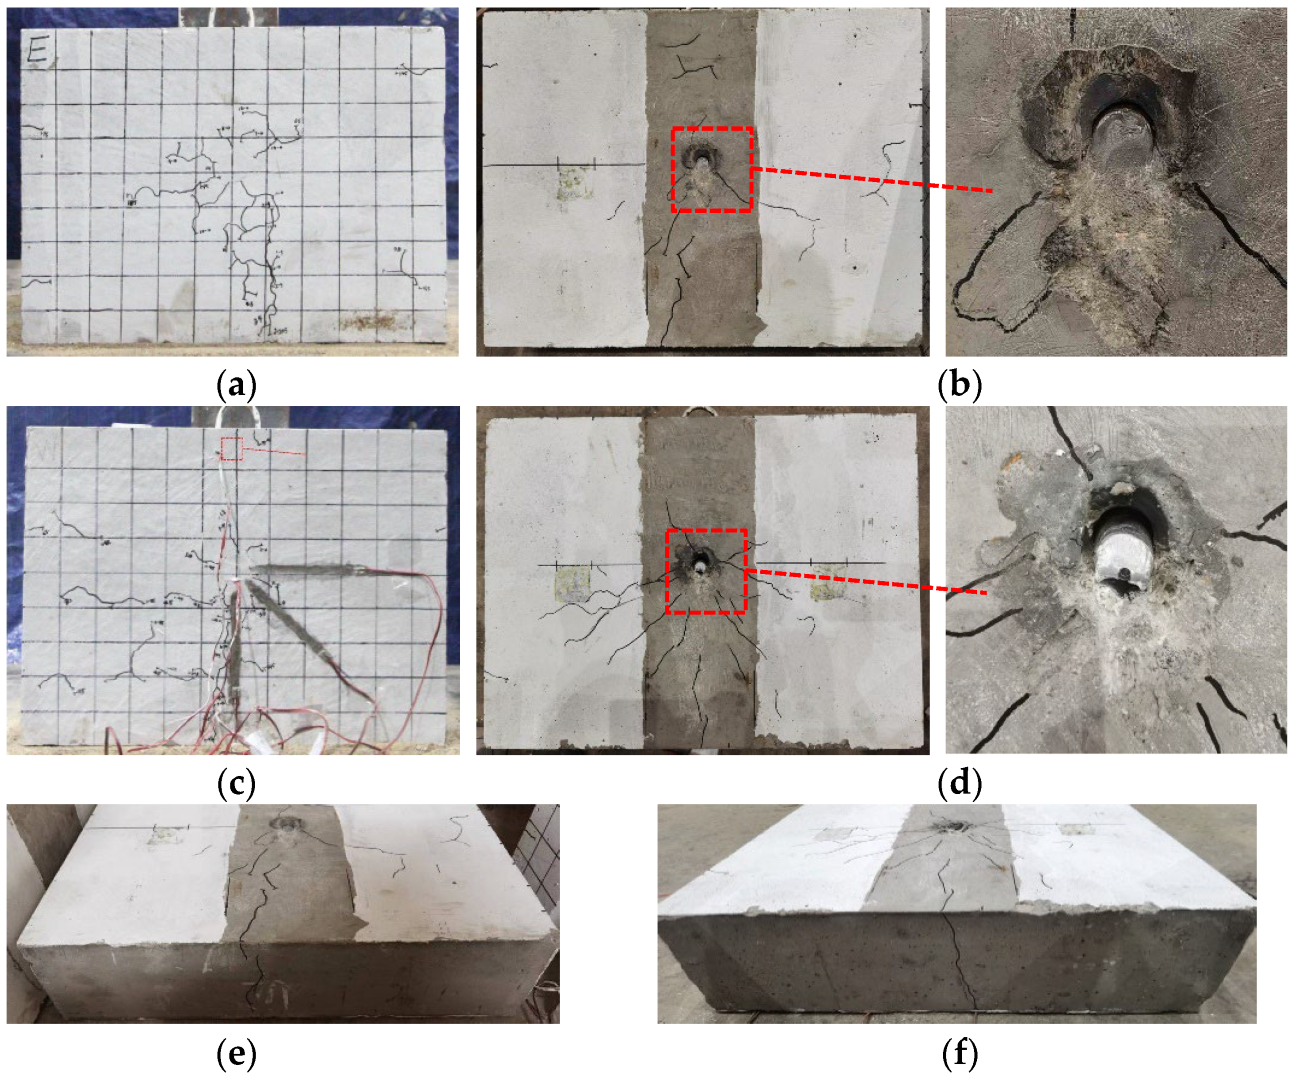
The damage process of the floor joint can be summarized as follows: as the steel beam moves downward under load, the studs interact with the grout within the reserved holes. The grout gradually develops damage and cracks under loading, transferring the forces to the corrugated tube, embedded steel plates, and the concrete slab. As the load increases, cracks appear and extend at the bottom of the precast concrete slabs. All precast shear pocket joints failed due to stud failure, and the concrete slabs did not undergo severe damage, confirming the effectiveness of the shear pocket joints. Due to variations in specimen parameters, the failure characteristics observed in this push-out test can be categorized into three distinct types: (1) Studs sheared off with significant signs on the exterior surface of the concrete slab (W13-C40-G80-D40-a); (2) Studs sheared off with no significant signs on either the interior or exterior surface of the concrete slab (B13-C40-G80-D40-a, B13-C50-G80-D40-a, B13-C40-G60-D40-a); (3) Studs sheared off with significant cracking on both the interior and exterior surfaces of the concrete slab (B19-C40-G80-D40-b, B13-C40-G80-D60-b). The failure processes of three representative specimens—W13-C40-G80-D40-a, B13-C40-G80-D40-a, and B19-C40-G80-D40-b—are detailed below to illustrate the different failure characteristics observed.
(1) W13-C40-G80-D40-a
For the ordinary shear pocket joint specimens, the studs first interact with the grout, and cracks gradually appear around the reserved holes. At 125 kN, a vertical crack emerged below the reserved hole on the slab’s outer surface. In the displacement-controlled stage, at 1.93 mm of displacement, interaction between the studs and the precast slab was audible. As displacement increased to 5.19 mm, the studs sheared, causing crushing of the grouting material and some concrete below the stud. Small cracks also developed around the inner reserved holes and at the bottom of the slab, as shown in Figure 11.
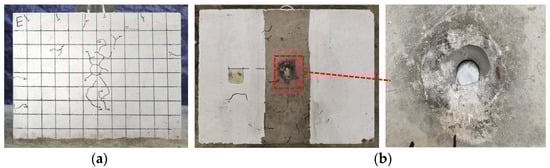
Figure 11.
Failure phenomenon of W13-C40-G80-D40-a: (a) Exterior surface of concrete slab; (b) Inner surface of concrete slab.
(2) B13-C40-G80-D40-a
With the adoption of RSP joint configuration, the confinement and reinforcement provided by the corrugated tube and embedded steel plate enhance the damage resistance of the precast concrete slab compared to ordinary shear pocket joint specimens. At 115 kN, a minor crack appeared along the corrugated pipe near the eastern side of the slab. During the displacement-controlled loading stage, at 4.23 mm displacement, contact noises between the studs and the slab were noted. At 5.01 mm, the studs inside the slab sheared, resulting in the crushing of grouting material and some concrete below the studs. The overall damage to the precast RAC slab in the specimen was improved, with fewer cracks developing. The surface phenomena are depicted in Figure 12.

Figure 12.
Failure phenomenon of B13-C40-G80-D40-a: (a) Exterior surface of concrete slab; (b) Inner surface of concrete slab.
(3) B19-C40-G80-D40-b
With an increase in stud diameter, the shear capacity of the studs is enhanced, resulting in greater load transfer to the concrete slab, thereby leading to more pronounced concrete damage. At 95 kN, a long crack appeared near the reserved hole on the east side of the slab. By 115 kN, a 3 cm crack extended upwards from the slab’s bottom. At 185 kN, a crack approximately 10 cm long extended westward from the southwest corner of the reserved hole. At 205 kN, a 30 cm long crack developed upwards from the middle of the slab’s bottom. By 215 kN, the crack continued to extend upward by an additional 5 cm. At a displacement of 0.99 mm, the crack’s width increased to approximately 1 mm. At 2.13 mm displacement, a pronounced vertical crack appeared on the west side of the slab, and the bottom crack continued to extend. Loading to 4.51 mm resulted in shearing of the studs on both sides of the slab, with diagonal and figure-eight-shaped cracks observed below the reserved holes. The bottom of the slabs exhibited crushed grouting material and concrete, as illustrated in Figure 13.
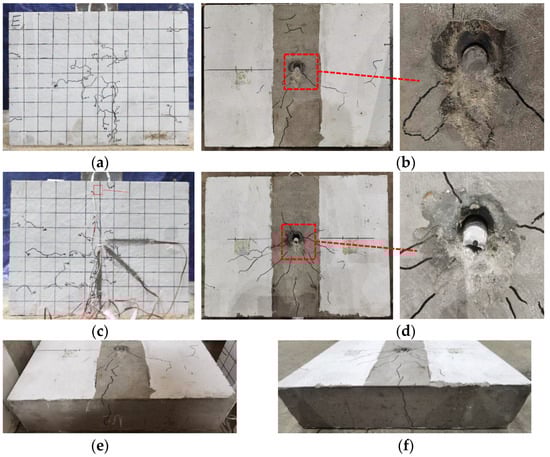
Figure 13.
Failure phenomenon of B19-C40-G80-D40-b: (a) Exterior surface of concrete slab on the east side; (b) Inner surface of concrete slab on the east side; (c) Exterior surface of concrete slab on the west side; (d) Inner surface of concrete slab on the west side; (e) Bottom surface of concrete slab on the east side; (f) Bottom surface of concrete slab on the west side.
Based on these failure characteristics, the following analytical conclusions can be drawn:
- (1)
- RSP specimens show reduced cracking compared to regular shear pocket specimens. The inclusion of built-in steel plates and corrugated steel pipes mitigates damage around the reserved holes and enhances the shear capacity of the joints.
- (2)
- While larger stud diameters increase the shear capacity, they also lead to more and longer cracks beneath the corrugated pipes, exacerbating slab damage. The substantial influence of stud diameter on failure characteristics and shear capacity is evident.
- (3)
- Higher strength of RAC improves damage mitigation around corrugated pipes, resulting in fewer crack developments. Conversely, lower grout strength weakens its restraint on the studs, enlarging gaps in the interaction between studs and grout during failure. Increasing the diameter of the reserved hole of the concrete slab weakens the integrity of the joint area of the precast floor slab and increases the damage of the joint area.
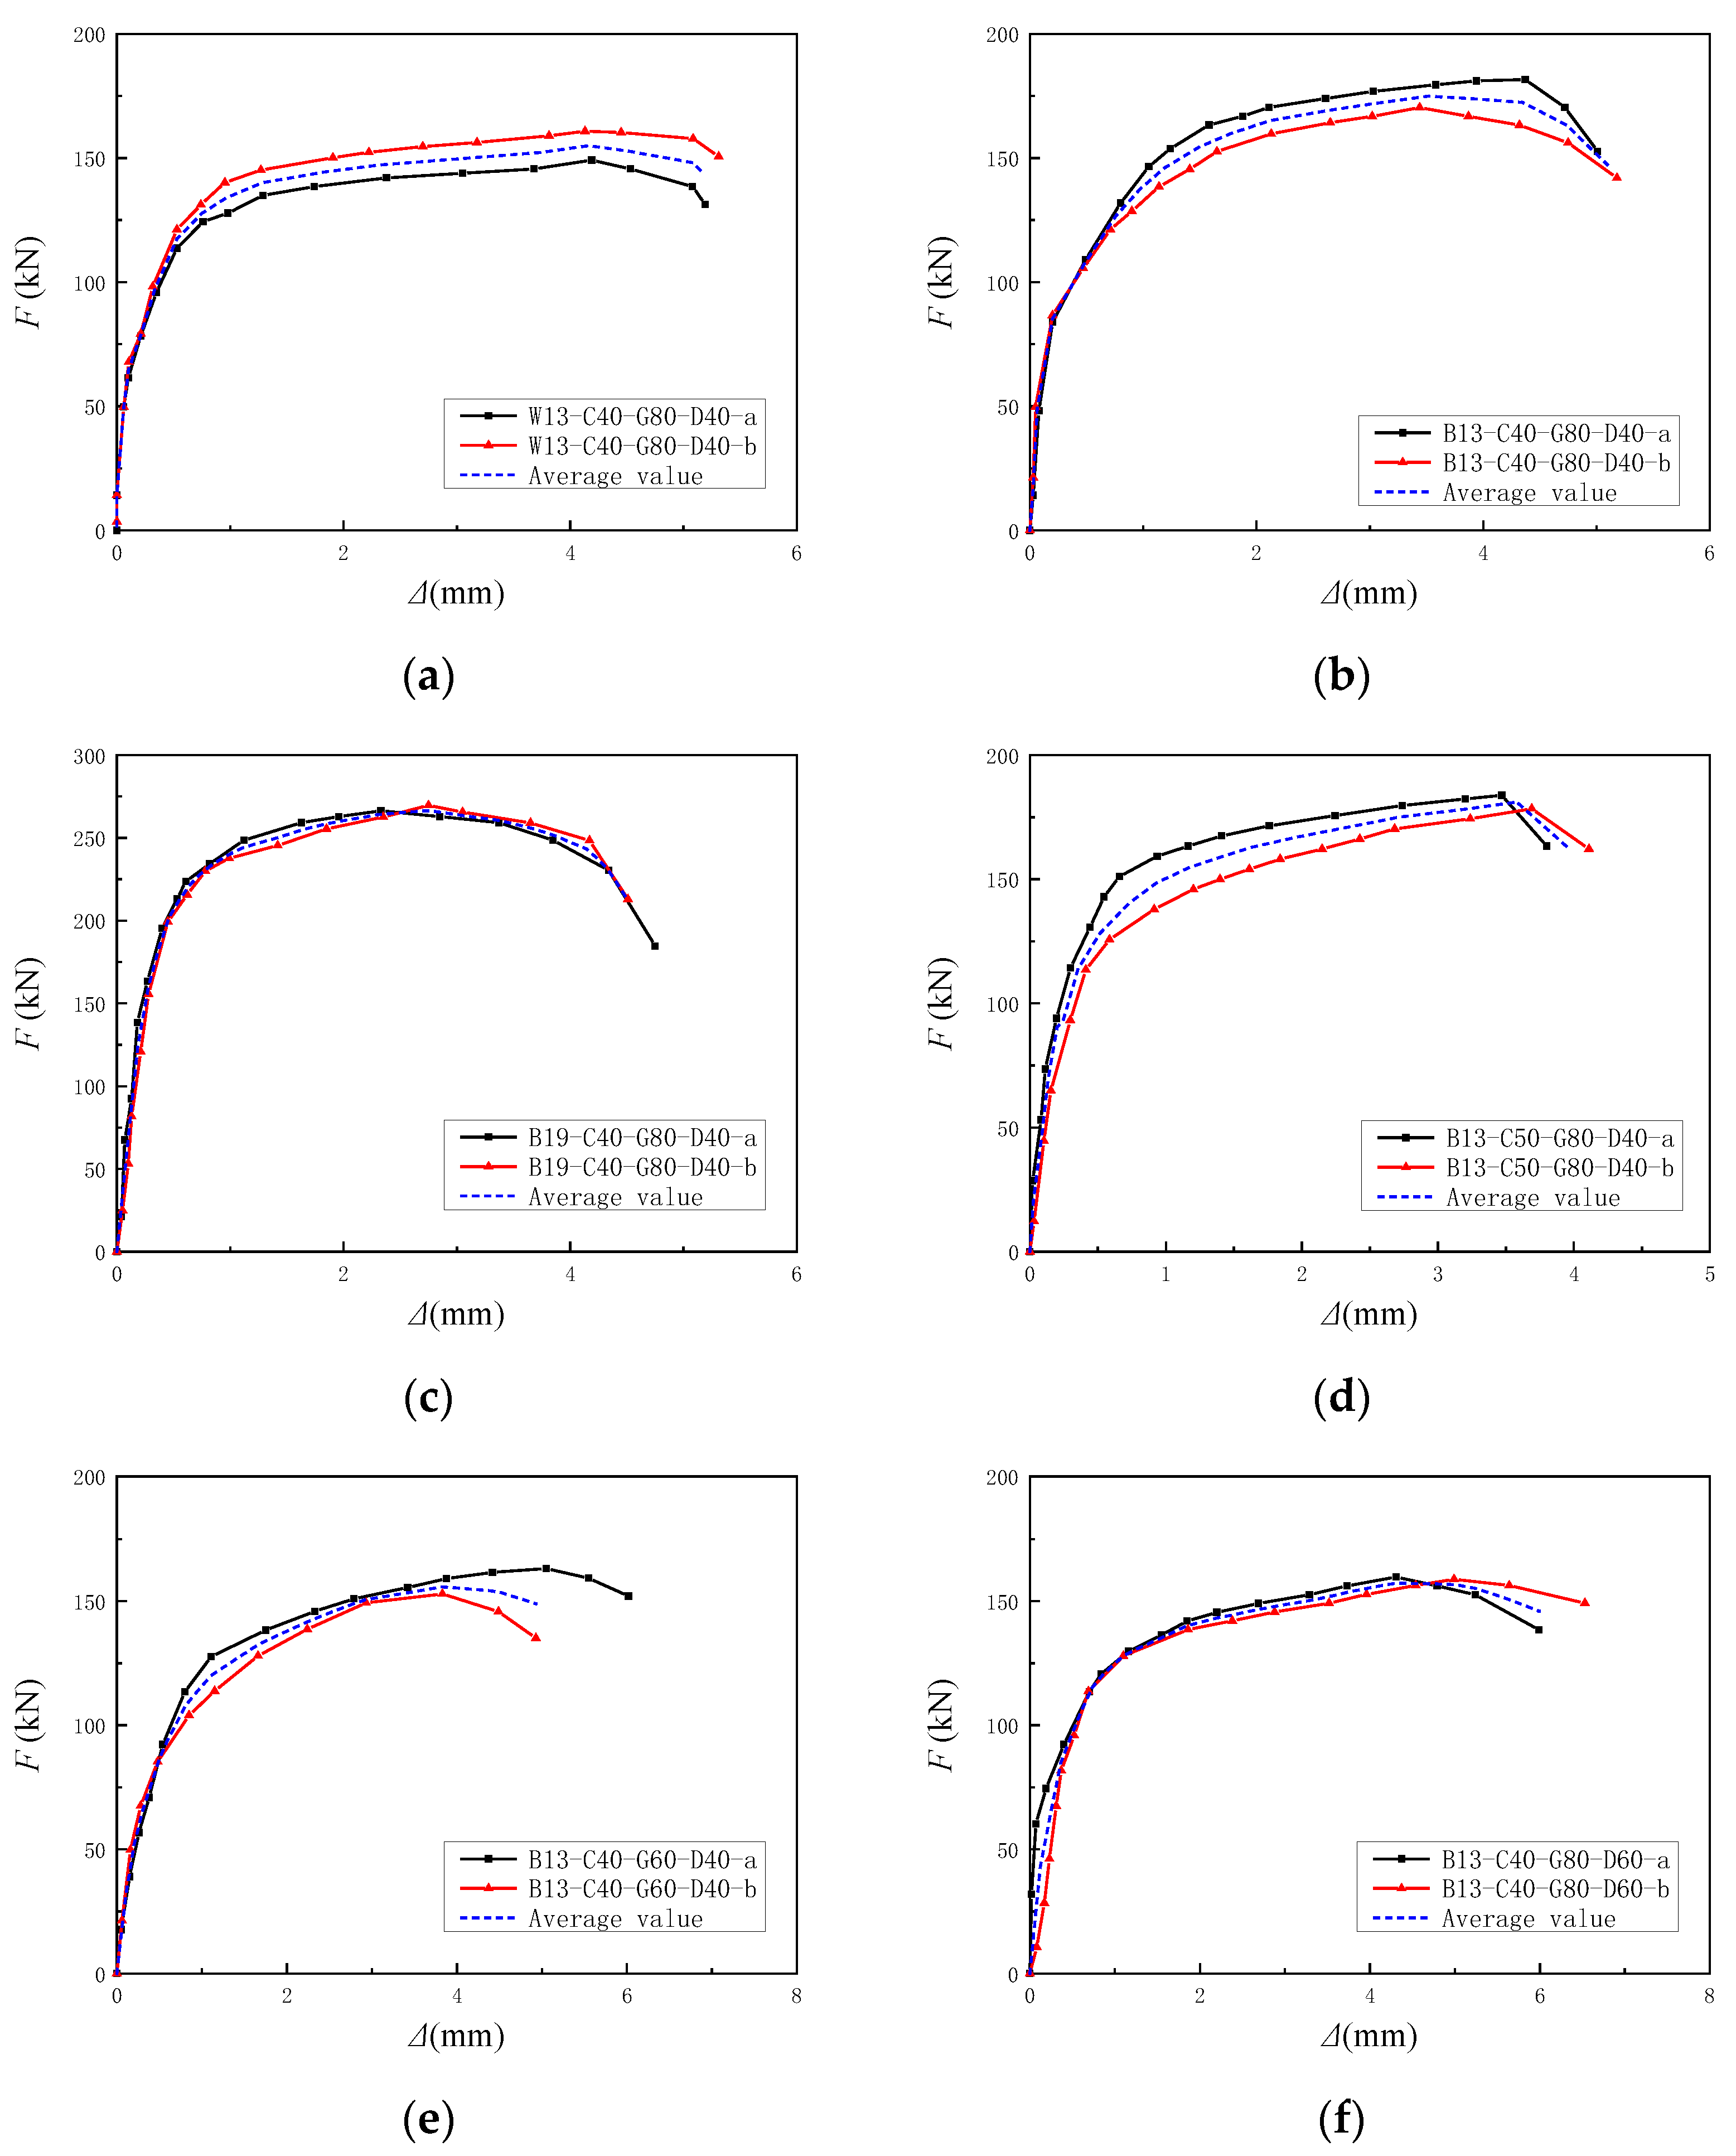
3.2. Load–Slip Curve Analysis
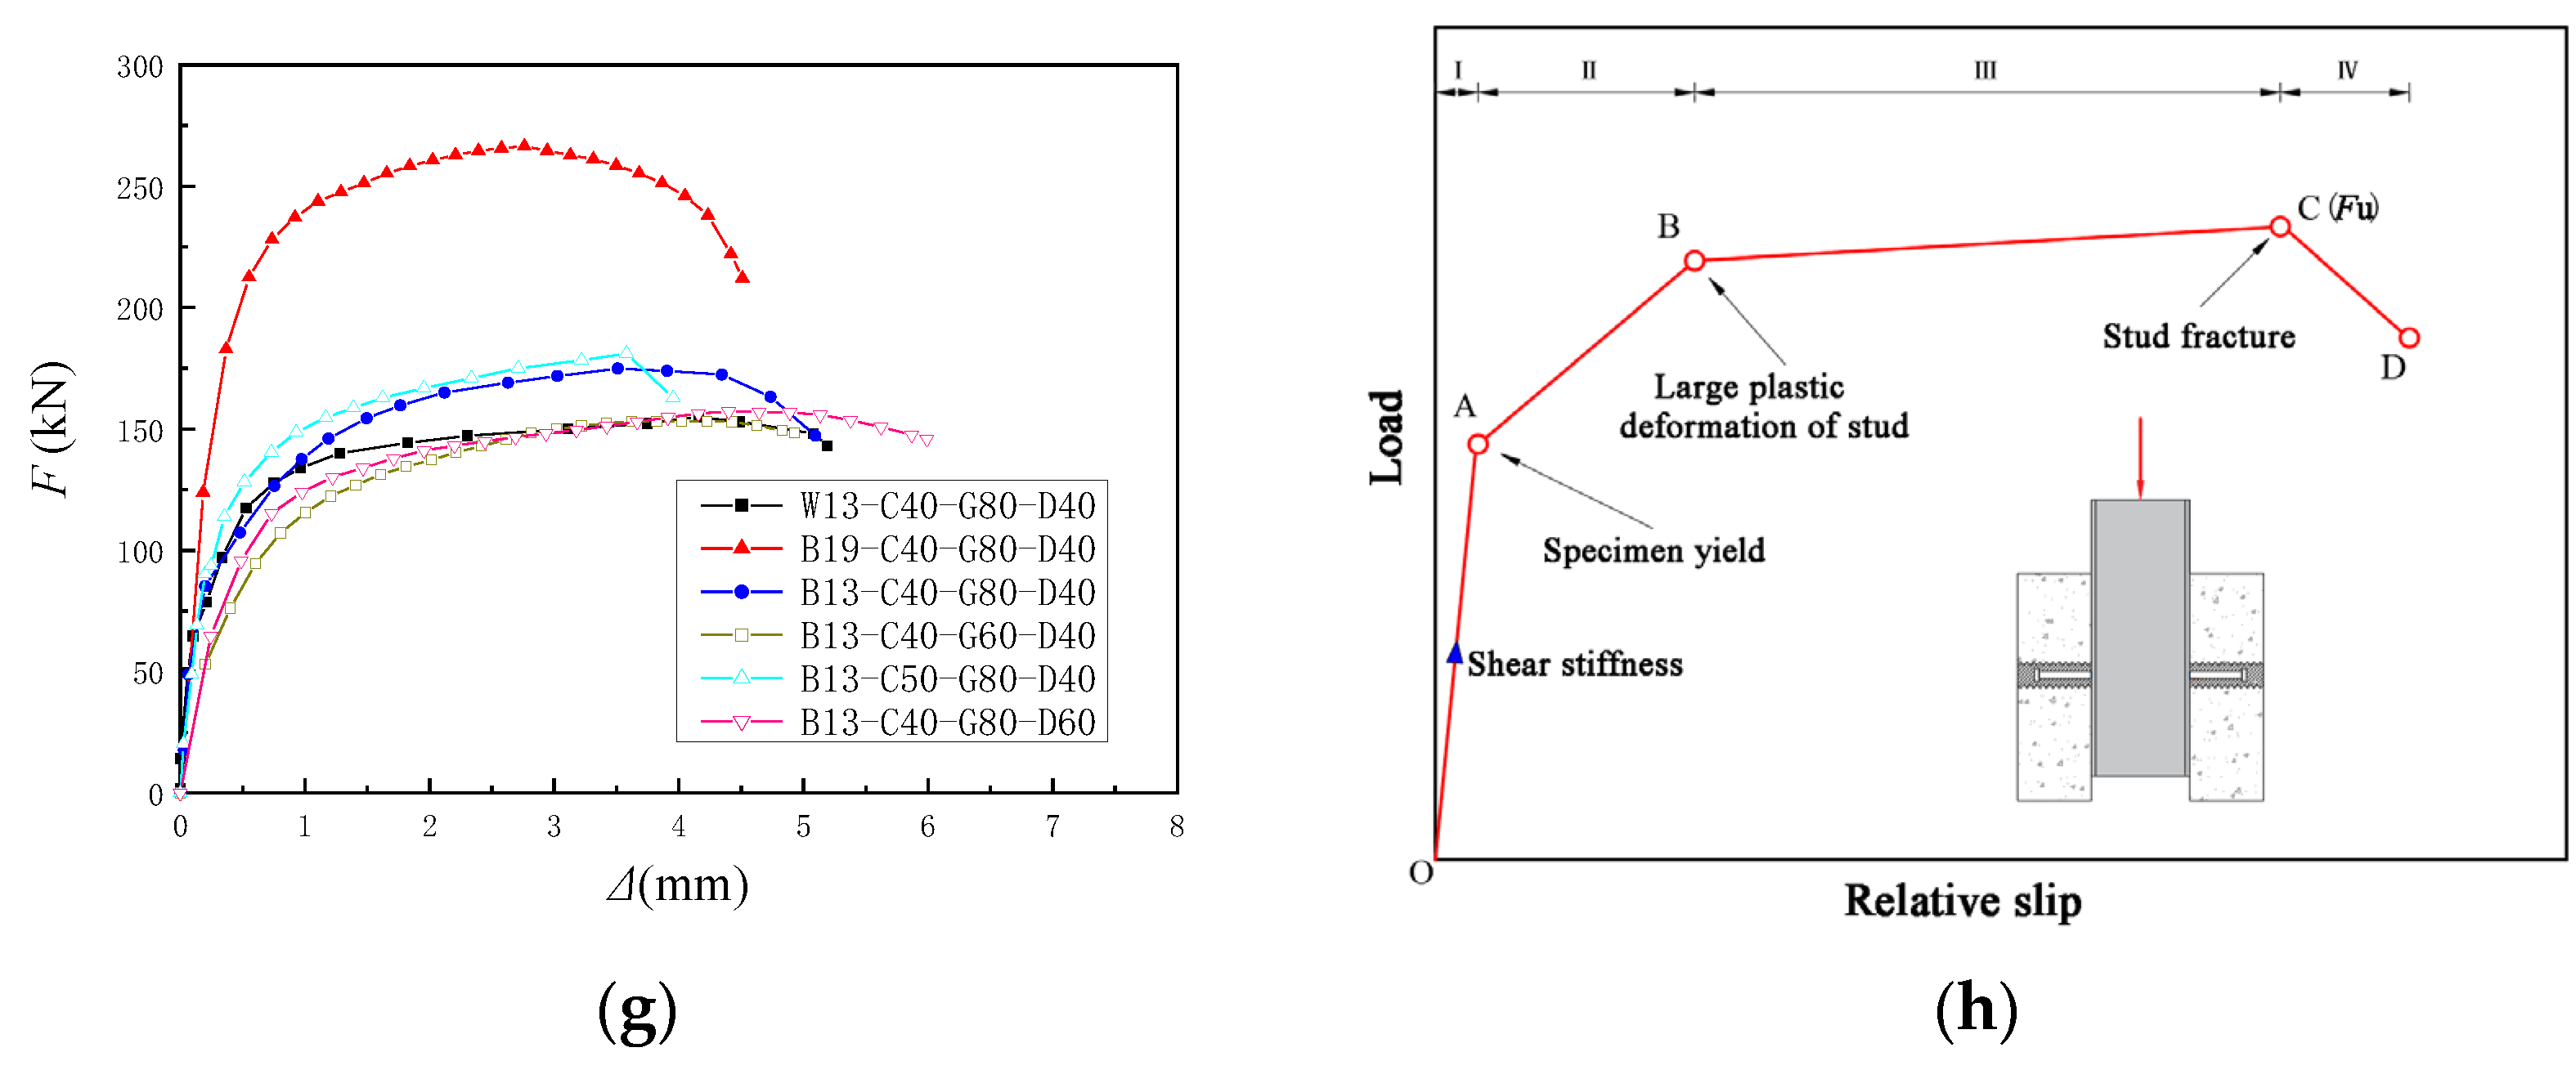
The load–slip curve illustrates the relationship between the slip amount of the steel beam and the concrete slab as the load changes. This curve is crucial for evaluating the mechanical performance of shear connectors. The load–slip curve for each group of specimens was plotted, with each group including two test curves and an average value curve, as shown in Figure 14.
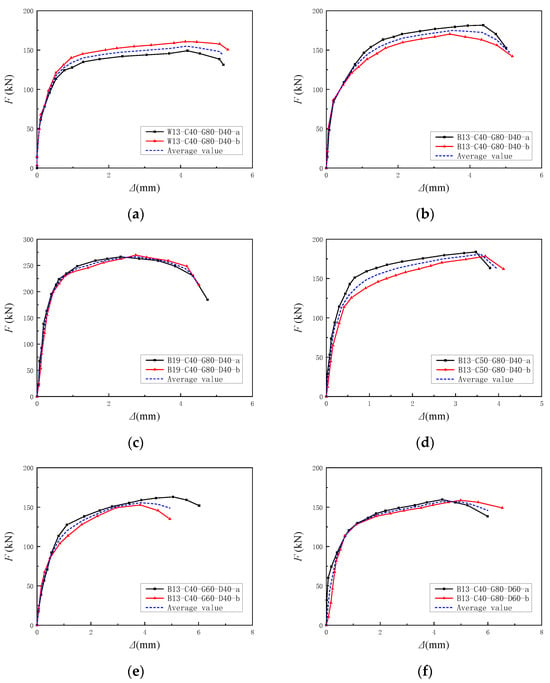
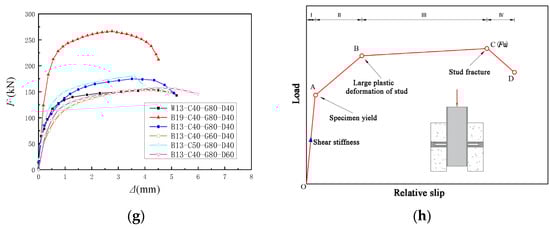
Figure 14.
Load–slip curve for specimens: (a) W13-C40-G80-D40; (b) B13-C40-G80-D40; (c) B19-C40-G80-D40; (d) B13-C50-G80-D40; (e) B13-C40-G60-D40; (f) B13-C40-G80-D60; (g) Average load-slip curve of specimens; (h) Development trend of load-slip curve.
From Figure 14, it is clear that the bearing capacity of the RSP specimens is higher than that of the ordinary shear pocket specimens, attributed to the optimized joint construction. Corrugated pipes help improve damage control around the reserved holes, influence the damage failure mode of joints, and reduce variability in joint strength. Due to the combined load-bearing mechanism of the corrugated tube, embedded steel plate, and grout, the variability in the test results of RSP specimens was also effectively reduced.
From Figure 14g, the B19-C40-G80-D40 specimen exhibits significantly higher shear bearing capacity and stiffness than other specimens, underscoring the impact of stud diameter on joint performance. In contrast, reducing grout strength and increasing the diameter of reserved holes weakens the joint area restraint, leading to decreased initial shear stiffness and ultimate bearing capacity, as seen in the B13-C40-G60-D40 and B13-C40-G80-D60 specimens.
The load–slip curves of all specimens exhibit a similar trend, which can be broadly divided into four stages (Figure 14h):
(1) Elastic Stage (OA Segment):
The specimen is in the elastic phase during the initial loading. Before reaching 30–40% of the peak load, the overall slip is less than 0.2 mm. The load increases rapidly, following an approximately linear trend. The steep slope in the load–slip curve reflects the joint’s shear stiffness.
(2) Yielding Stage (Segment AB):
As the load increases from 40% to 80% of the ultimate capacity, studs and concrete yield, leading to a gradual reduction in joint stiffness due to damage. Consequently, the load–slip curve evolves from a linear to a nonlinear growth pattern. Overall slip remains less than 2 mm, with fine cracks appearing on the surface of the recycled concrete.
(3) Plastic Stage (Segment BC):
As plastic deformation of the stud accumulates and the grout progressively crushes, the rate of load increase slows, while slip escalates rapidly until the ultimate load is reached. The load–slip curve exhibits a gradually flattening trend.
(4) Failure Stage (Segment CD):
As the slip increases, the load value gradually decreases. When the ultimate load drops to 90% of its maximum value, the load rapidly decreases, indicating complete fracture of the studs and damage to the entire joint area.
3.3. Analysis of Experimental Characteristic Values
Table 3 presents the experimental characteristic values obtained from each group of specimens. In the table, Fu denotes the ultimate shear capacity per stud for each specimen, reflecting the shear resistance of the joint, and is defined as half of the measured ultimate load. Fu represents the average ultimate shear capacity per stud for each parameter group, and SF is the standard deviation of ultimate load within the group. Δu is the ultimate slip corresponding to the ultimate load, reflecting the joint’s deformation capacity at peak load. Δu denotes the average ultimate slip per parameter group, and Δu is the standard deviation of ultimate slip. K0 refers to the initial shear stiffness, reflecting the joint’s resistance to deformation in the elastic stage. It serves as an important indicator for evaluating the composite structure’s ability to resist interfacial slip in the elastic stage.
Table 3.
Experimental characteristic values.
The relatively small standard deviations SF and SΔ in the table indicate limited data dispersion. When the RSP joint configuration is adopted, the combined effect of the corrugated tube and the embedded steel plate improves the consistency of joint behavior, resulting in reduced data dispersion. By comparing the experimental data across various test groups, the effects of joint configuration, stud diameter, RAC strength, grout strength, and reserved hole diameter on the ultimate load capacity, ultimate slip value, and initial shear stiffness of the specimen are analyzed as follows:
(1) Joint configuration
Comparing the RSP joint specimen (B13-C40-G80-D40) with the shear pocket joint specimen (W13-C40-G60-D40) reveals that adding an internal steel plate and corrugated pipe to the reserved hole increases the shear capacity of the stud shear connector by approximately 12.89% and improves initial shear stiffness by about 14.19%. This indicates that the internal steel plate and corrugated pipe enhance the constraint of the grout in the joint area and jointly participate in shear resistance, thereby increasing joint strength and stiffness. However, the ultimate slip of the joint decreases by approximately 15.63%.
(2) Stud diameter
Since stud failure primarily involves shear stud fracture, increasing the stud diameter from 13 mm to 19 mm results in a significant increase of approximately 52.35% in ultimate load capacity and 52.89% in shear stiffness. The increased stiffness reduces the slip between the studs and the precast slab, resulting in a reduction in ultimate slip by approximately 21.37%.
(3) RAC strength
Comparing specimens B13-C40-G60-D40 and B13-C40-G80-D40 indicates that increasing the RAC strength from RC40 to RC50 leads to a modest increase of approximately 3.54% in shear capacity and 5.96% in shear stiffness of the stud connector. The increase in RAC slab strength does not directly improve the components in the joint area, resulting in a minor enhancement in specimen load capacity and stiffness. The peak slip of the stud connector increases by approximately 1.99%.
(4) Grout strength
Comparing specimens B13-C40-G60-D40 and B13-C40-G80-D40 indicates that reducing the grout strength from C80 to C60 decreases the shear capacity and stiffness of the specimen by approximately 12.42% and 38.15%, respectively. Grout directly interacts with the studs in the joint area, providing direct restraint and significantly affecting shear stiffness. A decrease in grout strength weakens its ability to restrain the studs, resulting in an increase of approximately 8.83% in ultimate slip.
(5) Reserved hole diameter
Comparing specimens B13-C40-G80-D60 and B13-C40-G80-D40 indicates that increasing the corrugated pipe diameter from 40 mm to 60 mm reduces the shear capacity and stiffness of the specimen by approximately 10.11% and 9.04%, respectively. This suggests that with an increase in reserved hole diameter, the volume of post-pouring grout increases, reducing the confinement of the precast slab in the joint area. Consequently, the ultimate slip of the stud connector increases by approximately 39.32%.
4. Finite Element Analysis
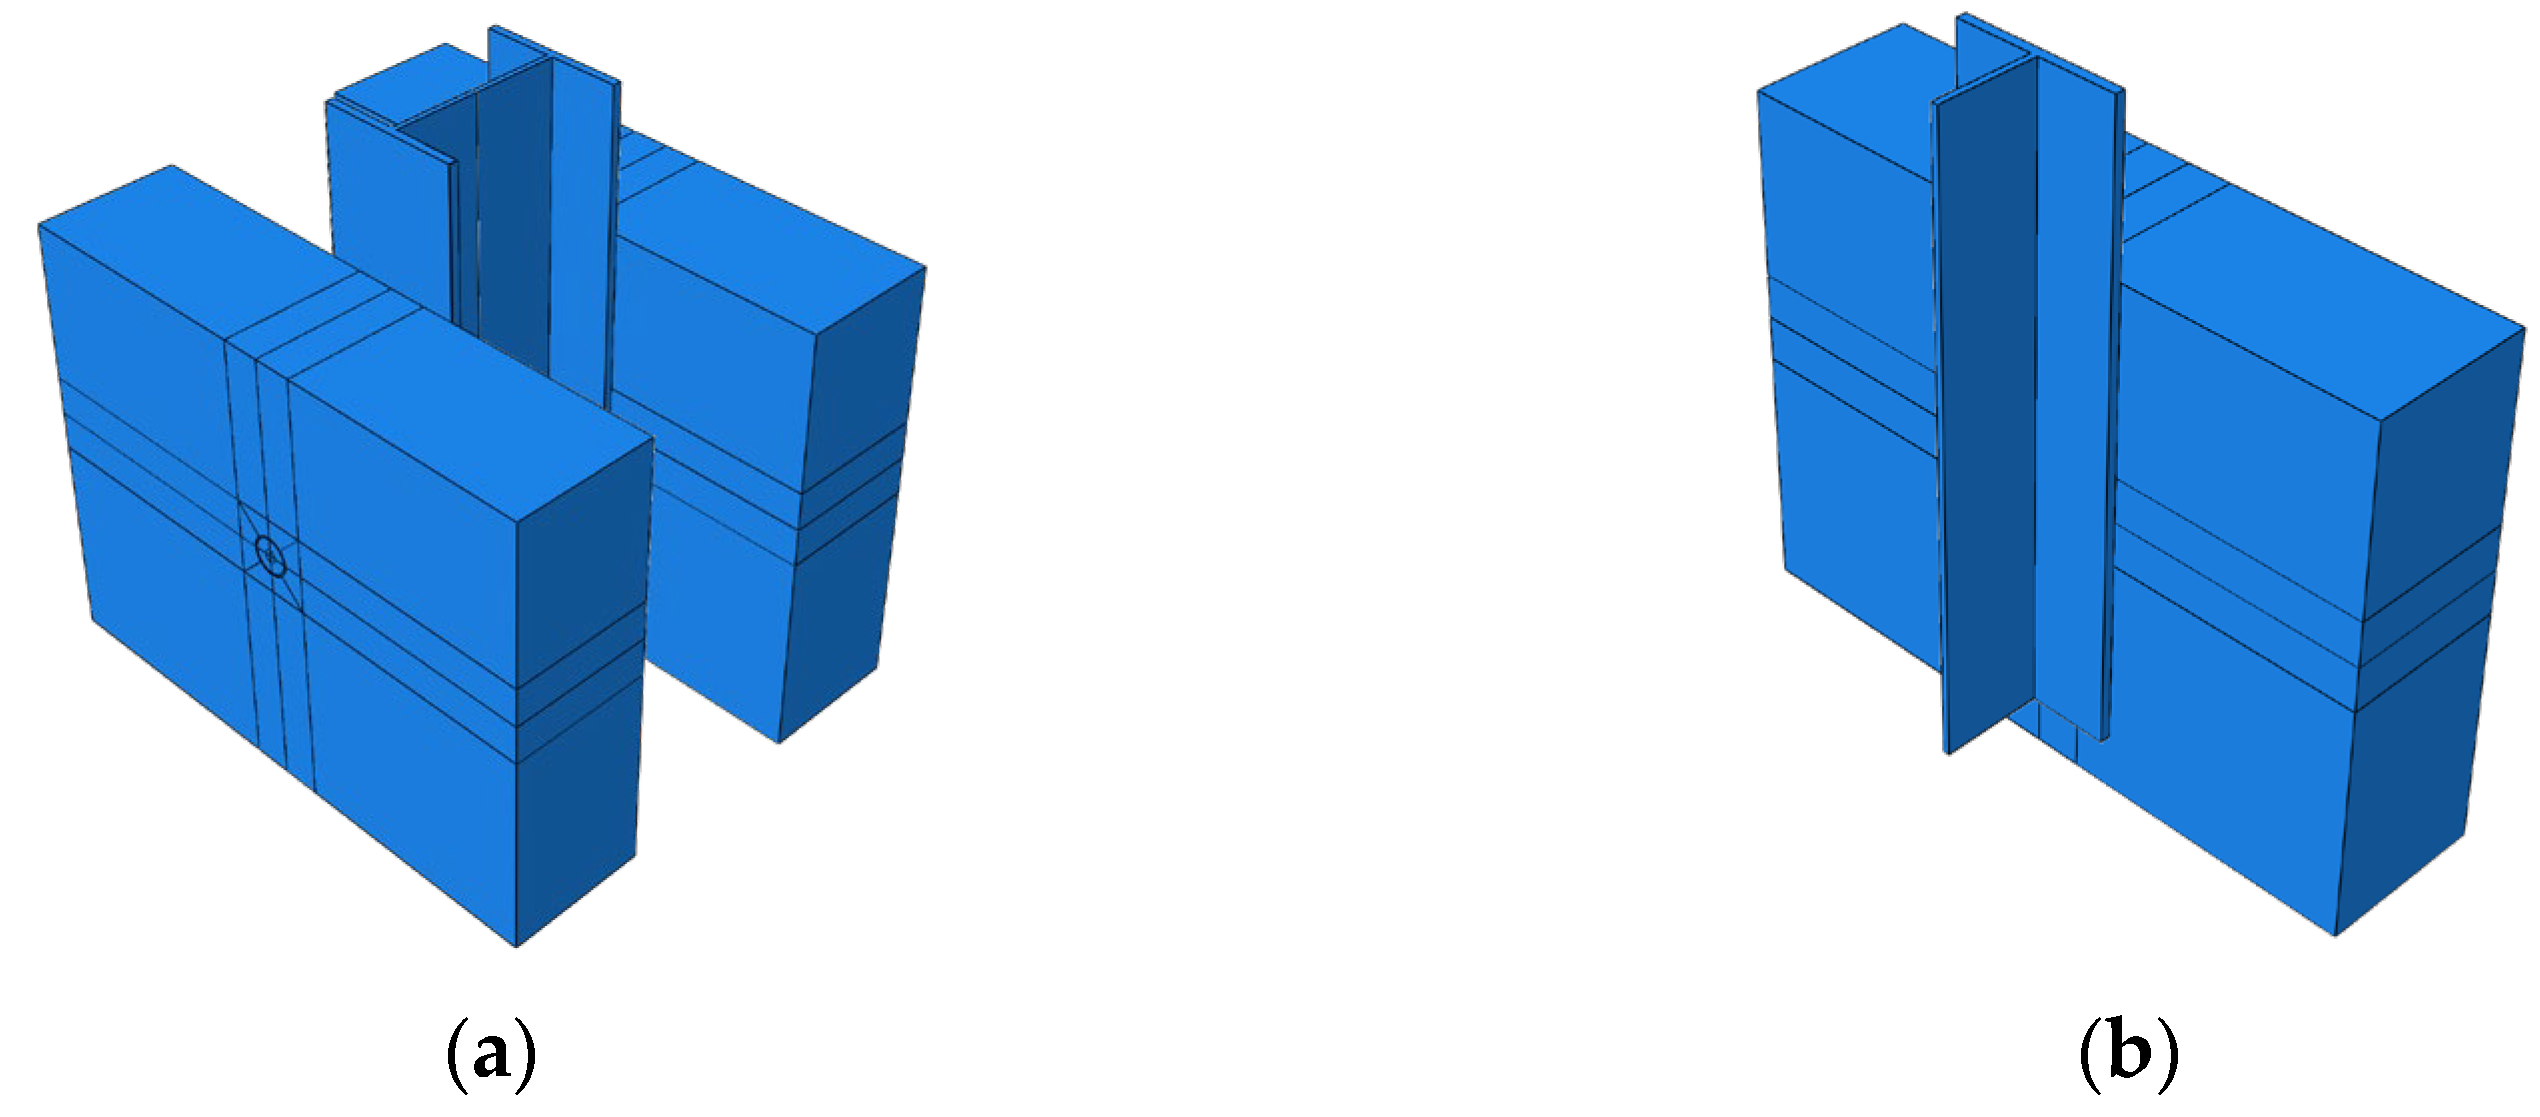
4.1. Modeling and Meshing
A numerical model of the test specimen was created using the finite element software ABAQUS (Version 6.14-4), based on detailed dimensions of the test specimen (Figure 15a). Due to the symmetry of the specimen, a 1/2 model was employed to improve computational efficiency (Figure 15b). The finite element model includes components such as H-section steel, precast floor slabs, corrugated pipes, grout, studs, internal steel reinforcement mesh, and steel plates. The different components were modeled using appropriate elements, with solid elements (C3D8R) for most components and three-dimensional two-node truss elements (T3D2) for the steel reinforcement.

Figure 15.
Finite Element Model of the Specimen: (a) Full-scale model; (b) 1/2 scale model.
The model elements were meshed with grid sizes specified as follows: 20 mm for RAC slab, 20 mm for reinforcement bar, 20 mm for steel beam, and 10 mm for steel plate. A finer mesh size was used at critical locations, such as the contact area between the studs and high-strength grout. The local mesh should be consistent, ranging from 2 to 4 mm. The mesh size for the corrugated pipe is 8 mm.
4.2. Material Constitutive Model
4.2.1. Recycled Concrete
The concrete damaged plasticity (CDP) model was used to characterize the behavior of RAC under compression in the simulation. The stress–strain relationship for compressed RAC was based on the model proposed by Xiao [27,28]. The specific expressions are detailed in Equations (1)–(3):
where yc represents the relative compressive stress of concrete, defined as yc = σc/fm. σc is the compressive stress of concrete and fm is the axial compressive strength of concrete. xc denotes the relative compressive strain of concrete, given by xc = εc/εc0, where εc is the compressive strain of concrete and εc0 is the peak compressive strain of concrete. a and b are coefficients reflecting the influence of the recycled-aggregate replacement ratio, expressed as Equations (2) and (3), where r represents the replacement ratio of recycled aggregate.
The tensile constitutive relationship for RAC adopted the stress–strain model proposed by Xiao [29]. The specific expression is given by Equation (4):
where, yt represents the relative tensile strength of concrete, defined as yt = σt/ft. σt is the tensile stress of concrete and ft is the tensile strength of concrete. xt denotes the relative tensile strain of concrete, given by xt = εt/εt0, where εt is the tensile strain of concrete and εt0 is the peak tensile strain of concrete. c represents the ratio of the tangent modulus to the secant modulus at the reference point. For RC40, c = 1.22 and for RC50, c = 1.23.
In addition to the stress–strain curve definition, the key parameters for the CDP model must also be specified in ABAQUS [30,31,32]. These parameters include the dilation angle, eccentricity, fb0/fc0 ratio, K, and viscosity parameter, with respective values of 40°, 0.1, 1.16, 0.64, and 0.0005.
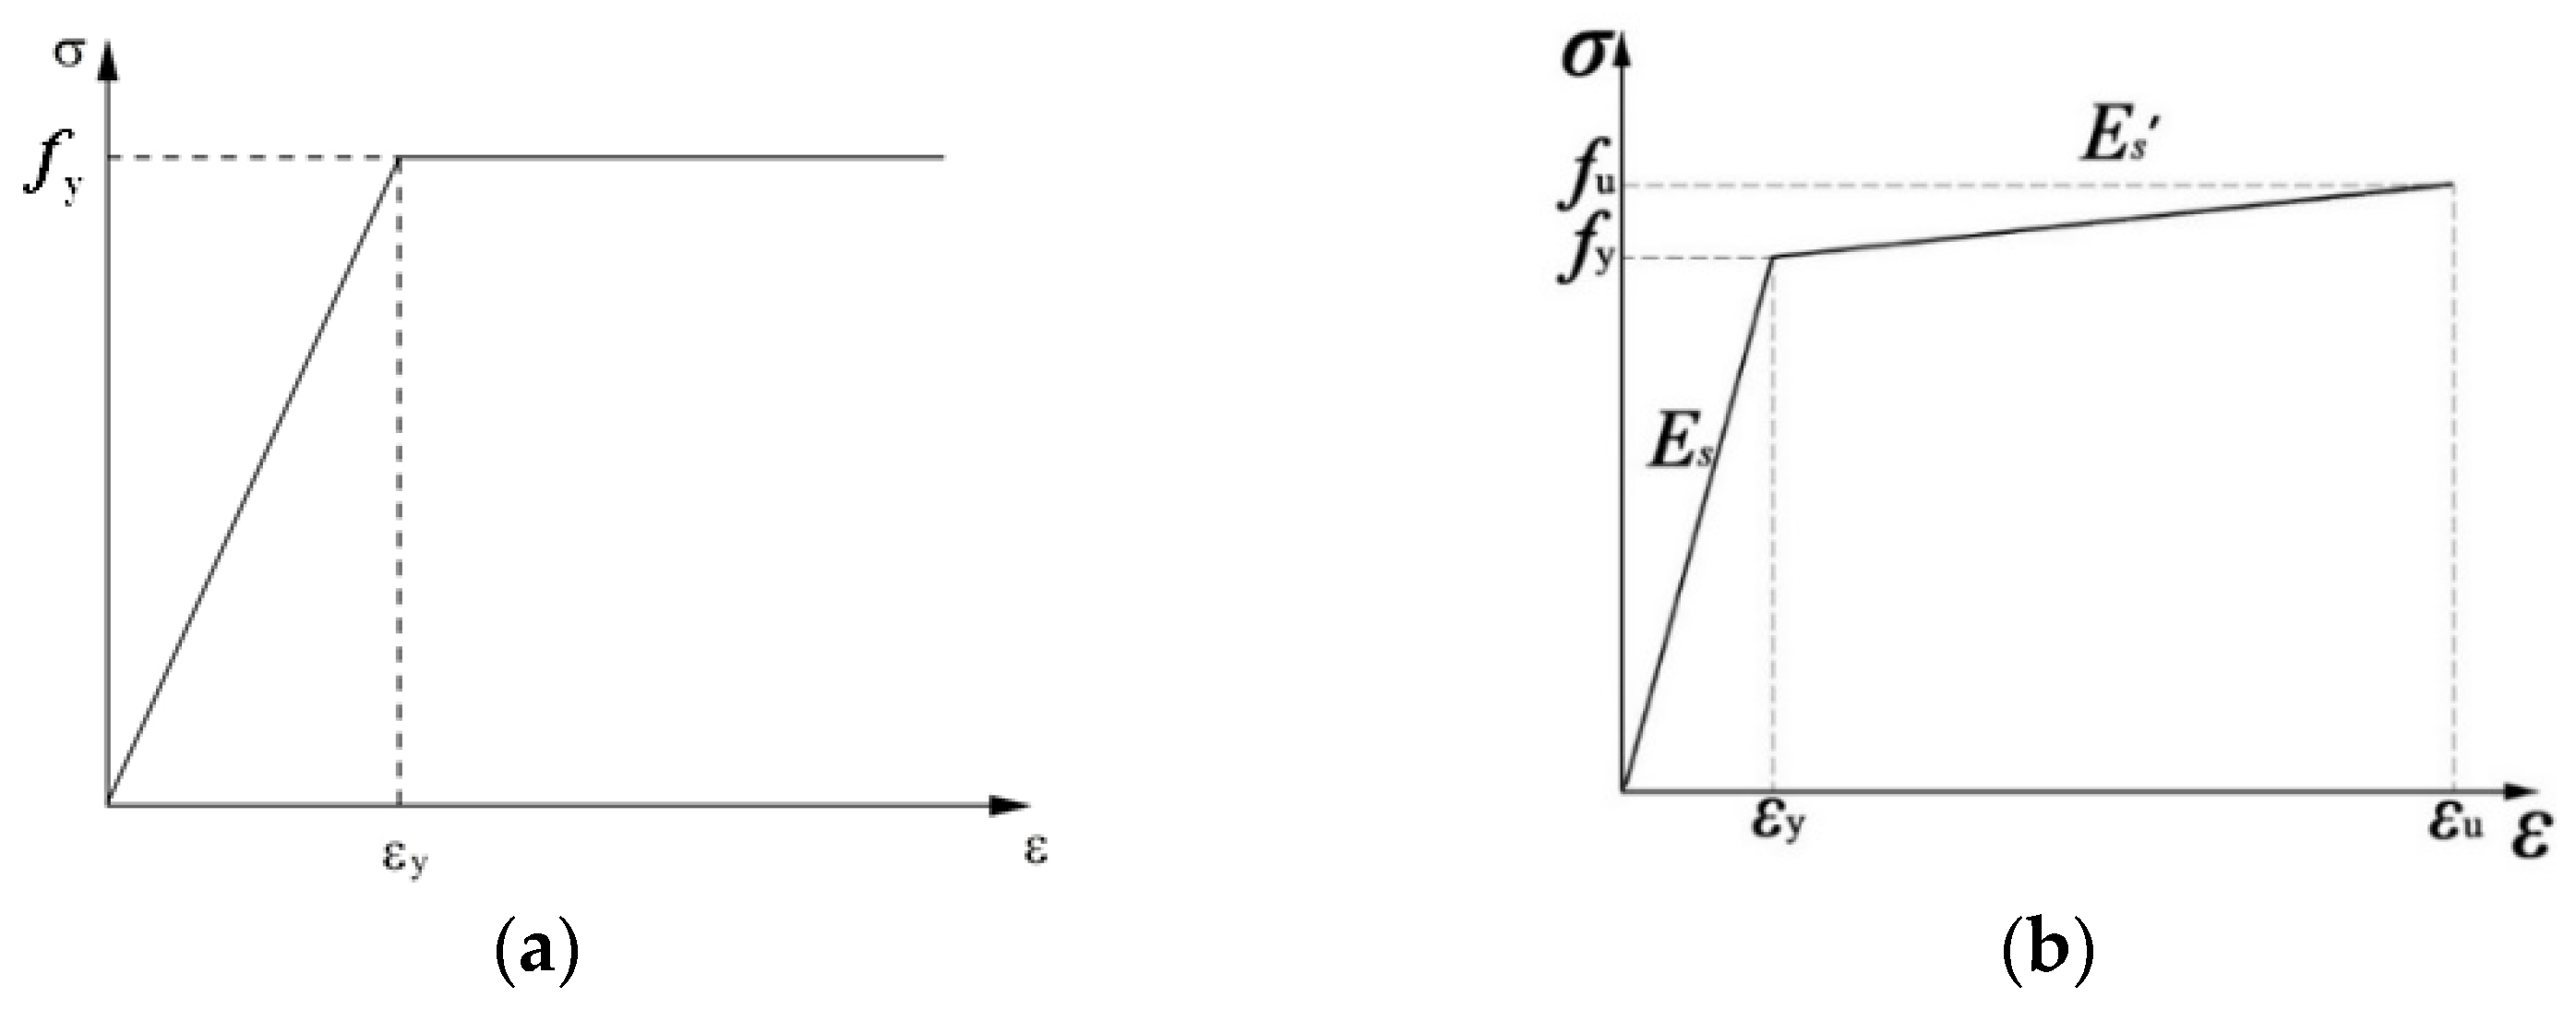
4.2.2. Steel
Based on experimental strain data, the maximum strain in the reinforcement, steel plate, and corrugated pipe components is between 80–500 με, which is much smaller than the yield strain of steel. Therefore, these components were simulated using an ideal elastoplastic model as shown in Figure 16a. The yield strength in the ideal elastoplastic model used the measured mechanical properties of the steel detailed in Section 2.2.2.

Figure 16.
Constitutive relationship models for steel: (a) Ideal elastoplastic model; (b) Elastic hardening model.
The studs, which act as the main force-transmitting components between the steel beam and the RAC slab, experience a more complex stress condition. The strain in the specimen ranges from 3500 to 10,000 με, indicating a high-stress state for the studs. Therefore, the stress–strain relationship of the stud connectors adopted an elastic hardening model, as shown in Figure 16b, with E s′ = 0.01 E s in the elastic hardening model.
4.3. Contacts and Constraints
In the finite element modeling of the push-out specimen, the actual contact and constraint conditions are carefully considered to ensure accurate simulation. The following contacts and constraints are implemented:
- (1)
- Interface between recycled concrete slab and steel beam flange surface: This interface was modeled using surface-to-surface contact. The steel surface was defined as the master surface and the RAC slab surface as the slave surface. Surface-to-surface contact includes both tangential and normal interactions. The tangential behavior is modeled using a penalty formulation with a friction coefficient of 0.2, while the normal interaction is defined as hard contact, allowing separation after contact.
- (2)
- Reinforcement mesh and RAC slab: The interaction between the reinforcement mesh and the RAC slab was simulated using the embed command, which ensures that the reinforcement mesh is embedded within the concrete slab.
- (3)
- Studs and grout: The interaction between the studs and the grout was also modeled using surface-to-surface contact. The shear stud surface is defined as the master surface, and the grout surface as the slave surface. Tangential contact is modeled using a penalty formulation with a friction coefficient of 0.4, while normal contact is defined as hard contact.
- (4)
- Grout and RAC, embedded tube and RAC, steel plate and embedded tube: These contact surfaces are constrained using the tie method due to reliable bonding with no signs of delamination observed during the experiment.
4.4. Load and Boundary Conditions
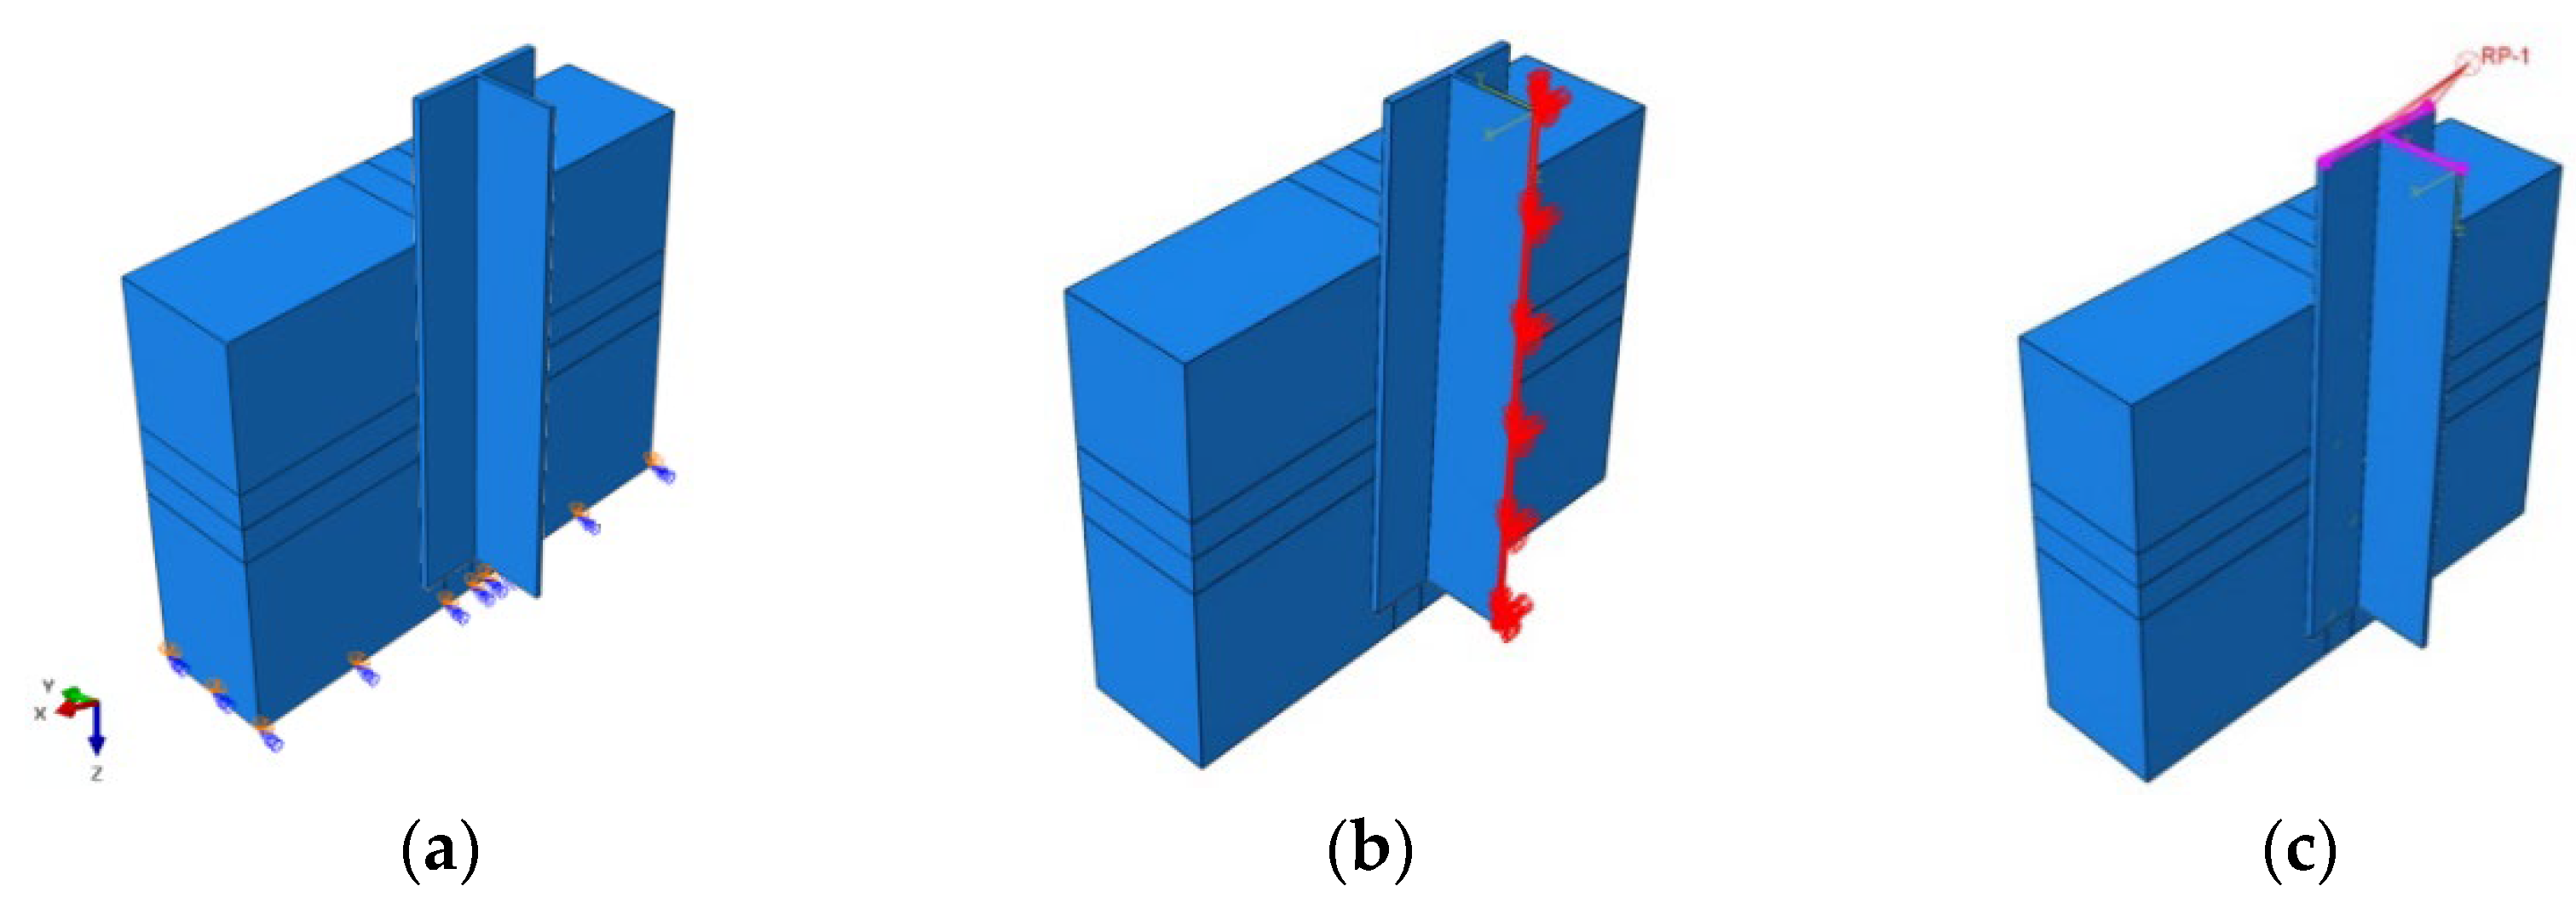
The finite element model’s coordinate directions are depicted in Figure 17a. Several specific boundary conditions are applied to replicate the experimental setup:
- (1)
- Bottom of the concrete slab: To simulate the interaction between the prefabricated concrete slab and the steel beam, constraints were applied to restrict all degrees of freedom at the bottom of the concrete slab, except for the horizontal Y-direction. This is shown in Figure 17a.
- (2)
- Steel beam: Boundary conditions were applied to the 1/2 symmetry plane of the model to restrict displacement in the Y-axis direction, as shown in Figure 17b.
- (3)
- Loading position on top of the steel beam: A reference point RP-1 was established at the loading position on the top of the steel beam. This reference point RP-1 was coupled with the top surface of the steel beam, and displacement was applied at reference point RP-1 to induce vertical downward displacement of the steel beam. This setup is illustrated in Figure 17c.

Figure 17.
Load and Boundary Conditions: (a) Bottom Constraint; (b) Symmetry Plane Constraint; (c) Load Application Position.
Figure 17.
Load and Boundary Conditions: (a) Bottom Constraint; (b) Symmetry Plane Constraint; (c) Load Application Position.
4.5. Finite Element Results Analysis
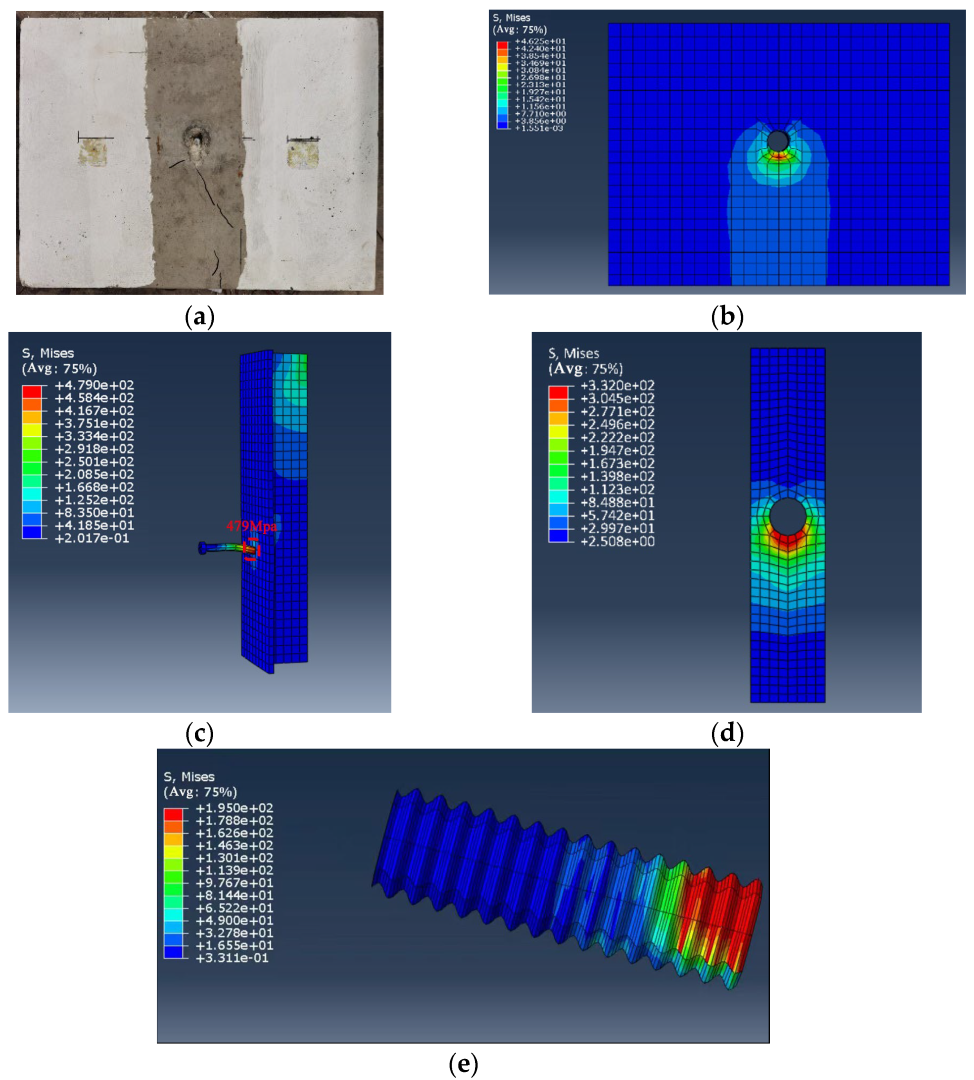
4.5.1. Damage Characteristic Analysis
A comparison was conducted between the failure characteristics of specimen B13-C40-G60-D40 and the stress nephogram results from the finite element (FE) simulation, as shown in Figure 18. In the experiment, local crushing of the grout and concrete occurred in the compression zone near the shear studs, as illustrated in Figure 18a. The FE stress nephogram results indicate that significant stress and damage were observed near the shear studs, as depicted in Figure 18b. The FE simulation results correspond well with the experimental observations.

Figure 18.
Damage characteristics of B13-C40-G60-D40: (a) Damage characteristics of test specimen; (b) Damage characteristics of finite element model; (c) Stress nephogram of stud and beam; (d) Stress nephogram of embedded steel plate; (e) Stress nephogram of corrugated tube.
The damage process begins with the shear studs bearing the shear force transferred from the steel beam. The shear force is transmitted to the grout, causing a significant increase in stress within the grout. The stress is then transferred downward through the corrugated tube to the concrete, leading to an increase in stress in the concrete. Additionally, due to the extrusion effect of the grout, stress concentration occurs in both the steel plate and the corrugated tube. The stress concentration zone of the steel plate and corrugated tube deforms along the loading direction, confirming their cooperative load-bearing behavior with the grout and concrete, as shown in Figure 18c,d. The embedded steel plate and corrugated tube, as reinforcement measures, collaborates with the grout and concrete during the loading process, ensuring the safety and shear resistance of the joint.
4.5.2. Load–Slip Curve
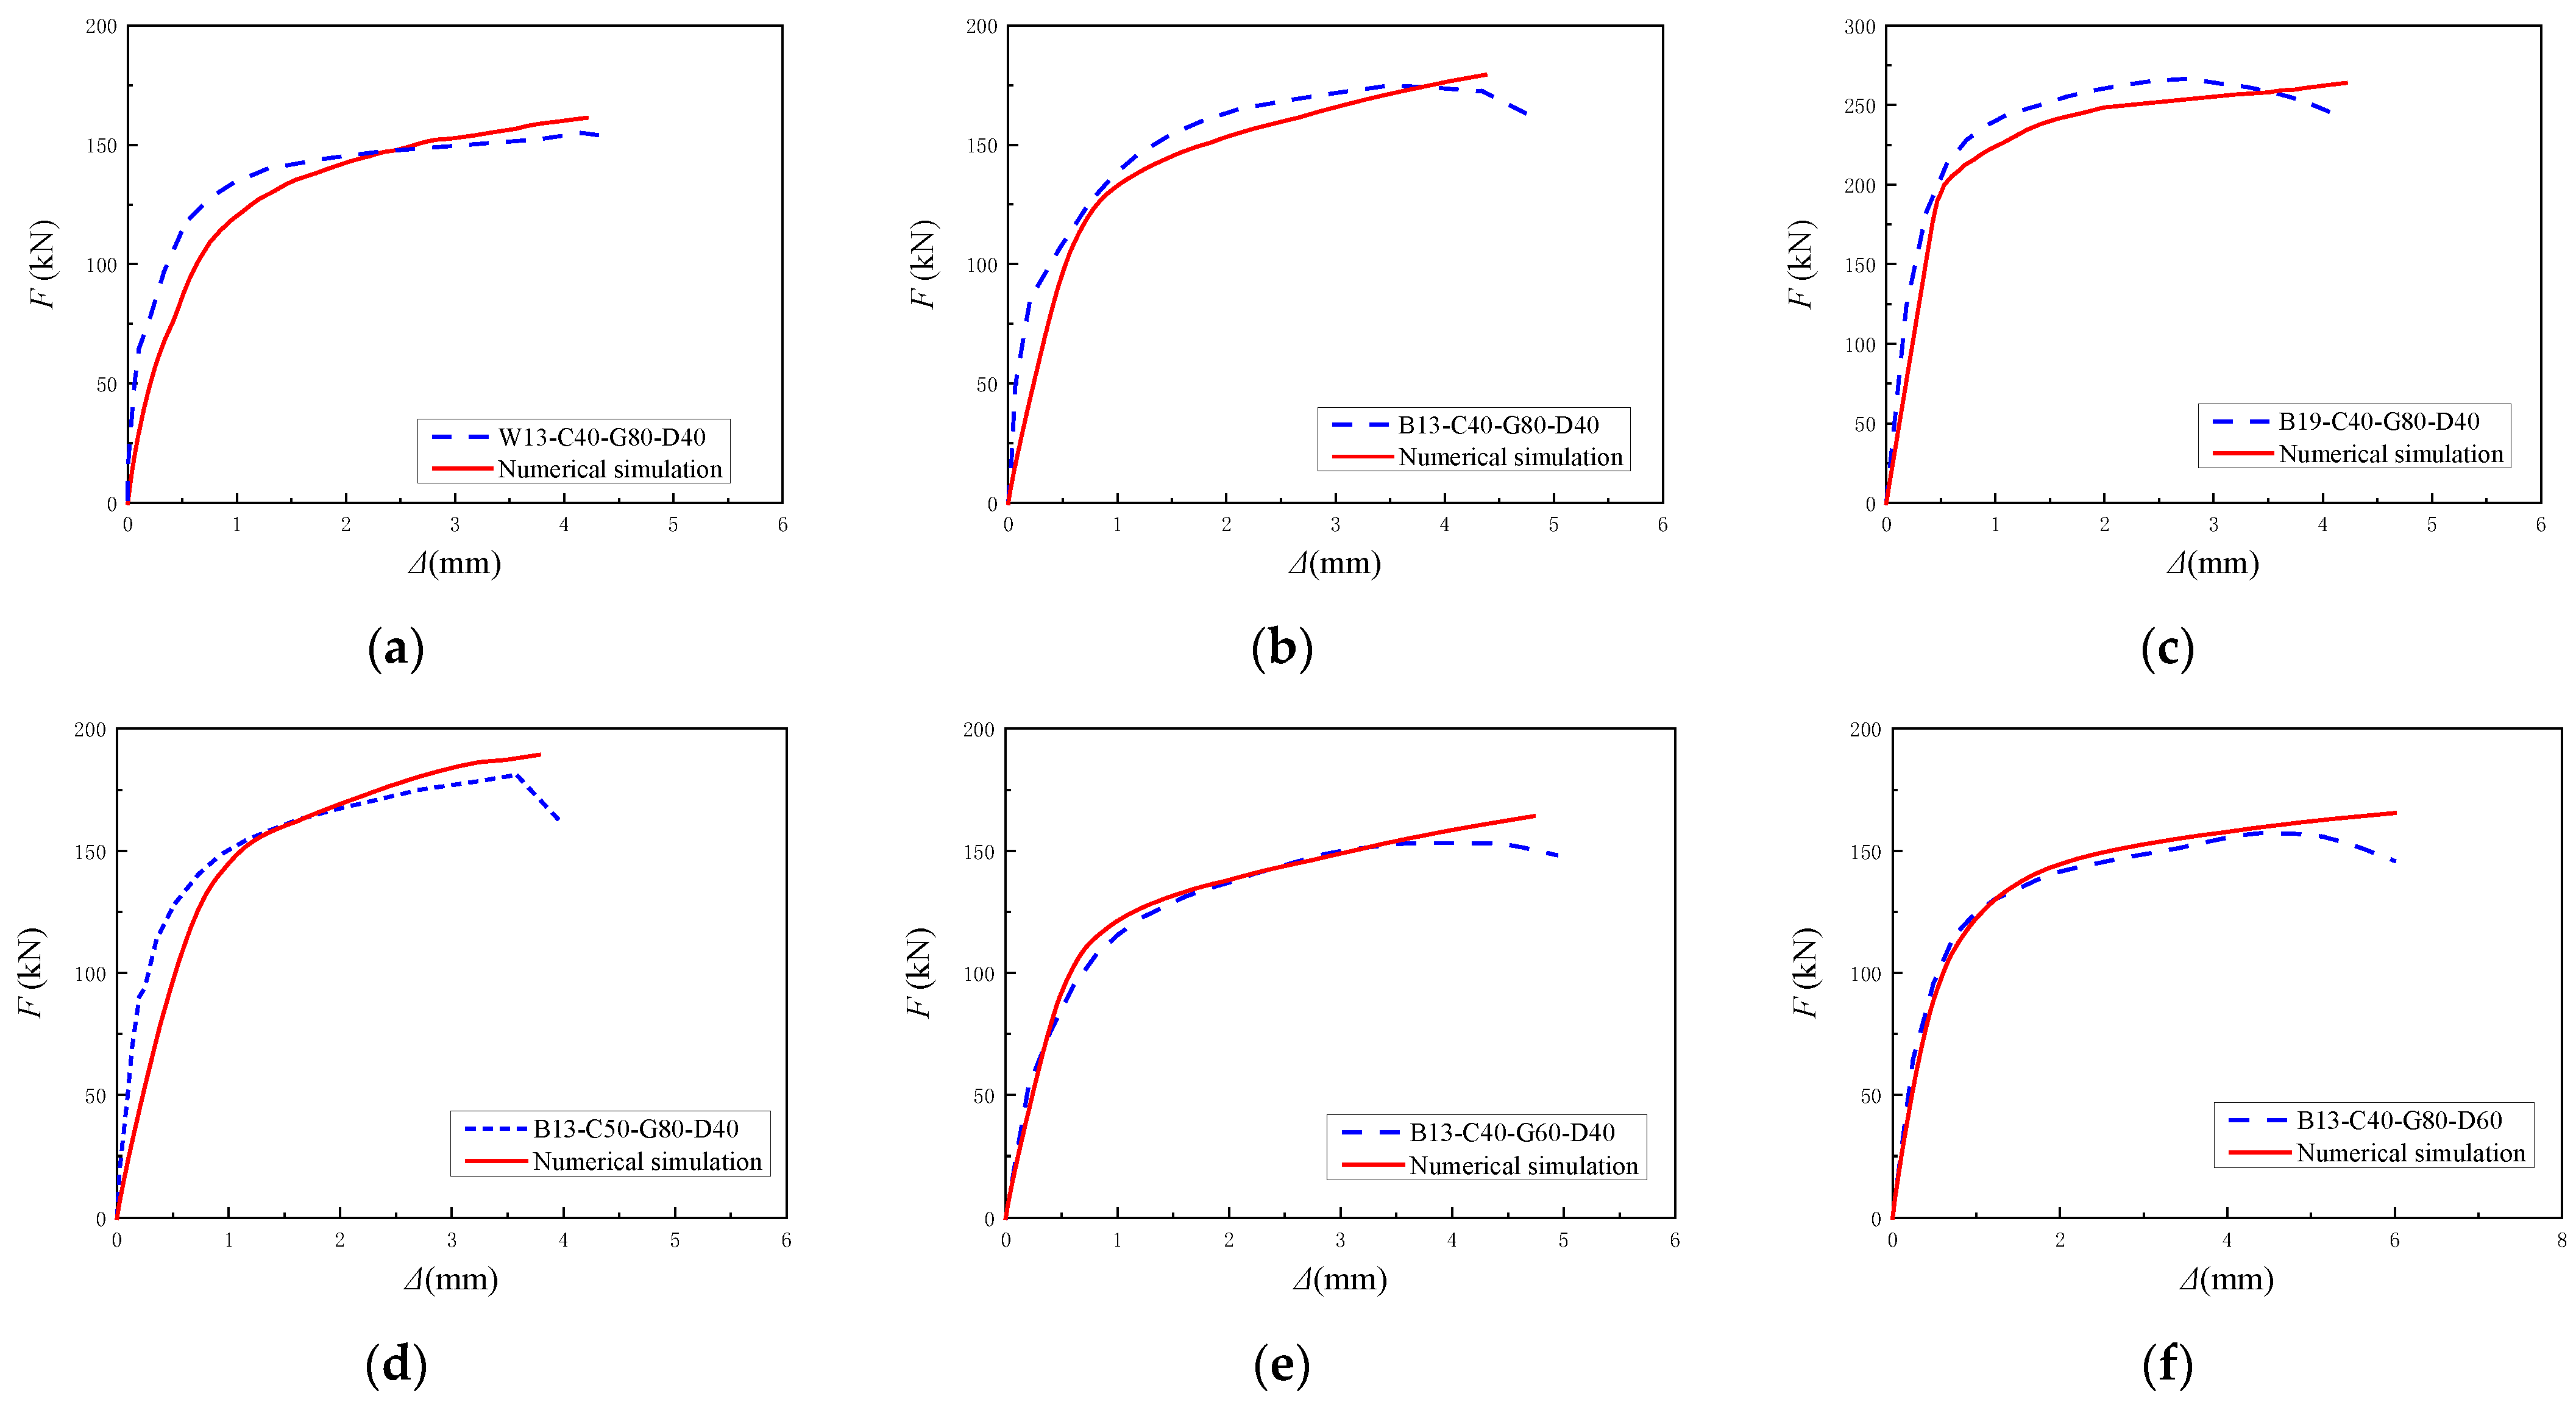
Figure 19 compares the load–slip curves measured in the experiments on six specimen groups with different parameters to the curves obtained from the FE simulations. The load–slip curves obtained from the FE simulations generally agree with the experimental curves in terms of shape before reaching the ultimate load. The absence of a descending branch in the simulation results is likely due to the use of an idealized model for the studs, which cannot capture stud fracture behavior. There is some variation in the initial stiffness between the simulation and experimental results—some specimens show good agreement, while others exhibit discrepancies. This can be attributed to the inherent variability among test specimens, as well as differences in fabrication and material properties that cannot be exactly replicated in the finite element model (FEM). The ultimate shear capacities obtained from the FE simulations correspond closely with those measured experimentally. The related error analysis is summarized in Table 4.
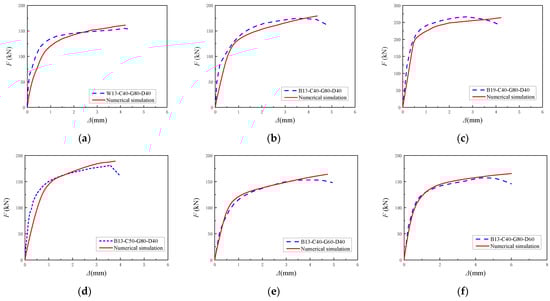
Figure 19.
Comparison of load–slip curves: (a) W13-C40-G80-D40; (b) B13-C40-G80-D40; (c) B19-C40-G80-D40; (d) B13-C50-G80-D40; (e) B13-C40-G60-D40; (f) B13-C40-G80-D60.
Table 4.
Comparison of experimental and simulated ultimate shear capacity.
Table 4 presents a comparison between the experimental ultimate shear capacity of individual studs and the FE simulation results. The minimum relative error is 0.99%, the maximum relative error is 7.17%, and the average error is 4.09%, indicating high reliability of the FE simulation results and confirming the validity of the model.
4.6. Parameter Analysis
Based on the validation of the FEM’s accuracy, an in-depth investigation was conducted into the effects of stud diameter, RAC strength, and reserved hole diameter on the shear performance of RSP joints. The study parameters were as follows:
- (1)
- Stud diameter (S): 13 mm, 16 mm, 19 mm, 22 mm;
- (2)
- RAC strength (C): RC30, RC40, RC50, RC60;
- (3)
- Reserved hole diameter (D): 30 mm, 40 mm, 50 mm, 60 mm;
- (4)
- Corrugated tube thickness (T): 0.5 mm, 1.0 mm, 1.5 mm, 2.0 mm.
In all FEM, the grout strength is held constant at 80 MPa. Model identifiers follow this convention: S13-C40-G80-D40-T0.5.
Where “S” denotes the shear stud diameter, “C” the RAC strength, “G” the grout strength, “D” the reserved-hole diameter, and “T” the corrugated tube thickness (in mm).
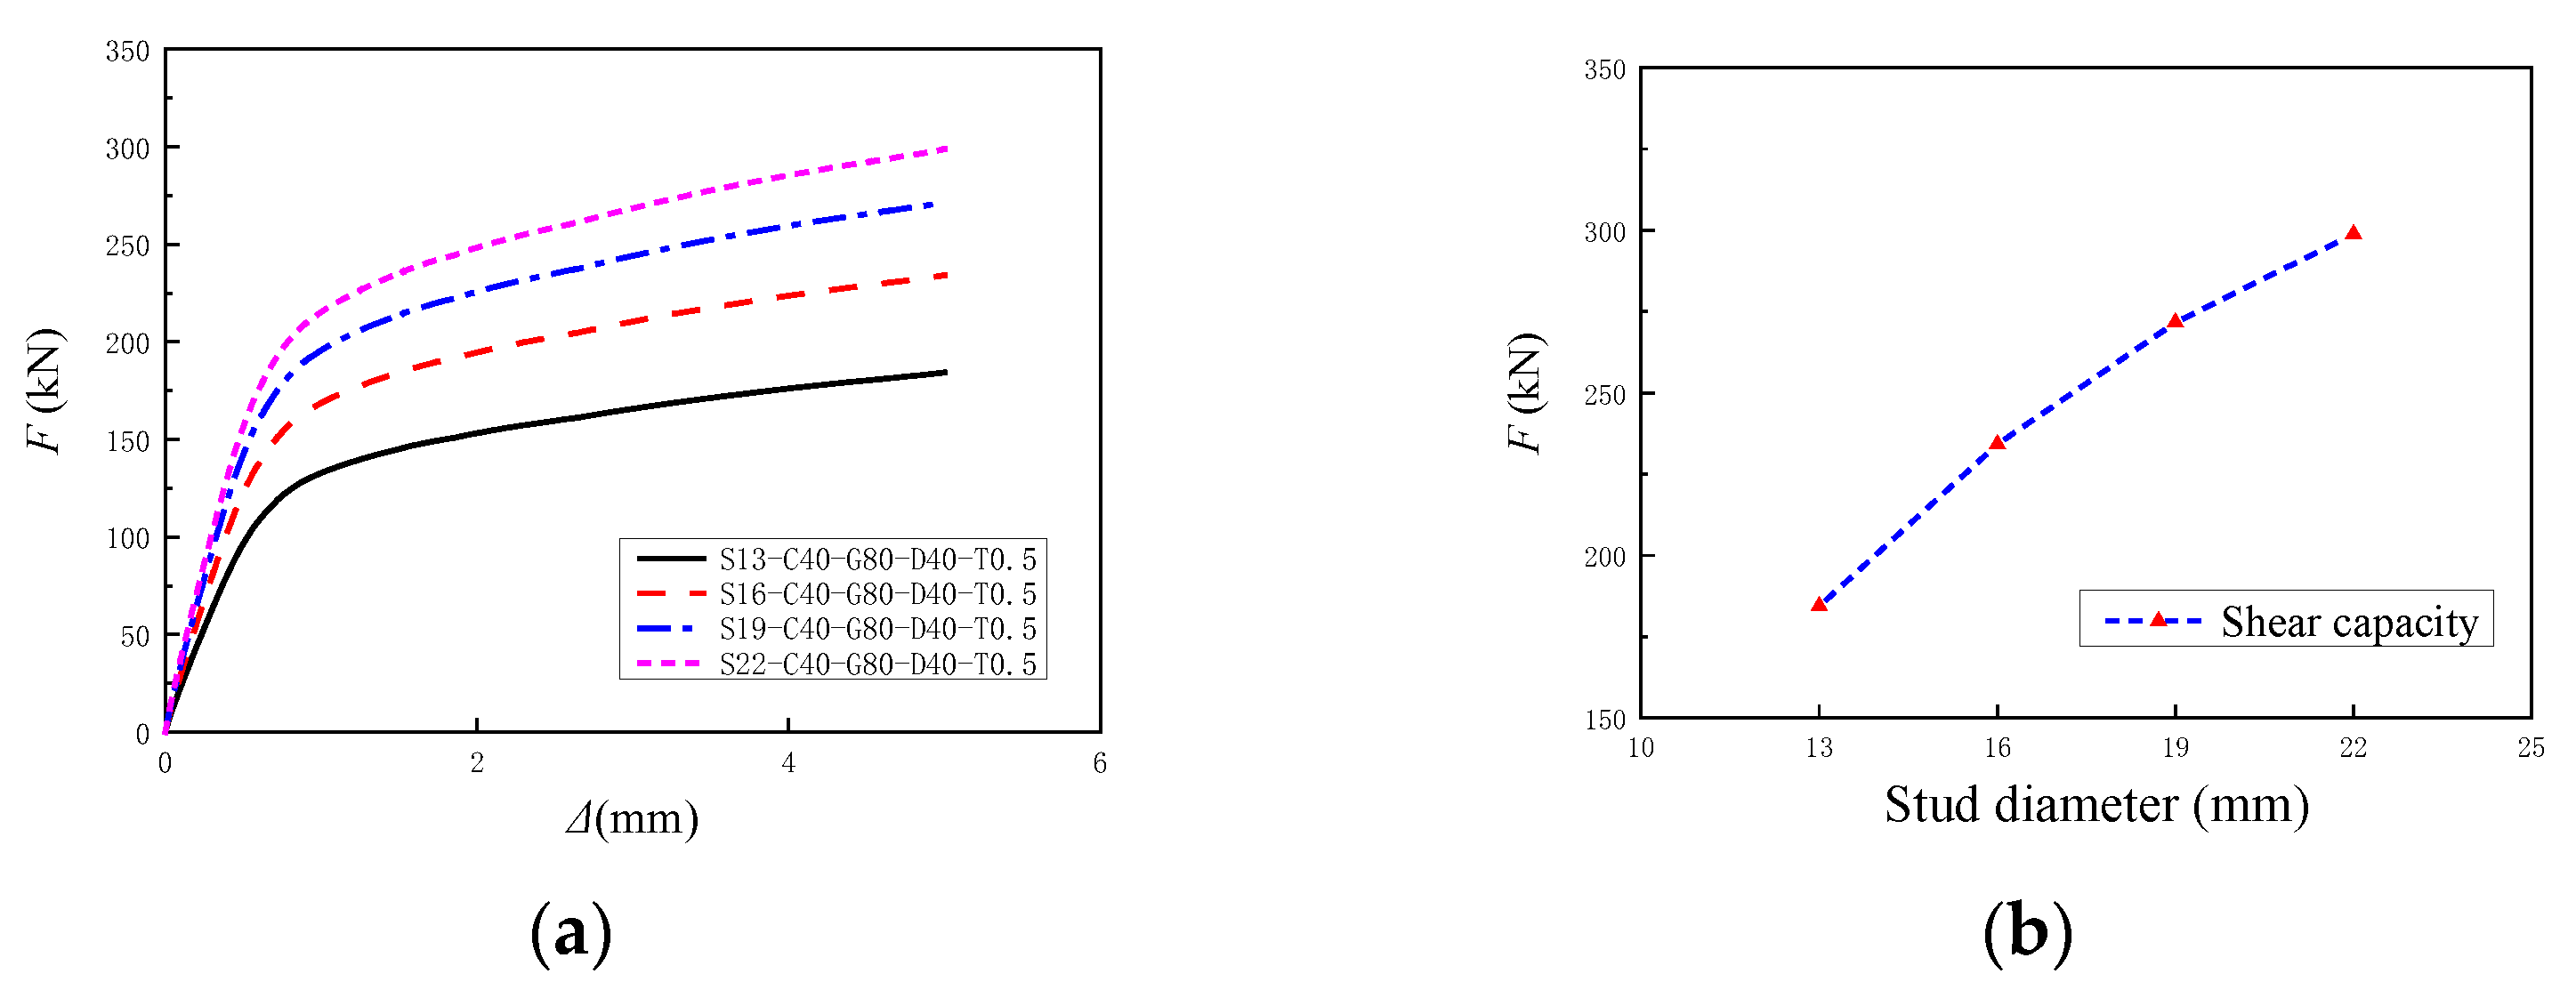
4.6.1. Stud Diameter
Figure 20 shows the shear capacity results of the joint with stud diameters of 13 mm, 16 mm, 19 mm, and 22 mm obtained from FE simulations. The load–slip curves of the joints exhibit a similar trend under different stud diameters. Experimental results revealed that the failure of RSP joint specimens was caused by stud shear fracture, with pronounced stress concentrations observed at the stud roots. Increasing the stud diameter enhanced the shear capacity of the studs, resulting in a significant improvement in the overall shear strength of the RSP joints. Furthermore, the shear capacity exhibited an approximately linear increase with the stud diameter. When the stud diameter increases from 13 mm to 16 mm, 19 mm, and 22 mm, the shear capacity of the RSP joints increases by 27%, 47%, and 63%, respectively. However, as the diameter of the studs increases from 13 mm to 22 mm, the grouting material in the joint area sustains more damage due to the interaction with the studs, thereby reducing the efficiency of the improvement in the joint’s shear capacity.
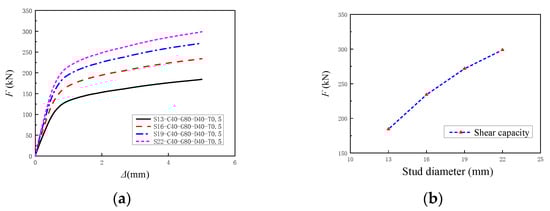
Figure 20.
Influence of stud diameter on the shear capacity of joints: (a) Load–slip curves; (b) Shear capacity analysis.
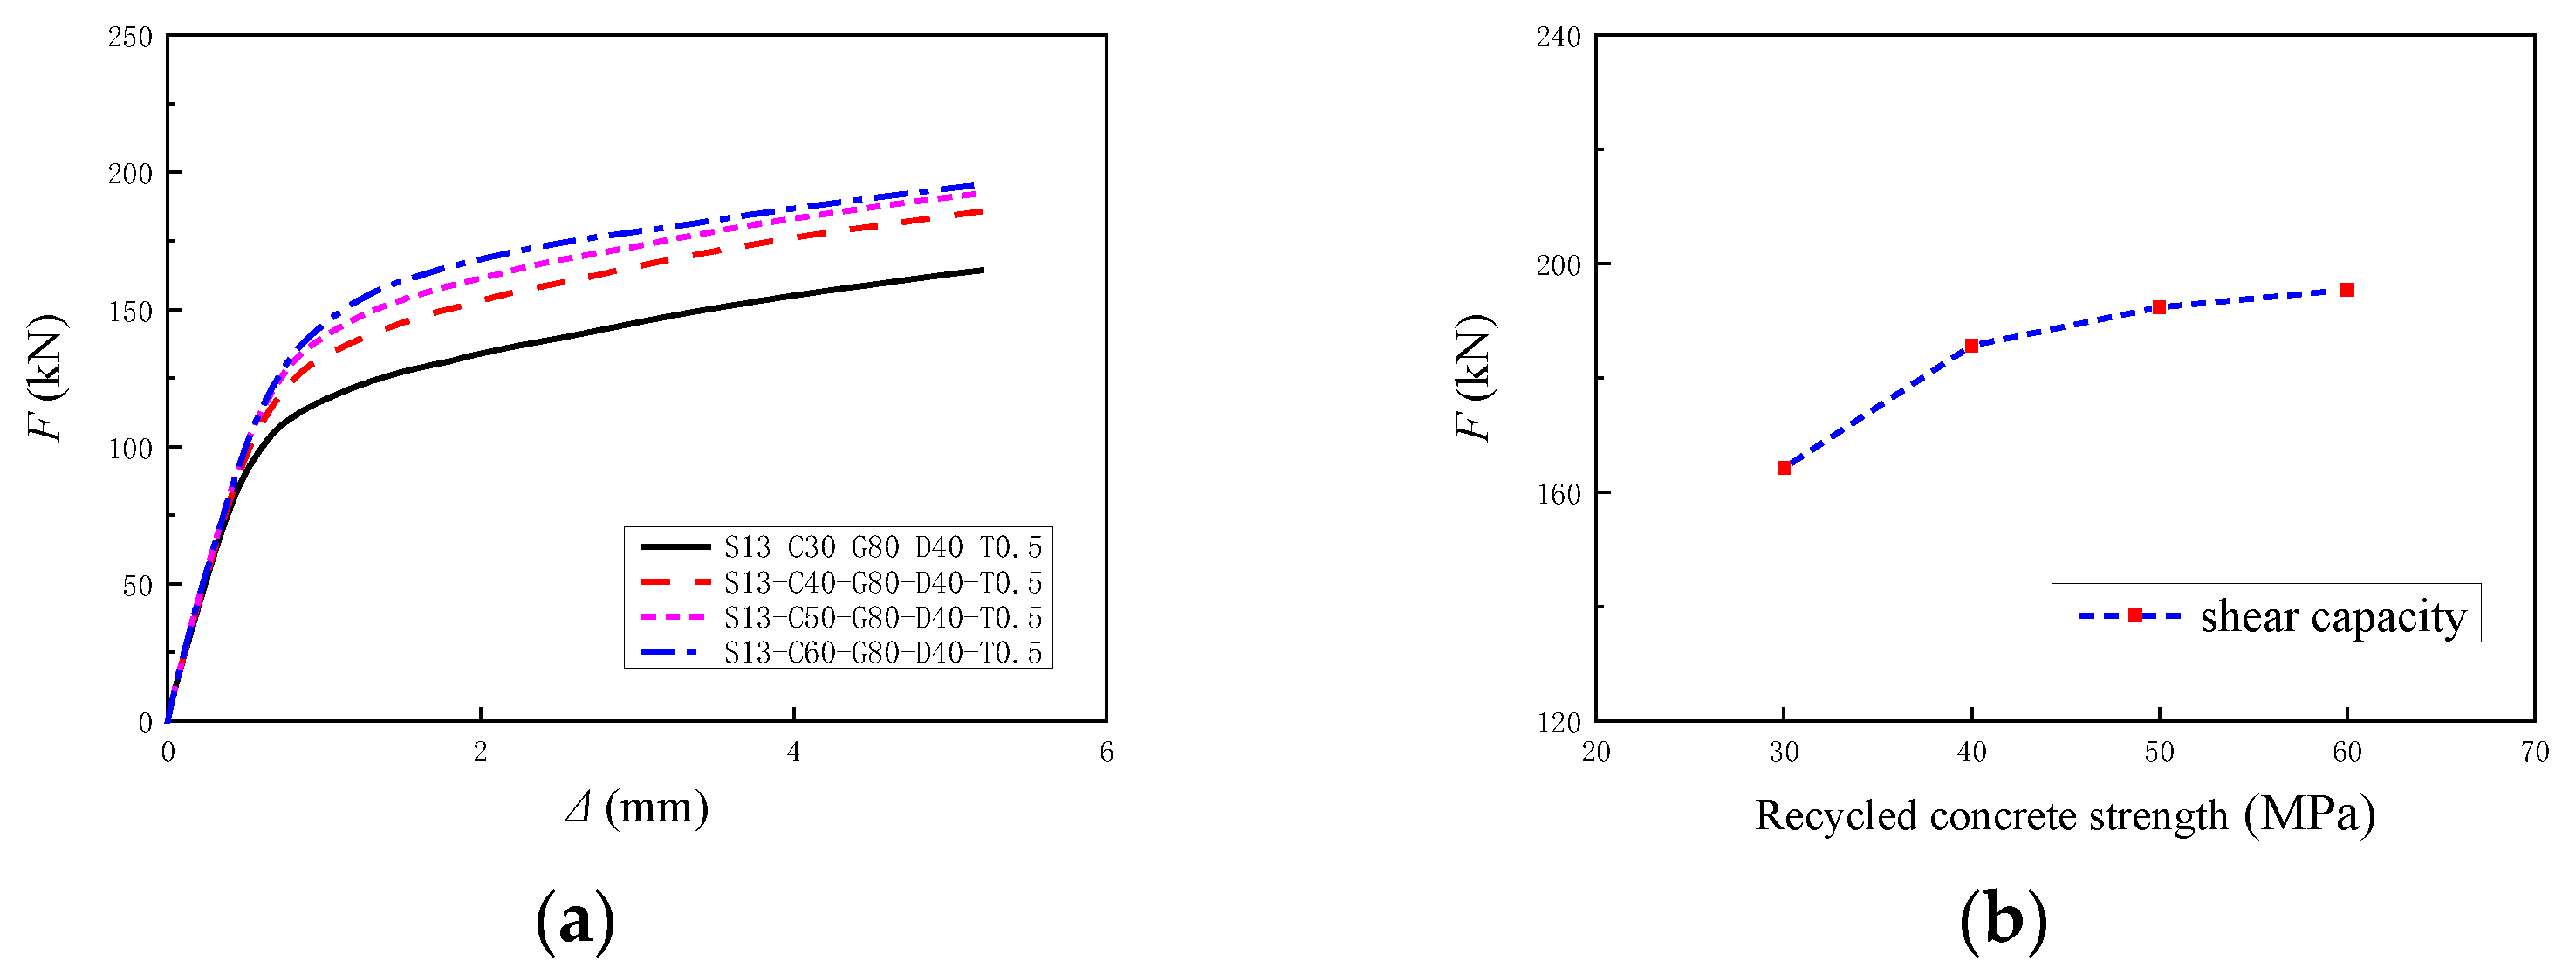
4.6.2. Recycled Concrete Strength
Figure 21 shows the FE simulation results of shear capacity for joints with RAC strengths of RC30, RC40, RC50, and RC60. The load–slip curves for the joints show similar trends under different RAC strengths. However, the shear capacity of the joints increases non-linearly with the increase in RAC strength. When the RAC strength increased from RC30 to RC40, RC50, and RC60, the shear capacity of the joints increased by 13%, 17%, and 19%, respectively. As seen in Figure 21b, there is a significant increase in shear capacity when the RAC strength increases from RC30 to RC40, but the change in shear capacity is minimal when the strength increases from RC40 to RC60. This phenomenon is attributed to the interaction between the studs and the surrounding concrete in the joint region. When the concrete strength is relatively low, damage occurs in both the studs and the concrete simultaneously. However, as the concrete strength increases, failure tends to be dominated by stud–shear fracture, making the influence of concrete strength on the shear capacity of the joint progressively less significant.
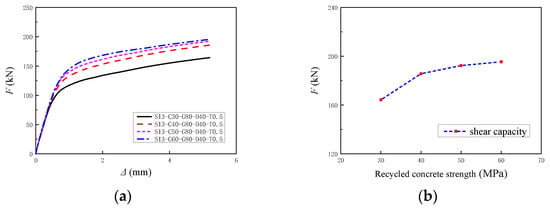
Figure 21.
Influence of the RAC strength on the shear capacity of joints: (a) Load–slip curves; (b) Shear capacity analysis.
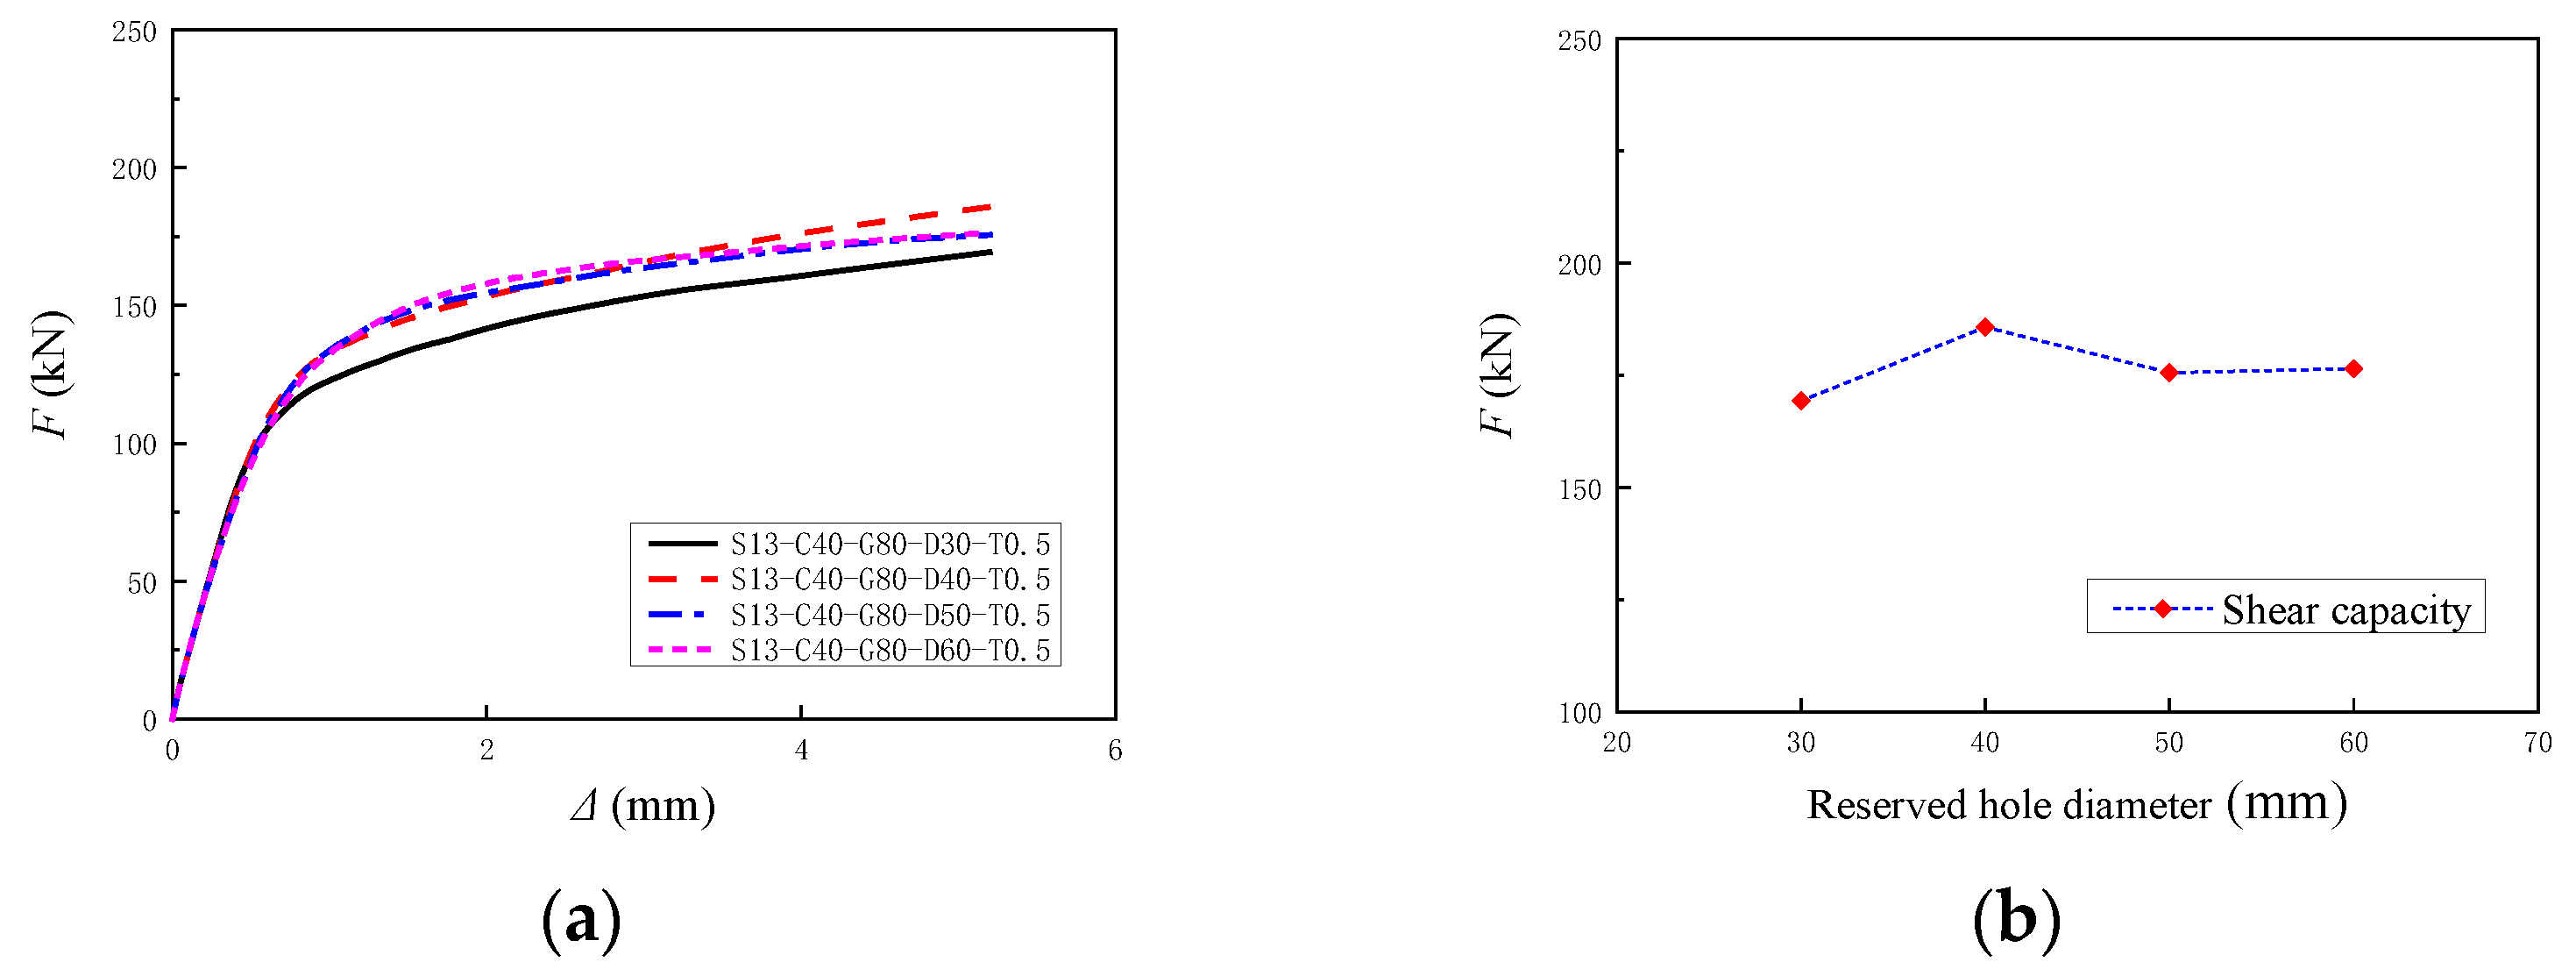
4.6.3. Reserved Hole Diameter
Figure 22 illustrates the FE simulation results of the shear capacity of joints with reserved hole diameters of 30 mm, 40 mm, 50 mm, and 60 mm. The load–slip curves for the joints show consistent trends across different reserved hole diameters. When the reserved hole diameter increased from 30 mm to 40 mm, the shear capacity of the studs increased by 10%. However, further increases in diameter to 60 mm resulted in an initial decrease in shear capacity followed by stabilization with no significant change. Smaller reserved hole diameters effectively constrain the grout. As the diameter of the reserved hole continues to increase, the reinforced concrete slab at the joint is significantly weakened, reducing the constraint and cooperative force capacity of the joint area and thereby lowering the overall shear capacity of the specimen. Therefore, in practical engineering applications, overly large reserved holes are not recommended, as they reduce the joint’s load-bearing capacity and increase the amount of post-pour grout needed.
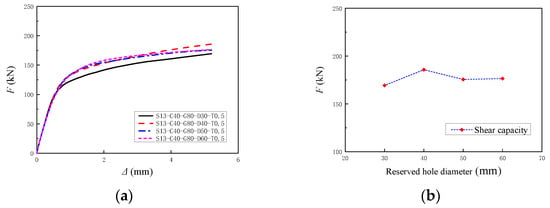
Figure 22.
Influence of the reserved hole diameter on the shear capacity of joints: (a) Load–slip curves; (b) Shear capacity analysis.
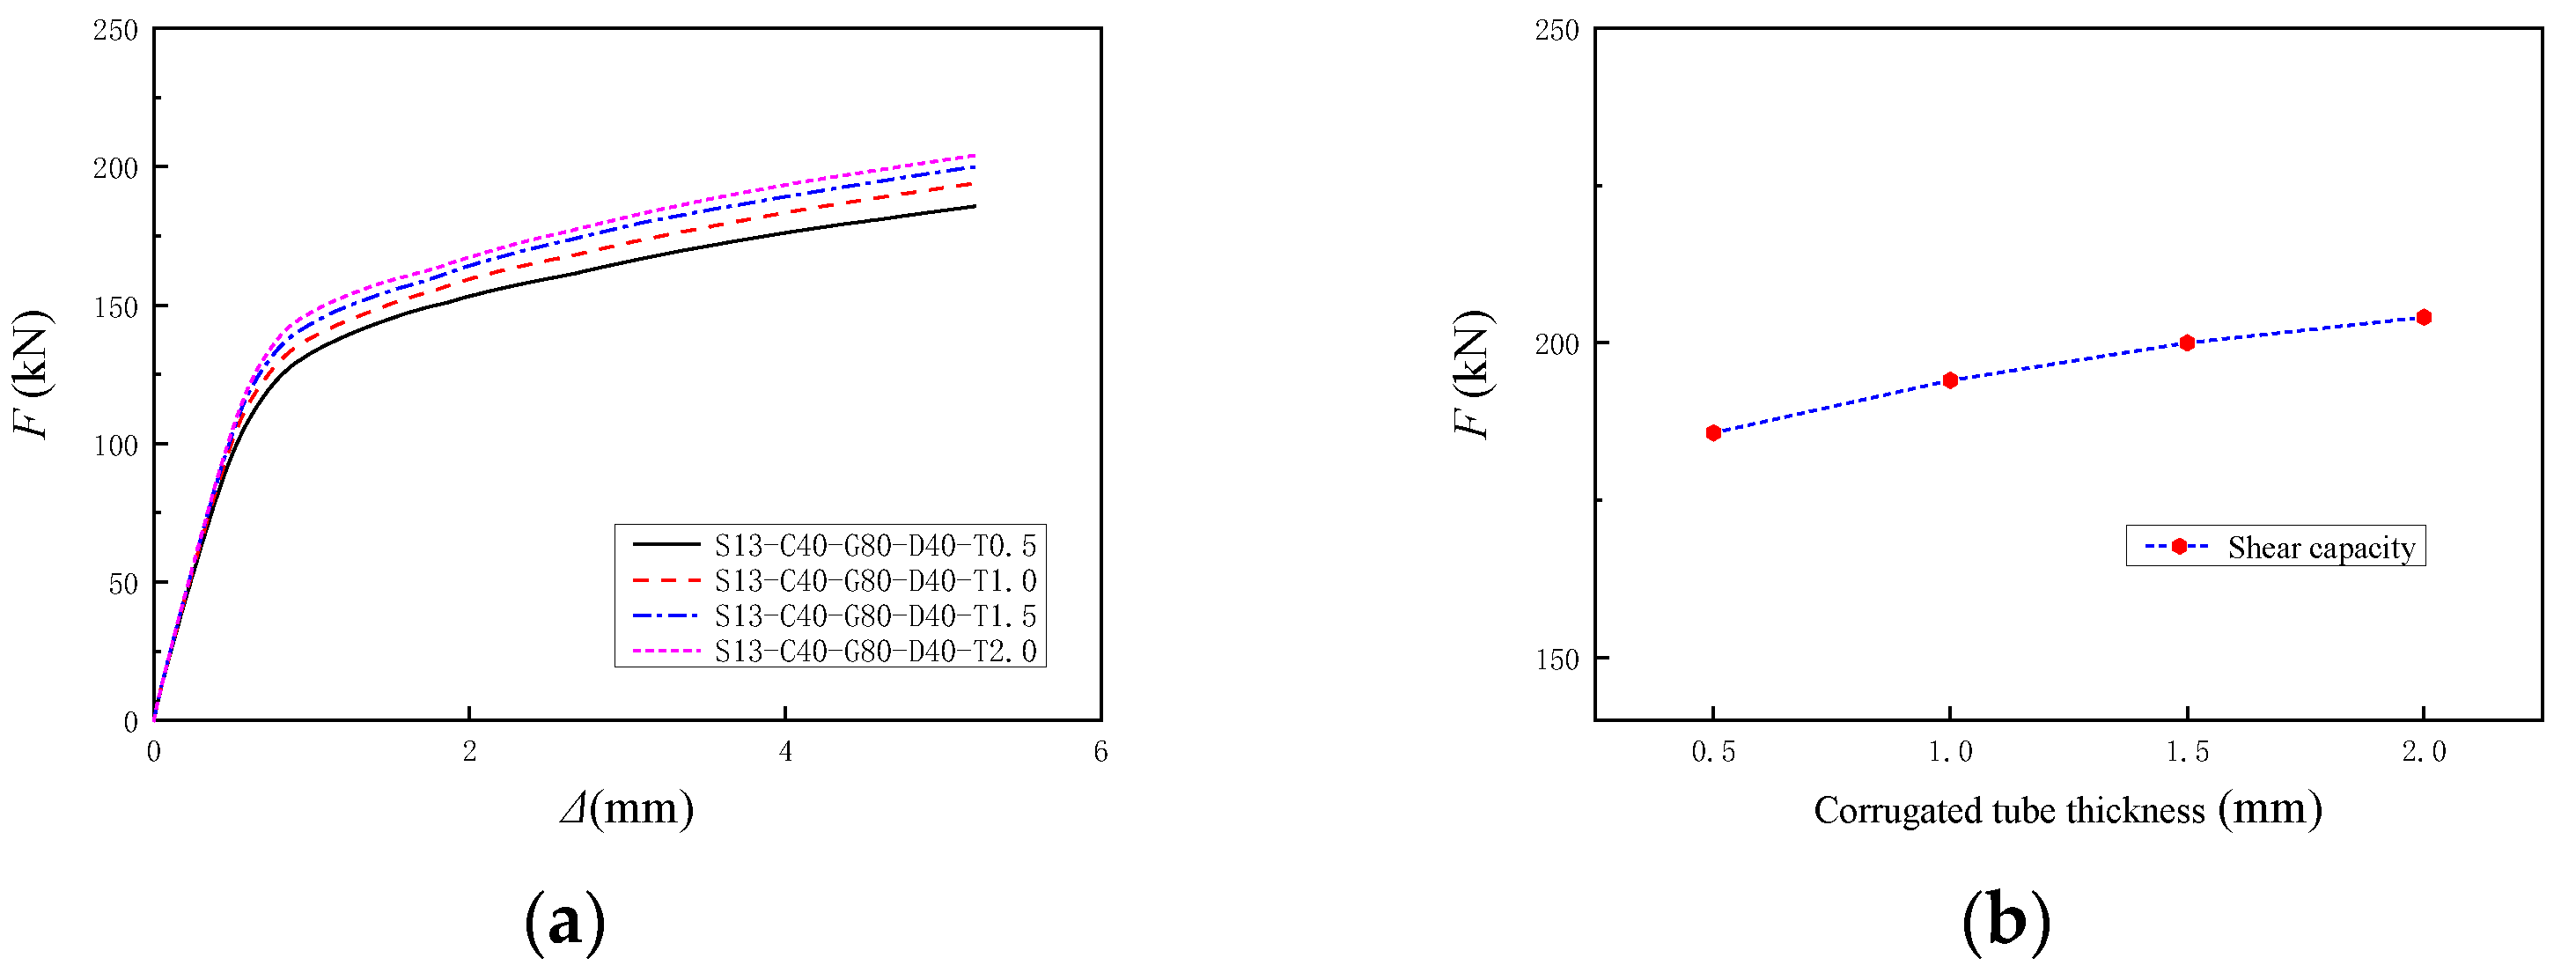
4.6.4. Corrugated Tube Thickness
Figure 23 illustrates the FE simulation results of the shear capacity of joints with corrugated tube thicknesses of 0.5 mm, 1.0 mm, 1.5 mm, and 2.0 mm. The load–slip behavior of stud connectors exhibited consistent trends across varying corrugated tube wall thicknesses. Shear capacity demonstrated near-linear growth with increasing tube thickness from 0.5 mm to 2.0 mm. Compared with the baseline 0.5 mm condition, increasing the tube thickness to 1.0 mm, 1.5 mm, and 2.0 mm yielded shear capacity improvements of 4.5%, 7.7%, and 9.6%, respectively. This strength improvement stems from enhanced synergistic interaction among the high-strength grout, studs, and corrugated tube. Thicker tube walls facilitate more effective confinement from the grout, collectively forming a higher-performance shear connection system that elevates joint capacity.

Figure 23.
Influence of corrugated tube thickness on the shear capacity of joints: (a) Load–slip curves; (b) Shear capacity analysis.
5. Conclusions
To study the shear performance of RSP joints of light steel composite floors, push-out tests were conducted on twelve joint specimens. The effects of various parameters such as joint construction, stud diameter, RAC strength, grout strength, and reserved hole diameter on the shear performance of the composite floor joints were investigated. A detailed FEM was established for parameter analysis. The main conclusions are as follows:
- (1)
- Based on the failure phenomena of the specimens, all specimens exhibited stud shear failure accompanied by varying degrees of cracking in the concrete slab. The shear pocket joint of the prefabricated steel–recycled concrete composite floor specimens caused concrete cracks to develop along the reserved hole position. The connection between the RAC slab and the stud connector using RSP joints is reliable and feasible for practical engineering applications.
- (2)
- For specimens with RSP joints, increasing the stud diameter, RAC strength, and grout strength improves the shear capacity and shear stiffness of the joints. The stud diameter is the main factor affecting the shear capacity of the joints. The shear capacity of joints with 19 mm diameter studs was 52% higher than that of nodes with 13 mm diameter studs. Increasing the diameter of the reserved holes reduces the shear capacity and stiffness of the joints.
- (3)
- A detailed FEM was established based on the experimental results. The load–slip curves obtained from the simulations matched well with the experimental results, with the relative error in ultimate shear capacity within 10%. This model can serve as a reference for modeling similar joints.
- (4)
- Further parametric analysis of stud diameter, RAC strength, and reserved hole diameter was conducted. The study shows that the diameter of the studs significantly affects the shear capacity of the joints. The shear capacity of joints with 22 mm diameter studs increased by 63% compared to those with 13 mm diameter studs. Increasing the RAC strength also improves the shear capacity of the joints, but the improvement tends to stabilize at higher strengths. An appropriate reserved hole diameter enhances the shear performance of the joints, with the best performance observed for a reserved hole diameter of 40 mm.
Author Contributions
J.B.: Writing—review & editing, Supervision, Funding acquisition. J.Z.: Writing—original draft, Investigation. L.Z.: Methodology, Visualization. W.G.: Investigation, Software. W.C.: Writing—review & editing, Conceptualization. All authors have read and agreed to the published version of the manuscript.
Funding
The Tianjin Municipal Enterprise Technology Commissioner Project (No. 23YDTPJC00790) and the Tianjin Natural Science Foundation (No. 22JCQNJC00680) are acknowledged.
Data Availability Statement
The original contributions presented in the study are included in the article, further inquiries can be directed to the corresponding author.
Conflicts of Interest
Author Lidong Zhao was employed by the company China Construction Eighth Engineering Division Co., Ltd. The remaining authors declare that the research was conducted in the absence of any commercial or financial relationships that could be construed as a potential conflict of interest.
References
- Wu, M.; Wu, G. An Analysis of Rural Households’ Earthquake-Resistant Construction Behavior: Evidence from Pingliang and Yuxi, China. Int. J. Environ. Res. Public Health 2020, 17, 9079. [Google Scholar] [CrossRef] [PubMed]
- Bian, J.; Cao, W.; Qiao, Q.; Zhang, J. Experimental and numerical studies of prefabricated structures using CFST frame and composite wall. J. Build. Eng. 2022, 48, 103886. [Google Scholar] [CrossRef]
- Bian, J.; Cao, W.; Zhang, Z.; Qiao, Q. Cyclic loading tests of thin-walled square steel tube beam-column joint with different joint details. Structures 2020, 25, 386–397. [Google Scholar] [CrossRef]
- Porter, M.; Ekberg, C. Compendium of ISU Research Conducted on Cold-Formed Steel-Deck-Reinforced Slab Systems; Iowa State University Engineering Research Institute: Ames, IA, USA, 1978; Available online: https://trid.trb.org/view/141796 (accessed on 20 April 2025).
- Daniels, B.J.; Crisinel, M. Composite slab behavior and strength analysis. Part II: Comparisons with test results and parametric analysis. J. Struct. Eng. 1993, 119, 36–49. [Google Scholar] [CrossRef]
- Tenhovuori, A.I.; Leskela, M.V. Longitudinal shear resistance of composite slabs. J. Constr. Steel Res. 1998, 46, 228. [Google Scholar] [CrossRef]
- Marciukaitis, G.; Jonaitis, B.; Valivonis, J. Analysis of deflections of composite slabs with profiled sheeting up to the ultimate moment. J. Constr. Steel Res. 2006, 62, 820–830. [Google Scholar] [CrossRef]
- Morcous, G.; Tawadrous, R. Circular Shear Pocket Connection for Full-Depth Precast Concrete Deck Construction. J. Bridge Eng. 2021, 26, 04021019. [Google Scholar] [CrossRef]
- Hassanieh, A.; Valipour, H.R.; Bradford, M.A. Bolt shear connectors in grout pockets: Finite element modelling and parametric study. Constr. Build. Mater. 2018, 176, 179–192. [Google Scholar] [CrossRef]
- Wang, S.; Fang, Z.; Chen, G.; Jiang, H.; Teng, S. Numerical Analysis on Shear Behavior of Grouped Head Stud Shear Connectors between Steel Girders and Precast Concrete Slabs with High-Strength Concrete-Filled Shear Pockets. J. Bridge Eng. 2021, 26, 04021030. [Google Scholar] [CrossRef]
- Tawadrous, R.; Morcous, G. Design of shear pocket connection in full-depth precast concrete deck systems. Eng. Struct. 2019, 179, 367–386. [Google Scholar] [CrossRef]
- Zhao, Y.; Yuan, Y.; Wang, C.-L.; Zheng, J.; Zhou, Y. Experimental study on shear performance of steel-timber screw connectors with grout pockets. Eng. Struct. 2022, 266, 114535. [Google Scholar] [CrossRef]
- El-Khier, M.A.; Morcous, G. Precast concrete deck-to-girder connection using Ultra-High Performance Concrete (UHPC) shear pockets. Eng. Struct. 2021, 248, 113082. [Google Scholar] [CrossRef]
- Hu, Y.; Meloni, M.; Cheng, Z.; Wang, J.; Xiu, H. Flexural performance of steel-UHPC composite beams with shear pockets. Structures 2020, 27, 570–582. [Google Scholar] [CrossRef]
- Shim, C.S.; Chang, S.P. Cracking of continuous composite beams with precast decks. J. Constr. Steel Res. 2003, 59, 201–214. [Google Scholar] [CrossRef]
- Shim, C.S.; Lee, P.G.; Chang, S.P. Design of shear connection in composite steel and concrete bridges with precast decks. J. Constr. Steel Res. 2001, 57, 203–219. [Google Scholar] [CrossRef]
- Francesconi, L.; Pani, L.; Stochino, F. Punching shear strength of reinforced recycled concrete slabs. Constr. Build. Mater. 2016, 127, 248–263. [Google Scholar] [CrossRef]
- Kang, T.H.-K.; Kim, W.; Kwak, Y.-K.; Hong, S.-G. Flexural Testing of Reinforced Concrete Beams with Recycled Concrete Aggregates. Aci Struct. J. 2014, 111, 607–616. [Google Scholar] [CrossRef]
- Knaack, A.M.; Kurama, Y.C. Behavior of Reinforced Concrete Beams with Recycled Concrete Coarse Aggregates. J. Struct. Eng. 2015, 141, B4014009. [Google Scholar] [CrossRef]
- Dong, H.; Li, Y.; Cao, W.; Guo, Y. Seismic behavior of full-scale steel reinforced recycled concrete columns under high axial compression ratio. Structures 2021, 29, 1882–1897. [Google Scholar] [CrossRef]
- Zhang, J.; Dong, H.; Cao, W.; Yu, C.; Chi, Y. Shaking Table Tests of Low-Rise Shear Walls Made of Recycled Aggregate Concrete. Struct. Eng. Int. 2016, 26, 62–73. [Google Scholar] [CrossRef]
- Zhang, J.; Cao, W.; Meng, S.; Yu, C.; Dong, H. Shaking table experimental study of recycled concrete frame-shear wall structures. Earthq. Eng. Eng. Vib. 2014, 13, 257–267. [Google Scholar] [CrossRef]
- Iverson, J.K.; Hawkins, N.M. Performance of Precast/Prestressed Concrete Building Structures During Northridge Earthquake. PCI J. 1994, 39, 38–55. [Google Scholar] [CrossRef]
- EN 1994-1-1:2004; Eurocode 4 Design of Composite Steel and Concrete Structures, Part 1.1: General Rules and for Buildings. European Committee for Standardization (CEN): Brussels, Belgium, 2004.
- GB/T 50081-2002; Standard for Test Method of Mechanical Properties of Ordinary Concrete. China Architecture Publishing & Media Co., Ltd.: Beijing, China, 2002.
- GB/T 228.1-2021; Metallic Materials—Tensile Testing—Part 1: Method of Test at Room Temperature. Standards Press of China: Beijing, China, 2021.
- Xiao, J.Z.; Li, J.B.; Zhang, C. Mechanical properties of recycled aggregate concrete under uniaxial loading. Cem. Concr. Res. 2005, 35, 1187–1194. [Google Scholar] [CrossRef]
- Zhou, C.; Chen, Z. Mechanical properties of recycled concrete made with different types of coarse aggregate. Constr. Build. Mater. 2017, 134, 497–506. [Google Scholar] [CrossRef]
- Xiao, J. Recycled Concrete; China Architecture Publishing & Media Co., Ltd.: Beijing, China, 2008. [Google Scholar]
- Hu, H.; Qi, L.; Chao, X. Physics-informed Neural Networks (PINN) for computational solid mechanics: Numerical frameworks and applications. Thin-Walled Struct. 2024, 205, 112495. [Google Scholar] [CrossRef]
- Niu, Y.; Wang, W.; Su, Y.; Jia, F.; Long, X. Plastic damage prediction of concrete under compression based on deep learning. Acta Mech. 2023, 235, 255–266. [Google Scholar] [CrossRef]
- Long, X.; Mao, M.-H.; Su, T.-X.; Su, Y.-T.; Tian, M.-K. Machine learning method to predict dynamic compressive response of concrete-like material at high strain rates. Def. Technol. 2023, 23, 100–111. [Google Scholar] [CrossRef]


Disclaimer/Publisher’s Note: The statements, opinions and data contained in all publications are solely those of the individual author(s) and contributor(s) and not of MDPI and/or the editor(s). MDPI and/or the editor(s) disclaim responsibility for any injury to people or property resulting from any ideas, methods, instructions or products referred to in the content. |
© 2025 by the authors. Licensee MDPI, Basel, Switzerland. This article is an open access article distributed under the terms and conditions of the Creative Commons Attribution (CC BY) license (https://creativecommons.org/licenses/by/4.0/).