
Structural Equation Modeling for Analyzing Innovation Adoption in Residential Condominium Projects


Abstract
1. Introduction
2. Literature Review
2.1. Innovation in the Real Estate Industry
2.2. Concepts Related to Innovation Adoption
2.2.1. Characteristics of Innovations and Types of Innovation Adopters
2.2.2. Technology Readiness (TR)
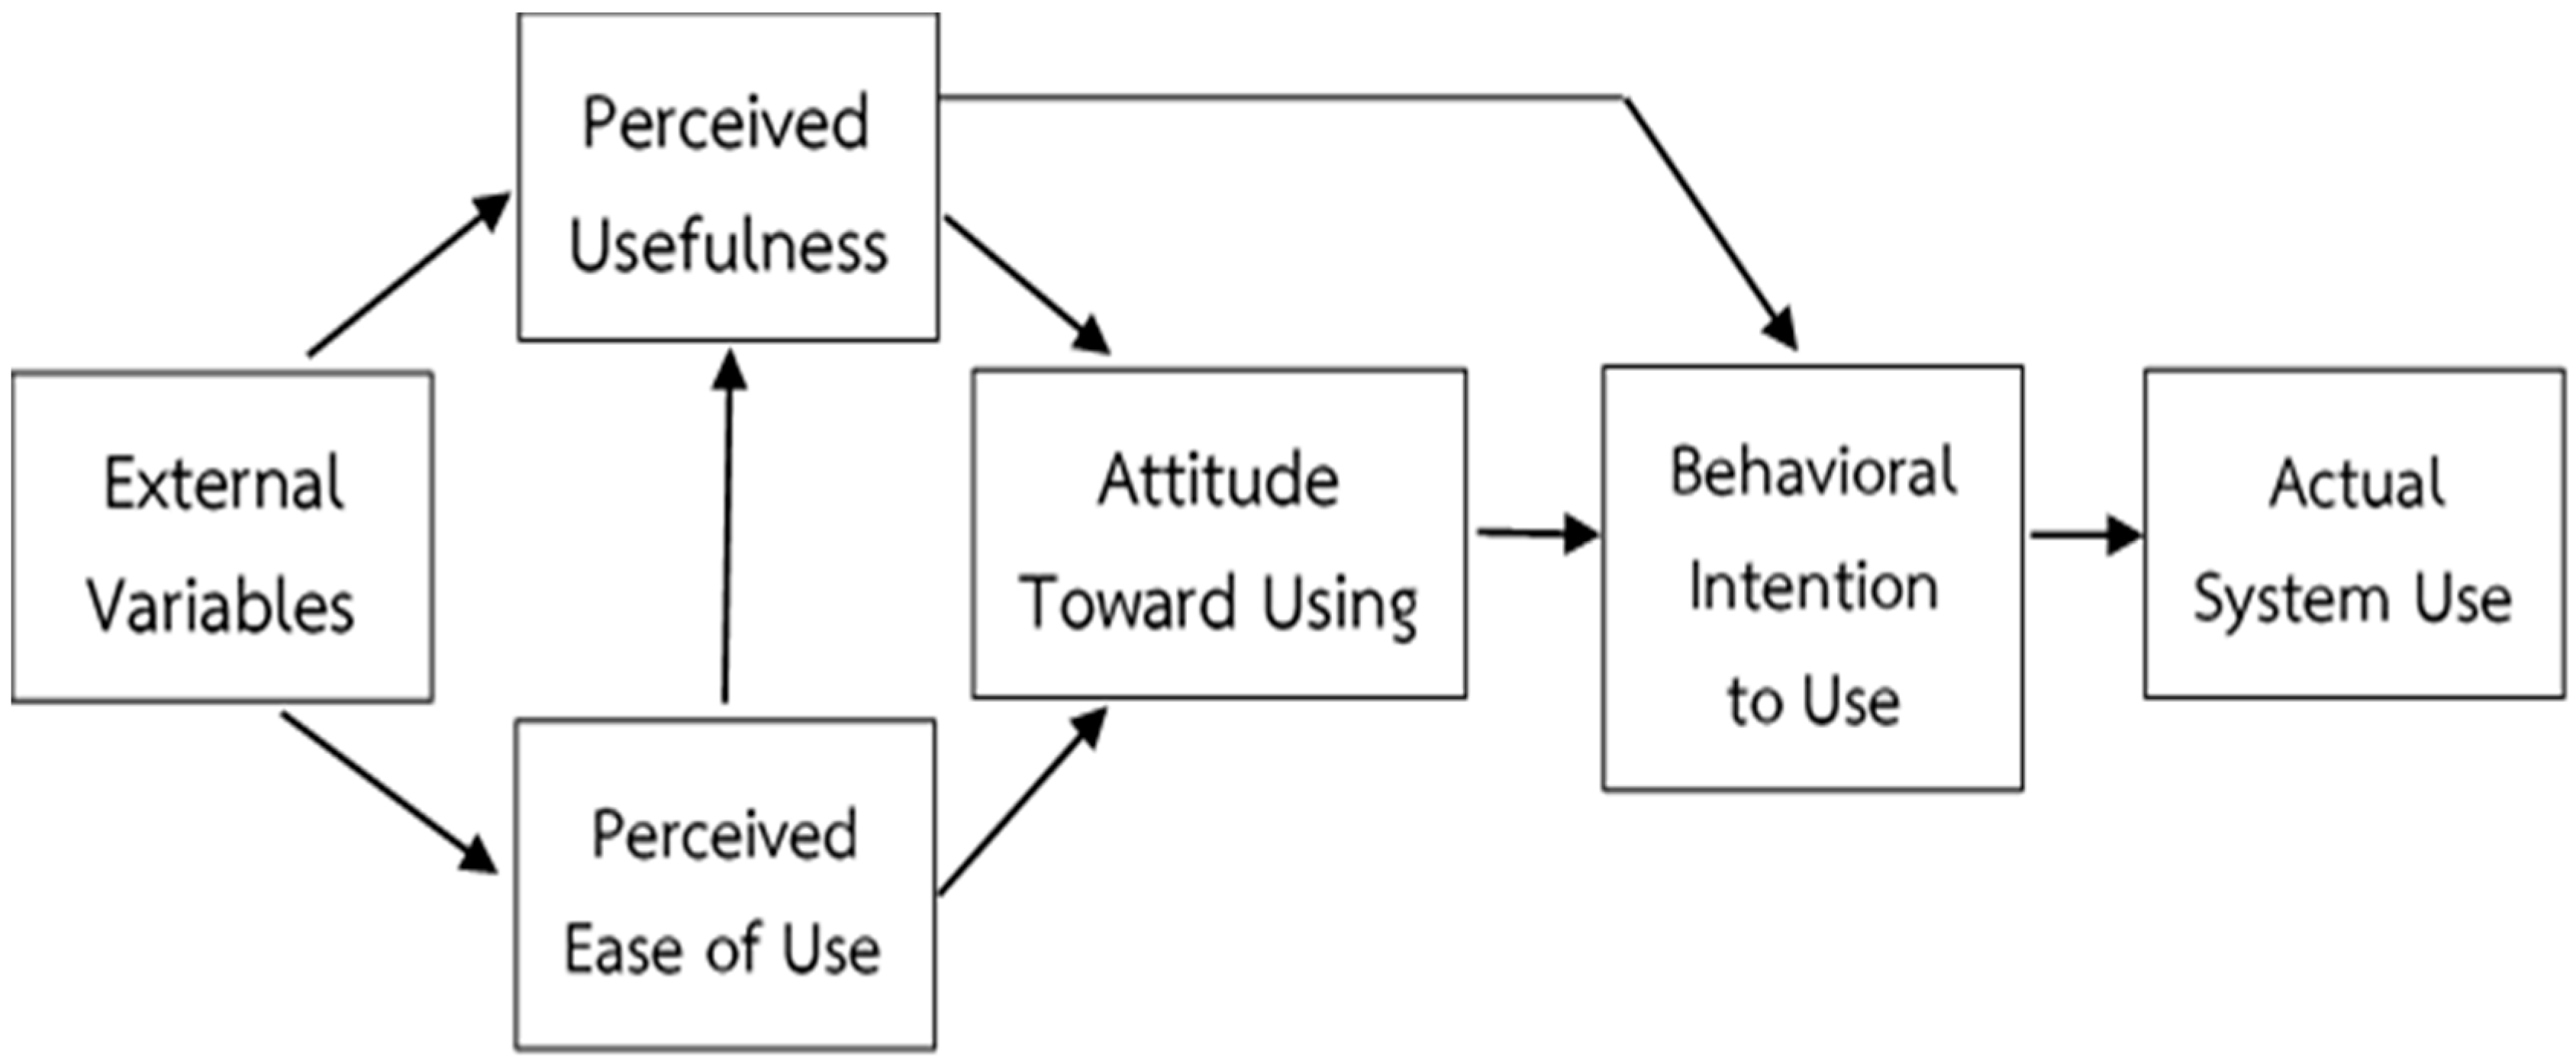
2.2.3. Technology Acceptance Model (TAM)
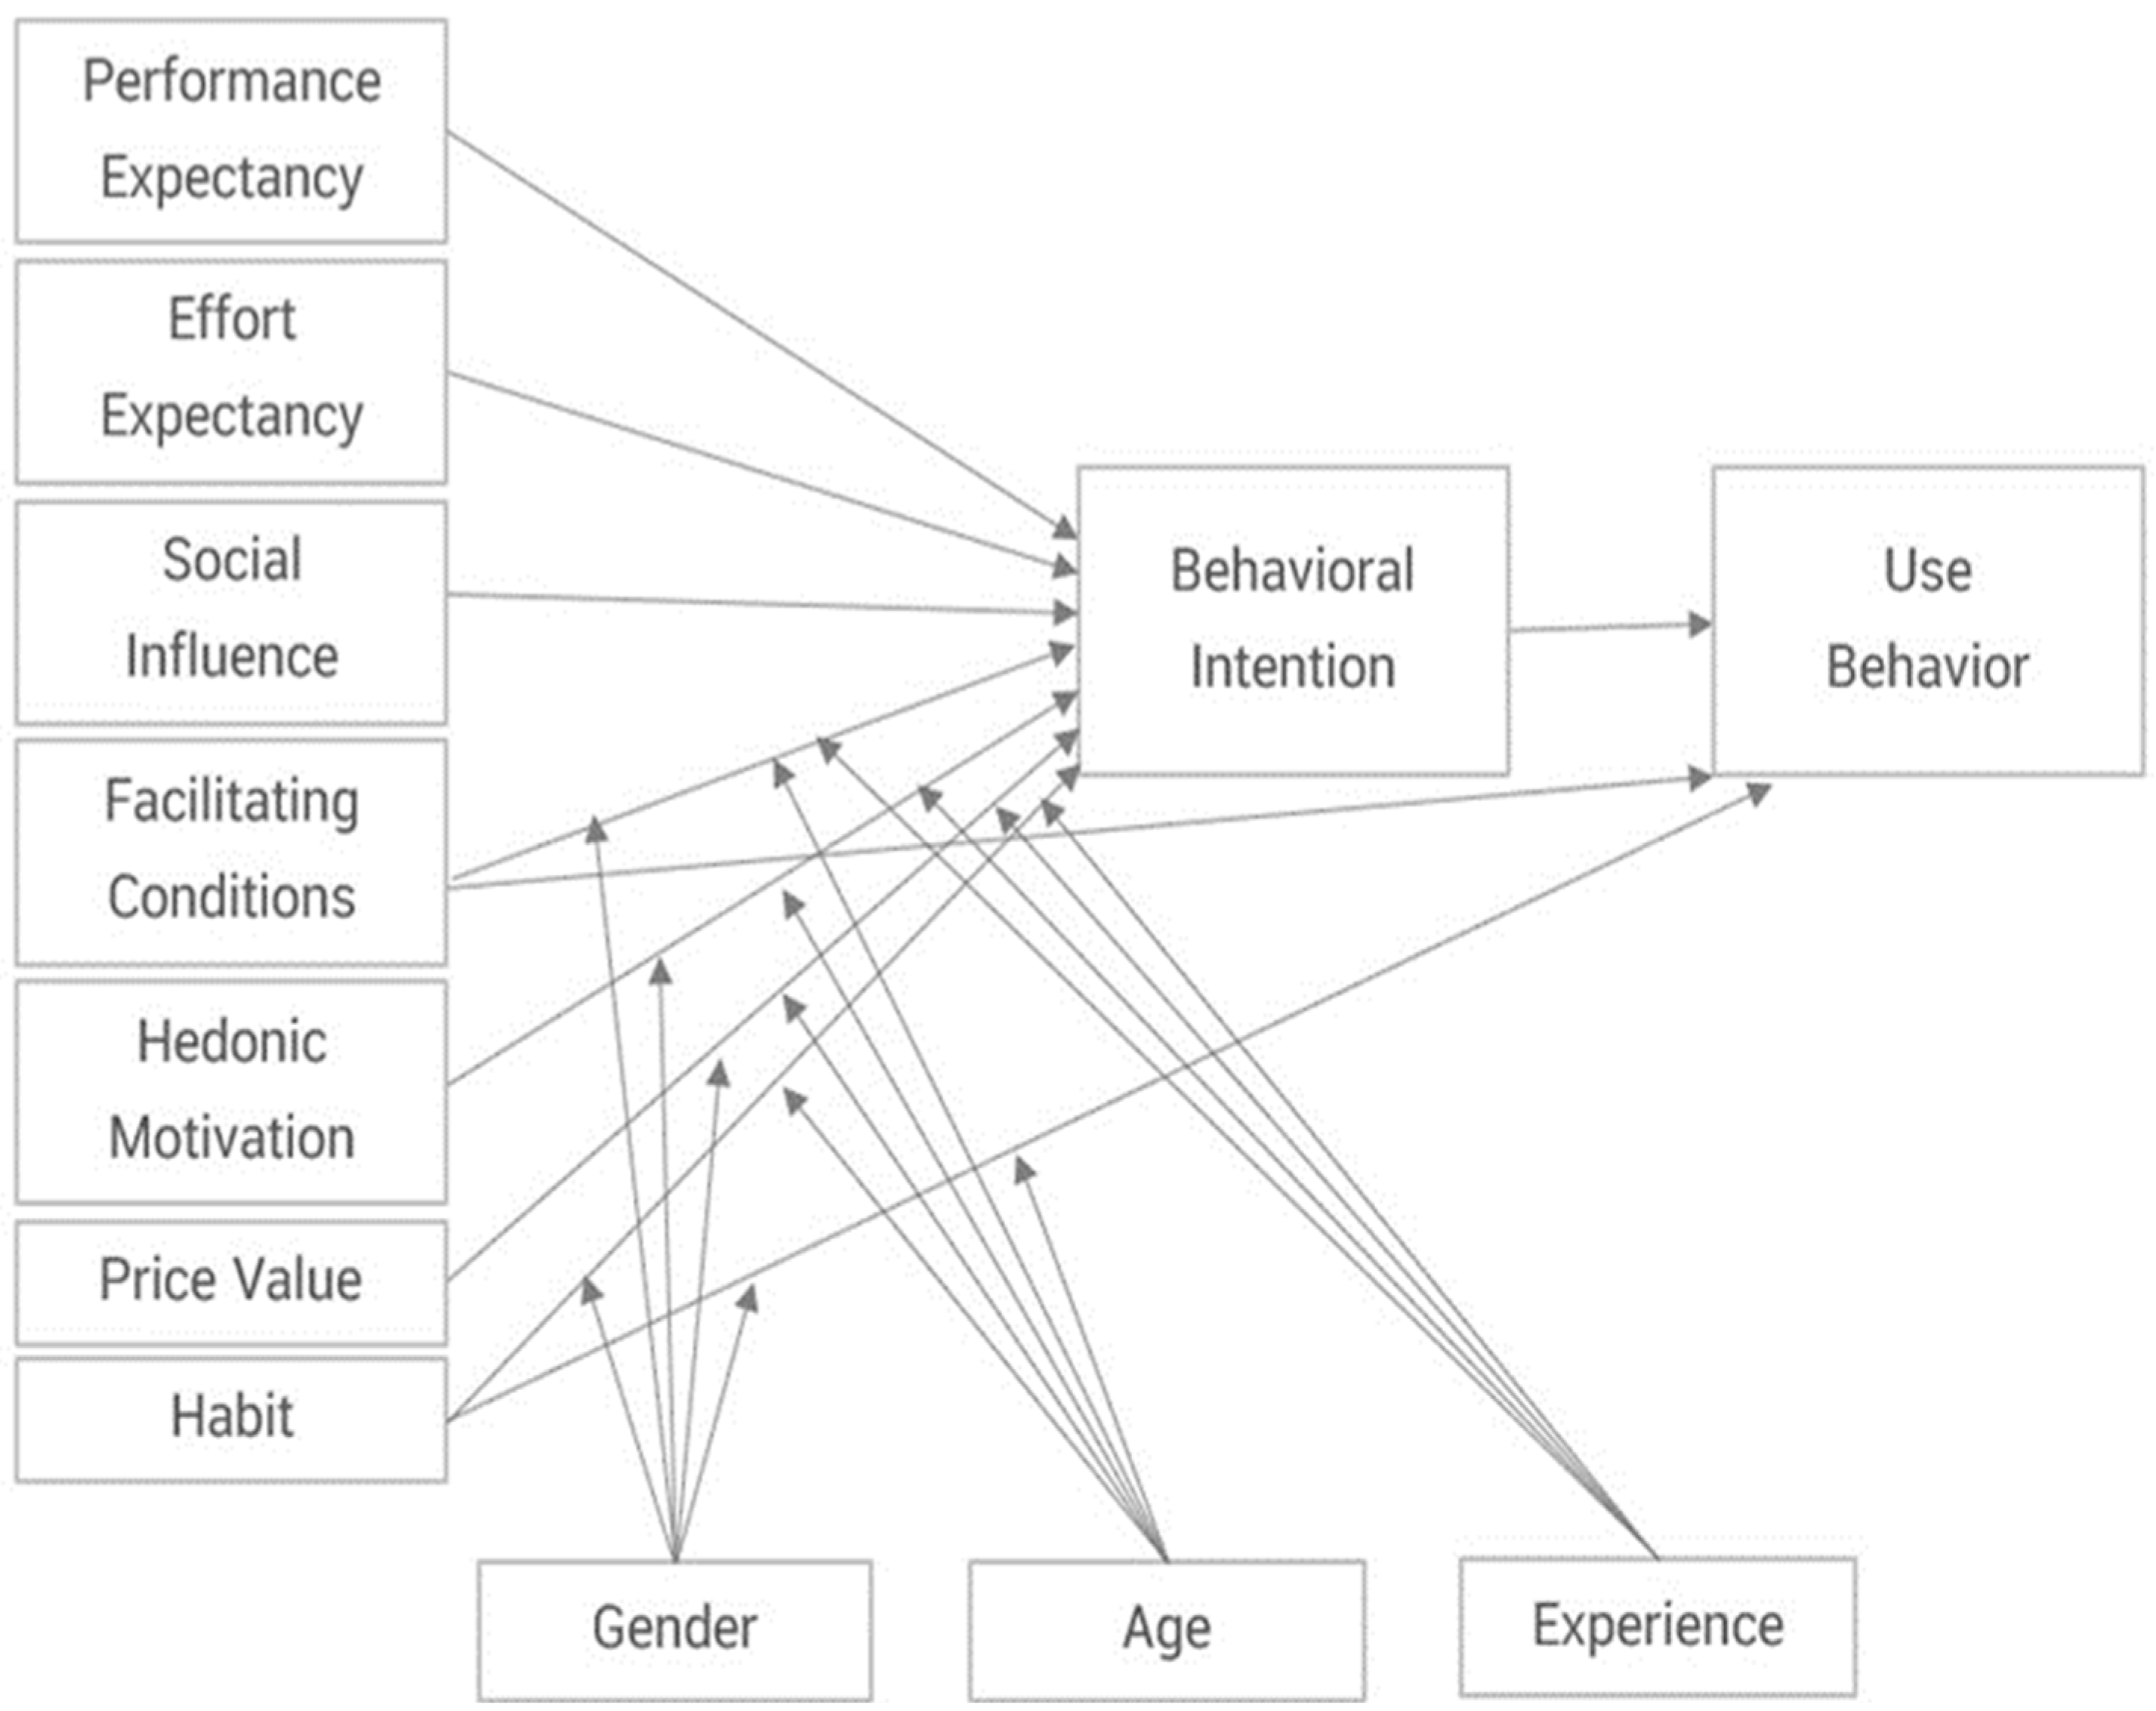
2.2.4. Unified Theory of Acceptance and Use of Technology (UTAUT)
3. Research Variable Framework

| Construct (Latent Variable) | Observed Variable | ||||
|---|---|---|---|---|---|
| Variable | Description | Supporting Research | Variable | Description | Supporting Research |
| CATEGORY (Desired Innovation Attributes) | The demand for products that create new value or that offer improvements over traditional methods to better meet contemporary living needs enhances the quality of life in various aspects such as convenience, economic efficiency, safety, and health care, as well as energy management and environmental sustainability. | [61,62] | SAFETY | Occupational Health and Safety | [67] |
| DIGITAL | Digital and Intelligent Systems | [68] | |||
| ENERGY | Energy Management | [69] | |||
| MATERIAL | Materials and Construction | [70] | |||
| CHARACTER (Characteristics of Innovation Adopters) | Attitudes toward new innovations in terms of intended usage, readiness to adapt, and opportunities for application in work and daily life, as well as the perceived value of the innovation in alignment with personal experience and user needs—reflected through the awareness of usage procedures and perceived ease or difficulty of implementation. | [63,64] | ATTITUDE | Attitude Toward New Innovation | [71] |
| KNOW | Perceived Ease of Use | [72] | |||
| FACTOR | Other Factors Influencing the Adoption Decision: Advantage, Effectiveness, Freedom to Select, Problem Solving, Experience, Previous Desire to Use, and Security | [73] | |||
| TRUST (Trust in Developers) | Attitudes toward the image of leaders and personnel as real estate developers reflect the organization’s brand and its past performance resulting from management practices, as well as the consistent presentation of products that convey the organization’s culture of innovation to consumers. | [61,65,66] | PRODUCT | Organization’s Products | [5] |
| OPERATE | Organizational Operations | [74] | |||
| BRAND | Corporate Brand | [75,76] | |||
| ADOPTION (Innovation Adoption) | The process begins with the recognition of new ideas and approaches that lead to innovation, followed by an interest in innovation through information seeking, and it continues with an evaluation of its value and appropriateness for specific contexts. This process ultimately leads to trial use and the decision to adopt the innovation. | [35,47,60] (Dependent variable) | INTEREST | Stages of Expressing Interest and Information Gathering | [72] |
| EVALUATE | Analysis and Evaluation Process | [40] | |||
| TRIAL | Experimentation and Decision-Making Process | [35,71] | |||
4. Research Methodology
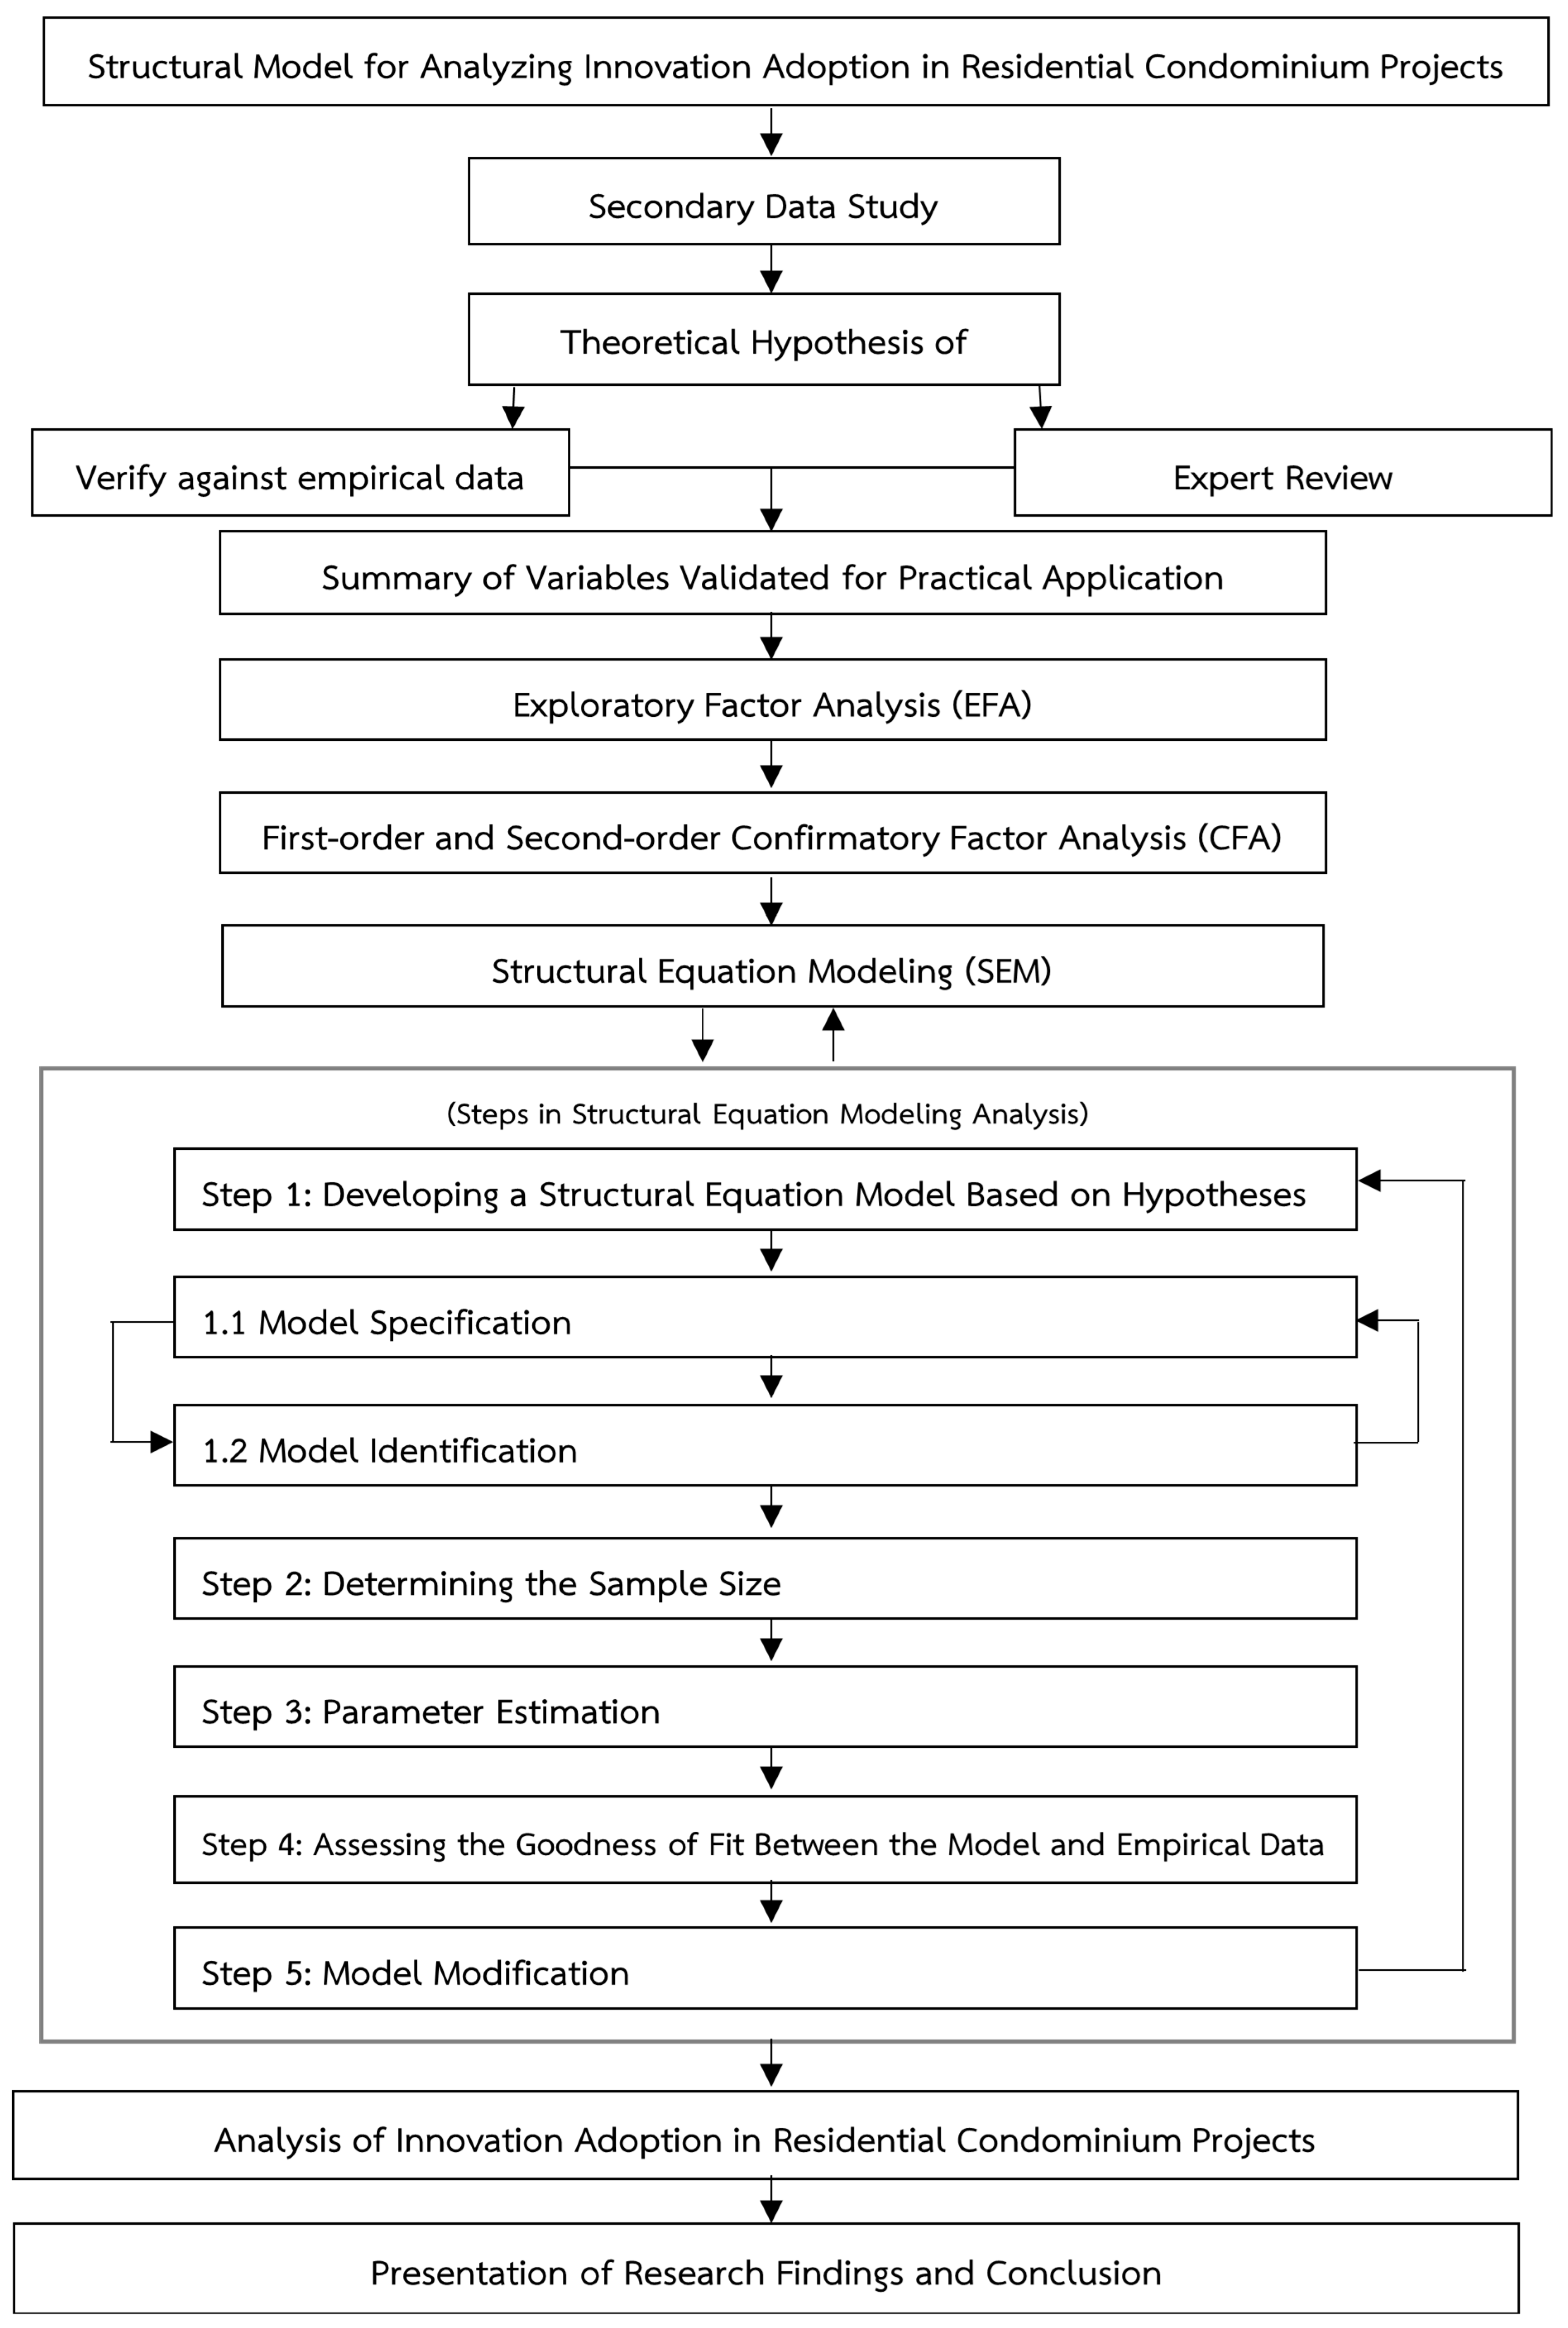
4.1. Research Process
4.2. Study Population and Sample
4.3. Research Tool
5. Research Findings
5.1. Demographic Data of the Respondents
5.1.1. Specification of Observed Variables
5.1.2. Model Fit Assessment of the Measurement Model with Empirical Data
5.2. Results of the Structural Model Analysis
5.2.1. Descriptive Statistics of the Observed Variables
5.2.2. Analysis of the Relationship Between the Structural Equation Model and the Influence of Variables on Innovation Adoption in Residential Condominium Buildings
6. Discussion and Conclusions
Author Contributions
Funding
Data Availability Statement
Conflicts of Interest
Appendix A
| Component Group | Questionnaire Items/Observed Variables |
|---|---|
| 1. Attitude toward new innovations Code (ATTITUDE) MEAN (3.793) SD (0.676) | (BEHA1) You are willing to accept the risks associated with the adoption of new innovations data (BEHA2) You are proficient in using technology and confident in its application. (BEHA3) You are not afraid of change and consistently maintain a positive attitude toward new innovations. (BEHA4) The innovation you choose must be modern and appropriate for the current circumstances. (BEHA5) You work in a profession related to the use of technology and innovation. (BEHA6) You feel proud when using innovative products. (BEHA7) You believe that a good innovation should be accessible to people of diverse genders and ages. (BEHA8) The innovation you choose must be compatible with other innovations. (BEHA9) You prioritize convenience in daily life. |
| 2. Perceived ease of use Code (KNOW) MEAN (4.209) SD (0.532) | (BEHA10) You accept innovations that do not involve complicated devices. (BEHA11) You accept innovations that do not require advanced skills to use. (BEHA12) You accept new innovations that are easier to use compared to previous innovations. (BEHA13) You choose innovations based on a thorough understanding of how they function. |
| 3. Factors in the selection of use Code (FACTOR) MEAN (4.036) SD (0.581) | (BEHA14) You prioritize the benefits of an innovation in your consideration. (BEHA15) You base your consideration on the effectiveness of the innovation. (BEHA16) You have the freedom to decide on the selection of innovative products. (BEHA17) You believe that new innovations should be able to solve the problems associated with using previous innovations. (BEHA18) If you have previously used or experimented with similar innovations, you will find it easier to decide to adopt them. (BEHA19) You decide to adopt the innovation based on your previous desire to use it. (BEHA20) The sense of security in using the innovation influences your decision-making. |
| Component Group | Questionnaire Items/Observed Variables |
|---|---|
| 1. Innovation in Safety and Health Code (SAFETY) MEAN (4.406) SD (0.526) | (TYPE1) Fire Detection and Alarm System (TYPE2) Closed-Circuit Television (CCTV) (TYPE3) Personal Screening Systems, e.g., Face Scan (TYPE4) Digital Smart Lock System (TYPE5) Motion Detection System for Theft Prevention (TYPE6) Touchless Devices for Disease Prevention (TYPE7) Modern Life-Saving Devices for Emergency First Aid (TYPE8) Air Circulation and Dust Prevention System (TYPE9) Devices with Gripping Mechanisms and Shock-Absorbent Flooring (TYPE10) Universal Design Innovation (TYPE11) Innovations to Reduce Pollution |
| 2. Digital Innovation and Smart Systems Code (DIGITAL) MEAN (3.644) SD (0.758) | (TYPE12) IoT Innovation (Internet of Things) (TYPE13) Artificial Intelligence (AI) Innovation (TYPE14) Smart Home Innovation (Home Automation) (TYPE15) Automated Parking Services (Auto Parking) (TYPE16) Smart Locker with Smartphone Integration (TYPE17) Electric Vehicle Charging Station (EV Charger) (TYPE18) Virtual Reality Technology |
| 3. Innovation in Energy Management Code (ENERGY) MEAN (3.793) SD (0.762) | (TYPE19) Water Recycling System in Projects (TYPE20) Energy-Saving Devices to Reduce Electricity Costs (TYPE21) Innovations to Reduce Heat Gain in Buildings, e.g., Walls, Glass (TYPE22) Solar Power System (Solar Cell) |
| 4. Innovation in Materials and Construction Code (MATERIAL), MEAN (3.890), SD (0.736) | (TYPE23) Construction Materials Mimicking Nature (TYPE24) Prefabricated Construction System (Prefabs) (TYPE25) Robotic Construction Innovation |
| Component Group | Questionnaire Items/Observed Variables |
|---|---|
| 1. Organization’s Products Code (PRODUCT) MEAN (3.899) SD (0.650) | (CORP1) The organization’s products excel in research and innovation. (CORP2) The organization’s previous products have consistently gained good customer acceptance. (CORP3) The organization adds value to its new products. (CORP4) The organization’s products are designed to continuously address customer problems. (CORP5) The organization’s products provide a unique alternative that differentiates them from competitors. (CORP6) Most of the organization’s products stand out from competitors in the industry. |
| 2. Organization’s Operations Code (OPERATE) MEAN (4.114) SD (0.570) | (CORP7) The organization has efficient marketing and management practices. (CORP8) The organization has consistently performed well in terms of business outcomes. (CORP9) The effectiveness of the organization’s management. (CORP10) The effectiveness of the organization’s employees. (CORP11) Innovation policies that reflect the organization’s operational methods. (CORP12) The organizational culture reflects a focus on innovation learning. (CORP13) Collaboration with other organizations, such as foreign entities. |
| 3. Corporate Brand Code (BRAND) MEAN (4.019) SD (0.636) | (CORP14) The brand’s credibility. (CORP15) The organization’s social image. (CORP16) The organization’s environmental image. |
| Component Group | Questionnaire Items/Observed Variables |
|---|---|
| 1. Interest and Information Search Code (INTEREST) MEAN (3.559) SD (0.740) | (PROC1) You enjoy trying new things. (PROC2) You are interested in thinking methods that lead to innovation. (PROC3) You are always interested in keeping up with news related to innovation. (PROC4) When an innovation emerges, you know where to search for information about it. (PROC5) Before deciding to choose an innovation, you always research and understand it first. (PROC6) You are interested in discussing with creative innovators or people who think of innovations. (PROC7) You always study the information of the company that produces the innovative product first. |
| 2. Analysis and Evaluation Stage Code (EVALUATE) MEAN (4.147) SD (0.559) | (PROC8) You analyze the pros and cons of the innovation before deciding to use it. (PROC9) You always make decisions on innovations by considering their value for money. (PROC10) You choose innovations when you clearly see their benefits and tangible outcomes. (PROC11) You use an innovation when you see more people adopting it. (PROC12) You choose innovations that are modern and suitable for the current situation. |
| 3 Experimental Stage for Decision-Making Code (TRIAL) MEAN (4.046) SD (0.615) | (PROC13) You choose innovations based on results from personally testing them. (PROC14) You choose innovations that can be physically touched and experienced. (PROC15) You choose innovations where you can clearly see how they work in practice. (PROC16) You choose innovations that you have had the opportunity to see used before or have had their benefits demonstrated to you. |
References
- Real Estate Information Center. Report on the Development Guidelines for the Composite Real Estate Market Index (Residential Category) of Thailand; Government Housing Bank: Bangkok, Thailand, 2022. [Google Scholar]
- Kim, Y.S.; Kim, J.J. A Study on Factors Affecting Demand for Housing in Innovation Cities—Focusing on Residential Satisfaction, Settlement Intention and Recommendation Intention among Housing Residents. J. Korean Hous. Assoc. 2020, 18, 285–296. [Google Scholar]
- Van Oorschot, J.A.; Halman, J.I.; Hofman, E. Getting Innovations Adopted in the Housing Sector. Constr. Innov. 2020, 20, 285–318. [Google Scholar] [CrossRef]
- Beracha, E.; He, Z.; Wintoki, M.B.; Xi, Y. On the Relation between Innovation and Housing Prices—A Metro Level Analysis of the US Market. J. Real Estate Financ. Econ. 2022, 65, 622–648. [Google Scholar] [CrossRef]
- Ahmed, N.; Qamar, S.; Jabeen, G.; Yan, Q.; Ahmad, M. Systematic Analysis of Factors Affecting Biogas Technology Acceptance: Insights from the Diffusion of Innovation. Sustain. Energy Technol. Assess. 2022, 52, 102122. [Google Scholar] [CrossRef]
- Siniak, N.; Kauko, T.; Shavrov, S.; Marina, N. The Impact of Proptech on Real Estate Industry Growth. In IOP Conference Series: Materials Science and Engineering; IOP Publishing: Bristol, UK, 2020; Volume 869, p. 062041. [Google Scholar]
- Pham, T.L.; Dau, T.K.T.; Nguyen, P.B.A. The Structural Model of Software Adoption and Organizational Performance: Innovation Acceptance Perspective. J. Knowl. Econ. 2025, 16, 1–36. [Google Scholar] [CrossRef]
- Sitek, M. Managing Innovation in the Residential Real Estate Market in Poland in the Context of Determinants and Risk of Introducing Innovation. Pol. J. Manag. Stud. 2022, 26, 271–291. [Google Scholar] [CrossRef]
- An, S.; Eck, T.; Yim, H. Understanding Consumers’ Acceptance Intention to Use Mobile Food Delivery Applications through an Extended Technology Acceptance Model. Sustainability 2023, 15, 832. [Google Scholar] [CrossRef]
- Pornthanachai, K. Dwellers’ Behavior in Using the Integrated Technology Equipment in Condominium of Sansiri Public Company Limited. Sarasatr J. Archit. Des. 2020, 3, 397–409. [Google Scholar]
- TERRA BKK. Condominium Unit Statistics in Thailand. Available online: https://urlkub.co/A3HC3H (accessed on 22 April 2025).
- Magno, F.; Cassia, F.; Ringle, C.M. A Brief Review of Partial Least Squares Structural Equation Modeling (PLS-SEM) Use in Quality Management Studies. TQM J. 2024, 36, 1242–1251. [Google Scholar] [CrossRef]
- Kuo, Y.C.; Chou, J.S.; Sun, K.S. Elucidating How Service Quality Constructs Influence Resident Satisfaction with Condominium Management. Expert Syst. Appl. 2011, 38, 5755–5763. [Google Scholar] [CrossRef]
- Hair, J.F.; Sarstedt, M.; Hopkins, L.; Kuppelwieser, V.G. Partial Least Squares Structural Equation Modeling (PLS-SEM): An Emerging Tool in Business Research. Eur. Bus. Rev. 2014, 26, 106–121. [Google Scholar] [CrossRef]
- Eker, H. Natural Language Processing Risk Assessment Application Developed for Marble Quarries. Appl. Sci. 2024, 14, 9045. [Google Scholar] [CrossRef]
- Janchomphu, W.; Pannucharoenwong, N.; Echaroj, S.; Iamtrakul, P.; Pinthurat, W. Factors Influencing Consumer Adoption of Electric Vehicles Replacements: A Case Study in Eastern Economic Corridor, Thailand. GMSARN Int. J. 2025, 19, 581–588. [Google Scholar]
- Ghafoor, A. Impact of Innovations on Consumers’ Behavior: A Case Study of Pak Electron Limited. Eur. J. Bus. Innov. Res. 2014, 2, 93–108. [Google Scholar]
- Weng, M.H.; Ha, J.L.; Wang, Y.C.; Tsai, C.L. A Study of the Relationship among Service Innovation, Customer Value and Customer Satisfaction: An Industry in Taiwan. Int. J. Organ. Innov. 2012, 4, 98–112. [Google Scholar]
- Kalıpçı, M.B. The Mediation Model of Learning Organization, Technology Acceptance and Service Innovation: Part I. Learn. Organ. 2023, 30, 777–794. [Google Scholar] [CrossRef]
- Tacsir, E. Innovation in Service: The Hard Case for Latin America and the Caribbean; Compete Caribbean; Inter-American Development Bank: New York, NY, USA, 2011. [Google Scholar]
- Amoa-Gyarteng, K.; Dhliwayo, S.; Adekomaya, V. Innovative Marketing and Sales Promotion: Catalysts or Inhibitors of SME Performance in Ghana. Cogent Bus. Manag. 2024, 11, 2353851. [Google Scholar] [CrossRef]
- Mansury, M.A.; Love, J.H. Innovation, Productivity and Growth in US Business Service: A Firm-Level Analysis. Technovation 2008, 28, 52–62. [Google Scholar] [CrossRef]
- Wang, Z.; Li, M.; Lu, J.; Cheng, X. Business Innovation Based on Artificial Intelligence and Blockchain Technology. Inf. Process. Manag. 2022, 59, 102759. [Google Scholar] [CrossRef]
- Smith, D. Exploring Innovation; McGraw-Hill Education: Berkshire, UK, 2006. [Google Scholar]
- Schilling, M.A. Strategic Management of Technological Innovation, 2nd ed.; McGraw-Hill Education: New York, NY, USA, 2008. [Google Scholar]
- Shin, J.; Kim, Y.J.; Jung, S.; Kim, C. Product and Service Innovation: Comparison between Performance and Efficiency. J. Innov. Knowl. 2022, 7, 100191. [Google Scholar] [CrossRef]
- Oke, A. Innovation Types and Innovation Management Practices in Service Companies. Int. J. Innov. Manag. 2007, 27, 564–587. [Google Scholar] [CrossRef]
- Febrianti, R.A.M.; Herbert, A.S.N. Business Analysis and Product Innovation to Improve SMEs Business Performance. Int. J. Res. Appl. Technol. 2022, 2, 1–10. [Google Scholar] [CrossRef]
- Akgun, A.E.; Keskin, H.; Byrne, J. Organizational Emotional Capability, Product and Process Innovation, and Firm Performance: An Empirical Analysis. J. Eng. Technol. Manag. 2009, 26, 103–130. [Google Scholar] [CrossRef]
- Goni, J.I.C.; Van Looy, A. Process Innovation Capability in Less-Structured Business Processes: A Systematic Literature Review. Bus. Process Manag. J. 2022, 28, 557–584. [Google Scholar] [CrossRef]
- Chuang, L.M.; Liu, C.C.; Tsai, W.C.; Huang, C.M. Towards an Analysis Framework of Organizational Innovation in the Service Industry. Afr. J. Bus. Manag. 2010, 4, 790–799. [Google Scholar]
- Lai, J.Y.; Wang, J.; Ulhas, K.R.; Chang, C.H. Aligning Strategy with Knowledge Management System for Improving Innovation and Business Performance. Technol. Anal. Strateg. Manag. 2022, 34, 474–487. [Google Scholar] [CrossRef]
- Forbes Business Council. Want To Be More Innovative in 2021? Start by Prioritizing Consumers’ Well-Being. Available online: https://www.forbes.com/councils/forbesbusinesscouncil/2021/02/17/want-to-be-more-innovative-in-2021-start-by-prioritizing-consumers-well-being/ (accessed on 17 February 2021).
- Engel and Volkers Development Services. The Next Generation of Living, The Future Living Study; Engel and Volkers Residential GmbH: Hamburg, Germany, 2021. [Google Scholar]
- Rogers, E.M. Diffusion of Innovations, 5th ed.; Simon and Schuster: New York, NY, USA, 2003. [Google Scholar]
- Sanders, F.; van Bortel, G. Exploring Social System Barriers and Enablers in Dutch Collaborative Housing, Using Rogers’ Diffusion of Innovations Framework. In Proceedings of the European Network for Housing Research Conference, Uppsala, Sweden, 26–29 June 2018. [Google Scholar]
- Yi, Y.; Tung, L.L.; Wu, Z. Incorporating Technology Readiness (TR) into TAM: Are Individual Traits Important to Understand Technology Acceptance? Diffus. Interest Group Inf. Technol. 2003, 1, 1–27. [Google Scholar]
- Parasuraman, A. Technology Readiness Index (TRI): A Multiple-Item Scale to Measure Readiness to Embrace New Technologies. J. Serv. Res. 2000, 2, 307–320. [Google Scholar] [CrossRef]
- Ojiako, U.; AlRaeesi, E.J.H.; Chipulu, M.; Marshall, A.; Bashir, H. Innovation Readiness in Public Sector Service Delivery: An Exploration. Prod. Plan. Control 2024, 35, 437–460. [Google Scholar] [CrossRef]
- Ling, L.M.; Moi, C.M. Professional Students’ Technology Readiness, Prior Computing Experience and Acceptance of an E-Learning System. Malays. Account. Rev. 2007, 6, 85–100. [Google Scholar]
- Pesch, R.; Endres, H.; Bouncken, R.B. Digital Product Innovation Management: Balancing Stability and Fluidity through Formalization. J. Prod. Innov. Manag. 2021, 38, 726–744. [Google Scholar] [CrossRef]
- Lam, S.Y.; Chiang, J.; Parasuraman, A. The Effects of the Dimensions of Technology Readiness on Technology Acceptance: An Empirical Analysis. J. Interact. Mark. 2008, 22, 19–39. [Google Scholar] [CrossRef]
- Eppinger, E. How Open Innovation Practices Deliver Societal Benefits. Sustainability 2021, 13, 1431. [Google Scholar] [CrossRef]
- Lee, Y.H.; Hsieh, Y.C.; Hsu, C.N. Adding Innovation Diffusion Theory to The Technology Acceptance Model: Supporting Employees’ Intentions to Use E-Learning Systems. J. Educ. Technol. Soc. 2011, 14, 124–137. [Google Scholar]
- Kaartinen, S. The Adoption of the Smart Readiness Indicator in the Finnish Residential Rental Property Market. Master’s Thesis, Aalto University, Espoo, Finland, 2023. [Google Scholar]
- Yusof, N.A.; Mohd Shafiei, M.W. Factors Affecting Housing Developers’ Readiness to Adopt Innovative Systems. Hous. Stud. 2011, 26, 369–384. [Google Scholar] [CrossRef]
- Davis, F.D. Perceived Usefulness, Perceived Ease of Use, and User Acceptance of Information Technology. Manag. Inf. Syst. Q. 1989, 13, 318–339. [Google Scholar] [CrossRef]
- Neufeld, D.J.; Dong, L.; Higgins, C. Charismatic Leadership and User Acceptance of Information Technology. Eur. J. Inf. Syst. 2007, 16, 494–510. [Google Scholar] [CrossRef]
- Xue, L.; Rashid, A.M.; Ouyang, S. The Unified Theory of Acceptance and Use of Technology (UTAUT) in Higher Education: A Systematic Review. Sage Open 2024, 14, 21582440241229570. [Google Scholar] [CrossRef]
- Chang, A. UTAUT and UTAUT 2: A Review and Agenda for Future Research. Winners 2012, 13, 10–114. [Google Scholar] [CrossRef]
- Rouidi, M.; Hamdoune, A.; Choujtani, K.; Chati, A. TAM-UTAUT and the Acceptance of Remote Healthcare Technologies by Healthcare Professionals: A Systematic Review. Inf. Med. Unlocked 2022, 32, 101008. [Google Scholar] [CrossRef]
- Gupta, B.; Dasgupta, S.; Gupta, A. Adoption of ICT in a Government Organization in a Developing Country: An Empirical Study. J. Strateg. Inf. Syst. 2008, 17, 140–154. [Google Scholar] [CrossRef]
- Yavwa, Y.; Twinomurinzi, H. Impact of Culture on E-Government Adoption Using UTAUT: A Case of Zambia. In Proceedings of the 2018 Fifth International Conference on eDemocracy & eGovernment (ICEDEG), Ambato, Ecuador, 18–20 April 2018; pp. 10–15. [Google Scholar] [CrossRef]
- Chan, M.; Estève, D.; Escriba, C.; Campo, E. A Review of Smart Homes—Present State and Future Challenges. Comput. Methods Programs Biomed. 2008, 91, 55–81. [Google Scholar] [CrossRef] [PubMed]
- Sun, W. Institutional Innovation of Cooperative Mode of Production. Teach. Res. Comp. Innov. Sci. Res. Manag. 2009, 30, 69–75. [Google Scholar]
- Pak, T.Y.; Bae, B.; Lee, C.; Jung, I.; Jang, B.J. Modeling Public Acceptance of Demand-Responsive Transportation: An Integrated UTAUT and ITM Framework. J. Public Transp. 2023, 25, 100067. [Google Scholar] [CrossRef]
- Yi, M.Y.; Fiedler, K.D.; Park, J.S. Understanding the Role of Individual Innovativeness in the Acceptance of IT-Based Innovations: Comparative Analyses of Models and Measures. Decis. Sci. 2006, 37, 393–426. [Google Scholar] [CrossRef]
- Fretzen, T. External Factors Affecting the Adoption of IoT-Technology: A TAM and UTAUT Approach. Bachelor’s Thesis, University of Twente, Enschede, The Netherlands, 2018. [Google Scholar]
- Venkatesh, V.; Morris, M.G.; Davis, G.B.; Davis, F.D. User Acceptance of Information Technology: Toward a Unified View. Manag. Inf. Syst. Q. 2003, 27, 425–478. [Google Scholar] [CrossRef]
- Venkatesh, V. Consumer Acceptance and Use of Information Technology: Extending the Unified Theory of Acceptance and Use of Technology. Manag. Inf. Syst. Q. 2012, 36, 157–178. [Google Scholar] [CrossRef]
- Saunila, M.; Ukko, J.; Nasiri, M.; Rantala, T.; Sore, S. Managing Supplier Capabilities for Buyer Innovation Performance in E-Business. J. Glob. Oper. Strateg. Sourc. 2021, 14, 567–583. [Google Scholar]
- Jungang, W. The Effect of Product Innovation and Product Variations on Consumer Buying Interest. Siber Int. J. Digit. Bus. 2023, 1, 25–33. [Google Scholar] [CrossRef]
- Charterina, J.; Basterretxea, I.; Landeta, J. Types of Embedded Ties in Buyer-Supplier Relationships and Their Combined Effects on Innovation Performance. J. Bus. Ind. Mark. 2016, 31, 152–163. [Google Scholar] [CrossRef]
- Kim, S.J.; Kim, K.H.; Choi, J. The Role of Design Innovation in Understanding Purchase Behavior of Augmented Products. J. Bus. Res. 2019, 99, 354–362. [Google Scholar] [CrossRef]
- Tarigan, Z.J.H.; Siagian, H.; Panjaitan, T.W.S.; Sutjianto, A. The Effect of Supplier Trust, Supplier Innovation, and Buyer-Supplier Relationship in Enhancing the Supplier Performance on the Death Service Companies in Surabaya, Indonesia. Ph.D. Thesis, KnE Life Sciences, Surabaya, Indonesia, 2020. [Google Scholar]
- Strupinski, J.; Witek-Hajduk, M. Relationships between High-Tech SME Suppliers and Foreign Buyers: Effects of Relational Trust, Relationship-Specific Investments and Contract Specificity on Product Innovation. Eur. J. Innov. Manag. 2024, 28, 1–20. [Google Scholar] [CrossRef]
- Ou, H.; Hung, C. Study on Factors of the Application of Intelligent Technology in Lifelong Residential Living Environment. In Proceedings of the 2019 IEEE International Conference of Intelligent Applied Systems on Engineering (ICIASE), Fuzhou, China, 26–29 April 2019. [Google Scholar] [CrossRef]
- Cahill, J.; McLoughlin, S.; Wetherall, S. The Design of New Technology Supporting Wellbeing, Independence and Social Participation, for Older Adults Domiciled in Residential Homes and/or Assisted Living Communities. Technologies 2018, 6, 18. [Google Scholar] [CrossRef]
- Robles, R.J.; Kim, T. Applications, Systems and Methods in Smart Home Technology: A Review. Int. J. Adv. Sci. Technol. 2010, 15, 37–48. [Google Scholar]
- Manchanda, S.; Steemers, K. Environmental Control and the Creation of Well-Being. In Sustainable Environmental Design in Architecture: Impacts on Health; Rassia, S.T., Pardalos, P.M., Eds.; Springer: New York, NY, USA, 2012; pp. 69–81. [Google Scholar] [CrossRef]
- Kotler, P.; Keller, K.L. Marketing Management, 14th ed.; Pearson Education: Upper Saddle River, NJ, USA, 2012. [Google Scholar]
- Kanagal, N.B. An Extended Model of Behavioural Process in Consumer Decision Making. Int. J. Mark. Stud. 2016, 8, 87–93. [Google Scholar] [CrossRef]
- Van den Bergh, J.; Behrer, M. How Cool Brands Stay Hot: Branding to Generation Y; Kogan Page Limited: London, UK, 2011. [Google Scholar]
- Brunetti, F.; Matt, D.T.; Bonfanti, A.; De Longhi, A.; Pedrini, G.; Orzes, G. Digital Transformation Challenges: Strategies Emerging from a Multi-Stakeholder Approach. TQM J. 2020, 32, 697–724. [Google Scholar] [CrossRef]
- Lynn, G.S.; Akgün, A.E. Launch Your New Products/Services Better, Faster. Res. Technol. Manag. 1995, 46, 21–26. [Google Scholar] [CrossRef]
- Rehman, U.U.; Iqbal, A. Nexus of Knowledge-Oriented Leadership, Knowledge Management, Innovation and Organizational Performance in Higher Education. Bus. Process Manag. J. 2020, 26, 1731–1758. [Google Scholar] [CrossRef]
- Hooper, D.; Coughlan, J.; Mullen, M.R. Structural Equation Modelling: Guidelines for Determining Model Fit. Electron. J. Bus. Res. Methods 2008, 6, 53–60. [Google Scholar] [CrossRef]
- Realestateasia.com. Bangkok Residential Vacancy Rate Declines to 6.5% in Q2. Available online: https://realestateasia.com/residential/news/bangkok-residential-vacancy-rate-declines-65-in-q2 (accessed on 24 June 2025).
- DDProperty.com. Sukhumvit: The Ultimate CBD Location in the Heart of Bangkok. Available online: https://www.ddproperty.com (accessed on 24 June 2025).
- Kline, R.B. Assessing Statistical Aspects of Test Fairness with Structural Equation Modelling. Educ. Res. Eval. 2013, 19, 204–222. [Google Scholar] [CrossRef]
- Lakens, D. Sample Size Justification. Collabra Psychol. 2022, 8, 33267. [Google Scholar] [CrossRef]
- Schumacker, R.E.; Lomax, R.G. A Beginner’s Guide to Structural Equation Modeling, 3rd ed.; Lawrence Erlbaum Associates: Hillsdale, NJ, USA, 2010. [Google Scholar]
- Ahmmed, S.; Saha, J.; Tamal, M.A. An Empirical Study for Determining the Quality Indicators for the Primary and Secondary School of Bangladesh: A Structural Equation Modeling Approach. Heliyon 2022, 8, e11111. [Google Scholar] [CrossRef] [PubMed]
- Rovinelli, R.J.; Hambleton, R.K. On the Use of Content Specialists in the Assessment of Criterion Referenced Test Item Validity. In Proceedings of the Annual Meeting of the American Educational Research Association, San Francisco, CA, USA, 19–23 April 1976. [Google Scholar]
- Tavakol, M.; Dennick, R. Making Sense of Cronbach’s Alpha. Int. J. Med. Educ. 2011, 2, 53–55. [Google Scholar] [CrossRef] [PubMed]
- Zheng, B.Q.; Bentler, P.M. Enhancing Model Fit Evaluation in SEM: Practical Tips for Optimizing Chi Square Tests. Struct. Equ. Model. 2025, 32, 136–141. [Google Scholar] [CrossRef]
- Best, J.W. Research in Education, 3rd ed.; Prentice Hall: Englewood Cliffs, NJ, USA, 1977. [Google Scholar]
| Criteria | Details | Number | Percentage |
|---|---|---|---|
| Gender | Male | 226 | 56.50 |
| Female | 174 | 43.50 | |
| Age | >25 | 24 | 6.00 |
| 25–30 | 143 | 35.75 | |
| 31–35 | 125 | 31.25 | |
| 36–40 | 56 | 14.00 | |
| 41–50 | 44 | 11.00 | |
| <50 | 8 | 0.02 | |
| Status | Single | 212 | 53.00 |
| Married | 176 | 44.00 | |
| Divorce | 12 | 3.00 | |
| Educational qualification | >Bachelor’s degree | 8 | 0.02 |
| Bachelor’s degree | 220 | 55.00 | |
| Master’s degree | 160 | 40.00 | |
| Doctoral degree | 12 | 3.00 | |
| Occupation | Student | 24 | 6.00 |
| Company employee | 311 | 77.75 | |
| Owner | 33 | 8.25 | |
| Government officer | 32 | 8.00 | |
| Income | <25,000 | 32 | 8.00 |
| 25,001–50,000 | 124 | 31.00 | |
| 50,001–75,000 | 164 | 41.00 | |
| 75,001–100,000 | 56 | 14.00 | |
| 100,001–200,000 | 12 | 3.00 | |
| >200,000 | 12 | 3.00 | |
| Number of residents per unit | 1 person | 76 | 19.00 |
| 2 people | 192 | 48.00 | |
| 3–4 people | 128 | 32.00 | |
| <5 people | 4 | 1.00 | |
| Residential room type | Studio | 36 | 9.00 |
| 1 bedroom | 248 | 62.00 | |
| 2 bedrooms | 92 | 23.00 | |
| 3 bedrooms | 16 | 4.00 | |
| Penthouse | 8 | 2.00 |
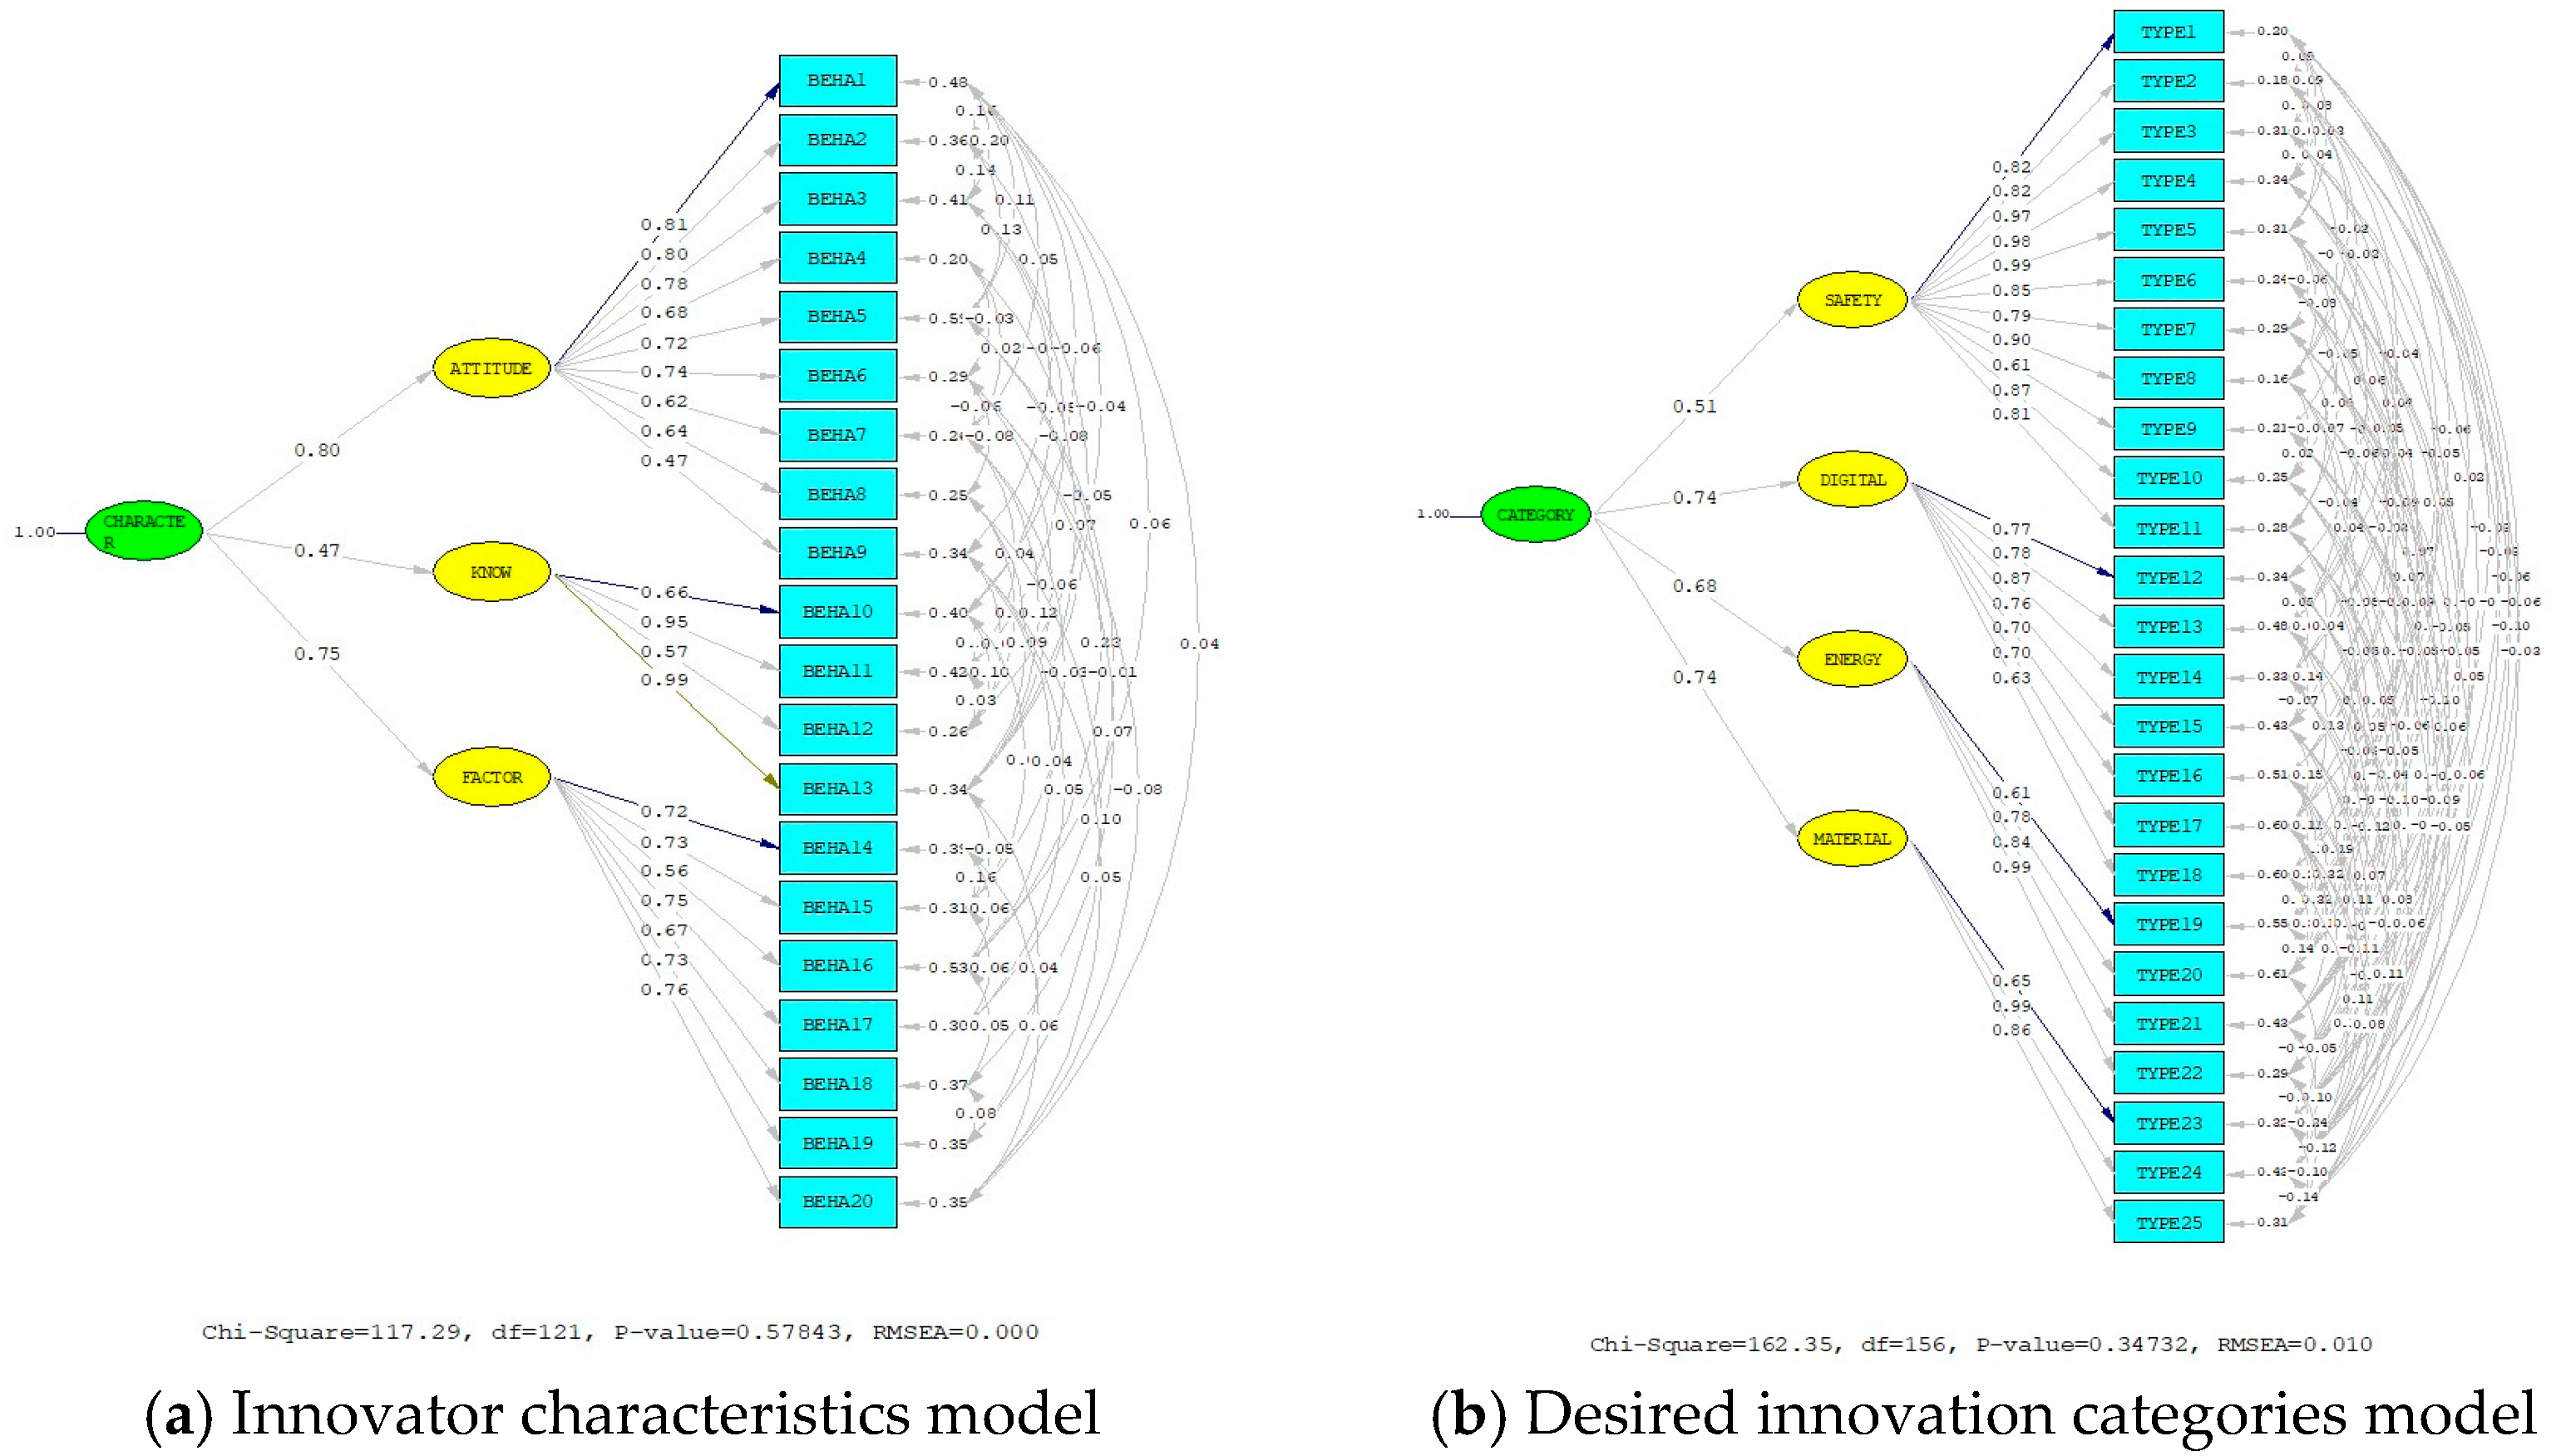
| Model | Chi-Square | Df (df > 0) | p-Value (p-Value ≥ 0.05) | RMSEA (RMSEA < 0.05) | GFI (GFI > 0.95) | AGFI (AGFI > 0.95) | RMR (RMR < 0.05) | CFI (CFI > 0.95) | NNFI (NNFI > 0.95) |
|---|---|---|---|---|---|---|---|---|---|
| CHARACTER | 117.29 | 121 | 0.578 | 0.000 | 0.972 | 0.951 | 0.017 | 1.000 | 1.000 |
| CATEGORY | 162.35 | 156 | 0.347 | 0.010 | 0.969 | 0.956 | 0.023 | 0.999 | 0.998 |
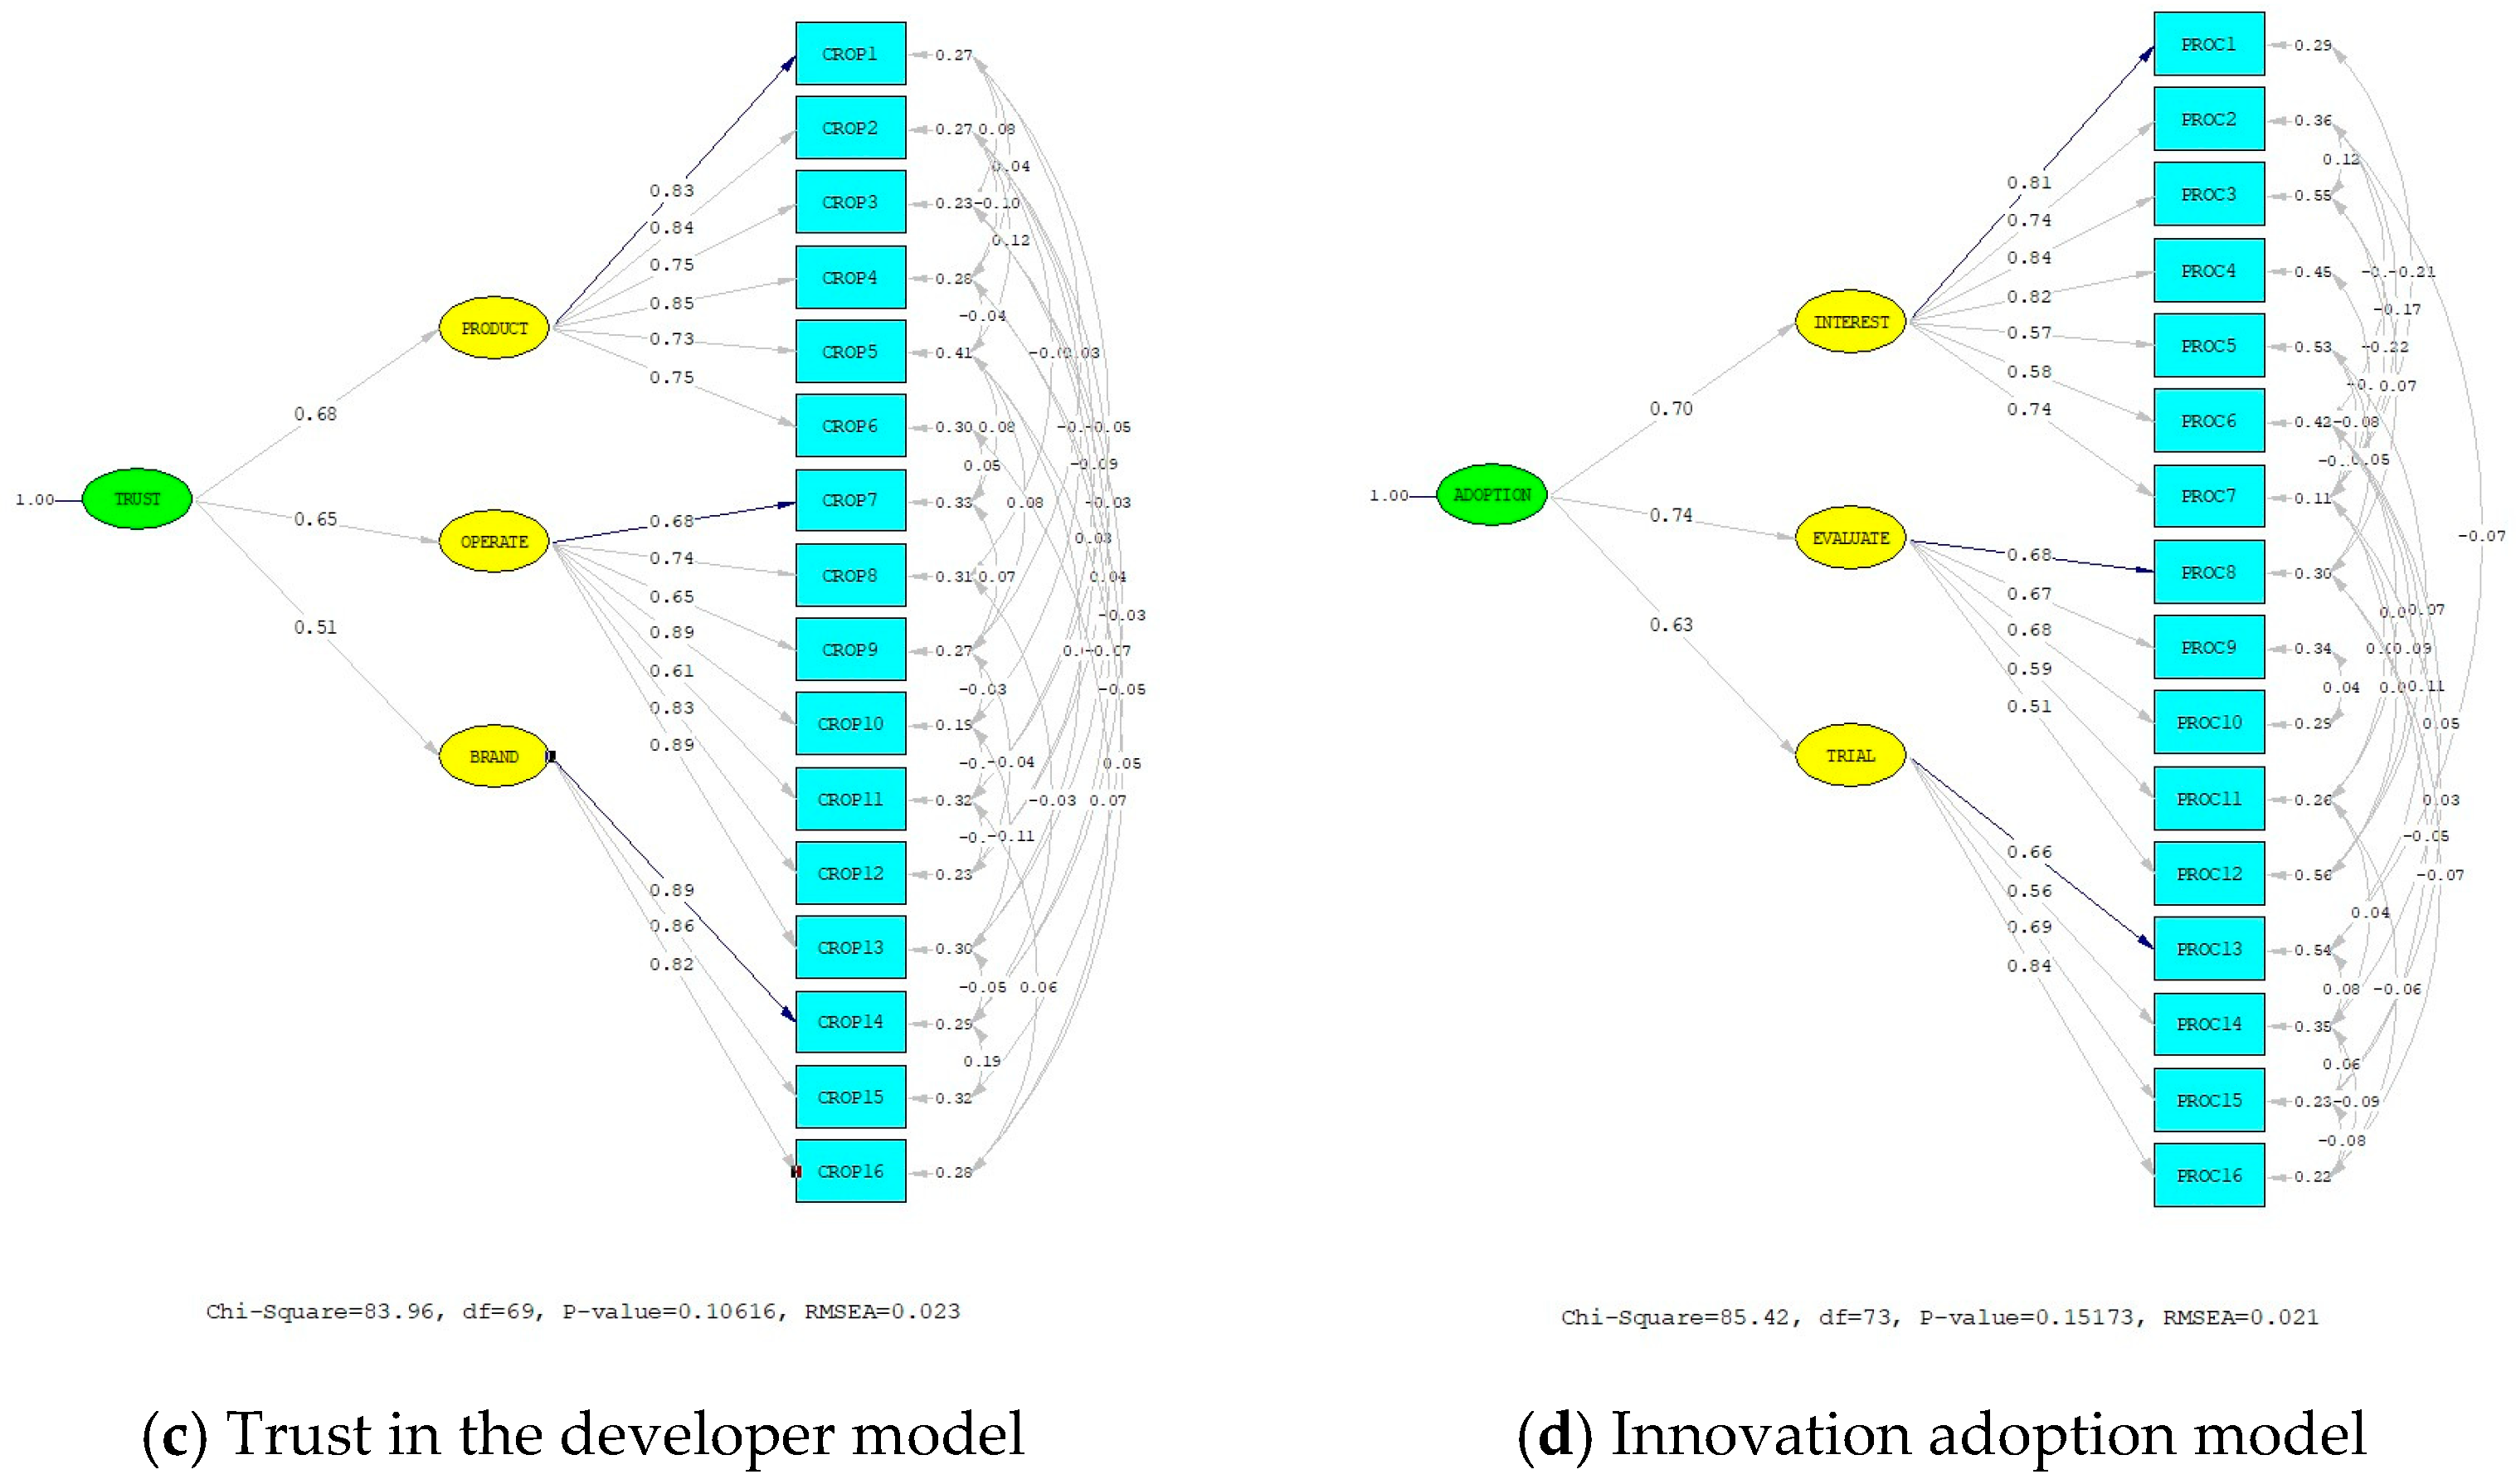
| TRUST | 83.96 | 69 | 0.106 | 0.023 | 0.975 | 0.951 | 0.016 | 0.996 | 0.993 |
| ADOPTION | 85.42 | 73 | 0.151 | 0.021 | 0.974 | 0.951 | 0.024 | 0.995 | 0.993 |
| Variables | Code | Mean (Scale 1–5) | Mean (%) | S.D. | Skewness | Kurtosis |
|---|---|---|---|---|---|---|
| Safety and Health | SAFETY | 4.41 | 88.11 | 0.53 | −1.08 | 1.09 |
| Digital and Intelligent Systems | DIGITAL | 3.64 | 72.87 | 0.74 | −0.60 | 0.12 |
| Energy Management | ENERGY | 3.79 | 75.85 | 0.76 | −0.74 | 0.44 |
| Materials and Construction | MATERIAL | 3.89 | 77.80 | 0.74 | −0.15 | −0.87 |
| Organization’s Products | PRODUCT | 3.90 | 77.98 | 0.65 | −0.43 | −0.22 |
| Organization’s Operations | OPERATE | 4.11 | 82.28 | 0.57 | −1.07 | 1.79 |
| Organization’s Brand | BRAND | 4.02 | 80.38 | 0.64 | −0.48 | 0.19 |
| Attitude Toward New Innovation | ATTITUDE | 3.79 | 75.85 | 0.68 | −0.55 | −0.11 |
| Perceived Ease of Use | KNOW | 4.21 | 84.18 | 0.53 | −0.56 | 0.77 |
| Factors in Usage Selection | FACTOR | 4.04 | 80.72 | 0.58 | −0.58 | 0.29 |
| The Stage of Attention and Information Search | INTEREST | 3.56 | 71.18 | 0.74 | −0.17 | −0.70 |
| The Stage of Analysis and Evaluation | EVALUATE | 4.15 | 82.94 | 0.56 | −0.59 | 0.49 |
| The Stage of Experimentation and Decision-Making | TRAIL | 4.05 | 80.91 | 0.62 | −0.62 | 0.34 |
| Variables | Factor Loadings of the Structural Model for Innovation Adoption in Residential Condominium Buildings | ||||||||||||
|---|---|---|---|---|---|---|---|---|---|---|---|---|---|
| Subcomponent | Subcomponent | Subcomponent | Subcomponent | R2 | |||||||||
| CATEGORY | TRUST | CHARACTER | ADOPTION | ||||||||||
| Coefficient | SE | t | Coefficient | SE | t | Coefficient | SE | t | Coefficient. | SE | t | ||
| SAFETY | 0.74 | 0.55 | |||||||||||
| DIGITAL | 0.83 | 0.09 | 14.38 | 0.69 | |||||||||
| ENERGY | 0.74 | 0.09 | 13.09 | 0.56 | |||||||||
| MATERIAL | 0.55 | 0.07 | 12.16 | 0.30 | |||||||||
| PRODUCT | 0.78 | 0.03 | 17.94 | 0.61 | |||||||||
| OPERATE | 0.92 | 0.02 | 21.87 | 0.84 | |||||||||
| BRAND | 0.64 | 0.03 | 13.79 | 0.41 | |||||||||
| ATTITUDE | 0.91 | 0.03 | 19.72 | 0.83 | |||||||||
| KNOW | 0.77 | 0.04 | 11.39 | 0.59 | |||||||||
| FACTOR | 0.84 | 0.03 | 17.36 | 0.70 | |||||||||
| INTEREST | 0.84 | 0.70 | |||||||||||
| EVALUATE | 0.76 | 0.04 | 14.62 | 0.58 | |||||||||
| TRIAL | 0.58 | 0.04 | 11.18 | 0.33 | |||||||||
| CATEGORY | |||||||||||||
| Coefficient | SE | t | |||||||||||
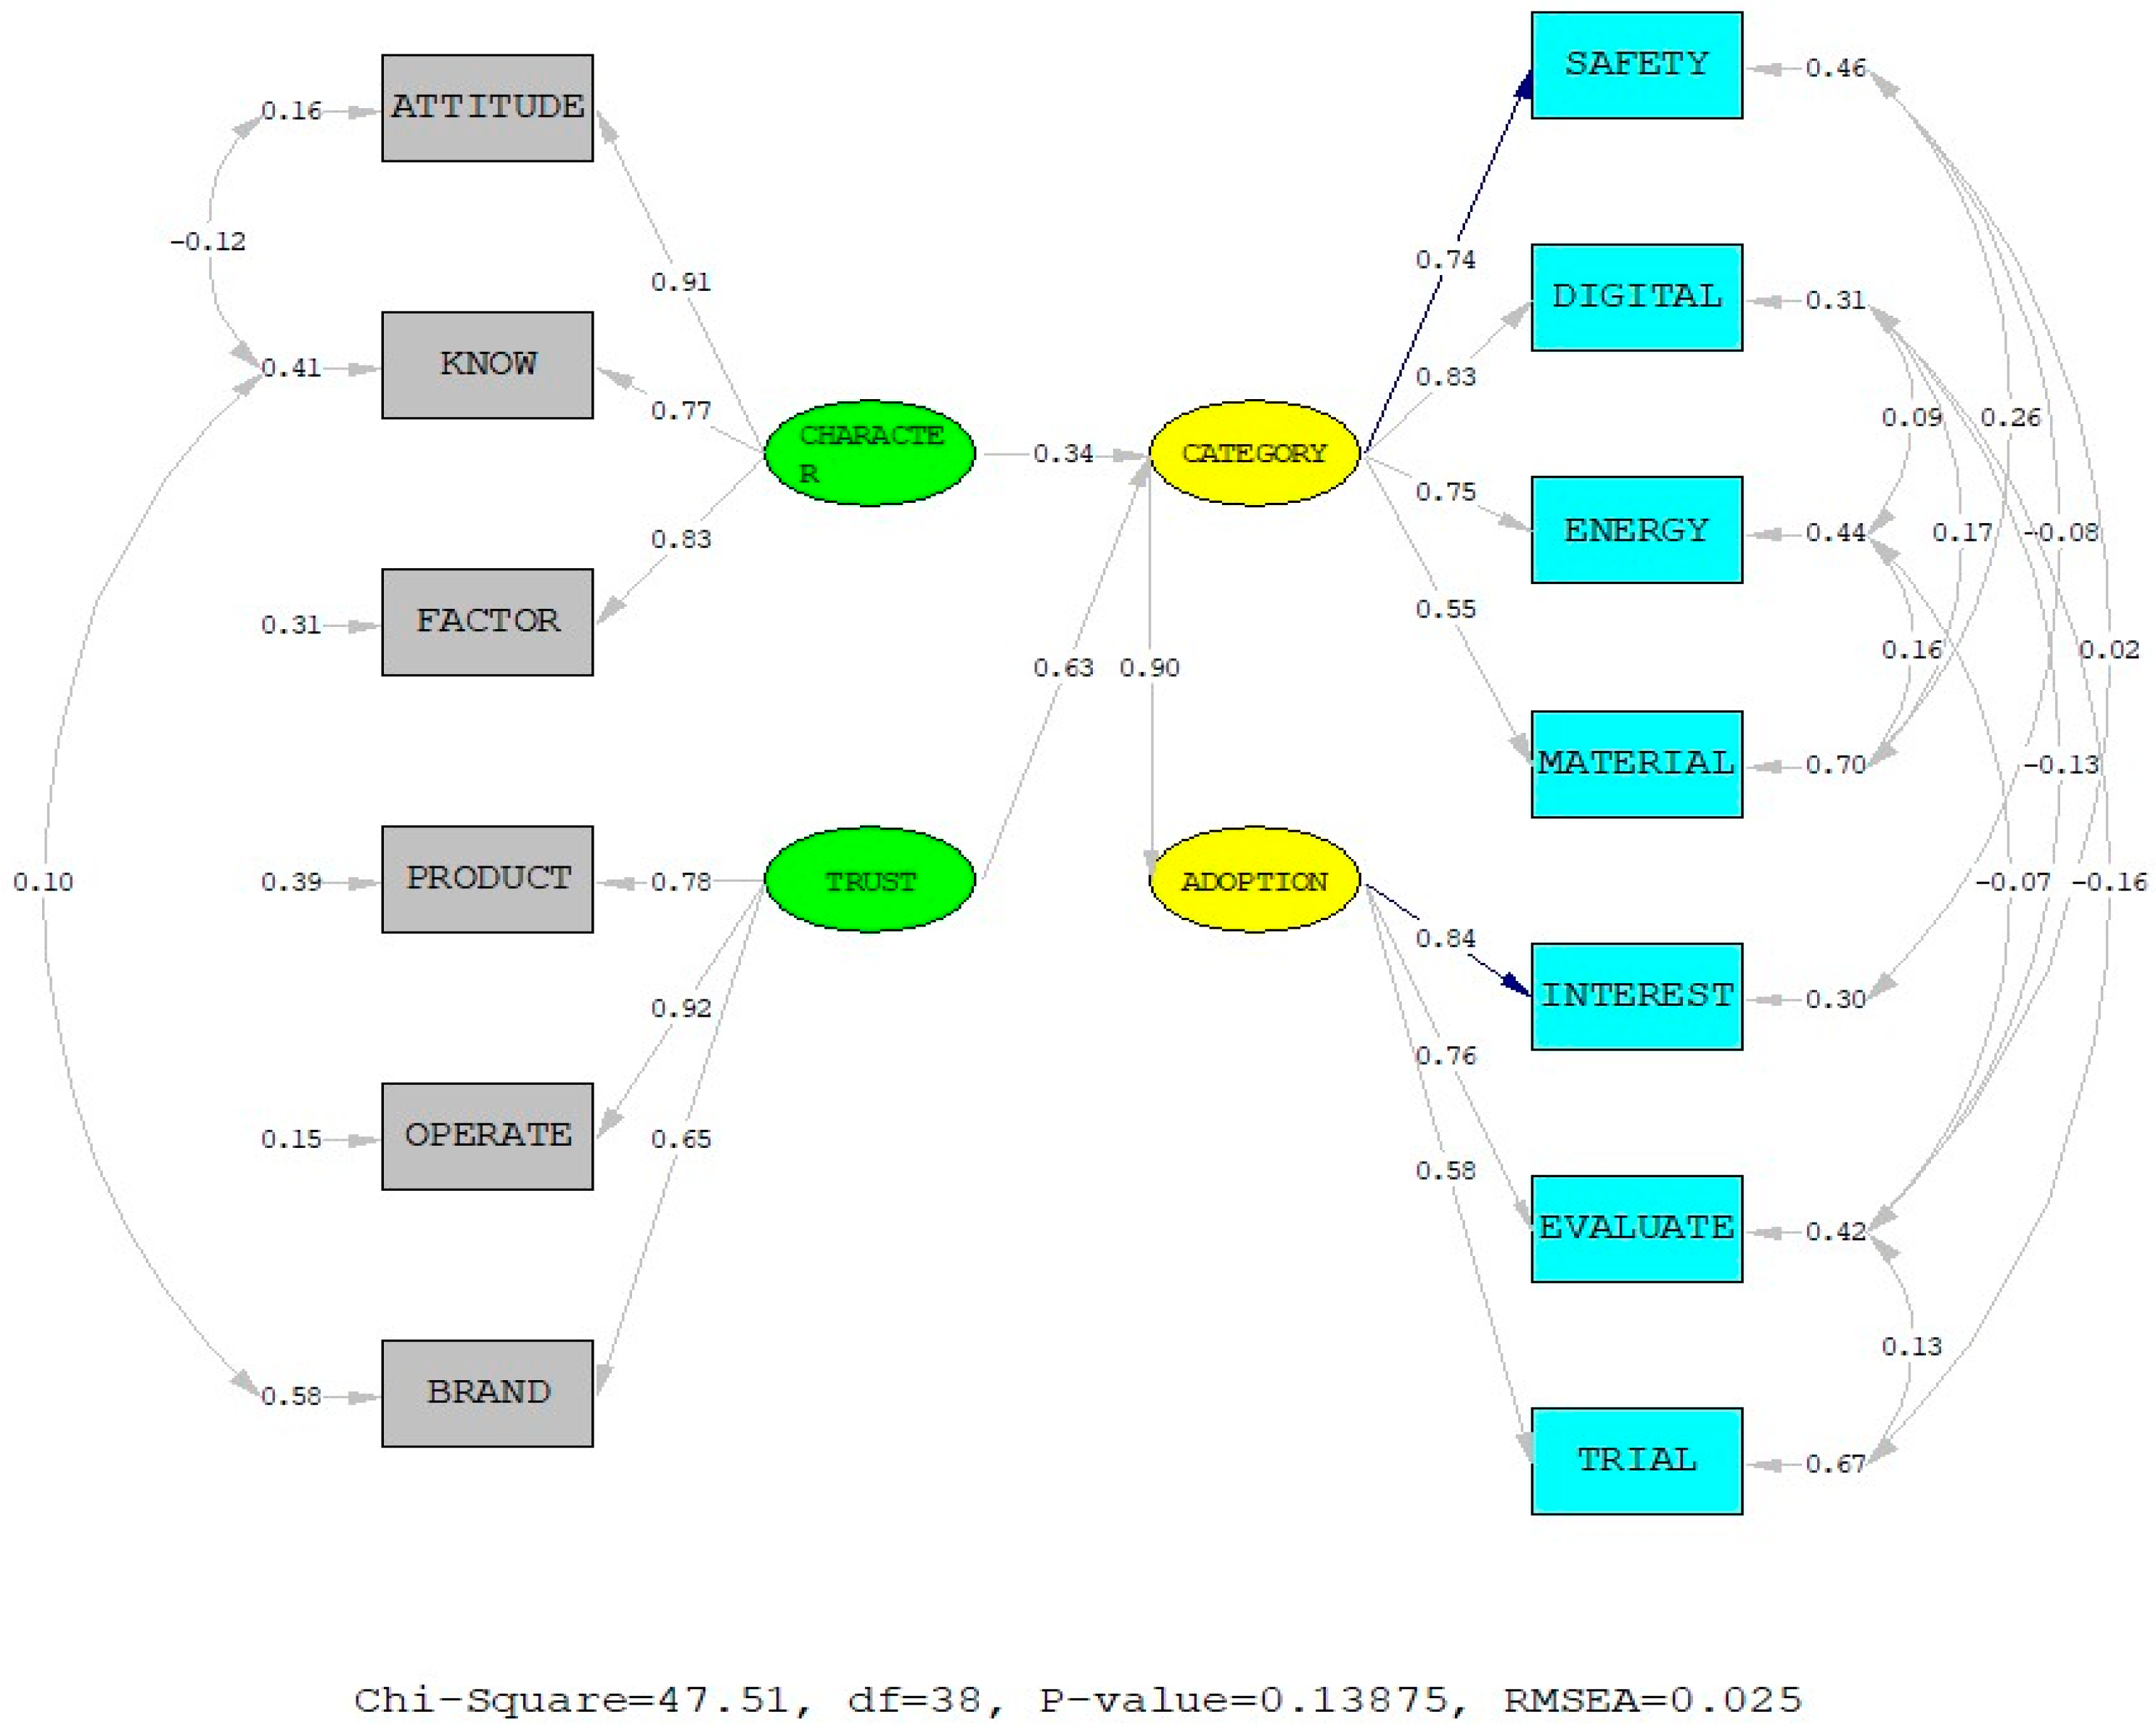
| TRUST | 0.63 | 0.03 | 10.42 | Chi-square = 47.51; df = 38; p-value = 0.138; RMSEA = 0.032 | |||||||||
| CHARACTER | 0.34 | 0.03 | 6.61 | GFI = 0.982; AGFI = 0.957; RMR = 0.0104; CFI = 0.997; TLI = 0.994 | |||||||||
| ADOPTION | 0.90 | 0.01 | 13.22 | ||||||||||
| Path | Path Coefficient (β) | t-Value | p-Value |
|---|---|---|---|
| CHARACTER ➔ CATEGORY | 0.34 | 2.957 | 0.052 |
| TRUST ➔ CATEGORY | 0.63 | 5.412 | 0.001 |
| CATEGORY ➔ ADOPTION | 0.90 | 10.271 | 0.001 |
Disclaimer/Publisher’s Note: The statements, opinions and data contained in all publications are solely those of the individual author(s) and contributor(s) and not of MDPI and/or the editor(s). MDPI and/or the editor(s) disclaim responsibility for any injury to people or property resulting from any ideas, methods, instructions or products referred to in the content. |
© 2025 by the authors. Licensee MDPI, Basel, Switzerland. This article is an open access article distributed under the terms and conditions of the Creative Commons Attribution (CC BY) license (https://creativecommons.org/licenses/by/4.0/).
Share and Cite
Tochaiwat, K.; Pawanacharurn, V.; Seniwong, P. Structural Equation Modeling for Analyzing Innovation Adoption in Residential Condominium Projects. Buildings 2025, 15, 2467. https://doi.org/10.3390/buildings15142467
Tochaiwat K, Pawanacharurn V, Seniwong P. Structural Equation Modeling for Analyzing Innovation Adoption in Residential Condominium Projects. Buildings. 2025; 15(14):2467. https://doi.org/10.3390/buildings15142467
Chicago/Turabian StyleTochaiwat, Kongkoon, Vitoon Pawanacharurn, and Patcharida Seniwong. 2025. "Structural Equation Modeling for Analyzing Innovation Adoption in Residential Condominium Projects" Buildings 15, no. 14: 2467. https://doi.org/10.3390/buildings15142467
APA StyleTochaiwat, K., Pawanacharurn, V., & Seniwong, P. (2025). Structural Equation Modeling for Analyzing Innovation Adoption in Residential Condominium Projects. Buildings, 15(14), 2467. https://doi.org/10.3390/buildings15142467