
Study on Performance Optimization of Red Mud–Mineral Powder Composite Cementitious Material Based on Response Surface Methodology

Abstract
1. Introduction
2. Experimental Materials and Methods
2.1. Experimental Materials
2.2. Experimental Scheme
2.3. Experimental Methods
2.3.1. Mechanical Property Test
2.3.2. XRD Test
2.3.3. SEM Test
3. Results and Discussion
3.1. Analysis of Variance for the Regression Model
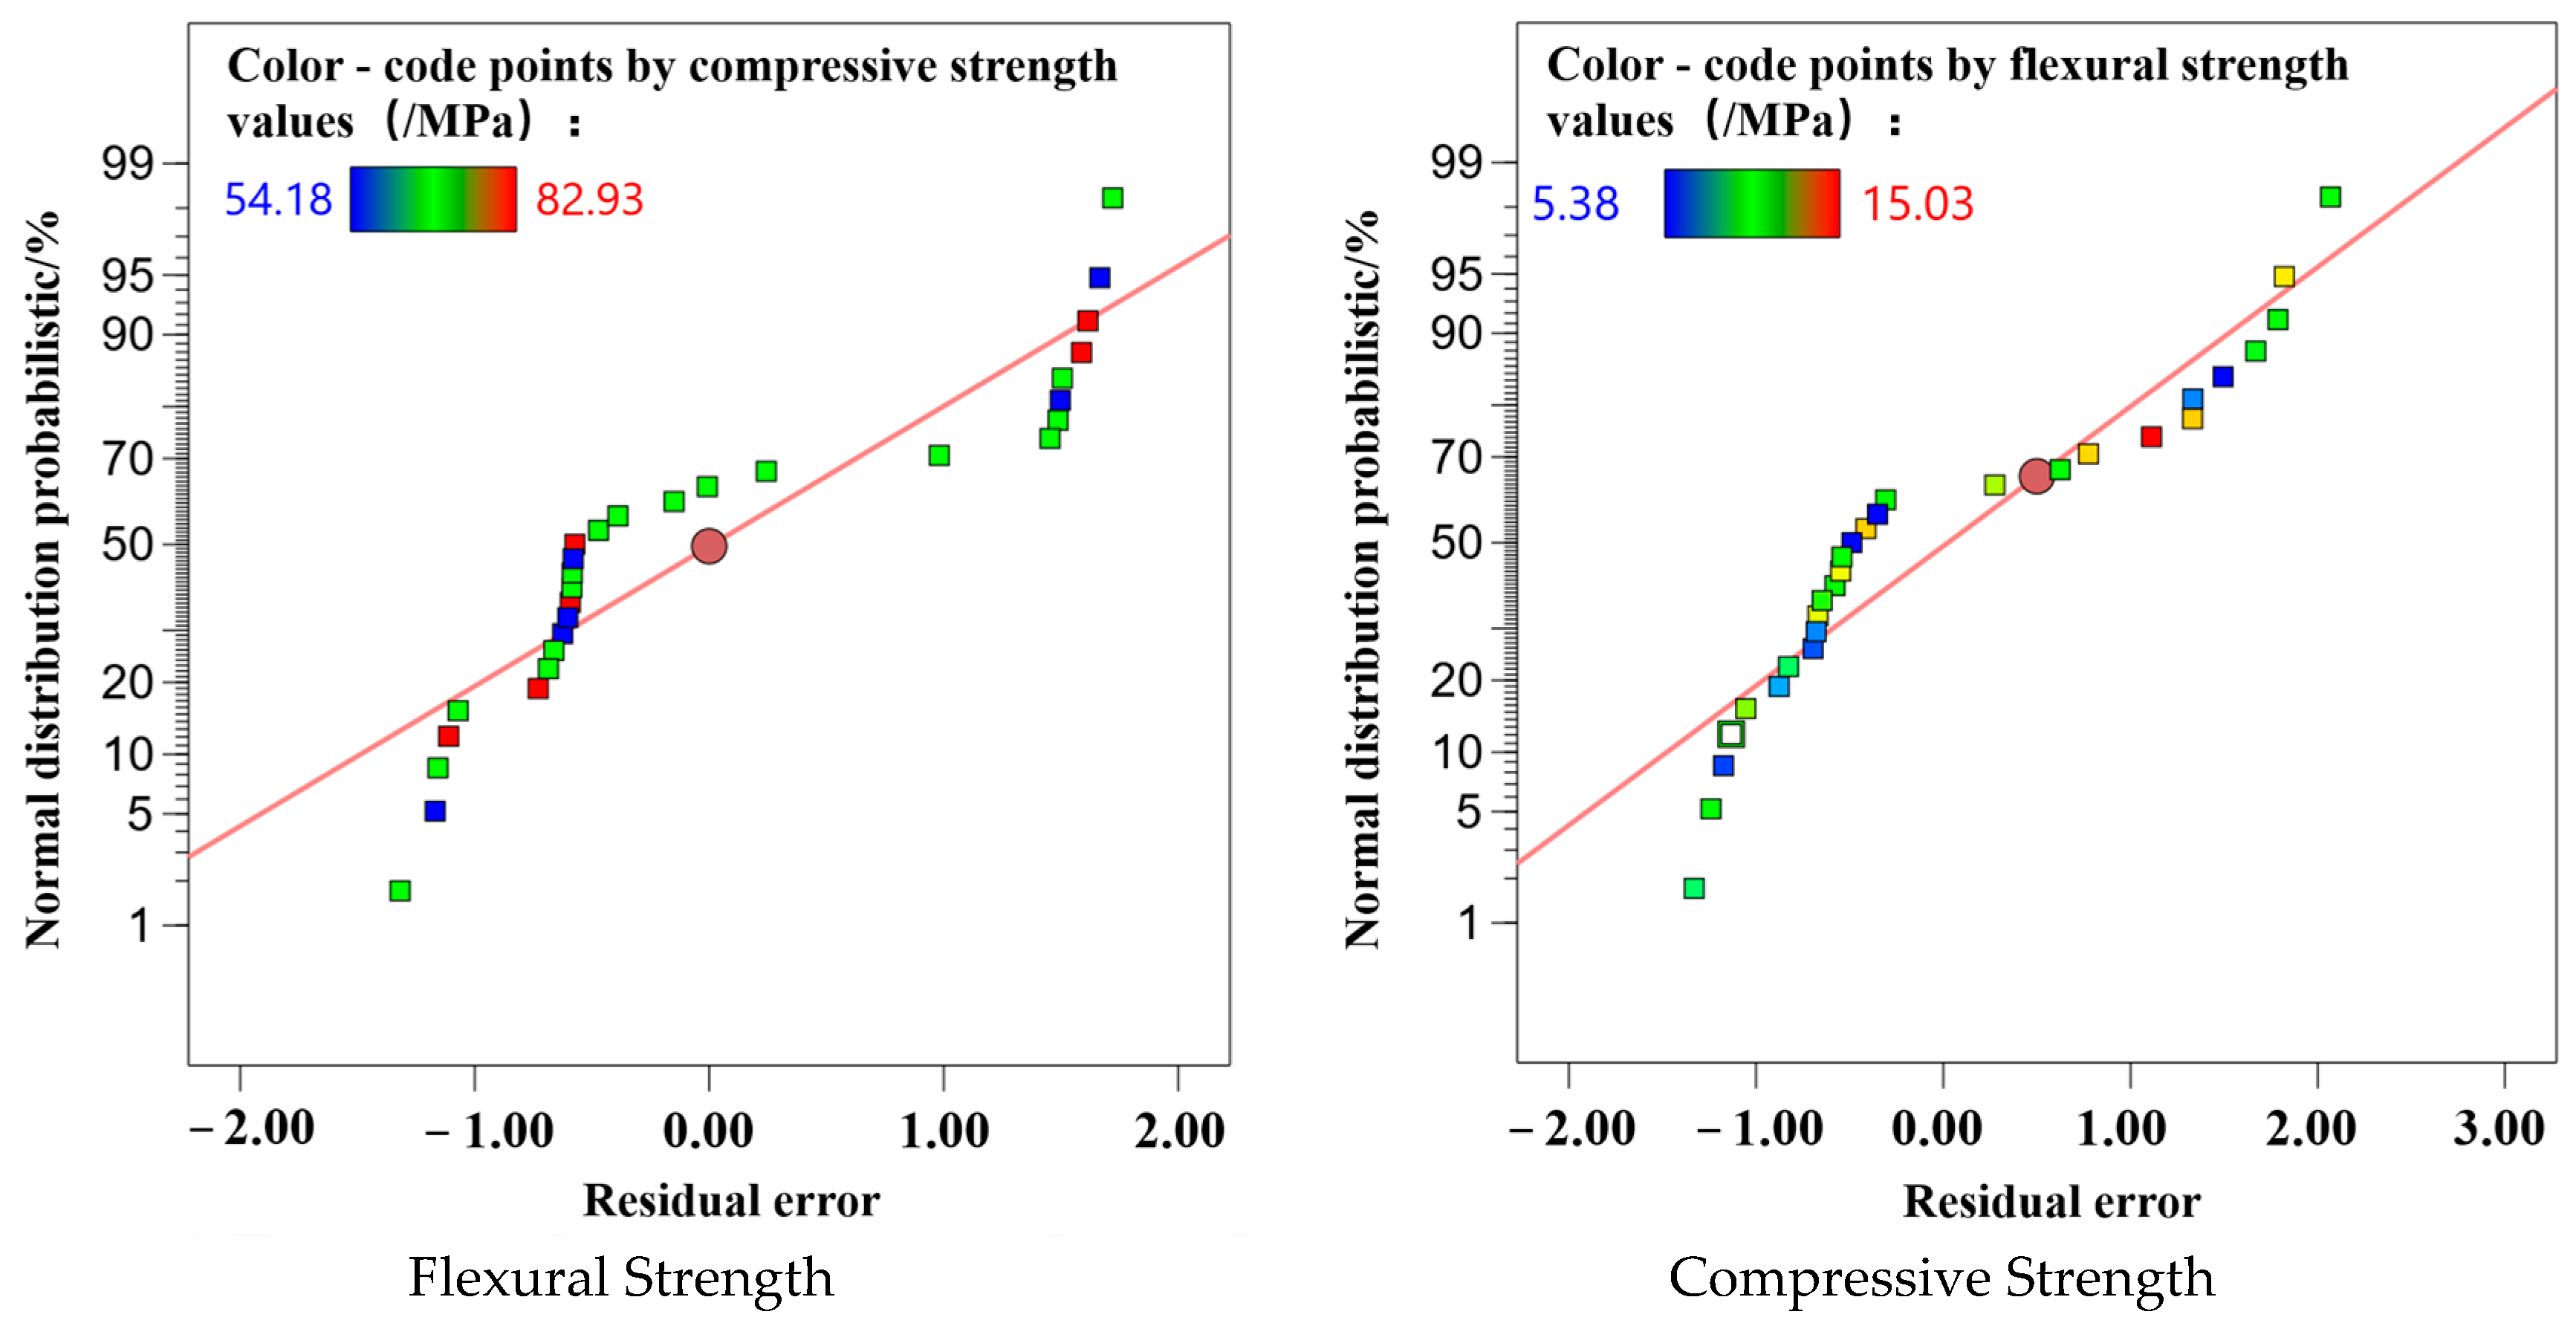
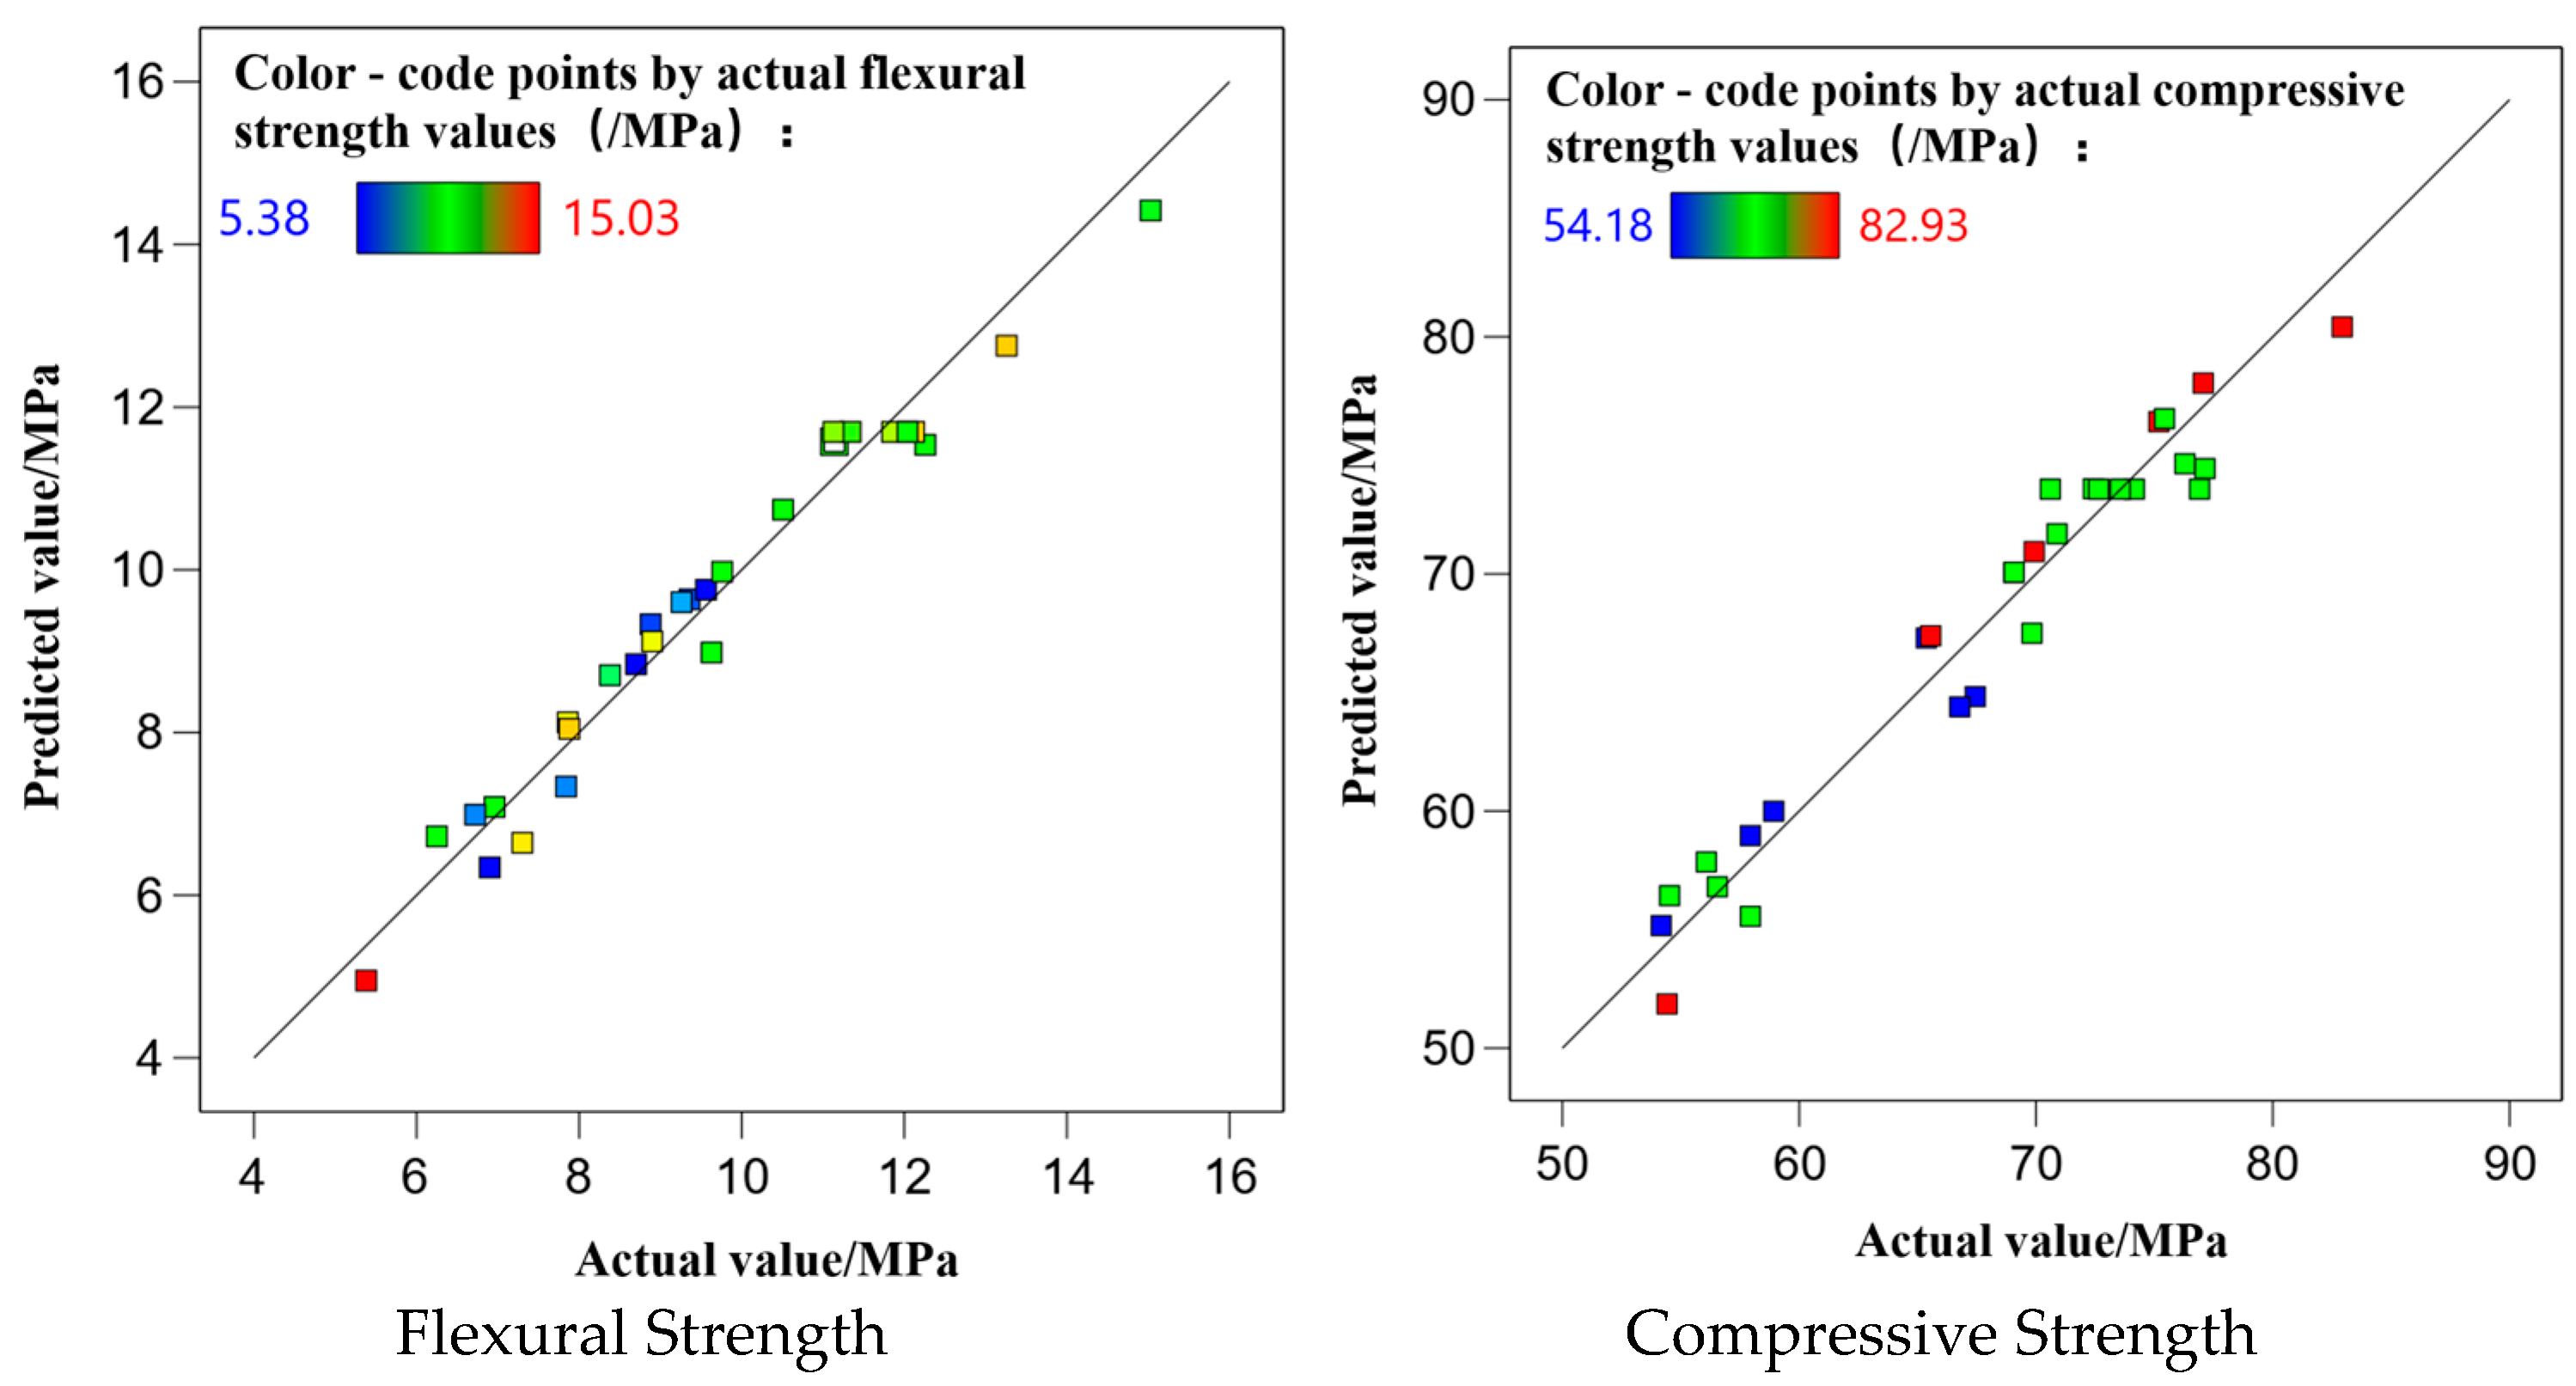
3.2. Analysis of Response Surface Model Prediction Accuracy
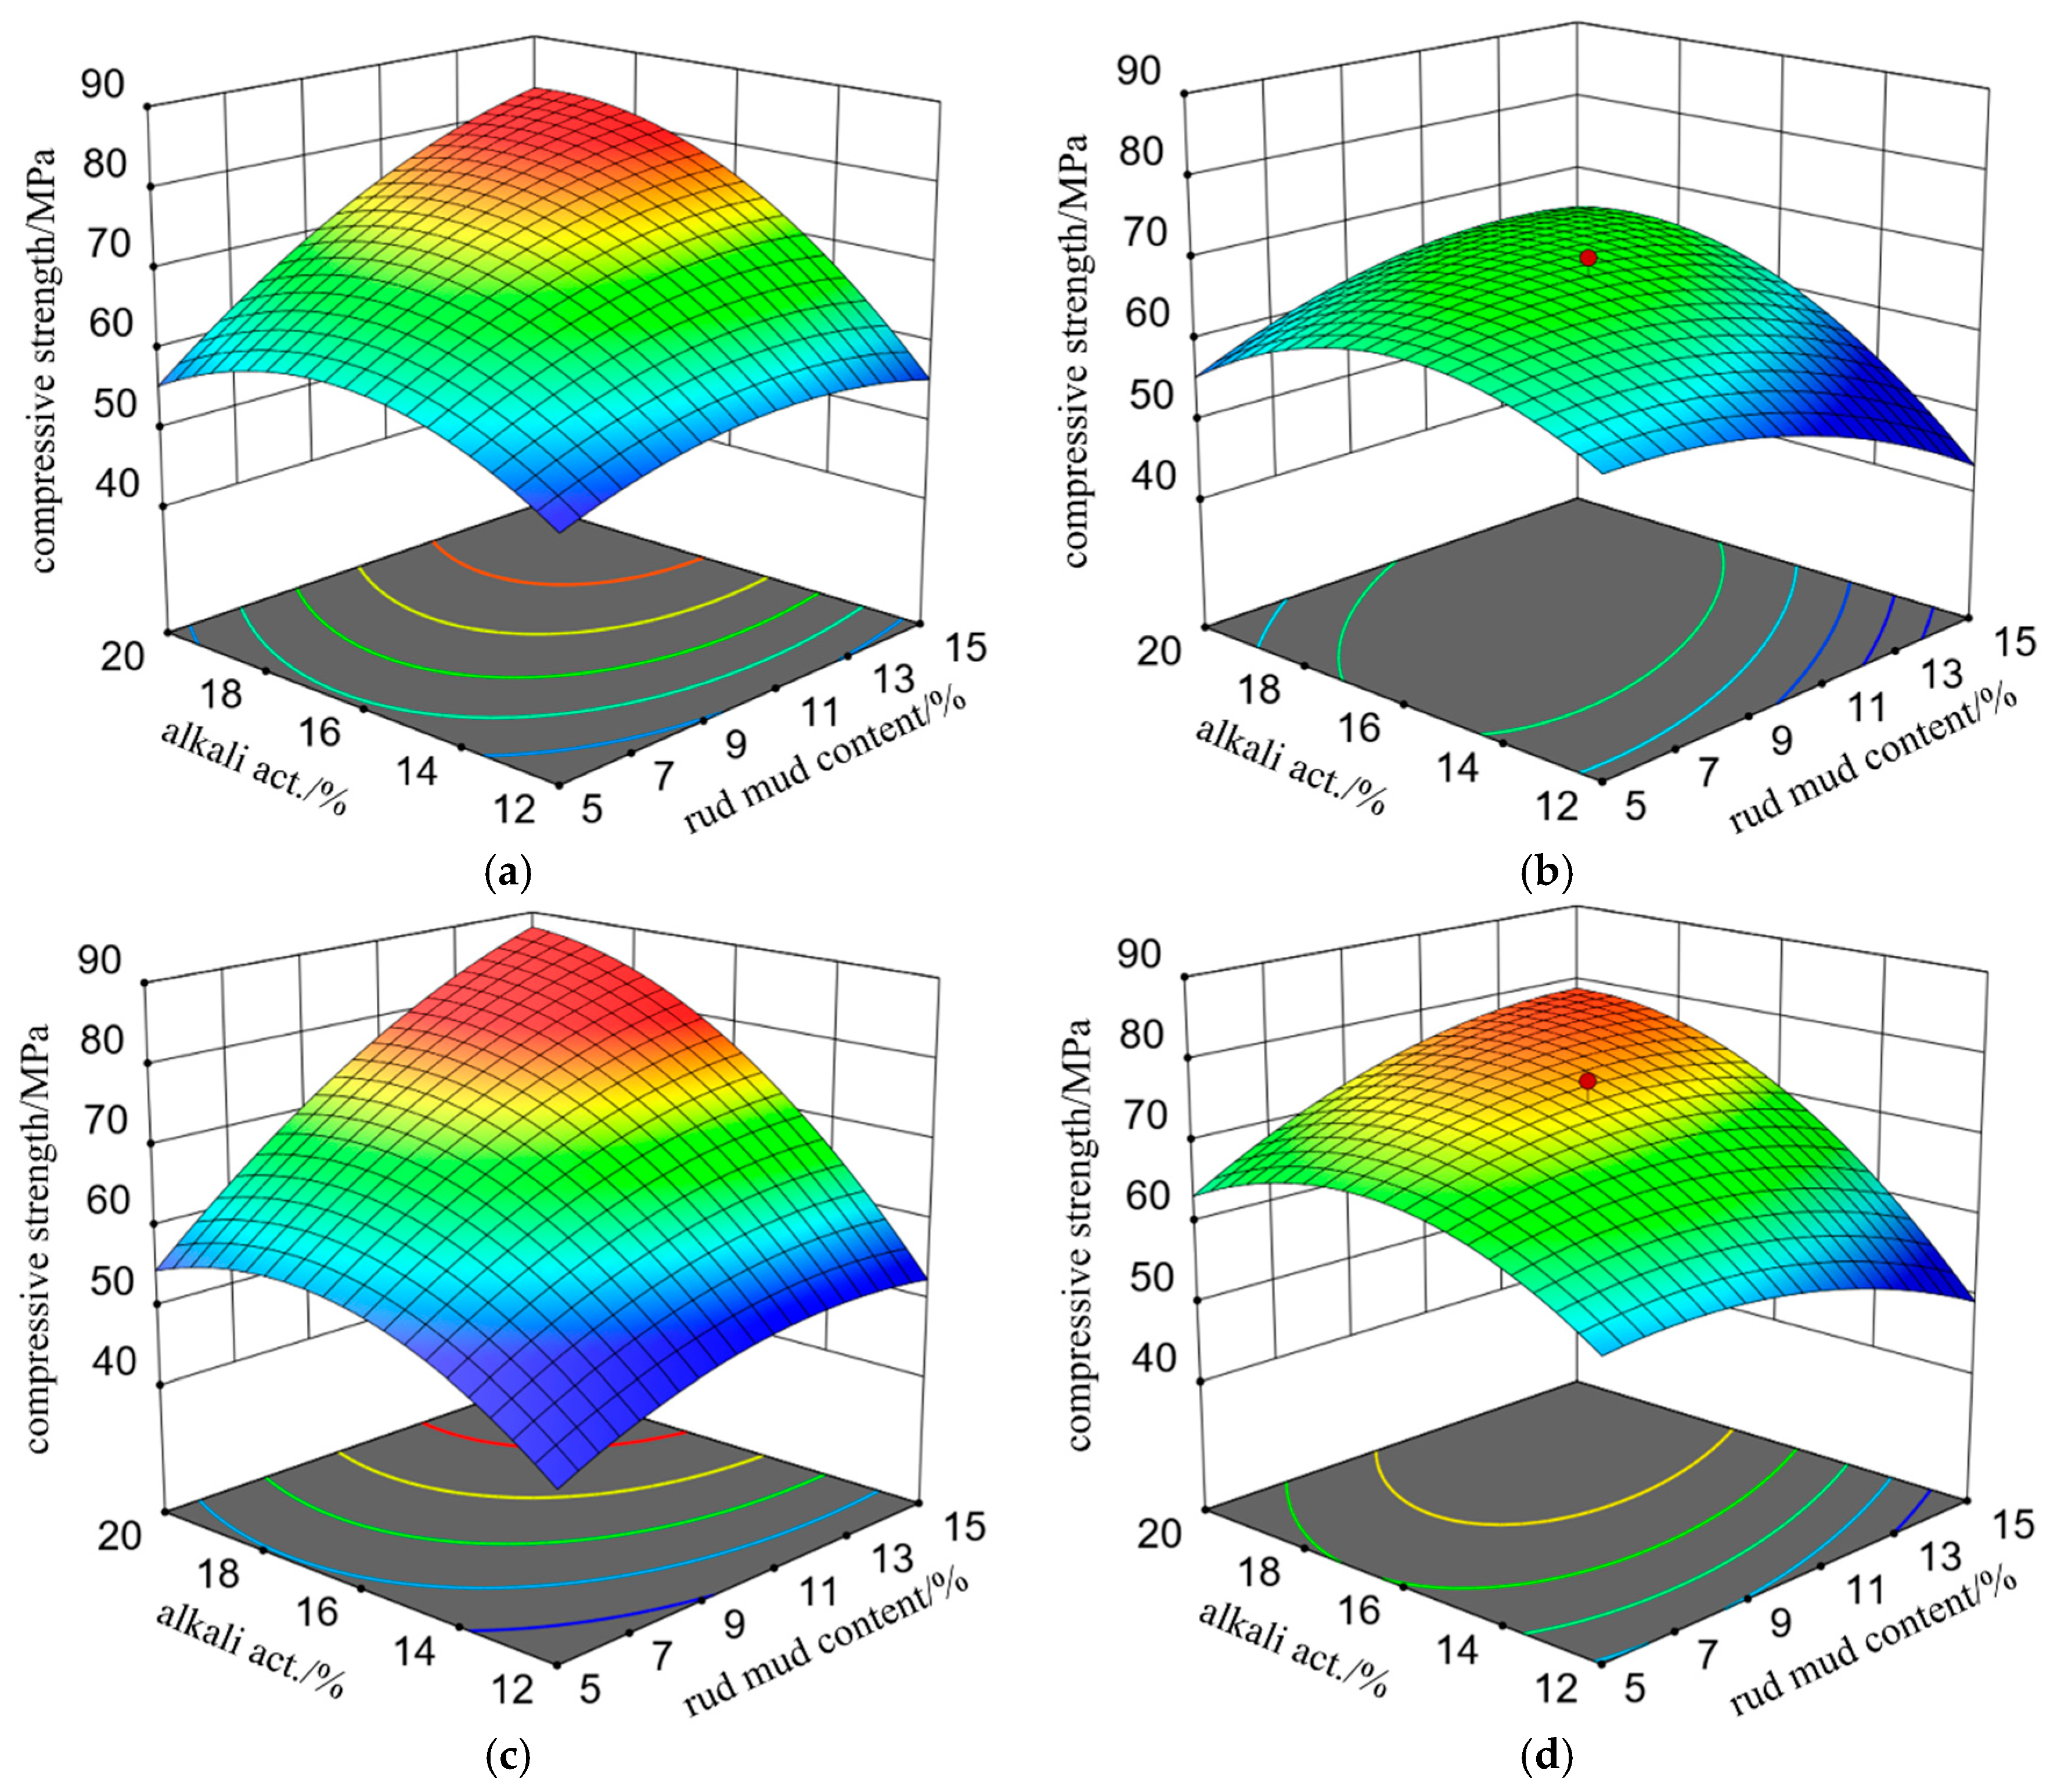
3.3. Analysis of Factors Influencing Mechanical Properties
3.3.1. Flexural Strength Analysis
3.3.2. Compressive Strength Analysis
3.4. Microstructural Analysis
3.4.1. XRD Analysis
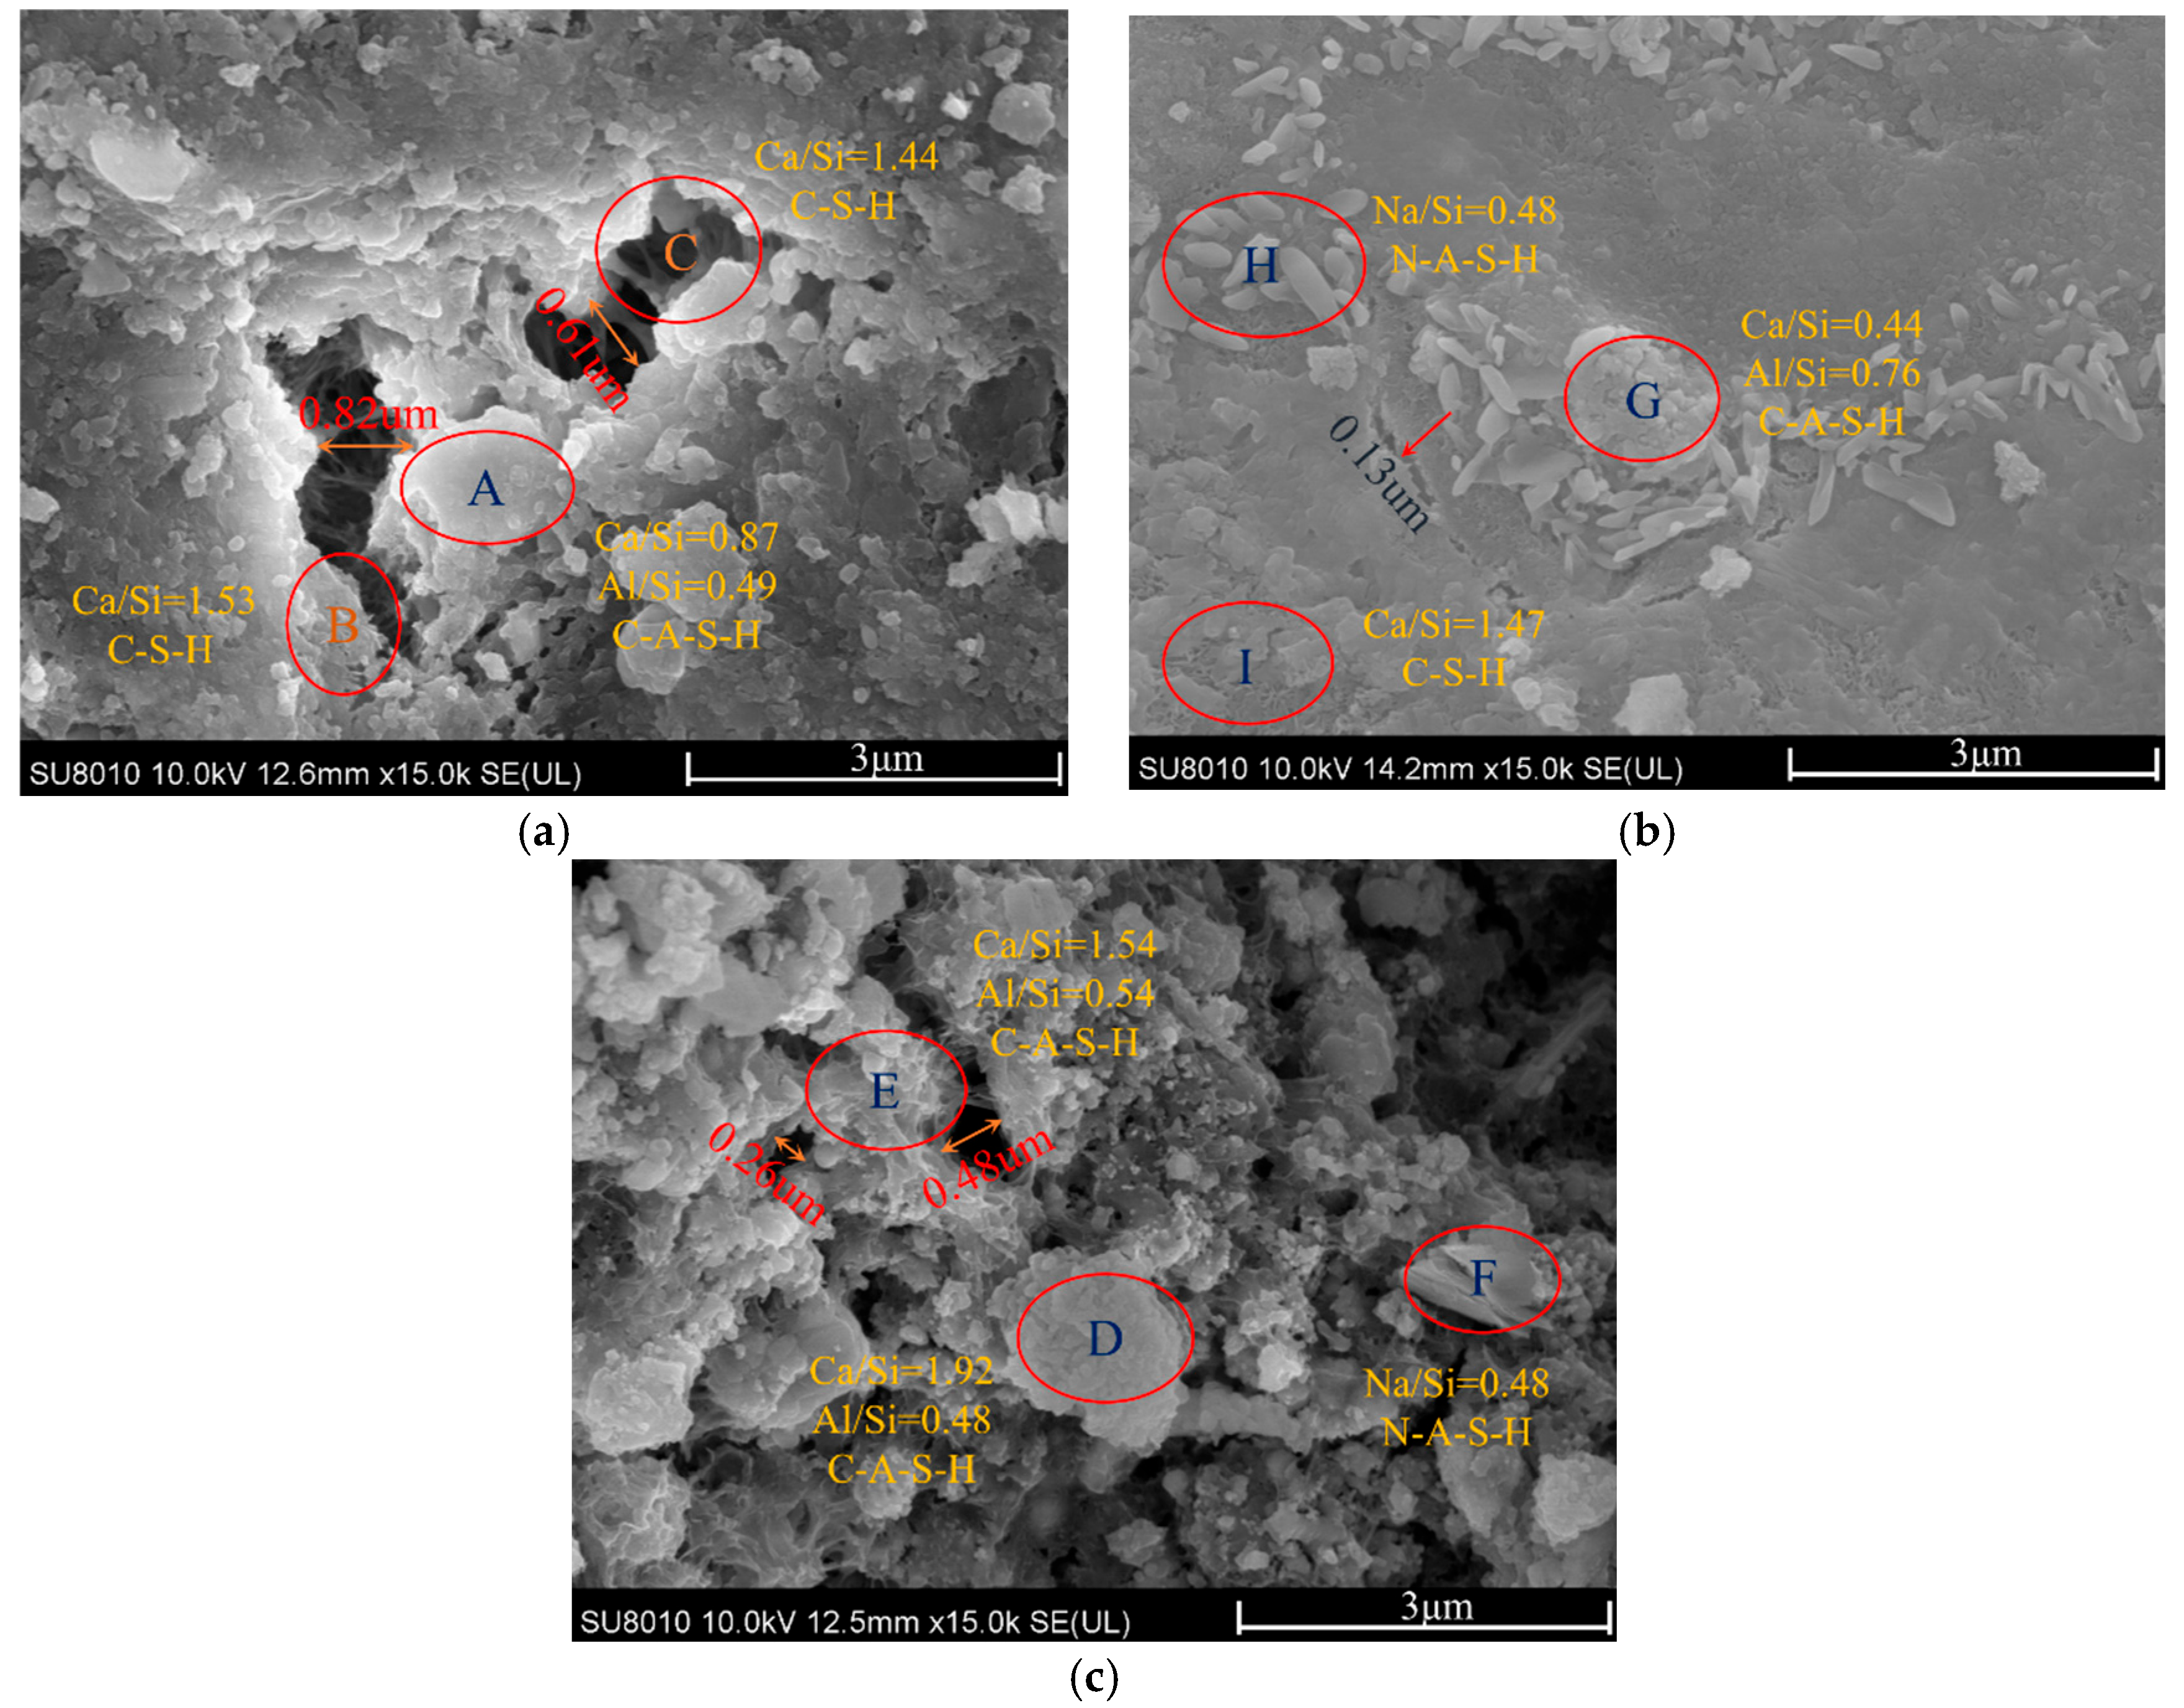
3.4.2. SEM Analysis
4. Conclusions
- The Box–Behnken response surface design was employed to optimize the red mud–slag powder composite cementitious material. The results showed that the content of red mud and the content of alkali activator were the main factors influencing the compressive strength and flexural strength. The established response surface regression model exhibited high prediction accuracy and excellent fitting performance, and could effectively guide the optimization of actual mix proportions.
- Under the conditions of a fiber content of 0 vol.% and a calcination temperature of 850 °C, when the content of red mud is 10% and the content of alkali activator is 16%, the flexural strength and compressive strength of the specimens reach 12.26 MPa and 69.83 MPa, respectively. Compared with other combinations, the comprehensive performance has been significantly enhanced, which demonstrates that there is a synergistic strengthening effect between the raw material ratios of red mud and mineral powder and the activation conditions.
- The hydration reaction of the alkali-activated red mud–slag powder composite material intensifies continuously with the progression of the age. In the early stage, the hydration products consist of a small amount of C-S-H and C-A-S-H gels. As time goes on, they gradually transform into a dense structure mainly composed of analcime and geopolymer gels. These products effectively fill the pores and cracks, significantly improving the compactness and microscopic uniformity of the material. This provides a solid microscopic basis for the enhancement of the material’s mechanical properties in the later stage.
- Through comparative analysis with traditional Portland cement, it is found that for the red mud–mineral powder composite cementitious material, its carbon emission per unit product can be reduced by 44.3% compared with that of traditional Portland cement, and the heat energy consumption can be reduced by more than 36.6%. Preliminary cost estimation shows that the production cost of this material is about 47.6% lower than that of ordinary cement, demonstrating good economic efficiency and potential for engineering promotion. For detailed comparison, see Appendix A.
Author Contributions
Funding
Data Availability Statement
Acknowledgments
Conflicts of Interest
Nomenclature
| REM | Response Surface Methodology |
| C-S-H Gel | Calcium Silicate Hydrate Gel |
| C-A-S-H Gel | Calcium Aluminosilicate Hydrate Gel |
| N-A-S-H Gel | Sodium Aluminosilicate Hydrate Gel |
| XRD | X-ray Diffraction |
| SEM | Scanning Electron Microscope |
| EDS | Energy Dispersive Spectroscopy |
| ITZ | Interfacial Transition Zone |
Appendix A. Quantitative Analysis of Environmental Benefits of Red Mud–Mineral Powder Composite Cementitious Material
| Indicator Category | Traditional Cementitious Material (P.O42.5) | Red Mud–Mineral Powder Composite Cementitious Material (this study) | Relative Difference or Savings Ratio | Data Source and Explanation |
| CO2 Emissions (kg/t) | 995.54 | 554.2 | Decrease by approximately 44.3% | Experimental estimation |
| Thermal Energy Consumption (MJ/t) | 1197 | 759 | Decrease by approximately 36.6% | Clinker calcination at 1450 °C vs. red mud calcination at 850 °C |
| Material Cost (Yuan/t) | 420 | 220 | Decrease by approximately 47.6% | Red mud and mineral powder are industrial by-products with low purchase prices |
| Raw Material Carbon Footprint | High | Low | Significant advantage | Red mud from zero-carbon sources; mineral powder as blast furnace by-product |
| Industrial Waste Utilization Rate | None | Red mud (30–40%) and mineral powder (30–50%) | Significant improvement | Improve resource utilization rate |
References
- Li, J.; Zheng, F.Q.; Jing, T. Inhibition Mechanism of Liquid Phase Generation in the Calcification and Reduction Process of High-Speed Railway Red Mud. Sinter. Pelletizing 2024, 49, 88–95. [Google Scholar]
- Sun, Z.; Tao, Z.; Li, H.; Pittman, A.S.; Zhou, F.; Zhang, G.; Wu, J.; Cheng, H.; Feng, E.; Chen, Z.; et al. Recovery of rare earth elements, gallium and germanium from fly ash and red mud via ultra-fast flash Joule heating. Chem. Eng. Sci. 2025, 315, 121879. [Google Scholar] [CrossRef]
- Peng, F.G.; Wang, F.X.; Ding, H.; Jia, Y.J. Effect of calcined red mud on the mechanical properties and microstructure of ultra-high performance concrete. Constr. Build. Mater. 2025, 484, 141891. [Google Scholar] [CrossRef]
- Rashidian, S.; Hosseini, A.S.; Korandeh, E.M. Investigation of red mud effects on microsurfacing asphalt performance: Quality enhancement and industrial waste reduction. Constr. Build. Mater. 2025, 483, 141798. [Google Scholar] [CrossRef]
- Zhang, J.F. Analysis of the Resource Utilization Process of Bayer Process Alumina Red Mud. Metall. Mater. 2025, 45, 34–36. [Google Scholar]
- Li, J.H.; Wang, X.T.; Liu, L.L. Guiding Opinions on the Comprehensive Utilization of Bulk Solid Waste during the 14th Five-Year Plan Period. Gold Sci. Technol. 2021, 29, 286. [Google Scholar]
- Tsakiridis, P.E.; Agatzini-Leonardou, S.; Oustadakis, P. Red mud addition in the raw meal for the production of Portland cement clinker. J. Hazard. Mater. 2004, 116, 103–110. [Google Scholar] [CrossRef]
- Zhu, X.; Li, W.; Zhao, H.; Zhang, C. Selective dealkalization of red mud using calcium oxide with pressure leaching. JOM 2018, 2018 70, 2800–2806. [Google Scholar]
- He, M.D.; Huang, P.; Lu, Q. Practice of Producing Cement Clinker by Using Red Mud as a Substitute for Iron Ore in Raw Materials. Sichuan Cem. 2014, 2014, 33–34. [Google Scholar]
- Garanayak, L. Strength effect of alkali activated red mud slag cement in ambient condition. Mater. Today Proc. 2021, 44, 1437–1443. [Google Scholar] [CrossRef]
- Zhao, Y.R.; Chen, P.; Wei, H.J. Preparation of belite-sulfoaluminate cement using fly ash and red mud from the Bayer process. J. Guilin Univ. Technol. 2015, 35, 581–584. [Google Scholar]
- Ren, C.; Wang, W.; Mao, Y.; Yuan, X.; Song, Z.; Sun, J.; Zhao, X. Comparative life cycle assessment of sulfoaluminate clinker production derived from industrial solid wastes and conventional raw materials. J. Clean. Prod. 2017, 167, 1314–1324. [Google Scholar] [CrossRef]
- Liu, J.H.; Zhou, Z.B.; Wu, A.X. Preparation and hydration mechanism of low-concentration Bayer red mud filling materials. J. Eng. Sci. 2020, 42, 1457–1464. [Google Scholar]
- Liu, J.; Li, Z.L.; Zhang, W.Z. Research Progress on the Preparation of Cold-Bonded Artificial Lightweight Aggregates from Industrial Solid Waste Materials. Mater. Rev. 2023, 37, 131–148. [Google Scholar]
- He, A.P.; Xiong, Y.X. Application of Industrial Solid Waste in Concrete. Resources, Environ. Eng. 2013, 27, 78–81. [Google Scholar]
- Ruan, Z.Y.; Wu, P.J.; Wu, A.X. Optimization of Proportions and Hydration Mechanism of Early-Strong Cementitious Materials Based on Refining Slag for Mining. Chin. J. Nonferrous Met. 2023, 33, 3064–3076. [Google Scholar]
- Ren, G.; Wu, H.; Fang, Q.; Liu, J.Z. Effects of steel fiber content and type on static mechanical properties of UHPCC. Constr. Build. Mater. 2018, 163, 826–839. [Google Scholar] [CrossRef]
- Banthia, N.; Gupta, R. Influence of polypropylene fiber geometry on plastic shrinkage cracking in concrete. Cem. Concr. Res. 2006, 36, 1263–1267. [Google Scholar] [CrossRef]
- GB/T 17671-2021; Test Method for Compressive Strength of Cement Mortar. ISO Method: Geneva, Switzerland, 2021.
- ISO 679:2009; Cement–Test Methods–Determination of Strength. International Organization for Standardization: Geneva, Switzerland, 2009.
- Zhou, M.; Bai, J.T.; Guo, L.Z.; Zhang, Y. Optimization of Grouting Material Proportion of Coal Gangue Geopolymer Based on Response Surface Methodology. Mater. Rep. 2023, 37, 123–131. (In Chinese) [Google Scholar]
- Kockal, U.N.; Ozturan, T. Optimization of properties of fly ash aggregates for high-strength lightweight concrete production. Mater. Des. 2011, 32, 3586–3593. [Google Scholar] [CrossRef]
- Teng, L.M.; Zhang, Q.; Wu, J.; Song, Y.C.; Xu, Y.; Liu, J.; Wang, H.T.; Zhao, Y.; Chen, L.; Li, X.; et al. Optimization of response surface methodology for the synthesis NaP type zeolite from cinder. J. Funct. Mater. 2022, 53, 8214–8220. (In Chinese) [Google Scholar]
- Yuan, X.; Shi, Y.; Chen, Y.; Yuan, X.H.; Guan, H.; Lu, F.; Chen, X. Effect of Steel Fiber Content on Mechanical Properties of Alkali-Slag Concrete. J. Xinyang Norm. Univ. (Nat. Sci. Ed.) 2023, 36, 656–662. [Google Scholar]
- Zhu, X.; Qian, C.; He, B. Experimental study on the stability of CSH nanostructures with varying bulk CaO/SiO2 ratios under cryogenic attack. Cem. Concr. Res. 2020, 135, 106114. [Google Scholar] [CrossRef]
- Salami, B.A.; Maslehuddin, M.; Johari, M.A.M.; Mohamed, H.D.; Ahmad, Z.A. Effect of alkaline activator ratio on the compressive strength response of POFA-EACC mortar subjected to elevated temperature. Mater. High Temp. 2021, 38, 166–176. [Google Scholar] [CrossRef]


| Serial Number | Material | Enterprise | Location |
|---|---|---|---|
| 1 | Red mud | Shandong Weiqiao Aluminum Co., Ltd. | Binzhou, China |
| 2 | Slag powder | Tang County Xinlei Mineral Powder Processing Plant | Baoding, China |
| 3 | Water glass | Nantong Yourui Building Materials Trading Co., Ltd. | Nantong, China |
| 4 | NaOH | Xilong Scientific Co., Ltd. | Shantou, China |
| Type | SiO2 | Al2O3 | Fe2O3 | Na2O | SO3 | TiO2 | CaO | MgO | K2O | Others |
|---|---|---|---|---|---|---|---|---|---|---|
| Red mud | 15.30 | 25.32 | 41.02 | 11.03 | 0.68 | 5.21 | 0.56 | 0.17 | 0.18 | 0.53 |
| Slag powder | 31.75 | 18.94 | - | 0.62 | - | 0.98 | 33.15 | 10.32 | 0.38 | 3.86 |
| Type of Fiber | Length/mm | Diameter/mm | Length Diameter Ratio L/d | Density/(g.cm−3) | Elastic Modulus/GPa | Tensile Strength/MPa |
|---|---|---|---|---|---|---|
| SS | 14 | 0.2 | 63 | 7.8 | 201 | ≥2700 |
| Modulus | Na2O | SiO2 | pH | Density(g/cm3) | Baumé Degree/(°Be) |
|---|---|---|---|---|---|
| 3.26 | 8.53 | 26.98 | 10~13 | 5.42 | 38.5 |
| Serial Number | Name | Model | Manufacturer | Location |
|---|---|---|---|---|
| 1 | Electronic Balance | HZ-20003 | Kunshan Hua’e Electronic Technology Co., Ltd. | Kunshan, China |
| 2 | Planetary Ball Mill | YXQM | Changsha Mimi Instrument Equipment Co., Ltd. | Changsha, China |
| 3 | Muffle Furnace | SX2-18-12A | Shaoxing Daoxu Yanguang Instrument Equipment Factory | Shaoxing, China |
| 4 | Constant Temperature and Humidity Curing Chamber | GH | Guangheng Sibo Testing Equipment Co., Ltd. | Shanghai, China |
| 5 | Constant Loading Pressure Testing Machine | TYA-2000A | Wuxi Jianyi Laboratory Equipment Co., Ltd. | Wuxi, China |
| 6 | Electric Hot Air Drying Oven | SN-101-4B | Shangyi Scientific Instruments Co., Ltd. | Shaoxing, China |
| 7 | Vibration Table | HZJ-A | Hebei Junyi Instrument Factory | Cangzhou, China |
| 8 | Mixer | JJ-5 | Shangyu Yueda Instrument Factory | Shaoxing, China |
| 9 | X-ray Diffractometer | D/MAX-IIIA | Dandong Haoyuan Instrument Co., Ltd. | Dandong, China |
| 10 | Scanning Electron Microscope | HITACHI-SU8010 | Nisshin Science Instruments Co., Ltd. | Guangzhou, Japan |
| Group Number | Factors | Test Results | ||||
|---|---|---|---|---|---|---|
| The Dosage of Red Mud/% (A) | End-Hook Copper-Plated Steel Fiber /vol.% (B) | Dosage of Alkali Activator /% (C) | The Calcination Temperature of Red Mud /°C (D) | 28-Day Compressive Strength /MPa (Y1) | 28-Day Flexural Strength /MPa (Y2) | |
| 1 | 15 | 1.5 | 16 | 750 | 75.19 | 7.86 |
| 2 | 15 | 0.75 | 16 | 650 | 77.07 | 7.88 |
| 3 | 10 | 0 | 16 | 850 | 69.83 | 12.26 |
| 4 | 10 | 0.75 | 16 | 750 | 74.16 | 11.85 |
| 5 | 10 | 0 | 20 | 750 | 69.08 | 6.25 |
| 6 | 10 | 1.5 | 16 | 650 | 70.89 | 11.14 |
| 7 | 5 | 0.75 | 20 | 750 | 57.94 | 6.72 |
| 8 | 15 | 0.75 | 16 | 850 | 65.56 | 8.38 |
| 9 | 10 | 0.75 | 20 | 650 | 76.29 | 7.3 |
| 10 | 10 | 1.5 | 16 | 850 | 77.14 | 13.26 |
| 11 | 10 | 0 | 12 | 750 | 56.08 | 8.88 |
| 12 | 5 | 0.75 | 12 | 750 | 54.18 | 8.7 |
| 13 | 10 | 0.75 | 16 | 750 | 73.56 | 11.13 |
| 14 | 10 | 0.75 | 12 | 850 | 56.55 | 9.36 |
| 15 | 5 | 0 | 16 | 750 | 67.44 | 9.63 |
| 16 | 10 | 0 | 16 | 650 | 72.43 | 9.76 |
| 17 | 10 | 0.75 | 16 | 750 | 76.91 | 12.12 |
| 18 | 5 | 1.5 | 16 | 750 | 66.79 | 15.03 |
| 19 | 10 | 1.5 | 20 | 750 | 75.43 | 8.9 |
| 20 | 5 | 0.75 | 16 | 650 | 58.93 | 9.26 |
| 21 | 15 | 0 | 16 | 750 | 69.93 | 10.51 |
| 22 | 15 | 0.75 | 20 | 750 | 82.93 | 5.38 |
| 23 | 15 | 0.75 | 12 | 750 | 54.42 | 6.9 |
| 24 | 10 | 0.75 | 16 | 750 | 72.65 | 11.34 |
| 25 | 5 | 0.75 | 16 | 850 | 65.38 | 11.18 |
| 26 | 10 | 0.75 | 16 | 750 | 70.61 | 12.04 |
| 27 | 10 | 1.5 | 12 | 750 | 54.53 | 9.56 |
| 28 | 10 | 0.75 | 20 | 850 | 69.06 | 6.96 |
| 29 | 10 | 0.75 | 12 | 650 | 57.94 | 7.84 |
| Variation Source | Sum of Squares | Degrees of Freedom | Mean Square | F-Value | p-Value | |||||
|---|---|---|---|---|---|---|---|---|---|---|
| y1 | y2 | y1 | y2 | y1 | y2 | y1 | y2 | y1 | y2 | |
| Model | 142.74 | 1813.94 | 14 | 14 | 10.20 | 129.57 | 28.09 | 19.42 | <0.0001 | <0.0001 |
| A | 15.44 | 246.98 | 1 | 1 | 15.44 | 246.98 | 42.53 | 37.02 | <0.0001 | <0.0001 |
| B | 5.96 | 19.2 | 1 | 1 | 5.96 | 19.2 | 16.43 | 2.88 | 0.0012 | 0.1119 |
| C | 7.89 | 784.57 | 1 | 1 | 7.89 | 784.57 | 21.74 | 117.61 | 0.0004 | <0.0001 |
| D | 5.63 | 8.38 | 1 | 1 | 5.63 | 8.38 | 15.51 | 1.26 | 0.0015 | 0.2811 |
| AB | 16.20 | 8.73 | 1 | 1 | 16.20 | 8.73 | 44.64 | 1.31 | <0.0001 | 0.2718 |
| AC | 0.0529 | 153.14 | 1 | 1 | 0.0529 | 153.14 | 0.1458 | 22.96 | 0.7084 | 0.0003 |
| AD | 0.5041 | 80.64 | 1 | 1 | 0.5041 | 80.64 | 1.39 | 12.09 | 0.2582 | 0.0037 |
| BC | 0.9702 | 15.6 | 1 | 1 | 0.9702 | 15.6 | 2.67 | 2.34 | 0.1243 | 0.1485 |
| BD | 0.0361 | 19.58 | 1 | 1 | 0.0361 | 19.58 | 0.0995 | 2.94 | 0.7571 | 0.1087 |
| CD | 0.8649 | 8.53 | 1 | 1 | 0.8649 | 8.53 | 2.38 | 1.28 | 0.1450 | 0.2772 |
| A2 | 15.39 | 105.23 | 1 | 1 | 15.39 | 105.23 | 42.39 | 15.77 | <0.0001 | 0.0014 |
| B2 | 1.10 | 1.05 | 1 | 1 | 1.10 | 1.05 | 3.02 | 0.1577 | 0.1041 | 0.6973 |
| C2 | 73.89 | 409.34 | 1 | 1 | 73.89 | 409.34 | 203.59 | 61.36 | <0.0001 | <0.0001 |
| D2 | 2.71 | 12.07 | 1 | 1 | 2.71 | 12.07 | 7.47 | 1.81 | 0.0162 | 0.2 |
| Response Value | R2 | R2adj | R2pred | C.V./% | Signal-to-Noise Ratio |
|---|---|---|---|---|---|
| 7d Flexural Strength (y1) | 0.9656 | 0.9313 | 0.8238 | 6.30 | 21.8521 |
| 7d Compressive Strength (y2) | 0.9510 | 0.9021 | 0.7644 | 3.80 | 15.3677 |
| Age Period | Region | O | Fe | Si | Ca | AI | Na | C | Mg | S | K |
|---|---|---|---|---|---|---|---|---|---|---|---|
| 3-day | A | 30.50 | 40.87 | 9.93 | 8.68 | 4.89 | 2.52 | 1.68 | 0.41 | 0.35 | 0.17 |
| B | 19.50 | 1.88 | 26.58 | 40.80 | 5.63 | 1.97 | 1.53 | 0.23 | 1.06 | 0.82 | |
| C | 6.06 | 32.61 | 22.24 | 32.08 | 4.22 | 0.65 | 0.15 | 0.15 | 1.17 | 0.67 | |
| 7-day | D | 23.10 | 15.34 | 11.21 | 21.63 | 5.41 | 1.90 | 3.60 | 0.43 | 1.68 | 0.70 |
| E | 11.26 | 41.53 | 12.94 | 19.91 | 6.97 | 0.36 | 4.91 | 0.37 | 0.73 | 1.02 | |
| F | 9.24 | 43.69 | 10.06 | 17.87 | 6.35 | 4.84 | 5.11 | 0.38 | 0.23 | 2.23 | |
| 28-day | G | 48.96 | 9.35 | 14.90 | 6.53 | 11.31 | 5.78 | 2.01 | 0.31 | 0.55 | 0.3 |
| H | 39.65 | 0.60 | 17.08 | 21.42 | 4.53 | 11.06 | 3.43 | 1.04 | 0.65 | 0.55 | |
| I | 47.99 | 0.68 | 12.87 | 18.98 | 3.03 | 9.65 | 6.17 | 0.16 | 0.09 | 0.38 |
Disclaimer/Publisher’s Note: The statements, opinions and data contained in all publications are solely those of the individual author(s) and contributor(s) and not of MDPI and/or the editor(s). MDPI and/or the editor(s) disclaim responsibility for any injury to people or property resulting from any ideas, methods, instructions or products referred to in the content. |
© 2025 by the authors. Licensee MDPI, Basel, Switzerland. This article is an open access article distributed under the terms and conditions of the Creative Commons Attribution (CC BY) license (https://creativecommons.org/licenses/by/4.0/).
Share and Cite
Yang, C.; Zeng, Q.; Hu, J.; Zhu, W. Study on Performance Optimization of Red Mud–Mineral Powder Composite Cementitious Material Based on Response Surface Methodology. Buildings 2025, 15, 2339. https://doi.org/10.3390/buildings15132339
Yang C, Zeng Q, Hu J, Zhu W. Study on Performance Optimization of Red Mud–Mineral Powder Composite Cementitious Material Based on Response Surface Methodology. Buildings. 2025; 15(13):2339. https://doi.org/10.3390/buildings15132339
Chicago/Turabian StyleYang, Chao, Qiang Zeng, Jun Hu, and Wenbo Zhu. 2025. "Study on Performance Optimization of Red Mud–Mineral Powder Composite Cementitious Material Based on Response Surface Methodology" Buildings 15, no. 13: 2339. https://doi.org/10.3390/buildings15132339
APA StyleYang, C., Zeng, Q., Hu, J., & Zhu, W. (2025). Study on Performance Optimization of Red Mud–Mineral Powder Composite Cementitious Material Based on Response Surface Methodology. Buildings, 15(13), 2339. https://doi.org/10.3390/buildings15132339