1. Introduction
In arid and semi-arid regions, soil cracking has always been a concern, as it can lead to deterioration in the soil mechanical properties, which not only threatens engineering projects but also triggers geological disasters [
1,
2]. After the soil cracks, the various properties of the soil mass will change, including the mechanical, hydrological, physical, chemical, and thermal properties, which can, in some cases, lead to a multitude of engineering problems. For instance, on mountain slopes, soil cracking can undermine the overall stability and weathering resistance of such slopes. In a rainy environment, rainwater will accelerate its infiltration into the interior of the slope through cracks on the slope surface, expediting soil softening and causing the internal water content of the soil to quickly reach saturation, as shown in
Figure 1, thereby inducing geological disasters such as collapses, landslides, and debris flows [
3,
4].
Clay is prone to cracking in high-temperature environments, as the soil remains in a balanced stress state due to water movement, and the escape of water leads to unbalanced contraction of the internal structure, inducing surface cracks [
5,
6,
7]. In actual working conditions, the complex frictional effects among soil particles can hinder the complete development of free shrinkage. This cracking phenomenon will significantly reduce the soil strength index and trigger a series of engineering problems, including house cracking, land salinization, slope instability, and foundational instability [
8]. It is particularly worth noting that the low permeability and low conductivity of the clay anti-seepage layer may completely fail due to the development of cracks. The essence of this natural phenomenon lies in the stress redistribution during the drying shrinkage process. An in-depth understanding of this process is crucial for engineering risk assessment, as cracks can significantly alter the soil–water interaction mechanism and affect the dynamic balance of infiltration and evaporation [
9,
10]. Conversely, due to the good anti-seepage performance of clay, in the field of environmental geotechnical engineering, clay materials are widely used in anti-seepage lining systems (such as tailings ponds, landfill sites, etc.) [
11,
12,
13]. However, soil cracking can damage the anti-seepage performance and electrical conductivity of the soil structure. With this, the development of cracks will lead to an order of magnitude increase in the permeability coefficient, resulting in the failure of the barrier system function. In addition, geological factors, such as the material properties of rocks (such as material anisotropy), the initial stress field, whether there are natural crack zones in the rock mass, the geometric shape of the tunnel, and the hydrogen and oxygen states present in the tunnel, can also affect the crack propagation law [
14]. This enhanced permeability may endanger the safe operation of key infrastructure such as dams and embankments. In addition, compressive deformation problems caused by a decline in bearing capacity pose a serious threat to civil engineering structures [
15,
16].
In the context of global climate change, natural disasters are occurring with greater frequency, particularly in northern China, where the impact of drought is incredibly widespread, such as in agriculture, engineering, and soil construction [
17,
18,
19,
20]. Soil cracking is a common tensile failure form on the surface, and its formation mechanism is closely related to the tensile behavior during the drying process. Understanding the tensile behavior of soil during the drying process is of great significance for determining the mechanism of soil drying cracks [
21,
22,
23]. The study of this process has significant guiding value for engineering practice, especially in the context of frequent extreme climates. Cohesive soil has significant water-sensitive characteristics, and its engineering properties change dramatically with the variation in moisture content. Current dryness trends add to the particularly urgent need to study the drying shrinkage mechanism of clay. If shrinkage and deformation are allowed to develop unchecked, a continuous crack network will form, completely altering the multi-field coupling characteristics of the soil. The majority of existing studies are limited to the analysis of the constitutive relationship of soil [
24,
25,
26,
27]. However, this study focuses on the soil in the arid areas of Xinjiang. Laboratory experiments were performed by controlling boundary conditions (using curved/straight constraints), and the evolution law of cracks was quantitatively characterized through the use of digital image processing technology, providing a theoretical basis for engineering protection in arid areas.
The soil samples used in our experiment were obtained from the arid areas of Xinjiang and subjected to indoor experimental studies to investigate the characteristics of dry soil cracks. Cracks in the soil that are light yellow in color, have no obvious odor or inclusions, and are caused by the various changes in humidity inside and outside the soil, and the uneven evaporation of water are referred to as dry cracks. Curved and straight containers were used as different boundary conditions to test the samples. Subsequently, the crack characteristics were assessed based on the change in water loss. The development of cracks was quantitatively analyzed through the use of digital image processing technology. Lastly, we explored the influence of boundary type on soil drying and cracking characteristics in the arid areas of Xinjiang.
2. Materials and Methods
2.1. Materials
The soil used in this experiment was obtained from the suburbs of Urumqi, Xinjiang Uygur Autonomous Region, China. The soil was light yellow in color and had no obvious odor or inclusions. The Xinjiang Uygur Autonomous Region has a warm, temperate continental arid climate, with four distinct seasons. Its monthly average temperature changes are shown in
Figure 2. The region experiences vast amounts of sunlight. Due to hydrogeological conditions, rock and soil in the area have been eroded and transported over many years, making the geology hard and stable, with significant stratum endurance. Under the influence of crustal movement, the geological conditions are complex. So as to avoid the undue influence of surface impurities on the soil samples used in the experiment, the sampling depth used in this test was about 0.5–1.0 m. The soil quality was relatively pure and belonged to the yellowish-brown clay widely distributed in this area. After the soil samples used in the test were collected, they were placed in pre-prepared sealed bags to prevent loss of moisture during transportation, a factor that may affect the preparation and determination of the initial moisture content of the soil samples. The soil samples were then transported to the laboratory for analysis, and their basic properties were determined immediately, including parameters such as density and moisture content (
Table 1).
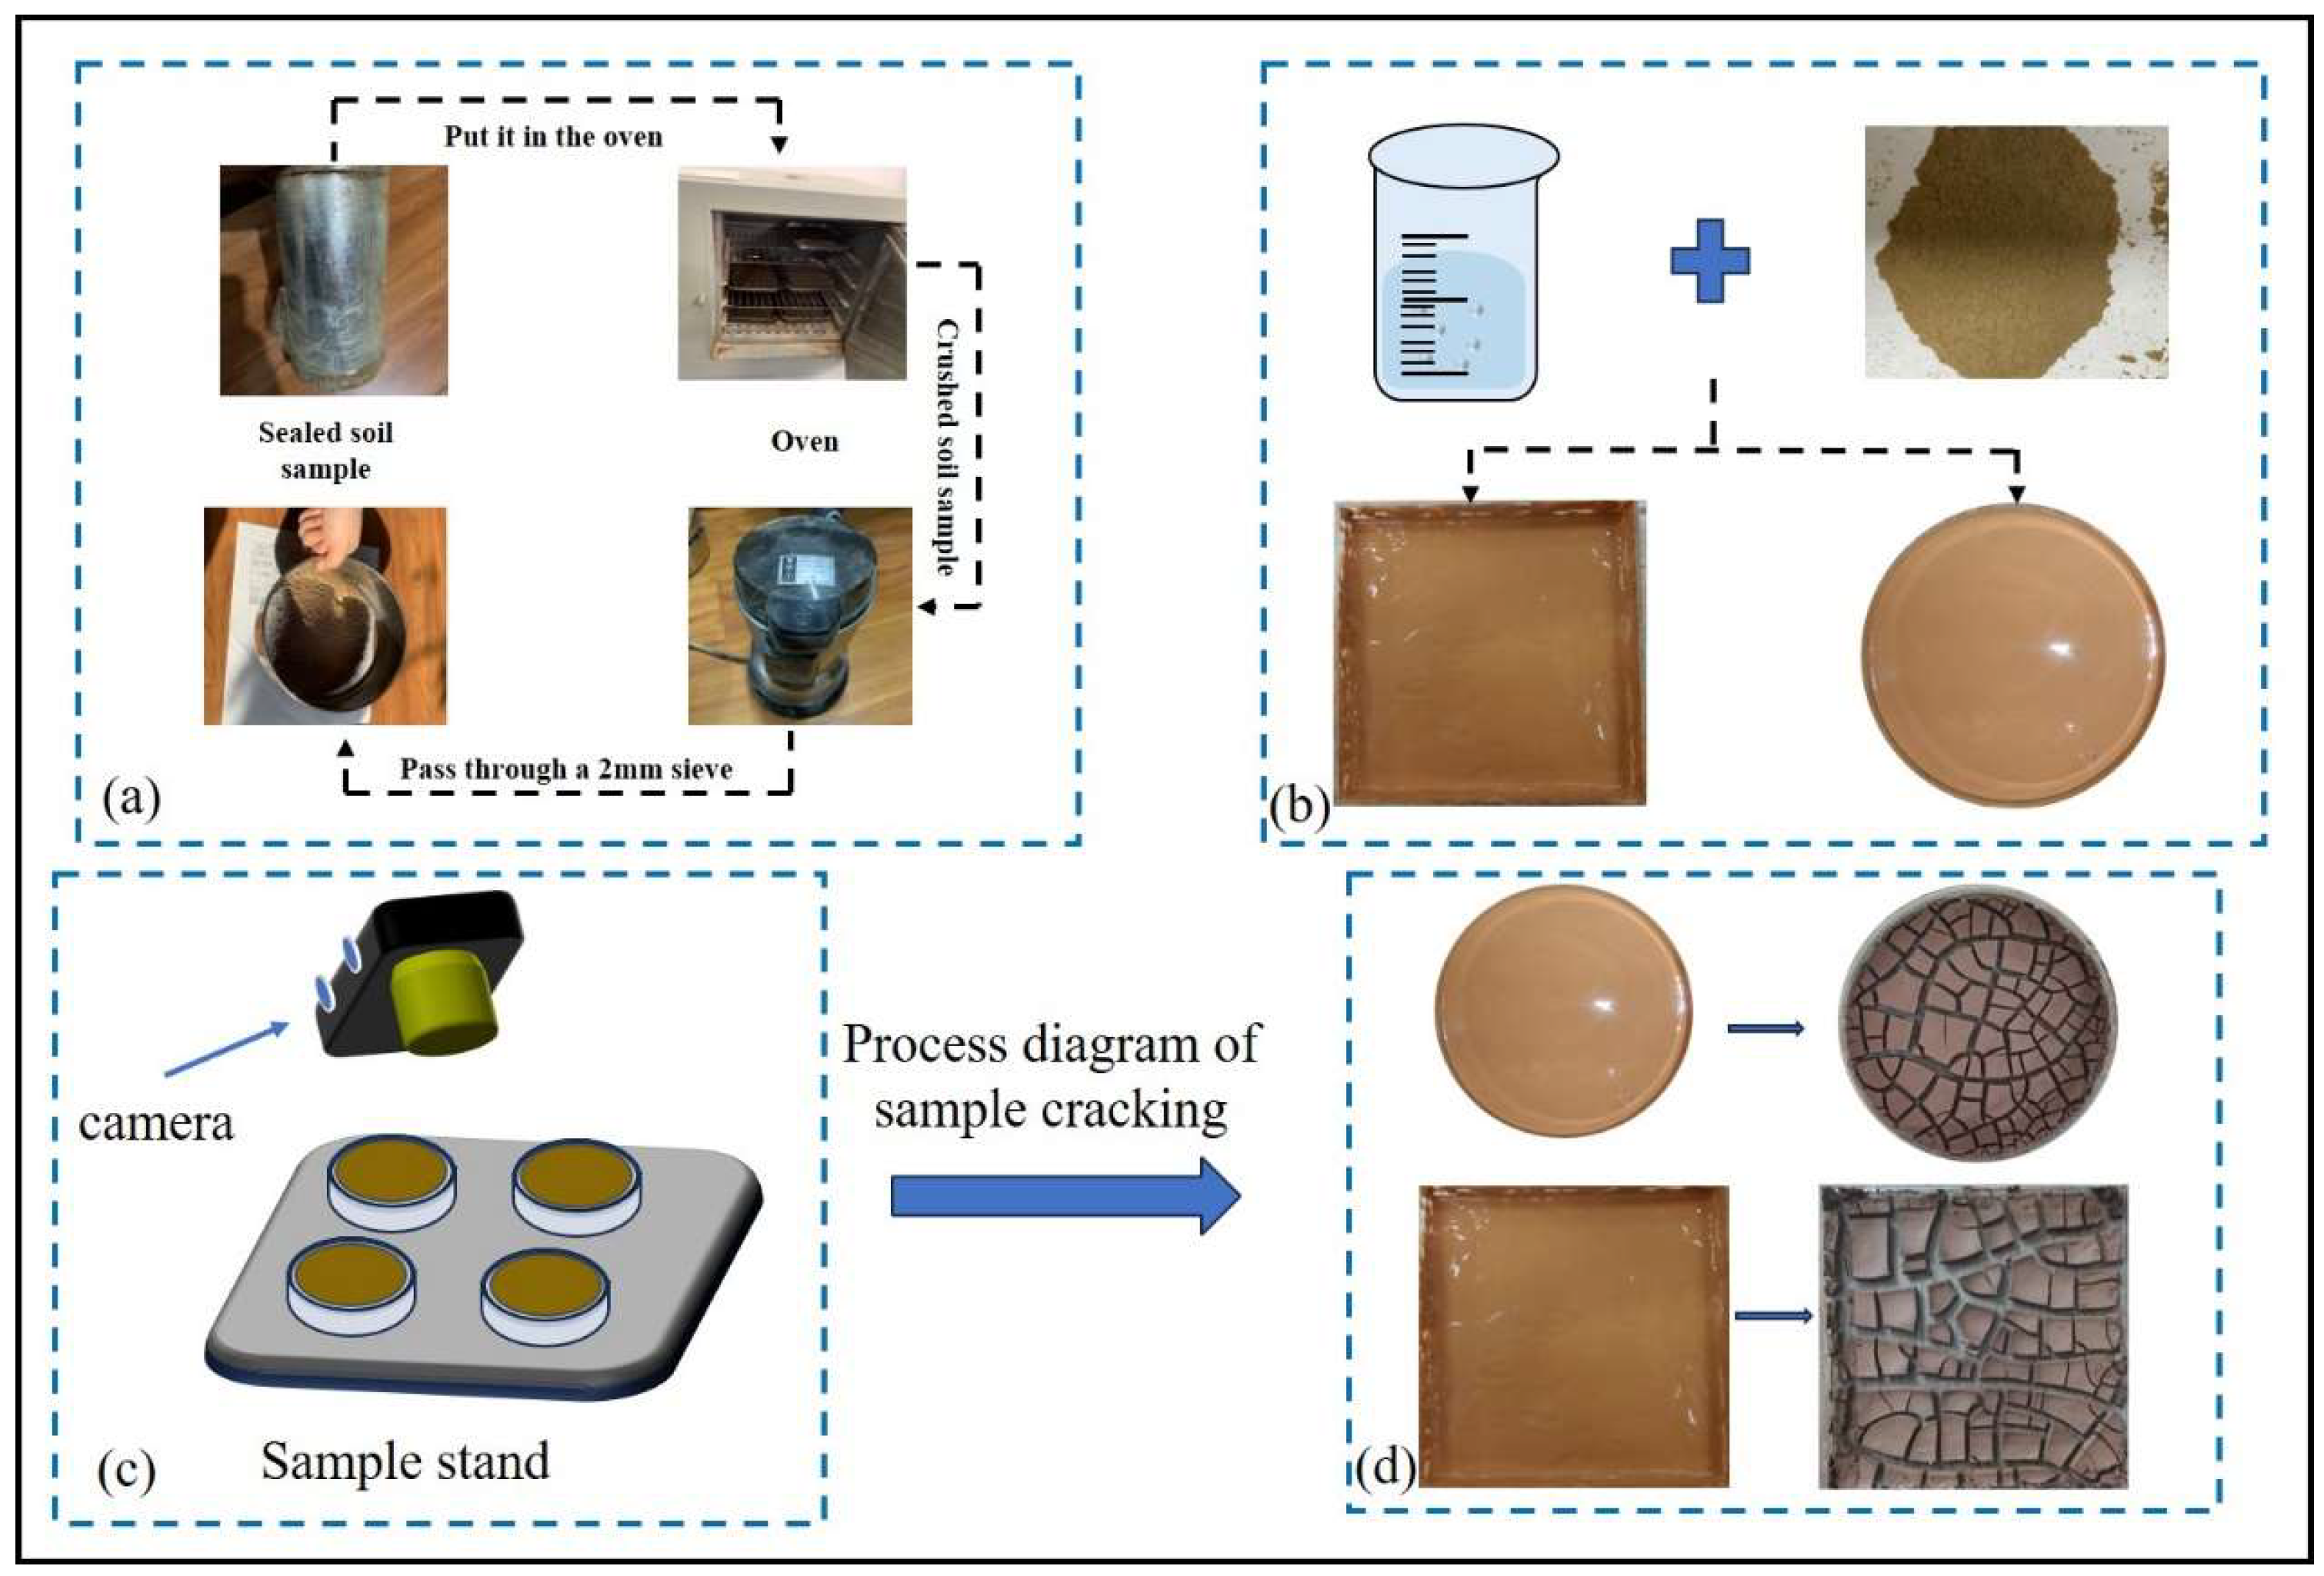
First, the soil was air-dried to make it easier to crush. Next, a crusher was used to crush the soil into a granular form. The crushed soil was placed in an electric oven at 105–110 °C and dried. Then, the soil was sieved with a standard 2 mm sieve. An electronic scale was used to weigh 200 g of soil samples before they were placed in the curved and straight containers, as required. For convenience, corresponding labels were attached to the containers. The labels denoted the corresponding investigator and the soil sample number. We ensured that appropriate preparations were made for the following series of experiments.
2.2. Experimental Process
Two types of containers were selected for the experiment, one being a straight container and the other a curved container, as shown in
Figure 3b. The two experimental instruments only differ in their boundaries, and the containers had identical surface areas. To ensure experimental accuracy, a set of parallel experiments was set up for each group as a control. The container is made of transparent acrylic, which is characterized by resistance to high and low temperatures, strong alkali and acid corrosion, high strength, and no deformation. Approximately 200 g of soil was added to each container and placed at a standard room temperature of 25 °C for the experiment.
In order to explore the process of evaporative cracking of cohesive soil under different boundary conditions, two different boundary conditions were implemented in total, one being a straight boundary and the other a curved boundary. The relevant experimental data are presented in
Table 2. For each group of experiments, a set of parallel experiments was designed as a reference. Using the control variable method, only the boundary conditions were taken as variables. The processed soil sample was mixed with water to prepare a 102% saturated slurry, and the slurry was poured into curved and straight containers, separately. To ensure complete mixing of the soil and water, we stirred the mixture and placed it in a vibrating instrument for 10 min to remove any bubbles. Thereafter, the sample was sealed with cling film and left to stand for 2 days. Once static placement was completed, the sample was weighed with an electronic scale, and the results were recorded. Under the condition of a constant room temperature of 25 °C, the mass of the soil decreases due to water evaporation; thereafter, the change in moisture content can be calculated. Multiple sets of data were obtained from the constant temperature and humidity experiment. We measured the change in soil moisture content every 3 h before sample cracking. After the sample cracked, the change in soil moisture content was measured every 2 h. Each time the data were measured, a digital camera was used to record the cracks in the soil sample. The overall experimental process is shown in
Figure 3. The corresponding time was concurrently recorded. After organizing the data, the changes in moisture content and cracking characteristics during the sample evaporation process were summarized.
2.3. Image Processing Procedure
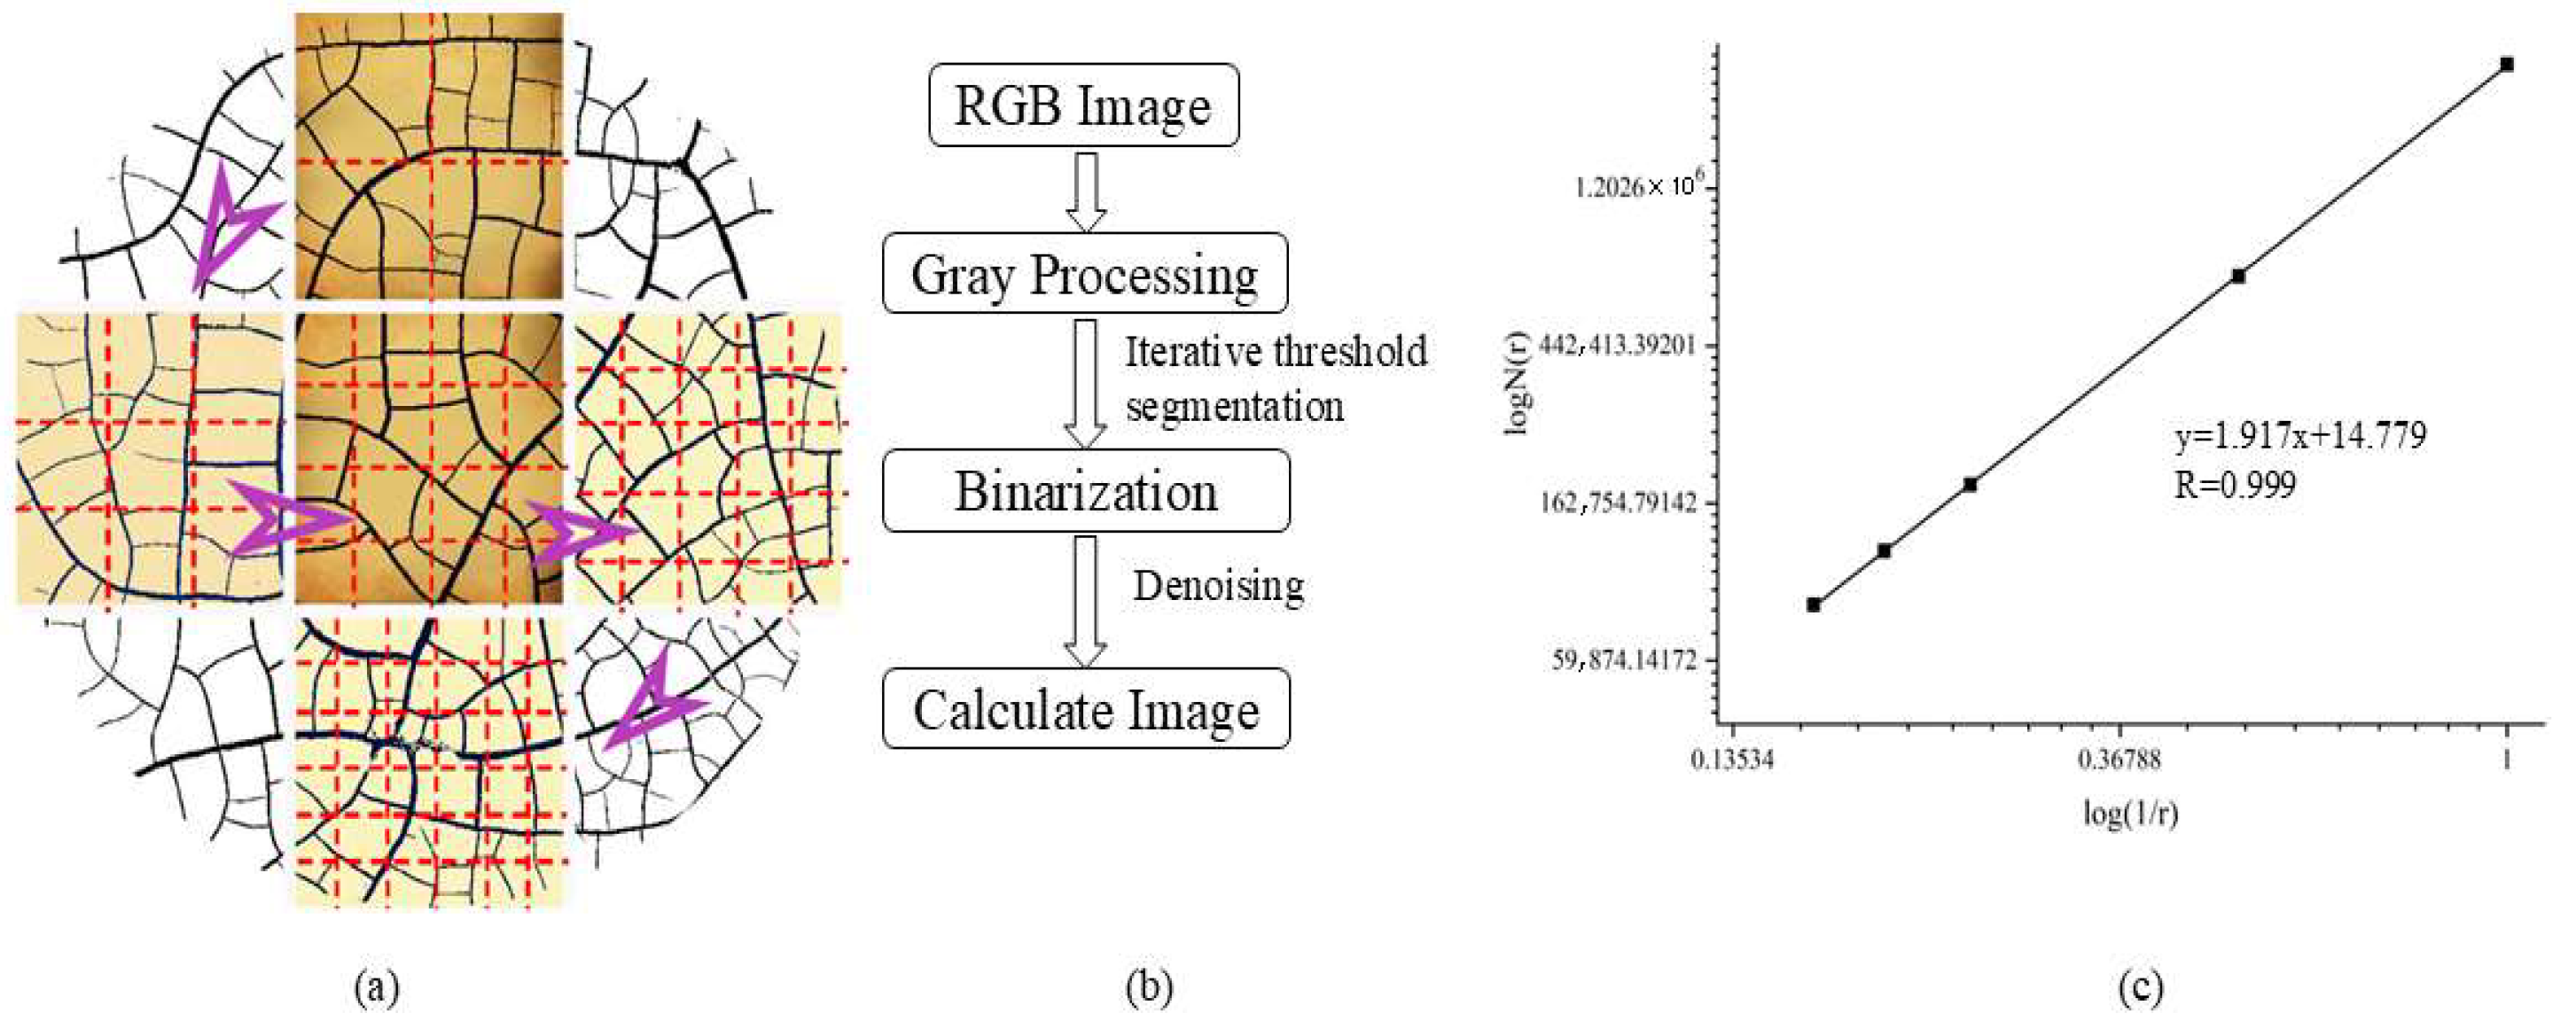
To ensure that noise-related issues caused by factors such as light source, environment, and equipment during imaging of the two sample containers did not impact the processing of image cracks, it was necessary to process the images appropriately. First, we cropped the image to remove the edges to eliminate their influence on the overall crack analysis. Thereafter, the photo was grayscale-processed to make the crack boundaries more distinct. Lastly, the grayscale photos were binarized [
28]. Binarization is achieved by determining the size between the surrounding pixels and the threshold, thereby transforming each pixel to form a black-and-white image. Next, we used an iterative method to perform threshold segmentation on the images and select the optimal threshold. Lastly, Gaussian filtering was used to perform image denoising [
29], as shown in
Figure 4. The fractal dimension of the sample image was calculated by using the box counting method, based on the adopted size (1 × 1; 2 × 2; 3 × 3 …). The statistics of the number covering the entire image were examined to determine the number N required to completely cover the image under grids L of different sizes. Lastly, by drawing a fitting curve, the fractal dimension (D) was obtained [
30]:
where L represents the size of the grid and represents the number of L dimensions required to completely cover the image cracks, as shown in
Figure 4.
The crack rate (C) is obtained by calculating the ratio of the crack area (S
c) to the total area (S
t) in Equation (2):
3. Results
3.1. Soil Cracking Process Under the Curved Boundary
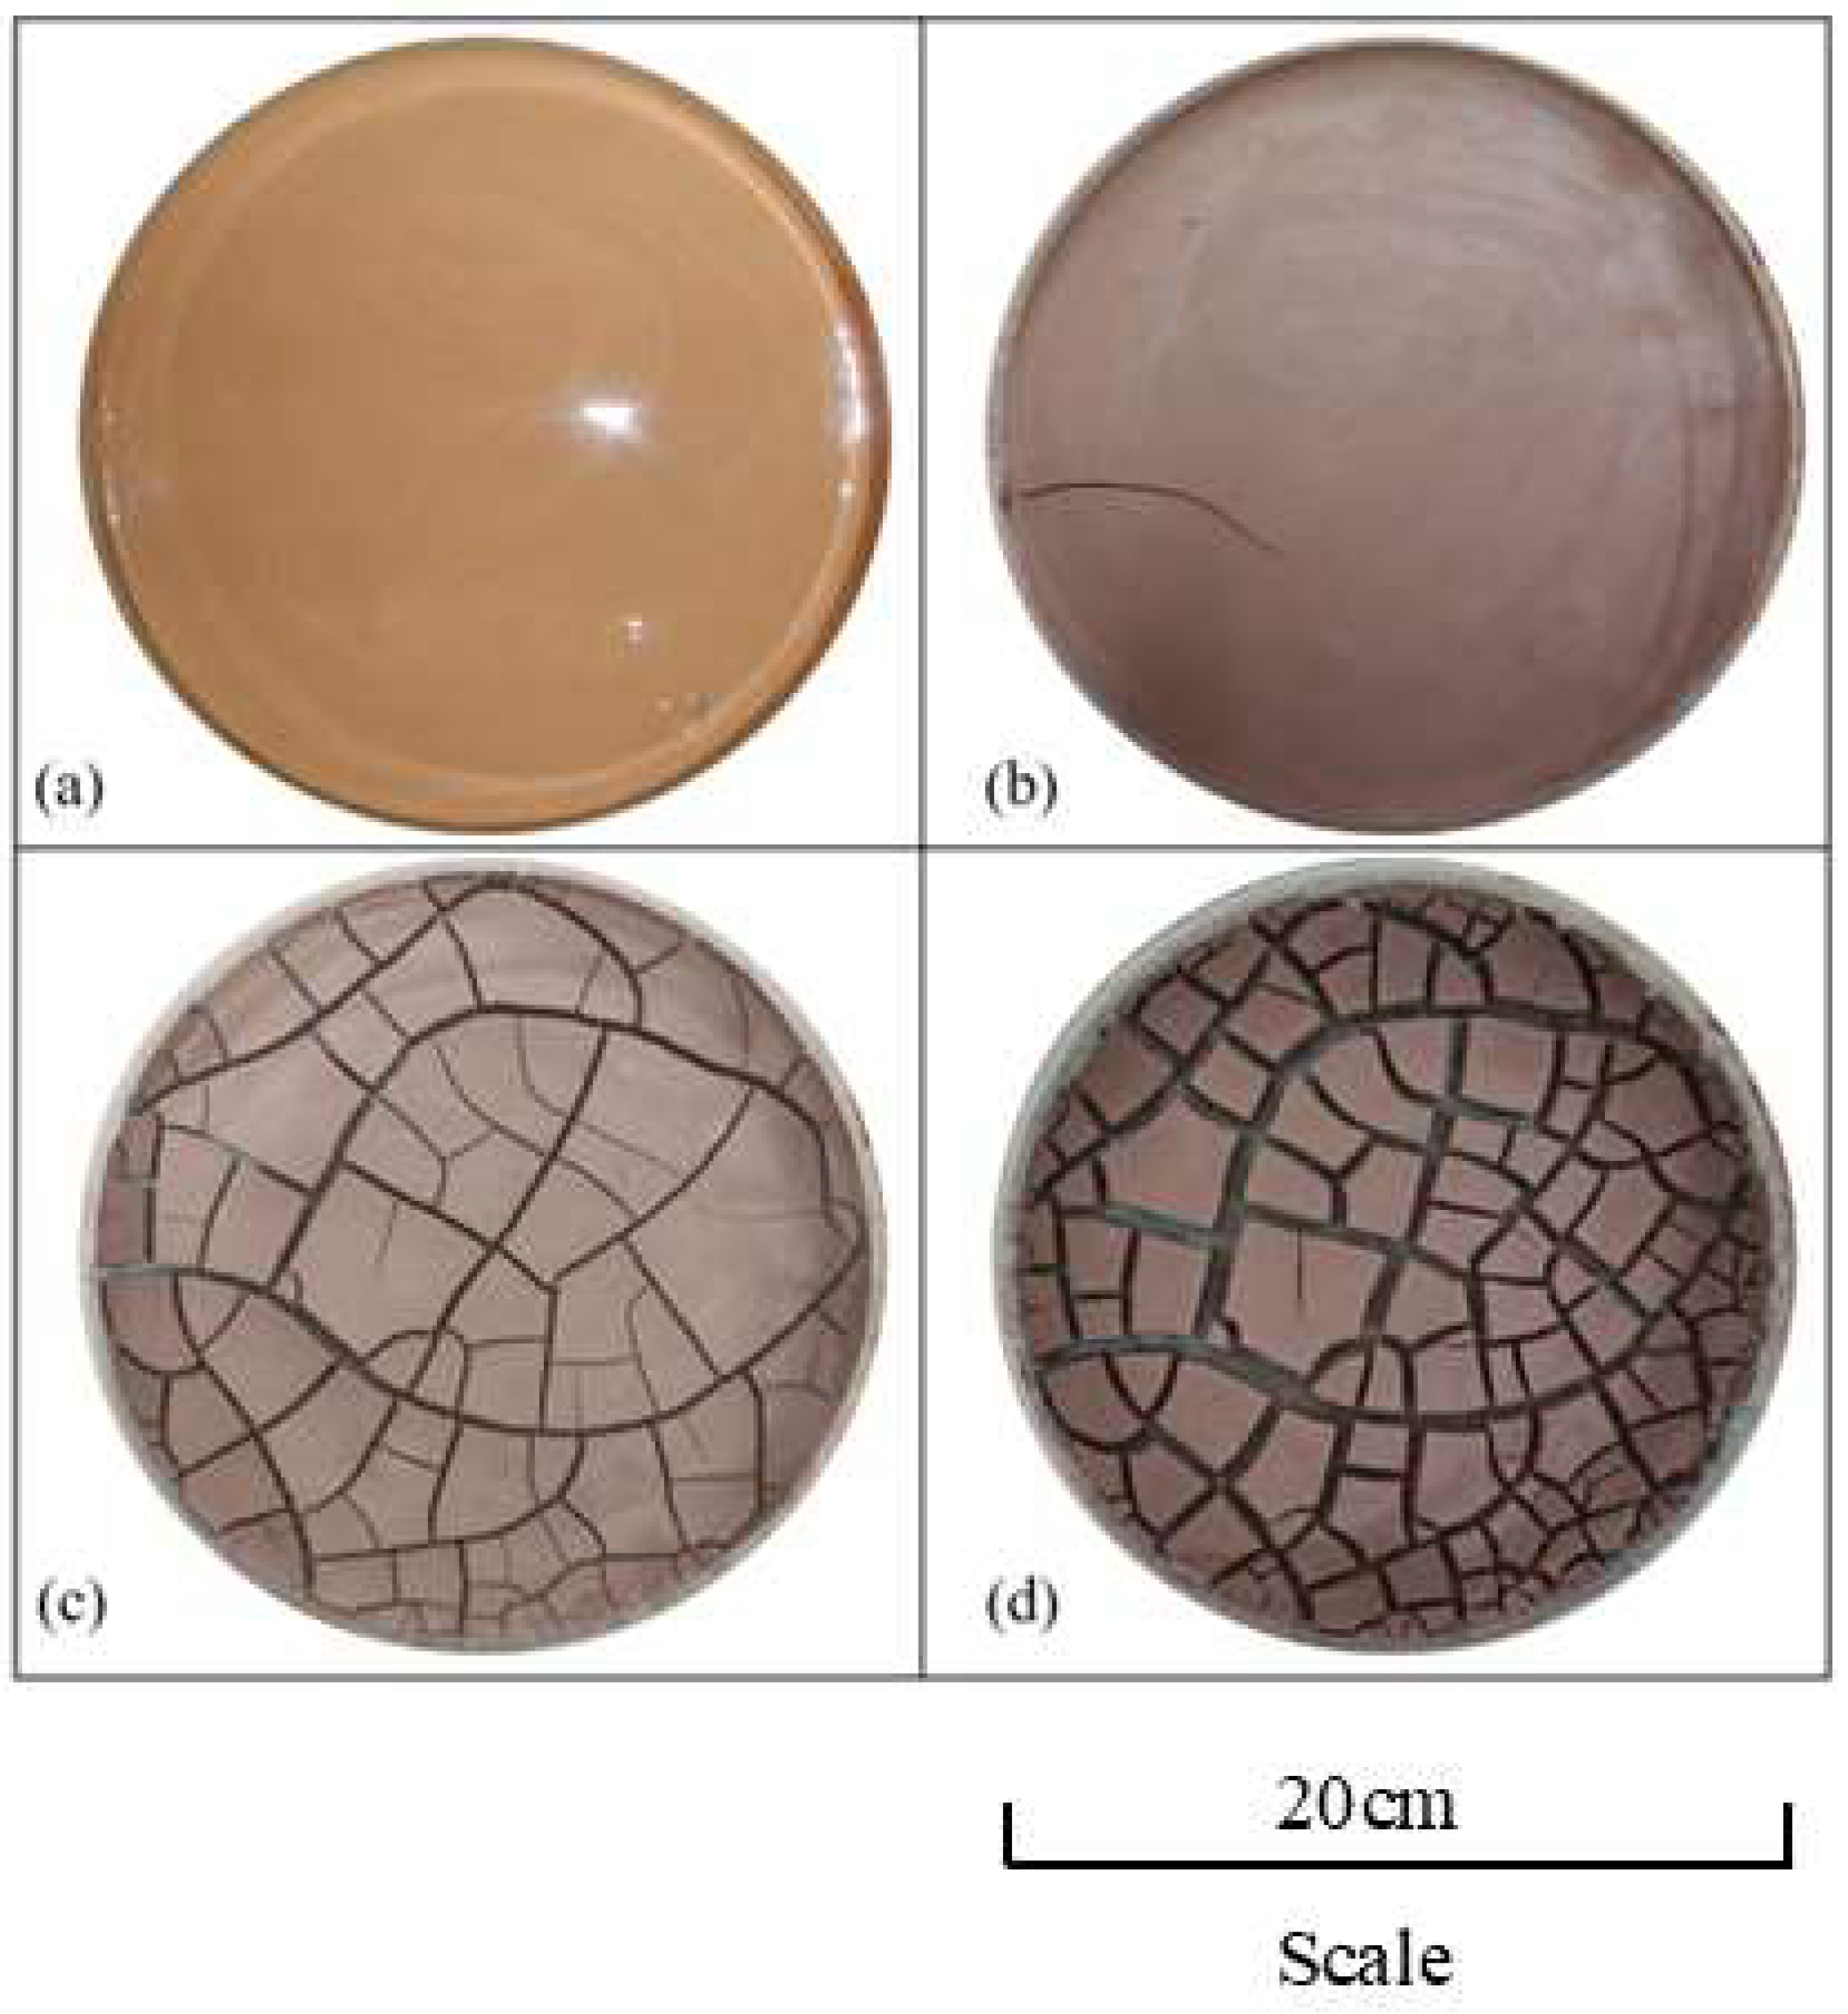
Figure 5 illustrates the surface crack development process in soil for different test periods under the curved boundary condition. It can be seen from
Figure 5 that the original slurry prepared started in a supersaturated state, as shown in
Figure 5a. After approximately 20 h of natural evaporation, the first crack began to develop at the lower left edge of the soil surface. The first crack started from the edge of the curved container, and the grouting extended toward the center of the curved container, as shown in
Figure 5b. After about 75 h of natural evaporation, the crack morphology on the soil surface essentially developed. In the later stage, only the width of the cracks continued to increase, and the newly formed cracks essentially did not develop any further, as shown in
Figure 5c. After approximately 120 h of natural evaporation, the free water in the soil had essentially evaporated completely, and the crack morphology on the soil surface had also ultimately been fixed, with it no longer continuously extending and widening. From the development process illustrated in
Figure 5a–d, it can be seen that under the curved boundary condition, the first crack in the soil gradually expanded from the curved boundary toward the center. Moreover, under the curved boundary condition, the fine cracks distributed at the boundary were denser than those inside.
3.2. Evaporation Cracking Process of Soil Under Straight Boundary Conditions
Figure 6 illustrates the development process of surface cracks in the soil at different test periods under the straight boundary condition. It can be seen from
Figure 6 that the first crack on the soil surface begins to appear at around the 20th hour of evaporation, distributed in the upper right corner of the sample, differing from the position where the first crack appeared in the soil under the curved boundary condition. Moreover, the development of the first crack extended from the middle of the soil sample toward the boundary in the direction of the soil sample, which was completely opposite to the development direction of the first crack under the curved boundary condition, as shown in
Figure 6b; at around 75 h of evaporation, three main crack networks spread through the soil in the left and right directions and continuously formed three relatively wide crack networks. Most of the cracks were straight cracks, as shown in
Figure 6c. However, the crack morphology at the curved boundary was completely different under the same evaporation duration. The cracks under the curved boundary condition were mostly smooth curved cracks; in comparison, the cracks under the straight boundary conditions were straight cracks that ran through the entire sample. The morphology of the crack network on the soil surface when the evaporation duration is 120 h is shown in
Figure 6d. The crack has formed in full, and the mass of the formed soil is mostly polygonal; in comparison, the curved cracks are curved polygons. From the above findings, it can be seen that the boundary conditions have a certain controlling effect on the crack morphology of soil evaporation and cracking.
3.3. The Variation in Soil Moisture Content Under Different Boundary Conditions
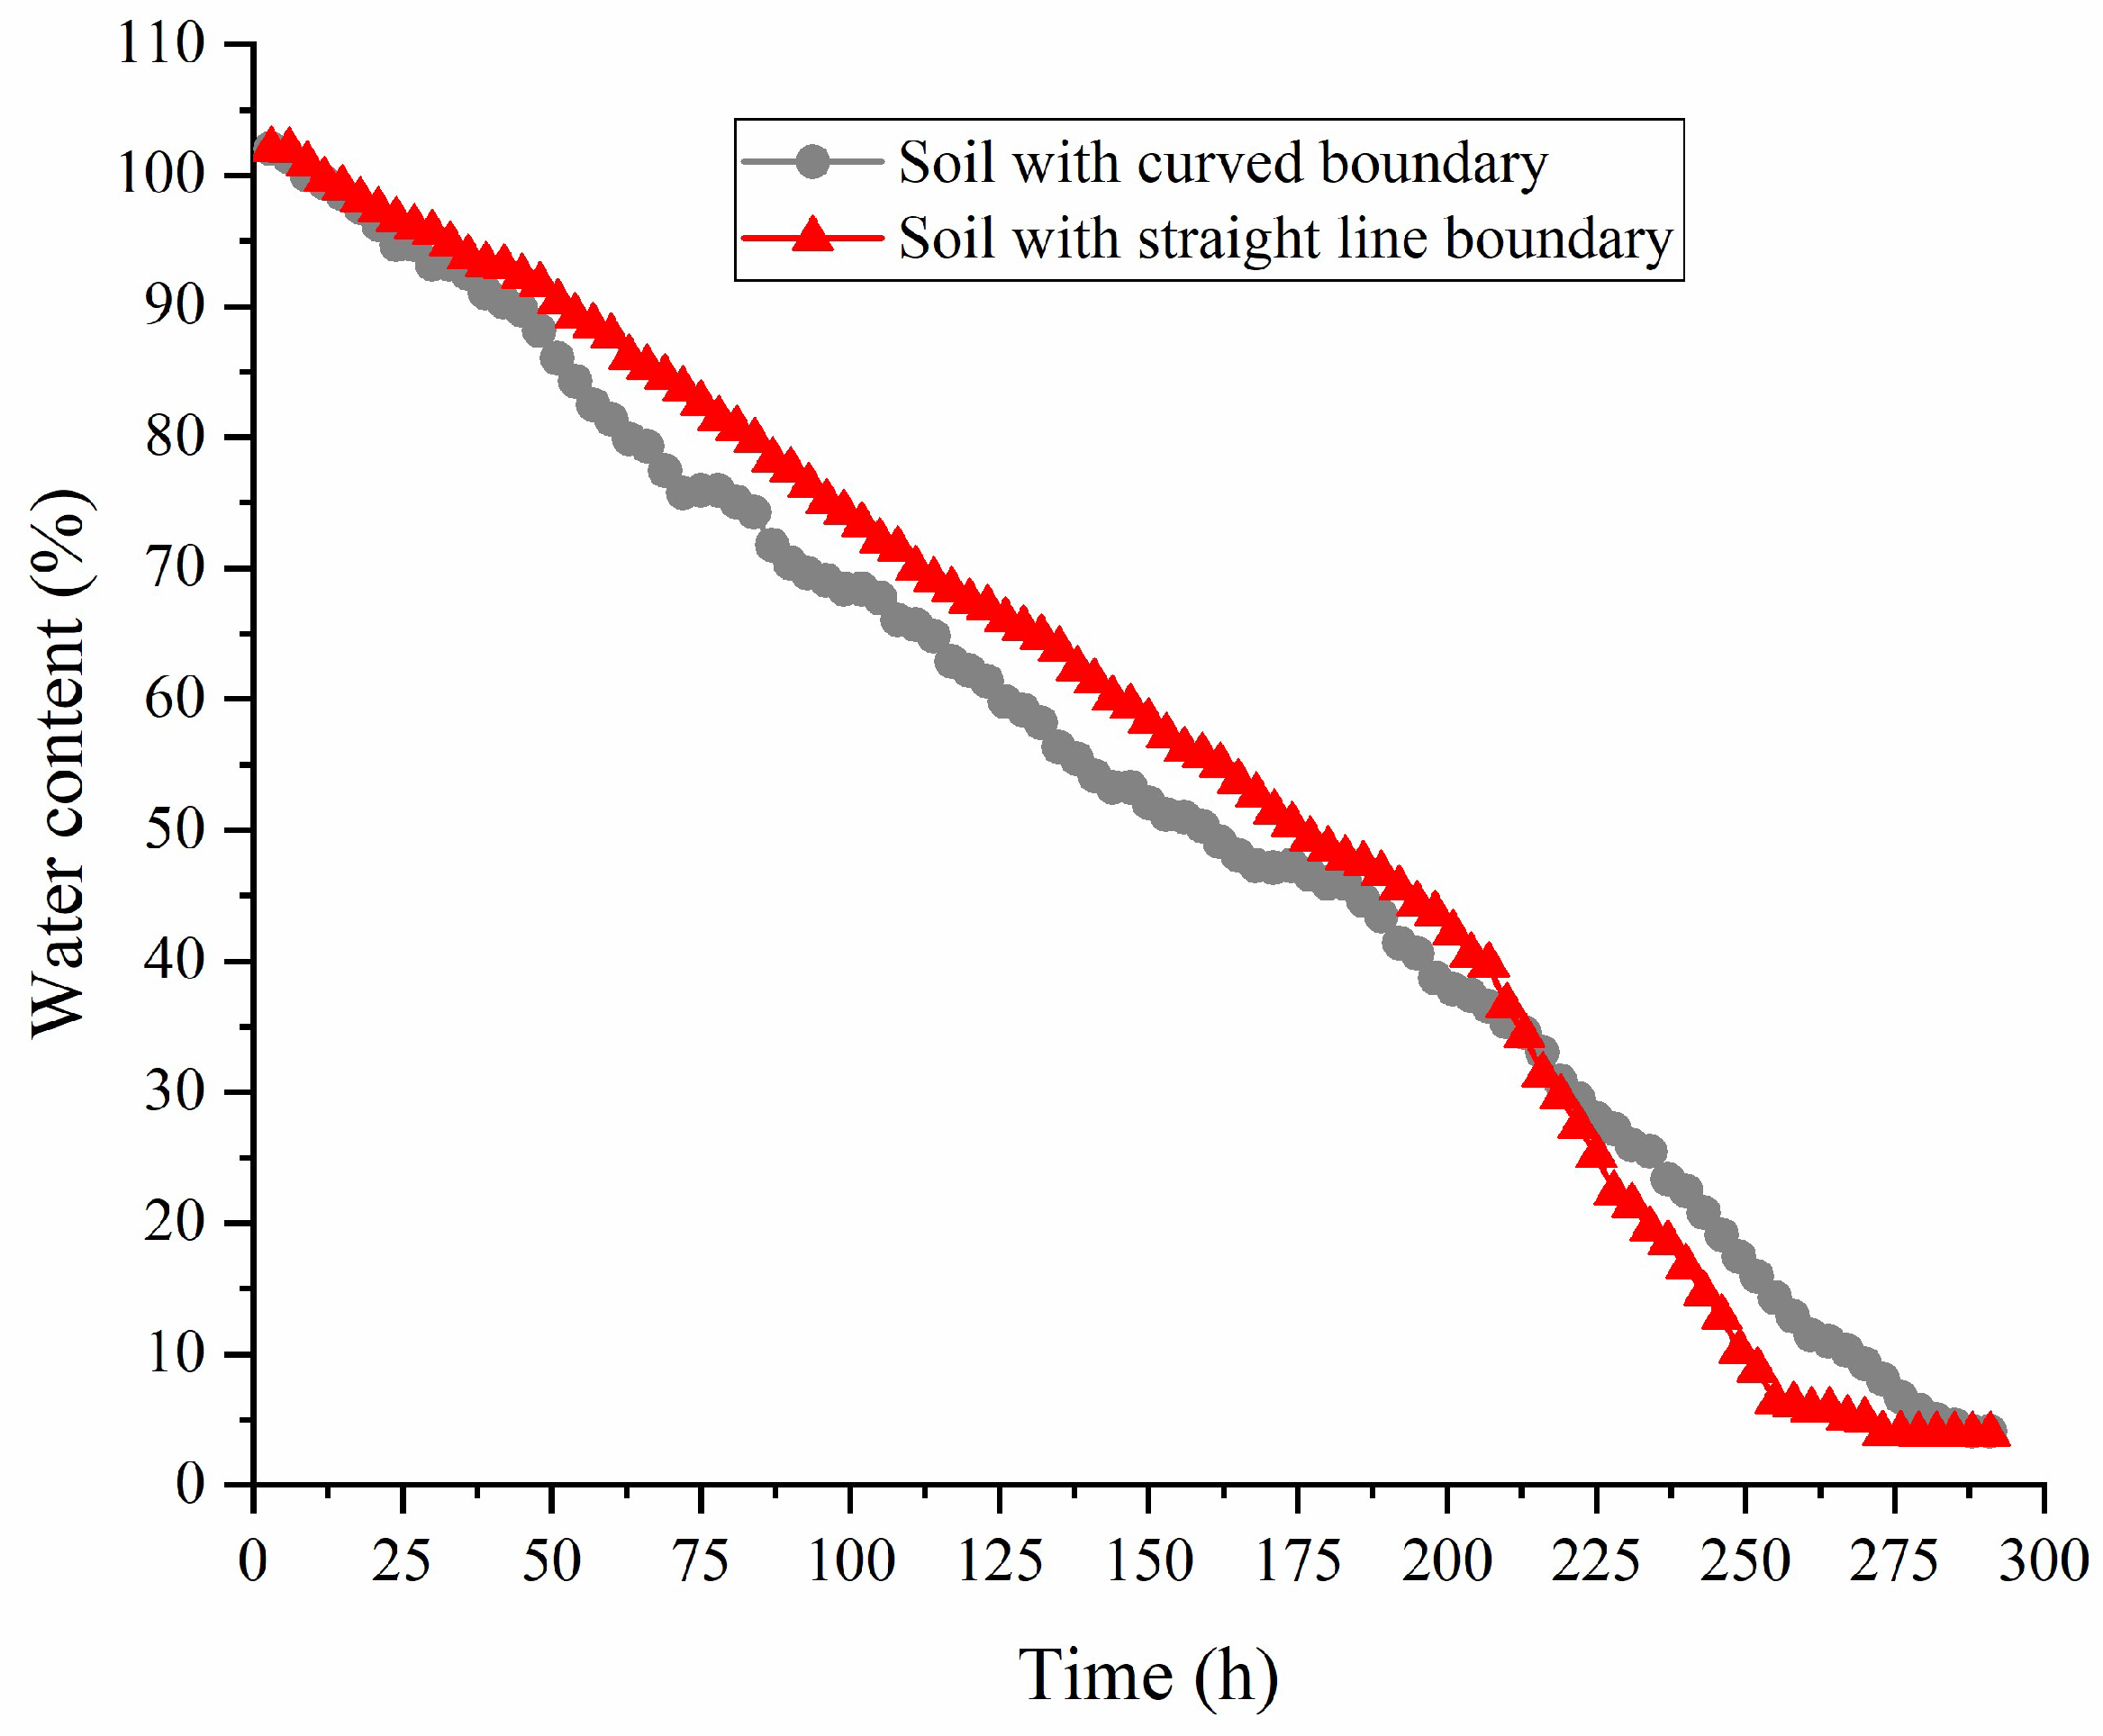
During our experiment, the data on changes in evaporation were used to calculate the variation in soil sample moisture content at each image collection period and corresponding time nodes. The variation in sample moisture content is presented in
Figure 7. Our samples can be divided into three evaporation stages. The first stage comprises the rapid evaporation of surface moisture. During this stage, the evaporation rate of the soil sample under the curved boundary condition is approximately the same as that under the straight boundary condition as, at this stage, the evaporation target of the sample primarily concerns the free water on the surface layer, and under the same external conditions, the boundary conditions will not affect the evaporation rate of the sample. The second stage comprises the rapid evaporation and attenuation of moisture in the sample. During this stage, the evaporation rate of the curved boundary is stronger than that of the straight boundary condition from the initial to middle stages and then lower than that of the straight boundary condition. Under the curved boundary condition, the sample loses water and generates dense cracks, accelerating the overflow of water and leading to the evaporation of water at a specific rate. However, over time, the free water in the curved boundary almost completely evaporates, and the evaporation rate decreases. In addition, the samples in the straight boundary undergo complete cracking, and the evaporation rate accelerates, demonstrating that the straight boundary has advantages over the curved boundary. During the final stage, the free moisture in the samples at the two boundaries evaporates completely, leaving only some strongly bound water, and the evaporation rate remains almost unchanged.
During the test, in addition to obtaining surface crack images at different time points, the collection frequency was at 5 h intervals. When obtaining data from the surface crack images, the data pertaining to sample weight changes were also collected. It is evident that the weight difference between the two collection time intervals is the amount of free water evaporation inside the soil sample within this time period. By analyzing the change in evaporation amount, the change in soil sample moisture content at each collection image period and corresponding time node could be calculated. When analyzing the change in moisture content, the moisture content per unit area can be calculated using Equation (3):
where w
s represents the moisture content per unit area (%), m
0 is the quality of soil moisture content, and s represents the soil area. The moisture content per unit area under straight and curved boundary conditions was calculated, with the results presented in
Table 3.
From the results presented in the above table, it can be clearly seen that the moisture content per unit area under the straight boundary condition in the third stage is significantly higher than that under the curved boundary condition. Following a comprehensive literature review and analysis, we concluded that this finding is the result of the original mass of the soil sample inside the directional container being significantly higher than that under the curved boundary condition. Therefore, the residual masses of strongly and weakly bound water in the soil particles under the straight boundary condition are significantly higher than the residual water volume under the curved boundary condition.
3.4. The Variation in Crack Fractal Dimensions in Soil Under Different Boundary Conditions
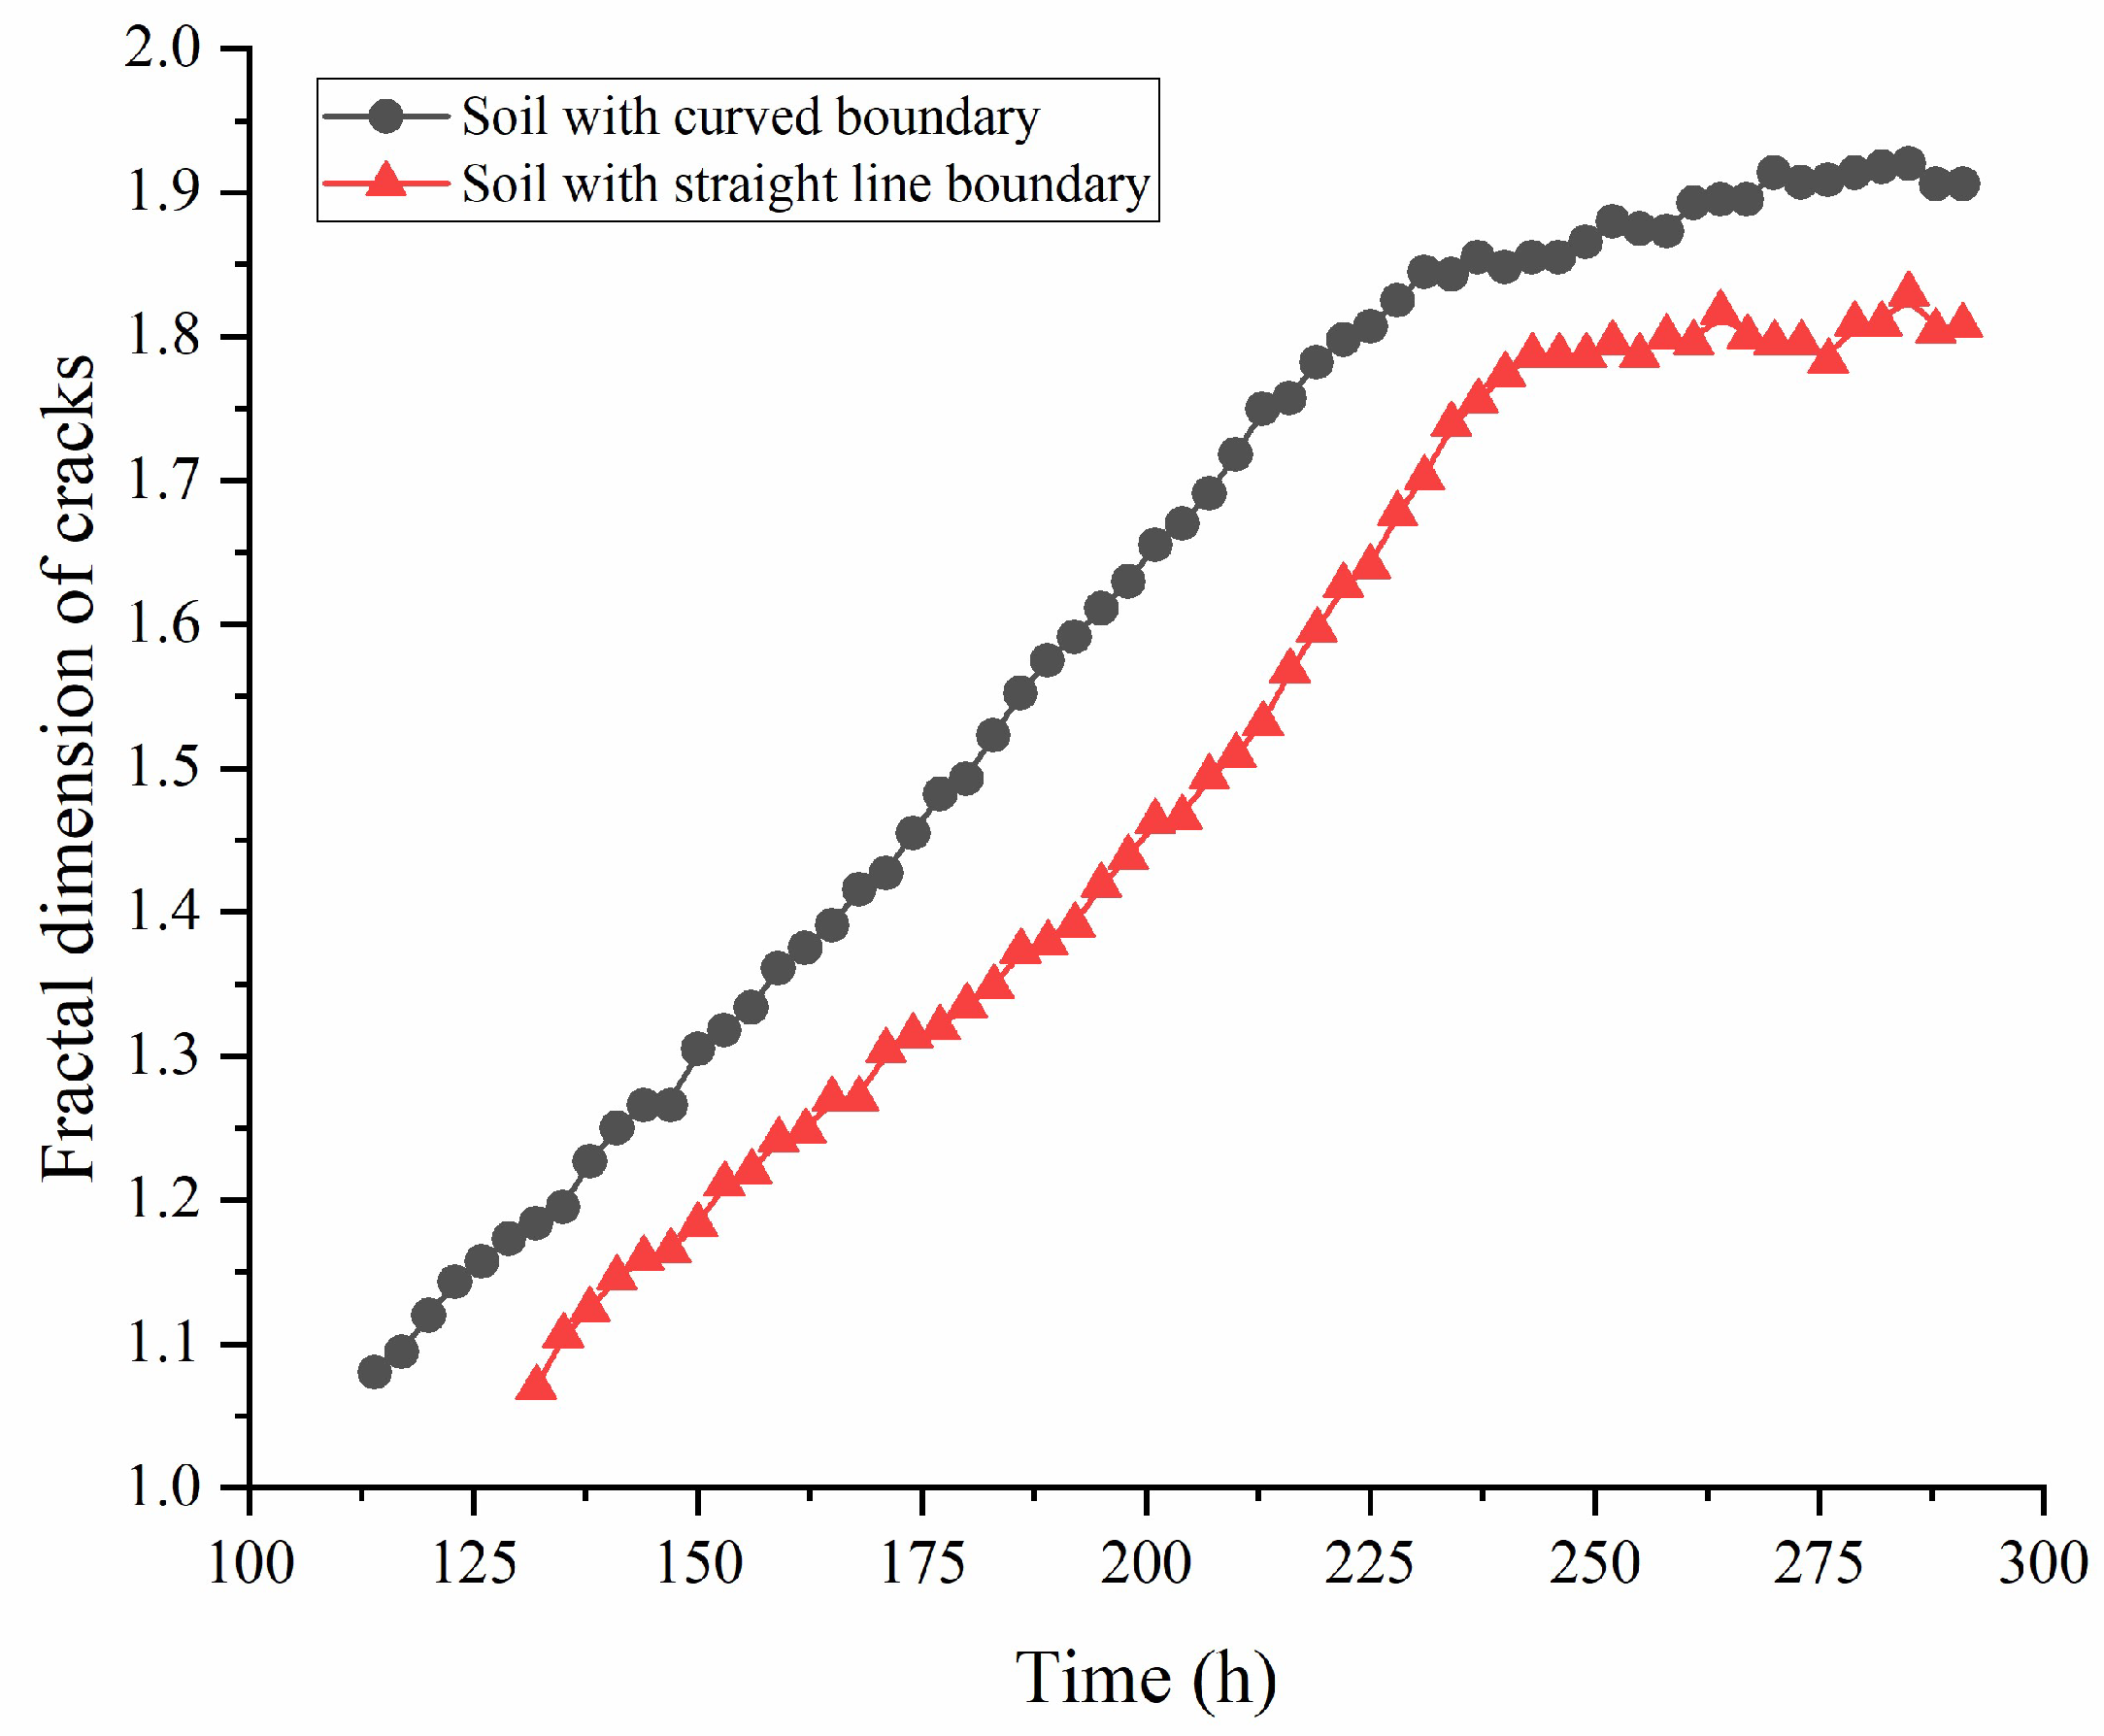
As shown in
Figure 8, the fractal dimensions of the cracks in the soil samples under both boundary conditions show an increasing trend over time. Compared with the straight border, the fractal dimension of the cracks in the soil in the curved-shaped border is always greater than that of the soil sample in the straight border. However, both eventually showed a stable trend over time and ultimately stabilized at around 1.90. This difference primarily stems from the influence of the different boundary conditions of the specimens. Under the curved-shaped boundary condition, the frequency of cracks in the specimens is relatively random, and the stress constraints on various parts of the soil are relatively large. When the first main trunk crack appears, it restricts the development of the main crack, and cracks rapidly emerge in other areas, resulting in crack interaction, making the crack network more complex. Compared with the curved boundary, the stress around the straight boundary is more concentrated. During the pre-treatment process, it may not have been flattened, resulting in cracks preferentially appearing near the four corners of the container. Moreover, when the main crack emerges, it runs through the entire container, causing the main crack to develop preferentially. This change will result in the surrounding secondary network not developing sufficiently, with the formed crack pattern being relatively simple, with a lower fractal dimension.
3.5. The Variation in Soil Crack Rates with Time Under Different Boundary Conditions
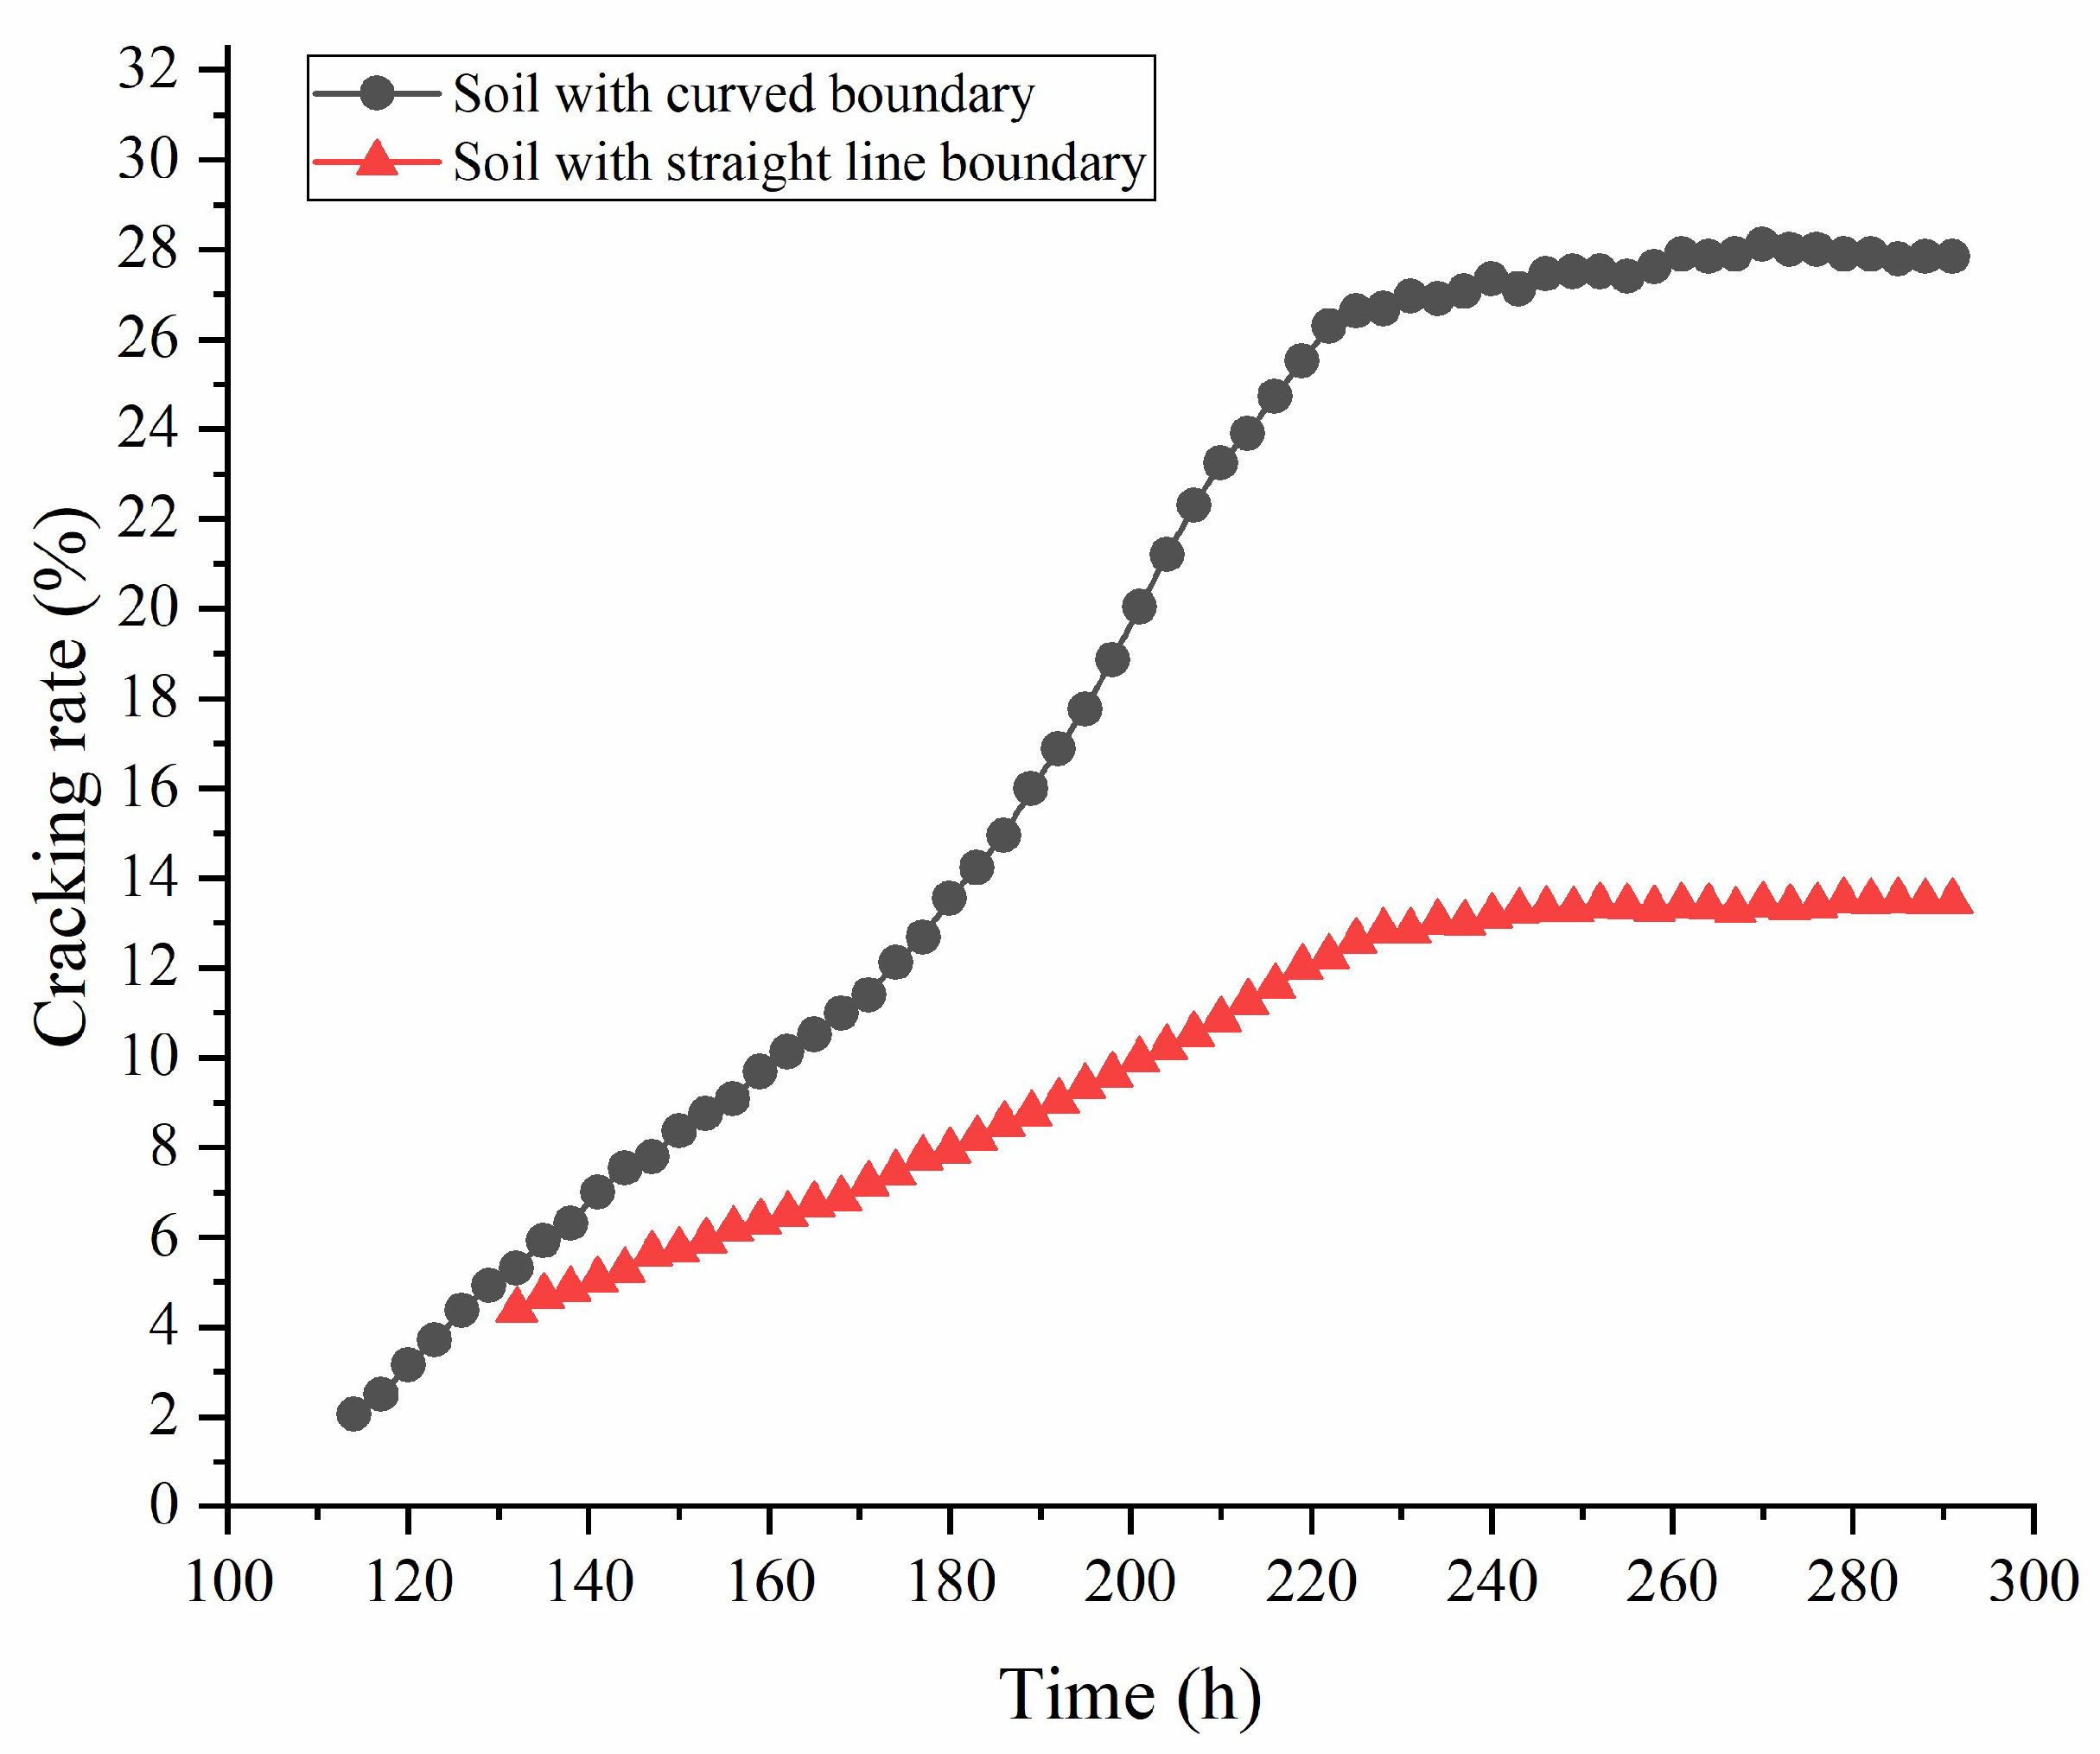
Based on the experimental results presented in
Figure 9, the characteristics of the soil sample crack rate can be clearly observed to vary with time under different boundary conditions. Under the curved boundary condition, the crack rate of the soil samples shows a trend of rapid increase, followed by stabilization, growing from approximately 8% in the initial stage to about 30% after 300 h. In contrast, the crack rate under the straight boundary condition increased relatively slowly and eventually stabilized at approximately 22%. This result is corroborated by the changing trend of the fractal dimension, further confirming the significant influence of boundary conditions on the cracking behavior of soil.
From a mechanistic perspective, the higher crack rate under the curved boundary condition primarily stems from two aspects. Firstly, a curve makes the internal stress distribution of the soil mass exhibit obvious non-uniformity, and this stress gradient promotes the initiation and propagation of multi-directional cracks. Secondly, the constraint effect of a curved boundary on the soil is more balanced. When the first main crack appears, the boundary conditions can effectively restrict its unidirectional rapid development and instead promote the generation of secondary cracks in other areas. This pattern of multi-crack interaction eventually forms a complex reticular crack system, manifested as a relatively high crack rate and fractal dimension. The development of cracks under straight boundary conditions shows different characteristics. Due to the symmetry of the boundary geometry, the stress concentrates primarily in the four corners of the container. This stress distribution leads to cracks often initiating preferentially at the edges and corners and rapidly expanding along the direction of the straight boundary. During the crack propagation process, the main crack is allowed to develop sufficiently, thereby suppressing the need to form secondary cracks. This cracking pattern is dominated by the main crack, making the crack network relatively simple, ultimately manifested as a lower crack rate and fractal dimension.
4. Discussion
From an analysis of our experimental results, we found that under different boundary conditions, there were significant differences in the cracking process and the complexity of cracks in the soil. Compared with the straight boundary condition, the fractal dimension of the curve container image is significantly greater. Our experimental results show that the boundary of the experimental container has a certain influence on the generation and expansion of soil cracks. The crack image under the curved boundary condition is more complex than that at the same moment under the straight boundary condition. The more complex the crack, the greater its impact on the evaporation of moisture in the sample. Through comparative experiments, we found that in curved containers, cracks in the samples often appear first at the center and boundaries. Over time, secondary cracks gradually occur around the main cracks. Such cracks are mostly Y- and T-shaped, with most being curved cracks. Compared with the straight boundary, cracks first appear at the center and run across the entire container. Over time, the cracks do not produce a large number of curved cracks like those found in curved containers. Straight containers become fragmented and cracked, with mostly regular cracks. Moreover, in the initial stage of crack formation in straight containers, very few secondary cracks will be present. Through our sample comparison, we found that the straight boundary exhibits higher residual water content compared to the curved boundary. A detailed analysis of different boundary conditions was undertaken, and it was found that during the drying of the soil at the curved boundary, as water was lost and the soil gradually developed cracks, the shrinkage stress between the soils tended to be uniform and followed the same pattern in all directions. Therefore, during the cracking process, the appearance of cracks is not definite but tends to be more random. Such variability will lead to situations in which, when the initial crack appears, another crack will randomly appear in other areas, extend and expand, and then intersect with other cracks. This cycle repeats itself, leading to an increasing number of crack intersections. Ultimately, the surface cracks in the soil tend to be more complex and subsequently generate a higher fractal dimension.
In addition, researchers have found that straight boundaries do not exhibit an all-around curvature in the same manner as a curved crack. Stress is more likely to concentrate at the four corners compared to other areas. Cracks preferentially develop at the corners of straight lines, which can be observed in our experimental results. In the straight containers, cracks in the main trunk tend to develop preferentially, first elongating and then expanding. This process will, to a certain extent, inhibit the occurrence and development of secondary cracks, eventually forming fewer crack networks and generating a lower fractal dimension. Previous studies have found that the evaporation of water in soil environments is impacted not only by the texture of the soil but also by the surrounding environment, temperature, lighting conditions, and other factors. This process is also related to the boundary conditions at the soil site and the number of cracks. Some scholars have found that initially straight containers will develop cracks earlier, resulting in an increase in the sample’s overall contact area with air, which will cause the initial evaporation rate to be higher than that of curved containers. As evaporation continues, a crack that runs through the entire body is formed, and the evaporation of water will accelerate at the crack site. The propagation of cracks will squeeze the surrounding soil, causing it to become denser, increasing the friction between particles and reducing seepage channels. The evaporation rate of soil moisture around the main crack weakens, resulting in a decrease in the overall evaporation rate. Regarding the curved boundary, in the initial soil stage, no stress concentration areas are present in the various parts of the surface layer. Cracks will appear later than those at the straight boundary, and the initial evaporation rate will be lower. However, with the appearance of the initial cracks, more random cracks occur, forming a cross-crack network, which leads to the overall formation of through seepage channels in the soil, accelerating the water evaporation rate and eventually resulting in a higher sample evaporation rate.
Since cracks are a concrete manifestation of the damage and deterioration of soil properties, in actual engineering scenarios involving soil, it is advisable to avoid storing or excavating soil under curved boundary conditions to the greatest extent possible. Instead, soil should be stored or excavated under straight boundary conditions. However, it is undeniable that the development of cracks is merely a manifestation of soil damage. Under different engineering scenarios, comprehensive consideration and judgment should also be made. This article merely presents fundamental conclusions under simple boundary conditions, which can provide a specific reference for engineering construction to a certain extent. In the future, experimental investigations under more complex boundary conditions can also be performed.
5. Conclusions
The development of surface cracks in the soil at different test periods under the curved boundary can be detailed as follows: the first crack in the soil gradually expands from the curved boundary toward the center, and the fine cracks distributed at the boundary under the curved boundary conditions are denser than those inside. In the development of surface cracks in the soil at different test periods under the straight boundary condition, the cracks appear as straight cracks, and the formed mass of the soil is mostly polygonal.
The crack morphology under the same evaporation duration at the straight boundary and the curved boundary is completely different. The cracks under the curved boundary condition are mostly smooth curved cracks, while the cracks under the straight boundary condition are continuous straight cracks. Once evaporation continues and after the crack network morphology on the soil surface is completely formed, the formed soil blocks are mostly polygons, with the curved ones being curved polygons. From this finding, it can be concluded that the boundary conditions have a certain controlling effect on crack morphology during soil evaporation and cracking.
Under the straight boundary condition, the residual water content of the curve in the third stage is significantly higher than that under the curved boundary condition. Since the original mass of the soil sample inside the straight container is significantly higher than that under the curved boundary condition, the residual masses of strongly and weakly bound water of the soil particles under the straight boundary condition are significantly higher than the residual water volume under the curved boundary.
Under the curved boundary condition, the fractal dimension of the image is significantly greater than that under the straight boundary condition. This finding indicates that the crack image under curved boundary conditions is more complex at the same time point compared with that under the condition of a straight boundary. In actual engineering scenarios involving soil, it is advisable to take measures to ensure that the soil is not under curved boundary conditions to the greatest extent possible. Instead, the soil should be stored or excavated under straight boundary conditions.


