Article

Liquefaction Response and Reinforcement Effect of Saturated Soil Treated by Dynamic Compaction Based on Hydro-Mechanically Coupled Explicit Analysis

1
Qingdao Transportation Development Group Co., Ltd., Qingdao 266100, China
2
Shandong Provincial Communications Planning and Design Institute Group Co., Ltd., Jinan 250101, China
3
School of Transportation Engineering, Shandong Jianzhu University, Jinan 250101, China
*
Authors to whom correspondence should be addressed.
Buildings 2025, 15(14), 2527; https://doi.org/10.3390/buildings15142527
Submission received: 23 April 2025 / Revised: 2 June 2025 / Accepted: 18 June 2025 / Published: 18 July 2025

Abstract

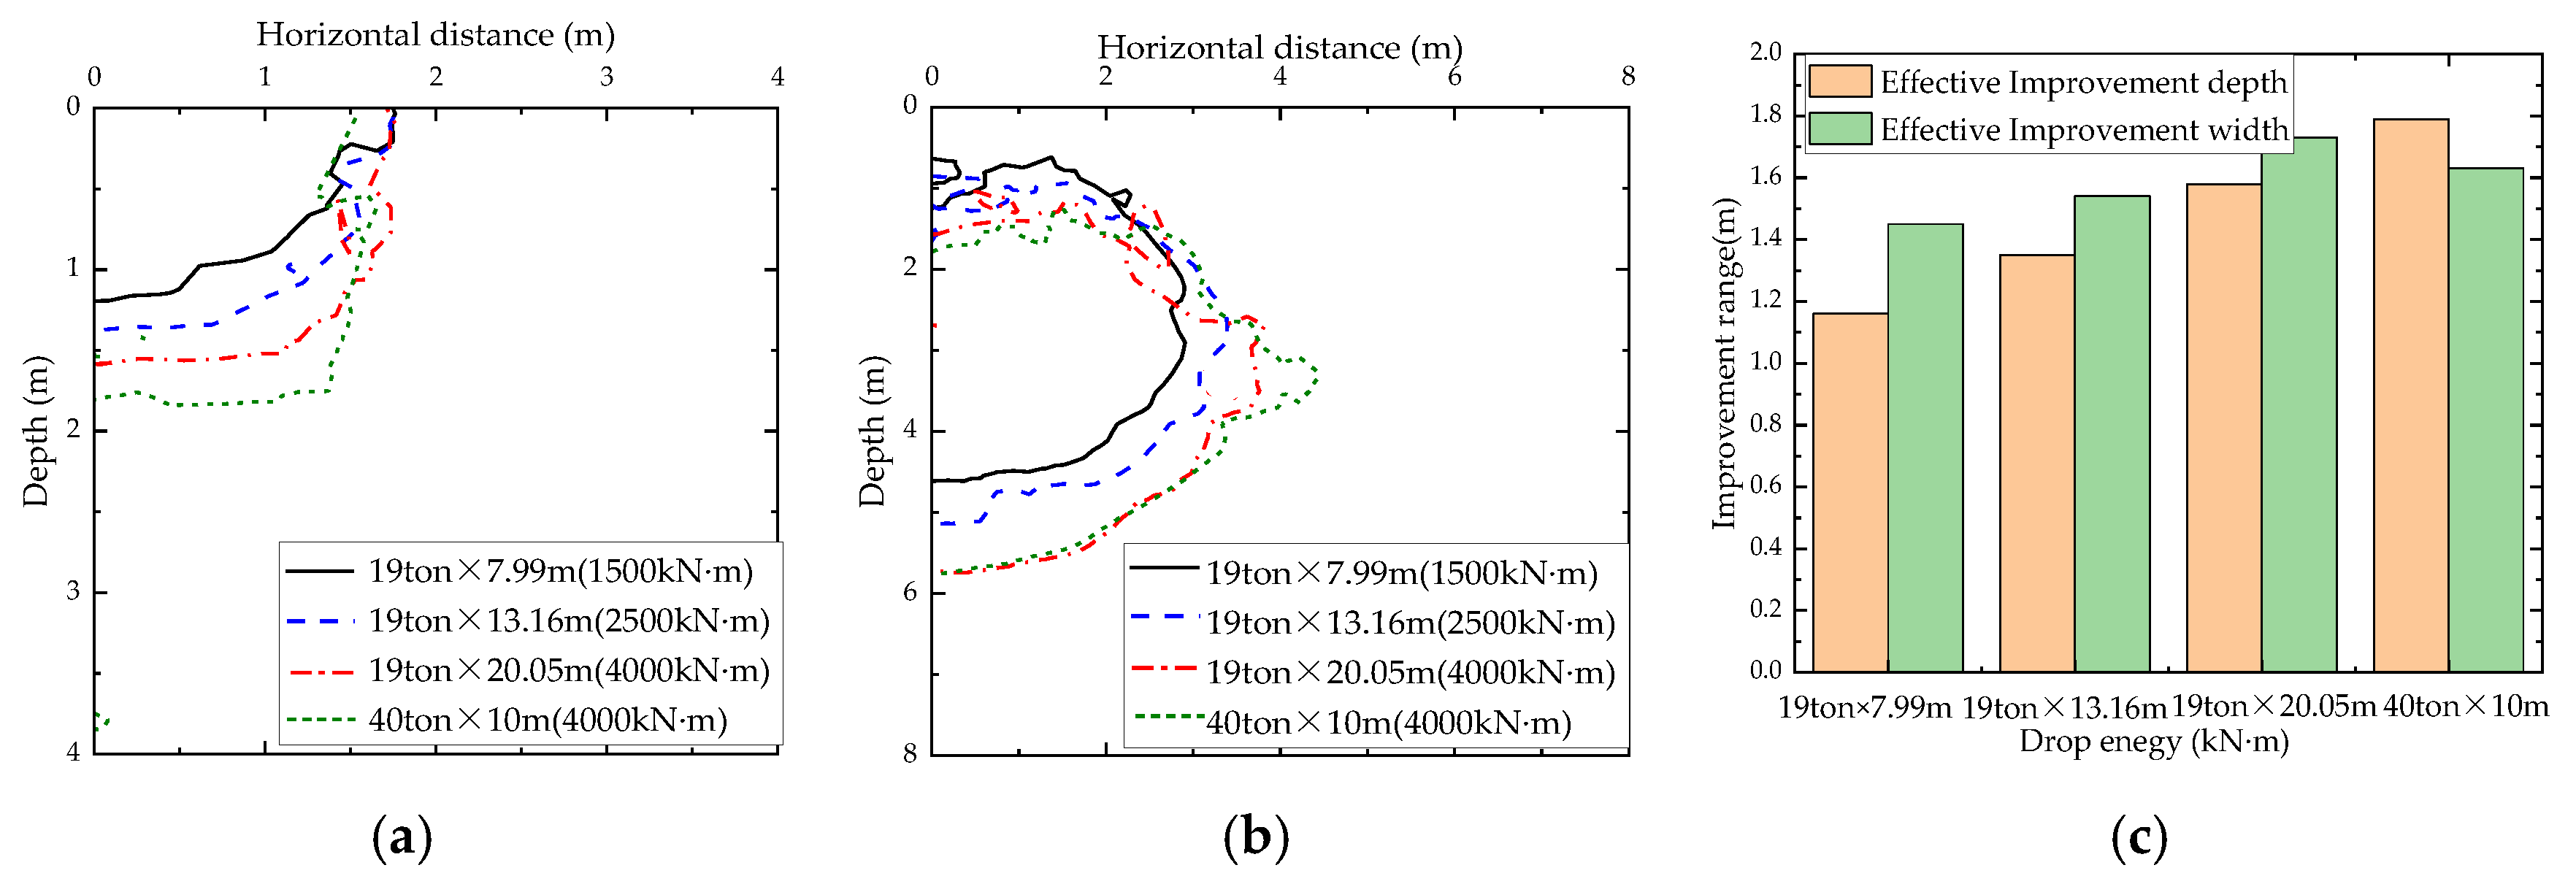
In order to accurately analyze the liquefaction and the reinforcement effect of saturated silty and sandy soils treated by dynamic compaction, a hydro-mechanically coupled explicit analysis method was proposed. The method, in combination with the cap model, was carried out using the Abaqus finite element software. Then, parametric analysis was carried out by means of the development and dissipation of excess pore water pressure, effective soil stress and the relative reinforcement degree. And the effects of the drop energy, tamper radius and soil permeability on the liquefaction zone and soil improvement of saturated soil were examined. The results demonstrated that the liquefaction zone and the effective reinforcement were determined by the drop energy rather than the permeability or tamper radius. A 2.5-times increase in drop energy can increase the maximum liquefaction depth by 1.1 m (4.6 m to 5.7 m) and the effective reinforcement depth (Ir ≥ 0.08) by 0.6 m (1.2 m to 1.8 m). It is recommended that the reinforcement effect should be improved by a lower drop energy with a low drop height and a heavy tamper in actual projects. It should also be noted that a smaller tamper radius was conducive to local soil improvement but also generated higher localized excess pore water pressures. Soil permeability critically controls liquefaction potential and excess pore water pressure dissipation. Low permeability soils experienced significant liquefaction depths and slower consolidation, whereas high permeability gravels (k = 10−2 m/s) showed minimal liquefaction and great improvements in depth. To diminish the effect of the underground water, the gravel cushions should be used to drain pore water out before dynamic compaction.

1. Introduction

Dynamic compaction (DC) is a frequent and cost-effective ground improvement technique, which has been widely applied in various types of soil including loosely packed sand [1], silt [2,3], clay [4], landfill waste [5], and collapsible loess [6], etc. Most research has focused on the effect of DC-treated dry soils involving crater depth [7,8], effective improvement depth [9,10,11], and dynamic stress distribution [12,13,14]. However, in some coastal or lakeside areas, DC has also been applied to foundations with high groundwater levels, such as marine reclamation land and airport construction [15].
In saturated soil with a high water level, skeleton deformation and inter-grain slippages of the soil occur during the DC impact process. As a result, the pore water pressure increases, which leads to local liquefaction around the impact zone. Consequently, the presence of water may significantly reduce the effectiveness of ground improvement. So, the drainage problem should be solved in practice. For example, lowering the underground water level or vacuum well-point dewatering have always been effective to soft soil foundation reinforcement with a high degree of saturation [16,17]. Currently, dynamic compaction is successfully applied to saturated clay [18] and fine-grained soils [19]. Meanwhile, an undeniable fact is that the accumulation and dissipation speed of the excess pore water pressure, dominating the densification effectiveness of saturated soil, are affected by the soil permeability and construction parameters (including drop energy and tamper radius) [20]. Thus, it is important to examine the effect of soil permeability and construction parameters on the excess pore pressure (ratio), effective stress and effective reinforced zone.
In order to examine the relationship between reinforcement effect and relative influence factors, many researchers studied the reinforcement results of DC in the field [21,22,23], where engineering judgment played an important role. Others used numerical or physical modeling to study this phenomenon [24,25,26,27]. Recently, artificial intelligence [28] and microstructural analysis methods [29] have been widely used to analyze this phenomenon. In addition, some studies have analyzed the effect of water on soil density and strength [30] and the vibrations transmitted through the soil during compaction [31]. Some studies proposed a new approach to predict the liquefaction-induced lateral spreading/displacement [32]. However, in these studies, the pore medium filled with water was unrealistically ignored or just implicitly considered based on single-phase approaches in the effective reinforcement depth of DC. Fewer studies have considered coupled hydro-mechanical simulations in saturated soil. Wang et al. [33] presented a parameter estimation method based on a coupled hydro-mechanical model of DC. Ye et al. [34] presented a readily implementable method for fully coupled u-U-type analysis of wave propagation in saturated soil with a commercial code. Zhou et al. [35] presented a fluid–solid u–U-type coupled method with a cap model to analyze the improvement in saturated foundations under DC, but the methods had drawbacks of poor computational efficiency incorporating ABAQUS overlapping meshes. In general, most of these studies mainly focused on one single impact stage or did not examine the high-pressure compaction process in saturated soils. And the mechanical behavior of saturated soil in the adjacent impact zone during the whole process of DC was very limited. Moreover, the influence of soil permeability and construction parameters on the effectiveness of DC in saturated soil is still ambiguous.
In this paper, a hydro-mechanically coupled explicit model, which can incorporate the excess pore water and the plastic deformation during the DC process, was proposed to examine the fundamental mechanism for the DC process in saturated soil more efficiently. A comprehensive comparison between the proposed model and the field test data was performed to verify the model. The liquefaction response of saturated soil treated by DC was obtained, and the reinforcement (mainly compaction) effect analysis was conducted through the liquefaction response. Then, a series of parametric studies were carried out, including the drop energy, tamper radius and soil permeability. In addition, the quantitative design insights into the above critical parameters were also provided. The research results provide a theoretical basis for DC design.

2. Hydro-Mechanically Coupled Explicit Model

2.1. Incorporation of Excess Pore Water

The proposed method considers the dynamic pore water pressure’s developing properties and consolidation process. This was achieved based on the approach documented in previous work [36,37,38], where a coupled temperature–displacement analysis with Abaqus/Explicit was utilized. By substituting the temperature with excess pore water, the excess pore water can be incorporated. The theory basis has been elaborated in detail by Hamann [36] and Staubach et al. [37,38]. Therefore, only a brief description was presented in this section.
For the pore water pressure p w as an extra unknown variable, the balance of mass of the pore water is given as an additional field equation.
φ w 1 K ¯ w d p w d t + φ w d i v ( v w ) + ( 1 φ w ) d i v ( v s ) = 0
where φ w is the porosity, K ¯ w is the bulk modulus of the water and vw and vs are the velocity of water and soil, respectively. The corresponding applied element formulation is described as the u-p formulation (the displacement of the solid phase u and the pore water pressure pw are discretized) [39].
The generalized Darcy law was used to evaluate the relative velocity ww between solid skeleton and pore water, which was derived from the linear momentum of the pore water:
w w = K P e r m η w ( g r a d ( p w ) + ρ ¯ w ( b u ¨ ) )
where KPerm is the permeability of the soil, η w is the dynamic viscosity of water, ρ ¯ w is the density of water and b is the gravity.
Based on the above, the following formula can be obtained.
φ w 1 K ¯ w d p w d t K P e r m η w ( g r a d ( p w ) + ρ ¯ w ( b u ¨ ) ) d i v ( v s ) = 0
The discretization of pore water pressure was based on Equation (3) in the finite element frame. To integrate Equation (3) into the ABAQUS explicit platform, the similarity between the energy balance of coupled thermal processes and Equation (3) was obtained. The energy balance is as follows:
ρ c θ ˙ + λ d i v g r a d ( θ ) = m T
where the specific heat c and the thermal conductivity λ are modified in such a way that the mass balance of pore water is derived.

2.2. Constitutive Model

In view of the plastic deformation observed during DC and the lack of compression yield in an elastic–plastic model, it was proposed that the cap model could be used to model soil nonlinearity under impulsive loads. It has been successfully applied to numerical simulation of DC in granular soils by Lee et al. [40], and Zhou et al. [41]. Therefore, the cap model was also adapted in this paper.
In the J1-J2 effective stress path, the yield surface of the cap model consists of two parts: a shear failure function f1 and a volumetric yield function f2, which are represented by the following equation:
f 1 = J 2 α J 1 κ = 0
f 2 = J 1 l 2 + R 2 J 2 x l 2 = 0
where f1 is the shear failure function and f2 is the volumetric yield function. J1 is the first stress invariant and J2 is the second invariant of the deviator stress tensor. α, κ and R′ are the soil parameters, which are related to cohesion c and the internal friction angle φ. l and x are the hardening parameters. The hardening parameter l is related to the other parameters, as shown below:
l = x R κ l + R α
α = 2 sin φ 3 3 sin φ
  κ = 2 3 c · cos φ 3 sin φ
The hardening parameter x is related to the plastic volumetric strain ε v p , by the empirical work-hardening relation as follows:
x = 1 D ln 1 ε v p W + x 0
where D and W are the work-hardening properties and x0 is the initial effective earth stress. ε v p is plastic volumetric strain. The numerical technique for solving the cap model was based on the general return-mapping algorithms. Detailed explanation of the algorithms can be found elsewhere [42].

3. Model Verification

3.1. Comparison of Numerical and Semi-Analytical Results for 1D Wave Propagation

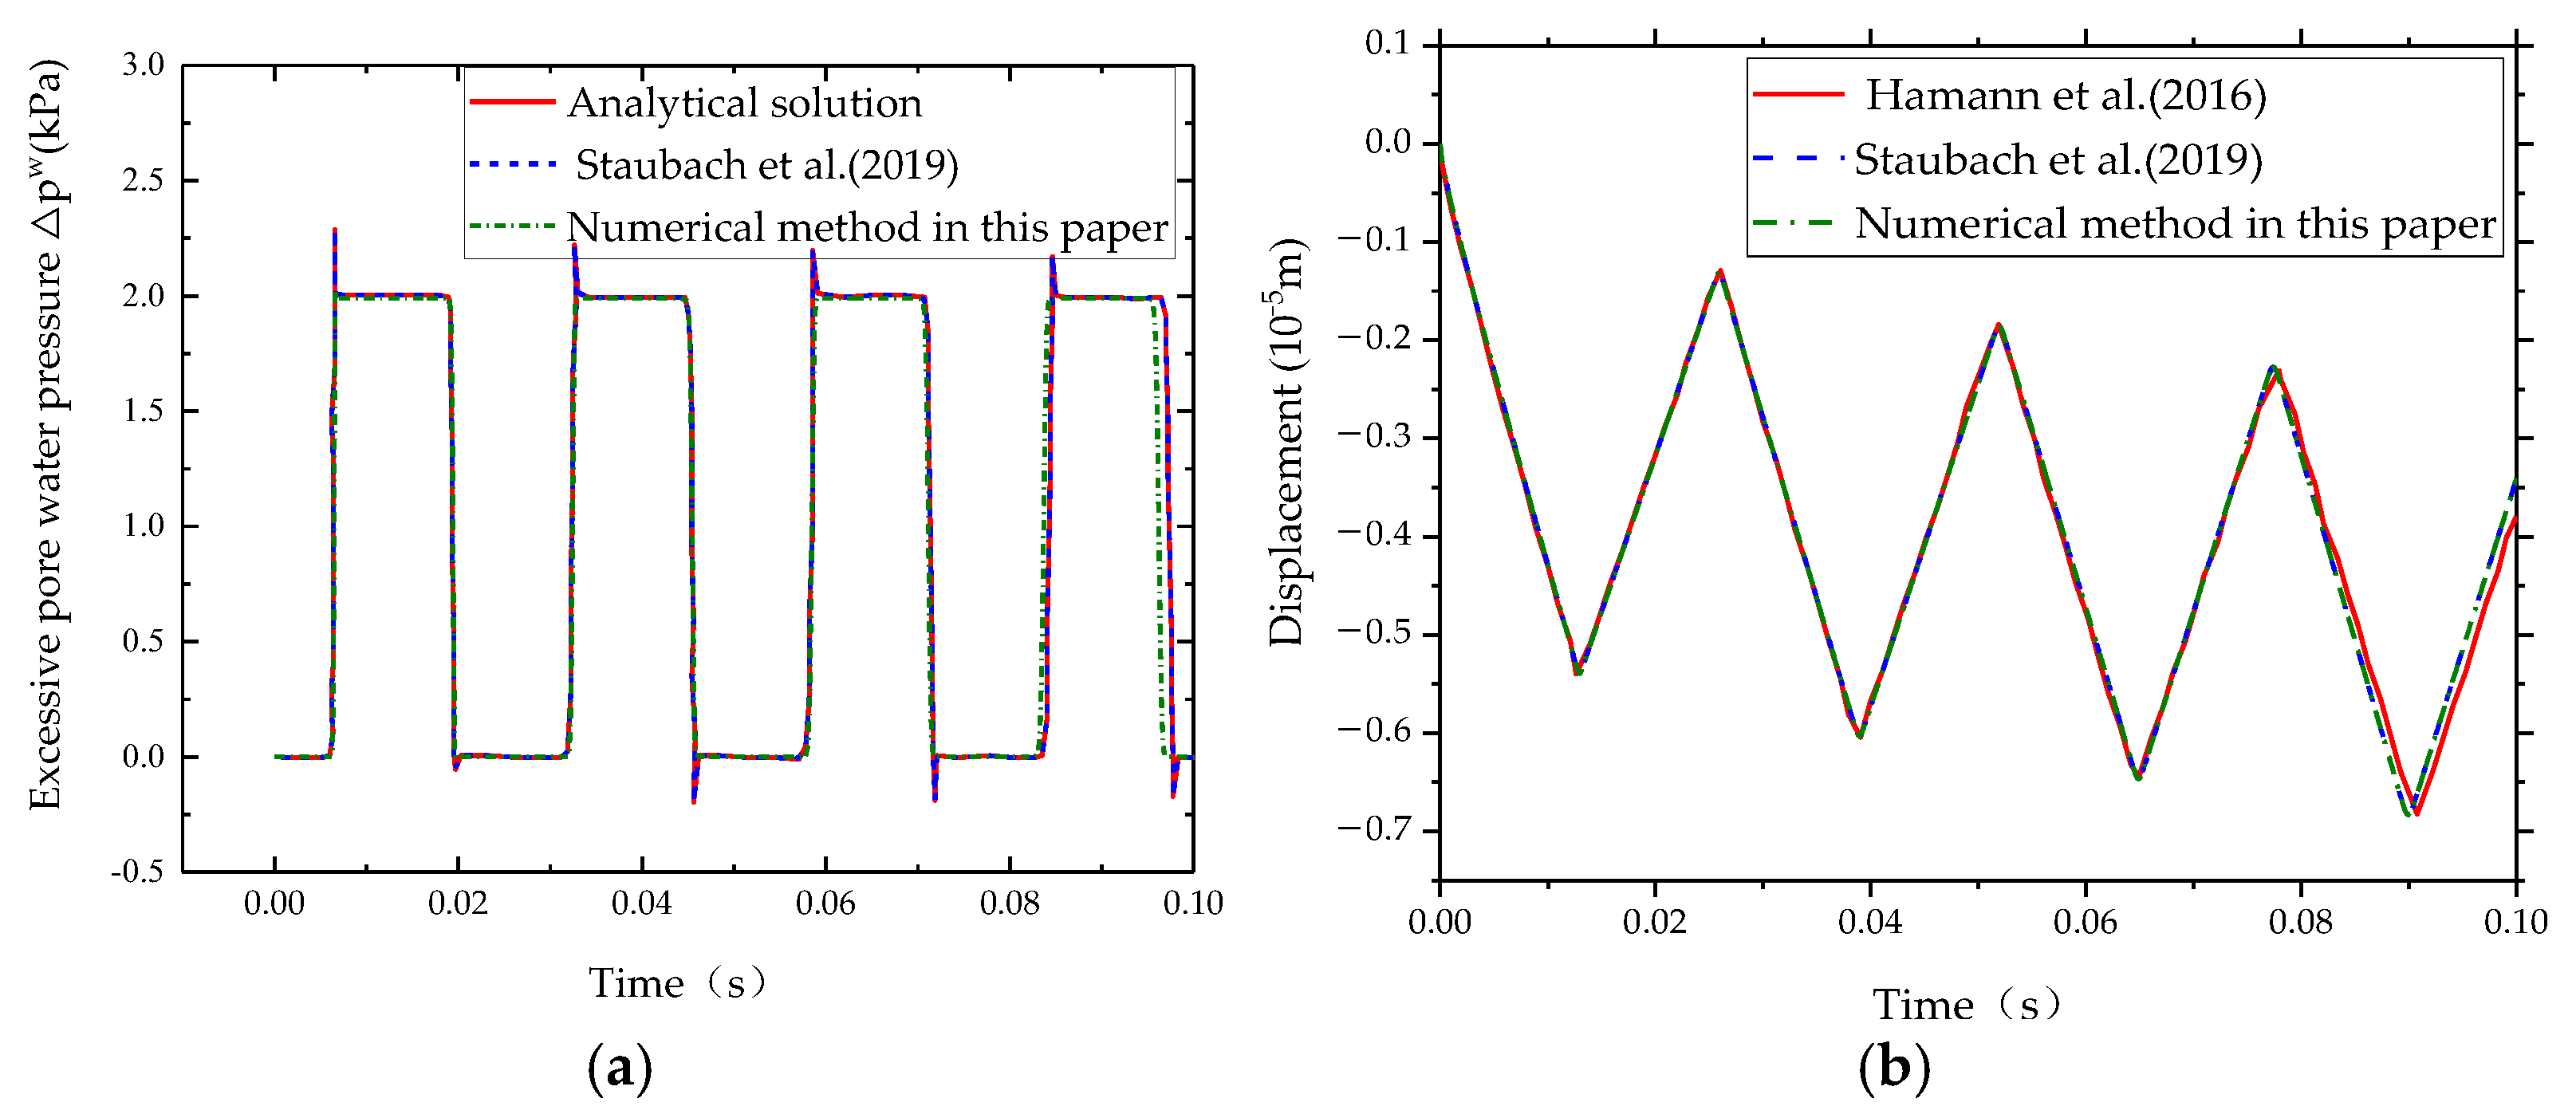
Firstly, the proposed fully coupled explicit approach was verified with an analytical solution for 1D wave propagation. The one-dimensional soil column was 10 m deep, with the top surface allowing drainage and the lateral and bottom boundary being impermeable and rigid, as shown in Figure 1. In Figure 1, the stress history of heavyside load Δσ = 1 kPa was applied to the top nodes (x = 0 m) of the solid phases at time t = 0 s. The computed excess pore water pressure histories at the bottom of the column and the settlement–time history recorded at the top of the column are plotted in Figure 2. In order to verify the presented model in this paper, the computed results were compared with the analytical solution by Hamann [36] and simulation solution by Staubach et al. [43] for the same one-dimensional soil column. It can be clearly seen that there is good agreement between the explicit numerical solution in this paper and the analytical solutions by Hamann [36] and the coupled FEM results of Staubach et al. [43]. Therefore, the presented model in this paper is accurate.

3.2. Verification of Coupled Model

The in-site test data of DC in the Lianyungang-Xuzhou Highway project reported by Miao et al. [44] were chosen as the presented model for the saturated case. The soil layer characteristics were liquefiable silty soil (0–4 m in depth), liquefiable silt layer (4–9 m in depth) and underlying clay layer (below 9 m in depth). The groundwater table coincided with the ground surface. The energy per drop with 2500 kN·m was performed to improve soil. A 19-ton tamper with a bottom radius of 1.3 m was adopted in this compaction test. During the DC process, various types of field observation data including lateral displacement, surface settlement and pore water pressure were recorded via different sensors.
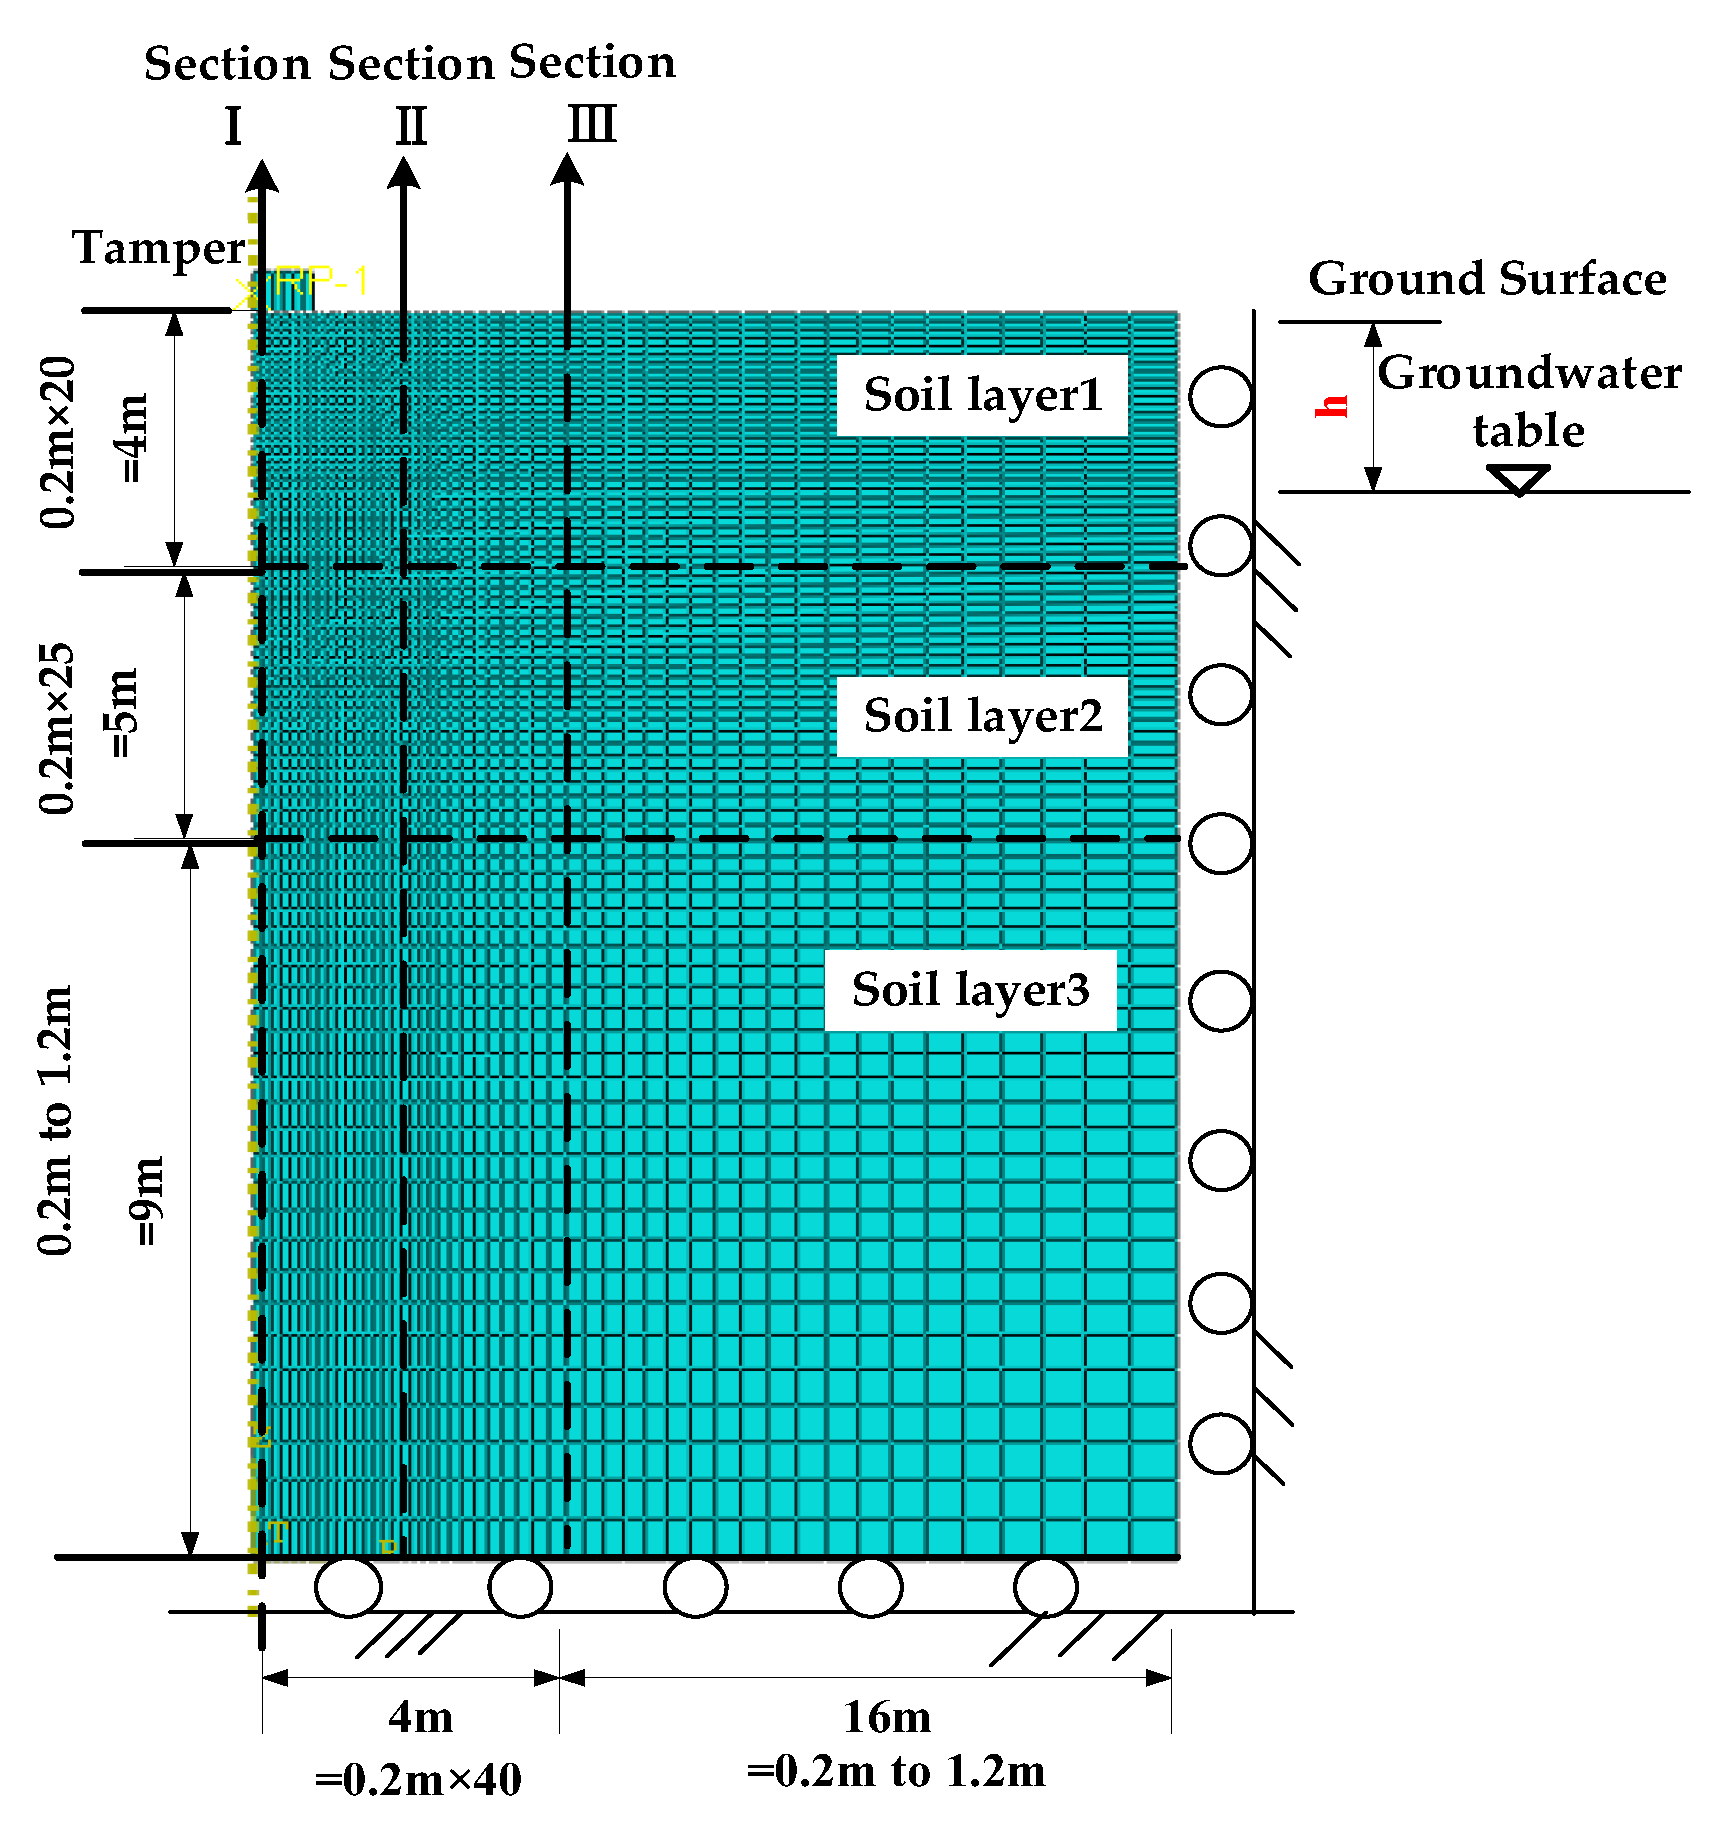
To verify the proposed coupled explicit model, a two-dimensional axisymmetric finite element model was built to analyze the whole process of soil compacted as shown in Figure 3. The size of the whole model was 20 m × 20 m, and the model consisted of four-node axisymmetric quadrilateral elements with reduced integration. The fixed horizontal boundary condition was applied for the vertical boundaries, and the bottom was fixed in both vertical and horizontal boundary conditions. For computational efficiency, a refined mesh size of 0.4 m was adopted within the 4 m zone directly under the tamper in the finite element model. The soil parameters used in saturated soil analysis are presented in Table 1. The coefficients of permeability and the bulk modulus of pore water were assumed as 1 × 10⁻⁷ m/s and 1 × 10⁴ kPa based on Wang et al. [33] and Zhou et al. [35]. The tamper was simulated as a rigid body, with a prescribed velocity of 16.3 m/s deduced from the free-falling considerations of 2500 kN·m drop energy. A time step of 10−5 s was used during the explicit analysis.
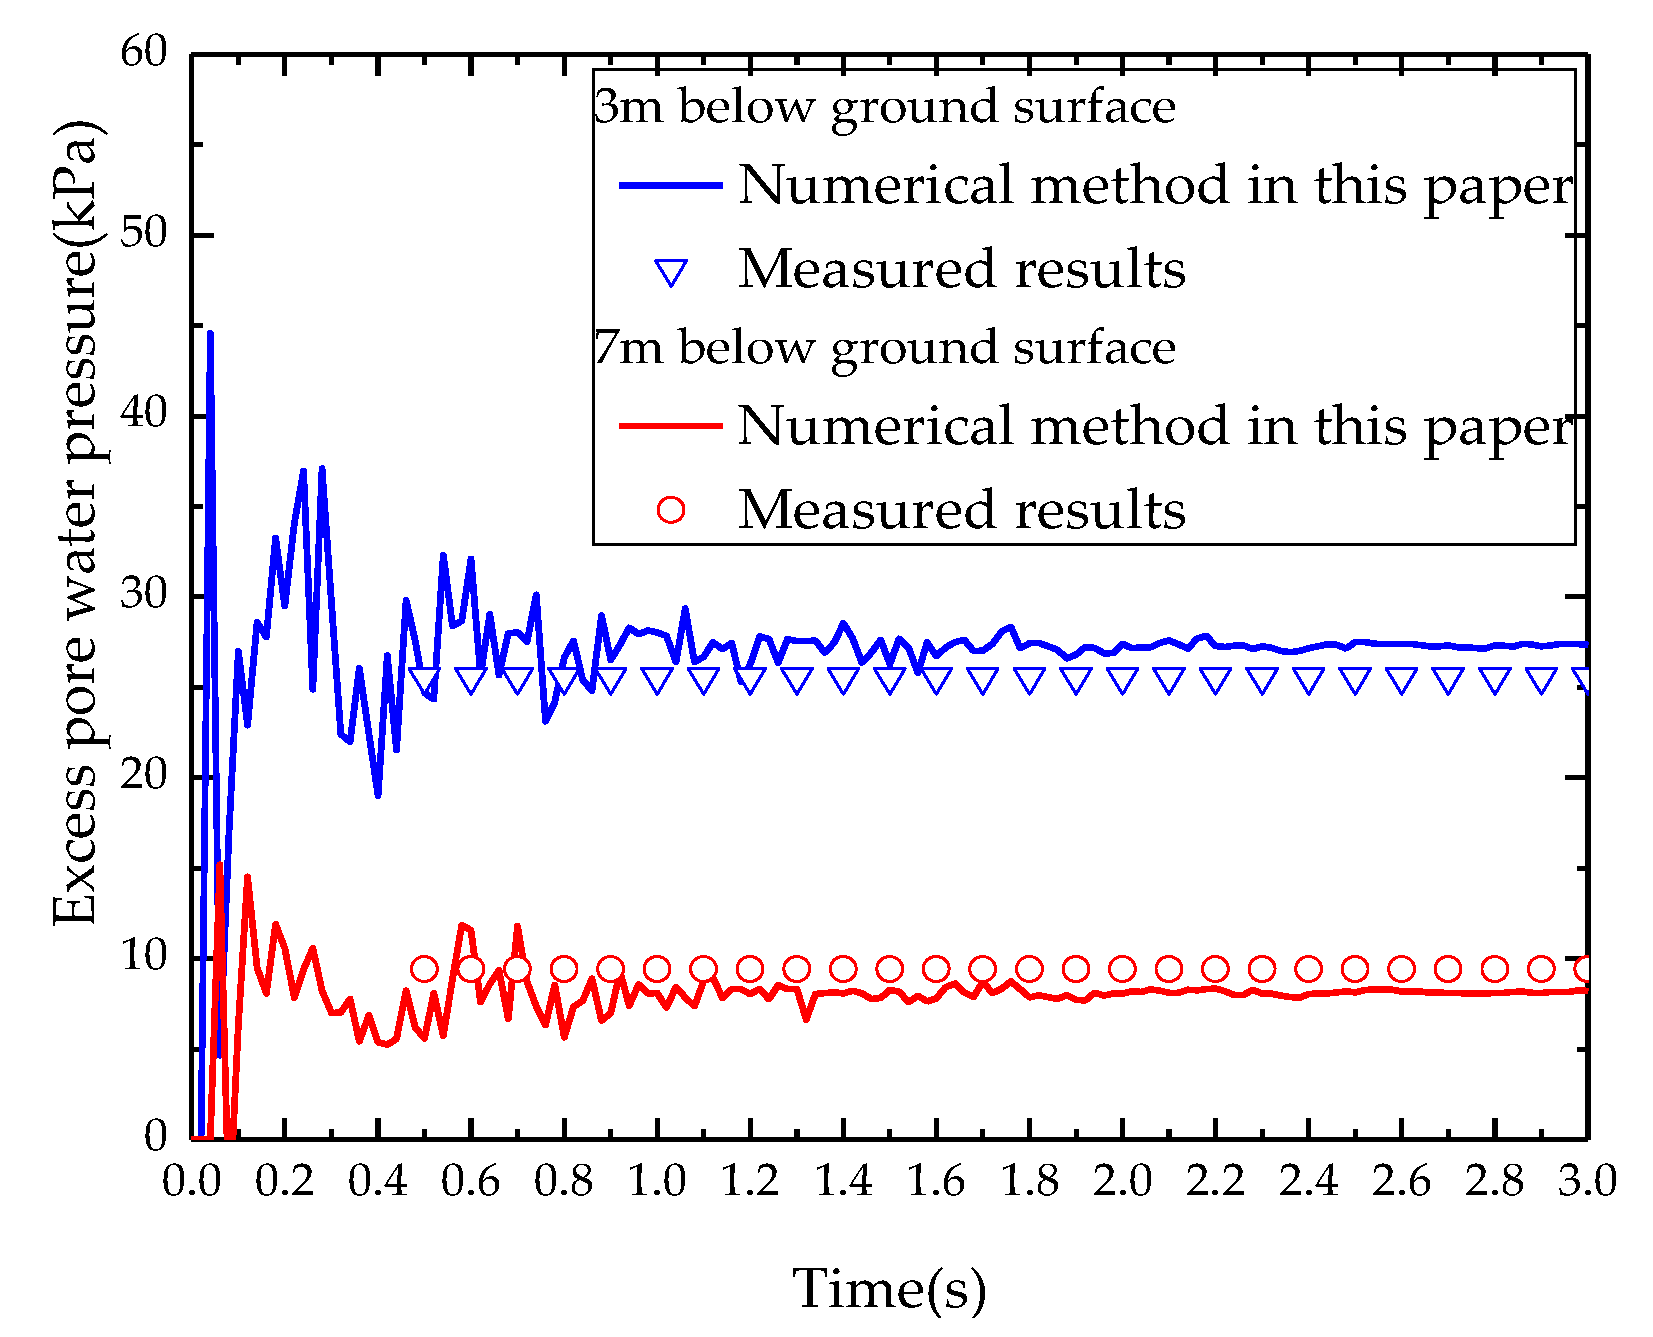
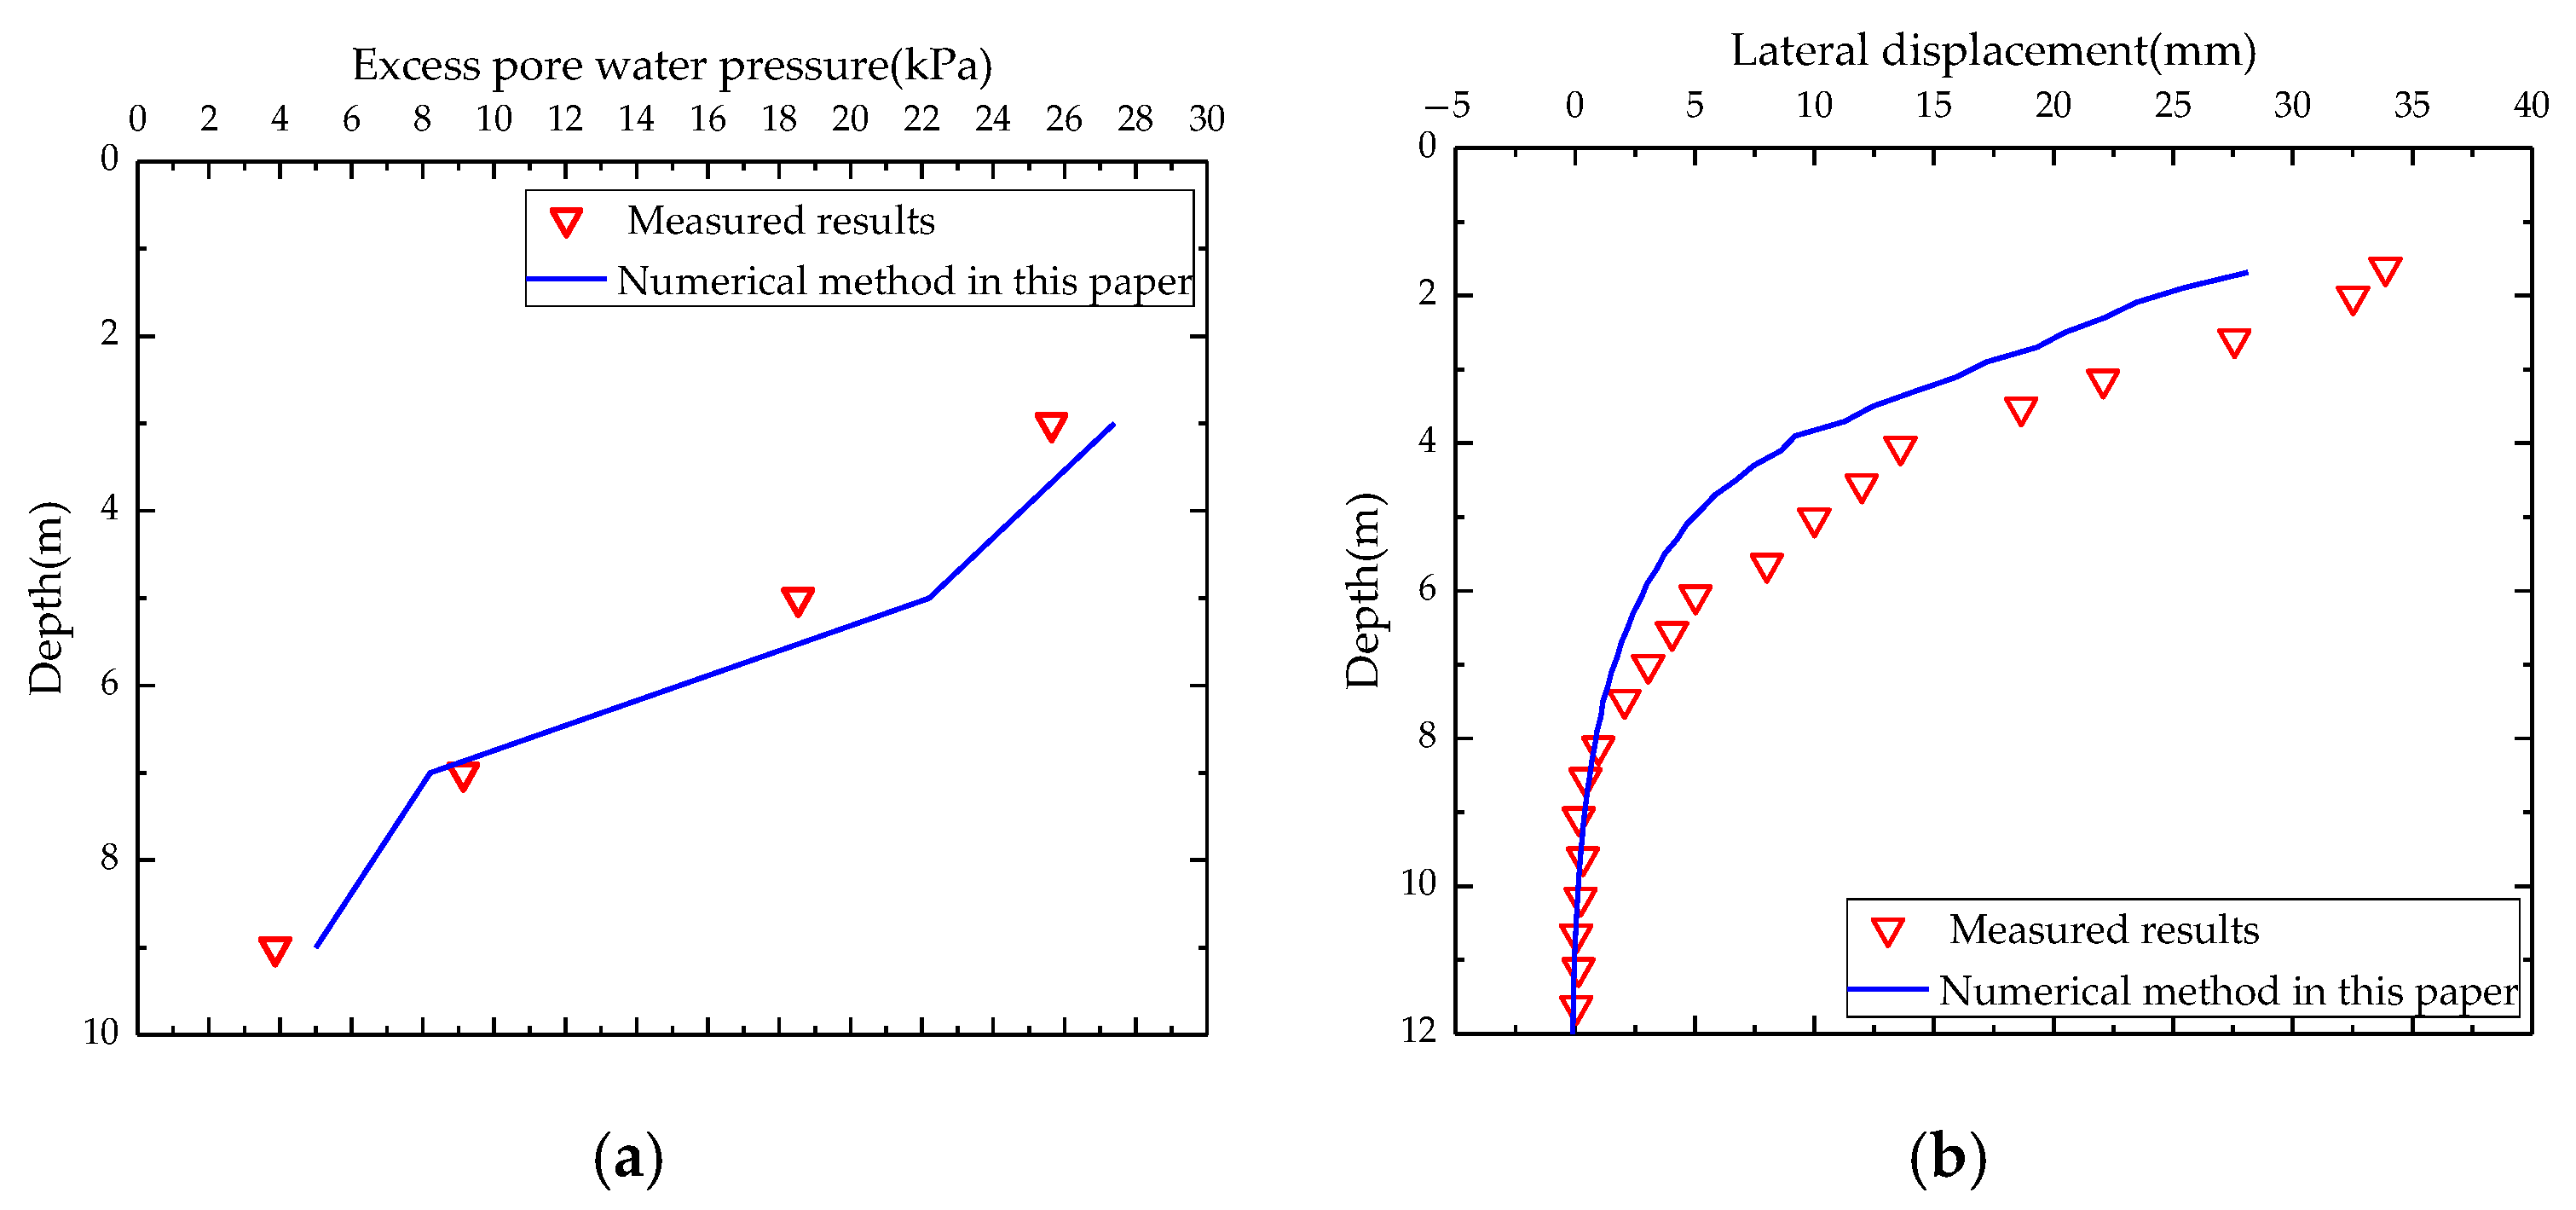
Figure 4 shows the comparison of the excess pore pressure variation with time for the 2500 kN·m drop energy. The numerical results indicate that the performance of the excess pore pressure predicted by the hydro-mechanically coupled cap model is in good agreement with the measured values, while the predicted lateral displacements (Figure 5) by the hydro-mechanically coupled cap model were slightly underestimated at depths less than 6.0 m for the case of 2500 kN·m. This incongruity was mainly attributed to the ignorance of the treatment of the tension cutoff region. Considering the effect on the ground heave around the compacting area by tensile stress, the simulation results were affected by the tension cutoff treatment. Meanwhile, the hydro-mechanically coupled cap model neglected the strain rate effects of the soil, which may lead to lower lateral displacement values. The numerical results for crater depths obtained from the proposed model and those recorded in the field are compared in Table 2. For the case of 2500 kN·m drop energy, the proposed model exhibited errors of about 0.5%.
In summary, the excellent agreement of the comparative results above provides compelling evidence in support of the proposed method’s reliability and robustness with regard to allowing the effective capturing of (excess) pore water pressure, lateral displacement and crater depth during DC in saturated soil.

4. Parameter Analysis

In this section, the effects of drop energy, tamper radius and soil permeability on the DC reinforcement effect, the excess pore water pressure variation and dimensions of liquefaction zone during the DC process were investigated based on the model as shown in Figure 3. It should be noted that when one parameter was evaluated, the other parameters were kept unchanged.

4.1. Reinforcement Mechanism and the Influence

In order to carry out an evaluation on the reinforcement mechanism of saturated silty and sandy soils by DC, three performance metrics, excess pore water pressure △u, effective stress increment △Sy′, the relative degree of reinforcement Ir and the excess pore water pressure ratio △ru, were introduced. The relative degree of reinforcement Ir was calculated as follows:
I r = D r - D r 0 100 - D r 0
where Dr0 and Dr are the relative density of soil before and after DC. These indexes can be utilized to eliminate the influence of different soil types on the reinforcement effect [11,25].
The item of excess pore water pressure ratio △ru was defined to quantify the liquefaction potential, which was characterized as follows:
Δ r u = Δ u σ s
where σs′ is the initial geostress before DC. Soil liquefaction is supposed to happen as △ru reaches 0.95 [45].
Figure 6, Figure 7, and Figure 8 show the variation in △u, △Sy′ and Ir in a saturated soil foundation with 0 m groundwater table. It is shown that at the impact stage of DC (t = 0.02 s), the excess pore water pressure △u increases instantaneously to quite a high stress level (△umax = 945 kPa). This is due to the undrained loading conditions, where the saturated soil skeleton transfers compressive stress primarily to pore water, consistent with Terzaghi’s effective stress principle. The effective stresses were transmitted into the upper soil with △Symax′ = 1160 kPa, which led to a contour of Ir = 0.08 in the range of 2 m × 2 m (horizontal and vertical areas). It was proved that the reinforcement effect greatly relied on conversion rates of the drop energy (i.e., effective stress increment), which finally acted on the soil skeleton to compress the soil into a denser state. As a continuation of wave propagation, as shown in Figure 6b, Figure 7b and Figure 8b, the max excess pore water pressure △umax dropped from 945 kPa at t = 0.02 s to 197 kPa at t = 0.06 s, and the corresponding △Symax′ at the edge of tamper fell from 1160 kPa at t = 0.02 s to 334 kPa at t = 0.06 s, initiating partial drainage and soil skeleton rearrangement. This could also be illustrated by the shrunken contour line of △u = 80 kPa, △Sy′ = 10 kPa and Ir = 0.08. In addition, the maximum value of excess pore water pressure △umax = 80~95 kPa was reported with a 0.5 m lateral range near a depth of 4 m and entered a slow dissipative stage due to the lower permeability (10−7 m/s) of the soil layer, confining effective stress increments and soil densification to shallow depths. This highlights the critical role of drainage capacity in DC efficiency. At the unloading stage, the excess pore water pressure induced by DC may lead to liquefaction. The effective stress increment declined to △Symax′ = 0 kPa and the contours of Ir = 0.08 were in the range of 1.8 m horizontally and 1.3 m vertically below the ground surface. This implied that a high proportion of the dynamic impact was first transferred to the pore water, and the densification effectiveness for saturated deposits was mainly dominated by the soil permeability and groundwater table. Namely, the improvement effect of saturated soil was mainly affected by the soil permeability and groundwater table due to its dissipation speed of excess pore water pressure.

4.2. Effect of Drop Energy

The numerical simulation of DC was performed with drop energy ranging from 1500 to 4000 kN·m, tamper radius R = 1.3 m and high groundwater table of h = 0 m. Based on the model, the improvement of the drop energy on the soil and development of the liquefaction zone was investigated. Figure 9 and Figure 10 illustrate the cloud charts of excess pore water pressure for various drop energy at the initial moment of DC (t = 0.02 s) and the end moment of DC (t = 4.0 s), respectively.
As for the above moment, the max excess pore water pressure occurred around the loading zone. And higher drop energy led to a larger excess pore water pressure. For the drop energies MH = 19 t × 7.99 m = 1500 kN·m and 19 t × 13.16 m = 2500 kN·m, i.e., the combinations of 4000 kN·m with 19 t × 20.05 m and 40 t × 10 m, the excess pore water pressure reached its peak values of 742 kPa, 945 kPa, 1020 kPa and 1035 kPa at time of 0.02 s, respectively. Then, the values decreased to 85.5 kPa, 87.56 kPa, 94.5 kPa and 101.5 kPa at the end of impact loading, respectively. The results indicated that the drop energy plays a crucial part in dimension of excess pore water pressure under DC, which is consistent with the field investigation by Jia et al. [46]. Moreover, the difference in the max excess pore pressure at t = 4 s for 1500 kN·m and 4000 kN·m drop energy reached 18%. In other words, a 2.5-times increase in drop energy resulted in a 18% increase in the △umax. This nonlinearity arises from energy dissipation through plastic deformation beyond a critical threshold, reducing compressibility gains. It means a further increase to 4000 kN·m drop energy has little effect on the extension of the excess pore water pressure.
Figure 11 and Figure 12 illustrate the contours of the excess pore water pressure ratio for different drop energies. As can be seen, the maximum liquefaction depth reached 4.6 m, 5.1 m, 5.6 m and 5.7 m for the drop energies of 1500 kN·m and 2500 kN·m, and the combinations of 4000 kN·m with 19 t × 20.05 m and 40 t × 10 m. The relative difference in the maximum liquefaction depth between drop energies of 1500 kN·m and 4000 kN·m was about 24%.
Figure 12a describes the contours of Ir = 0.08 and Figure 12c gives the exact value of the improvement range. As can be seen, the regional extent of Ir = 0.08 commonly increased as the drop energy increased. However, there were restrictions on improving soil reinforcement by increasing the drop energy. For example, the effective reinforcement depth increased from 1.2 m when MH = 1500 kN·m (19 t × 7.99 m) to 1.8 m when MH = 4000 kN·m (40 t × 10 m) during the first blow. It indicated that the effective reinforcement depth can only be increased by 0.6 m even when the drop energy doubled. It should also be noted that greater improvements and excess pore water pressure ratios were observed when using a heavy tamper with low drop height (40 t × 10 m) compared to that of a light tamper with high drop height (19 t × 20.05 m). This was due to superior stress distribution as a larger contact area minimizes energy loss via stress wave scattering, aligning with the stress dispersion theory. This was also consistent with the observations in the literature [11,25,47], in which a heavy tamper with low drop energy was more beneficial to the expansion of the improvement range. Therefore, it is recommended to use an appropriate low tamping energy with a heavy tamper of low drop energy to strengthen the saturated soil foundation in practical engineering.

4.3. Effect of Tamper Radius

The numerical simulation of DC was performed with drop energy MH = 2500 kN·m and a tamper radius (R) ranging from 0.6 to 1.8 m. In this way, the influence of the tamper radius on the soil improvement and development of the liquefaction zone was investigated.
In Figure 13 and Figure 14, for the case of the beginning (t = 0.02 s) and the ending (t = 4.0 s) of DC, the smaller the tamper radius was, the larger the maximum value of excess pore water pressure was. We can take the maximum excess pore water pressure △umax as an example, which reached peak values of 990 kPa, 975 kPa, 945 kPa and 798 kPa for the tamper radius R = 0.9 m, R = 1.1 m, R = 1.3 m, and R = 1.8 m at t = 0.02 s, and then dropped to 94.5 kPa, 92.4 kPa, 87.5 kPa and 81.0 kPa at t = 4.0 s. The results meant that DC becomes locally more effective, which is attributed to the reductive dimension of the tamper. However, the difference was not especially noticeable.
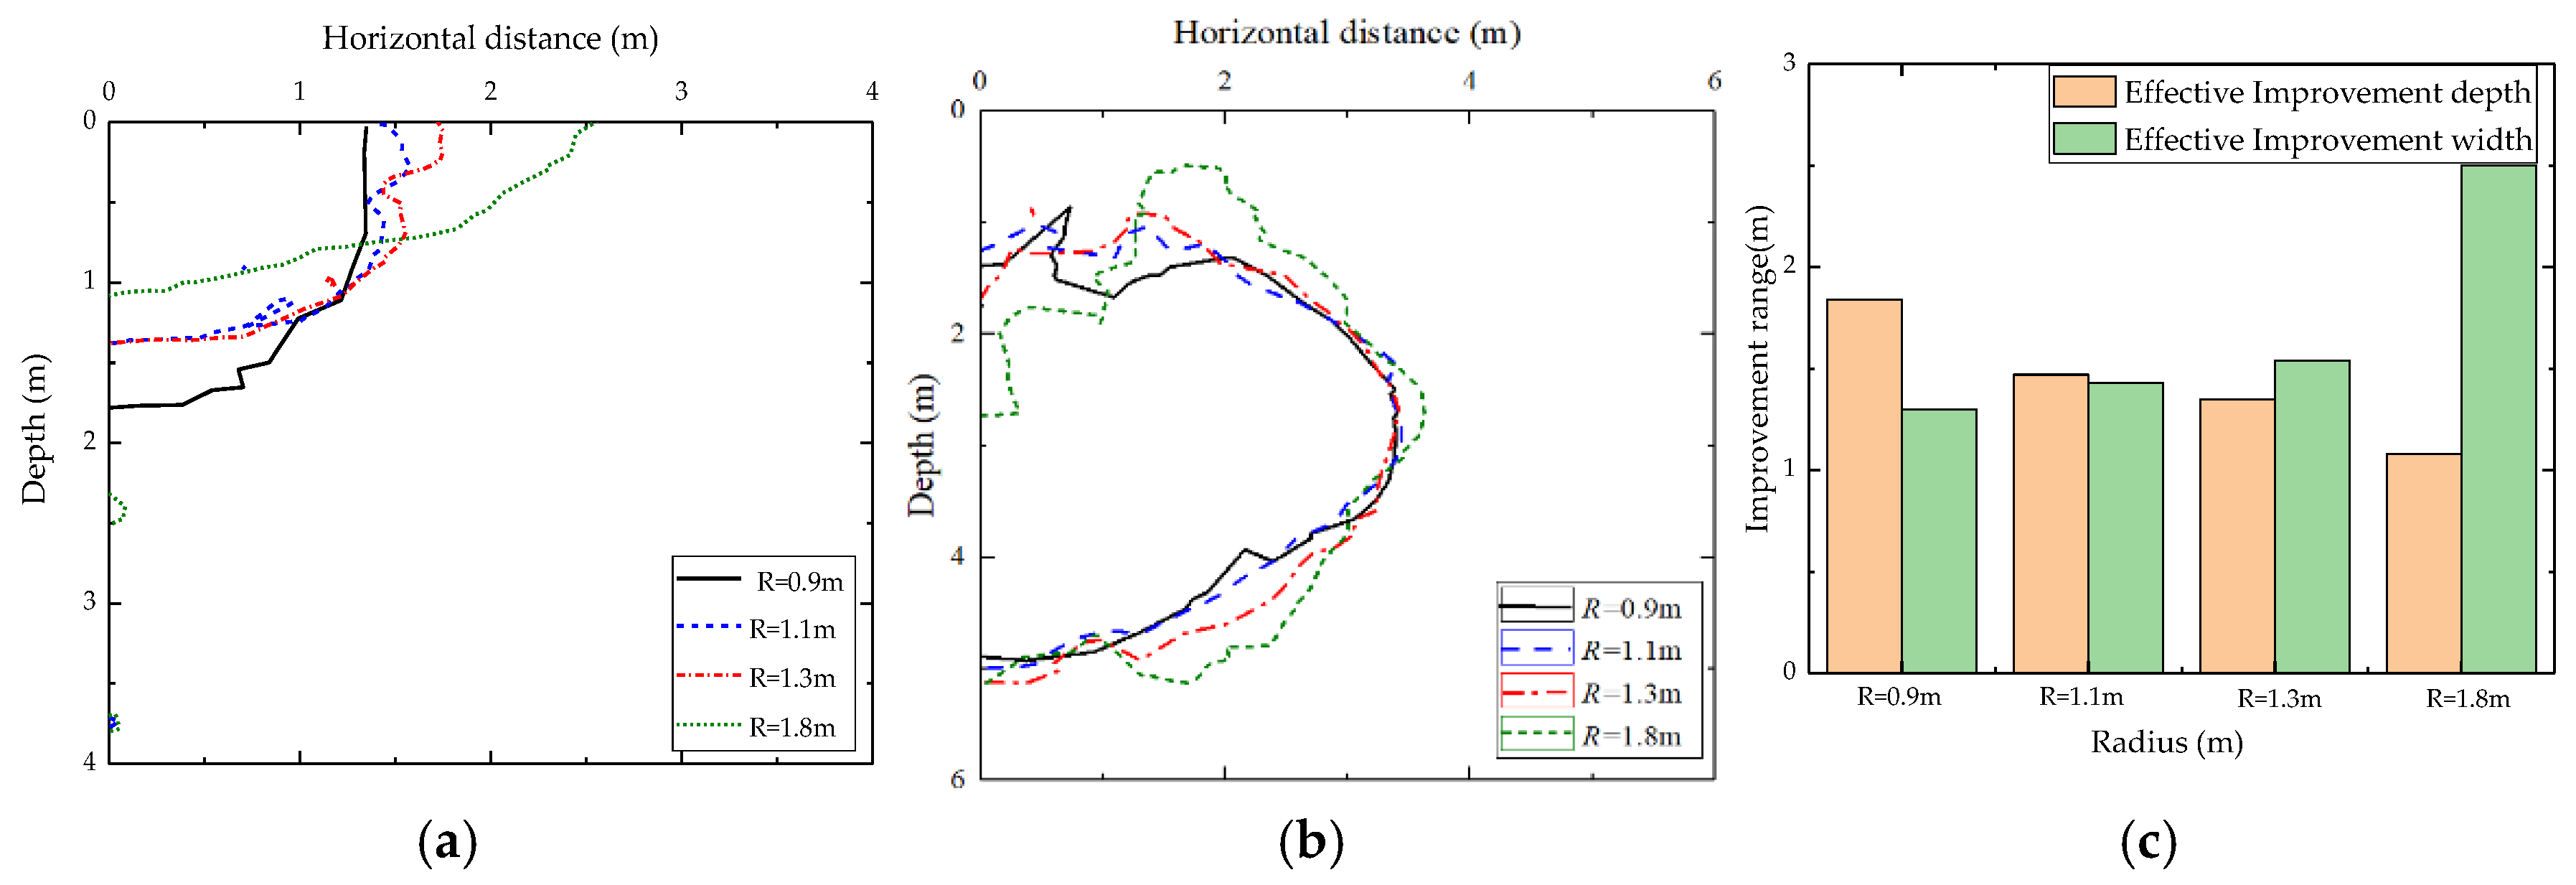
Further inspection of Figure 15 and Figure 16 indicated that the liquefaction zone expanded as the tamper radius increased. This was mainly because a smaller tamper radius would produce a greater impact pressure, resulting in the local maximum pore water pressure. Taking into account the large tamper radius with a large acting area and the low permeability of soil that cannot be drained in time, the pore pressure accumulated as a result, and a larger liquefaction zone was eventually formed.
The foundation improvement effects of DC for different tamper radii are shown in Figure 16. It can be seen that the effective improvement depth and width of Ir = 0.08 are about 1.84 m and 1.3 m for R = 0.9 m, 1.47 m and 1.43 m for R = 1.1 m, 1.35 m and 1.54 m for R = 1.3 m, 1.08 m and 2.5 m for R = 1.8 m. This demonstrates that a smaller tamper radius can be used to obtain a more pronounced and better reinforcement effect in a local limited range. Despite the greater improvement for smaller R (Figure 16c), engineers must balance this benefit against the risk of excessive cratering in low-permeability soils.

4.4. Effect of Permeability

The numerical simulation of DC was performed with the typical values of the soil permeability coefficients, k = 10−2 m/s, 10−3 m/s, 10−5 m/s and 10−7 m/s, representing gravel, coarse sand, silt, and silty clay. Based on the above parameters, the influences on the improvement effect of DC and the liquefaction zone were investigated in detail. Figure 17 and Figure 18 show the cloud charts of excess pore water pressure for various permeability values, where t = 0.02 s and t = 4 s represent the moment of impact stage and the moment of unloading stage, respectively.
It can be seen that the max excess pore water pressure △umax rose dramatically from 576 kPa to 836 kPa when the soil permeability coefficient decreased from k = 10−2 m/s to k = 10−3 m/s. However, it showed a slow increase from 935 kPa to 945 kPa for k = 10−5 m/s and k = 10−7 m/s. At the final moment of the impact loading, the max excess pore water pressure dropped rapidly to 1 kPa for k = 10−2 m/s, and it remained about 28 kPa, 81.4 kPa and 87.5 kPa for k = 10−3 m/s, k = 10−5 m/s and k = 10−7 m/s, respectively. It also proved that permeability had a strong impact on the excess pore water pressure. Since coarse sand, silt, and silty clay made it impossible for the pore water to drain water in time, this would lead to continuous accumulation of pore water pressure. Therefore, it was only allowed for the continuous impact on gravel foundation because of its high dissipation capacity of pore water.
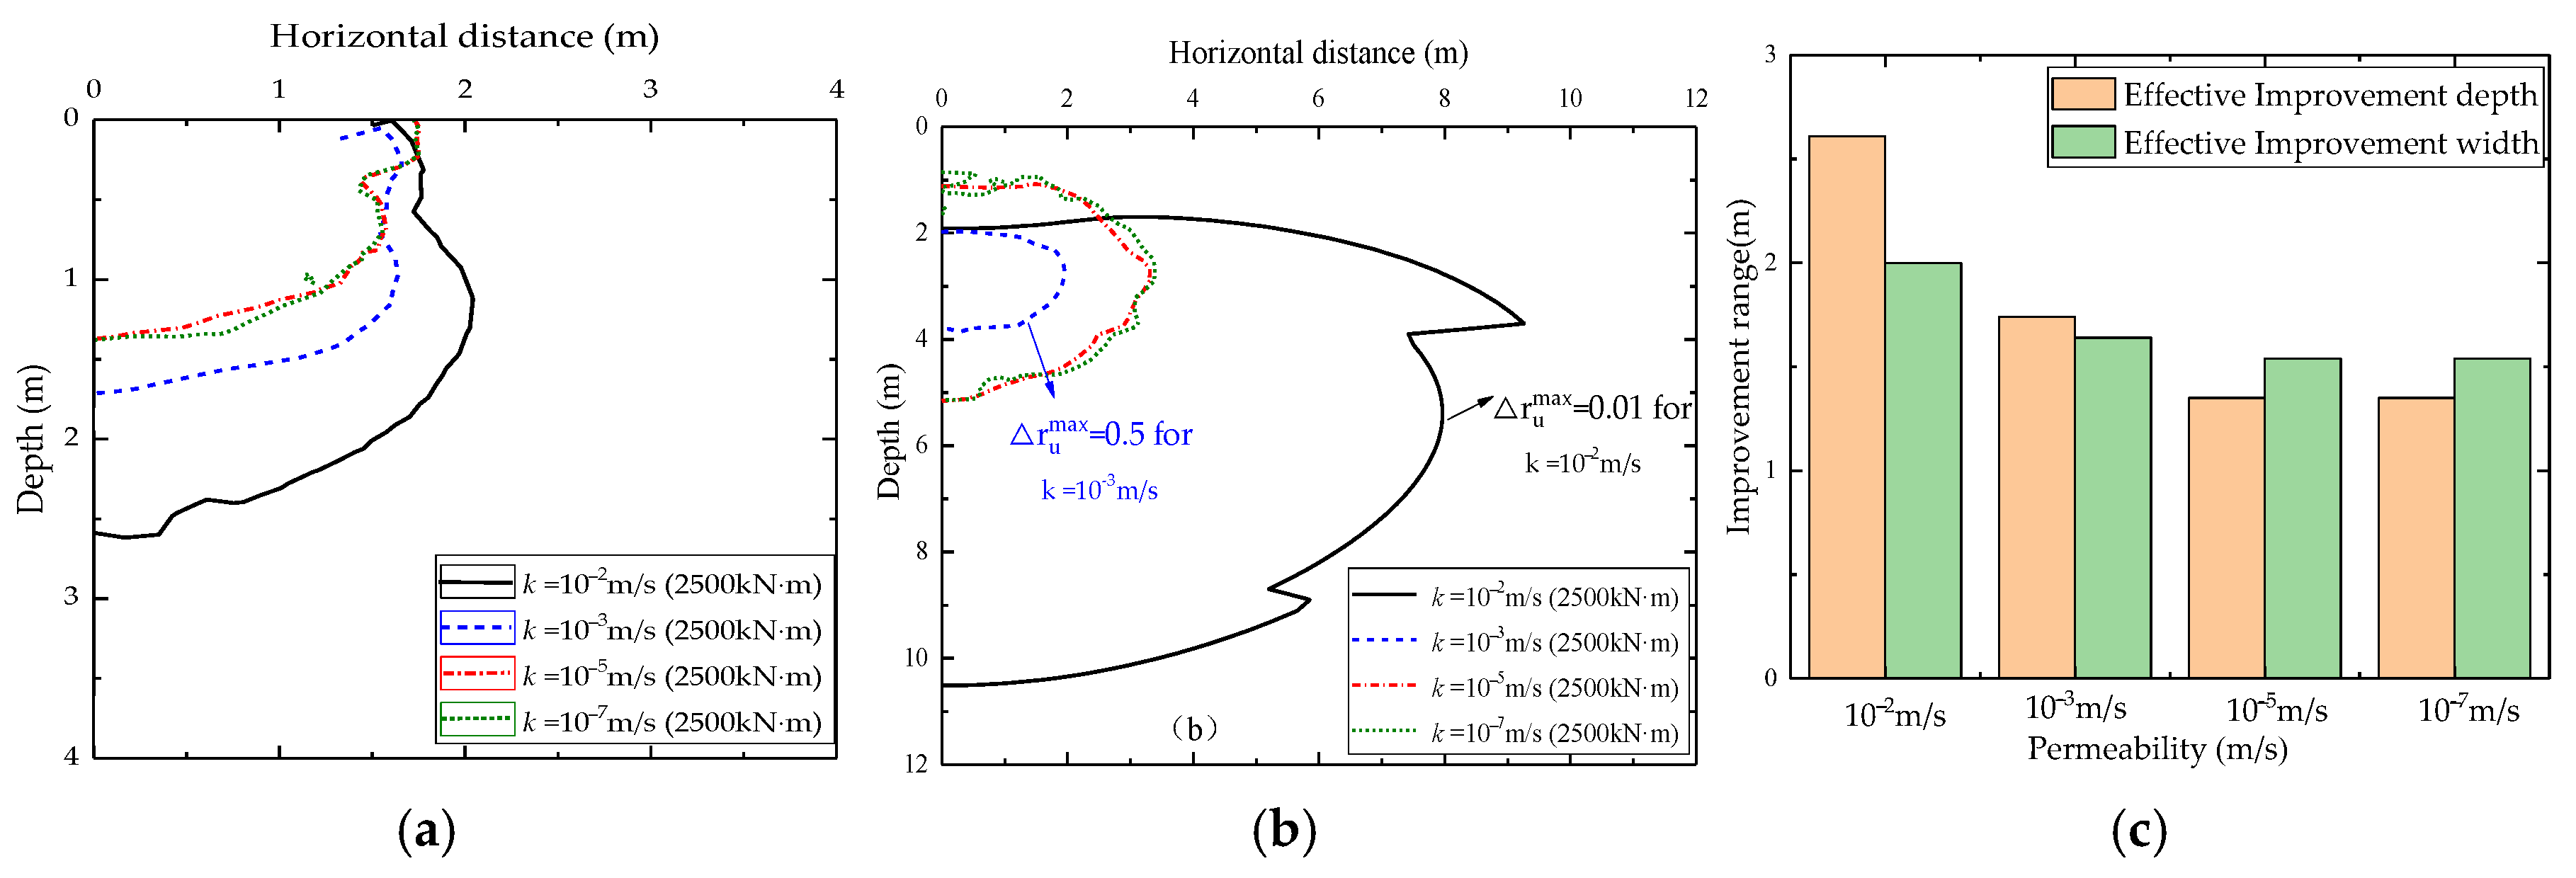
The effects of permeability on the liquefaction zone are given in Figure 19. As can be seen, the lower the ground permeability, the wider the liquefaction zone will be. To be specific, the maximum liquefied depth increased to about 5.1 m and 5.3 m for 10−5 m/s and 10−7 m/s at the end of DC. However, the max excess pore water pressure ratio △rumax was about 0.01 and 0.5 within the localized zone for k = 10−2 m/s, and k = 10−3 m/s, respectively. This means that there was no soil liquefaction for k = 10−2 m/s and k = 10−3 m/s. In practical engineering, it is recommended that the reinforcement effect of foundations with a high groundwater table and low permeability can improve performance by increasing gravel/stone cushion. It also more suited to strengthen saturated soil than other materials.
As shown in Figure 20a, there was a gradually increasing trend in the zone of Ir = 0.08 with the increase in permeability coefficient, whereas the incremental values generally maintained almost constant for permeability coefficients within 10−7 m/s~10−5 m/s. This was expected since part of the impact energy was transmitted to the pore water and the whole impact energy cannot contribute to soil compaction. The specific improvement range is given in Figure 20c. As can be seen, the effective improvement depth and width of Ir = 0.08 are about 2.6 m and 1.8 m for k = 10−2 m/s, 1.74 m and 1.64 m for k = 10−3/s and 1.35 m and 1.54 m for k = 10−5/s and k = 10−7/s. Therefore, soil with high permeability may lead to a better reinforcement effect in areas shallower than 2.5 m.
In conclusion, higher permeability encourages excess pore pressure to dissipate quickly, facilitates the compaction process and increases the area of the improvement zone.

5. Conclusions

A hydro-mechanically coupled explicit analysis method with a cap model was proposed to study the behaviors of the saturated soil improved by DC. The effect of drop energy, tamper radius, and soil permeability has been studied in detail by means of the development of excess pore water pressure, effective soil stress and the relative degree of reinforcement. The main conclusions drawn from this study are as follows:
(1)
The hydro-mechanically coupled explicit analysis method shows good agreement with field test data. It can also predict stresses, displacements, and pore pressures of saturated soil under DC with higher accuracy.
(2)
Drop energy is the primary factor governing both the extent of the liquefaction zone and the effective reinforcement depth. A 2.5-times increase in drop energy can increase the maximum liquefaction depth by 1.1 m (4.6 m to 5.7 m) and the effective reinforcement depth (Ir ≥ 0.08) by 0.6 m (1.2 m to 1.8 m). It is recommended that the reinforcement effect should be improved by reducing drop energy with a low drop and a heavy tamper in real-life projects.
(3)
A greater tamper radius can extend the dimension of the liquefaction zone but lower localized excess pore water pressures. A smaller tamper radius can effectively improve the local soil improvement but also generate higher localized excess pore water pressures.
(4)
Soil permeability critically controls the liquefaction potential and the excess pore water pressure dissipation. Low permeability soils demonstrated significant liquefaction depths and slower consolidation, whereas high permeability gravels (k = 10−2 m/s) showed minimal liquefaction and greater depths. To diminish the effect of the underground water, the gravel cushions should be used to drain pore water out before dynamic compaction.
This research has several benefits, as outlined above, but we were unable to simulate the dissipation of excess pore water pressure accurately due to the 2D assumption. Therefore, future research will be focused on extending the method to 3D multi-point DC analysis for saturated soils, in which the excess pore pressure dissipation situation after DC can be incorporated.

Author Contributions

Conceptualization, S.M. and X.Y.; methodology, G.Z. and C.Z.; software, C.Z.; validation, C.Z. and C.L.; investigation, G.Z. and R.X.; resources, Z.W.; data curation, J.L.; writing—original draft preparation, C.Z.; writing—review and editing, C.L.; visualization, Z.W. and S.M.; funding acquisition, C.L. All authors have read and agreed to the published version of the manuscript.

Funding

This research was funded by the National Natural Science Foundation of China, grant number 52408376, and Shandong Provincial Natural Science Foundation, grant number ZR2022QE082.

Data Availability Statement

The original contributions presented in the study are included in the article and further inquiries can be directed to the corresponding author.

Acknowledgments

We sincerely express our gratitude to the peer reviewers and editors for their professional comments that improved the manuscript.

Conflicts of Interest

Authors Sihan Ma, Xiaoyuan Yang, Zhiqiang Weng and Jiawei Liu were employed by the company Qingdao Transportation Development Group Co., Ltd. Authors Guo Zhao and Run Xu were employed by the company Shandong Provincial Communications Planning and Design Institute Group Co., Ltd. The remaining authors declare that the research was conducted in the absence of any commercial or financial relationships that could be construed as a potential conflict of interest.

References

  1. Heh, K.S. Dynamic Compaction of Sand. Ph.D. Thesis, Polytechnic University of New York, New York, NY, USA, 1991. [Google Scholar]
  2. Dumas, J.C.; Beaton, N.F.; Morel, J.F. Dynamic compaction of saturated silt and silty sand-A case history. In In-Situ Deep Soil Improvement; ASCE: Reston, VA, USA, 1994; pp. 80–89. [Google Scholar]
  3. Nashed, R. Liquefaction Mitigation of Silty Soils Using Dynamic Compaction. Ph.D. Thesis, State University of New York, Buffalo, NY, USA, 2006. [Google Scholar]
  4. Menard, L.; Broise, Y. Theoretical and practical aspect of dynamic consolidation. Geotechnique 1975, 25, 3–18. [Google Scholar] [CrossRef]
  5. Van Impe, W.F.; Bouazza, A. Densification of domestic waste fills by dynamic compaction. Can. Geotech. J. 1997, 33, 879–887. [Google Scholar] [CrossRef]
  6. Feng, S.J.; Shi, Z.M.; Shen, Y.; Li, L.C. Elimination of loess collapsibility with application to construction and demolition waste during dynamic compaction. Environ. Earth Sci. 2015, 73, 5317–5332. [Google Scholar] [CrossRef]
  7. Feng, S.J.; Shui, W.H.; Gao, L.Y.; He, L.J.; Tan, K. Field studies of the effectiveness of dynamic compaction in coastal reclamation areas. Bull. Eng. Geol. Environ. 2010, 69, 129–136. [Google Scholar] [CrossRef]
  8. Feng, S.J.; Du, F.L.; Shi, Z.M.; Shui, W.H.; Tan, K. Field study on the reinforcement of collapsible loess using dynamic compaction. Eng. Geol. 2015, 185, 105–115. [Google Scholar] [CrossRef]
  9. Bo, M.W.; Na, Y.M.; Arulrajah, A.; Chang, M.F. Densification of granular soil by dynamic compaction. Proc. Inst. Civ. Eng.-Ground Improv. 2009, 162, 121–132. [Google Scholar] [CrossRef]
  10. Feng, S.J.; Tan, K.; Shui, W.H.; Zhang, Y. Densification of desert sands by high energy dynamic compaction. Eng. Geol. 2013, 157, 48–54. [Google Scholar] [CrossRef]
  11. Zhou, C.; Yang, C.; Qi, H.; Yao, K.; Yao, Z.; Wang, K.; Li, H. Evaluation on improvement zone of foundation after dynamic compaction. Appl. Sci. 2021, 11, 2156. [Google Scholar] [CrossRef]
  12. Mayne, P.W.; Jones, J.S., Jr. Impact stresses during dynamic compaction. J. Geotech. Eng. 1983, 109, 1342–1346. [Google Scholar] [CrossRef]
  13. Michalowski, R.L.; Nadukuru, S.S. Static fatigue, time effects, and delayed increase in penetration resistance after dynamic compaction of sands. J. Geotech. Geoenvironmental Eng. 2012, 138, 564–574. [Google Scholar] [CrossRef]
  14. Scott, R.A.; Pearce, R.W. Soil compaction by impact. Geotechnique 1975, 25, 19–30. [Google Scholar] [CrossRef]
  15. Wang, W.; Feng, Q.; Yang, C. Investigation on the dynamic liquefaction responses of saturated granular soils due to dynamic compaction in coastal area. Appl. Ocean Res. 2019, 89, 273–283. [Google Scholar] [CrossRef]
  16. Wei, J.H.; Men, Y.; Zhu, F.; Le, H.L.; Fan, H.T. The reinforcement effects of deep soft soil foundation with high degree of saturation under dynamic compaction. Eng. Environ. Sci. 2018, 10, 168781401878263. [Google Scholar] [CrossRef]
  17. Sun, J.; Ge, X.; Li, P. Vibration mechanism and energy transfer analysis of dynamic compaction method on ground with high groundwater level. Int. J. Geomech. 2023, 23, 04023200. [Google Scholar] [CrossRef]
  18. Perucho, A.; Olalla, C. Dynamic consolidation of a saturated plastic clayey fill. Proc. Inst. Civ. Eng.-Ground Improv. 2006, 10, 55–68. [Google Scholar] [CrossRef]
  19. Arslan, H.; Baykal, G.; Ertas, O. Influence of tamper weight shape on dynamic compaction. Proc. Inst. Civ. Eng.-Ground Improv. 2007, 11, 61–66. [Google Scholar] [CrossRef]
  20. Lukas, R. Geotechnical Engineering Circular No. 1-Dynamic Compaction (No. FHWA-SA-95-037); United States. Federal Highway Administration; Office of Technology Applications: Washington, DC, USA, 1995. [Google Scholar]
  21. Feng, S.J.; Shui, W.H.; Tan, K.; Gao, L.Y.; He, L.J. Field evaluation of dynamic compaction on granular deposits. J. Perform. Constr. Facil. 2011, 25, 241–249. [Google Scholar] [CrossRef]
  22. Liu, J.H.; Yuan, J.B.; Xiong, H.; Chen, W. Dynamic compaction treatment technology research of red clay soil embankment in southern mountains. J. Cent. South Univ. Technol. 2008, 15 (Suppl. S2), 50–57. [Google Scholar] [CrossRef]
  23. Zou, W.L.; Wang, Z.; Yao, Z.F. Effect of dynamic compaction on placement of high-road embankment. J. Perform. Constr. Facil. 2005, 19, 316–323. [Google Scholar] [CrossRef]
  24. Pan, J.L.; Selby, A.R. Simulation of dynamic compaction of loose granular soils. Adv. Eng. Softw. 2002, 33, 631–640. [Google Scholar] [CrossRef]
  25. Gu, Q.; Lee, F.H. Ground response to dynamic compaction of dry sand. Geotechnique 2002, 52, 481–493. [Google Scholar] [CrossRef]
  26. Oshima, A.; Takada, N.; Tanaka, Y. Relation between compacted area and ram momentum by heavy tamping density and strength increases due to single point tamping. Doboku Gakkai Ronbunshu 1996, 554, 185–196. [Google Scholar] [CrossRef] [PubMed]
  27. Jafarzadeh, F. Dynamic compaction method in physical model tests. Sci. Iran. 2006, 13, 187–192. [Google Scholar]
  28. Kovalsky, E.; Kongar-Syuryun, C.; Morgoeva, A.; Klyuev, R.; Khayrutdinov, M. Backfill for advanced potash ore mining technologies. Technologies 2025, 13, 60. [Google Scholar] [CrossRef]
  29. Kongar-Syuryun, C.B. Industrial waste in backfill composite—the paradigm of environmental and process safety during field development. Bezop. Tr. V Promyshlennosti 2025, 3, 73–78. [Google Scholar] [CrossRef]
  30. Kongar-Syuryun, C.B. Influence of mine water on the strength of artificial mass based on industrial waste. Ugol 2024, 12, 75–78. [Google Scholar]
  31. Golik, V.I.; Kongar-Syuryun, C.B.; Michałek, A.; Pires, P.; Rybak, A. Ground transmitted vibrations in course of innovative vinyl sheet piles driving. J. Phys. Conf. Ser. 2021, 1921, 012083. [Google Scholar] [CrossRef]
  32. Raja, M.N.A.; Abdoun, T.; El-Sekelly, W. Smart prediction of liquefaction-induced lateral spreading. J. Rock Mech. Geotech. Eng. 2024, 16, 2310–2325. [Google Scholar] [CrossRef]
  33. Wang, W.; Zhang, L.L.; Chen, J.J.; Wang, J.H. Parameter estimation for coupled hydromechanical simulation of dynamic compaction based on pareto multi objective optimization. Shock Vib. 2015, 2015, 127878. [Google Scholar]
  34. Ye, F.; Goh, S.H.; Lee, F.H. Dual-phase coupled u–U analysis of wave propagation in saturated porous media using a commercial code. Comput. Geotech. 2014, 55, 316–329. [Google Scholar] [CrossRef]
  35. Zhou, C.; Jiang, H.; Yao, Z.; Li, H.; Yang, C.; Chen, L.; Geng, X. Evaluation of dynamic compaction to improve saturated foundation based on the fluid-solid coupled method with soil cap model. Comput. Geotech. 2020, 125, 103686. [Google Scholar] [CrossRef]
  36. Hamann, T. Zur Modellierung Wassergesättigter Böden Unter Dynamischer Belastung und Großen Bodenverformungen am Beispiel der Pfahleinbringung; Technische Universität Hamburg-Harburg, Institut für Geotechnik und Baubetrieb: Hamburg, Germany, 2016. [Google Scholar]
  37. Staubach, P.; Machaček, J.; Moscoso, M.C.; Wichtmann, T. Impact of the installation on the long-term cyclic behaviour of piles in sand: A numerical study. Soil Dyn. Earthq. Eng. 2020, 138, 106223. [Google Scholar] [CrossRef]
  38. Staubach, P.; Machaček, J.; Skowronek, J.; Wichtmann, T. Vibratory pile driving in water-saturated sand: Back-analysis of model tests using a hydro-mechanically coupled CEL method. Soils Found. 2021, 61, 144–159. [Google Scholar] [CrossRef]
  39. Zienkiewicz, O.C.; Shiomi, T. Dynamic behaviour of saturated porous media; the generalized Biot formulation and its numerical solution. Int. J. Numer. Anal. Methods Geomech. 1984, 8, 71–96. [Google Scholar] [CrossRef]
  40. Lee, F.H.; Gu, Q. Method for estimating dynamic compaction effect on sand. J. Geotech. Geoenvironmental Eng. 2004, 130, 139–152. [Google Scholar] [CrossRef]
  41. Zhou, C.; Yao, K.; Rong, Y.; Lee, F.H.; Zhang, D.; Jiang, H.; Chen, L. Numerical investigation on zone of improvement for dynamic compaction of sandy ground with high groundwater table. Acta Geotech. 2023, 18, 695–709. [Google Scholar] [CrossRef]
  42. Simo, J.C.; Ju, J.W.; Pister, K.S.; Taylor, R.L. Assessment of cap model: Consistent return algorithms and rate-dependent extension. J. Eng. Mech. 1988, 114, 191–218. [Google Scholar] [CrossRef]
  43. Staubach, P.; Machaček, J. Influence of relative acceleration in saturated sand: Analytical approach and simulation of vibratory pile driving tests. Comput. Geotech. 2019, 112, 173–184. [Google Scholar] [CrossRef]
  44. Miao, L.; Chen, G.; Hong, Z. Application of dynamic compaction in highway: A case study. Geotech. Geol. Eng. 2006, 24, 91–99. [Google Scholar] [CrossRef]
  45. Seed, H.B.; Idriss, I.M. Simplified procedure for evaluating soil liquefaction potential. J. Soil Mech. Found. Div. 1971, 97, 1249–1273. [Google Scholar] [CrossRef]
  46. Jia, M.; Zhao, Y.; Zhou, X. Field studies of dynamic compaction on marine deposits. Mar. Georesources Geotechnol. 2016, 34, 313–320. [Google Scholar] [CrossRef]
  47. Zhang, R.; Sun, Y.; Song, E. Simulation of dynamic compaction and analysis of its efficiency with the material point method. Comput. Geotech. 2019, 116, 103218. [Google Scholar] [CrossRef]
Figure 1. Finite fluid-saturated porous column subject to heavyside load [36,43]: (a) saturated finite soil; (b) load profile column.
Buildings 15 02527 g001
Figure 2. Comparison of numerical and semi-analytical results for the one-dimensional wave propagation problem [36,43]: (a) excess pore water pressure–time history (Δpw); (b) settlement–time history u2(t).
Buildings 15 02527 g002
Figure 3. Two-dimensional axisymmetric finite element model [23,35] (Adapted with permission from Ref. [35]. Copyright 2020 Elsevier).
Buildings 15 02527 g003
Figure 4. Comparison with the field results for the case of 2500 kN·m drop energy: excess pore water pressure versus time.
Buildings 15 02527 g004
Figure 5. Comparison with the field results for the case of 2500 kN·m drop energy: (a) excess pore water pressure versus soil depth; (b) lateral displacement versus soil depth.
Buildings 15 02527 g005
Figure 6. Excess pore water pressure contours at different instances, where h = 0.0 m and k = 10−7 m/s: (a) t = 0.02 s; (b) t = 0.06 s; (c) t = 0.3 s; (d) t = 4.0 s.
Buildings 15 02527 g006
Figure 7. Effective stress increment contours at different instances, where h = 0.0 m and k = 10−7 m/s: (a) t = 0.02 s; (b) t = 0.06 s; (c) t = 0.3 s; (d) t = 4.0 s.
Buildings 15 02527 g007
Figure 8. Relative degree of reinforcement contours at different instances, where h = 0.0 m and k = 10−7 m/s: (a) t = 0.02 s; (b) t = 0.06 s; (c) t = 0.3 s; (d) t = 4.0 s.
Buildings 15 02527 g008
Figure 9. Cloud charts of excess pore water pressure at t = 0.02 s for various drop energies: (a) 19 t × 7.99 m; (b) 19 t × 13.16 m; (c) 19 t × 20.05 m; (d) 40 t × 10 m.
Buildings 15 02527 g009
Figure 10. Cloud charts of excess pore water pressure at t = 4 s for various drop energies: (a) 19 t × 7.99 m; (b) 19 t × 13.16 m; (c) 19 t × 20.05 m; (d) 40 t × 10 m.
Buildings 15 02527 g010
Figure 11. Contours of excess pore water pressure ratio at t = 4 s for various drop energies: (a) 19 t × 7.99 m; (b) 19 t × 13.16 m; (c) 19 t × 20.05 m; (d) 40 t × 10 m.
Buildings 15 02527 g011
Figure 12. Contours of related index for dynamic compaction at t = 4.0 s for various drop energies: (a) Relative degree of reinforcement; (b) excess pore water pressure ratio; (c) improvement range.
Buildings 15 02527 g012
Figure 13. Cloud charts of excess pore water pressure at t = 0.02 s for various tamper radii: (a) R = 0.9 m; (b) R = 1.1 m; (c) R = 1.3 m; (d) R = 1.8 m.
Buildings 15 02527 g013
Figure 14. Cloud charts of excess pore water pressure at t = 4 s for various tamper radii: (a) R = 0.9 m; (b) R = 1.1 m; (c) R = 1.3 m; (d) R = 1.8 m.
Buildings 15 02527 g014
Figure 15. Contours of excess pore water pressure ratio at t = 4 s for various tamper radii: (a) R = 0.9 m; (b) R = 1.1 m; (c) R = 1.3 m; (d) R = 1.8 m.
Buildings 15 02527 g015
Figure 16. Contours of related index for dynamic compaction at t = 4.0 s for various tamper radii: (a) relative degree of reinforcement; (b) excess pore water pressure ratio; (c) improvement range.
Buildings 15 02527 g016
Figure 17. Cloud charts of excess pore water pressure at t = 0.02 s for various permeability values: (a) k = 10−2 m/s; (b) k = 10−3 m/s; (c) k = 10−5 m/s; (d) k = 10−7 m/s.
Buildings 15 02527 g017
Figure 18. Cloud charts of excess pore water pressure at t = 4 s for various permeability values: (a) k = 10−2 m/s; (b) k = 10−3 m/s; (c) k = 10−5 m/s; (d) k = 10−7 m/s.
Buildings 15 02527 g018
Figure 19. Contours of excess pore water pressure ratio at t = 4 s for various permeability values: (a) k = 10−2 m/s; (b) k = 10−3 m/s; (c) k = 10−5 m/s; (d) k = 10−7 m/s.
Buildings 15 02527 g019
Figure 20. Contours of related index for dynamic compaction at t = 4.0 s for various permeability values: (a) relative degree of reinforcement; (b) excess pore water pressure ratio; (c) improvement range.
Buildings 15 02527 g020
Table 1. Material parameters for dynamic compaction analysis [23,35].
Soil Layerρ (kg/m3)E (MPa)vα (kPa)θR’WD (kPa−1)
soil119406.000.3017.80.254.330.50.0003
soil219408.00.3021.20.214.330.50.0003
soil319407.000.3030.50.194.330.50.0003
Table 2. Comparison of the crater depth.
Drop Energy (kN·m)Measured at Field (m)Present Model (m)Error (%)
25000.940.9480.5
Disclaimer/Publisher’s Note: The statements, opinions and data contained in all publications are solely those of the individual author(s) and contributor(s) and not of MDPI and/or the editor(s). MDPI and/or the editor(s) disclaim responsibility for any injury to people or property resulting from any ideas, methods, instructions or products referred to in the content.