Abstract
The soil surrounding foundations is typically heterogeneous and anisotropic; however, existing studies for estimating the ultimate bearing capacity of foundations adjacent to slopes are predominantly applicable to isotropic and homogeneous soils. This study aims to investigate the ultimate bearing capacity of strip foundations adjacent to heterogeneous and anisotropic slopes within the framework of the Meyerhof theory. Considering the soil’s heterogeneity and anisotropy, a unilateral failure mode with varying base roughness is established. An analytical solution for the ultimate bearing capacity is derived using the limit equilibrium method, and the calculation steps are outlined through an iterative trial approach. The proposed formulation is validated by comparisons with theoretical solutions, numerical simulations and experimental data. Results indicate that the ultimate bearing capacity of foundations adjacent to slopes increases with an increase in the heterogeneity coefficient. In contrast, the ultimate bearing capacity decreases as the anisotropy coefficient increases, with a more significant reduction observed for higher cohesion soil. Moreover, the base roughness and the distance to slope crest also markedly influence the ultimate bearing capacity.
1. Introduction
The evaluation of foundation bearing capacity remains a critical challenge in geotechnical engineering. Strength parameters obtained from laboratory tests, such as direct shear and triaxial compression tests, are widely used in geotechnical stability analyses. However, the effects of soil heterogeneity and anisotropy, arising from natural deposition, excavation unloading, artificial filling and other complicated geological genesis, are frequently neglected [1,2,3]. Since the strength parameters of soils directly influence mechanical behavior, soil heterogeneity and anisotropy have a significant impact on the stability analysis of geotechnical structures [4,5,6,7]. Recent studies have increasingly acknowledged the importance of soil heterogeneity and anisotropy in estimating the ultimate bearing capacity of foundations on level ground. Yang and Du [8] proposed a novel failure mechanism accounting for spatially varying material properties and derived a new bearing capacity formula for heterogeneous and anisotropic clay foundations using the upper bound theorem. Keawsawasvong et al. [9] employed robust lower and upper-bound finite-element limit analyses under axisymmetric conditions to investigate the undrained stability and failure mechanisms of ring footings on anisotropic and heterogeneous clays, proposing a dimensionless equation for bearing capacity. Lai et al. [10] developed numerical solutions for the bearing capacity of conical footings embedded in anisotropic and heterogeneous clay using axisymmetric finite-element analysis with the NGI-ADP constitutive model. These studies highlight the important role of soil heterogeneity and anisotropy in determining the foundation bearing capacity.
In engineering applications such as transportation, water conservancy and civil infrastructure, foundations are often constructed adjacent to slopes or excavation pits. The foundation strength is weakened owing to the presence of slopes [11,12,13]. Research on the combined effects of soil heterogeneity and anisotropy on foundations adjacent to slopes is limited, with most studies focusing on the individual impacts of either heterogeneity or anisotropy. For example, Jin et al. [14] assumed a linear increase in cohesion with depth and developed a methodology for determining the critical sliding surface and ultimate bearing capacity of heterogeneous clay foundations adjacent to slopes using an improved radial movement optimization technique. Kalourazi et al. [15] analyzed the impact of soil shear strength anisotropy on the ultimate bearing capacity of foundations adjacent to slopes using the lower-bound finite-element method, highlighting the influence of slope geometry parameters. Gao et al. [16] proposed a critical state sand model considering fabric evolution and conducted a numerical investigation on the ultimate bearing capacity of strip footings on anisotropic cohesionless slopes, demonstrating that the bearing capacity derived from isotropic models significantly exceeded the measured values. Only Hou et al. [17] considered the combined effects of soil heterogeneity and anisotropy to derive an expression of the bearing capacity factor for cohesion (Nc) corresponding to the minimum upper-bound solution for foundations adjacent to slopes.
Additionally, current theoretical studies on the bearing capacity of foundations adjacent to slopes mostly neglect the shear strength contribution of foundation lateral soils, instead adopting a uniform surcharge (q = γD) as a substitute [18,19,20]. This simplification inadequately accounts for the soil strength contribution within the foundation embedment depth, leading to inaccurate bearing capacity predictions. In contrast, the classical Meyerhof theory for strip foundations on level ground accounts for these effects by incorporating the stresses on an equivalent free surface, thereby more accurately reflecting the actual failure mechanism [21,22,23].
The primary objective of this study is to investigate the ultimate bearing capacity of strip foundations adjacent to heterogeneous and anisotropic slopes based on the Meyerhof theory. The classical Meyerhof framework is extended to establish a unilateral failure mode considering soil heterogeneity and anisotropy effects. By introducing heterogeneity and anisotropy coefficients for cohesion, a closed-form solution for the ultimate bearing capacity of foundations adjacent to slopes is derived utilizing the limit equilibrium method. The calculation procedure is detailed, and comparisons with published theoretical results, numerical simulations and experimental data are presented to validate the proposed formulation. Furthermore, parametric studies are conducted to analyze the influence of key parameters, including the heterogeneity coefficient, anisotropy coefficient and the horizontal distance from the foundation to the slope crest, on bearing capacity behaviors.
2. Problem Definitions and Assumptions
2.1. Failure Mode of Strip Foundations Adjacent to Slopes
A strip foundation with a width B and an embedment depth D is positioned adjacent to a slope inclined at an angle η, as illustrated in Figure 1. The horizontal distance from the foundation to the slope crest is L = aB, where coefficient a is defined as the ratio of the horizontal distance L to the foundation width B. When the foundation soil reaches the ultimate bearing capacity qu, the foundation undergoes general shear failure. The corresponding failure mode is shown in Figure 1. The soil along the sliding surface is assumed to be in a state of plastic limit equilibrium, and its shear strength satisfies the Mohr–Coulomb failure criterion. The failure mode is divided into four zones, with the following assumptions:
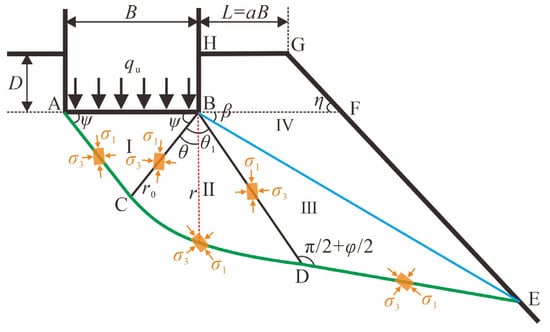
Figure 1.
The failure mode of foundations adjacent to slopes.
(1) The soil adjacent to the slope fails first, and the sliding surfaces on both sides of the foundation are assumed to be the same. Consequently, Zone I (ABC) is a symmetrical triangular elastic wedge. The angle between surfaces AB and BC is denoted as ψ. For a completely rough base, ψ = φ; for a completely smooth base, ψ = π/4 + φ/2.
(2) Zone II (BCD) is a transitional shear zone, where the surface CD follows a logarithmic spiral. According to the definition of a logarithmic spiral, the expression of the radius r at any point along the spiral is given by
where r0 is the initial radius (i.e., the length of line BC in Figure 1), and θ is the angle between radius r and the initial radius r0.
(3) Zone III (BDE) is a passive failure zone, where the surface DE intersects the slope surface GE at point E. The line DE is tangent to the logarithmic spiral CD at point D, and the angle between surfaces BD and DE is π/2 + φ.
(4) Zone IV (BEGH) is a disturbed zone, and the surface BE is treated as an equivalent free surface. The combined effects of the resultant force along the foundation side BH and the weight W4 of Zone IV are represented by the equivalent stresses (normal stress σ0 and shear stress τ0) acting on the surface BE.
2.2. Soil Heterogeneity and Anisotropy
This study solely considers the heterogeneity and anisotropy of cohesion for single-layer soil. When the foundation soil is homogeneous, cohesion is uniformly distributed with depth. In contrast, cohesion typically varies with depth for heterogeneous soils. A typical pattern of cohesion distribution is a linear increase along the depth [14,24,25], as depicted in Figure 2. In this figure, ch0 represents the cohesion in the horizontal direction of the shear plane at the top of a slope, and χ denotes the gradient of the linear increase in cohesion with depth. A dimensionless coefficient ν = χB/ch0 is defined as the heterogeneity coefficient to quantify the soil heterogeneity effect on the ultimate bearing capacity of foundations adjacent to slopes. Accordingly, the horizontal cohesion at a depth H can be expressed as
where the value of ch0 is typically not more than 15 kPa. The gradient χ = γ′Δcu/Δσv, where γ′ is the effective unit weight, Δcu is the increment of undrained strength and Δσv is the increment of vertical effective consolidation stress. The value of χ commonly ranges from 0.6 kPa/m to 3.0 kPa/m [26,27].
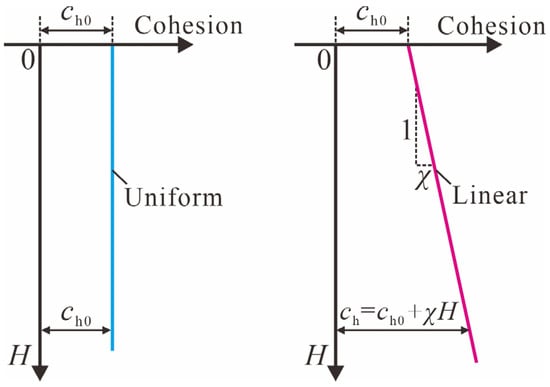
Figure 2.
Variation in cohesion with depth.
Cohesion anisotropy refers to the dependence of cohesion on the direction of the major principal stress. Figure 1 illustrates the variation in the direction of the major principal stress along the sliding failure surface. Here, σ1 and σ3 denote the major and minor principal stresses, respectively. The initial stress state varies along the sliding surface, and the angle between σ1 and the sliding surface is given by μ = π/4 − φ/2 [25]. The variation in cohesion with the direction of σ1 is shown in Figure 3. The cohesion at the angle ξ, between σ1 and the vertical direction, is denoted as cξ, which is expressed as
where cv is the vertical cohesion. The anisotropy coefficient is defined as k = cv/ch, representing the ratio of vertical to horizontal cohesion. For specific soil at a given site, the coefficient k can be approximated as a constant, and it typically ranges between 0.5 and 1.33 [26]. The cohesion is isotropic with k = 1, while k typically exceeds 1 for over consolidated soils [7,26]. Substituting k = cv/ch into Equation (3) yields
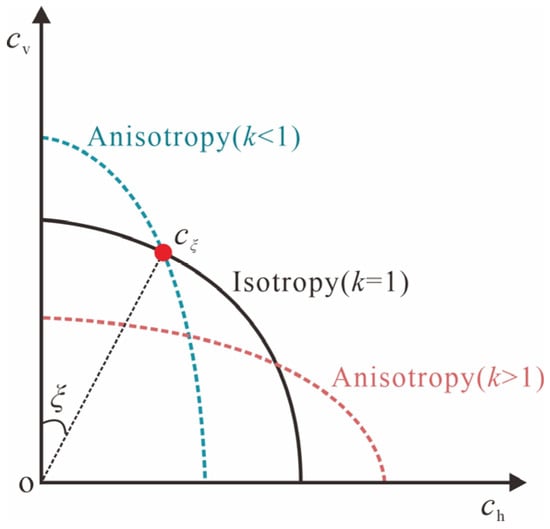
Figure 3.
Anisotropy of cohesion.
3. Ultimate Bearing Capacity of Foundations Adjacent to Slopes
3.1. Formulation Derivation
Based on the Meyerhof theory and the superposition principle, the formula for calculating the ultimate bearing capacity of foundations adjacent to slopes is derived considering the effects of soil heterogeneity and anisotropy. The ultimate bearing capacity qu is divided into two parts: the ultimate bearing capacity qu1 caused by soil cohesion and surcharge, and the ultimate bearing capacity qu2 caused by the soil unit weight.
3.1.1. Ultimate Bearing Capacity qu1
The normal stress on the foundation side depicted in Figure 1 is calculated as the static earth pressure. Subsequently, the average normal stress σa and average shear stress τa acting on surface BH are determined as
where K0 is the coefficient of static earth pressure; δ is the external friction angle between the foundation side and soils.
Zone IV (BEGH) is taken as an isolator, and its force analysis is illustrated in Figure 4. The static force equilibrium in the normal and tangential directions along surface BE can be expressed as
where β denotes the angle between the surface BE and the horizontal plane (with β ≥ 0), is the length of line BE, and S4 is the area of quadrilateral BEGH.
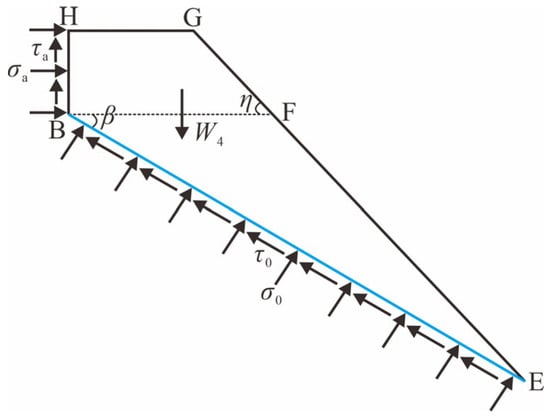
Figure 4.
Force analysis of isolator BEGH.
By solving Equations (7) and (8) simultaneously, the normal stress σ0 and shear stress τ0 on the surface BE are obtained as
To calculate cohesion at different positions using Equation (4), it is necessary to obtain the depth H and the angle ξ, between σ1 and the vertical direction, at each calculation point. Figure 5 illustrates the geometric parameters of Isolator BDE (Zone III). Here, ε represents the angle between surface BD and the vertical direction; ξ1 is the angle between σ1 on surface BD and the vertical direction; ξ2 denotes the angle between σ1 on surface DF and the vertical direction. The cohesion at the midpoint of BD or DF is regarded as the average cohesion to evaluate the ultimate bearing capacity of foundations adjacent to slopes [21]. The depth H1 at the midpoint of BD is written as
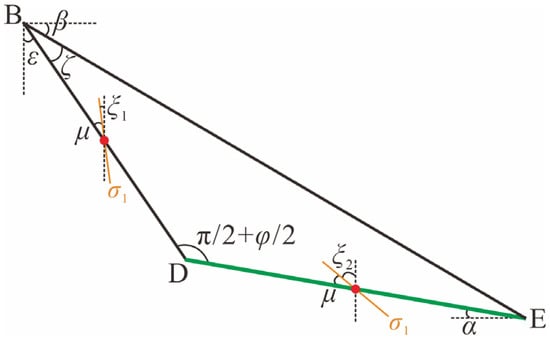
Figure 5.
Geometric parameters of isolator BDE.
Substituting Equation (11) into Equation (4), the average cohesion cξ1 on surface BD is obtained as
where
The length of line BC is determined from the geometric relationship of triangle ABC as
Since CD is a logarithmic spiral, any radial r on CD can be expressed as r = exp(θtanφ). Therefore, the length of line BD is given by
The depth H2 at the midpoint of surface DE is
Substituting Equation (15) into Equation (4), the average cohesion cξ2 on surface DE is calculated as
where
In triangle BDE shown in Figure 5, the relationship among the surfaces BD, BE and DE following the law of sines is expressed as
Substituting Equation (14) into Equation (17), the length of surface DE can be derived as
Substituting and Equation (14) into Equation (17) yields
Equation (20) describes the relationship involving β along with ζ, φ, ψ, η, D and B. The angle ζ can be determined from the Mohr stress circle corresponding to the limit state of surface BD in Figure 6. The center of the Mohr stress circle is positioned at point d. The normal stress σb and shear stress τb on surface BD correspond to point e, while σ0 and τ0 on surface BE correspond to point f. A line drawn from point f at an angle β to the horizontal plane intersects the Mohr stress circle at point g. Then, the angle ∠egf formed by the lines eg and fg equals the angle ζ, corresponding to ∠DBE in Figure 1. Since the central angle is twice the circumferential angle, ∠edf = 2ζ.
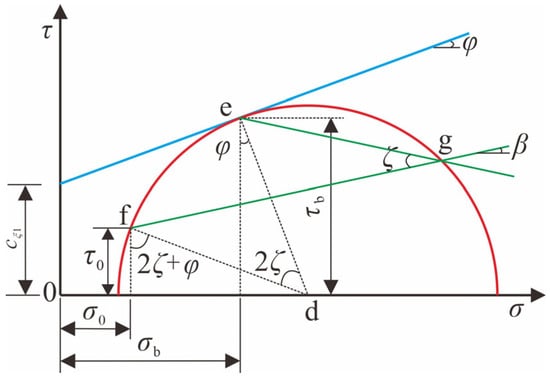
Figure 6.
Mohr stress circle corresponding to the limit state of surface BD.
The angle β is determined using an iterative trial method as follows: Firstly, an initial value β1 is assumed, and the equivalent stresses σ0 and τ0 are calculated by Equations (9) and (10). Secondly, the angle ζ is established through the geometrical relationship in Figure 6, and a new value β2 can be computed by substituting it into Equation (20). This process is repeated until the difference between the assumed value β1 and the calculated value β2 satisfies the accuracy requirement.
Furthermore, the conversion between τ0 and τb is obtained from the geometric relationships in Figure 6 as
The above equation is rearranged as
Substituting into Equation (23) yields
The geometric parameters and force analysis of isolation BCD (Zone II) are illustrated in Figure 7. Similar to the analysis process for isolator BDE, the depth H3 at the midpoint of BC in Figure 7a is

Figure 7.
Isolator BCD: (a) Geometric parameters; (b) Force analysis caused by cohesion and surcharge.
The angle ξ3, between σ1 and the vertical direction on the BC plane, is written as
Substituting Equations (25) and (26) into Equation (4), the average cohesion cξ3 on surface BC is deduced as
The angle ξ4, between σ1 and the vertical direction at any point on the surface CD, is
The depth H4 corresponding to this point is
Substituting Equations (28) and (29) into Equation (4), the cohesion cξ4 at any point on surface CD is obtained as
In Figure 7b, σc and τc are the normal and shear stresses on surface BC, respectively. The resistance due to cohesion on the differential length ds acting on surface CD is cξ4ds. Fc is the resultant radial force on surface CD caused by cohesion and surcharge. The direction of Fc forms an angle φ with the normal of surface CD and points towards point B. The moment equilibrium at point B can be expressed as
From Equation (31), the normal stress σc and shear stress τc on surface BC are formulated as
The force analysis of isolation ABC (Zone I) is conducted by a symmetric semi-structure, as demonstrated in Figure 8. The vertical force equilibrium is described by
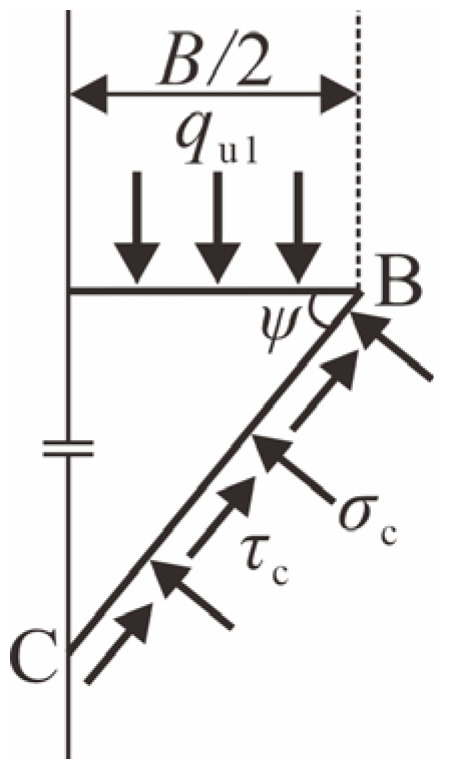
Figure 8.
Force analysis of a symmetric semi-structure of isolation ABC caused by cohesion and surcharge.
Substituting Equations (32) and (33) into Equation (34), the ultimate bearing capacity qu1 caused by cohesion and surcharge is given as
where Nc and Nq are bearing capacity factors for cohesion and surcharge, respectively.
3.1.2. Ultimate Bearing Capacity qu2
In this case, only the effect of soil unit weight is considered. Figure 9 depicts the force analysis of isolator BDE (Zone III) caused by unit weight of soils. The force equilibrium equations in the horizontal and vertical directions are determined as
where Ep1 is the resultant force on surface DE acting at a distance of /3 from point D with an angle φ to its normal. Ep2 is the resultant force on surface BD acting at a distance of /3 from point D with an angle φ to its normal. W3 is the soil self-weight of isolator BDE, and S3 is the area of triangle BDE.
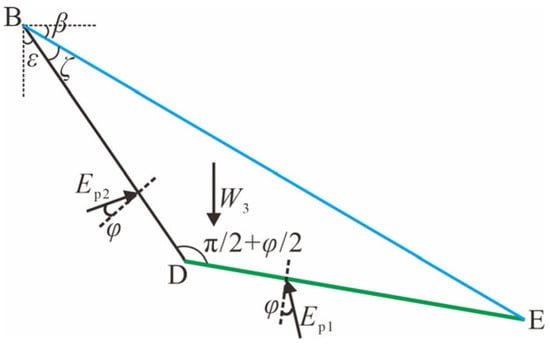
Figure 9.
Force analysis of isolator BDE caused by unit weight of soils.
Simultaneously solving Equations (38) and (39), the resultant force Ep2 on surface BD is obtained as
Figure 10 illustrates the force analysis of isolator BCD (Zone II) caused by unit weight of soils. The moment equilibrium at point B can be expressed as
where Ep3 is the resultant force on surface BC acting at a distance of /3 from point C, with an angle φ to its normal. The radial resultant force caused by the unit weight of soils on surface CD is F1, which is directed towards point B. W2 and S2 are the self-weight and area of isolator BCD, respectively. λ is the lever arm from W2 to point B. As shown in Figure 7a, a Cartesian coordinate system is established with point B as the origin and line BC as the x-axis. Hence, λ can be expressed as
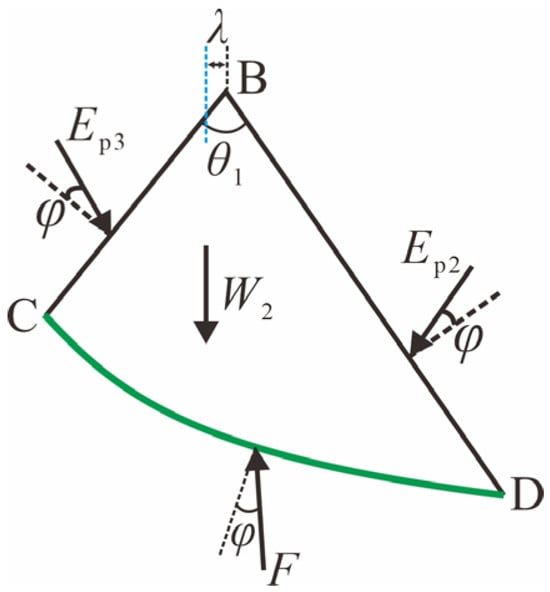
Figure 10.
Force analysis of isolation BCD caused by unit weight of soils.
The expression of the resultant force Ep3 on surface BC is derived from Equation (41) as
Figure 11 shows the force analysis of a symmetric semi-structure of isolation ABC caused by unit weight of soils, and the vertical force equilibrium is given as
where W1 is the self-weight of isolator ABC, and S1 is the area of triangle ABC.
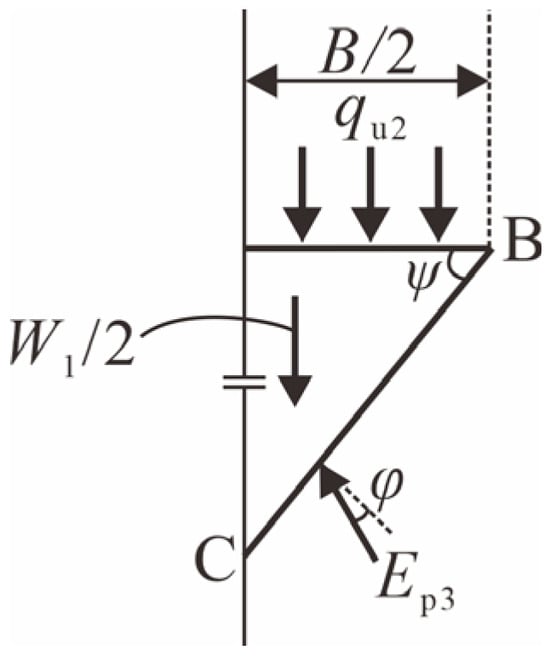
Figure 11.
Force analysis of a symmetric semi-structure of isolation ABC caused by unit weight of soils.
Substituting Equations (40) and (43) into Equation (44), the ultimate bearing capacity qu2 caused by unit weight of soils is formulated as
where Nγ is the bearing capacity factor of soil unit weight, which is defined as
3.1.3. Ultimate Bearing Capacity qu
By superimposing the ultimate bearing capacities qu1 and qu2, as given in Equations (35) and (45), the ultimate bearing capacity qu of strip foundations adjacent to heterogeneous and anisotropic slopes is presented as
The proposed Equation (47) for the ultimate bearing capacity of strip foundations adjacent to slopes is an extension of the classical Meyerhof theory for strip foundations on level ground, which can effectively reflect contributions of soil strength within the foundation depth. Simultaneously, the comprehensive effects of soil heterogeneity (coefficient ν) and anisotropy (coefficient k), the slope parameters (distance L and slope angle η), and the roughness of the foundation base are taken into account. The coefficients ν > 0 and k ≠ 1 correspond to heterogeneous and anisotropic soils. When the soil is homogeneous and isotropic (i.e., ν = 0 and k = 1), Equation (47) degenerates into the ultimate bearing capacity equation of strip foundations adjacent to homogeneous and isotropic slopes reported in the literature [22].
3.2. Calculation Steps
For a strip foundation situated adjacent to a slope, the following parameters are known: foundation width (B), embedded depth (D), slope angle (η), horizontal distance from the foundation to slope crest (L) and soil mechanical parameters (ch0, φ, and γ). The heterogeneity and anisotropy coefficients (ν and k) can be determined experimentally or from empirical data in the literature. The coefficient of static earth pressure (K0) and the external friction angle between the foundation side and soils (δ) are estimated based on empirical values.
The angle β is determined by an iterative trial method as follows: (1) An initial value of β1 is assumed, and the equivalent stresses (σ0 and τ0) are calculated by Equations (9) and (10); (2) The angle ζ is determined from the geometric relationship shown in Figure 6; (3) An updated β2 is calculated by substituting ζ into Equation (20); (4) The iteration continues until the difference between β2 and β1 meets the convergence criterion Δ. For instance, an initial value of β1 can be defined as φ/2 with an error tolerance value of Δ = 0.01°. Typically, satisfactory calculation results can be obtained within no more than five iterations. Throughout this process, the values of ζ, θ1, σ0 and τ0 are obtained and subsequently substituted into Equation (47) to determine the ultimate bearing capacity of foundations adjacent to heterogeneous and anisotropic slopes. A detailed flowchart of the calculation steps is provided in Figure 12.
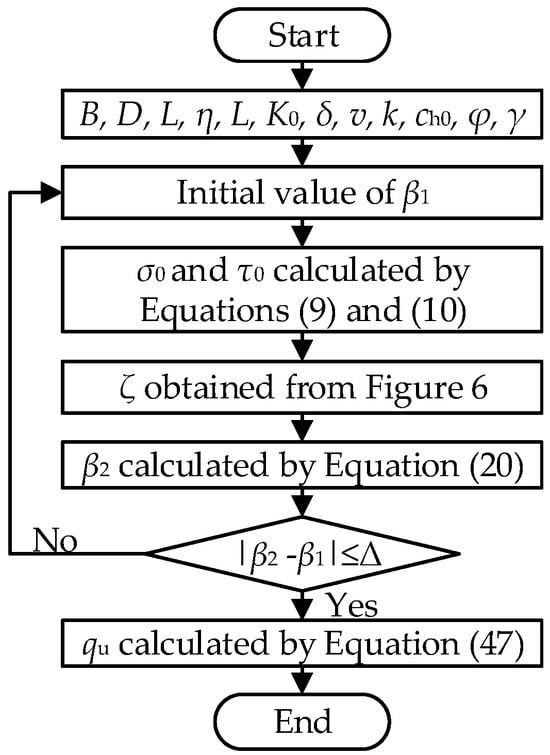
Figure 12.
Flowchart of the calculation steps.
4. Comparative Analysis
The validity and reasonableness of the established analytical solution (i.e., Equation (47)) for the ultimate bearing capacity of foundations adjacent to slopes considering soil heterogeneity and anisotropy are verified through comparisons with theoretical solutions, numerical simulations and experimental data.
4.1. Comparisons with Theoretical Solutions
4.1.1. Example 1
Jin et al. [14] considered the heterogeneity of clay foundations and proposed constraint equations for the ultimate bearing capacity of foundations adjacent to slopes using the upper-bound limit analysis theorem. Meanwhile, the improved radial movement optimization was utilized to optimize computational accuracy. A comparison between the ultimate bearing capacity obtained from Jin et al. [14] and this study is presented in Table 1. The analysis is conducted using the following parameters: ch0 = 90 kPa, φ = 0°, γ = 18 kN/m3, B = 2 m and D = 0 m. An anisotropy coefficient of k = 1 is adopted for comparability, as Jin et al. [14] did not consider soil anisotropy in the methodology.

Table 1.
Comparisons of qu from this study and Jin et al. [14].
Table 1 reveals that the ultimate bearing capacity qu obtained from this study and Jin et al. [14] exhibits a remarkable increase with the augmentation of the heterogeneity coefficient ν. For the slope angle of η = 10°, 20° and 30°, the mean relative errors (MRE) are only 4.0%, 5.1% and 7.5%, respectively. These results indicate a strong agreement between the two studies; thereby, the accuracy of the proposed Equation (47) is validated. Furthermore, the ultimate bearing capacity qu decreases with an increasing slope angle. This reduction in bearing capacity demonstrates that slope angle constitutes a critical impact on foundation stability.
4.1.2. Example 2
Hou et al. [17] investigated the influence of soil heterogeneity and anisotropy on the bearing capacity of foundations adjacent to slopes by utilizing the upper-bound analysis. The expression of bearing capacity coefficient Nc was derived by introducing the heterogeneity and anisotropy coefficients. A comparative analysis between Nc calculated from Hou et al. [17] and this study with Equation (36) is shown in Figure 13.
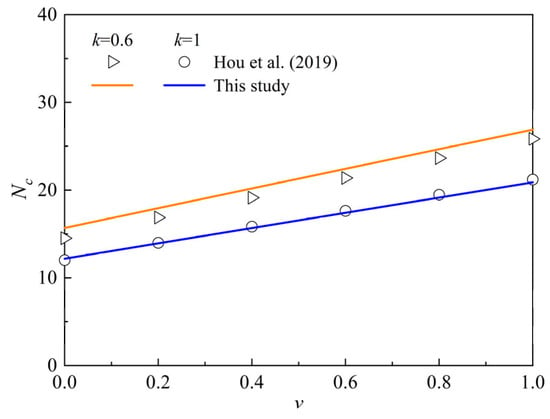
Figure 13.
Comparisons of Nc from this study and Hou et al. [17] (φ = 20°, a = 1, η = 20°).
Figure 13 demonstrates that results of Nc from Equation (36) in this study and Hou et al. [17] display a consistent increasing trend with the heterogeneity coefficient ν. The calculated results of Nc from both studies are relatively close with mean relative errors of merely 5.5% for k = 0.6 and 1.2% for k = 1. Therefore, the accuracy of Equation (36) in this study is verified, which in turn validates the reliability of Equation (47) for the ultimate bearing capacity of foundations adjacent to slopes. Notably, the results of Nc for k = 0.6 are significantly higher than those for k = 1 (corresponding to isotropic soil), indicating that a decrease in the anisotropy coefficient is beneficial for the stability of foundations adjacent to slopes.
4.2. A Comparison with Results of Numerical Simulations
A novel numerical simulation analysis is introduced to further validate the proposed theoretical solution. A numerical model for the bearing capacity of strip foundations adjacent to heterogeneous slopes is established using the discontinuous layout optimization method. The numerical simulation results are compared with the calculated values from Equation (47) in this study, as depicted in Figure 14. The relevant parameters are as follows: B = 1 m, D = 0 m, γ = 16 kN/m3, ch0 = 10 kPa, η = 30°, a = 0, k = 1, K0 = 0.45 and δ = 20°. From Figure 14, it can be observed that both the theoretical calculation from Equation (47) and the numerical simulation show a significant increase in bearing capacity with the rise in the heterogeneity coefficient. The results from these two methods are closely aligned, with an average absolute relative error of only 2.1%, confirming the accuracy of Equation (47). Figure 14 also presents the failure mode of foundations adjacent to heterogeneous slopes obtained from the numerical simulation for ν = 0.2. The red line delineates the external envelope of the foundation’s slip zone, the failure mode can be approximated by three distinct parts: a triangular active zone, a transitional shear zone and a passive zone. This observation closely aligns with the assumed failure mode and further underscores the reliability of the assumed failure mode depicted in Figure 1.
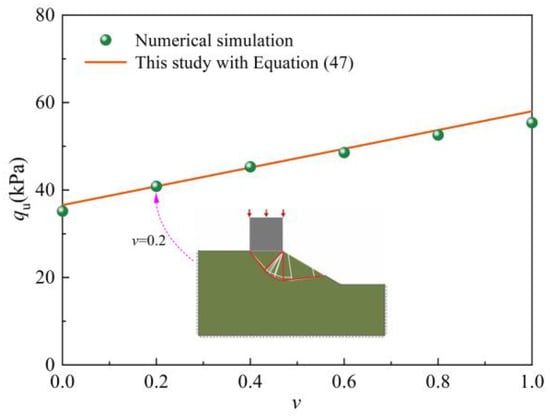
Figure 14.
Comparisons with results of numerical simulations.
4.3. A Comparison with Experimental Results
Several reduced-scale model experiments have been conducted to investigate the ultimate bearing capacity of strip foundations on slopes [28,29]. Due to the use of the layered paving method in preparing foundation model specimens, with the compaction process being identical for each soil layer, the foundation soil can be considered uniform and isotropic. Figure 15 compares the predicted value from this study (ν = 0 and k = 1) with the model experimental results. The calculation parameters are based on experimental parameters from the literature. Furthermore, the experiments were conducted under conditions of a smooth base, and calculations in this study were based on a completely smooth base scenario. The 1:1 line in Figure 15 represents perfect alignment between the predicted and measured values. This comparison underscores the validity of the computational formula proposed in this study, as the error between the measured values from two sets of model experiments and the predicted values in this study does not exceed 20%.
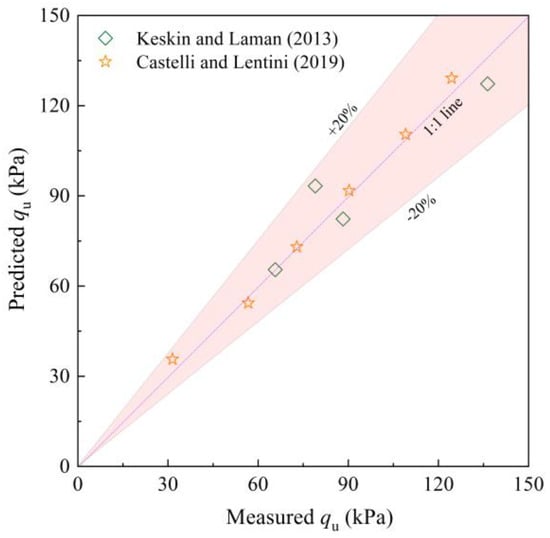
Figure 15.
Comparisons with experimental results [28,29].
5. Parametric Studies
The effects of the heterogeneity coefficient (ν), the anisotropy coefficient (k), the distance to slope crest (L) and base roughness on the ultimate bearing capacity of foundations adjacent to slopes are discussed. The following parameters are used: ch0 = 10 kPa, φ = 30°, γ = 18 kN/m3, B = 1 m, D = 1 m and η = 30°. The analyses presented in Section 5.1, Section 5.2 and Section 5.3 are confined to the case of a completely rough base with ψ = φ.
5.1. Heterogeneity Coefficient
The variation in the heterogeneity coefficient ν is employed to analyze the impact of soil heterogeneity on the ultimate bearing capacity qu of foundations adjacent to slopes. Figure 16 reveals the variation in the bearing capacity qu with respect to ν and ch0. Here, the anisotropy coefficient k = 0.6. Results show that the ultimate bearing capacity qu significantly increases with the rise in the heterogeneity coefficient ν. An increase in cohesion significantly enhances the bearing capacity qu. Specifically, as the coefficient ν increases from 0 to 1 with ch0 = 10 and 20 kPa, the bearing capacity qu increases by 48.6% and 75.6%, respectively. This trend can be attributed to the progressive increase in soil cohesion as the coefficient ν rises, which markedly improves the ultimate bearing capacity, especially for higher cohesion. Therefore, cohesion heterogeneity is crucial in determining the ultimate bearing capacity of foundations adjacent to slopes. Neglecting soil heterogeneity results in a conservative underestimation of the ultimate bearing capacity and fails to fully develop the actual strength of foundation soils.
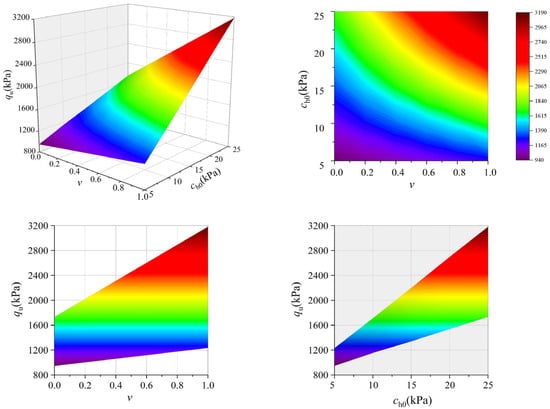
Figure 16.
Effect of heterogeneity coefficient.
5.2. Anisotropy Coefficient
The influence of anisotropy coefficient k on the ultimate bearing capacity of foundations adjacent to slopes is depicted in Figure 17 with ν = 0. Results show a nonlinear decrease in ultimate bearing capacity qu as the anisotropy coefficient k increases. For instance, when the coefficient k increases from 0.6 to 1.4 with ch0 = 10 and 20 kPa, the bearing capacity qu decreases by 11.2% and 19.2%, respectively. The reason for these decreases is that the anisotropy coefficient k represents the ratio of vertical to horizontal cohesion along the shear plane, whereas the horizontal cohesion only depends on the depth H. A higher value of k corresponds to a lower vertical cohesion, which in turn reduces the ultimate bearing capacity. Consequently, soil anisotropy negatively impacts foundation stability, and this adverse effect is slightly more significant for soil with relatively higher cohesions.
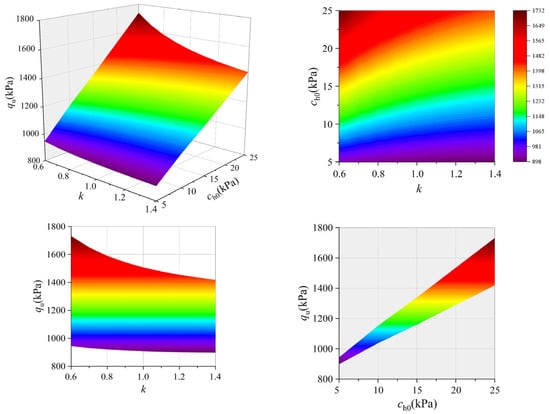
Figure 17.
Effect of anisotropy coefficient.
5.3. Distance to Slope Crest
The horizontal distance from foundation to slope crest is denoted as L = aB, where the dimensionless coefficient a characterizes its influence on the ultimate bearing capacity of foundations adjacent to slopes. Figure 18 presents the variation in the ultimate bearing capacity qu with coefficient a and ν for k = 0.6. It can be seen from Figure 18 that as the coefficient a increases, the ultimate bearing capacity qu nonlinearly increases. However, its growth rate decreases gradually, and the final bearing capacity converges to a stable value. In the case of a completely rough base, for instance, as the foundation moves from the slope crest (a = 0) to a = 5, the ultimate bearing capacity qu increases by 1.98, 1.50 and 1.22 times for coefficients ν = 0, 0.5 and 1, respectively. The rate of increase in bearing capacity qu decreases gradually with increasing a, and qu converges to a stable value at the critical distance coefficient ac = 5. Beyond this point (a ≥ 5), the bearing capacity qu equals that of foundations on the level ground. The extent of the sliding zone beneath strip foundations increases with an increasing distance to the slope crest. Hence, the strength of foundations adjacent to slopes improves as the foundation is positioned farther from the slope crest, and this effect becomes more marked with a higher value of the heterogeneity coefficient.
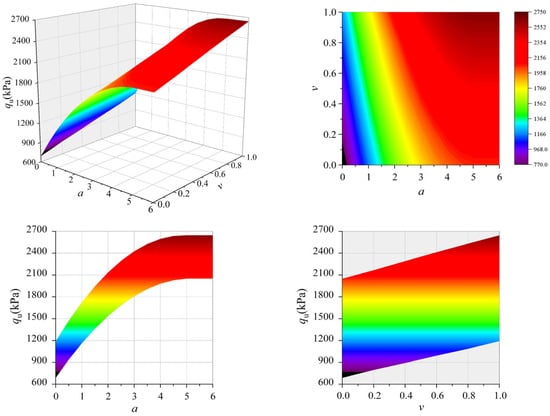
Figure 18.
Effect of distance to slope crest.
5.4. Base Roughness
The base roughness directly affects the angle ψ between faces AB and BC. Two extreme base roughness conditions are discussed: a completely rough base with ψ = φ and a completely smooth base with ψ = π/4 + φ/2. When the heterogeneity coefficient ν is 0, 0.5 and 1, the ultimate bearing capacity qu varies with the coefficient a as shown in Figure 19. It is found that the bearing capacity qu is greater for a completely rough base than for a completely smooth base. For the coefficient ν = 0, 0.5 and 1 with a = 1, the bearing capacity qu for a completely rough base compared to that for a completely smooth base is increased by 29.7%, 25.1% and 24.4%, respectively. These findings highlight that base roughness significantly affects the ultimate bearing capacity estimation for foundations adjacent to slopes, with its effect being more pronounced at a lower heterogeneity coefficient. Notably, the critical distance coefficient ac is larger for a completely smooth base than for a completely rough one, which indicates a slower convergence of the ultimate bearing capacity for smooth bases.
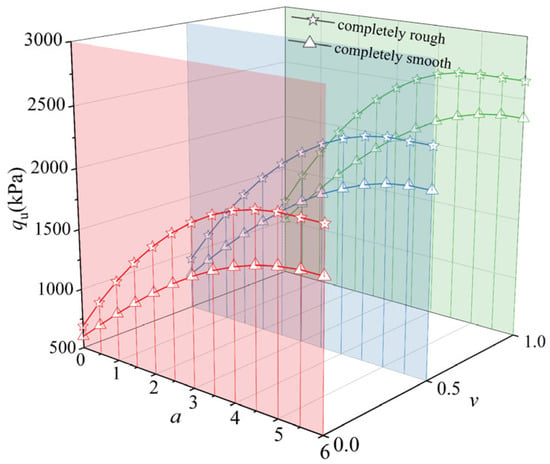
Figure 19.
Effect of base roughness.
6. Discussion and Limitations
This study proposes an analytical framework for evaluating the ultimate bearing capacity of strip foundations situated near heterogeneous and anisotropic slopes by extending the classical Meyerhof theory. The approach incorporates factors such as soil heterogeneity, anisotropy, the horizontal distance from the foundation to the slope crest and base roughness, which are often overlooked or treated separately in traditional models. The use of a limit equilibrium method allows for a transparent, step-by-step derivation of bearing capacity equations, ensuring both conceptual clarity and practical applicability. Consequently, the model can serve as a preliminary design tool for estimating the ultimate bearing capacity of foundations near slopes, particularly where soil exhibits spatial variability and directional strength behavior. The identified influence of slope crest proximity and base roughness offers practical insights for optimizing foundation layouts in constrained terrains.
The classical Mohr–Coulomb failure criterion is employed to assess the ultimate bearing capacity of strip foundations adjacent to heterogeneous and anisotropic slopes. However, this derivation neglects soil dilatancy, especially relevant in sandy soils. Future studies should consider extending the Mohr–Coulomb criterion using a non-associated flow rule to evaluate the impact of soil dilation on foundation bearing capacity near slopes.
The current analysis is limited to static conditions; dynamic effects, particularly in seismic zones, are not considered. This omission is significant for foundations near slopes, where cyclic loading and inertial forces can dominate failure mechanisms. Future research should incorporate pseudo-static or fully dynamic analyses to address this limitation.
Additionally, the model assumes a constant of anisotropy, coefficient k, for single-layer soil throughout the depth, which does not reflect the stratified or depth-dependent anisotropy commonly observed in natural deposits. This simplification may reduce the model’s accuracy in layered soil systems. Future work should investigate the effects of anisotropy in multi-layered foundation soils on the bearing capacity of foundations adjacent to slopes.
7. Conclusions
Within the framework of the Meyerhof theory, a unilateral failure mode of strip foundations adjacent to heterogeneous and anisotropic slopes with varying base roughness is established. A conventional form formulation of the ultimate bearing capacity for foundations adjacent to slopes is derived using the limit equilibrium method and the superposition principle. The following conclusions are drawn from this study:
(1) The proposed analytical solution for the ultimate bearing capacity of strip foundations adjacent to slopes comprehensively accounts for the effects of soil heterogeneity, anisotropy and base roughness. It also reduces smoothly to the classical solution for homogeneous and isotropic soils. Detailed calculation steps of this proposed equation are provided with an iterative trial method. Validations against theoretical solutions, numerical simulations and experimental data confirm the accuracy and reliability of the proposed formulation.
(2) An increase in the heterogeneity coefficient significantly enhances the ultimate bearing capacity of foundations adjacent to slopes, while the ultimate bearing capacity gradually decreases with an increasing anisotropy coefficient. These effects are more significant for a soil with relatively higher cohesions. Therefore, it is essential to emphasize the effects of soil heterogeneity and anisotropy to optimize the performance of foundations adjacent to slopes.
(3) The ultimate bearing capacity increases as the horizontal distance from the foundation to the slope crest increases, eventually approaching that of foundations on level ground at a critical distance. The bearing capacity is higher with a completely rough base than a completely smooth one. The influence of base roughness becomes more pronounced as the heterogeneity coefficient decreases. Notably, this critical distance is greater for a completely smooth base.
Author Contributions
Conceptualization, Q.Y.; methodology, Q.Y. and X.C.; software, Q.Y.; validation, Q.Y., X.C. and Z.Z.; formal analysis, Q.Y. and X.C.; investigation, Q.Y. and Y.Y.; resources, Q.Y. and X.C.; data curation, Q.Y. and Y.Y.; writing—original draft preparation, Q.Y.; writing—review and editing, X.C. and Z.Z.; visualization, Q.Y. and X.C.; supervision, X.C.; project administration, Q.Y.; funding acquisition, Q.Y. and Z.Z. All authors have read and agreed to the published version of the manuscript.
Funding
This research was funded by the Natural Science Foundation of Shandong Providence (Grant NO. ZR2022QD026), and the Start-up Funding for Doctoral Research at Shandong University of Technology (Grant NO. 422041).
Data Availability Statement
The data used to support the findings of this study are available from the corresponding author upon request.
Conflicts of Interest
The authors declare no conflicts of interest.
References
- Bozorgpour, M.H.; Binesh, S.M.; Fathipour, H. Stability Analysis of the Slopes Composed of Heterogeneous and Anisotropic Clay. Acta Geotech. 2025, 20, 69–87. [Google Scholar] [CrossRef]
- Zou, J.-F.; Peng, Z.-Z. Stability Analyses of Shallow Rectangular Tunnels in Anisotropic and Nonhomogeneous Soils Using a Kinematic Approach. Int. J. Geomech. 2024, 24, 04024127. [Google Scholar] [CrossRef]
- Hu, P.; Leo, C.; Liyanapathirana, S. Horizontal Bearing Capacity Factors for Conical Footings on Clay. Appl. Ocean Res. 2022, 127, 103308. [Google Scholar] [CrossRef]
- Rao, P.; Zhao, L.; Chen, Q.; Nimbalkar, S. Three-Dimensional Limit Analysis of Slopes Reinforced with Piles in Soils Exhibiting Heterogeneity and Anisotropy in Cohesion. Soil Dyn. Earthq. Eng. 2019, 121, 194–199. [Google Scholar] [CrossRef]
- Hong, L.; Chen, L.; Wang, X. Reliability Analysis of Serviceability Limit State for Braced Excavation Considering Multiple Failure Modes in Spatially Variable Soil. Buildings 2022, 12, 722. [Google Scholar] [CrossRef]
- Nguyen Van, C.; Keawsawasvong, S.; Nguyen, D.K.; Lai, V.Q. Machine Learning Regression Approach for Analysis of Bearing Capacity of Conical Foundations in Heterogenous and Anisotropic Clays. Neural Comput. Appl. 2023, 35, 3955–3976. [Google Scholar] [CrossRef]
- Liu, J.Y.; Liu, J. Seismic Active Earth Pressure in Nonhomogeneous and Anisotropic Soils. Comput. Geotech. 2024, 170, 106315. [Google Scholar] [CrossRef]
- Yang, X.L.; Du, D.C. Upper Bound Analysis for Bearing Capacity of Nonhomogeneous and Anisotropic Clay Foundation. KSCE J. Civ. Eng. 2016, 20, 2702–2710. [Google Scholar] [CrossRef]
- Keawsawasvong, S.; Shiau, J.; Ngamkhanong, C.; Lai, V.Q.; Thongchom, C. Undrained Stability of Ring Foundations: Axisymmetry, Anisotropy, and Nonhomogeneity. Int. J. Geomech. 2022, 22, 04021253. [Google Scholar] [CrossRef]
- Lai, V.Q.; Shiau, J.; Van, C.N.; Tran, H.D.; Keawsawasvong, S. Bearing Capacity of Conical Footing on Anisotropic and Heterogeneous Clays Using FEA and ANN. Mar. Georesour. Geotechnol. 2023, 41, 1053–1070. [Google Scholar] [CrossRef]
- Chen, T.; Xiao, S. An Upper Bound Solution to Undrained Bearing Capacity of Rigid Strip Footings near Slopes. Int. J. Civ. Eng. 2020, 18, 475–485. [Google Scholar] [CrossRef]
- Khan, M.U.A.; Shukla, S.K. Load–Settlement Response and Bearing Capacity of a Surface Footing Located over a Conduit Buried Within a Soil Slope. Int. J. Geomech. 2020, 20, 04020173. [Google Scholar] [CrossRef]
- Tan, M.; Vanapalli, S.K. Foundation Bearing Capacity Estimation on Unsaturated Soil Slope under Transient Flow Condition Using Slip Line Method. Comput. Geotech. 2022, 148, 104804. [Google Scholar] [CrossRef]
- Jin, L.; Feng, Y.; Zhang, H.; Feng, Q. The Use of Improved Radial Movement Optimization to Calculate the Ultimate Bearing Capacity of a Nonhomogeneous Clay Foundation Adjacent to Slopes. Comput. Geotech. 2020, 118, 103338. [Google Scholar] [CrossRef]
- Kalourazi, A.F.; Chenari, R.J.; Veiskarami, M. Bearing Capacity of Strip Footings Adjacent to Anisotropic Slopes Using the Lower Bound Finite Element Method. Int. J. Geomech. 2020, 20, 04020213. [Google Scholar] [CrossRef]
- Gao, Z.; Zhao, J.; Li, X. The Deformation and Failure of Strip Footings on Anisotropic Cohesionless Sloping Grounds. Int. J. Numer. Anal. Methods Geomech. 2021, 45, 1526–1545. [Google Scholar] [CrossRef]
- Hou, C.; Zhang, Y.; Sun, Z.; Deng, X. Calculation of Upper Bound of Bearing Capacity of Non-homogeneous and Anisotropic Foundation Adjacent to Slope. J. Highw. Transp. Res. Dev. 2019, 36, 21–27. (In Chinese) [Google Scholar]
- Xu, S.; Yang, X.; Yin, Z. Seismic Bearing Capacity of Rectangular Foundations near Slopes Using the Upper Bound Method. Comput. Geotech. 2025, 182, 107133. [Google Scholar] [CrossRef]
- Castelli, F.; Motta, E. Bearing Capacity of Strip Footings near Slopes. Geotech. Geol. Eng. 2010, 28, 187–198. [Google Scholar] [CrossRef]
- Liao, H.; Xu, S.; Wu, C. 3D Seismic Bearing Capacity of Rectangular Foundations near Rock Slopes Using Upper Bound Method. Alex. Eng. J. 2024, 109, 778–791. [Google Scholar] [CrossRef]
- Zhang, C.; Yan, Q.; Zhao, J.; Wang, J. Formulation of Ultimate Bearing Capacity for Strip Foundations Based on the Meyerhof Theory and Unsaturated Soil Mechanics. Comput. Geotech. 2020, 126, 103734. [Google Scholar] [CrossRef]
- Yan, Q.; Zhao, J.; Zhang, C. Ultimate Bearing Capacity of a Strip Foundation near Slopes Based on the Unified Strength Theory. Arab. J. Geosci. 2021, 14, 2218. [Google Scholar] [CrossRef]
- Meyerhof, G.G. The Ultimate Bearing Capacity of Foundations. Géotechnique 1951, 2, 301–332. [Google Scholar] [CrossRef]
- Xu, J.; Yang, X. Seismic and Static Stability Analysis for 3D Reinforced Slope in Nonhomogeneous and Anisotropic Soils. Int. J. Geomech. 2018, 18, 04018065. [Google Scholar] [CrossRef]
- Reddy, A.S.; Rao, K.N.V. Bearing Capacity of Strip Footing on c-φ Soils Exhibiting Anisotropy and Nonhomogeneity in Cohesion. Soils Found. 1982, 22, 49–60. [Google Scholar] [CrossRef]
- Tani, K.; Craig, W.H. Bearing Capacity of Circular Foundations on Soft Clay of Strength Increasing with Depth. Soils Found. 1995, 35, 21–35. [Google Scholar]
- Yang, F.; Zhao, L.; Yang, J. Upper Bound Ultimate Bearing Capacity of Rough Footings on Anisotropic and Nonhomogeneous Clays. Rock Soil Mech. 2010, 31, 2958–2966. (In Chinese) [Google Scholar]
- Keskin, S.M.; Laman, M. Model Studies of Bearing Capacity of Strip Footing on Sand Slope. KSCE J. Civ. Eng. 2013, 17, 699–711. [Google Scholar] [CrossRef]
- Castelli, F.; Lentini, V. Evaluation of the Bearing Capacity of Footings on Slopes. Int. J. Phys. Model. Geotech. 2012, 12, 112–118. [Google Scholar] [CrossRef]
Disclaimer/Publisher’s Note: The statements, opinions and data contained in all publications are solely those of the individual author(s) and contributor(s) and not of MDPI and/or the editor(s). MDPI and/or the editor(s) disclaim responsibility for any injury to people or property resulting from any ideas, methods, instructions or products referred to in the content. |
© 2025 by the authors. Licensee MDPI, Basel, Switzerland. This article is an open access article distributed under the terms and conditions of the Creative Commons Attribution (CC BY) license (https://creativecommons.org/licenses/by/4.0/).