
Quantifying the Thermal and Energy Impacts of Urban Morphology Using Multi-Source Data: A Multi-Scale Study in Coastal High-Density Contexts


Abstract
1. Introduction
1.1. Background
1.2. Literature Review
1.3. Research Gaps
2. Materials and Methods
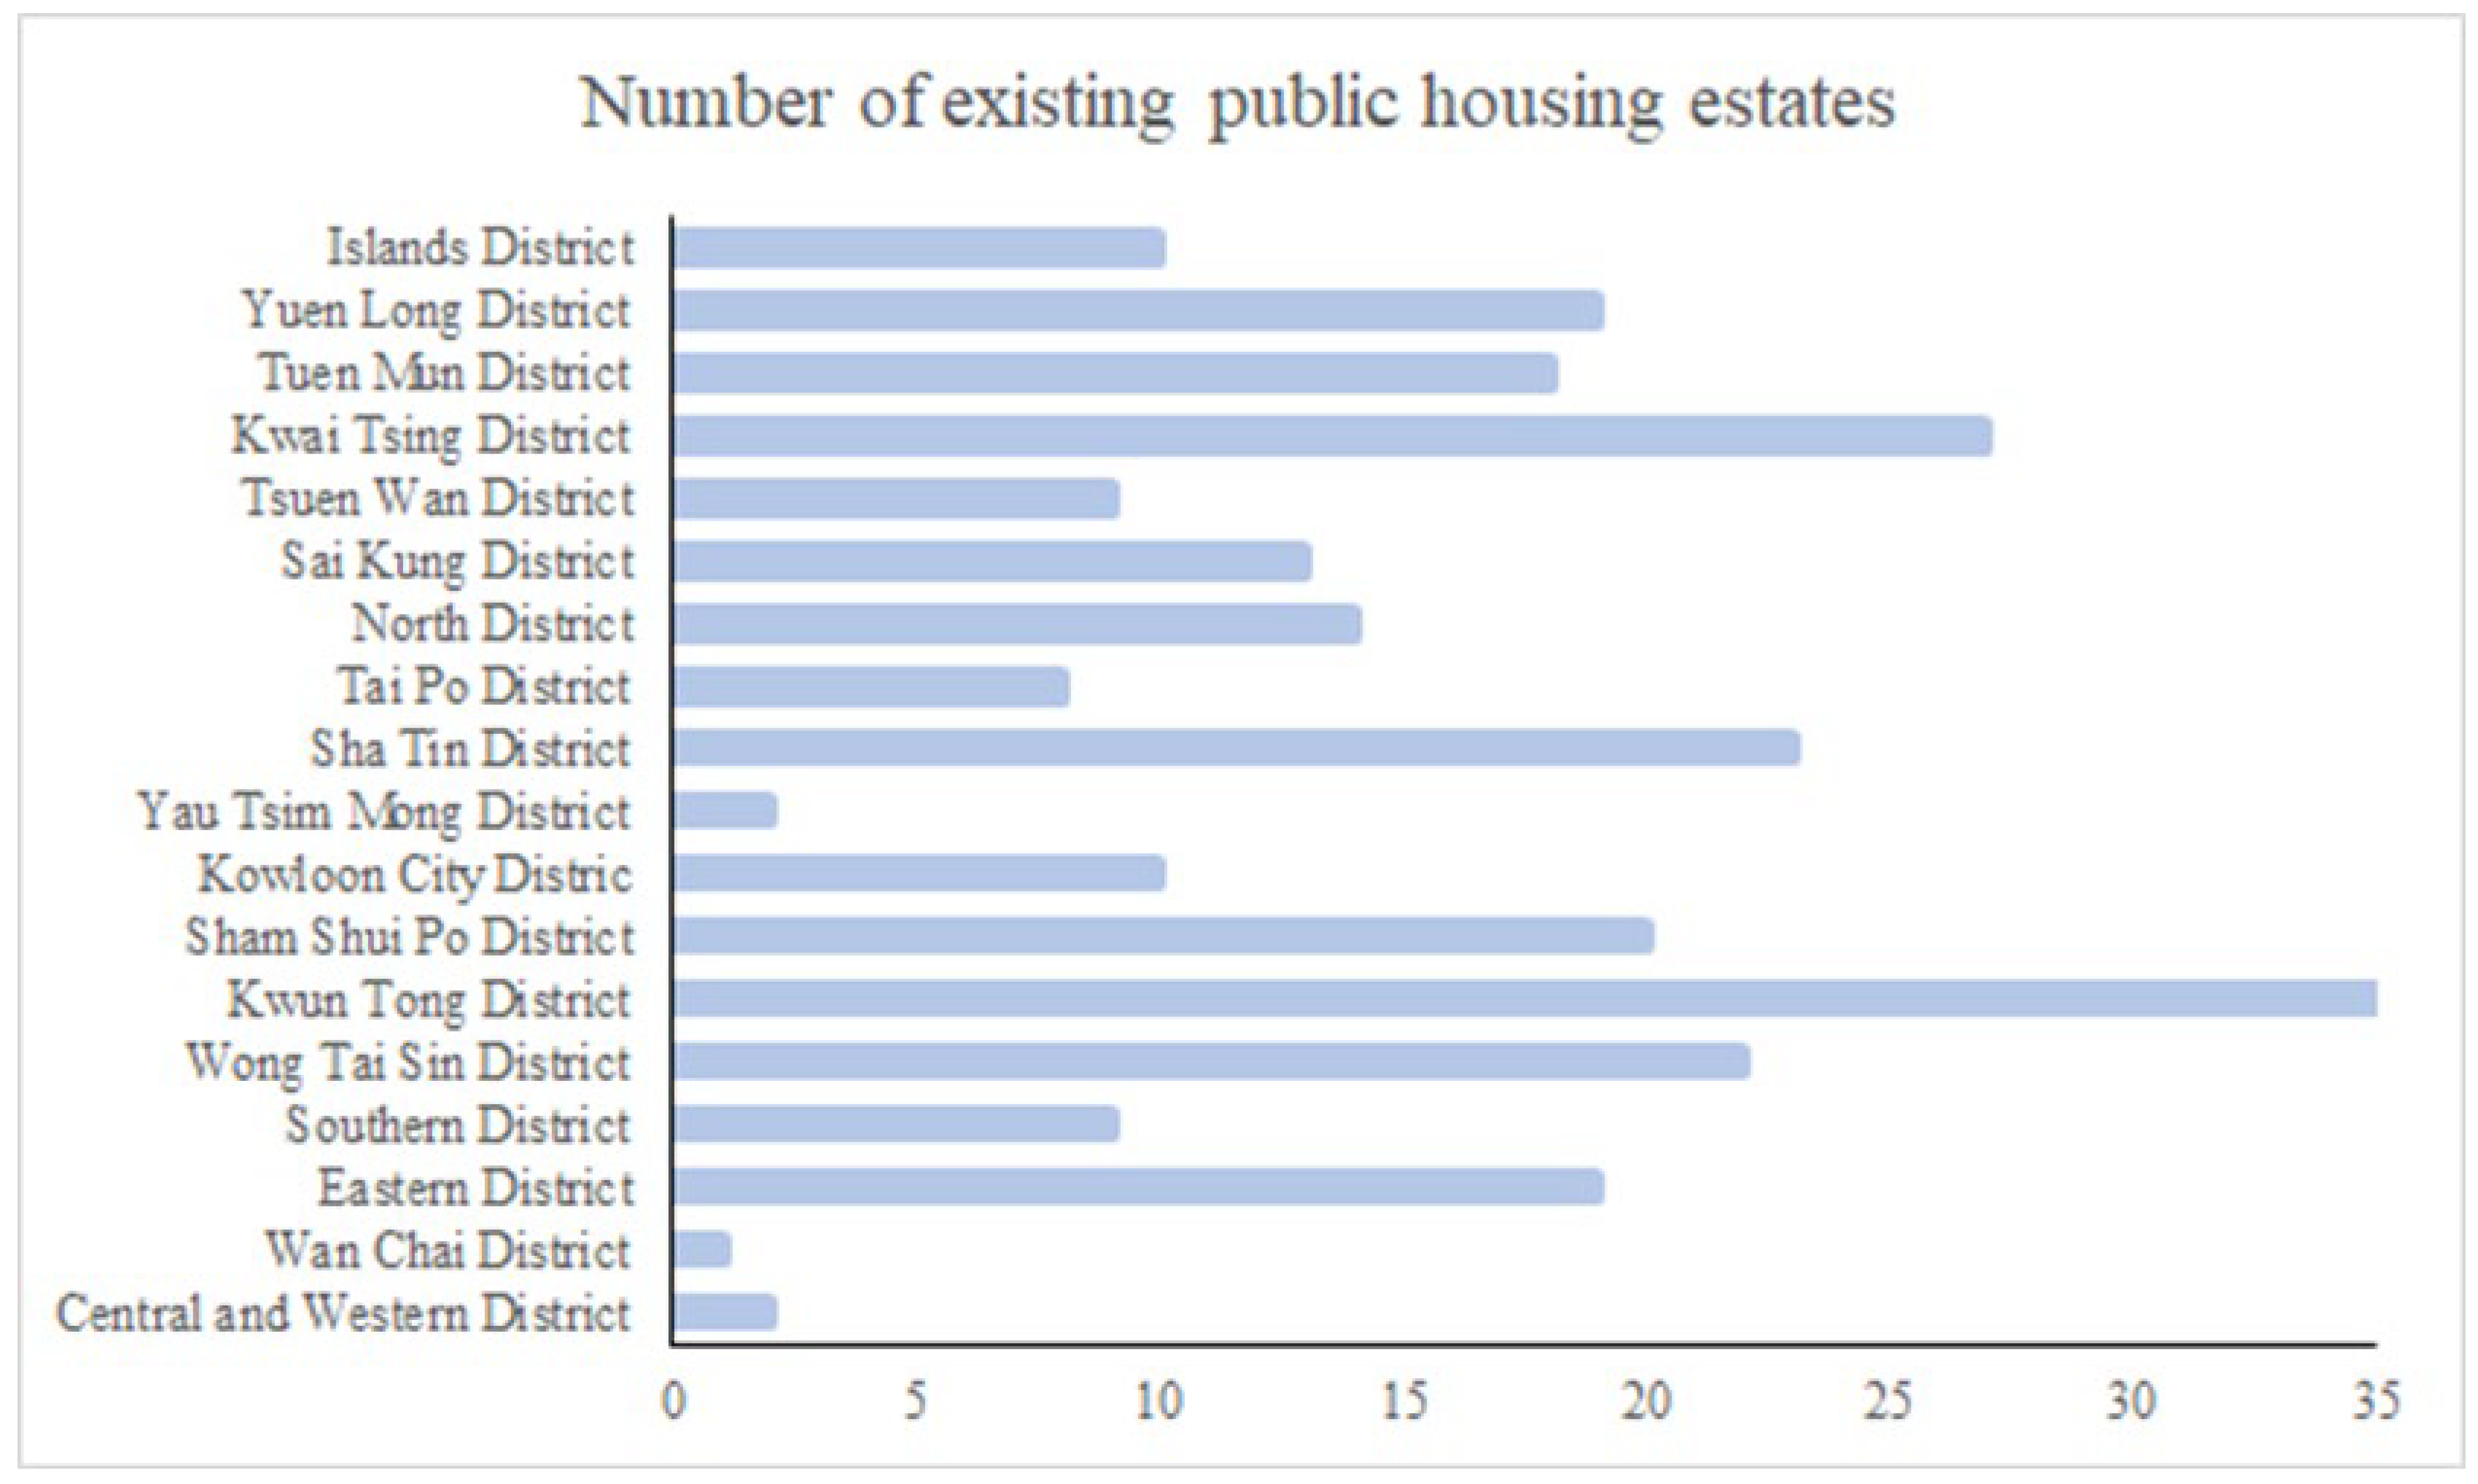
2.1. Description of the Study Area
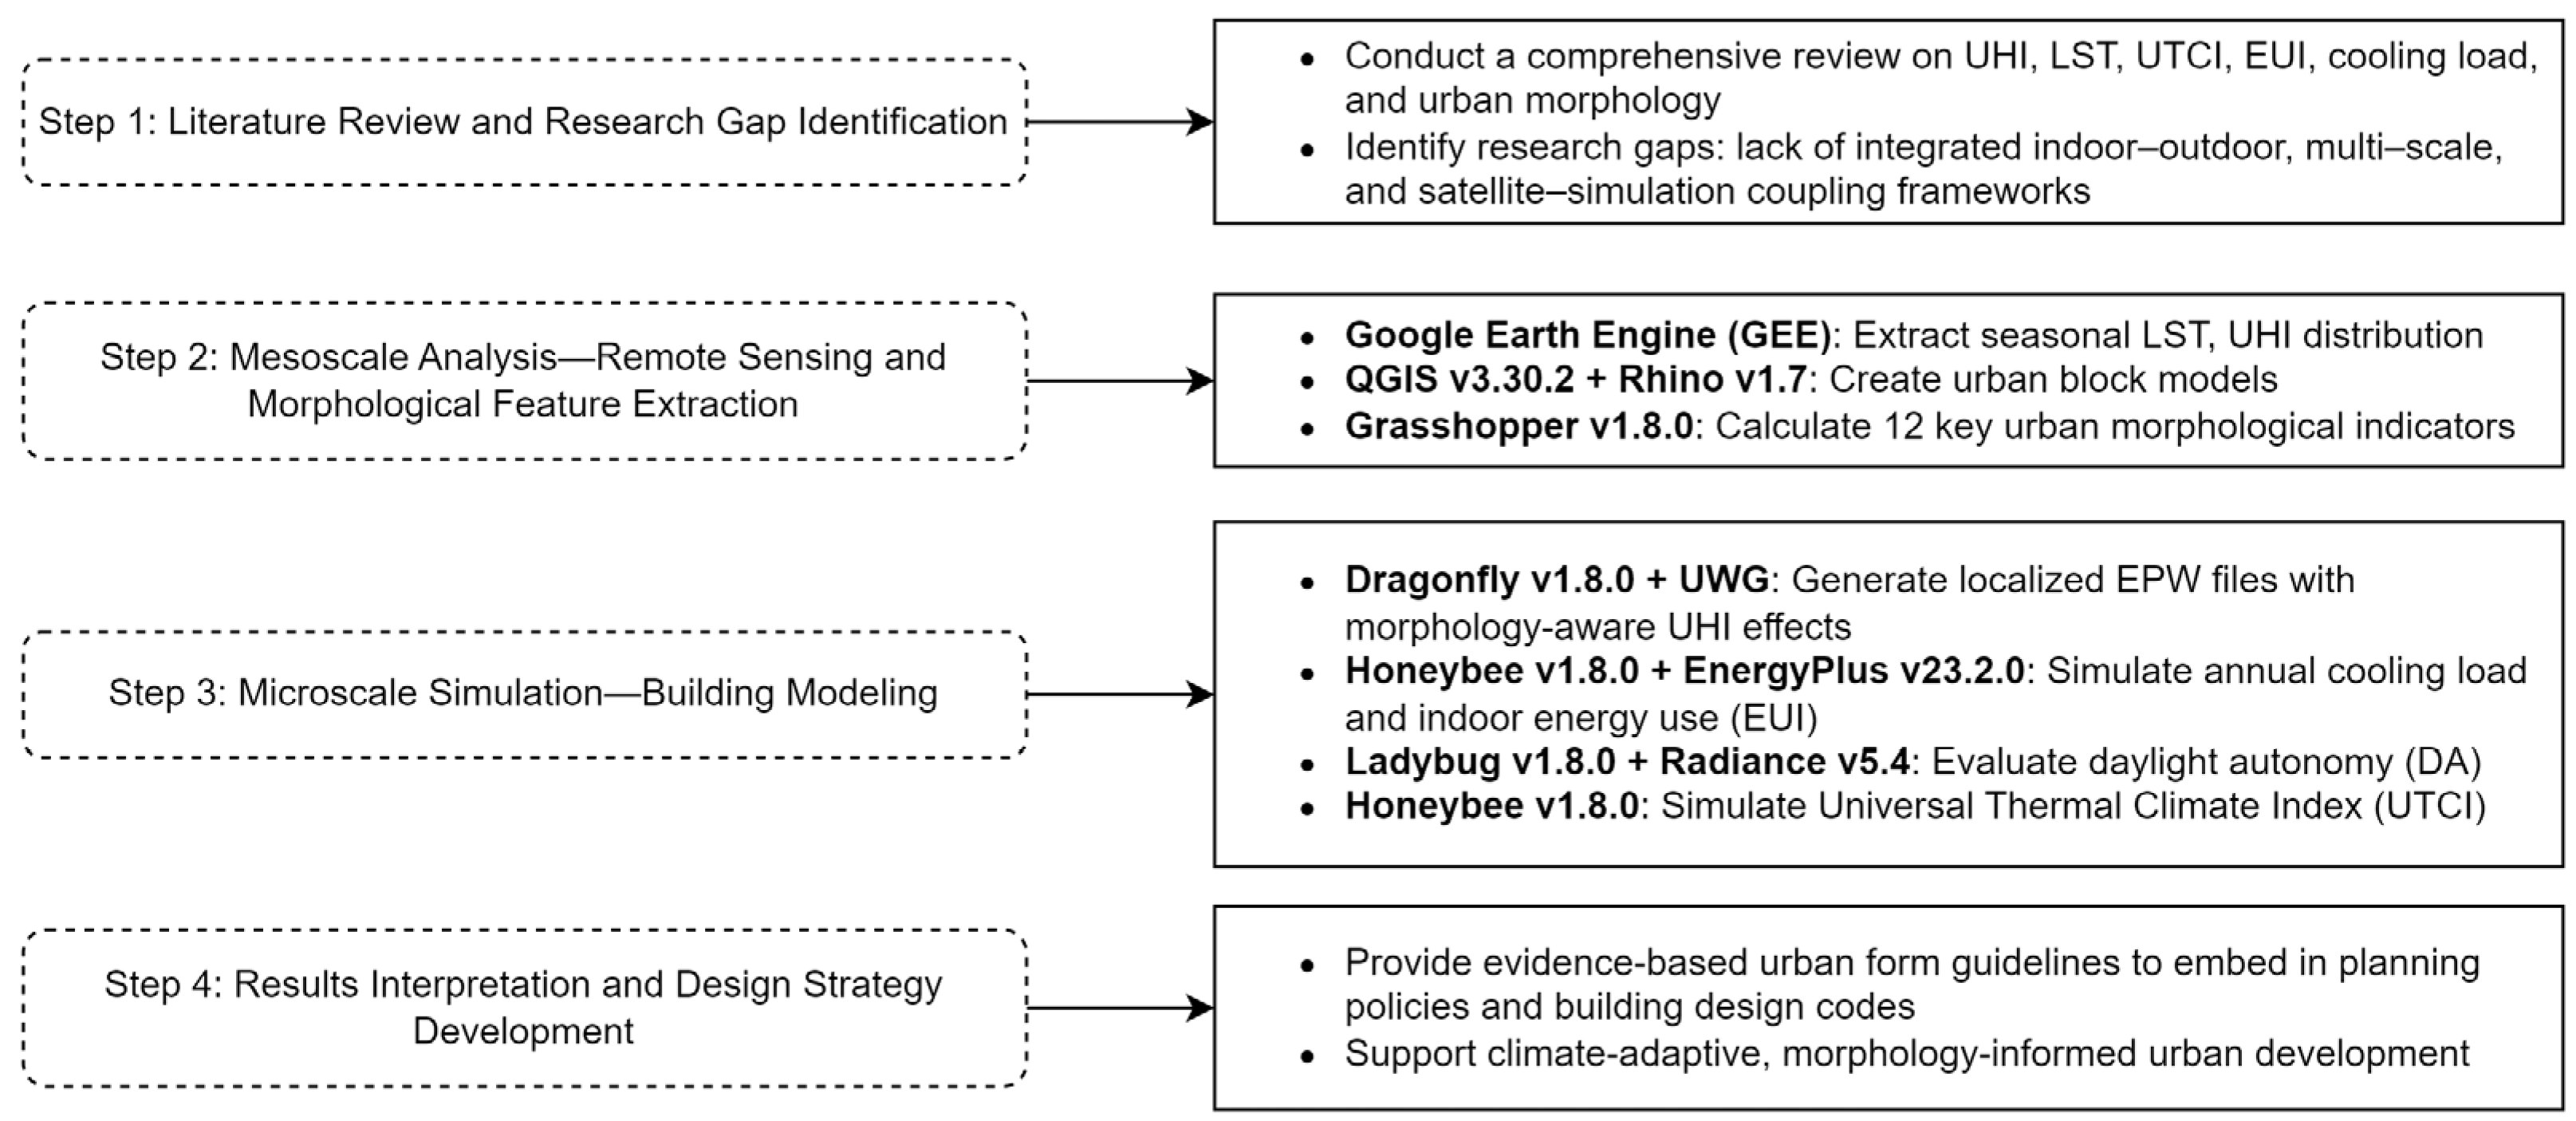
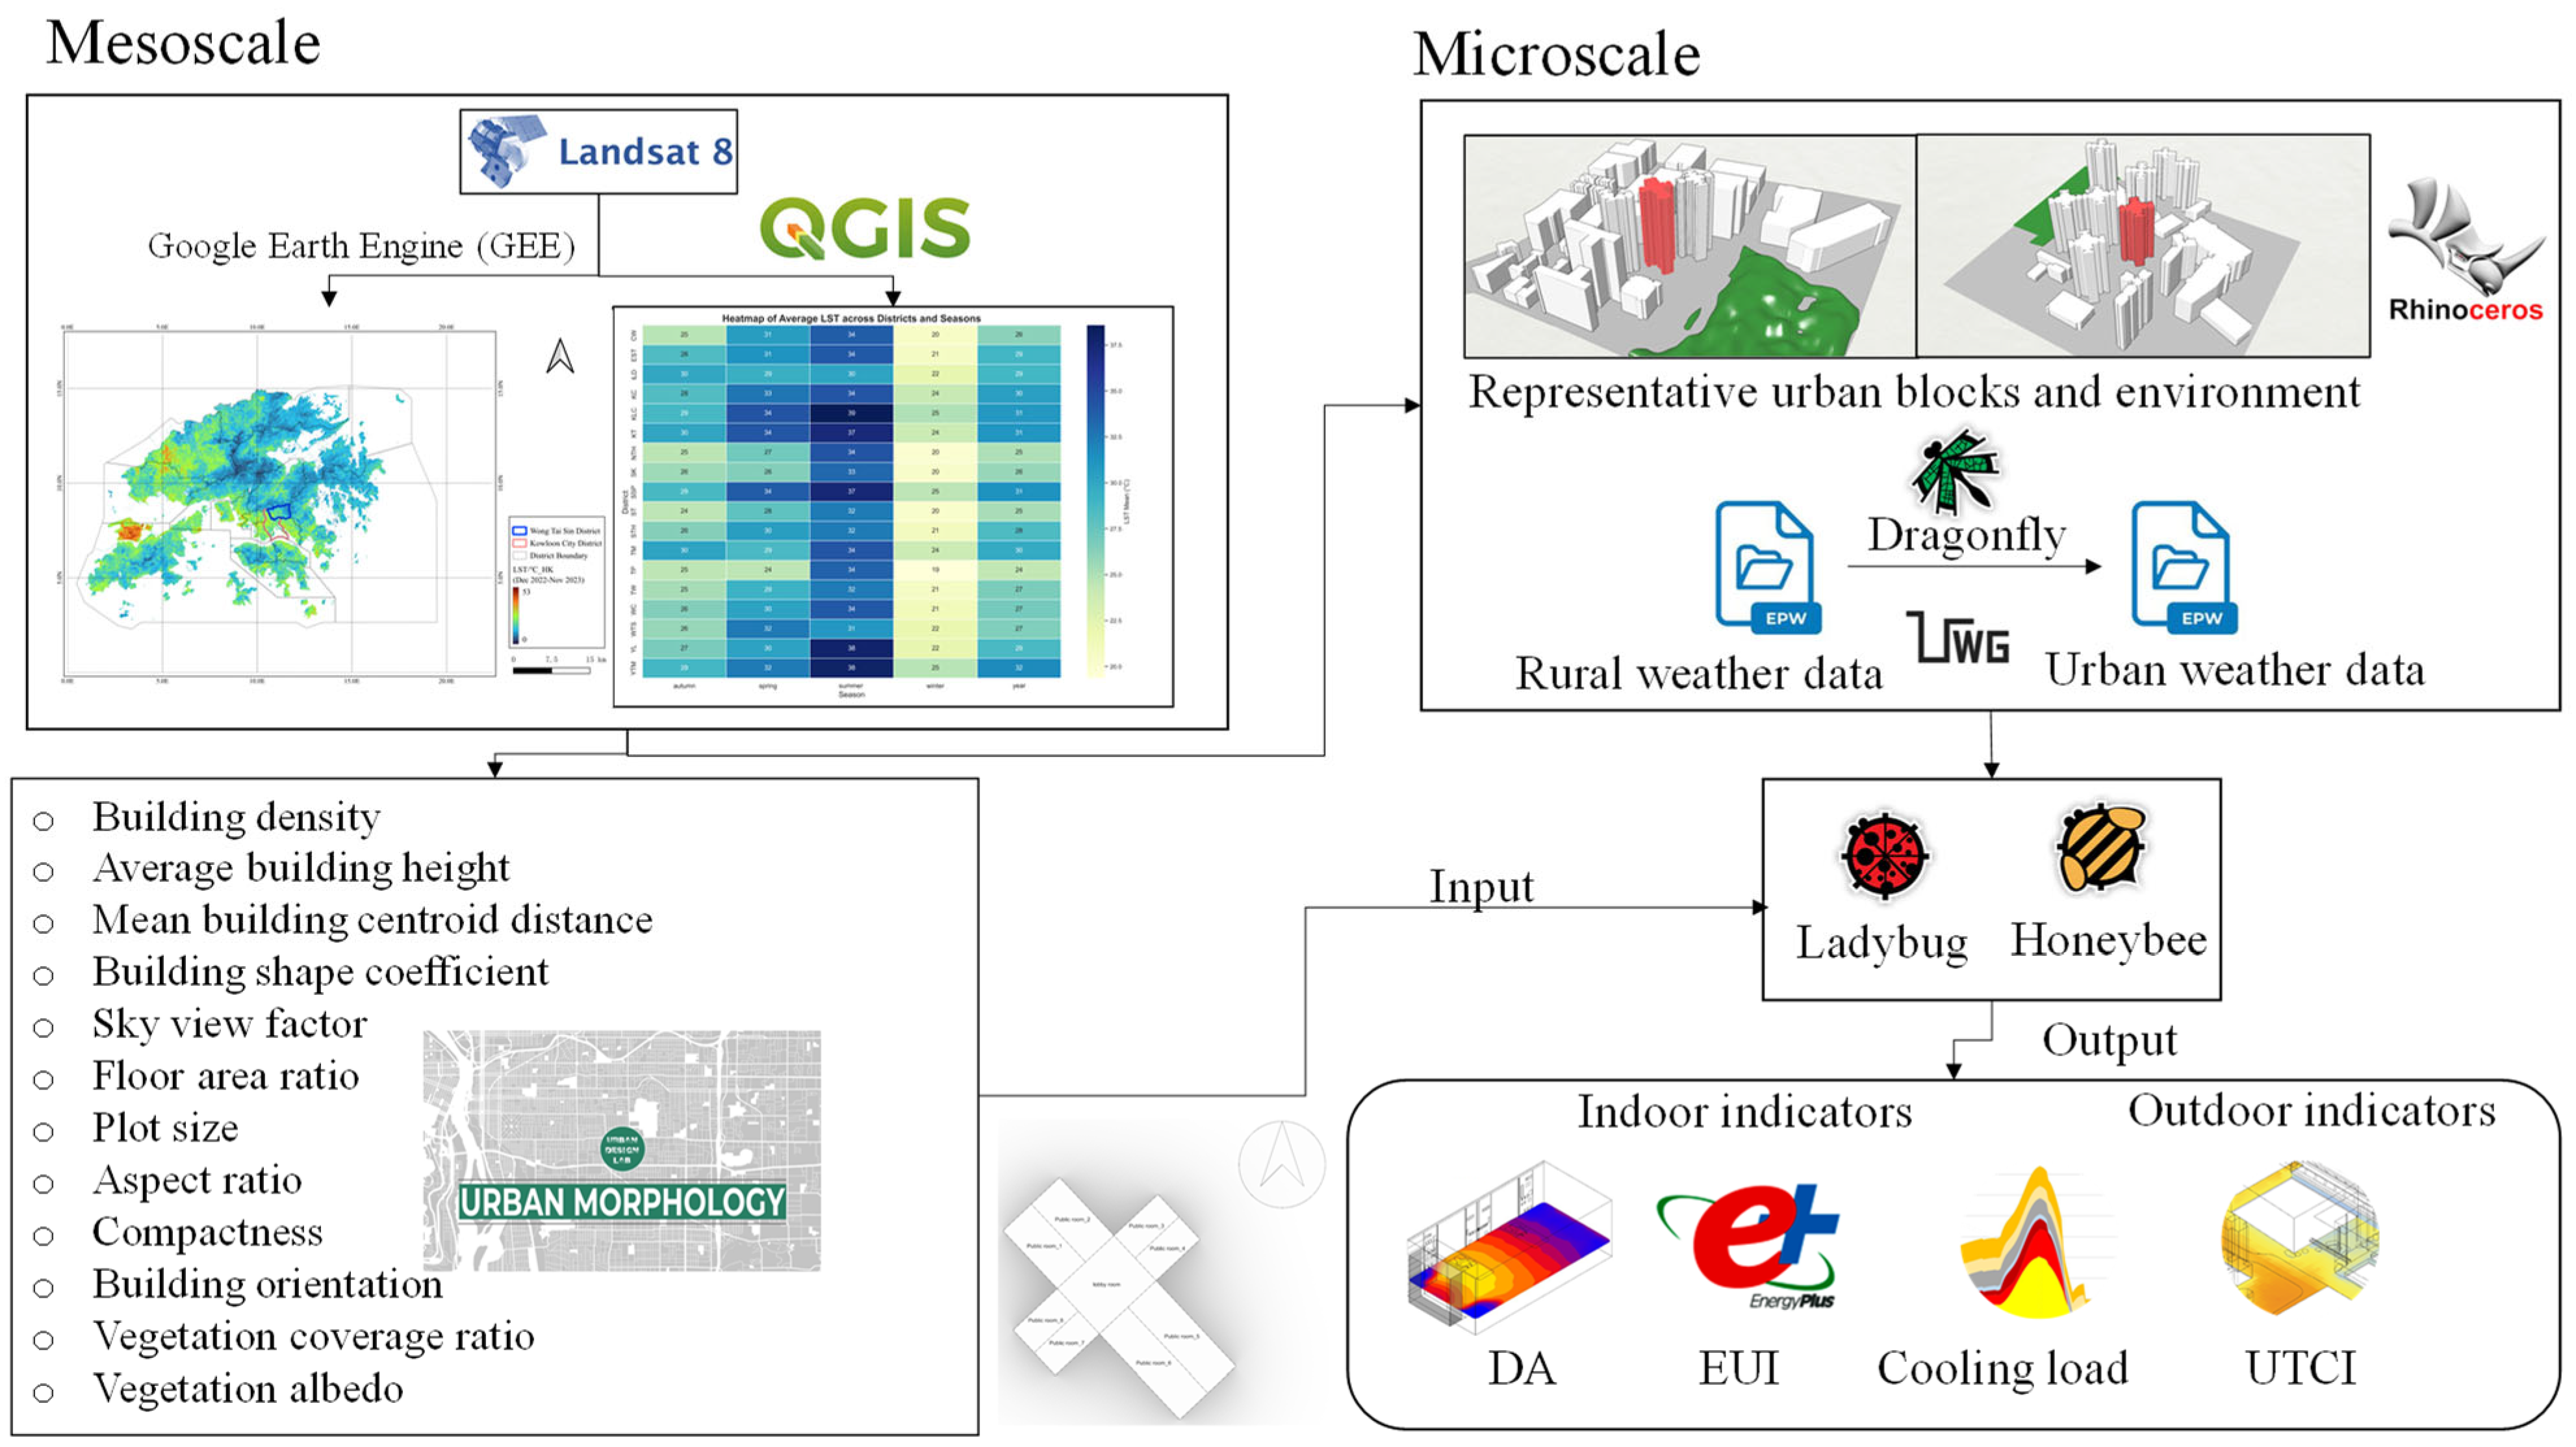
2.2. Research Methodology
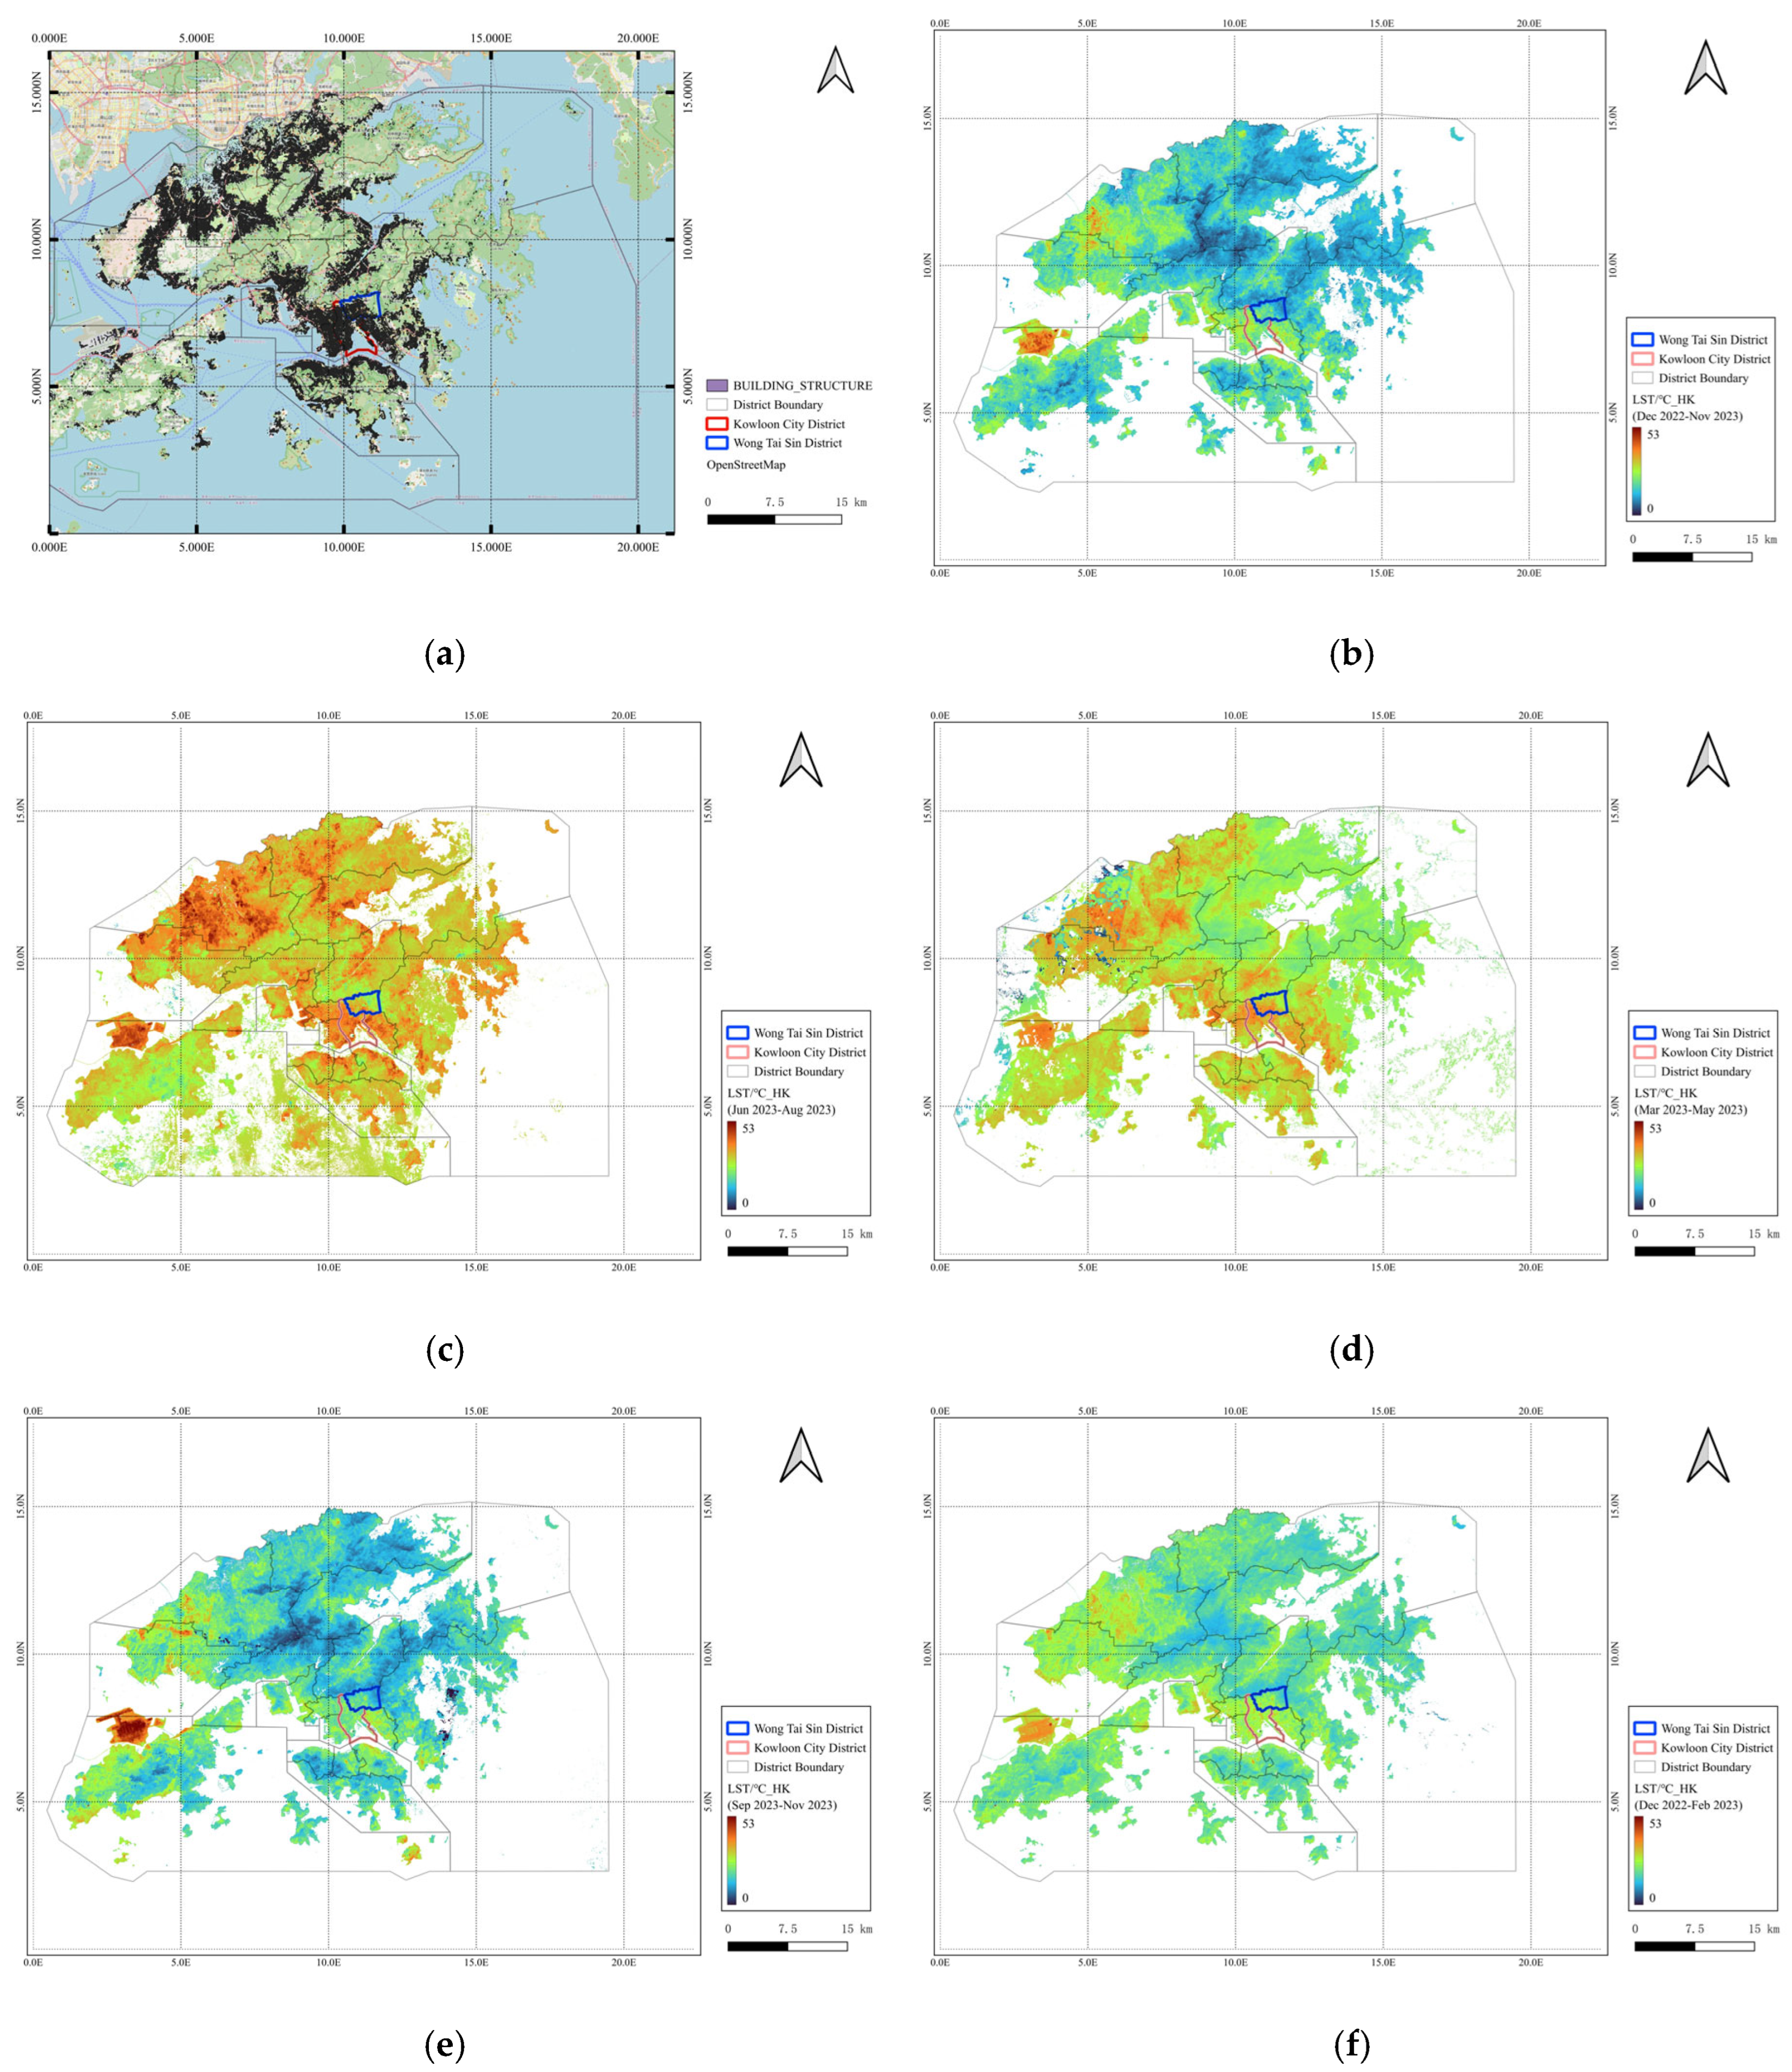
- The mesoscale analysis extracts urban heat island patterns and morphological features using (Google LLC, Mountain View, CA, USA; https://code.earthengine.google.com/, accessed on 27 November 2024) and QGIS v3.30.2 (QGIS Development Team, Grüt, Zurich, Switzerland) based on seasonal Landsat 8 imagery.
- The microscale simulation evaluates indoor–outdoor environmental performance using a combination of Dragonfly v1.8.0 (Ladybug Tools LLC, New York, NY, USA), EnergyPlus v23.2.0 (U.S. Department of Energy, Washington, DC, USA), Ladybug v1.8.0, and Honeybee v1.8.0 (Ladybug Tools LLC, New York, NY, USA) tools within the Rhino–Grasshopper (Robert McNeel & Associates, Seattle, WA, USA) environment.
2.3. Data Source and Material
2.4. Evaluation Metrics
2.4.1. Land Surface Temperature
2.4.2. Urban Heat Island Intensity
2.4.3. Energy Use Intensity
2.4.4. Cooling Energy Consumption
2.4.5. Universal Thermal Climate Index
2.4.6. Daylight Autonomy
3. Results and Discussion
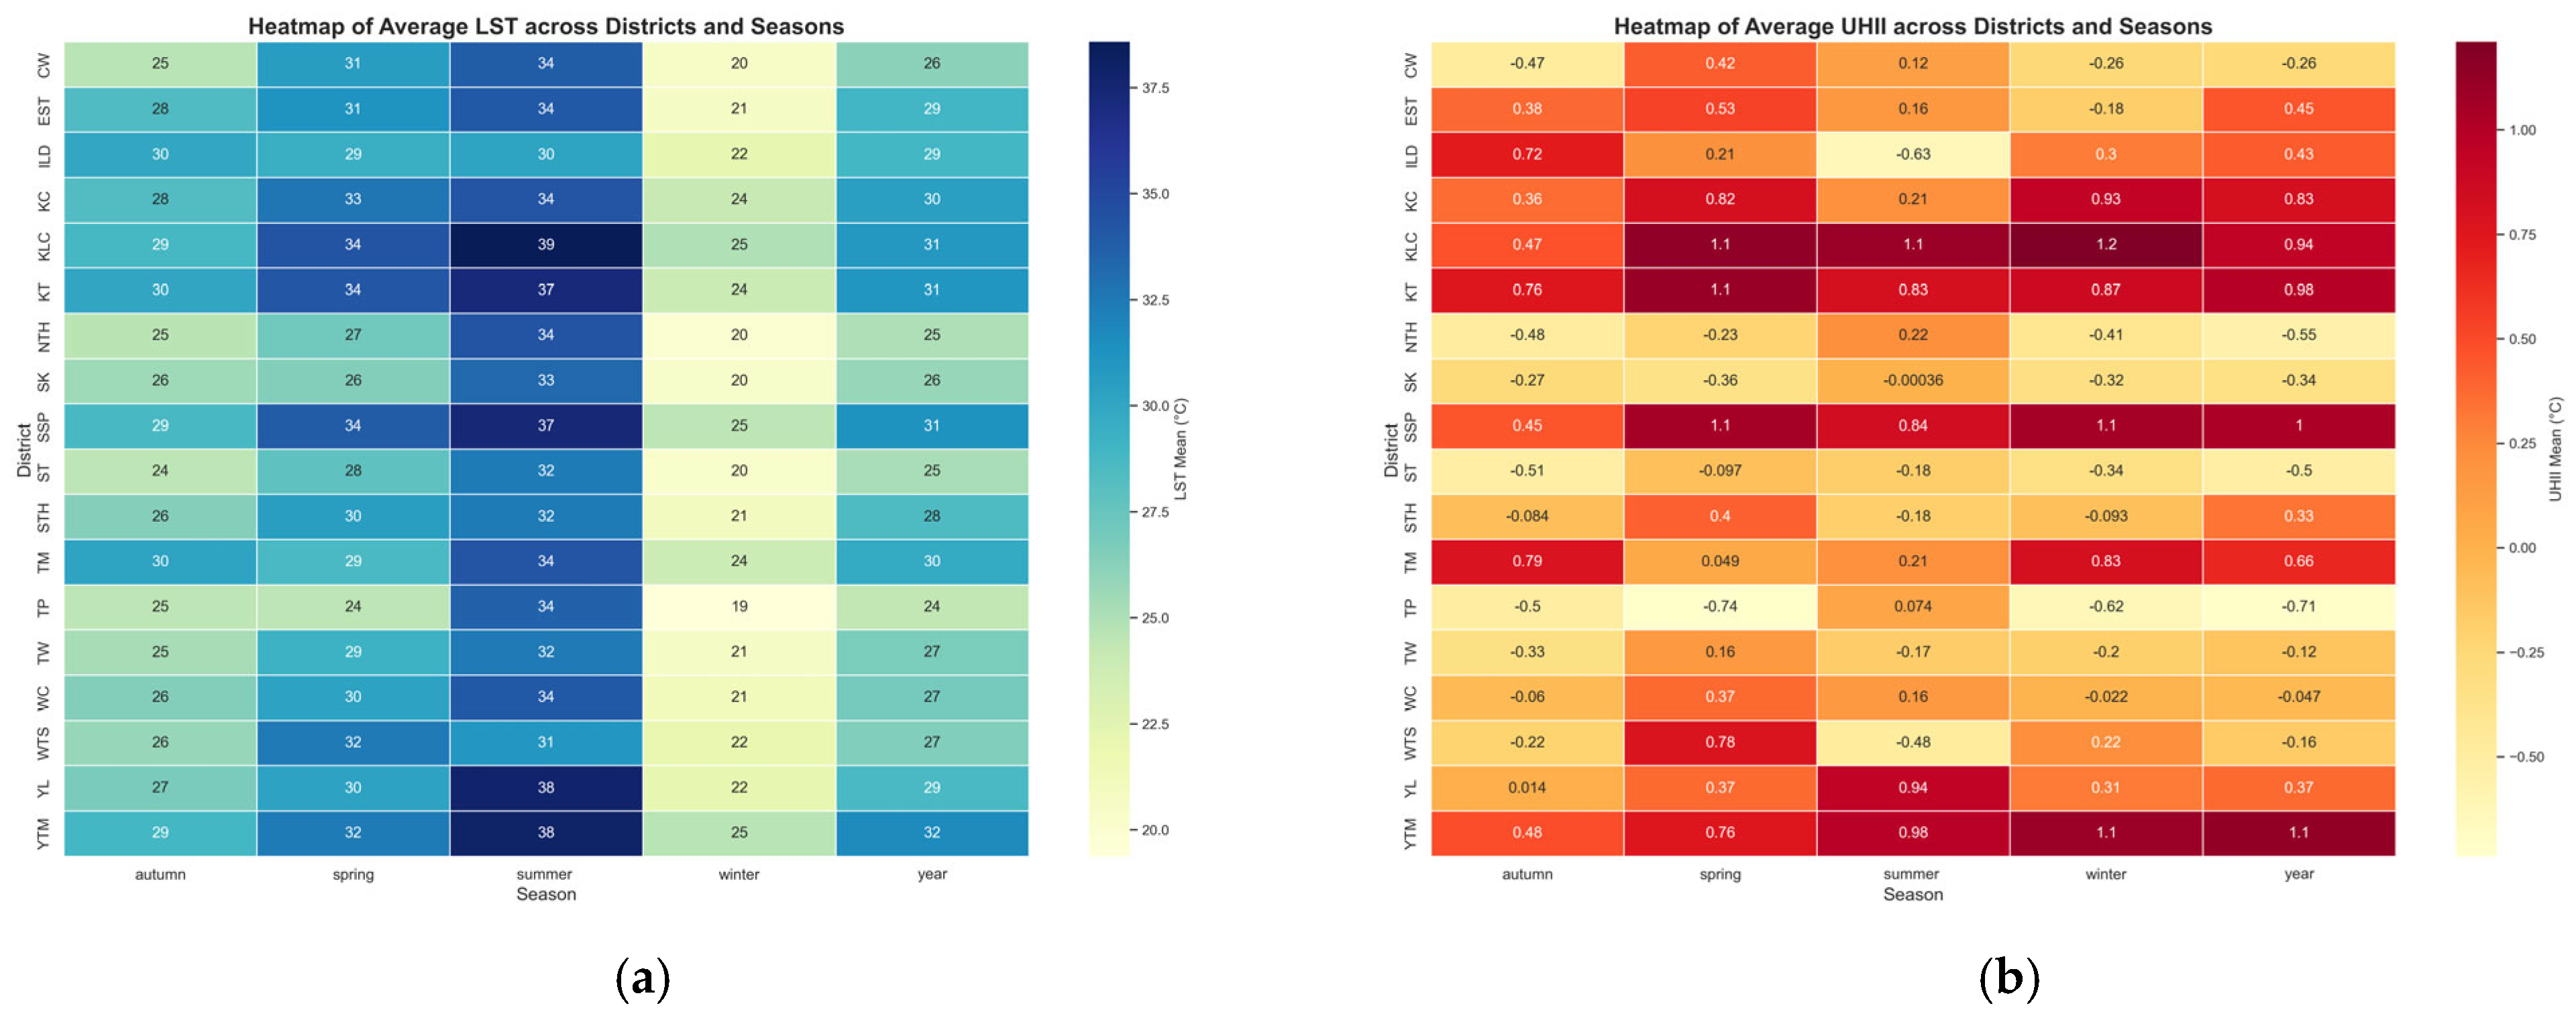
3.1. Seasonal Variation Analysis
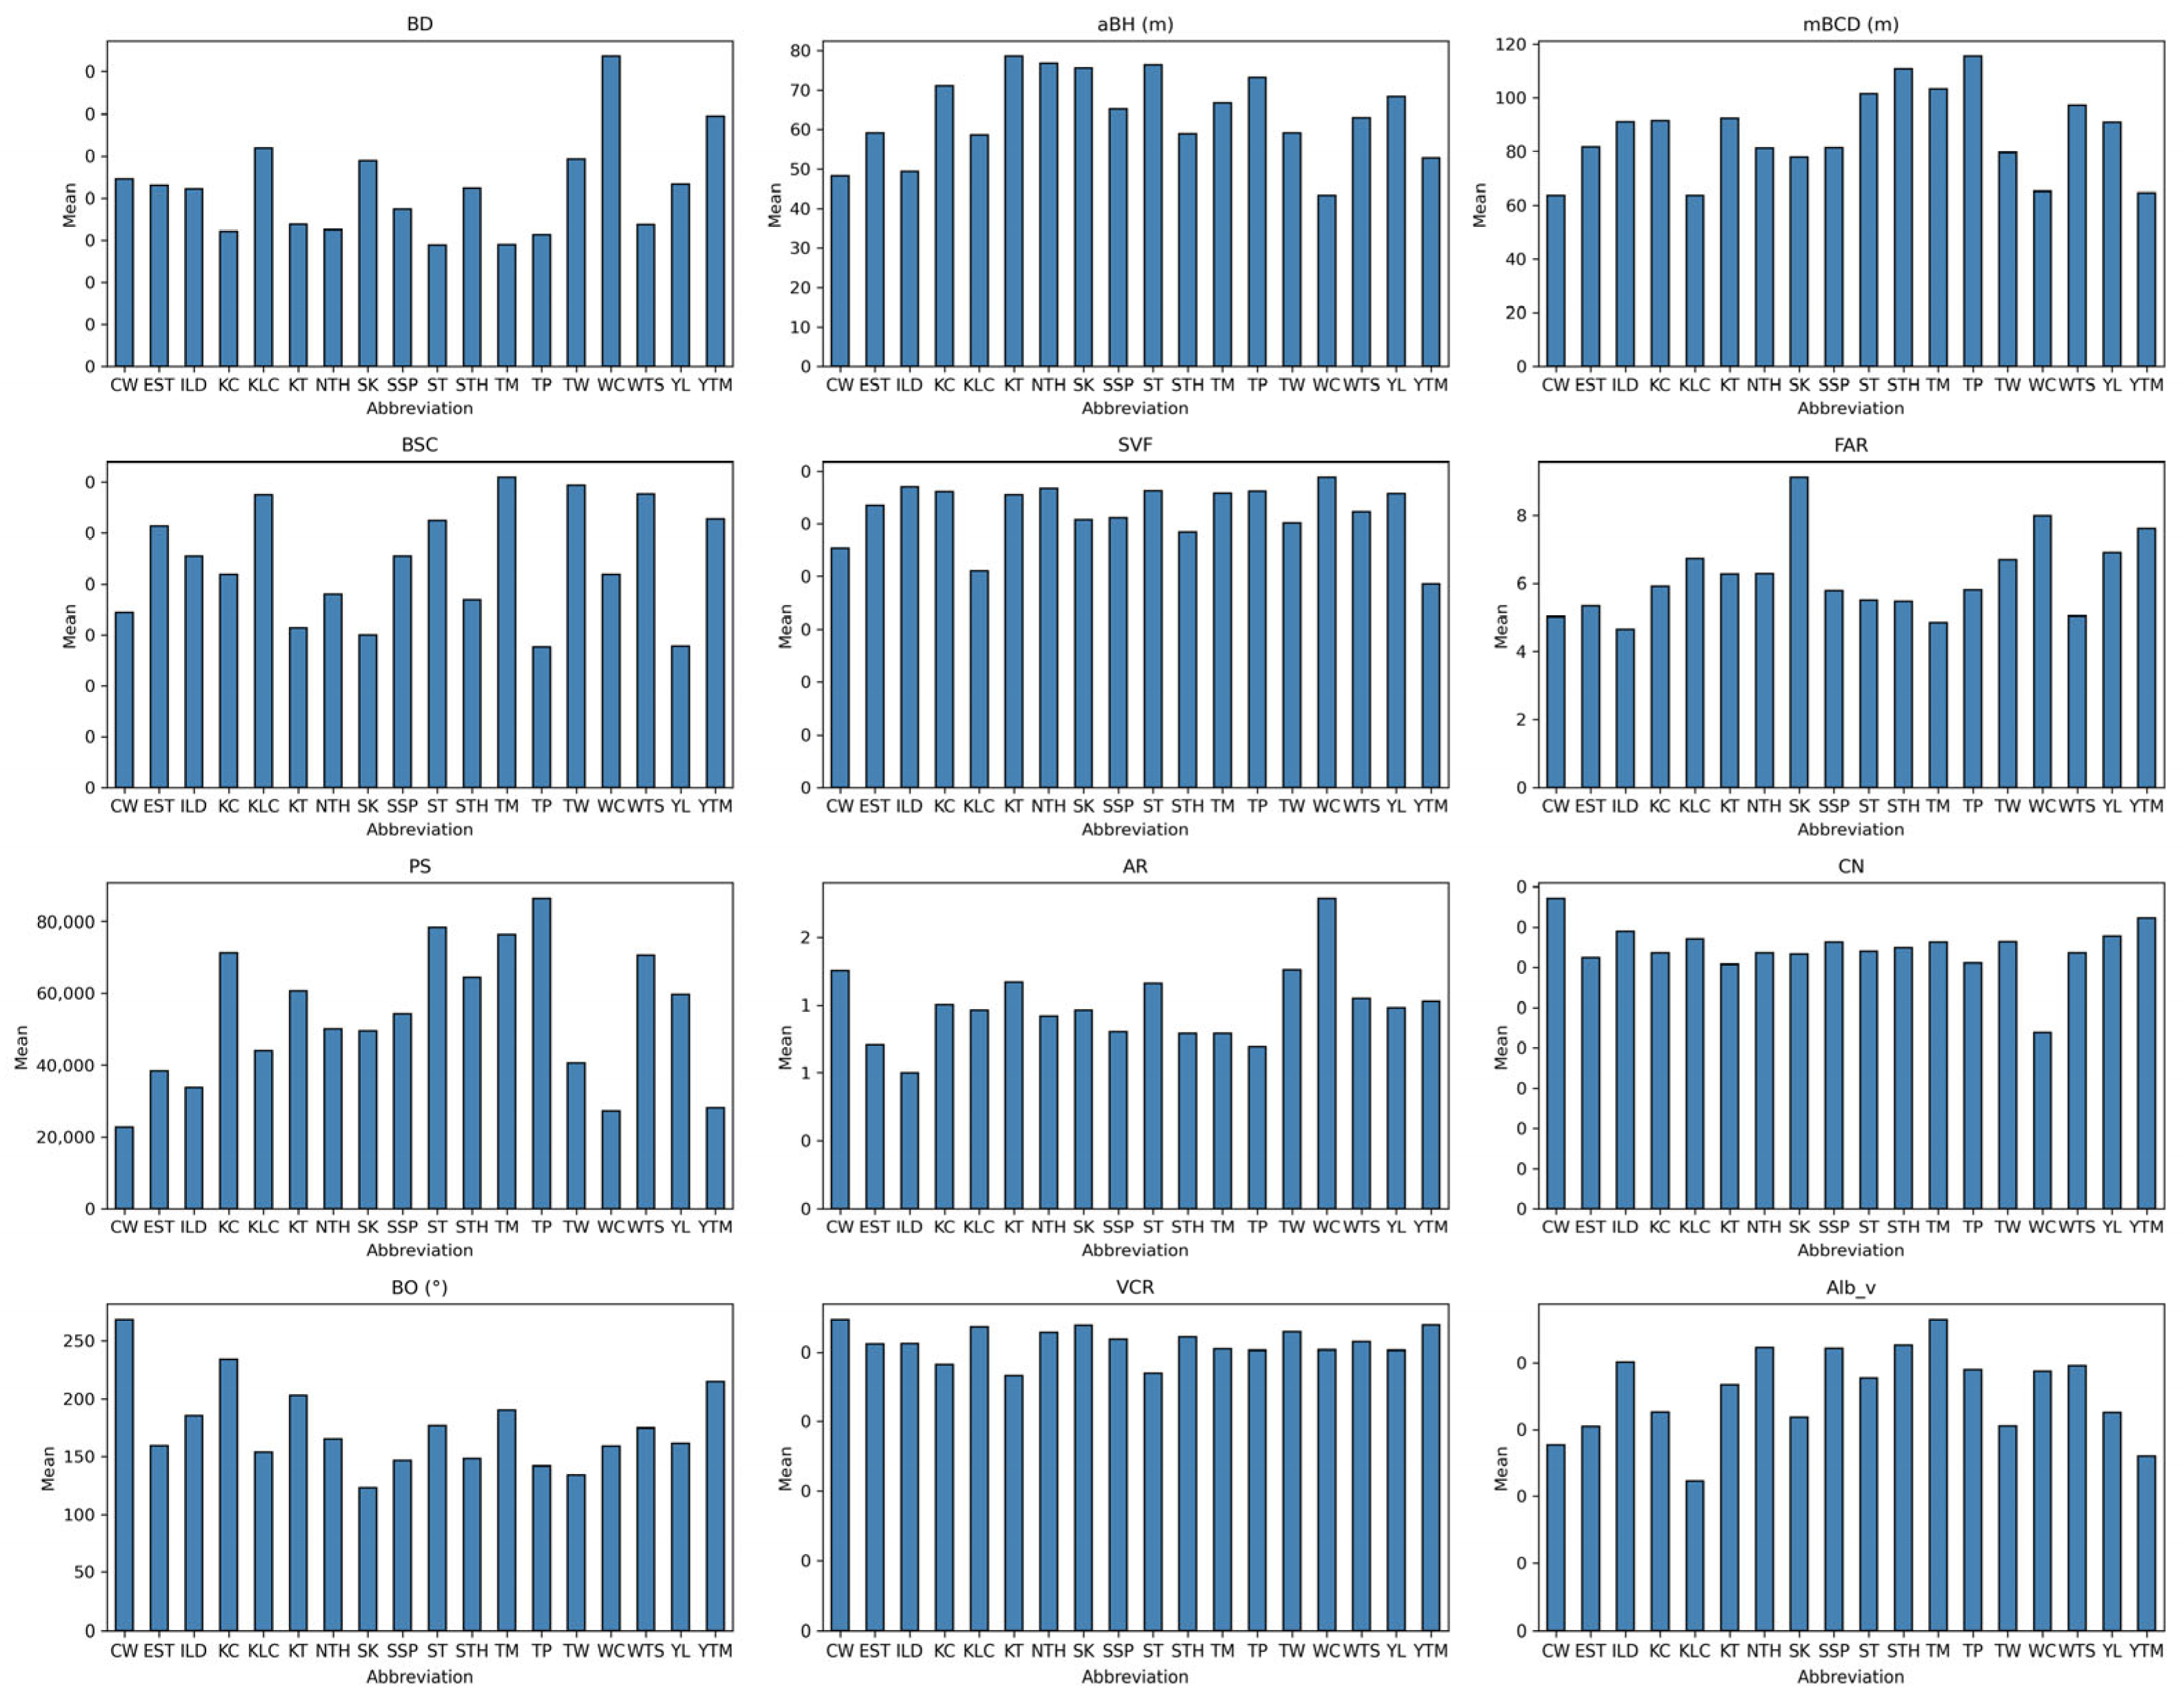
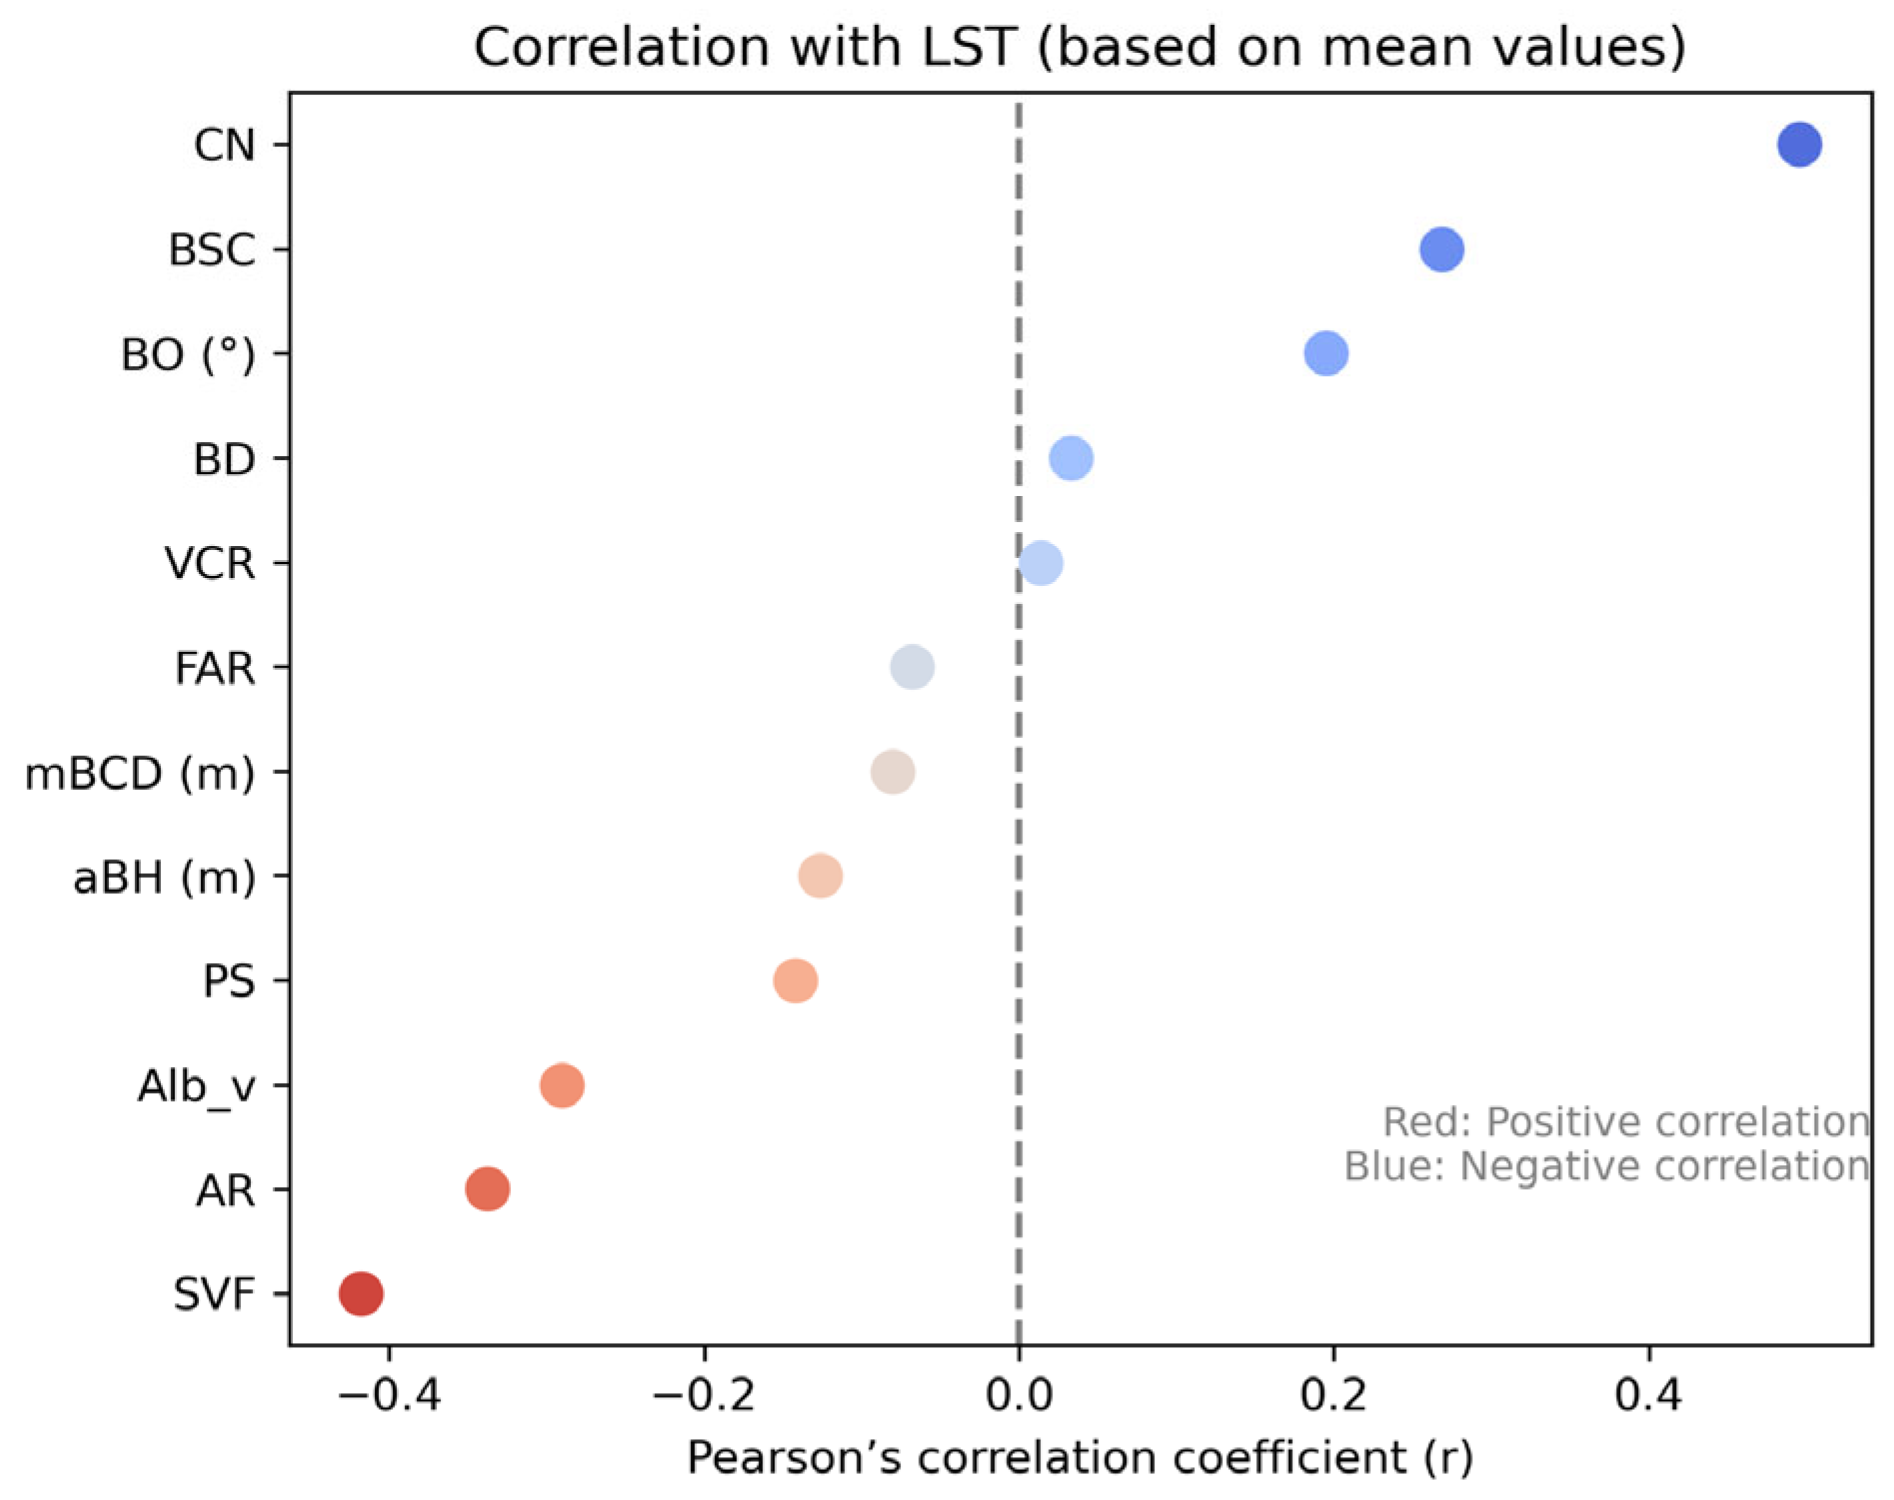
3.2. Regional Variation Analysis
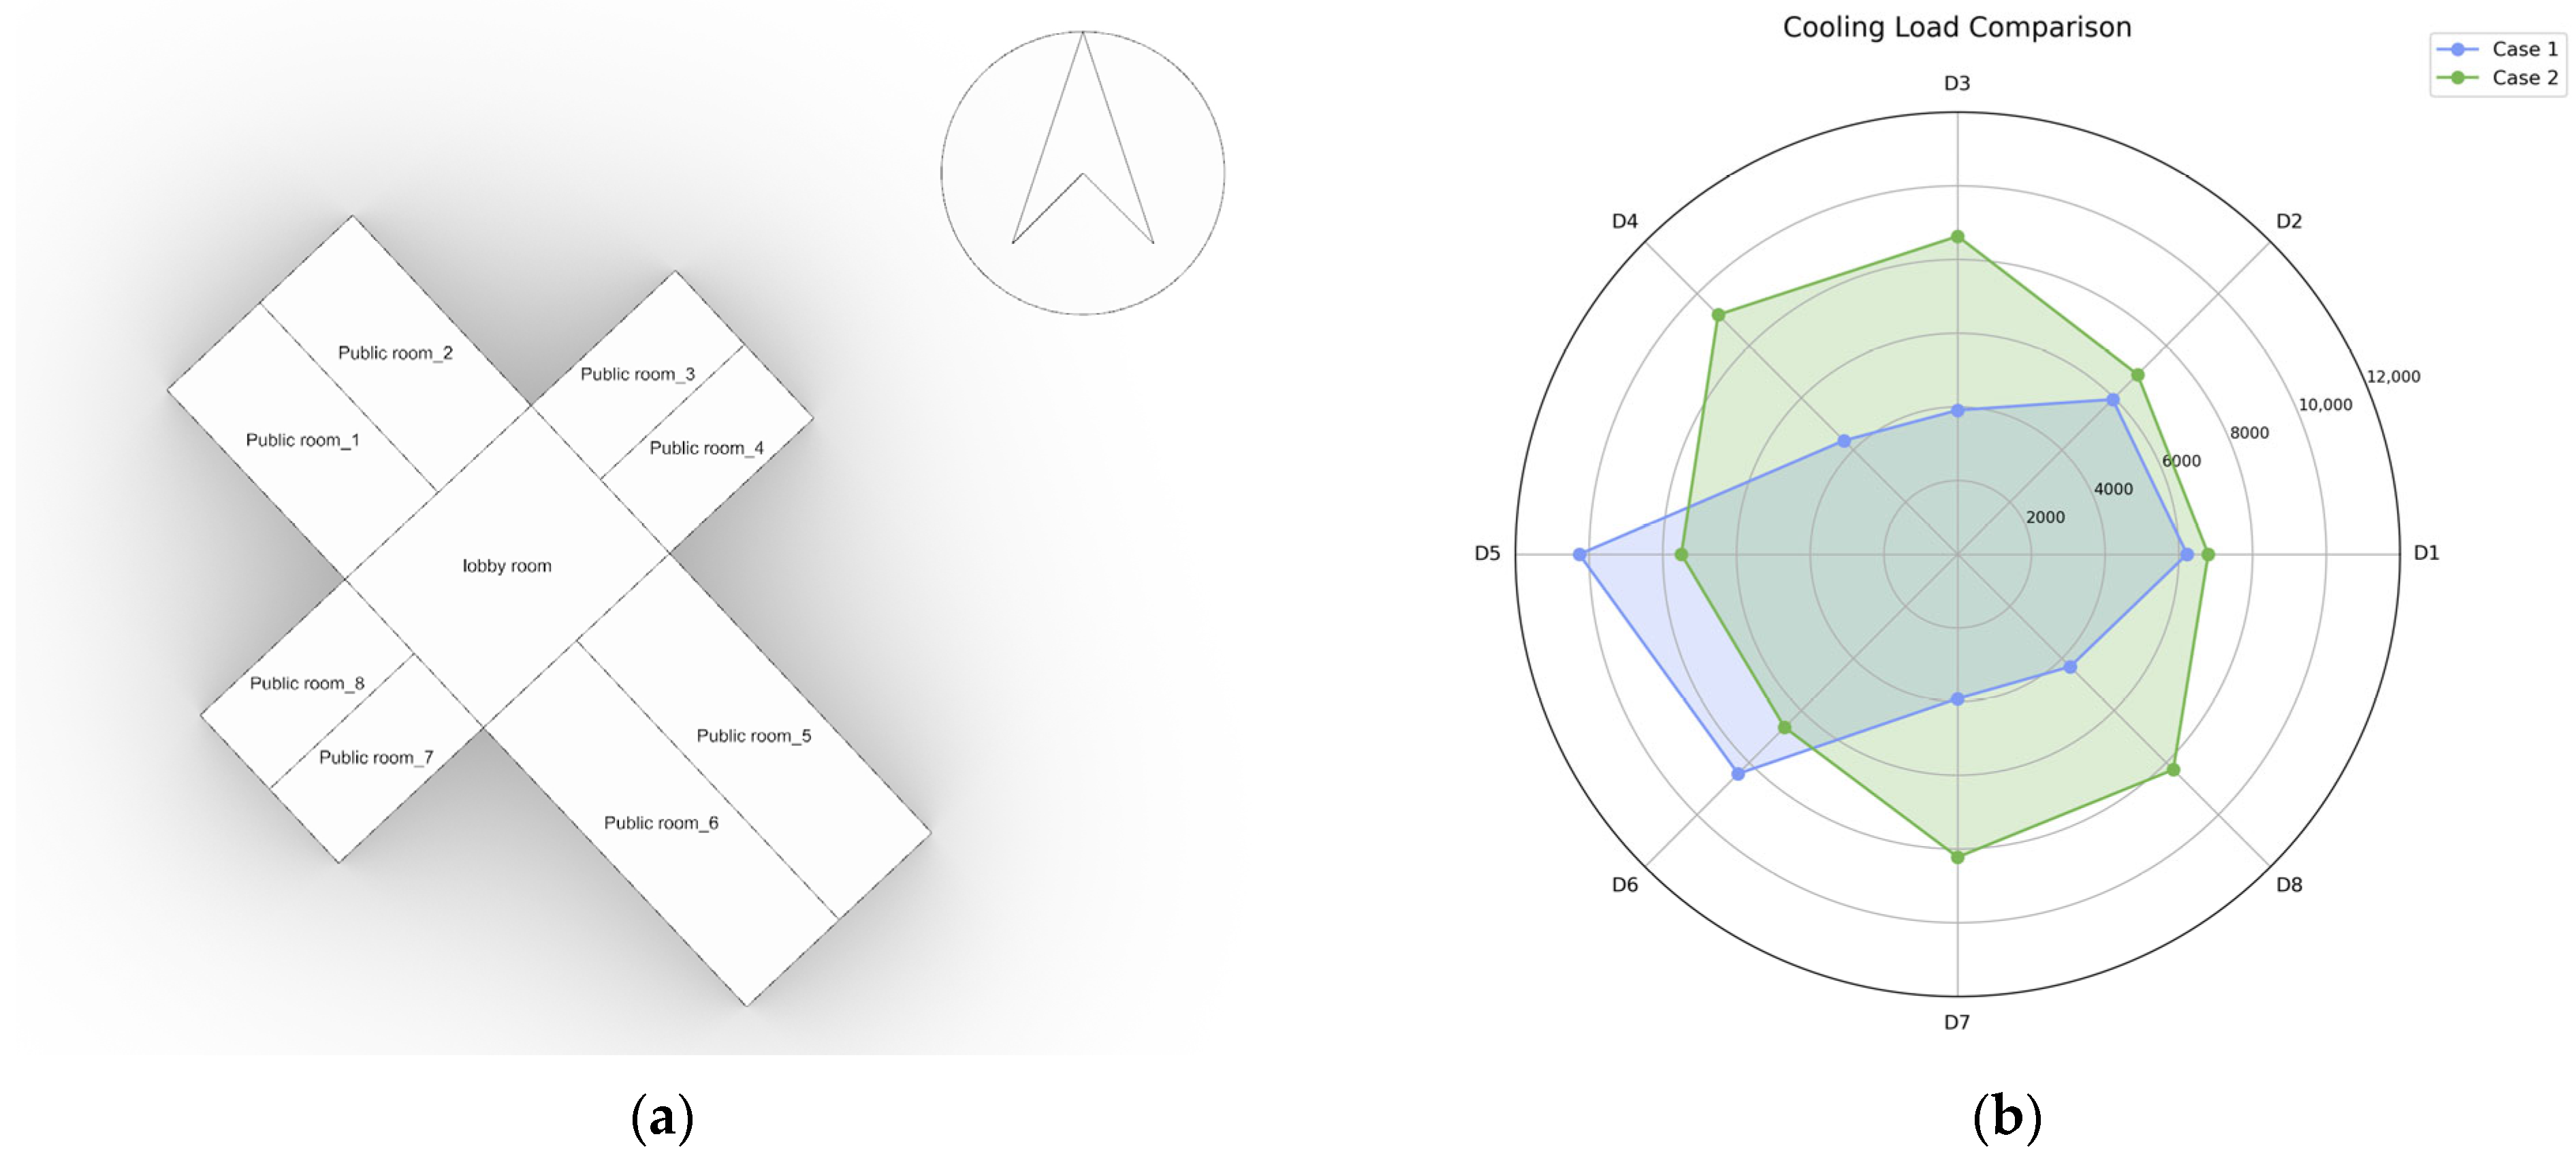
3.3. Typical Urban Block Created
3.4. Urban Energy and Thermal Results
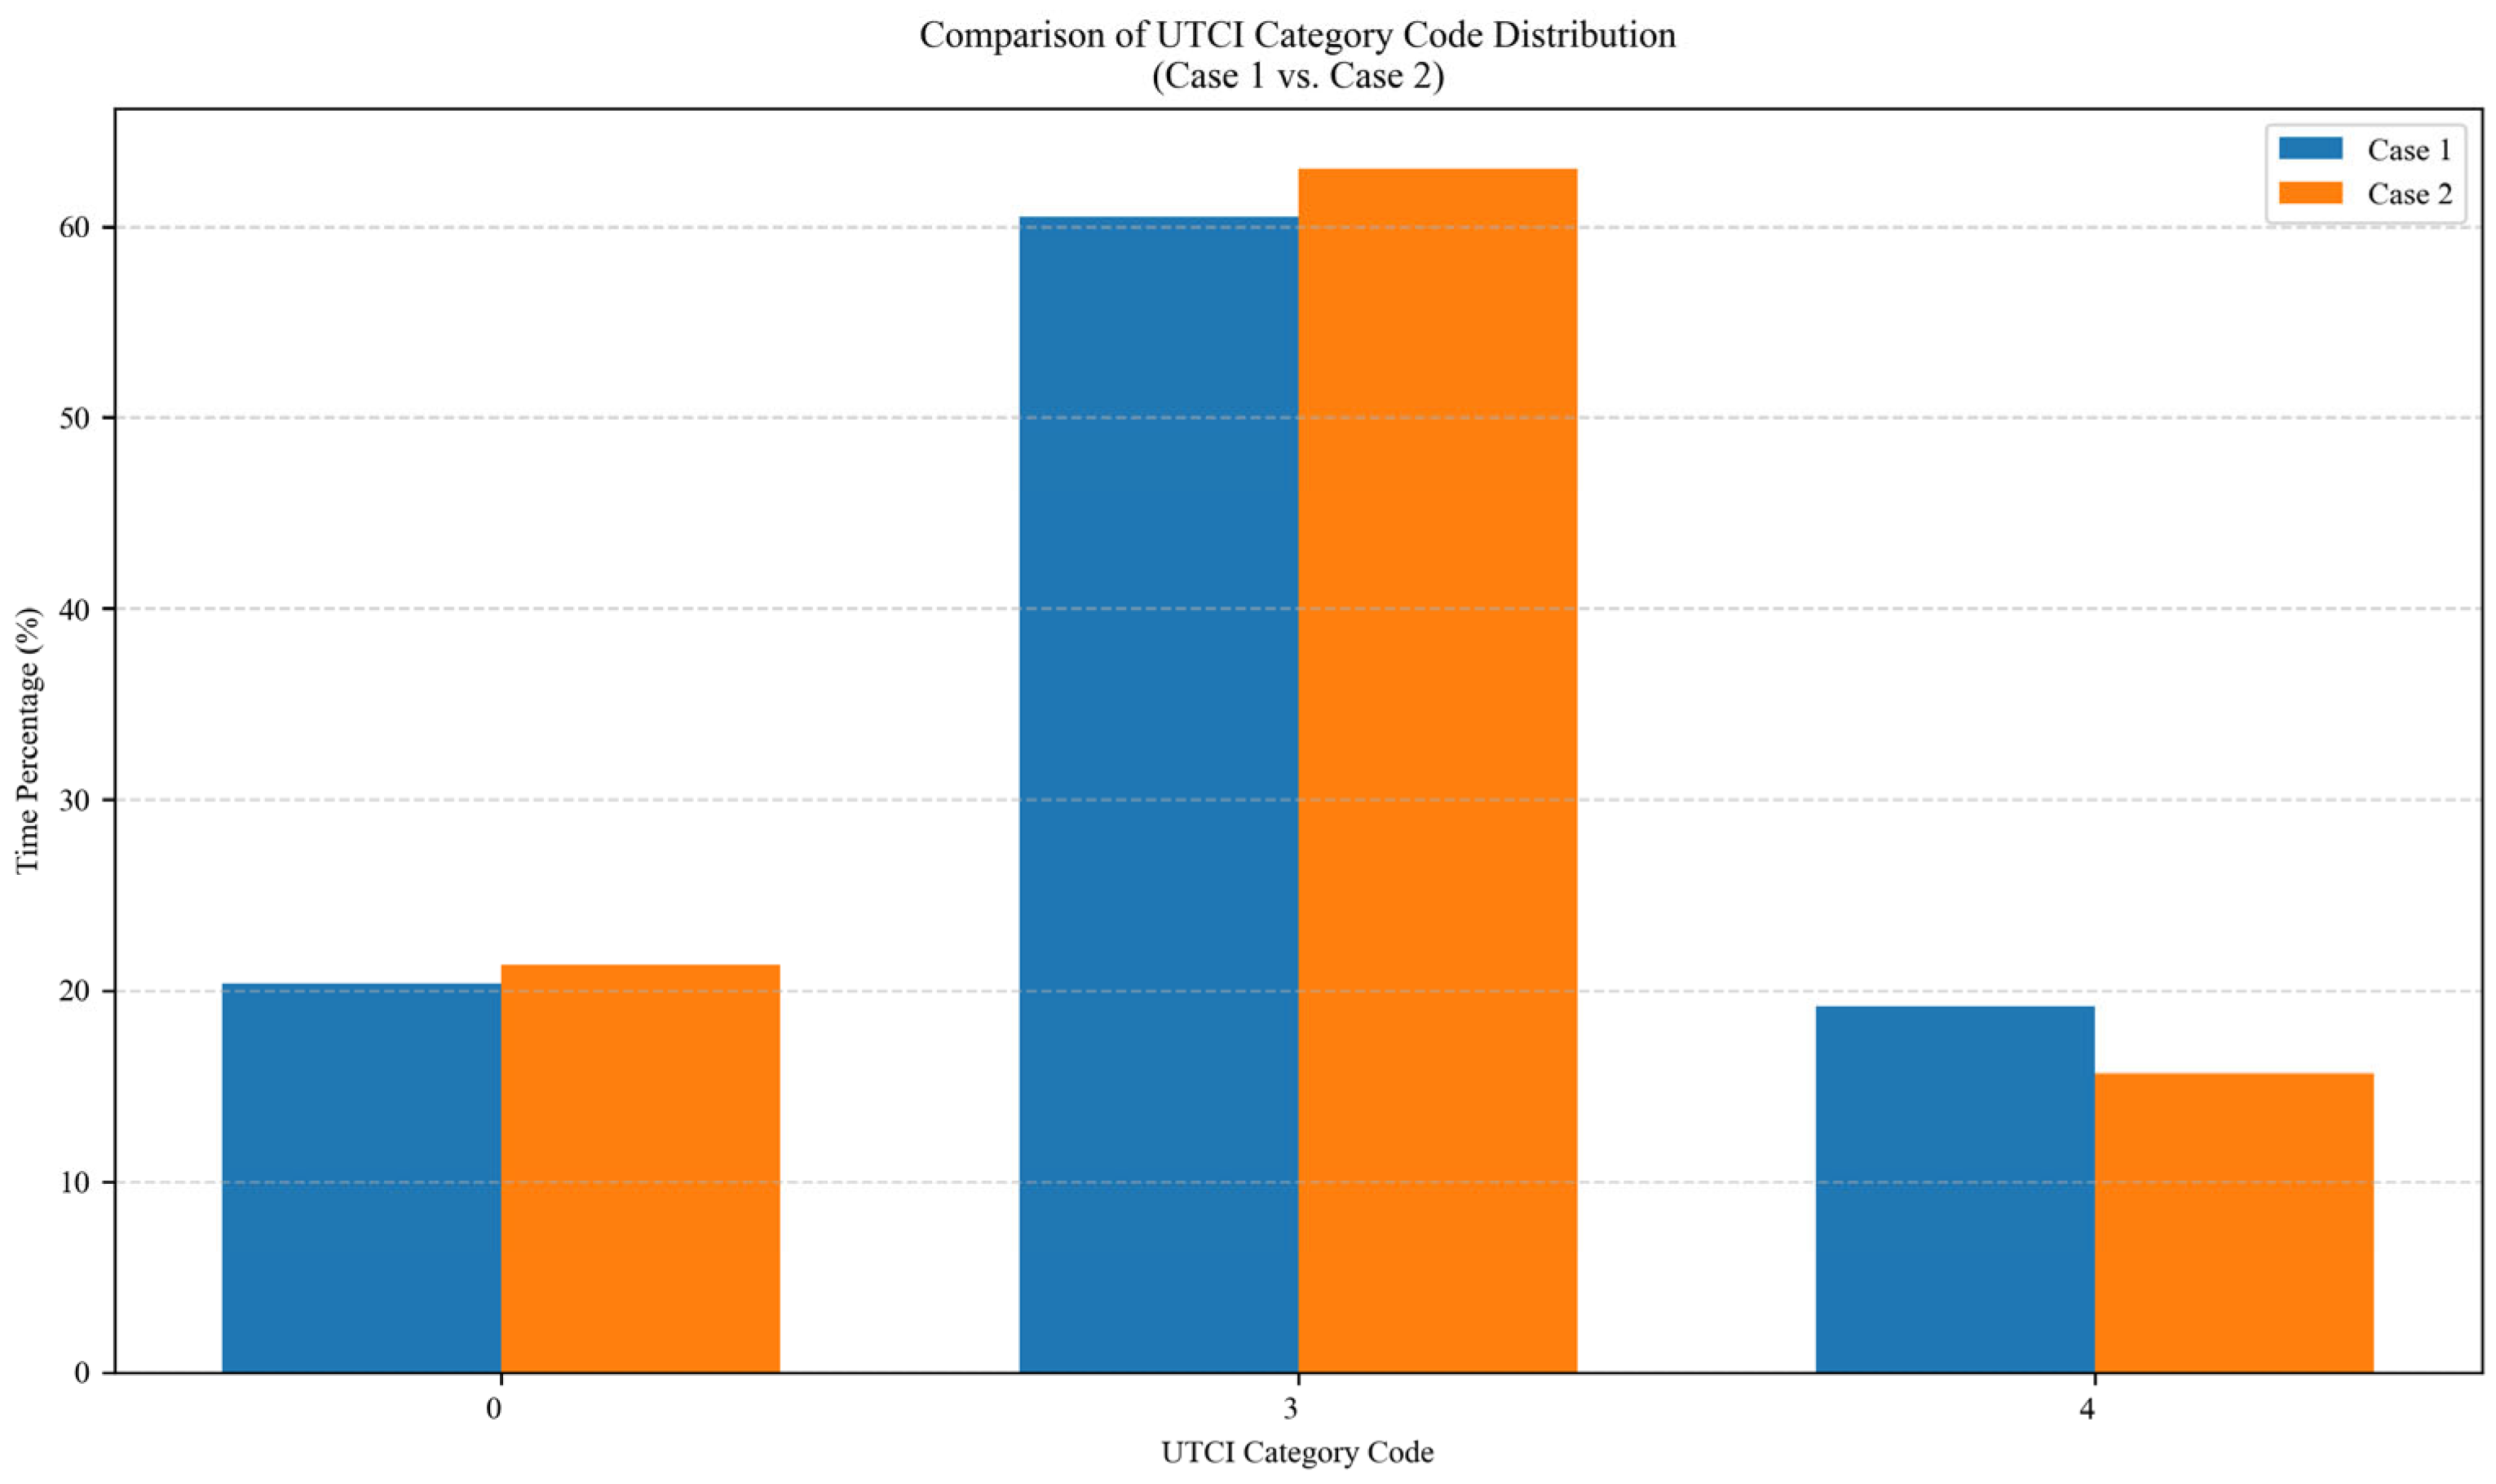
3.4.1. Simulation Results of Universal Thermal Climate Index
3.4.2. Simulation Results of Energy Use Intensity
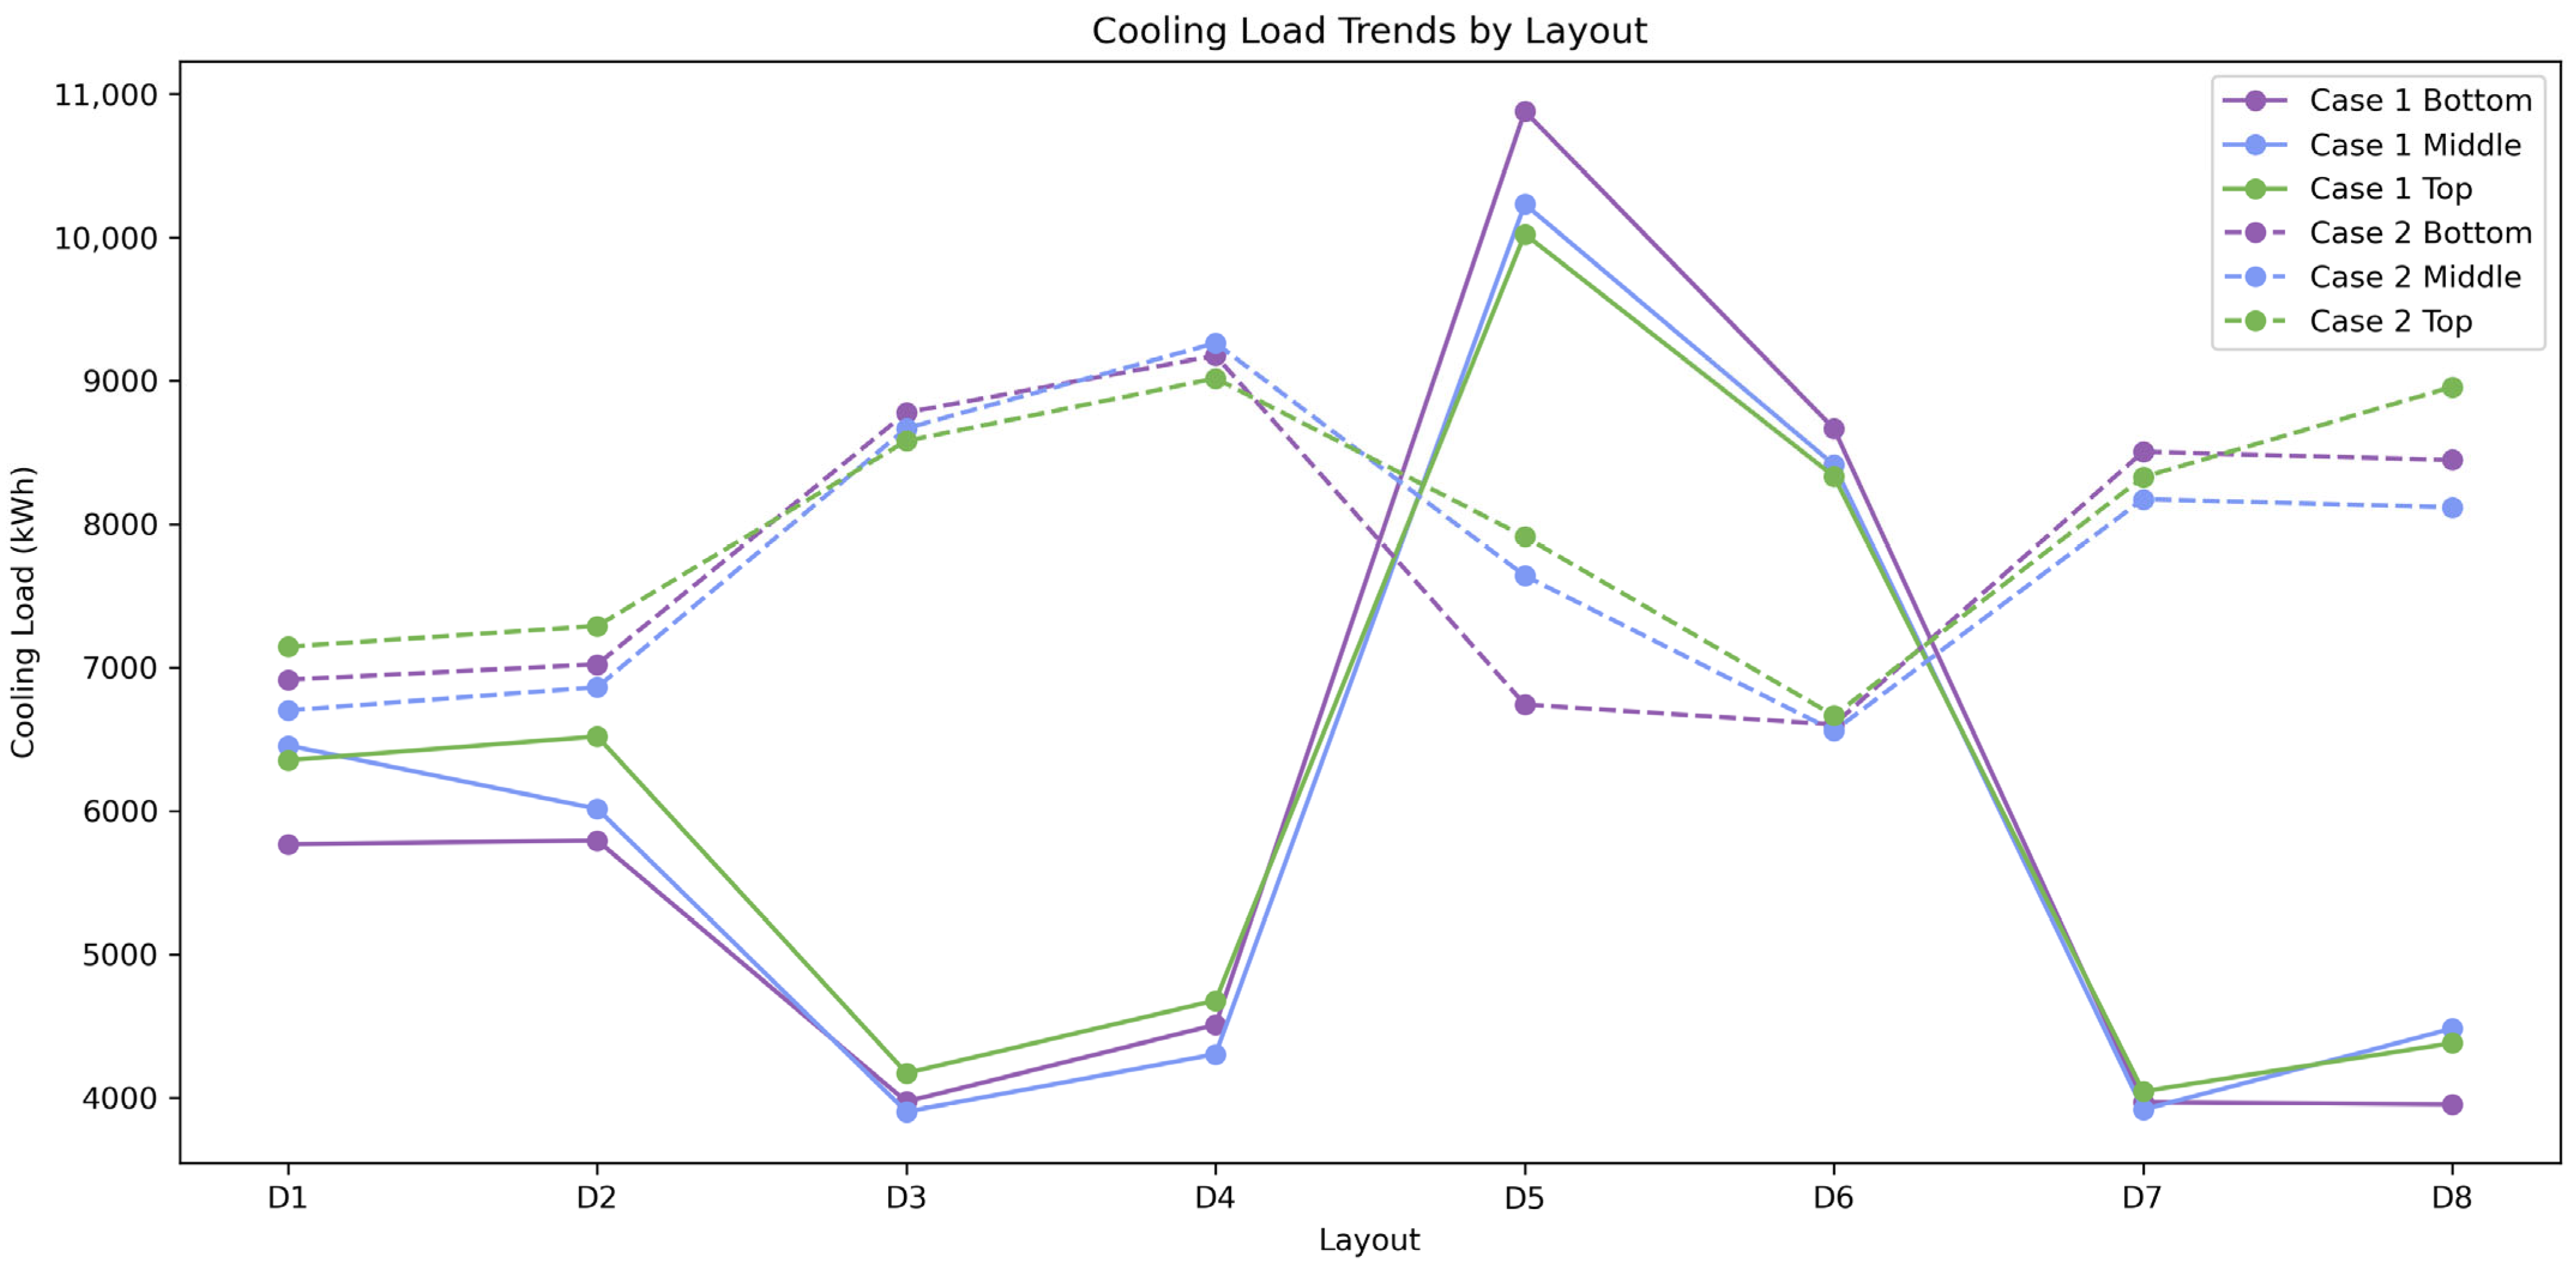
3.4.3. Simulation Results of Detailed Cooling Energy Consumption
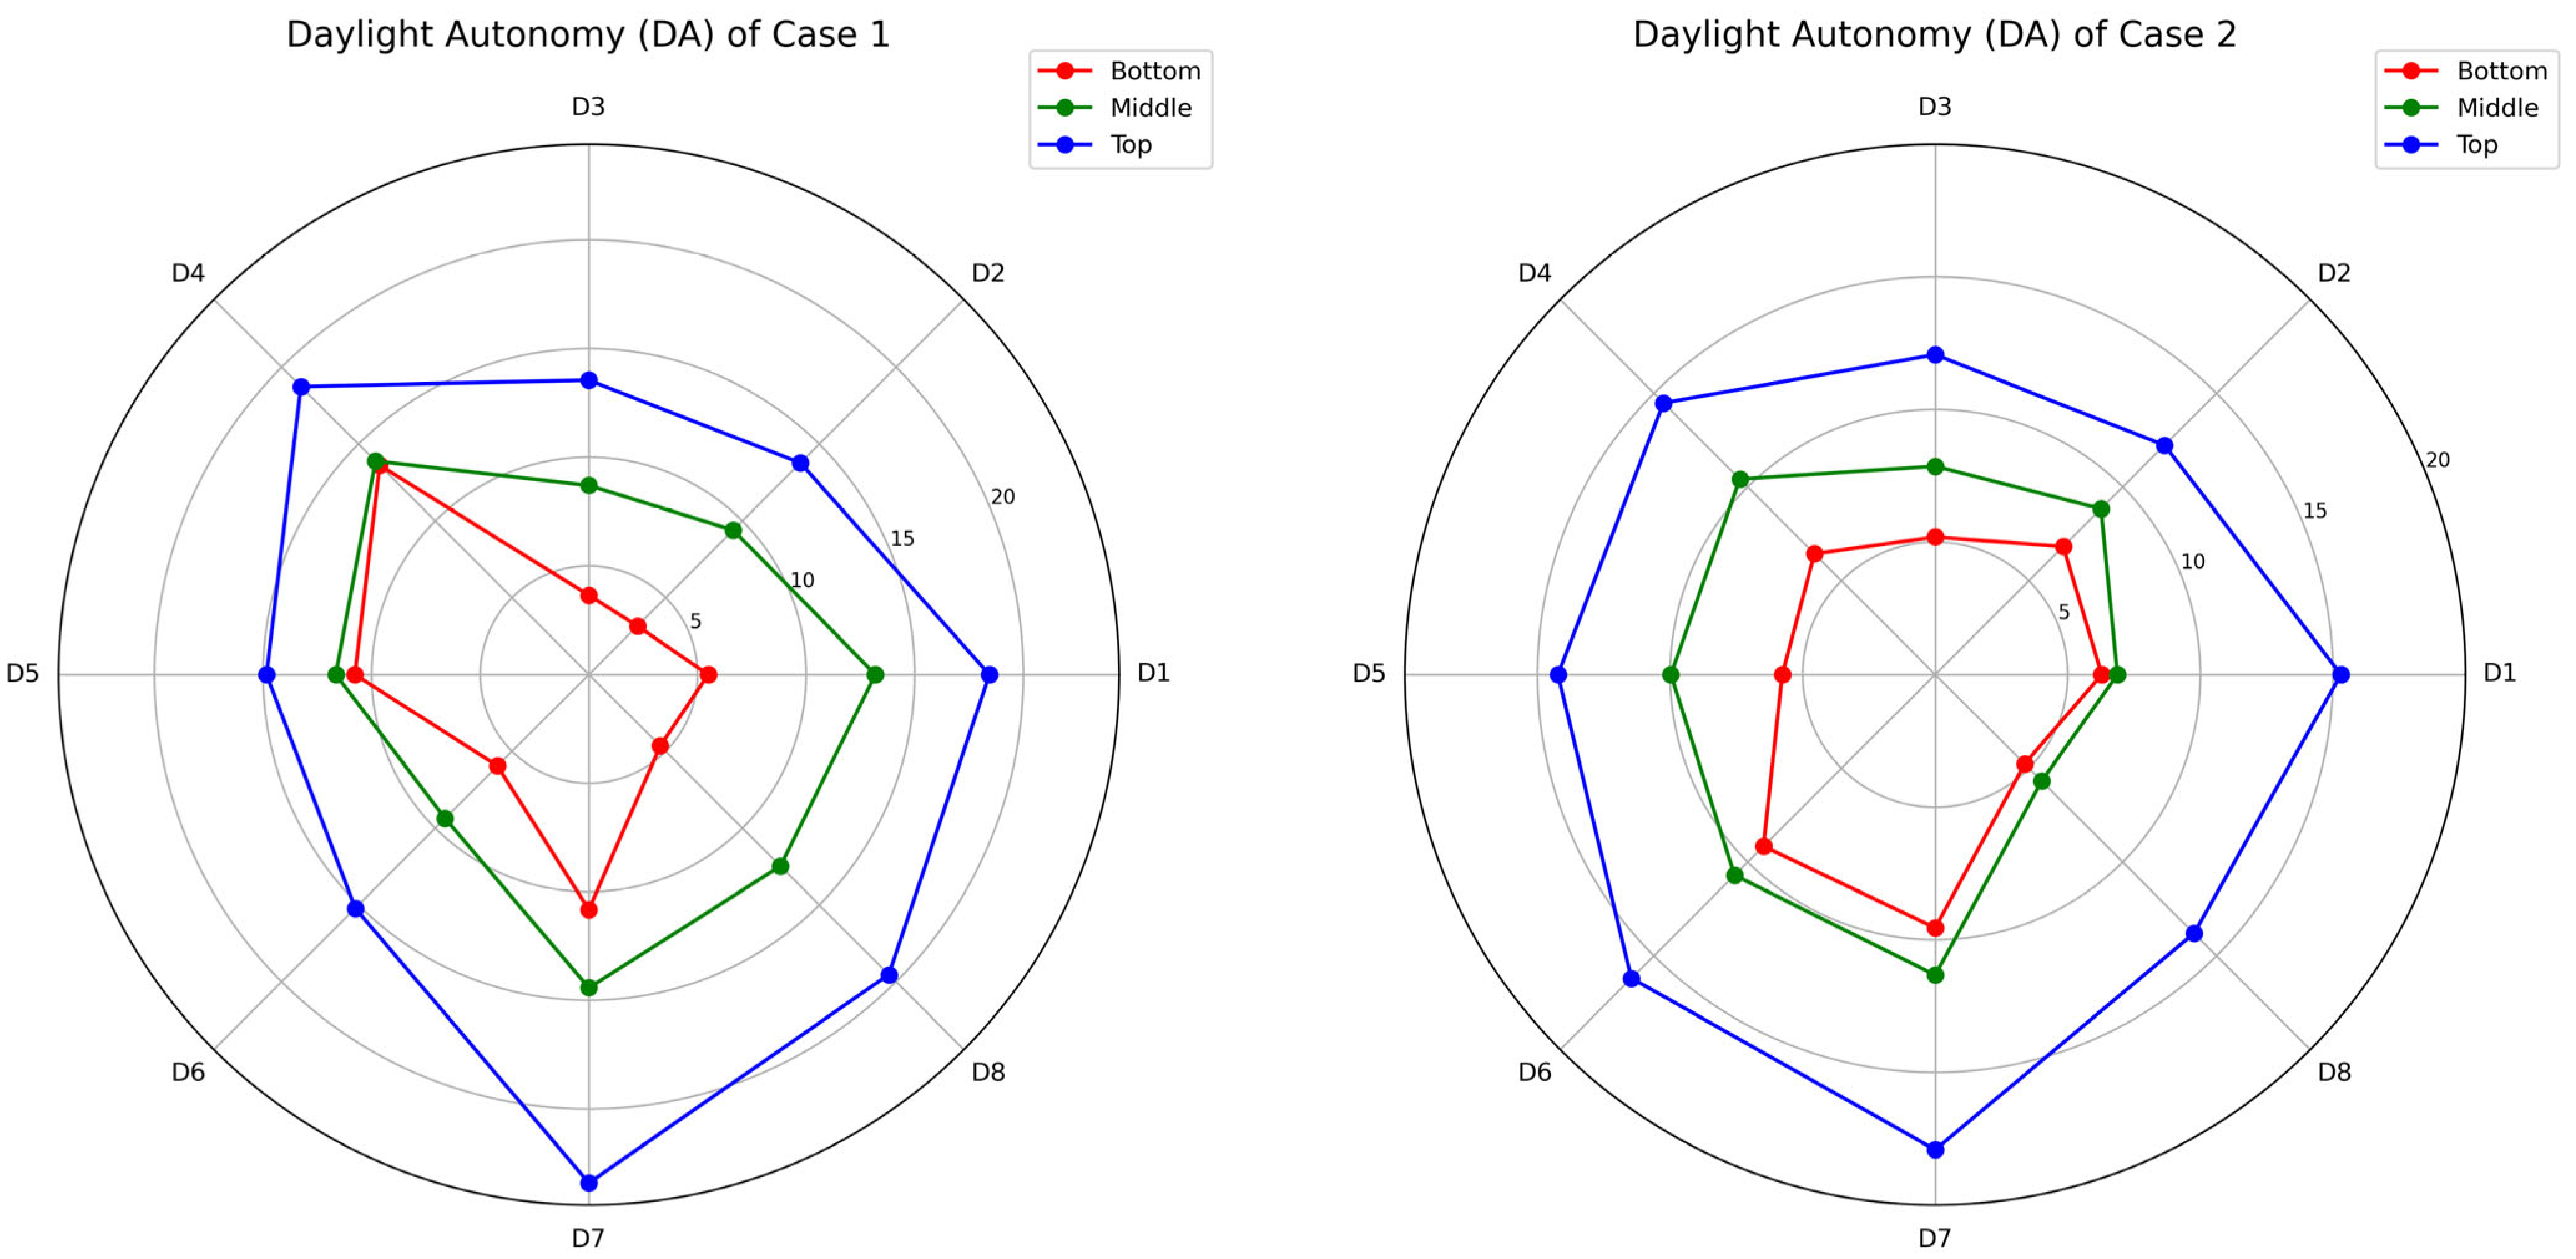
3.4.4. Simulation Results of Daylight Autonomy
4. Conclusions
Author Contributions
Funding
Data Availability Statement
Conflicts of Interest
Abbreviations
| UHII | Urban heat island intensity | BD | Building density |
| EUI | Energy use intensity | aBH | Average building height |
| UTCI | Universal thermal climate index | mBCD | Mean building centroid distance |
| DA | Daylight autonomy | BSC | Building shape coefficient |
| PMV | Predict mean vote | SVF | Sky view factor |
| CSDI | Common spatial data infrastructure | FAR | Floor-area ratio |
| GEE | Google Earth Engine | PS | Plot size |
| CFD | Computational fluid dynamics | AR | Aspect ratio |
| Qc | Cooling energy consumption | CN | Compactness |
| CW | Central and Western | BO | Building orientation |
| WC | Wan Chai | VCR | Vegetation coverage ratio |
| EST | Eastern | Alb | Vegetation albedo |
| STH | Southern | YTM | Yau Tsim Mong |
| WTS | Wong Tai Sin | KT | Kwun Tong |
| SSP | Sham Shui Po | ST | Sha Tin |
| KLC | Kowloon City | TP | Tai Po |
| KT | Kwai Tsing | NTH | North |
| TM | Tuen Mun | SK | Sai Kung |
| YL | Yuen Long | TW | Tsuen Wan |
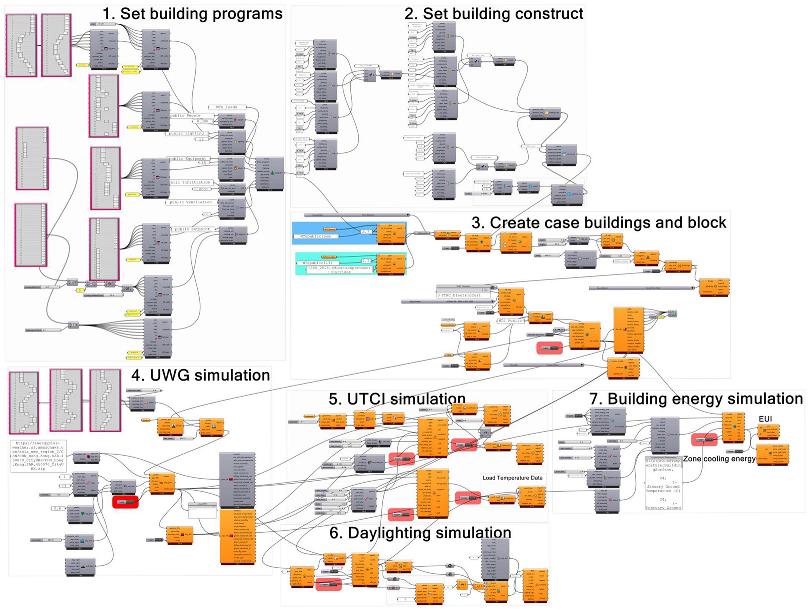
Appendix A. Grasshopper Workflow for the Multi-Indicator Urban Thermal and Energy Simulation
References
- Shang, Y.; Sang, S.; Tiwari, A.K.; Khan, S.; Zhao, X. Impacts of renewable energy on climate risk: A global perspective for energy transition in a climate adaptation framework. Appl. Energy 2024, 362, 122994. [Google Scholar] [CrossRef]
- Li, X.; Lu, W.; Peng, Z.; Zhang, Y.; Huang, J. Generative design of walkable urban cool spots using a novel heuristic GAN×GAN approach. Build. Environ. 2024, 266, 112027. [Google Scholar] [CrossRef]
- Wang, R.; Wang, M. Multi-scale analysis of surface thermal environment in relation to urban form: A case study of the Guangdong-Hong Kong-Macao Greater Bay Area. Sustain. Cities Soc. 2023, 99, 104953. [Google Scholar] [CrossRef]
- IEA. World Energy Outlook 2023—Analysis. Available online: https://www.iea.org/reports/world-energy-outlook-2023 (accessed on 12 December 2023).
- Deng, X.; Cao, Q.; Wang, L.; Wang, W.; Wang, S.; Wang, S.; Wang, L. Characterizing urban densification and quantifying its effects on urban thermal environments and human thermal comfort. Landsc. Urban Plan. 2023, 237, 104803. [Google Scholar] [CrossRef]
- Wang, J.; Wei, M.; Ruan, X. Characterization of the acceptable daylight quality in typical residential buildings in Hong Kong. Build. Environ. 2020, 182, 107094. [Google Scholar] [CrossRef]
- Ibrahim, Y.; Kershaw, T.; Shepherd, P.; Elkady, H. Multi-objective optimisation of urban courtyard blocks in hot arid zones. Sol. Energy 2022, 240, 104–120. [Google Scholar] [CrossRef]
- Evola, G.; Costanzo, V.; Magrì, C.; Margani, G.; Marletta, L.; Naboni, E. A novel comprehensive workflow for modelling outdoor thermal comfort and energy demand in urban canyons: Results and critical issues. Energy Build. 2020, 216, 109946. [Google Scholar] [CrossRef]
- Nicholson, S.; Nikolopoulou, M.; Watkins, R.; Löve, M.; Ratti, C. Data driven design for urban street shading: Validation and application of ladybug tools as a design tool for outdoor thermal comfort. Urban Clim. 2024, 56, 102041. [Google Scholar] [CrossRef]
- Zhang, Z.; Paschalis, A.; Mijic, A.; Meili, N.; Manoli, G.; van Reeuwijk, M.; Fatichi, S. A mechanistic assessment of urban heat island intensities and drivers across climates. Urban Clim. 2022, 44, 101215. [Google Scholar] [CrossRef]
- Zhang, L.; Cao, M.; Li, N.; Luo, L.; Chen, Y.; Li, Z. Machine learning prediction of heating and cooling loads based on Athenian residential buildings’ simulation dataset. Energy Build. 2025, 342, 115808. [Google Scholar] [CrossRef]
- Tootkaboni, M.P.; Ballarini, I.; Corrado, V. Towards climate resilient and energy-efficient buildings: A sensitivity analysis on building components and cooling strategies. Build. Environ. 2025, 270, 112473. [Google Scholar] [CrossRef]
- Aloshan, M.; Aldali, K. Empirical study of facade retrofits for optimizing energy efficiency and cooling in school buildings in Saudi Arabia. Energy Rep. 2024, 12, 4105–4128. [Google Scholar] [CrossRef]
- Errebai, F.B.; Strebel, D.; Carmeliet, J.; Derome, D. Impact of urban heat island on cooling energy demand for residential building in Montreal using meteorological simulations and weather station observations. Energy Build. 2022, 273, 112410. [Google Scholar] [CrossRef]
- Jia, L.-R.; Li, Q.-Y.; Chen, X.; Lee, C.-C.; Han, J. Indoor thermal and ventilation indicator on university students’ overall comfort. Buildings 2022, 12, 1921. [Google Scholar] [CrossRef]
- Mirzabeigi, S.; Razkenari, M. Design optimization of urban typologies: A framework for evaluating building energy performance and outdoor thermal comfort. Sustain. Cities Soc. 2022, 76, 103515. [Google Scholar] [CrossRef]
- De Luca, F.; Naboni, E.; Lobaccaro, G. Tall buildings cluster form rationalization in a Nordic climate by factoring in indoor-outdoor comfort and energy. Energy Build. 2021, 238, 110831. [Google Scholar] [CrossRef]
- Sun, R.; Liu, J.; Lai, D.; Liu, W. Building form and outdoor thermal comfort: Inverse design the microclimate of outdoor space for a kindergarten. Energy Build. 2023, 284, 112824. [Google Scholar] [CrossRef]
- Xu, X.; Liu, W.; Lian, Z. Dynamic indoor comfort temperature settings based on the variation in clothing insulation and its energy-saving potential for an air-conditioning system. Energy Build. 2020, 220, 110086. [Google Scholar] [CrossRef]
- Pompei, L.; Nardecchia, F.; Gugliermetti, L.; Cinquepalmi, F. Design of three outdoor combined thermal comfort prediction models based on urban and environmental parameters. Energy Build. 2024, 306, 113946. [Google Scholar] [CrossRef]
- Wang, M.; Lu, H.; Chen, B.; Sun, W.; Yang, G. Fine-Scale Analysis of the Long-Term Urban Thermal Environment in Shanghai Using Google Earth Engine. Remote Sens. 2023, 15, 3732. [Google Scholar] [CrossRef]
- Fong, K.F.; Lee, C.K.; Lau, K.K.-L.; Ng, E.Y.Y. Cooling energy resilience of high-rise residential buildings under climate change in Hong Kong. J. Build. Eng. 2025, 101, 111888. [Google Scholar] [CrossRef]
- Dai, H.K.; Shi, Y.; Chen, C. Developing a deep neural network model for predicting ventilation rates in public housing buildings in Hong Kong. Energy Build. 2024, 307, 113993. [Google Scholar] [CrossRef]
- Hong Kong Housing Authority and Housing Department. Standard Block Typical Floor Plans. Available online: https://www.housingauthority.gov.hk/en/global-elements/estate-locator/standard-block-typical-floor-plans/index.html (accessed on 11 December 2024).
- Liu, S.; Kwok, Y.T.; Lau, K.K.-L.; Tong, H.W.; Chan, P.W.; Ng, E. Development and application of future design weather data for evaluating the building thermal-energy performance in subtropical Hong Kong. Energy Build. 2020, 209, 109696. [Google Scholar] [CrossRef]
- Wikipedia. List of Public Housing Estates in Hong Kong. Available online: https://en.wikipedia.org/wiki/List_of_public_housing_estates_in_Hong_Kong (accessed on 5 November 2024).
- Takebayashi, H. Effects of air temperature, humidity, and wind velocity distribution on indoor cooling load and outdoor human thermal environment at urban scale. Energy Build. 2022, 257, 111792. [Google Scholar] [CrossRef]
- Apritasari, Y.D.; Indraprastha, A.; Wonorahardjo, S. The role of building mass configuration and material selection for mitigating the intensity of the urban heat island. Energy Build. 2024, 323, 114822. [Google Scholar] [CrossRef]
- Google Earth Engine. Landsat Algorithms. Available online: https://developers.google.com/earth-engine/guides/landsat (accessed on 11 December 2024).
- U.S. Geological Survey. Landsat 8-9 OLI/TIRS Collection 2 Level 1 Data Format Control Book. Available online: https://www.usgs.gov/media/files/landsat-8-9-olitirs-collection-2-level-1-data-format-control-book (accessed on 24 April 2025).
- Common Spatial Data Infrastructure (CSDI) Portal for Government. Available online: https://portal.csdi.gov.hk/csdi-webpage/ (accessed on 11 December 2024).
- Bian, C.; Cheung, K.L.; Chen, X.; Lee, C.C. Integrating microclimate modelling with building energy simulation and solar photovoltaic potential estimation: The parametric analysis and optimization of urban design. Appl. Energy 2025, 380, 125062. [Google Scholar] [CrossRef]
- Liu, S.; Kwok, Y.-T.; Lau, K.; Ng, E. Applicability of different extreme weather datasets for assessing indoor overheating risks of residential buildings in a subtropical high-density city. Build. Environ. 2021, 194, 107711. [Google Scholar] [CrossRef]
- Kwok, Y.T.; De Munck, C.; Schoetter, R.; Ren, C.; Lau, K.K.-L. Refined dataset to describe the complex urban environment of Hong Kong for urban climate modelling studies at the mesoscale. Theor Appl Clim. 2020, 142, 129–150. [Google Scholar] [CrossRef]
- Ma, Y.X.; Yu, A.C. Impact of urban heat island on high-rise residential building cooling energy demand in Hong Kong. Energy Build. 2024, 311, 114127. [Google Scholar] [CrossRef]
- Chen, X.; Yang, H. Combined thermal and daylight analysis of a typical public rental housing development to fulfil green building guidance in Hong Kong. Energy Build. 2015, 108, 420–432. [Google Scholar] [CrossRef]
- Gao, K.; Fong, K.F.; Lee, C.K.; Lau, K.K.-L.; Ng, E. Balancing thermal comfort and energy efficiency in high-rise public housing in Hong Kong: Insights and recommendations. J. Clean. Prod. 2024, 437, 140741. [Google Scholar] [CrossRef]
- Zhu, R.; Wong, M.S.; Guilbert, É.; Chan, P.-W. Understanding heat patterns produced by vehicular flows in urban areas. Sci. Rep. 2017, 7, 16309. Available online: https://www.nature.com/articles/s41598-017-15869-6 (accessed on 2 May 2025). [CrossRef]
- Chen, X.; Yang, J.; Zhu, R.; Wong, M.S.; Ren, C. Spatiotemporal impact of vehicle heat on urban thermal environment: A case study in Hong Kong. Build. Environ. 2021, 205, 108224. [Google Scholar] [CrossRef]
- ScienceDirect. Spatio-Temporal Analysis of Urban Heat Island (UHI) and Its Effect on Urban Ecology: The Case of Mekelle City, Northern Ethiopia. Available online: https://www-sciencedirect-com.ezproxy.lib.hkmu.edu.hk/science/article/pii/S2405844023003055 (accessed on 2 May 2025).
- ScienceDirect. Willingness to Pay for Well-Being Housing Attributes Driven by Design Layout: Evidence from Hong Kong. Available online: https://www-sciencedirect-com.ezproxy.lib.hkmu.edu.hk/science/article/pii/S0360132324000696 (accessed on 2 May 2025).
- Zhang, D.; Liu, C.; Wu, J.; Wang, H. A satellite-based approach for thermal comfort simulation: A case study in the GBA. Urban Clim. 2024, 53, 101776. [Google Scholar] [CrossRef]
- Ibrahim, A.; Alsukkar, M.; Dong, Y.; Saleem, F.; Hamza, A.; Hu, P.; Hu, M. Enhancing energy efficiency in shipping container house: A novel approach using hybrid louver systems. Energy Built Environ. 2024, in press. [Google Scholar] [CrossRef]
- Siu, L.W.; Hart, M.A. Quantifying urban heat island intensity in Hong Kong SAR, China. Environ. Monit. Assess. 2013, 185, 4383–4398. [Google Scholar] [CrossRef]
- Xu, X.; Wu, Y.; Lin, G.; Gong, J.; Chen, K. Exploring diurnal and seasonal variabilities in surface urban heat island intensity in the Guangdong-Hong Kong-Macao Greater Bay Area. J. Geogr. Sci. 2024, 34, 1472–1492. [Google Scholar] [CrossRef]
- Chakraborty, T.; Hsu, A.; Manya, D.; Sheriff, G. A spatially explicit surface urban heat island database for the United States: Characterization, uncertainties, and possible applications. ISPRS J. Photogramm. Remote Sens. 2020, 168, 74–88. [Google Scholar] [CrossRef]
- Yee, M.; Kaplan, J.O. Drivers of urban heat in Hong Kong over the past 116 years. Urban Clim. 2022, 46, 101308. [Google Scholar] [CrossRef]


| Author(s) and Year | Methodology | Indicators | Key Findings | Limitations |
|---|---|---|---|---|
| De Luca et al. (2021) [17] | CFD + EnergyPlus simulation of Nordic high-rise clusters | Indoor cooling load, outdoor UTCI | Layout variations significantly affected both indoor and outdoor comfort | Limited integration of radiative or seasonal thermal variations |
| Sun et al. (2023) [18] | Genetic algorithm inverse design of school courtyard forms | UTCI, solar radiation, height/coverage | An optimized building layout reduced UTCI by 1.2–1.6 °C | Focused on summer performance at individual building scale; limited generalizability |
| Xu et al. (2020) [19] | Adaptive HVAC setpoints using dynamic clothing insulation models | Indoor comfort temperature, HVAC energy | Adaptive control strategies reduced energy use by up to 65.5% | Focused only on indoor comfort; the outdoor thermal impact was not considered |
| Pompei et al. (2024) [20] | ML-based UTCI prediction using RF, GBDT, and SVR | Air temp, humidity, SVF, PET, UTCI | Built density and vegetation were key variables | Lacked integration with indoor metrics or energy demand outcomes |
| Wang et al. (2023) [21] | Landsat LST time series via GEE | LST, UHI pattern, NDVI/NDBI/NDWI | UHI expanded over 20 years; imperviousness and vegetation were key factors | Daytime only; lacked indoor metrics |
| Component | Indicators | Values |
|---|---|---|
| Window [33] | Window-to-wall ratio (WWR) | 0.22 |
| Solar heat gain coefficient (SHGC) | 0.32 | |
| U-value | 5.75 W/m2·K | |
| Transmittance | 0.8 | |
| Material [34,35] | Exterior walls: reinforced concrete, gypsum, and light-colored mosaic tiles Roofs: reinforced concrete, gypsum, polystyrene insulation, and light-colored mosaic tiles Floors: concrete slabs Shading: 1 m overhangs with a tilt angle of 65° | |
| Infiltration | 0.0001 m3/s·m2 | |
| Schedule [36] | Occupancy, lighting, equipment, ventilation, cooling | |
| Load [37] | Occupant density | 0.088 people/m2 |
| Lighting power density | 5 W/m2 | |
| Equipment power density | 8 W/m2 | |
| Ventilation air exchange rates | 0.65 | |
| HVAC [38] | Cooling temperature | 25 °C |
| Type | packaged terminal air conditioner (PTAC) | |
| Urban microclimate | Vehicle heat emissions [27,39] | 8 W/m2 |
| Vegetation albedo [34] | 0.6 | |
| District | BD | aBH (m) | mBCD (m) | BSC | SVF | FAR | PS (m2) | AR | CN | BO (°) | VCR | Alb |
|---|---|---|---|---|---|---|---|---|---|---|---|---|
| CW | 0.44 | 48.23 | 63.68 | 0.344 | 0.45 | 7.15 | 22,826 | 1.8 | 0.77 | 269 | 0.447 | 0.055 |
| EST | 0.43 | 59.16 | 81.60 | 0.513 | 0.54 | 8.47 | 38,282 | 1.2 | 0.62 | 160 | 0.412 | 0.061 |
| ILD | 0.42 | 49.38 | 91.19 | 0.455 | 0.57 | 6.93 | 33,828 | 1.0 | 0.69 | 185 | 0.412 | 0.080 |
| KC | 0.32 | 71.11 | 91.53 | 0.418 | 0.56 | 7.62 | 71,212 | 1.5 | 0.64 | 234 | 0.382 | 0.065 |
| KLC | 0.52 | 58.59 | 63.72 | 0.575 | 0.41 | 10.11 | 44,042 | 1.5 | 0.67 | 154 | 0.436 | 0.045 |
| KT | 0.34 | 78.55 | 92.43 | 0.314 | 0.55 | 8.83 | 60,627 | 1.7 | 0.61 | 203 | 0.366 | 0.073 |
| NTH | 0.33 | 76.76 | 81.16 | 0.380 | 0.57 | 8.32 | 50,008 | 1.4 | 0.64 | 165 | 0.429 | 0.084 |
| SK | 0.49 | 75.47 | 78.09 | 0.300 | 0.51 | 12.31 | 49,441 | 1.5 | 0.63 | 123 | 0.439 | 0.064 |
| SSP | 0.37 | 65.22 | 81.31 | 0.455 | 0.51 | 8.13 | 54,336 | 1.3 | 0.66 | 147 | 0.418 | 0.084 |
| ST | 0.29 | 76.35 | 101.53 | 0.524 | 0.56 | 7.33 | 78,422 | 1.7 | 0.64 | 176 | 0.370 | 0.075 |
| STH | 0.42 | 58.96 | 110.74 | 0.369 | 0.48 | 8.32 | 64,493 | 1.3 | 0.65 | 148 | 0.422 | 0.085 |
| TM | 0.29 | 66.76 | 103.41 | 0.609 | 0.56 | 6.43 | 76,469 | 1.3 | 0.66 | 190 | 0.404 | 0.093 |
| TP | 0.31 | 73.27 | 115.49 | 0.276 | 0.56 | 7.66 | 86,405 | 1.2 | 0.61 | 142 | 0.403 | 0.078 |
| TW | 0.49 | 59.15 | 79.68 | 0.593 | 0.50 | 9.72 | 40,614 | 1.8 | 0.66 | 134 | 0.429 | 0.061 |
| WC | 0.74 | 43.38 | 65.26 | 0.418 | 0.59 | 10.65 | 27,180 | 2.3 | 0.44 | 159 | 0.403 | 0.078 |
| WTS | 0.34 | 63.05 | 97.12 | 0.576 | 0.52 | 7.07 | 70,558 | 1.5 | 0.64 | 175 | 0.415 | 0.079 |
| YL | 0.43 | 68.37 | 91.01 | 0.278 | 0.56 | 9.85 | 59,640 | 1.5 | 0.68 | 161 | 0.403 | 0.065 |
| YTM | 0.59 | 52.84 | 64.62 | 0.528 | 0.39 | 10.47 | 28,099 | 1.5 | 0.72 | 215 | 0.440 | 0.052 |
| Categories | Energy Use Intensity (kWh/m2) | |
|---|---|---|
| Case 1 | Case 2 | |
| Cooling | 67.96 | 59.80 |
| Interior lighting | 36.14 | 45.14 |
| Electric equipment | 68.44 | 56.27 |
| Total | 172.53 | 161.20 |
| Performance | Case 1 | Case 2 |
|---|---|---|
| UTCI (highest value) | 33.7 °C (high density, lower SVF, and limited tree coverage) | >34 °C (higher sky view factor and insufficient shading, increased solar exposure, and localized heat accumulation) |
| EUI | 172.53 kWh/m2/year (higher cooling and equipment use due to a dense morphology and higher FAR) | 161.20 kWh/m2/year (lower density, lower FAR, and higher lighting demand) |
| Cooling load | 4000–11,000 kWh (higher cooling loads due to a dense morphology and lower tree coverage) | 6000–9000 kWh (lower cooling loads due to better ventilation and higher tree coverage) |
| DA | 3–24% (limited by a high building density, shading, and average building height) | 5–18% (lower density and shorter buildings, and constrained by a poor orientation) |
Disclaimer/Publisher’s Note: The statements, opinions and data contained in all publications are solely those of the individual author(s) and contributor(s) and not of MDPI and/or the editor(s). MDPI and/or the editor(s) disclaim responsibility for any injury to people or property resulting from any ideas, methods, instructions or products referred to in the content. |
© 2025 by the authors. Licensee MDPI, Basel, Switzerland. This article is an open access article distributed under the terms and conditions of the Creative Commons Attribution (CC BY) license (https://creativecommons.org/licenses/by/4.0/).
Share and Cite
Bian, C.; Lee, C.C.; Chen, X.; Li, C.Y.; Hu, P. Quantifying the Thermal and Energy Impacts of Urban Morphology Using Multi-Source Data: A Multi-Scale Study in Coastal High-Density Contexts. Buildings 2025, 15, 2266. https://doi.org/10.3390/buildings15132266
Bian C, Lee CC, Chen X, Li CY, Hu P. Quantifying the Thermal and Energy Impacts of Urban Morphology Using Multi-Source Data: A Multi-Scale Study in Coastal High-Density Contexts. Buildings. 2025; 15(13):2266. https://doi.org/10.3390/buildings15132266
Chicago/Turabian StyleBian, Chenhang, Chi Chung Lee, Xi Chen, Chun Yin Li, and Panpan Hu. 2025. "Quantifying the Thermal and Energy Impacts of Urban Morphology Using Multi-Source Data: A Multi-Scale Study in Coastal High-Density Contexts" Buildings 15, no. 13: 2266. https://doi.org/10.3390/buildings15132266
APA StyleBian, C., Lee, C. C., Chen, X., Li, C. Y., & Hu, P. (2025). Quantifying the Thermal and Energy Impacts of Urban Morphology Using Multi-Source Data: A Multi-Scale Study in Coastal High-Density Contexts. Buildings, 15(13), 2266. https://doi.org/10.3390/buildings15132266