Abstract
Culture represents the core and ultimate value of a city, serving as a foundation for its economic and social development. However, with rapid urban expansion and increasing globalization, issues related to the spatial distribution pattern, accessibility and equity of cultural resources have become more prominent. This study proposes an integrated GIS-based framework combining ANN, Kernel Density, accessibility, and LQ analyses. It evaluates cultural service coverage across walking, cycling, and driving modes under varying travel durations (5–30 min). Both area-based accessibility and residential-based accessibility are considered. Additionally, the study incorporates Location Quotient (LQ) Analysis for low-income communities across these travel modes and accessibility types to assess spatial equity. The framework is validated through a case study of red cultural resources in Shanghai (China). The results show significant mismatches between area accessibility and residential accessibility in certain administrative districts, particularly highlighting disparities in cultural service provision for disadvantaged populations. These findings suggest incorporating residential-oriented accessibility and equity-based metrics into planning practices. This method supports more accurate and equitable allocation of cultural resources and informs evidence-based decisions in facility planning, urban function optimization, and spatial management.
1. Introduction
1.1. Research Background and Significance
In the context of rapid globalization and urbanization, cities serve not only as centers of population and economic activity but also as key carriers of cultural accumulation and transmission. Large cities play a significant role in the global urban arena, where the quality and efficiency of cultural services are key drivers of urban competitiveness. Both city size and the nature of cultural amenities are important success factors [1]. However, in the process of urban renewal, the symbolic value of culture and history is often overlooked. This leads to a decline in the cultural significance of urban spaces. Under the prevailing trend of standardized and efficiency-driven development, such neglect accelerates the homogenization of urban landscapes, resulting in a loss of local character and uniqueness. It also weakens cultural identity and residents’ sense of belonging [2,3]. Moreover, it limits the potential to develop localized cultural tourism, creative industries, and other distinctive economic sectors, thereby restricting the diversification of urban economic value [4,5]. Based on the above analysis, research on urban culture holds significant practical importance and long-term strategic value. First, in the context of urban planning, the systematic integration of cultural elements helps create public spaces with historical depth and cultural meaning. This supports a shift from material-based planning to human-centered planning. Second, in terms of cultural heritage protection, the identification, classification, and evaluation of tangible and intangible cultural assets provide a theoretical foundation for more scientific and sustainable preservation policies. This helps avoid issues such as neglect during restoration or superficial landscape-oriented development. Third, from the perspective of tourism and transport optimization, spatial integration and route planning centered on cultural resources can enhance the synergy between urban culture and the tourism industry. This improves visitor experience, reduces crowding, and promotes both cultural dissemination and economic benefits.
In recent years, increasing attention has been directed toward the spatial equity of urban infrastructure. Existing research has primarily focused on facilities such as healthcare, education, and green space [6,7,8]. Studies have shown that the spatial distribution of such resources often favors central or affluent areas, while underserved communities—such as low-income neighborhoods—frequently face accessibility deficits. By comparison, research on the spatial equity of cultural facilities remains limited, especially in relation to accessibility for disadvantaged groups. Incorporating cultural resources into urban equity studies is therefore necessary to support more inclusive and equitable access to public services.
This study builds on existing research to explore the spatial distribution, service accessibility and equity of urban cultural resources. A dual-dimensional evaluation framework is proposed, integrating area-based and residential-based accessibility. The analysis is conducted using the Average Nearest Neighbor (ANN) Analysis, Kernel Density (KD) Analysis, accessibility assessment and Location Quotient (LQ) Analysis methods. Walking is recognized as the primary mode of travel for urban residents. Its accessibility serves as a key indicator of spatial access to urban cultural resources. Cycling offers a fast and cost-effective alternative, supporting more efficient access. Driving provides insights into the overall balance and coverage of urban public service systems at a larger spatial scale. By incorporating three travel modes—walking, cycling, and driving—this study investigates how different modes and time thresholds affect accessibility to cultural resources. The analysis adopts a dual perspective, focusing on both “resources” and “residents”, to evaluate the spatial alignment between the distribution of cultural resources and residential patterns. It also highlights how different transportation modes influence the equity of service provision. To assess accessibility equity, particularly for low-income neighborhoods, this study employs the Location Quotient (LQ) method. LQ measures the relative share of accessible cultural resources for disadvantaged areas compared to the overall urban population, allowing for a quantitative evaluation of access disparities across travel modes. The findings aim to support the spatial optimization of cultural resources, enhance coordination between transport systems and cultural infrastructure, and promote equity in public cultural services.
1.2. Evolution of Spatial Analytical Methods
The Average Nearest Neighbor (ANN) Analysis has been widely adopted as a spatial analysis tool for identifying clustering patterns across multiple disciplines, such as epidemiology, ecology, and urban studies. Recent research has explored ways to improve its robustness, particularly when applied to complex spatial structures or non-point datasets. For example, Monte Carlo simulation techniques have been integrated to enhance its applicability in areal data environments [9]. In practice, the ANN Analysis has been used to map ancient neighborhood structures [10] and to assess the spatial clustering of cultural facilities in urban environments [11], demonstrating its adaptability to diverse research contexts.
Kernel Density (KD) Analysis was first introduced by Rosenblatt (1956) and Parzen (1962) as a non-parametric method to estimate probability density functions [12,13]. A study conducted by American scholar Warangkana Ruckthongsook et al. evaluated threshold selection methods for adaptive kernel density estimation in disease mapping, aiming to enhance spatial clustering accuracy in regions with heterogeneous population distributions [14]. Karppa et al. proposed the DEANN algorithm, combining approximate nearest neighbor search and random sampling to improve KD Estimation efficiency in high-dimensional data [15]. A study conducted by Wang et al. proposed a KD Estimation model based on quadtree and quasi-interpolation, which improves efficiency for large-scale data and mitigates boundary and smoothing problems [16].
Hansen (1959) defined accessibility as the potential for interaction [17]. Kwan (1998) classified accessibility into two types: individual accessibility and place accessibility [18]. Geurs and van Wee (2004) identified four key dimensions of accessibility: land use system, transport system, individual characteristics, and temporal aspects [19]. This framework has provided a systematic foundation for subsequent research [19]. Martens (2012) further emphasized the concept of “justice in accessibility,” proposing that policy design should address equality of travel opportunities among different social groups [20]. Recent accessibility research has increasingly emphasized dynamic and multifactorial metrics that account not only for time and distance, but also for route quality, frequency of use, and other service-related attributes. Borja Moya-Gómez et al. (2018) analyzed the dynamic accessibility of Madrid by considering the effects of changing network congestion conditions and destination attractiveness [21]. Liu et al. (2023) evaluated the reliability of public transit accessibility using high-resolution real-time data [22]. Ma et al. (2024) introduced a multi-dimensional and high-granularity equity measurement for transportation services, which considers service accessibility and quality alongside population demographics [23]. Accessibility research in China started relatively late and has primarily focused on macro-scale geographical levels such as the national, provincial, and urban agglomeration scales. Quantitative evaluations of regional accessibility under different transport modes have been conducted using methods such as time cost analysis, raster cost distance analysis, and cost distance weighted analysis [24,25]. Some scholars have also introduced accessibility into the field of tourism geography. Their research focuses on the impact of transportation system development on the accessibility of tourist destinations [26,27,28], as well as the evaluation of regional tourism accessibility based on different modes of transport [29,30].
In recent years, with the progress of big data collection and analysis, Geographic Information Systems (GISs) have been widely used in studies on the spatial distribution and accessibility of cultural resources. The integration of GIS and BIM is increasingly applied in urban studies to enhance spatial analysis, visualization, and decision-making process [31]. GIS offers strong functions in integrating, simulating, and analyzing spatial data. Methods such as the Average Nearest Neighbor (ANN) Ratio, Kernel Density (KD) Estimation, and accessibility calculation are especially effective in these applications. Zou et al. (2021) examined the spatial distribution and patterns of classic revolutionary tourism sites in China from a geographical perspective [32]. Zhong et al. (2011) applied accessibility analysis and spatialization of population data to quantitatively analyze and evaluate the spatial structure and regional effects of major red tourism sites in Jiangxi Province [33]. Zhao et al. (2023) conducted a comparative study of Seoul and Tokyo, analyzing the spatial distribution and walking accessibility of museums in both cities [34]. Zhao et al. (2022) evaluated the spatial accessibility of Cultural Urban Land Use (CULU) using an improved 2SFCA method [35]. Xi’an, a representative ancient city in China, was selected as the study area. The study compared accessibility results across different travel modes—walking, bus, metro, and overall—to identify the characteristics of CULU accessibility in Xi’an [35]. A comparative study of cultural spaces in Xi’an and Manhattan used spatial analysis methods, including fractal dimension and the ANN Ratio, and revealed significant differences in their spatial distribution patterns [36].
In summary, existing studies have made progress in identifying spatial patterns of cultural resources, evaluating transportation accessibility, and comparing multiple travel modes. However, most research focuses on macro scales or specific cultural sites. Few studies systematically examine the interaction between urban spatial structure, residential distribution, and the spatial organization of cultural resources alongside accessibility by different transport modes. In particular, research on the efficiency gains and spatial differentiation of accessibility across various travel modes remains limited. Moreover, there is a lack of empirical evidence on how different transport modes affect access to cultural resources for low-income communities. To address these gaps, it is necessary to build on existing work by integrating multi-source spatial data and GIS methods to further explore the multidimensional relationship between urban cultural resource distribution and accessibility. This will provide theoretical and methodological support for future case studies.
2. Data and Methods
2.1. Data
2.1.1. Study Area and Subjects
Shanghai is one of China’s four directly governed municipalities. It is one of China’s economic, financial, technological, and shipping centers. Located on the eastern coast, Shanghai covers a total area of 6340.5 square kilometers and consists of 16 districts. By the end of 2024, the resident population reached 24.8 million, with a gross domestic product (GDP) of CNY 5.39 trillion [37]. Shanghai’s transportation network is vast, including a developed road network, an efficient subway system, and a busy public transportation network [38]. Under rapid urbanization, Shanghai has actively promoted the “People-Centered City” development concept, integrating the construction of a public cultural service system into urban governance. Over the course of its development, the city has built a diverse and inclusive cultural system and accumulated a rich collection of red cultural resources.
Red culture is a distinctive form of political symbolism unique to China. It was developed during the long historical process of revolution, construction, and reform under the leadership of China’s ruling party (the Communist Party of China, the only ruling party since the founding of the People’s Republic of China), and is rooted in the sinicization of Marxism [39]. Red cultural resources mainly include historic sites, ruins, memorial facilities, and related locations. These resources carry strong political symbolism and serve important educational functions. They can also be considered a form of state narrative cultural heritage, as they serve to reinforce collective memory, ideological values, and national identity. Similar heritage types exist globally, such as the Altare della Patria in Italy, the Lincoln Memorial in the United States, or the Hiroshima Peace Memorial in Japan.
As the birthplace of the Communist Party of China (CPC) and the origin of its founding mission, Shanghai holds a rich collection of red cultural resources. According to the Shanghai Red Cultural Resources Directory (First Batch) published by the Shanghai Municipal People’s Government, over 600 red cultural sites have been identified across Shanghai [40]. These resources are widely distributed and offer a strong foundation for spatial analysis. Therefore, they are suitable for empirical research on the accessibility of cultural resources. At the same time, Shanghai has a large permanent population and a complex urban structure. The spatial distribution of cultural resources shows significant patterns of clustering and dispersion, and accessibility levels vary across different areas. These conditions present challenges in terms of both spatial efficiency and service equity for cultural resources. In recent years, the Shanghai municipal government has prioritized the preservation and utilization of red cultural resources. A range of initiatives has been introduced to enhance public awareness and engagement. For example, key historical sites have been marked with commemorative plaques to improve visibility. Transportation infrastructure has been upgraded, and cultural landmarks have been promoted as popular destinations, making it easier for residents to access these sites. The Blue Book on the Inheritance, Promotion, and Utilization of Red Cultural Resources in Shanghai (2021–2022) notes that “transportation” is the most frequently mentioned factor in evaluations of functional value for red cultural resources [41]. This highlights public concern regarding the spatial location and transport accessibility of such resources. Accessibility plays a critical role in shaping how residents interact with cultural heritage. Therefore, taking Shanghai as a case study to examine the spatial patterns and accessibility of red cultural resources can help reveal the spatial logic of cultural resource distribution in mega cities. It also provides a practical reference for using cultural resources to support high-quality urban development, demonstrating both real-world relevance and academic value.
According to the Shanghai Comprehensive Transportation Development Annual Report (2022), the average daily green travel rate in central Shanghai reached 72.1% on weekdays in 2021, marking a year-on-year increase of 3.2 percentage points. Non-motorized travel, including walking and cycling, accounted for 17.3% of total trips, up by 2.2 percentage points compared to the previous year [42]. Since 2017, Shanghai has actively promoted a green travel system and supported the development of a “cycling-friendly city.” The introduction of shared bicycles has further increased the popularity of cycling among residents [43]. Meanwhile, motorized travel has also expanded, with rapid growth in personalized transport services and more diverse travel options. In response to these trends, this study focuses on three typical travel modes—walking, cycling, and driving—to evaluate accessibility under different time thresholds. A 15 min time threshold was adopted in this study, with time intervals divided into six bands: 0–5 min, 5–10 min, 10–15 min, 15–20 min, 20–25 min, and 25–30 min. The Shanghai Master Plan (2016–2040) (Draft) proposed the construction of 15 min community life circles. By 2040, the plan aims to achieve 100% coverage of community public service facilities accessible within a 15 min walking distance [44]. Based on this planning goal, the study focuses on accessibility within a 15 min threshold, including both area-based and residential accessibility. Accessibility maps were generated by calculating the travel range areas across different time intervals. These maps were used to assess the accessibility levels of red cultural resources.
For this research, the study area was the City of Shanghai. Encompassing approximately 6340.5 square kilometers, the study area is home to a population of 24.8745 million residents. To comprehensively assess the spatial distribution, accessibility and equity of red cultural resources in Shanghai, this study covers all 16 administrative districts of the city. These include the central urban districts (Huangpu, Xuhui, Changning, Jing’an, Putuo, Hongkou, and Yangpu), the suburban districts (Minhang, Baoshan, Jiading, Jinshan, Songjiang, Qingpu, Fengxian, and Chongming), and Pudong New Area [45].
2.1.2. Data Sources and Processing
This study used five types of data: (1) the Shanghai Red Cultural Resources Directory, (2) administrative boundary data, (3) road network data, (4) residential area data and (5) low-income communities.
The first dataset is the Shanghai Red Cultural Resources data. In 2022, the Shanghai Municipal People’s Government released the Shanghai Red Cultural Resources Directory (First Batch) (hereafter referred to as the “Directory”) (https://www.shanghai.gov.cn/). The Directory includes 612 immovable red cultural resources within Shanghai, comprising 228 former sites, 279 historic sites, and 105 commemorative facilities. The Shanghai Red Cultural Resources Joint Directory Database (https://red.library.sh.cn/minglu/ (accessed on 9 March 2025) was developed under the leadership of the Joint Office for Red Cultural Resource Protection and Utilization. This effort involved the Municipal Publicity Department, Party History Research Office, Culture and Tourism Bureau, Shanghai Library, and other departments. The database provides unified search functionality to obtain detailed address information for all 612 red cultural resources in the Directory. Geographic coordinates (latitude and longitude) for each red cultural resource point were collected using the Baidu coordinate picker system. Coordinates were then transformed and corrected using the GeoHey plugin in QGIS. This process enabled the construction of a Shanghai red cultural resource POI geographic database.
The second dataset, containing the administrative boundaries, was obtained from the Resource and Environment Science and Data Center of the Chinese Academy of Sciences (https://www.resdc.cn/), and corresponds to the year 2022.
The third dataset represents the transportation network of Shanghai and was extracted from OpenStreetMap (https://www.openstreetmap.org) in February 2025. The transportation network data consists of the walking path network, the cycling path network and the road network for vehicles. Travel speeds were defined as follows: 4.8 km/h for walking and 14.4 km/h for cycling, based on average values used in urban transport studies. For driving, the free-flow speed assigned to each road segment in the OSM attribute table was used to calculate mode-specific travel times. The extracted network was preprocessed through topological cleaning to ensure connectivity and remove duplicate segments.
The fourth dataset is the residential area data. It was downloaded from the StarCloud Data Service Platform (https://data-starcloud.pcl.ac.cn/ accessed on 9 March 2025). This dataset integrates multiple data sources, including 2018 Sentinel-2 satellite imagery at 10 m resolution, OpenStreetMap data, Luojia-1 nighttime light data, Tencent mobile location data, and Amap POI data. Using these social big data sources, the dataset achieves the first nationwide urban land use mapping in China. It covers five main land use categories: residential, recreational, transportation, industrial, and office areas [46].
The fifth dataset is low-income communities in Shanghai. Due to the difficulty of directly obtaining spatial data on low- and middle-income populations, this study uses residential conditions as a proxy for income levels. Specifically, residential property prices are adopted as an indirect indicator of socioeconomic status. Point of Interest (POI) data on residential compounds were collected from the Amap API (https://lbs.amap.com) in January 2024. The dataset includes compound names, housing prices, geographic coordinates, and year of construction. According to the National Bureau of Statistics of China, urban households are typically divided into five income groups based on population quintiles: the lowest 20% represent low-income households, followed by lower–middle, middle, upper–middle, and the highest 20% as high-income households. Following this classification, this study identifies the lowest 20% of residential compounds in Shanghai by average housing price as low-priced communities, which are used to represent low-income communities for subsequent accessibility and equity analysis.
2.2. Method
This study develops a GIS-based spatial analysis framework for urban cultural resources. It integrates four methods in sequence: Average Nearest Neighbor (ANN) Analysis, Kernel Density (KD) analysis, accessibility analysis and Location Quotient (LQ) Analysis. Compared with previous studies, this paper distinctively integrates residential-oriented accessibility metrics with LQ-based equity analysis in a multimodal and multiscale framework. This integration enables a systematic approach from spatial distribution identification to service accessibility evaluation. The method can identify spatial mismatches between the locations of cultural resources and residential demand, and offer data-driven insights for improving the distribution and accessibility of urban cultural resources. The detailed procedure is illustrated in the academic workflow diagram below (Figure 1).
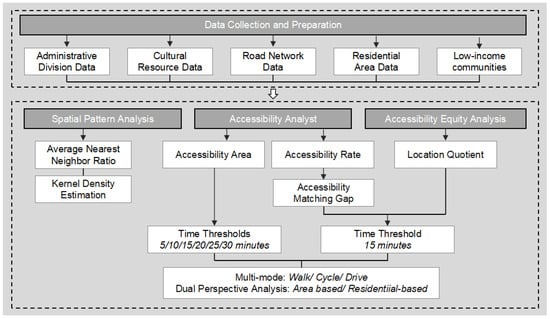
Figure 1.
Academic workflow diagram.
2.2.1. Average Nearest Neighbor (ANN) Analysis
The nearest neighbor distance is a geographic metric that reflects the spatial proximity between point features. The Nearest Neighbor Index (NNI) effectively describes the spatial distribution pattern of these features. The Average Nearest Neighbor (ANN) method calculates the mean distance between each point and its nearest neighbor, and compares it to the expected mean distance under a random distribution. The ratio of these two values yields the NNI, which indicates whether the spatial pattern is clustered, random, or dispersed. The formula is as follows:
In the formula, the expected nearest neighbor distance is given by:
where is the number of points and is the area of the study region. If the index is less than 1, the pattern exhibits clustering; if the index is greater than 1, the trend is toward dispersion or competition.
In this study, the study region A corresponds to the administrative boundary area of Shanghai city. No additional edge correction methods were applied beyond those inherent in the ArcGIS ANN tool. We acknowledge that this approach may introduce edge effects and that the method assumes spatial homogeneity, which may not fully capture the complexities of urban spatial patterns. Nevertheless, ANN provides a useful initial quantitative measure of clustering in the spatial distribution of cultural resources.
2.2.2. Kernel Density (KD) Analysis
Kernel Density Estimation (KDE) visually reflects the dispersion or clustering of point features in geographic space. It serves as an important indicator of the spatial density of point features [47]. The higher the point density, the more pronounced the KDE result, which helps highlight spatial differences in the distribution of specific features [48]. The KDE formula for a point with center ρ is given by:
In the formula, is the kernel density estimate at spatial location . represents the number of points within the distance bandwidth. is the distance threshold, which defines the spatial scale of the Kernel Density Analysis. denotes the distance between the estimation point and the kernel center . is the weighting parameter.
In this study, Kernel Density Analysis was performed using the Kernel Density tool in ArcGIS to visualize the spatial distribution of immovable red cultural resources in Shanghai. The kernel function is based on the quartic kernel function described in Silverman (1986, p. 76, Equation (4.5)) [49], which provides smooth and localized spatial surfaces suitable for point-based urban facility data. The search bandwidth was adjusted according to the spatial characteristics of each dataset to strike a balance between smoothing and spatial fidelity, ensuring that the results are interpretable.
2.2.3. Accessibility Analysis
This study proposes an accessibility framework based on two dimensions, three travel modes, and multiple time intervals. The framework quantifies the service coverage of urban cultural resources under different transport modes and time thresholds, offering a more comprehensive perspective on resource allocation. It enables the identification of service gaps and areas of over-concentration. Accessibility ratio is used as a key indicator to assess service capacity. Two types of accessibility ratios are constructed: area-based accessibility and residential unit-based accessibility.
Area accessibility rate () is a direct and effective indicator for measuring overall spatial coverage. It reflects the matching efficiency between transportation modes and the distribution of cultural resources. The formula is as follows:
In the formula, represents the service area covered by resource points, and denotes the total area of the study region.
The residential area accessibility rate () focuses on the impact of resource allocation on residents’ daily cultural life. It reflects the relationship between residential areas and cultural resources, and is suitable for evaluating cultural equity and service balance. The indicator is calculated by taking actual residential locations as the evaluation units and computing the proportion of residential area that can reach at least one cultural resource within a given time threshold to the total residential area. The formula is as follows:
In the formula, is the residential area covered by accessible cultural resources, and is the total residential area within the study region.
This study incorporates three typical travel modes: walking, cycling, and driving. Based on residents’ daily travel habits and relevant research standards, multiple time thresholds are set for each mode: 5, 10, 15, 20, 25, and 30 min. These thresholds are used to assess changes in accessibility under different travel costs. As travel modes shift, the marginal contribution of each additional mode to accessibility can be quantitatively evaluated by changes in coverage rates.
The Accessibility Matching Gap (AMG) reflects the degree of spatial alignment between the service scope of resources and the distribution of residential areas. For each travel mode, AMG is calculated as
In the formula, denotes the mode of travel, where w, c and d represent walking, cycling, and driving, respectively.
2.2.4. Location Quotient Analysis
To evaluate the spatial equity of cultural resource accessibility for low-income communities, this study employs Location Quotient (LQ) Analysis under different travel modes. In this study, LQ is calculated as the ratio between two proportions: the share of low-priced residential compounds within a district that fall inside the service area of cultural resources, and the corresponding share of all residential compounds within the same district that are covered. Two dimensions of accessibility are considered: area accessibility and residential area accessibility. The formula is as follows:
In the formula,
, where A denotes area accessibility and R denotes residential area accessibility;
denotes the mode of travel, where w, c and d represent walking, cycling, and driving, respectively.
is the number of low-priced residential compounds in district that fall within the service area of cultural resources under a given travel mode and time threshold;
is the total number of low-priced residential compounds in district ;
is the number of all residential compounds in district that are covered by the service area;
is the total number of all residential compounds in district .
An LQ value of 1 indicates that cultural resources cover low-priced and overall residential compounds at the same rate, reflecting spatial equity. A value greater than 1 suggests that low-priced communities receive better coverage, indicating a bias toward disadvantaged groups. A value below 1 implies that resources are more concentrated in higher-priced areas, reflecting potential exclusion of low-income communities.
2.2.5. Methodological Considerations
The two-step floating catchment area (2SFCA) method is widely used to assess service accessibility. It combines supply–demand relationships and distance decay to estimate accessibility scores. However, this study does not apply the 2SFCA model for three main reasons. First, cultural resources in the study area vary greatly in type and scale. These include museums, memorial halls, and open public spaces such as cemeteries and plazas. Their functions and service ranges differ, making it difficult to set a unified threshold for catchment areas or supply capacity. Second, many sites are open to the public without controlled entry. This leads to a lack of stable visitor flow data, which prevents accurate demand estimation. Third, assigning consistent weights to such diverse cultural facilities is challenging due to their symbolic and experiential nature.
Other advanced models, such as gravity-based or weighted accessibility methods, were also considered. These methods require assumptions about the attraction strength or utility of each site. However, cultural resources often lack clear metrics for measuring these values. In addition, the study does not have access to detailed travel behavior or real-time mobility data, which these models often require. As an alternative, this study uses a static, ratio-based accessibility model. It measures service coverage through area-based and residential-based accessibility rates. This method allows for comparison across different travel modes and time thresholds, without needing detailed supply–demand data.
3. Result
3.1. Spatial Distribution Patterns
According to the Average Nearest Neighbor Analysis (Table 1), the spatial distribution of red cultural resources in Shanghai—including former sites, ruins, and memorial facilities—shows a high degree of dispersion. This indicates that the spatial layout of red cultural resources is highly selective and intentional, closely associated with their historical development, cultural dissemination purposes, and the characteristics of the urban spatial framework. As shown in Table 1, the Z-scores for all facility types are significantly positive, and the Nearest Neighbor Index (NNI) values are much greater than 1. The overall NNI of red cultural resources in Shanghai is 11.11, indicating a dispersed spatial pattern. The NNI for former sites is 10.42, and for ruins, it is 9.40, both showing moderate dispersion significantly above random distribution. Memorial facilities exhibit the highest NNI of 21.58, suggesting that they are primarily located in symbolic or representative areas.

Table 1.
The spatial distribution patterns of red cultural resources.
The Kernel Density Analysis results indicate that immovable red cultural resources in Shanghai are both widely distributed and relatively concentrated in central urban districts (Figure 2). First, the distribution is broad: Baoshan District has 12 sites, Chongming District has 31 sites, Fengxian District has 5 sites, Hongkou District has 84 sites, Huangpu District has 143 sites, Jiading District has 14 sites, Jinshan District has 7 sites, Jing’an District has 105 sites, Minhang District has 12 sites, Pudong New Area has 19 sites, Putuo District has 42 sites, Qingpu District has 17 sites, Songjiang District has 7 sites, Xuhui District has 21 sites, Yangpu District has 71 sites, and Changning District has 22 sites. Second, the distribution is concentrated. Most resources are located in central areas such as Huangpu and Jing’an District, while the number of immovable red cultural resources is relatively low in suburban districts [50]. As illustrated in the Geographic Distribution Map of Red Cultural Resources in Shanghai (Figure 3), 65.85% of the immovable red cultural resources are located in central districts.
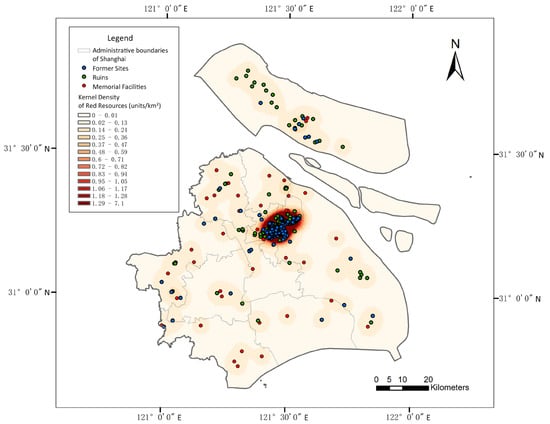
Figure 2.
Kernel density map of red cultural resources in Shanghai.
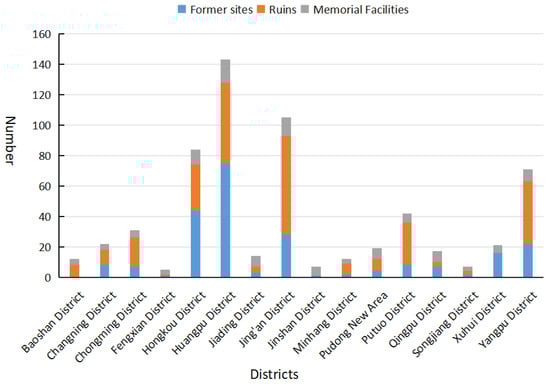
Figure 3.
Geographic distribution map of red cultural resources in Shanghai.
3.2. Accessibility Analysis
To assess the applicability of the accessibility index in evaluating the service capacity of urban cultural resources, this study calculated the red cultural resource service areas in Shanghai under six time thresholds (5, 10, 15, 20, 25, and 30 min) using three travel modes: walking, cycling, and driving. The 15 min area and residential area accessibility rates are illustrated in Figure 4, Figure 5 and Figure 6 and Table 2. The results show that red cultural resources are accessible by walking within 15 min across 7.00% of Shanghai’s total area, with only 4.37% of residential areas falling within this range. Under the cycling mode, the 15 min service area covers 23.03% of the city, and residential area accessibility rate rises to 33.30%. For driving, the 15 min area accessibility rate reaches 91.80%, and the residential area accessibility rate reaches 97.21%. The 15 min area accessibility rates and residential area accessibility rates for each administrative district under walking, cycling, and driving modes are presented in Figure 4c, Figure 5c and Figure 6c.
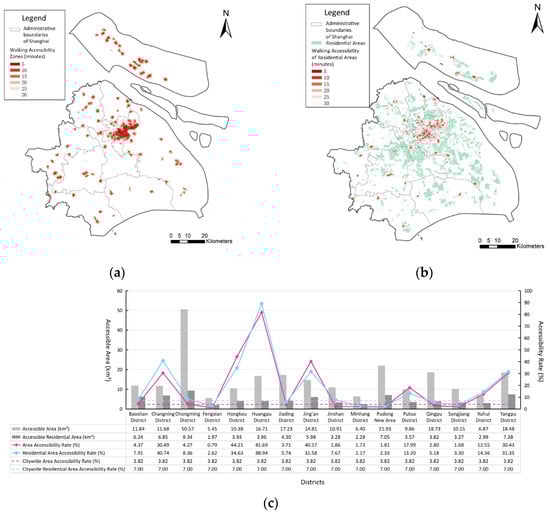
Figure 4.
Walkability accessibility analysis. (a) Walkability accessibility level map; (b) walkability-residential accessibility level map; (c) 15 min walkable area accessibility rate and residential accessibility rate.
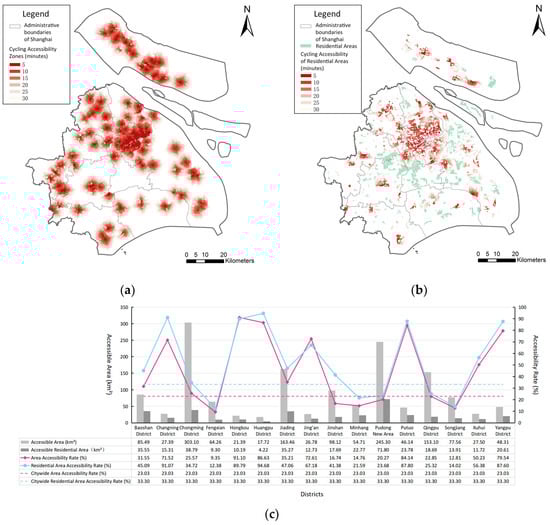
Figure 5.
Cycling accessibility analysis. (a) Cycling accessibility level map; (b) cycling–residential accessibility level map; (c) 15 min cycling area accessibility rate and residential accessibility rate.
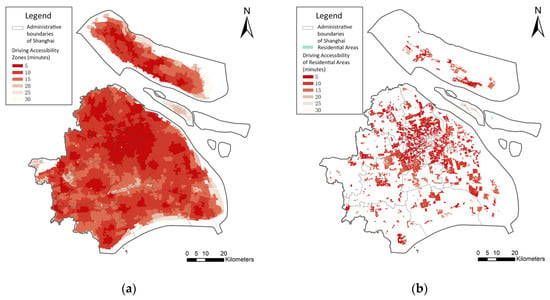
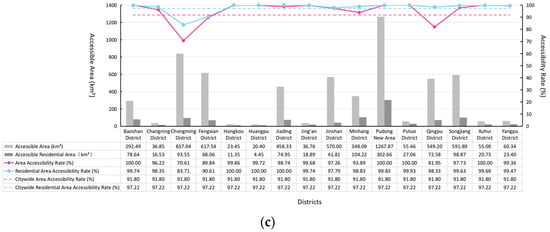
Figure 6.
Driving accessibility analysis. (a) Driving accessibility level map; (b) driving–residential accessibility level map; (c) 15 min driving area accessibility rate and residential accessibility rate.
Table 2.
Area and residential accessibility rates within 15 min under walking, cycling, and driving.
To maintain visual clarity and analytical focus, islands located outside the urban built-up area—such as Sheshan Island in the Yangtze River estuary—are not included in this and subsequent analysis maps.
There are significant differences in cross-district accessibility under different travel modes (Table 2). The following analysis focuses on walking accessibility (Figure 4c). In Huangpu District, the walking-accessible area is 16.71 km2, covering 81.69% of the district’s total area. The accessible residential area is 3.96 km2, with a regional accessibility rate of 88.94%, the highest among all districts. This suggests that residents in Huangpu District can reach multiple red cultural resource sites within a short walking time. Hongkou (area accessibility rate: 44.21%, residential area accessibility rate: 34.63%), Jing’an (40.17%, 31.58%), Yangpu (30.43%, 31.35%), and Changning (30.49%, 40.74%) District also show relatively high rates of 15 min walking accessibility. Notably, in Hongkou and Jing’an District, the residential area accessibility rates are about 10 percentage points lower than the area accessibility rates. This indicates that many red cultural resource sites in these districts are located in public or non-residential areas. In Changning District, the residential area accessibility rate exceeds the area accessibility rate by 10%, indicating that red cultural resources are more closely integrated with residential zones. Although its area accessibility is not outstanding, residents benefit from relatively high walkability. Putuo (area accessibility rate: 17.99%, residential area accessibility rate: 13.20%) and Xuhui (12.55%, 14.36%) District also show moderate rates of 15 min walking accessibility, performing better than most suburban districts. In contrast, suburban districts show low walkability. Baoshan (area accessibility rate: 4.37%, residential accessibility rate: 7.91%), Chongming (4.27%, 8.36%), Fengxian (0.79%, 2.62%), Jiading (3.71%, 5.74%), Jinshan (1.86%, 7.67%), Minhang (1.73%, 2.17%), Qingpu (2.80%, 5.18%), and Songjiang (1.68%, 3.30%) District all have low area and residential area accessibility. Notably, Chongming District has the largest walking-accessible area (50.57 km2), but due to its extensive land area, the accessibility rate remains low at 4.27%. Across suburban districts, the differences between area and residential area accessibility rates are minimal. This suggests a dispersed distribution of red cultural resources, with limited advantage in walkability for residential areas. Pudong New Area also shows low walkability, with an area accessibility rate of 1.81% and a residential area accessibility rate of 2.33%.
Cycling accessibility in central urban districts remains higher than in suburban areas (Figure 5c). In Hongkou District, the 15 min cycling-accessible area reaches 21.39 km2, with an area accessibility rate of 91.10%. The accessible residential area is 10.19 km2, and the residential area accessibility rate is 89.79%, both ranking among the highest in the city. Other central districts with high cycling accessibility include Huangpu (area accessibility rate: 86.63%, residential area accessibility rate: 94.68%), Putuo (84.14%, 87.80%), Xuhui (50.23%, 56.38%), Yangpu (79.54%, 87.60%), and Changning (71.52%, 91.07%) District. In these districts, residential area accessibility exceeds area accessibility, suggesting that red cultural resources are well-integrated into areas with dense road networks. This enhances coverage for residential zones and improves overall accessibility by bicycle. In contrast, Jing’an (area accessibility rate: 72.61%, residential area accessibility rate: 67.18%) and Hongkou District are the only districts where residential area accessibility is lower than area accessibility, indicating room for improvement in their cycling infrastructure. Although cycling accessibility has improved in suburban districts, it remains significantly lower than in central areas. In Jiading (area accessibility rate: 35.21%, residential area accessibility rate: 47.06%), Baoshan (31.55%, 45.09%), Qingpu (22.85%, 25.32%), Jinshan (16.74%, 41.38%), Songjiang (12.81%, 14.02%), Minhang (14.76%, 21.59%), and Fengxian (9.35%, 12.38%) District, both area and residential area accessibility levels are clearly below those of central districts. However, in all suburban districts, residential area accessibility rates exceed area accessibility rates. This indicates that red cultural resources in these areas are more reachable from residential zones. Notably, Jinshan District shows the largest positive gap, with residential area accessibility rate 24.64 percentage points higher than area accessibility rate, suggesting relatively better access for residents. Pudong New Area demonstrates intermediate accessibility between central and suburban districts. Its area accessibility rate is 20.27%, and the residential area accessibility rate is 23.68%.
In most administrative districts, both the area accessibility rate and the residential accessibility rate of red cultural resources by car exceed 90% (Figure 6c). Districts such as Huangpu (area accessibility rate: 99.72%, residential area accessibility rate: 100%), Hongkou (99.86% and 100%), Jing’an (99.68% and 99.74%), Yangpu (99.36% and 99.47%), and Changning (96.22% and 98.35%) show excellent car accessibility, with coverage nearly spanning the entire district. However, some areas show room for improvement. In Chongming District, the area accessibility rate is only 70.61%, and the residential area accessibility rate is 83.71%, indicating limited coverage within a 15 min driving range due to large spatial extent and dispersed resource distribution. Similarly, Fengxian District has relatively low accessibility, with area accessibility rate of 89.94% and residential area accessibility rate of 90.61%. In contrast, Qingpu District presents a different pattern: although the area accessibility rate is moderate (81.95%), the residential area accessibility rate is high (98.33%), suggesting better access to red cultural resources for residents despite limited spatial coverage.
We further analyzed how red cultural resource accessibility improved under a 15 min threshold. Figure 7 presents the results across different transport modes and administrative districts. This paragraph specifically examines the change in accessibility when the travel mode shifts from walking to cycling. Among the 16 districts, the 6 central districts (Xuhui, Changning, Jing’an, Putuo, Hongkou, and Yangpu District) show the most significant increases. For example, the area accessibility rate of red cultural resources increased by 66.16% in Putuo District, 49.12% in Yangpu District, and 46.89% in Hongkou District. These results indicate that the walking and cycling infrastructure in central districts is relatively well-developed, effectively enhancing short-distance accessibility. In contrast, Huangpu District, also a central district, showed the smallest increase (4.94%), possibly because its high-density urban form already meets most travel needs through walking, leaving little room for further improvement by cycling. Suburban districts generally exhibited lower improvements in accessibility from walking to cycling, suggesting potential for optimization in short-distance non-motorized travel. Among the suburban districts, Baoshan and Jiading District showed notable improvements, with area accessibility rates increasing by 27.18% and 31.50%, respectively.
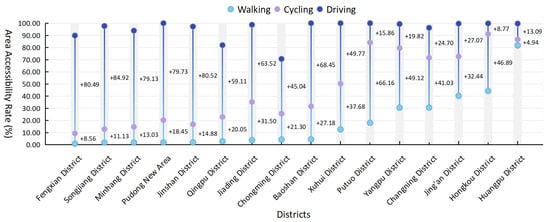
Figure 7.
Improvement magnitude of 15 min area accessibility rate by transport mode.
In suburban districts, the increase in area accessibility rate from cycling to driving was generally high. For example, the area accessibility rate from cycling to driving increased by 84.92% in Songjiang District, 80.49% in Fengxian District, and 79.13% in Minhang District. In these areas, motor vehicles significantly expand the spatial reach of red cultural resources. Two main factors may explain this trend. First, the spatial scale of suburban districts is larger, making it difficult for non-motorized modes to meet cross-neighborhood or cross-district travel demands. Second, the road network in these areas is more dependent on the infrastructure for motorized traffic. In contrast, the increase from cycling to driving in central districts was relatively small, suggesting limited marginal gains in accessibility by car. Among the central districts, only Xuhui District showed a relatively high increase, which can be attributed to its lower cycling accessibility compared to other central areas.
As shown in Figure 8 and Table 3, the Accessibility Matching Gap (AMG) values under the walking mode are mostly positive, implying that residential communities are generally located within better-served zones in Shanghai. However, several inner-city districts—such as Hongkou (−9.58%), Jing’an (−8.58%), and Putuo (−4.79%) districts—show negative values, indicating a spatial mismatch where many communities are located in areas with below-average accessibility. Under cycling conditions, the AMG values increase significantly in several suburban districts, including Jinshan (24.64%), Baoshan (13.54%), and Jiading (11.84%) districts, suggesting that cycling expands the reach of red cultural resources to areas with higher residential densities. Nevertheless, negative AMG values persist in districts such as Hongkou and Jing’an districts, indicating limited improvement in spatial alignment. Driving mode yields the most balanced results, with AMG values converging closer to zero across most districts. This suggests that car travel reduces the spatial disparity between residential locations and resource accessibility.
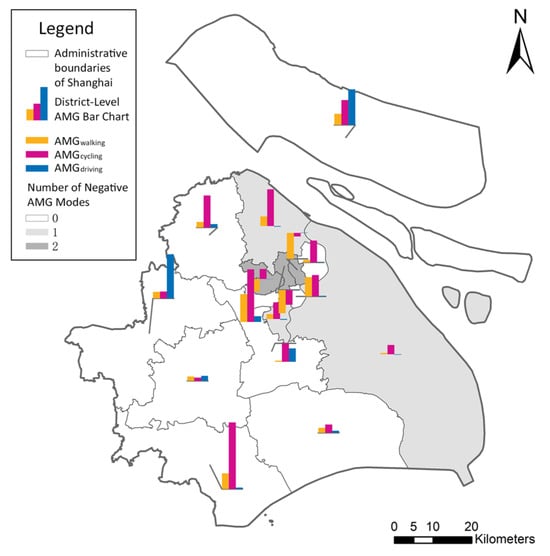
Figure 8.
Accessibility matching gap (AMG) by travel mode within a 15 min threshold in Shanghai.
Table 3.
Accessibility matchingGap (AMG) values by travel mode (%).
3.3. Equity Analysis
Kernel density estimation reveals significant spatial clustering of low-priced housing communities in Shanghai (Figure 9). High-density clusters are mainly located in the southwest, northwest, and southern parts of the city, particularly in Jiading, Qingpu, Jinshan, and Fengxian districts. In contrast, central areas such as Huangpu, Jing’an, and Xuhui districts show relatively low density values, despite their central location and abundant resources. This indicates a clear spatial mismatch between areas rich in red cultural resources and the distribution of low-priced housing communities. Such a mismatch may intensify inequality in access to urban services and underscores the importance of evaluating whether red cultural resources are equitably allocated relative to housing distribution.
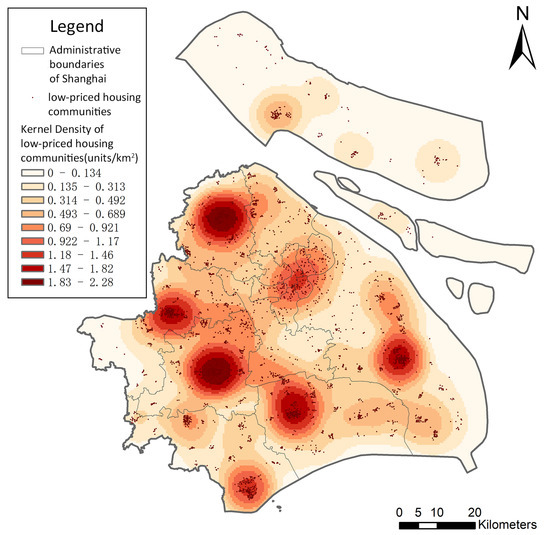
Figure 9.
Kernel density map of low-priced housing communities in Shanghai.
The spatial distribution of Location Quotients (LQs) for low-price housing communities within 15 min of accessibility highlights spatial inequalities across travel modes and calculation methods (Figure 10). Figure 10a–c show the LQ distribution based on area accessibility. Under walking and cycling modes, central districts, along with Minhang, Baoshan, and Pudong New Area, generally have lower LQ values. This indicates that low-priced housing communities in these areas have poorer access to red cultural resources. In contrast, Jiading, Qingpu, Songjiang, and Jinshan districts have LQ values above 1, suggesting that low-income groups in these suburban districts enjoy relatively better access. In panel (c), driving mode reduces LQ differences between districts. However, it also lowers LQ values in some suburban areas where disadvantaged groups had previously benefited from better access (LQ > 1). Most central urban districts, except for Hongkou, maintain LQ values above 1 under driving mode, showing that low-priced housing communities in these areas still enjoy better access compared to the general population. Figure 10d–f, based on residential area accessibility, reveal similar spatial patterns. However, the differences in LQ between districts become more pronounced. Compared to area-based results, many districts show even lower LQ values (darker colors), suggesting a further decline in resource coverage for low-income groups. Driving mode (panel f) again helps reduce spatial disparities, with more districts reaching LQ values close to or above 1. Still, the spatial balance is not as even as in the area-based analysis.
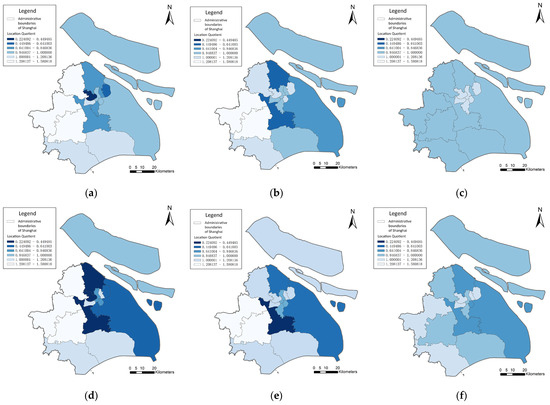
Figure 10.
Location Quotient (LQ) of low-priced housing communities within 15 min accessibility by travel mode. (a–c) LQ based on area accessibility by walking, cycling, and driving, respectively. (d–f) LQ based on residential area accessibility by walking, cycling, and driving, respectively.
The color classification scheme is consistent across all maps to allow for direct visual comparison.
4. Discussion
4.1. Limitations and Future Directions
Despite the useful insights provided by this study, several limitations should be acknowledged. First, the accessibility model assumes an unobstructed travel environment, ignoring factors such as traffic signals and congestion. This may cause deviations between calculated accessibility and actual travel experiences. Second, the model does not account for factors like trip purpose or landscape attractiveness, which could influence accessibility. Future research should incorporate more factors to improve the analysis. Third, the results represent theoretical estimates based on static spatial data. To enhance their practical value for urban planning and design, future studies should combine theory with field surveys. Validating the model using representative urban cultural resources through on-site investigation will improve the accuracy and applicability of the findings. It is important to note that some urban cultural resources are not open to the public or have very limited access due to heritage protection or security management. Although these sites are geographically close, they are effectively “inaccessible” in terms of service. The current model evaluates accessibility mainly based on physical distance and travel time. As a result, it cannot identify such actual inaccessibility, leading to an overestimation of the true service effectiveness. To address these limitations, future research should consider dynamic accessibility models supported by real-time data sources, such as mobile phone signals or public transit smart card records. These approaches can better capture temporal variations and actual usage patterns, thereby improving the accuracy of analysis and its relevance to policy and planning. Furthermore, integrating Building Information Modeling (BIM) with Geographic Information Systems (GISs) offers valuable opportunities for future accessibility research. BIM-GIS integration supports urban infrastructure planning, visualization, and management by enabling multi-scale analysis and access to real-time spatial data. Applying this framework can help examine the distribution, accessibility, and operational status of public cultural facilities more effectively.
4.2. Discussion on Policy and Practical Recommendations
Based on the findings, four targeted recommendations are proposed: (1) promote inter-district coordination, especially in peripheral areas such as Jinshan and Jiading districts, where red cultural resources are limited and accessibility remains low. Linking these areas with nearby tourism or ecological assets may enhance spatial integration. (2) Improvements in transportation networks are proposed in specific districts such as Fengxian, Songjiang and Minhang districts, where walking and cycling accessibility is weak despite reasonable driving coverage. Expanding slow-traffic infrastructure can reduce dependence on private vehicles and improve equity. (3) Residential-oriented accessibility should be introduced as a core planning criterion, rather than relying solely on area-based accessibility measures. (4) LQ Analysis highlights significant disparities in access for low-income neighborhoods, particularly in parts of Minhang, Baoshan and Pudong New Area. These areas should be prioritized in future resource planning and investment. To guide implementation, a Cultural Accessibility Priority Map is recommended to visualize mismatch zones and define targeted intervention areas for equitable resource allocation.
4.3. Comparison with Existing Studies
The observed mismatch between resource locations and residential communities, especially under walking and cycling conditions, supports concerns raised in prior literature regarding service inequity across transport modes (e.g., [Wang, 2019] [51]). Moreover, the combined use of area- and residential-based LQ offers a refined lens for detecting spatial misalignments, which are often overlooked in traditional proximity-based assessments. Overall, this study contributes to the growing discourse on equitable cultural planning by highlighting the need for mode-sensitive and residency-focused accessibility evaluations.
5. Conclusions
This study investigated the spatial distribution pattern, accessibility and equity of immovable red cultural resources in Shanghai using a GIS-based framework. This study develops an integrated methodological framework combining the Average Nearest Neighbor (ANN) Analysis, Kernel Density (KD) Analysis, accessibility analysis and Location Quotient (LQ) Analysis to reveal spatial characteristics across walking, cycling, and driving modes under multiple time thresholds. Both area-based accessibility and residential-based accessibility are considered.
Immovable red cultural resources in Shanghai show a high degree of dispersion. They are both widely distributed and relatively concentrated in central urban districts. Accessibility analysis reveals significant variations in both area and residential area accessibility rates for red cultural resources across different travel modes and time thresholds in Shanghai. Overall, central districts rank highest in walking and cycling accessibility, indicating a well-developed active transportation network. In contrast, suburban areas show lower accessibility for non-motorized modes and rely heavily on motor vehicles, suggesting room for improvement in the slow-traffic system. AMG analysis shows that walking and cycling reveal spatial mismatches in central districts. While cycling improves alignment in some suburbs, driving results in the most balanced accessibility, reducing disparities between resources and residential areas.
LQ Analysis reveals evident spatial inequalities in red cultural resource accessibility for low-income communities. Under walking and cycling modes, central districts and several urban fringe areas show low LQ values, indicating limited access. Suburban districts like Jiading and Jinshan perform better. Driving reduces these disparities but may also dilute advantages in previously better-served areas. Compared with area-based results, residential-based LQs show more pronounced gaps, highlighting the need for targeted planning to improve equity.
These findings highlight significant mismatches between area-based and residential-based accessibility in certain administrative districts, revealing disparities in cultural service provision for disadvantaged populations. Therefore, it is recommended that future urban planning incorporate residential-oriented accessibility measures and equity-based metrics to better ensure fair and inclusive access to cultural resources, particularly for low-income and vulnerable groups.
Author Contributions
S.-Q.C. contributed to conceptualization, methodology, software, investigation, formal analysis, and writing—original draft preparation; J.Z. contributed to data curation and writing—original draft preparation; W.-L.L. contributed to data curation and writing—original draft preparation. X.L. contributed to data curation and investigation. All authors have read and agreed to the published version of the manuscript.
Funding
This research received no external funding.
Data Availability Statement
The data presented in this study are available on request from the corresponding author.
Conflicts of Interest
The authors declare no conflict of interest.
References
- Kourtit, K.; Nijkamp, P. Urban Cultural Vanguards Why Culture Matters for Urban Success. J. Urban Manag. 2022, 11, 198–213. [Google Scholar] [CrossRef]
- Birdsall, C.; Halauniova, A.; van de Kamp, L. Sensing Urban Values: Reassessing Urban Cultures and Histories amidst Redevelopment Agendas. Space Cult. 2021, 24, 348–358. [Google Scholar] [CrossRef]
- Zhang, J.; Luan, W.-L.; Zhang, J.-S. Optimization of Quantitative Evaluation Method for Urban Waterfront Building Cluster Skyline. Buildings 2025, 15, 9. [Google Scholar] [CrossRef]
- Senderos, M.; Sagarna, M.; Otaduy, J.P.; Mora, F. Globalization and Architecture: Urban Homogenization and Challenges for Unprotected Heritage. The Case of Postmodern Buildings with Complex Geometric Shapes in the Ensanche of San Sebastián. Buildings 2025, 15, 497. [Google Scholar] [CrossRef]
- Zhang, J.; Wang, Y.; Luo, X.; Luan, W.-L. Multi-Viewpoint Assessment of Urban Waterfront Skylines: Fractal and Spatial Hierarchy Analysis in Shanghai. Buildings 2025, 15, 1407. [Google Scholar] [CrossRef]
- Jin, Y.; He, R.; Hong, J.; Luo, D.; Xiong, G. Assessing the Accessibility and Equity of Urban Green Spaces from Supply and Demand Perspectives: A Case Study of a Mountainous City in China. Land 2023, 12, 1793. [Google Scholar] [CrossRef]
- Hu, H.; Wang, L.; Chen, Y.; Zhao, P. Accessibility and its spatial equity of basic education in China. Sci. Geogr. Sin. 2024, 44, 1513–1523. [Google Scholar] [CrossRef]
- Tao, Z.; Dai, T.; Song, C. Improving spatial equity-oriented location-allocation models of urban medical facilities. Acta Geogr. Sin. 2023, 78, 474–489. [Google Scholar]
- Vidanapathirana, N.; Wang, Y.; McLain, A.C.; Self, S. Cluster Detection Capabilities of the Average Nearest Neighbor Ratio and Ripley’s K Function on Areal Data: An Empirical Assessment 2022. arXiv 2022, arXiv:2204.10882. [Google Scholar]
- Thompson, A.E.; Walden, J.P.; Chase, A.S.Z.; Hutson, S.R.; Marken, D.B.; Cap, B.; Fries, E.C.; Guzman Piedrasanta, M.R.; Hare, T.S.; Horn, S.W.; et al. Ancient Lowland Maya Neighborhoods: Average Nearest Neighbor Analysis and Kernel Density Models, Environments, and Urban Scale. PLoS ONE 2022, 17, e0275916. [Google Scholar] [CrossRef]
- He, D.; Chen, Z.; Ai, S.; Zhou, J.; Lu, L.; Yang, T. The Spatial Distribution and Influencing Factors of Urban Cultural and Entertainment Facilities in Beijing. Sustainability 2021, 13, 12252. [Google Scholar] [CrossRef]
- Rosenblatt, M. Remarks on Some Nonparametric Estimates of a Density Function. Ann. Math. Stat. 1956, 27, 832–837. [Google Scholar] [CrossRef]
- Parzen, E. On Estimation of a Probability Density Function and Mode. Ann. Math. Stat. 1962, 33, 1065–1076. [Google Scholar] [CrossRef]
- Ruckthongsook, W.; Tiwari, C.; Oppong, J.R.; Natesan, P. Evaluation of Threshold Selection Methods for Adaptive Kernel Density Estimation in Disease Mapping. Int. J. Health Geogr. 2018, 17, 10. [Google Scholar] [CrossRef]
- Karppa, M.; Aumüller, M.; Pagh, R. DEANN: Speeding up Kernel-Density Estimation Using Approximate Nearest Neighbor Search. arXiv 2022, arXiv:2107.02736. [Google Scholar]
- Wang, J.; Liu, Y.; Chang, J. An Improved Model for Kernel Density Estimation Based on Quadtree and Quasi-Interpolation. Mathematics 2022, 10, 2402. [Google Scholar] [CrossRef]
- Hansen, W.G. How Accessibility Shapes Land Use. J. Am. Inst. Plan. 1959, 25, 73–76. [Google Scholar] [CrossRef]
- Kwan, M.-P.; Murray, A.T.; O’Kelly, M.E.; Tiefelsdorf, M. Recent Advances in Accessibility Research: Representation, Methodology and Applications. J. Geogr. Syst. 2003, 5, 129–138. [Google Scholar] [CrossRef]
- Geurs, K.T.; van Wee, B. Accessibility Evaluation of Land-Use and Transport Strategies: Review and Research Directions. J. Transp. Geogr. 2004, 12, 127–140. [Google Scholar] [CrossRef]
- Martens, K. Justice in Transport as Justice in Accessibility: Applying Walzer’s “spheres of Justice” to the Transport Sector. Transportation 2012, 39, 1035–1053. [Google Scholar] [CrossRef]
- Moya-Gómez, B.; Salas-Olmedo, M.H.; García-Palomares, J.C.; Gutiérrez, J. Dynamic Accessibility Using Big Data: The Role of the Changing Conditions of Network Congestion and Destination Attractiveness. Netw. Spat. Econ. 2018, 18, 273–290. [Google Scholar] [CrossRef]
- Liu, L.; Porr, A.; Miller, H.J. Realizable Accessibility: Evaluating the Reliability of Public Transit Accessibility Using High-Resolution Real-Time Data. J. Geogr. Syst. 2023, 25, 429–451. [Google Scholar] [CrossRef]
- Ma, M.; Bian, Z.; Gao, J.; Yang, H.; Chow, J.; Ozbay, K. A Multi-Dimension and High-Granularity Equity Measurement for Transportation Services through Accessibility and Reliability. arXiv 2024, arXiv:2501.14761. [Google Scholar]
- Song, J.-H.; Li, M.-N.; Cai, S.; Wang, P. The Measurement and Spatial Differentiation Pattern of Traffic Accessibility in Hainan. Sci. Geogr. Sin. 2017, 37, 1507–1516. [Google Scholar] [CrossRef]
- Yang, Y.-B.; Deng, Q. Study on the Spatial Distribution Pattern and Highway Accessibility of Red Villages in Hunan Province. Resour. Environ. Yangtze Basin 2022, 31, 793–804. [Google Scholar]
- Chen, F.; Li, J.-F.; Ji, X.-F. The Impact of High-speed Railway on the Spatial Pattern of Regional Tourism Transport Accessibility. J. Transp. Syst. Eng. Inf. Technol. 2016, 16, 225–230+247. [Google Scholar] [CrossRef]
- Li, B.-C.; Wang, C.-H.; Li, L.; Liu, Q.; Wang, M. The Influence of High-Speed Railways on Accessibility of Tourism in the Region—A Case Study of Southern Anhui International Cultural Tourism Destination. Econ. Geogr. 2016, 36, 182–191. [Google Scholar] [CrossRef]
- Sun, Q. Study on the Spatial Relationship between Traffic Accessibility and Tourism Economic Linkage: Taking Daxi High-speed Railway as an Example. Econ. Probl. 2023, 4, 95–104. [Google Scholar] [CrossRef]
- Yang, X.-Z.; Feng, L.-X.; Zhang, K. The Impact of Transportationt on Accessibility of Tourism Scenic Region of Cross-border Tourism Region: A Case Study of Dabieshan Mountain. Sci. Geogr. Sin. 2013, 33, 693–702. [Google Scholar] [CrossRef]
- Wang, L.; Cao, X.-S.; Hu, L.-L. Research on the impact of tourist attractions accessibility on tourist flow in different travel times: A case study of Xi’an city. Hum. Geogr. 2021, 36, 157–166. [Google Scholar] [CrossRef]
- Piras, G.; Muzi, F.; Zylka, C. Integration of BIM and GIS for the Digitization of the Built Environment. Appl. Sci. 2024, 14, 11171. [Google Scholar] [CrossRef]
- Zou, J.-Q.; Ming, Q.-Z.; Liu, A.-L.; Zheng, B.-M.; Shi, P.-F.; Luo, D.-S. Spatial distribution pattern of classic red tourism scenic spots and heterogeneity of its influencing factors in China. J. Nat. Resour. 2021, 36, 2748–2762. [Google Scholar] [CrossRef]
- Zhong, Y.-X.; Liu, Y.; Lai, G.-Y. The Study on Accessibility and Spatial Structures for Red Tourist Attractions in Jiangxi Province. J. Jiangxi Norm. Univ. (Nat. Sci.) 2011, 35, 208–212. [Google Scholar] [CrossRef]
- Zhao, X.; Lee, J.; Hong, K. A Comparative Analysis of Museum Accessibility in High-Density Asian Cities: Case Studies from Seoul and Tokyo. Buildings 2023, 13, 1886. [Google Scholar] [CrossRef]
- Zhao, Z.; Li, X.; Xu, Y.; Yang, S.; Jiang, Y.; Wang, S. Evaluating Spatial Accessibility of Cultural Urban Land Use by Using Improved 2SFCA Method in Xi’an, China. Heliyon 2022, 8, e11993. [Google Scholar] [CrossRef]
- Wang, S.; Yang, S.; Xu, Y.; Zhao, Z.; Jiang, Y.; Li, X. Comparative Study of Cultural Space Characteristics: Inside Areas of Xi’an 2nd Ring Road, China, and Manhattan Borough. J. Urban Plann. Dev. 2021, 147, 04021045. [Google Scholar] [CrossRef]
- Shanghai Municipal Bureau of Statistics; Survey Office of the National Bureau of Statistics in Shanghai. Shanghai Statistical Bulletin on National Economic and Social Development, 2024; Statistical Theory and Practice; Shanghai Municipal Bureau of Statistics: Shanghai, China; Survey Office of the National Bureau of Statistics in Shanghai: Shanghai, China, 2025; pp. 43–52.
- Mei, Y.; Wang, S.; Gong, M.; Chen, J. Urban Traffic Dominance: A Dynamic Assessment Using Multi-Source Data in Shanghai. Sustainability 2024, 16, 4956. [Google Scholar] [CrossRef]
- Liu, R.-W. Red Culture: The Spiritual Pillar of the Chinese Nation. Red Flag Manuscr. 2013, 4–9, 1. [Google Scholar]
- Shanghai Municipal People’s Government. Notice of the Shanghai Municipal People’s Government on the Publication of the “List of Red Cultural Resources of Shanghai (First Batch).”; Bulletin of the Shanghai Municipal People’s Government: Shanghai, China, 2022; pp. 3–34.
- Pan, M.; Quan, H.; Ma, X.-Q. Blue Book on the Inheritance, Promotion, Protection and Utilization of Red Cultural Resources in Shanghai, 2021–2022; Shanghai Academy of Social Sciences Press: Shanghai, China, 2023. [Google Scholar]
- Shanghai Municipal Transportation Commission. Annual Changes in Shanghai’s Integrated Transportation in 2021 Under the Impact of the Pandemic. Available online: https://jtw.sh.gov.cn/xwfb2/20221228/ed0d52a414674acea0cde3e569f19add.html (accessed on 29 May 2025).
- Shanghai Municipal Transportation Commission. Reply from the Municipal Transportation Commission to the Proposal on Practicing the “Green” Concept and Building a “Cycling” City. Available online: https://jtw.sh.gov.cn/jyjabljg/20180605/0010-4819.html (accessed on 9 March 2025).
- The State Council of the People’s Republic of China. “Shanghai 2040” Plan: Enhancing People’s Sense of Well-Being. Available online: https://www.gov.cn/xinwen/2016-08/23/content_5101522.htm (accessed on 5 March 2025).
- Shanghai Municipal Bureau of Statistics; Leading Group Office of the Seventh National Population Census of Shanghai. Communiqué on Major Data of the Seventh National Population Census of Shanghai; Jiefang Daily: Shanghai, China, 2021; Volume 8.
- Gong, P.; Chen, B.; Li, X.; Liu, H.; Wang, J.; Bai, Y.; Chen, J.; Chen, X.; Fang, L.; Feng, S.; et al. Mapping Essential Urban Land Use Categories in China (EULUC-China): Preliminary Results for 2018. Sci. Bull. 2019, 65, 182–187. [Google Scholar] [CrossRef]
- Berke, O. Exploratory Disease Mapping: Kriging the Spatial Risk Function from Regional Count Data. Int. J. Health Geogr. 2004, 3, 18. [Google Scholar] [CrossRef][Green Version]
- Wang, H.-B.; Yang, R.-R. Spatial distribution characteristics of toponymic landscape in Baoding. J. Arid Land Resour. Environ. 2018, 32, 99–105. [Google Scholar] [CrossRef]
- Silverman, B.W. Density Estimation for Statistics and Data Analysis; Routledge: New York, NY, USA, 2018; ISBN 978-1-315-14091-9. [Google Scholar]
- Research Group of the Party History Research Office of the CPC Shanghai Municipal Committee; Yan, A.-Y. A Study on the Inheritance, Promotion, Protection, and Utilization of Red Resources in Shanghai. Shanghai Party Hist. Party Build. 2023, 5, 3–10. [Google Scholar] [CrossRef]
- Wang, S.; Zhang, Y.; Xu, Y.; Yan, S. A Quantitative Analysis of Inequality of Urban Cultural Space Distribution in Xi’an. Sci. China Technol. Sci. 2019, 62, 502–510. [Google Scholar] [CrossRef]


Disclaimer/Publisher’s Note: The statements, opinions and data contained in all publications are solely those of the individual author(s) and contributor(s) and not of MDPI and/or the editor(s). MDPI and/or the editor(s) disclaim responsibility for any injury to people or property resulting from any ideas, methods, instructions or products referred to in the content. |
© 2025 by the authors. Licensee MDPI, Basel, Switzerland. This article is an open access article distributed under the terms and conditions of the Creative Commons Attribution (CC BY) license (https://creativecommons.org/licenses/by/4.0/).