Article

Mechanical Performance Evaluation and Strengthening of Rectangular RC Columns with Deficient Lap Splices: Monotonic Loading Tests and Equivalent Plastic Hinge Modeling

by
Yuheng Zhao
1,
Fangxin Jiang
2,
Xue Zhang
1,* and
Yufeng Guo
1
1
State Key Laboratory of Coastal and Offshore Engineering, Dalian University of Technology, Dalian 116024, China
2
China Building Technique Group Co., Ltd., Beijing 100013, China
*
Author to whom correspondence should be addressed.
Buildings 2025, 15(12), 1964; https://doi.org/10.3390/buildings15121964
Submission received: 10 May 2025 / Revised: 27 May 2025 / Accepted: 4 June 2025 / Published: 6 June 2025

Abstract

Reinforced concrete columns constructed prior to the 1970s often exhibit deficient lap splices at the base, characterized by insufficient splice lengths. In response to the urgent need for an efficient seismic assessment of these vulnerable structural elements, this study proposed a modelling method for lap-spliced columns. Typically, numerical simulations of columns with lap splices require the cross-sections of the lap-spliced and non-lap-spliced zones to be established, a process that is complex and time-consuming. This paper proposes an equivalent distribution of curvature along the height of the column to represent the effect of lap splice defects on the mechanical behavior of columns, thereby reducing the modelling complexity of such components. Four large-scale column specimens with varying lap splice lengths were subjected to monotonic pushover loading to investigate the effect of splice length on failure modes, strain distribution, and displacement ductility. An active strengthening method was employed to improve the performance of columns with deficient lap splices. Applying lateral prestress to the strengthening devices improves the mechanical behavior of columns. The experimental results revealed that insufficient splice lengths lead to reduced ductility and stress-transfer capacity. The strengthened specimen demonstrated significantly improved ductility and enhanced stress-transfer efficiency, indicating a marked improvement in mechanical performance. The proposed equivalent plastic hinge model was established in OpenSees. A database was created to verify the accuracy of the model. The results showed the modelling method to be accurate.

1. Introduction

Earthquakes are critical disasters that cause severe financial losses and social damage. Past earthquakes have shown that large-scale destruction can occur due to the non-ductile behavior of critical components such as reinforced concrete (RC) columns [1,2]. Many existing buildings still contain RC columns that were designed according to outdated codes or without any seismic consideration, and these columns have seismic deficiencies in three aspects: (i) Insufficient lap splice length. The lap splice length should be sufficient to achieve effective stress transfer between lap-spliced rebar under lateral loading. In general, lap splices in columns built to the old codes were designed to transfer compressive forces. For example, in ACI 318-56 [3], ACI 318-63 [4], and ACI 318-77 [5], the recommended minimum lap splice length for compression was 20db, 24db, and 30db (where db is the diameter of the longitudinal rebar). As a result, when the columns with inadequate lap splice length are subjected to lateral loads generated by earthquakes, slip between the longitudinal rebar occurs before the rebar yields, resulting in bond failure [6,7,8,9,10]. (ii) Lap joints located in the potential plastic hinge zone. The ductility and energy dissipation capacity of RC columns can be weakened if the lap splices are located at the plastic hinge zone [11,12]. Revised specifications over the last two decades (e.g., ACI 318-95 [13], CAN/CSA-S6-06 [14], and AASHTO [15]) do not allow for lap splices to be placed in potential plastic hinge zones. (iii) Wide spacing of transverse stirrups. Relatively wide spacing of transverse stirrups according to outdated codes does not provide sufficient confinement for concrete and longitudinal rebar, which can reduce the bond strength of lap splices [16,17].
Although the revised specifications propose an updated lap splice requirement, and lap splices are no longer used in the design of moment frames with special seismic requirements. There are still many RC columns in existing buildings structures around the world that suffer from inadequate lap splices. Previous studies focusing on the mechanical performance of lap splices have shown that structures built before 1970 with lap splices have a lap splice length of 20–24db [1,16,17,18,19,20]. From the existing studies, it can be concluded that bond brittle failure occurred in columns with a relatively short ls = 20db, 22db, and 30db at lateral drift ratios of 1.0% to 1.5% (where ls is the splice length), and that lap splice details such as spacing of transverse stirrups and splice methods could affect the overall behavior of lap spliced columns. Therefore, more efficient simulation methods are needed to evaluate the mechanical behavior of lap spliced columns. Meanwhile, effective strengthening of these structures has become more popular compared to reconstruction due to its economy and sustainability.
Extensive research has been conducted on the simulation methods for lap splices over the last 20 years. Tarquini et al. [21] introduced an equivalent stress–strain law for lap splices and applied it to RC structural walls with lap splices; the simulated results demonstrated the effectiveness of the proposed approach in capturing the peak strength and displacement capacity of the spliced units. Tariverdilo et al. [22] and Barkhordarty et al. [23] introduced a softening response into the stress–strain law of the rebar material model to simulate the strength degradation after bond failure of lap splices, and then they provided recommended constant parameter values for the rebar material model. Choi et al. [24] adopted pinching-related parameter values in modelling the lap-spliced rebar without considering the effect of rebar slip. The simulated mechanical response of columns with lap splices showed no strength degradation after the lateral peak loads were reached. They summarized the reason for errors as the inaccurate modelling of lap splices.
Although the previous modelling methods (using distributed plasticity by modelling with fiber-section) have shown feasibility, two limitations can be summarized: (i) Limited accuracy of proposed model parameter values; these models all need to be calibrated based on the experimental results. The accuracy of parameter modification can be affected by the sample size in the test database. However, a large amount of parameter correction work is time-consuming. (ii) Little consideration of the geometric and material properties of the columns; the existing models mainly focused on the local bond behavior of the lap splices; however, the geometric parameters such as the cross-section size can affect the performance of the columns. Therefore, in this paper, the authors proposed a theoretical equivalent plastic hinge model for columns with lap splices and applied it to a model verification. The model considers the lateral displacement of columns caused by bending moment and bond slip, but not the lateral displacement caused by shear force. This is because when considering columns with large shear span ratio (λ > 4, where λ is the shear span ratio), the contribution of shear force to lateral displacement can be neglected. The modelling method was achieved by converting the effect of lap splices into a plastic hinge with a specific length; by this means, no sophisticated modelling details of lap splices but a plastic hinge element with customized length was needed. Numerical models of specimens were established with OpenSees. A test database consisting of six rectangular columns with lap splices, including two specimens from this study and four specimens from the existing literature, was established to verify the accuracy of the proposed modelling method.
In contrast to conventional modeling approaches, the proposed methodology is founded on theoretical derivations that eliminate the need for extensive empirical parameter calibration. Furthermore, by incorporating the ForceBeamColumn element within the OpenSees framework, this approach enables customized definition of plastic hinge lengths, thereby providing enhanced operational flexibility and user adaptability compared to traditional modeling techniques.
In addition, a novel active strengthening technique is proposed. The key to strengthening lap splices is to increase the bond strength of the lap-spliced zone, as once slip occurs between lap-sliced rebar, the strength of the column can decrease rapidly. Although strengthening methods designed for columns constructed with continuous longitudinal rebar can be applied to lap-spliced columns, there are limitations. On the one hand, existing passive strengthening methods (i.e., the confinement is activated after the lateral deformation of columns), which are commonly achieved using CFRP, steel jackets, and a combination of these materials [25,26,27,28,29,30,31,32,33,34,35], do not provide sufficient lateral confinement; that is because the slip between lap-spliced rebar could occur before the lateral deformation of the columns. On the other hand, the active strengthening methods (lateral prestressing is applied outside the column) used for columns with continuous rebar fail to estimate the required prestressing force for different lap splice lengths. Harajli and Hantouche [36] proposed a method to strengthen wall-type bridge piers by penetrating the prestressed anchor rods into the piers; they also provided equations to calculate the required active prestress; the test results showed a good strengthening effect. When considering the square columns with lap splices, penetrating a pretensioned steel anchor at the lap splice zone may decrease the original strength of the columns. Therefore, a strengthening device that can be placed outside the column body was proposed in this study, and an experiment was carried out on four large-scale lap-spliced columns to verify the strengthening effect.
This paper is organized as follows: Section 2 and Section 3 presents tests with four large-scale specimens (including one strengthened specimen) that were carried out; static pushover with a concreted force was chosen as the loading pattern because pushover analysis is recommended as an effective method to evaluate the structural limit state according to HAZUS [37] and Eurocode 8 [38]. In Section 4, a theoretical analysis of an equivalent plastic hinge model designed for lap-spliced columns is presented, and a modelling method for columns with lap splices is proposed. Section 5 presents a verification of the proposed modelling method. The conclusions are given in Section 6.

2. Experiment Program

In this section, four large-scale specimens are designed and tested under lateral monotonic loads with concentrated force pattern. Details of the experimental program are introduced as follows:

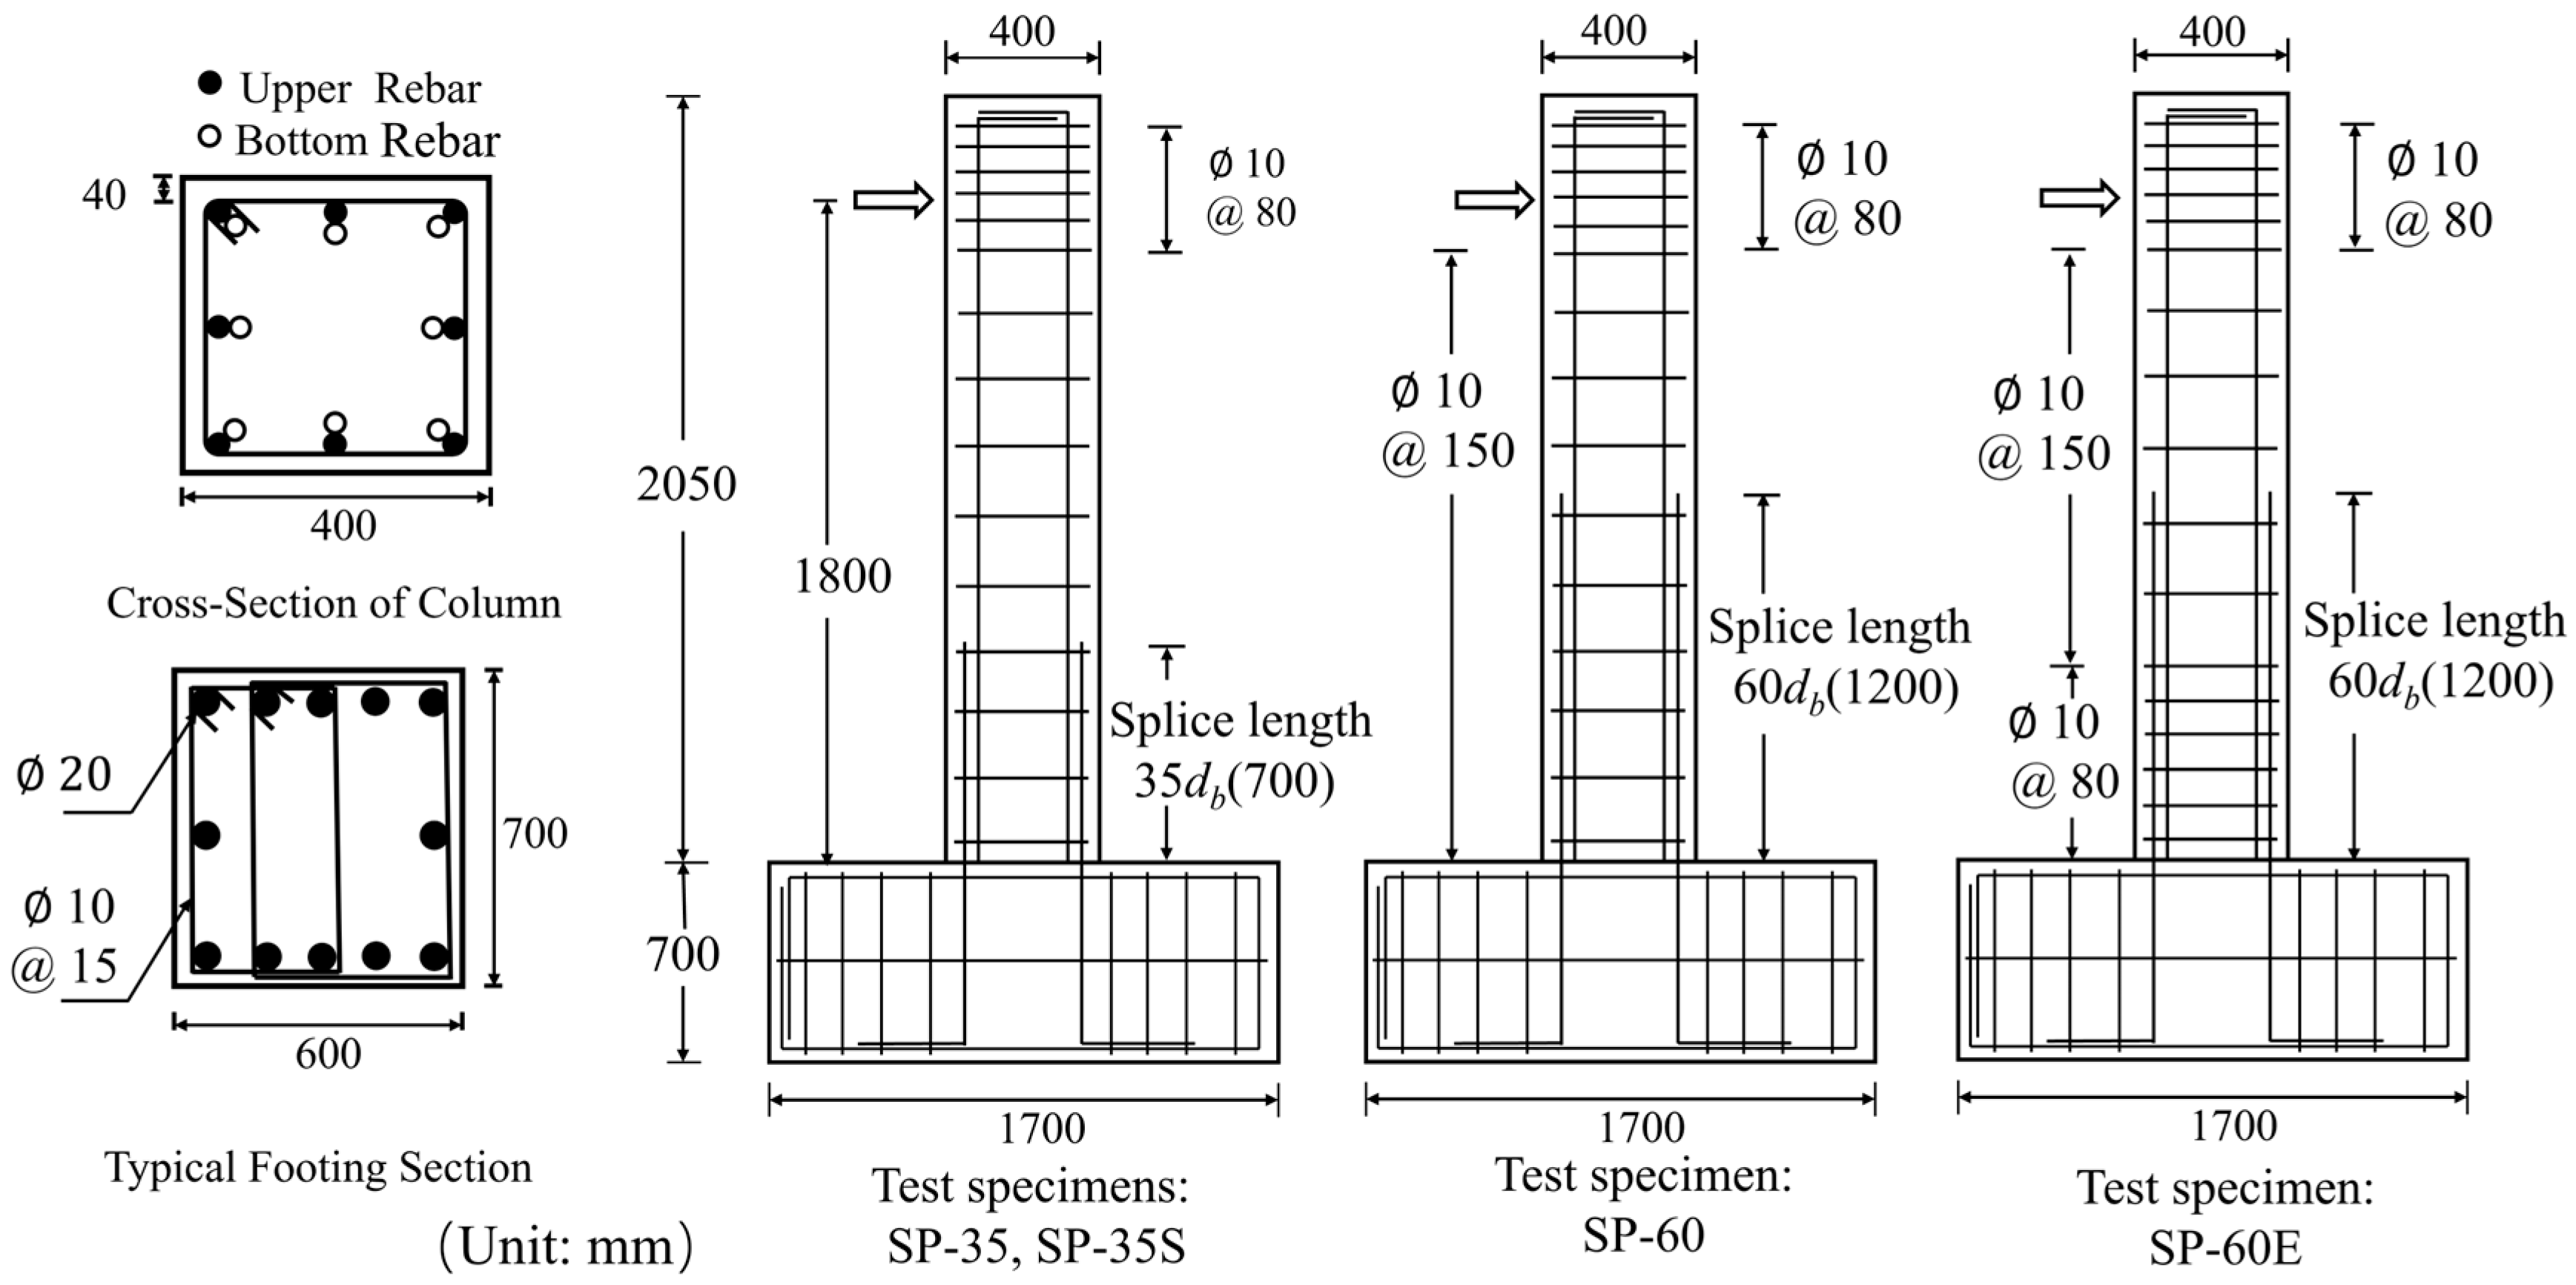
2.1. Specimen Design and Materials

All specimens used HRB400-grade steel rebar, stirrups, and longitudinal lap-spliced rebar with diameters of 10 mm and 20 mm, respectively. The yield strength fy and ultimate strength fu of the 20 mm rebar are 447.61 MPa and 637.29 MPa, respectively. The yielding strength (fy) and ultimate strength (fu) of the 10 mm rebar are 479.71 MPa and 614.33 MPa, respectively. The elastic modulus of HRB400 rebar is 200 GPa. All of these specimens were made of grade C30 concrete. Compression tests were performed on the first day of testing and the average actual compressive strength of the concrete was found to be fc’ = 20.6 MPa.
Specimens in this test are shown in Figure 1. All these specimens have the same cross-sectional dimensions of 400 × 400 mm. The minimal splice length lsm,ACI for the designed specimens in this test is 920 mm, which is the minimal splice length of Class B lap splice specified in ACI 381-14 [39]. Two splice lengths of the longitudinal rebar were adopted in this test (i.e., ls = 35db, ls = 60db, where db denotes diameter of longitudinal rebar), which were equivalent to 76% and 130% of lsm,ACI, respectively. The shear span length is 1800 mm for all specimens. In the specimen names, “SP” denotes static pushover loads; “35” and “60” denote the splice length, ls = 35db and ls = 60db, respectively. “E” denotes the seismic details at the bottom of the column. The specimen SP-60E is designed for contrast.
Stirrups with 90-degree end hooks were adopted to confine the longitudinal rebar. The bottom rebar was extended to the bottom of the base; with a standard 90-degree hook, the rebar can be fully confined in the footing. The concrete cover was selected as 400 mm. Stirrups of SP-35 and SP-60 were placed with a spacing s = 150 mm, while SP-60E has a smaller spacing of 80 mm within a height of 500 mm from the bottom of the column.

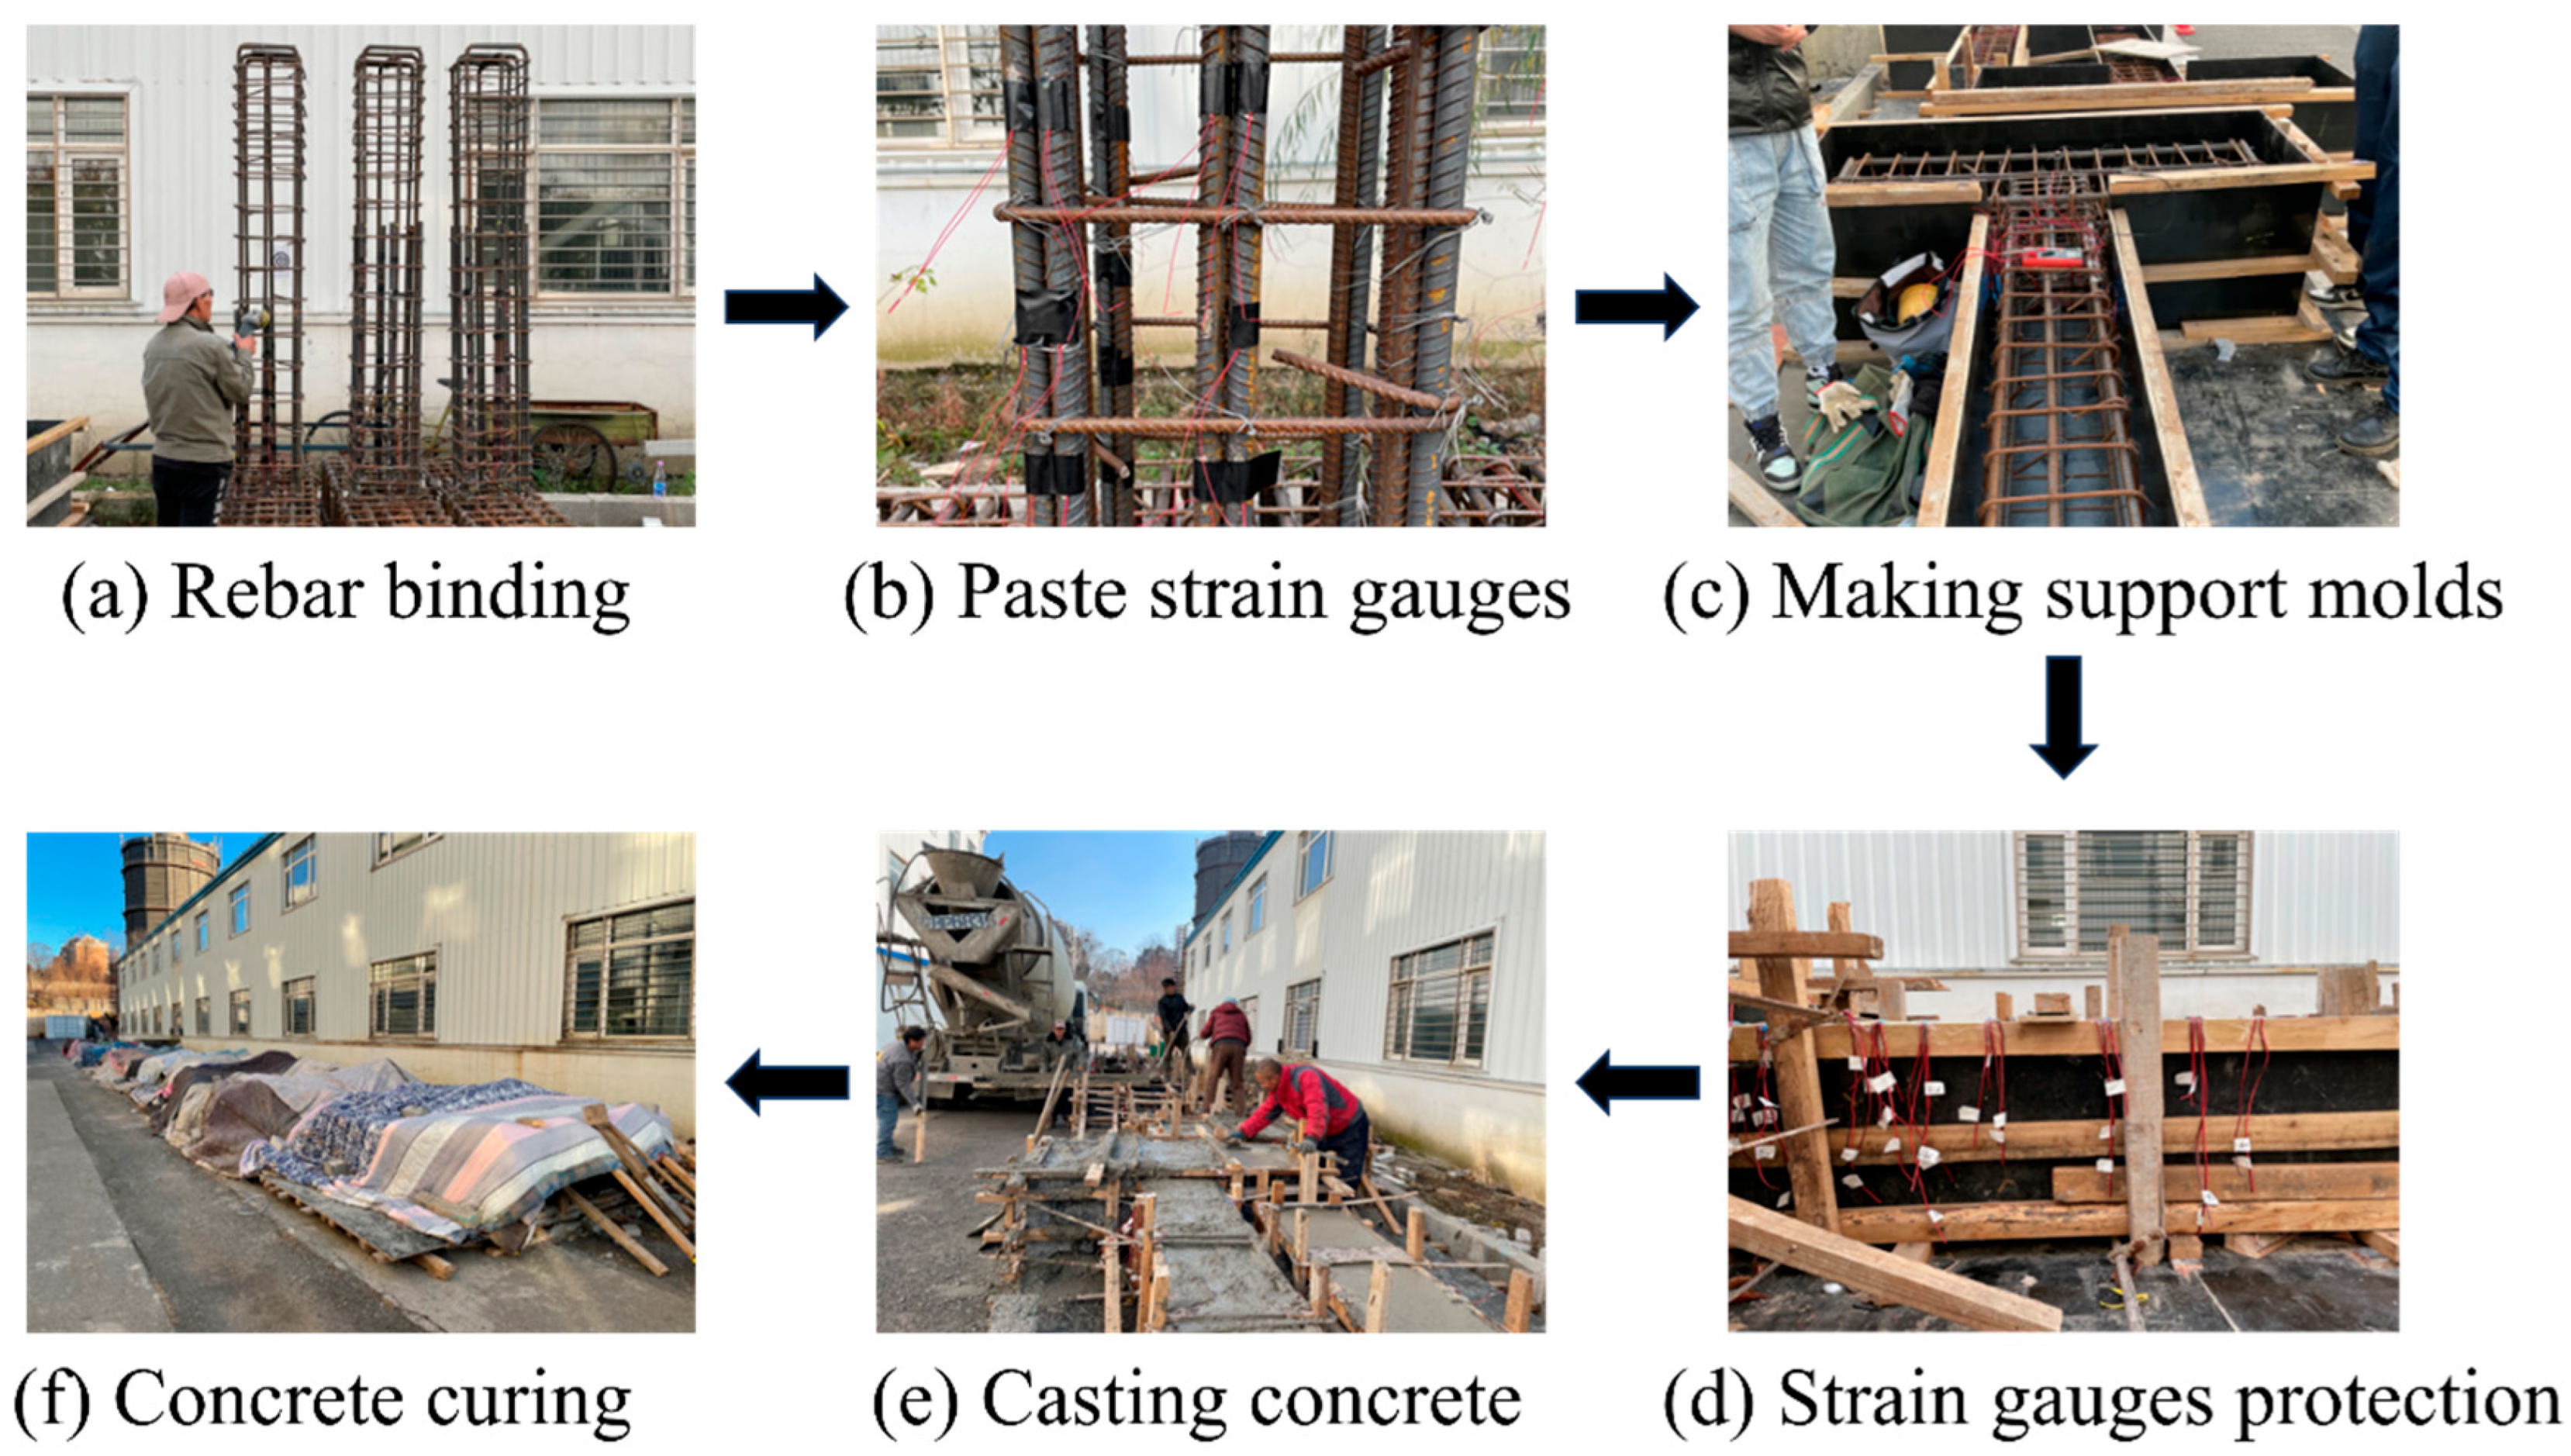
2.2. Construction Process

The construction process of specimens can be seen in Figure 2. Firstly, tie the steel cage, then paste strain gauges in the overlapping area of the longitudinal steel bars, place the steel cage in a wooden mold, protect the wires of the strain gauges, pour commercial C30 concrete, and, finally, perform specimen curing.

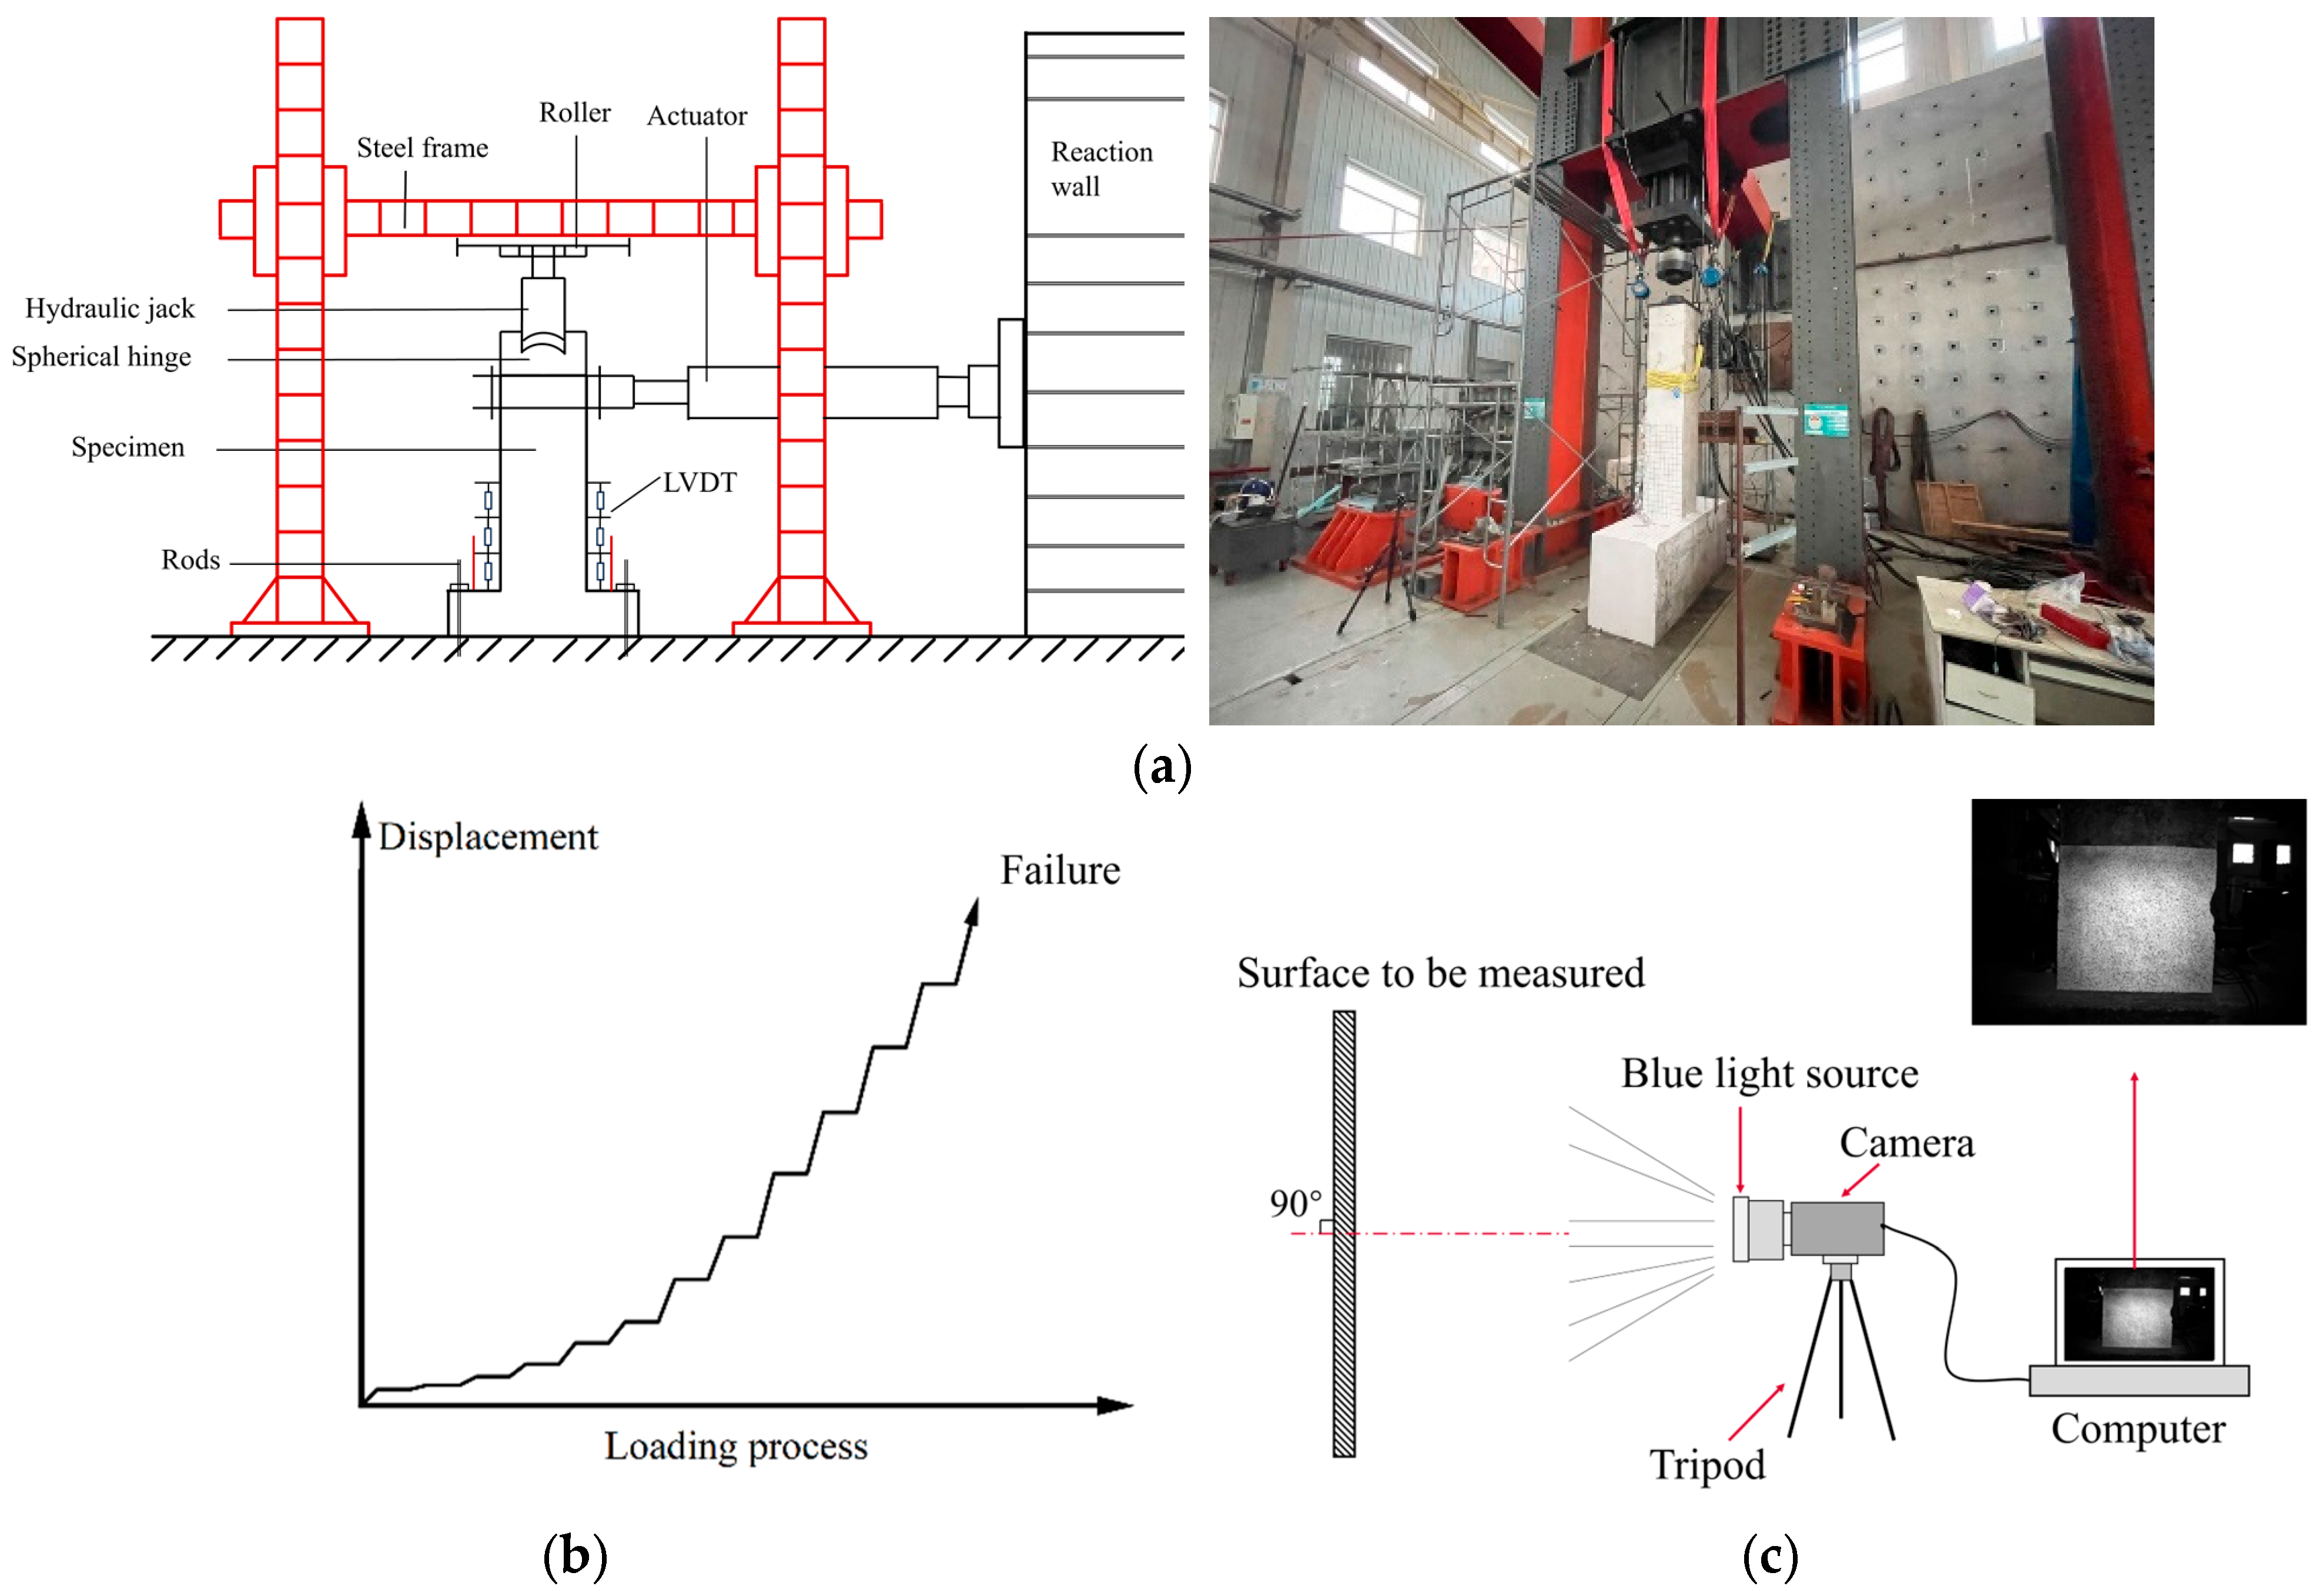
2.3. Loading and Instrumentation

The experimental loading process is illustrated in Figure 3. The hydraulic actuator was positioned 1800 mm above the column base elevation. As delineated in Figure 3b, the test protocol employed a progressively increasing displacement pattern with target lateral drift ratios sequenced at 0.25%, 0.35%, 0.5%, 0.75%, 1.0%, 1.5%, 2%, 2.5%, 3.5%, 5%, and 7%. This stepwise loading scheme maintained an incremental scaling factor of 1.25–1.5 between successive drift levels [40], ensuring controlled damage progression during testing. The selection of monotonic pushover loading aligns with the primary objective of establishing baseline strengthening effectiveness. However, practitioners should exercise caution when extrapolating these results to seismic retrofit applications until cyclic performance validation is completed.
The test is terminated once the load-carrying capacity of the specimen decreases to below 85% of its peak value [41]. One hydraulic jack with a maximum capacity of 1000 kN was placed on top of the specimen to provide an axial load (N). This load is maintained by keeping the hydraulic pressure of the machine uniform. The test specimens consist of a footing and a column. The footing is a capacity-protected member that secures the specimen to the laboratory’s strong floor using a steel beam and threaded rods. The two-dimensional digital image correlation (2D-DIC) method was adopted for this test to capture the displacement of the bottom of the column, as shown in Figure 3c. The basic principle of DIC involves analyzing speckle images of the measured surface at previous and subsequent moments of deformation. The computer divides the speckle image measurement domain and compares the positions of speckles of the same shape at two different times to obtain the displacement vector of the measured surface. The speckle image taken before deformation is referred to as the reference image, while the speckle image taken after deformation is referred to as the deformed image [42]. The monitored area is a 400 × 400 mm area at the bottom of the column.
Strain gauges were used to monitor the strain level of longitudinal rebar; it should be noted that this study mainly focused on the stress transfer between the lap-spliced longitudinal rebar; thus, the strain gauges on the stirrups were omitted. Details of the strain gauges are shown in Figure 4. The values from S1 to S9 are 100 mm, 200 mm, 300 mm, 400 mm, 550 mm, 700 mm, 867 mm, 1034 mm, and 1200 mm, respectively.

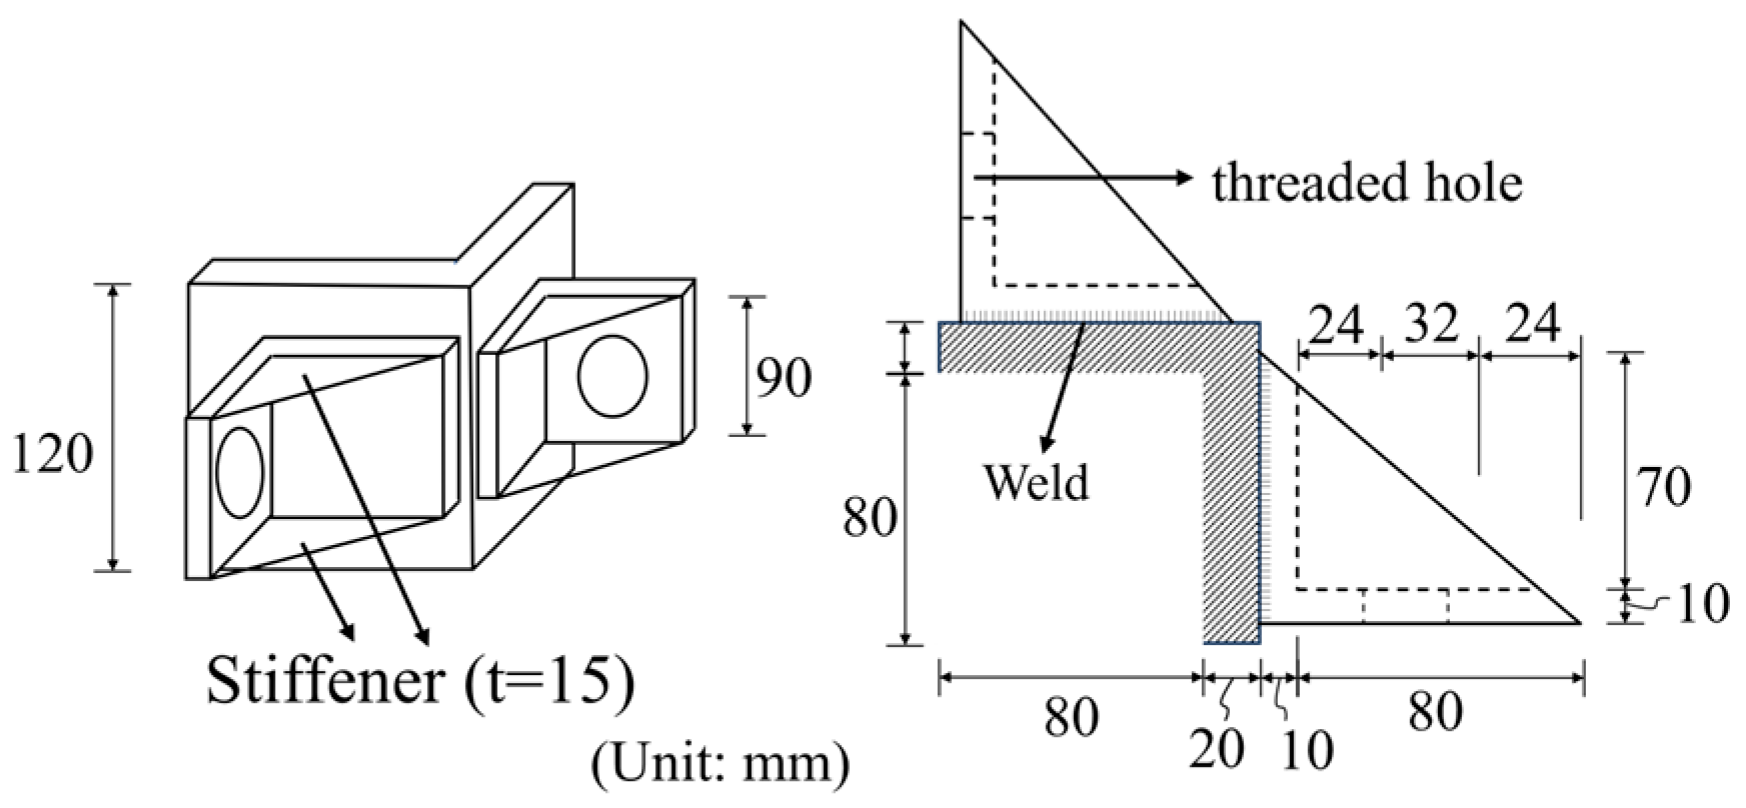
2.4. Strengthening Method

The specimen designated SP-35S was strengthened with an active strengthening method. As demonstrated in Figure 5, the strengthening system utilizes a multi-layer configuration of angle steel and threaded rods, which are positioned in a strategic manner to provide additional lateral confinement to the reinforced concrete column. The angle steel and threaded rod combination functions to enhance the lateral stability of the column by applying a uniform, external restraining force, particularly at the critical corners of the column. In this approach, the rebar located at the corner of the column are identified as the primary strengthening elements, these areas are typically more vulnerable to stress concentrations. The total required strengthening force can be calculated using Equation (1). Detailed explanations can be seen as follows [43]:
The author chose the lap-spliced rebar at the corner of the column as the mainly strengthening object; this is because when the rebar at the corners is subjected to a lateral force, rebar in the center is subjected to the lateral pressure transmitted by the concrete. As shown in Figure 5, the tensile force (Tb) is induced in the reinforcement of the isolation body under the action of the external load, it can be expressed as Tb = Ab × fs, where Ab denotes the area of one spliced rebar, and fs denotes the steel stress to be developed in the spliced bars. For seismic bond strengthening, the actual yield strength is typically higher than the design yield strength to prevent bond failure due to high steel stresses or strains caused by strong earthquakes. A splice stress fs equal to either 1.85fyd or 1.25fya is recommended [43]; note that fyd and fya denote the design strength and actual strength of rebar, respectively. As shown in Figure 5b, according to the force balance of the isolation body, the relationship between the tensile force (Tb) and the average bond stress (ua) can be obtained, as shown in Equation (1).
T b = A b f s = A b ( 1.85 f y d ) = u π d b l s
In general, the bond stress (ua) can be affected by many factors. A well-known equation for calculating the average bond strength at bond failure, which is proposed by Orangun et al. [44], is introduced, as seen in Equation (2).
u a f c ( M P a ) = 0.1 + 0.25 c d b + 4.15 d b l s + A t r f y t r 41.6 s n s d b
where fc = design concrete compressive strength, c = smaller of bottom concrete cover cb or 1/2 clean spacing ch between the spliced bars, db = diameter of one spliced bar, ls = splice length, and Atr, s, and fytr denote the area, spacing, and yield strength of transverse stirrups, respectively. ns denotes the number of spliced rebar.
From Equation (2) it can be seen that the confining effect of stirrups is quantified by the term Atrfytr/s. In existing columns with lap splices, the stirrups within the splice region are often characterized by either insufficient cross-sectional area or excessive spacing. This implies that the passive confinement contributed by these sparsely distributed stirrups in aged columns may be safely neglected through conservative estimation. By establishing an analogy between the active lateral force and the passive confining force generated by stirrups, the conventional term Atrfytr/s can be equivalently substituted with Fl/ls, where Fl denotes the total required lateral force in the lap-spliced region. This methodology was also implemented in the research of Hantouche et al. [36]. By substituting Equation (2) into Equation (1) and replacing Atrfytr/s with Fl/ls, the following modified formulation is obtained:
F l = 41.6 n s l s d b 1.85 A b f y π d b L s f c ( M P a ) ( 0.1 + 0.25 c d b + 4.15 d b l s )
Equation (3) ignores the confining contribution of the stirrups, which is considered reasonable because for older columns the hoops are usually set at large spacings.
As shown in Figure 5d,e, the relationship between the required lateral force Fl and the required strengthening force FT (which is applied on the threaded rods of the strengthening device) can be obtained with the force balance of the isolated body.
F T , s u m = 2 F T = F i n
F l F i n = d b 4 d b + 2 2 c
According to Equations (1)–(5), the final equation to calculate the required strengthening force FT can be expressed as
F T = 20.8 ( 4 c + 4 2 d b ) l s 1.85 A b f y π d b l s f c ( M P a ) ( 0.1 + 0.25 c d b + 4.15 d b l s )
Through basic mechanical knowledge, the required lateral force can be converted into torque, the conversion relationship between lateral force and torque will change depending on the specific usage location. More details can be seen in Ref. [43].
Using the proposed design method, the total calculated pretension force for the SP-35S was found to be 964.16 kN. The position parameters of the strengthening devices are as follows: The height of angle steel B is 120 mm. The number of sets along the height is n = 3, meaning the required pretension force per set for each threaded rod is 321.39 kN. The spacing C is 40 mm. The details of the device used in this test are shown in Figure 6. Each anchor rod was fastened to two angle steels using nuts. The rods were pretensioned prior to the experimental program. The pretension force was attained using a torque meter and monitored simultaneously through strain gauges affixed to selected rods before installation. A spirit level was used to ensure that each set of devices was on the same horizontal line. After careful calculation, it was determined that the dimensions and material properties of the strengthening device satisfied the required mechanical specifications.

3. Experiment Results and Discussion
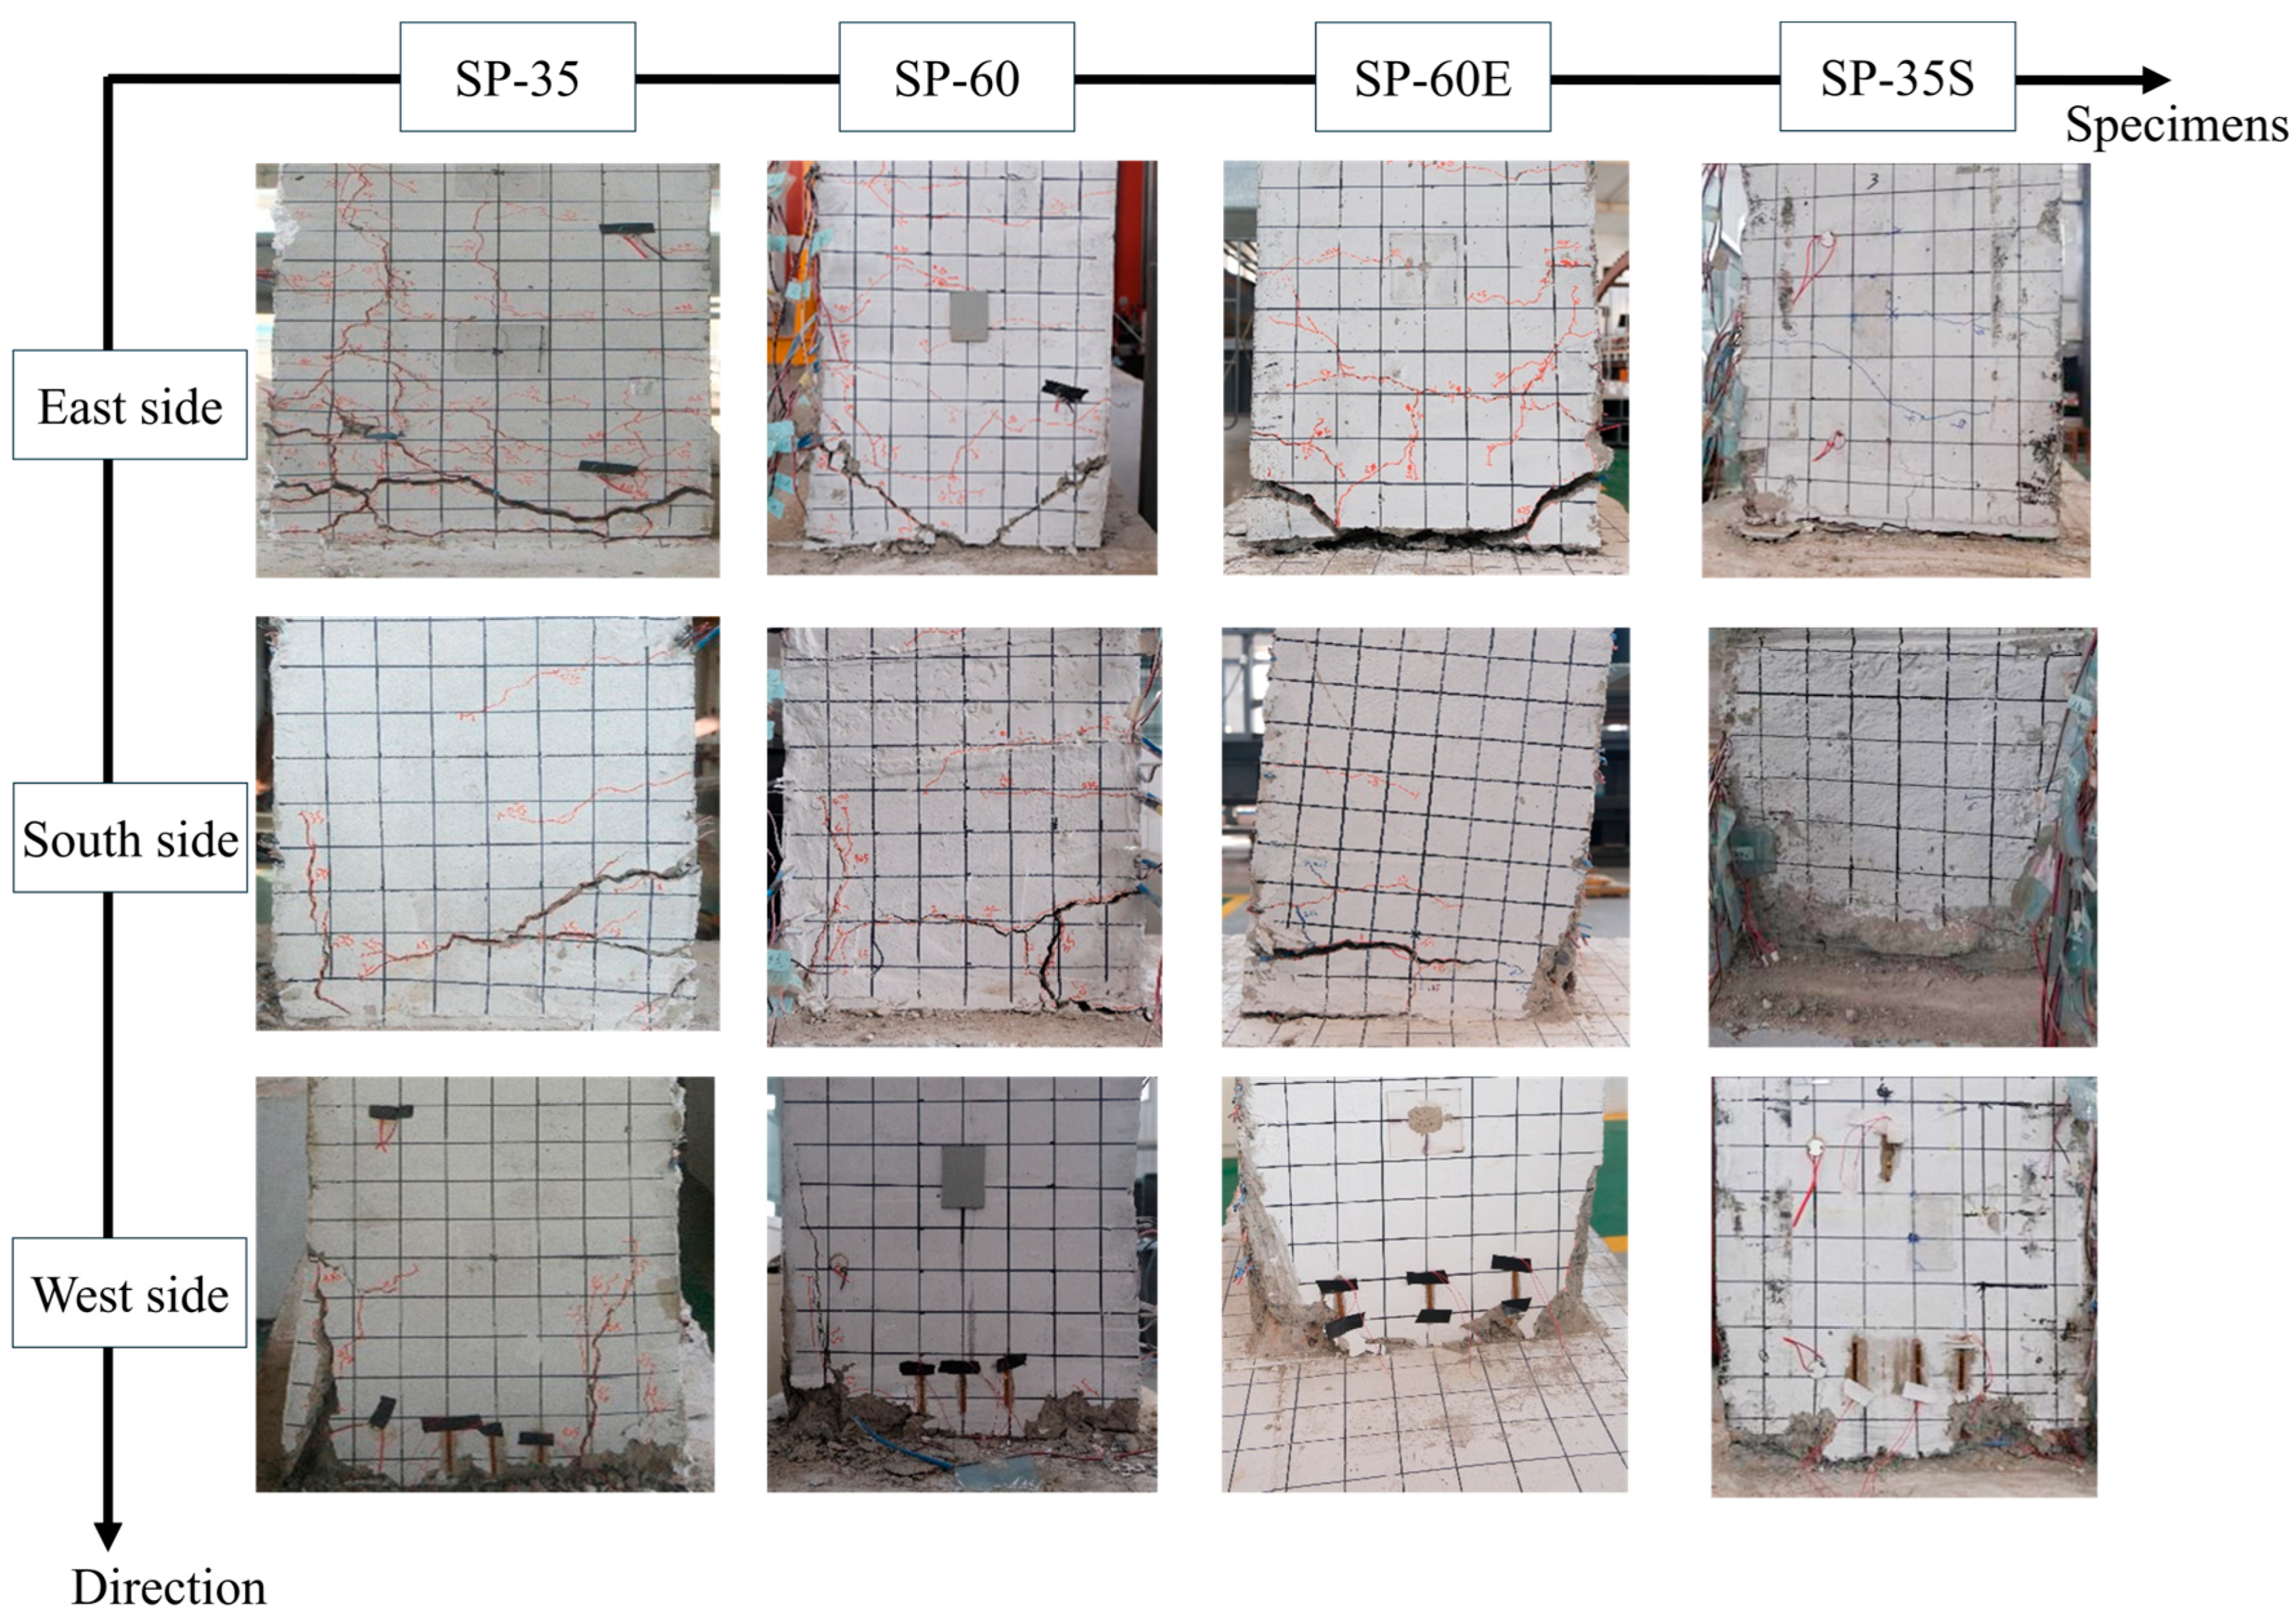
3.1. Failure Mode

The columns were subjected to lateral loads from east to west, with the south side perpendicular to the loading direction. For specimen SP-35, the first cracks appeared at a drift ratio of 0.25%. Clear horizontal cracks can be observed at heights ranging from 0 mm to 150 mm on the east side (the tensile side). Moreover, vertical splitting cracks can also be observed, indicating splitting failure. The concrete on the compressed side was cracked. For specimen SP-60, diagonal cracks were observed and only the concrete at the bottom of the compressed side was cracked. SP-60E showed a larger crack at the junction of the column and the pier due to the longer lap-spliced length and smaller spacing of transverse stirrups at the bottom of the column. No obvious cracks were observed on the east side of SP-35S, indicating that the column was well confined by lateral prestress. Figure 7 showed the typical failure phenomenon of all specimens.

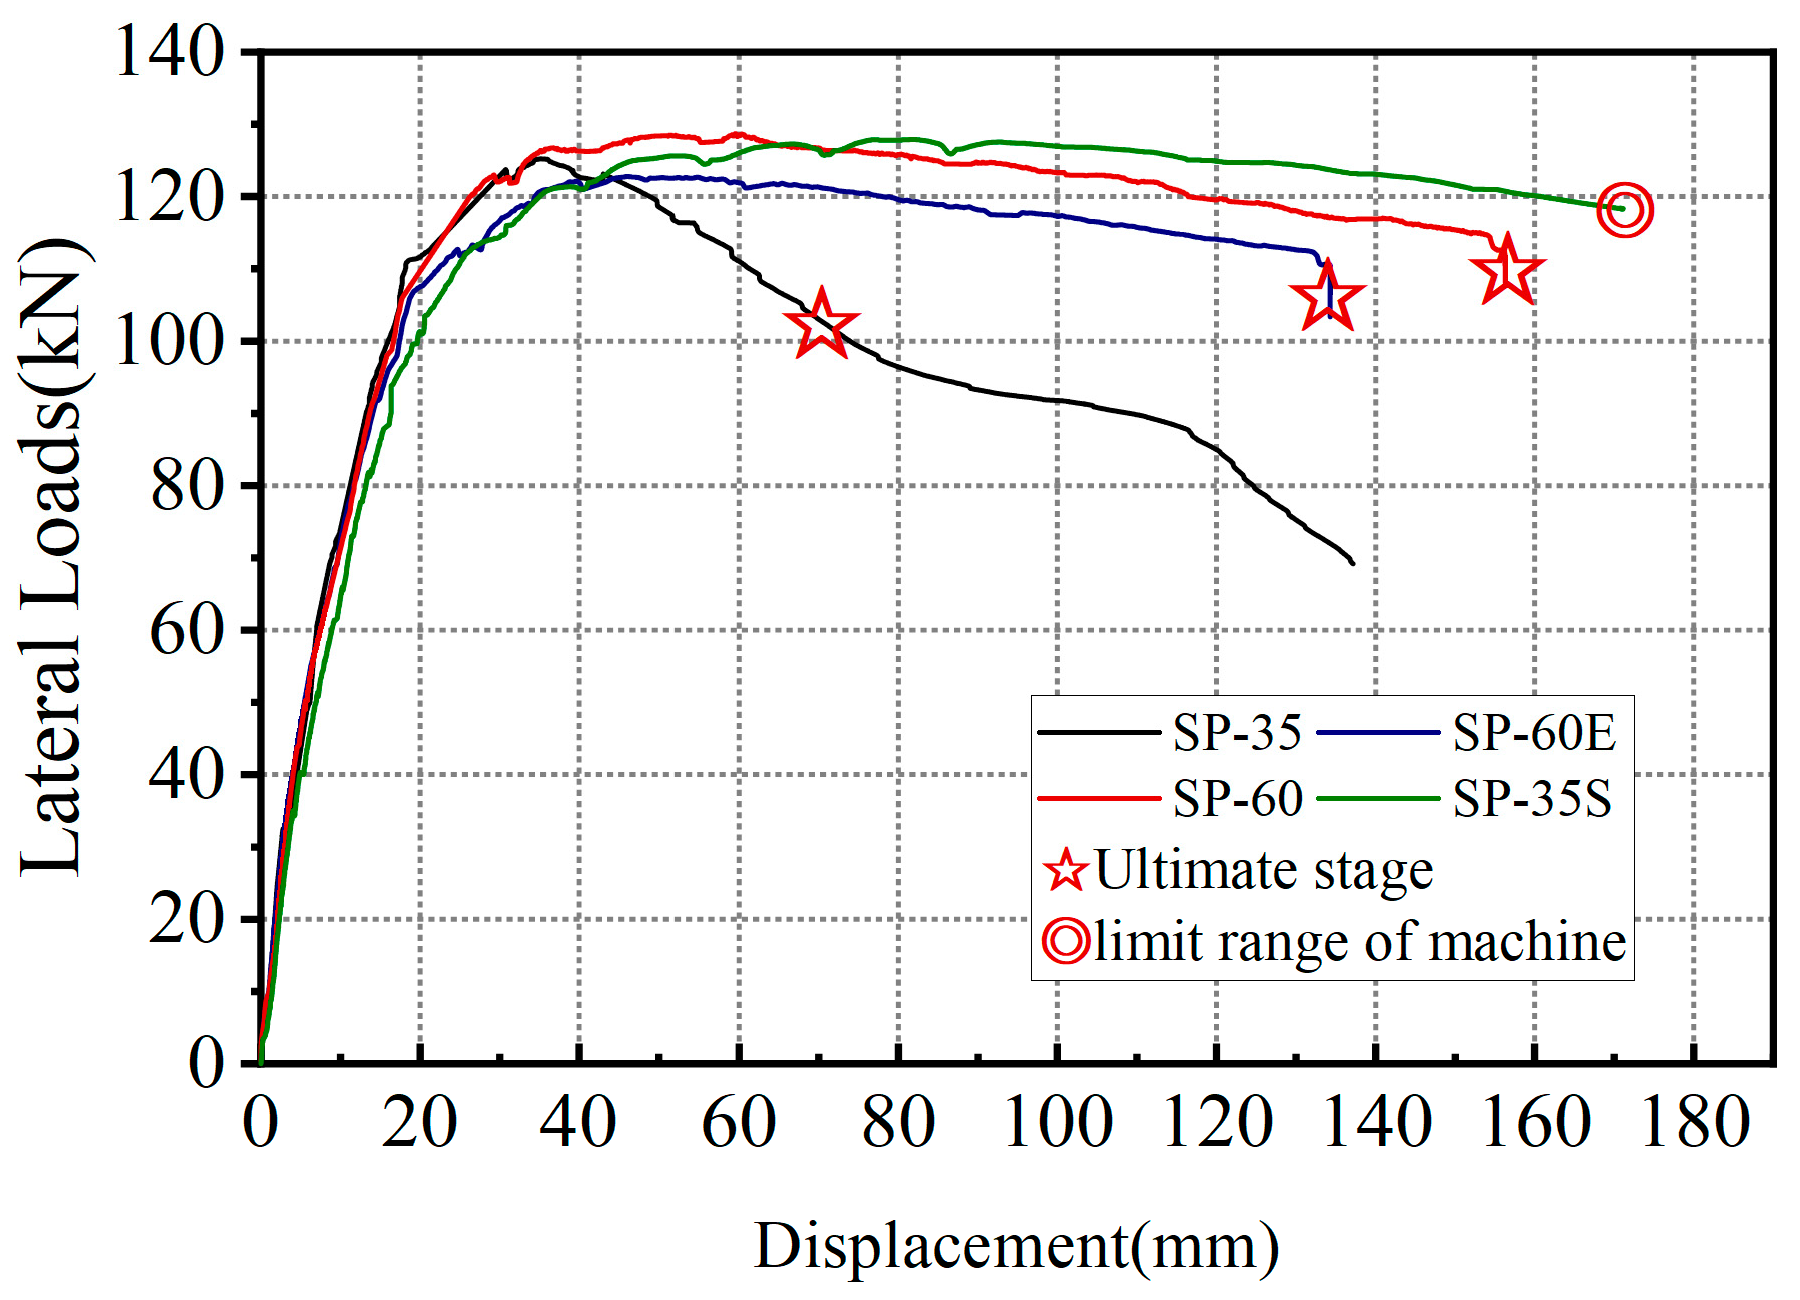
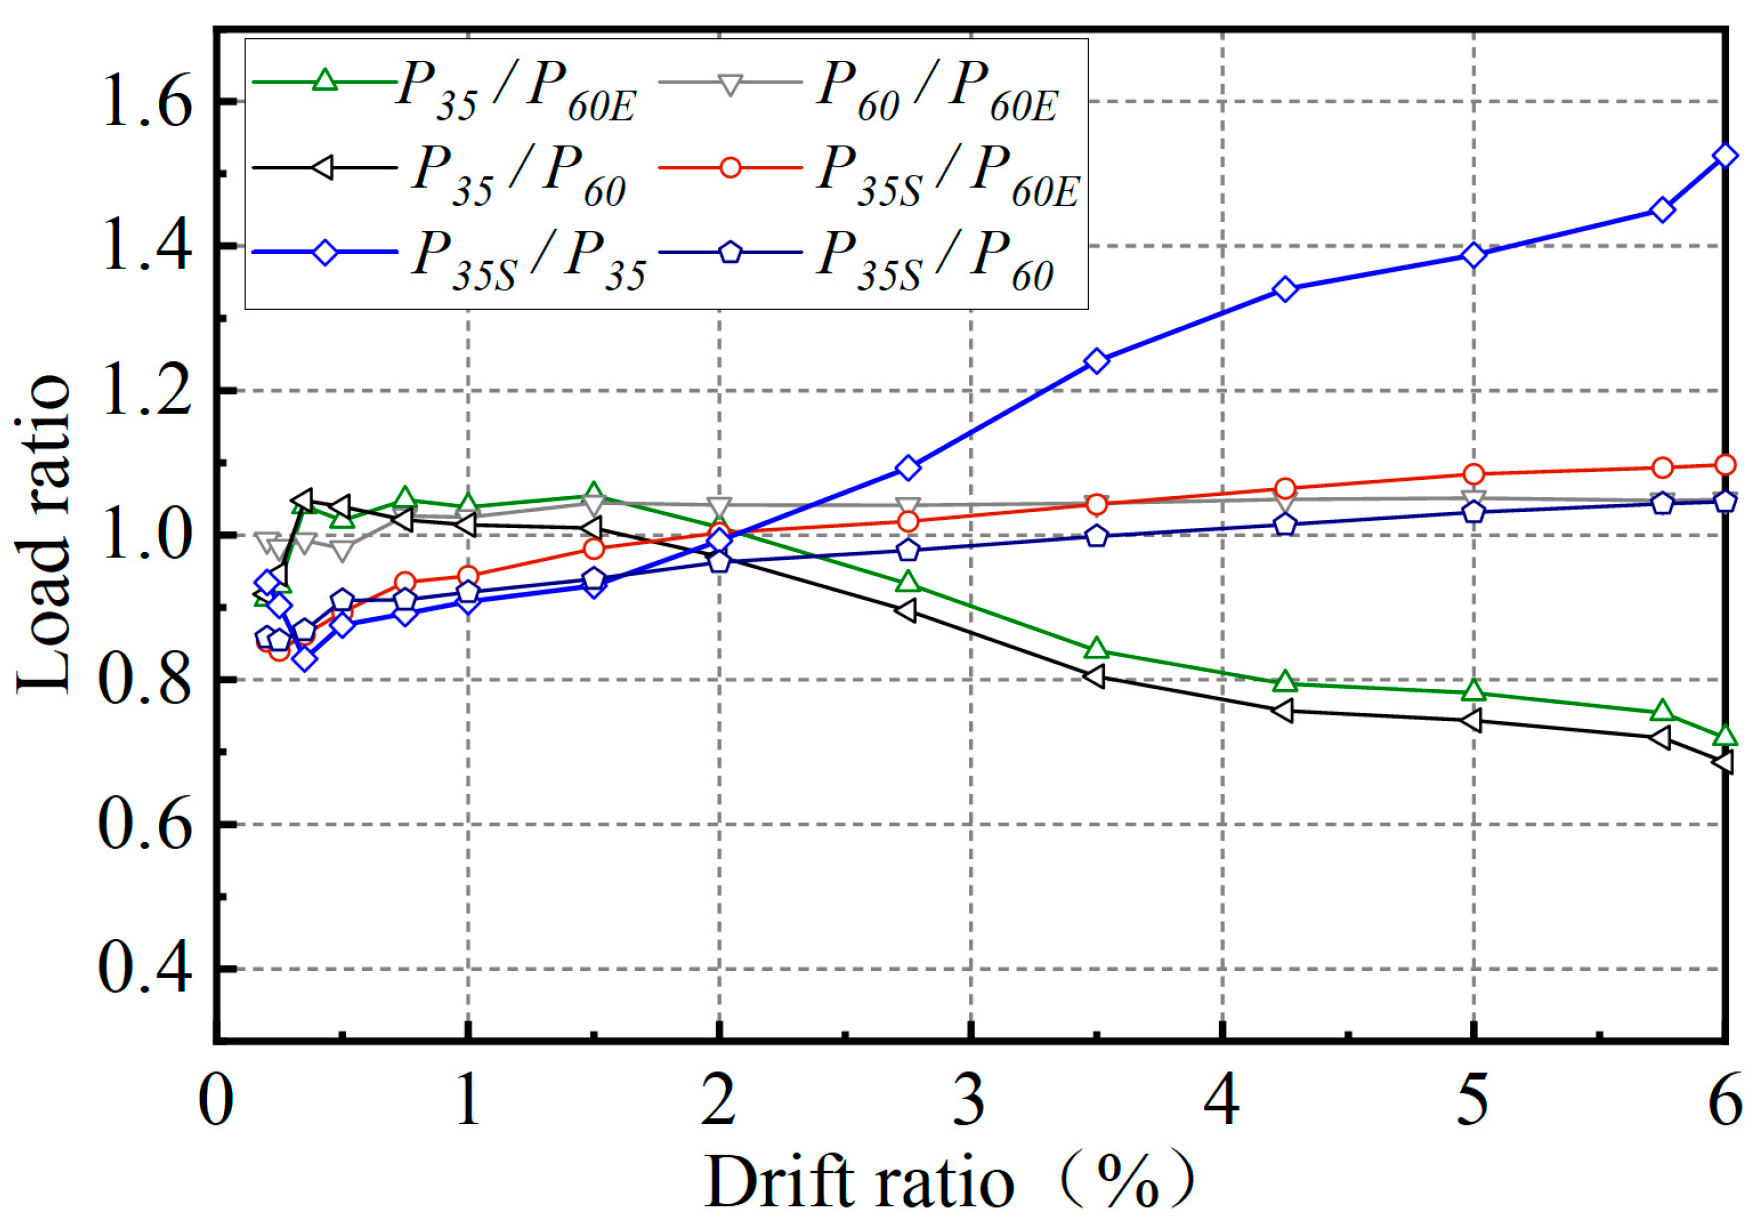
3.2. Load–Displacement Relationship

Table 1 shows the test results. It should be noted that the actual mechanical performance of the specimen SP-35S was better than the test results of this study because the machine had a limit, and the specimen SP-35S failed to reach its ultimate displacement. As a result, the nominal ultimate displacement of the SP-35S was smaller than the actual ultimate displacement. Figure 8 shows the load–displacement curves of the column specimens. The equivalent yield displacement, which is used to determine the displacement ductility, was calculated using the method proposed by Park [41].
No obvious difference was observed in the peak loads of SP-35S specimens compared to non-strengthened specimens, meaning that the peak loads are scarcely affected by the splice length. This is consistent with the conclusion of Kim et al. [11] that no significant reduction in peak load can be observed, but deformation capacity can decrease due to premature bond-splitting cracks occurring along the splice length. The loads of the SP-35 decreased rapidly, showing brittle failure at an ultimate displacement of 65.5 mm. This is because the SP-35 with a short splice length was more fragile than the 60db and strengthened columns. However, the loads sustained by the SP-35S remained stable for an extended period after reaching their maximum until the load machine reached its ultimate range. This indicates that the strengthened specimen showed superior ductility.
As shown in Figure 9, the authors compared the load-bearing capacity of different specimens at the same drift ratio. The SP-35S specimens exhibited a superior load-carrying capacity to the 60db specimens. This implies that, when confined using the proposed methods, columns with insufficient lap splices could potentially perform even better than those with sufficient lap splices. When comparing the P35/P60E and P35/P60 ratios in Figure 9, the load ratios remain within 10% until the drift ratio reaches 2%. However, beyond this threshold, both the P35/P60E and P35/P60 ratios decrease rapidly, indicating the significant influence of splice length on the load-carrying capacity of lap-spliced columns at large drift ratios. The P35S/P35 ratio continued to increase with the drift ratio. For example, at a drift ratio of 6%, the SP-35S specimens exhibited bearing capacities approximately 1.05 and 1.1 times higher than the SP-60 and SP-60E specimens, respectively. The P35S/P35 load ratio reaches 1.5, clearly demonstrating the strengthening effect of this proposed technique.

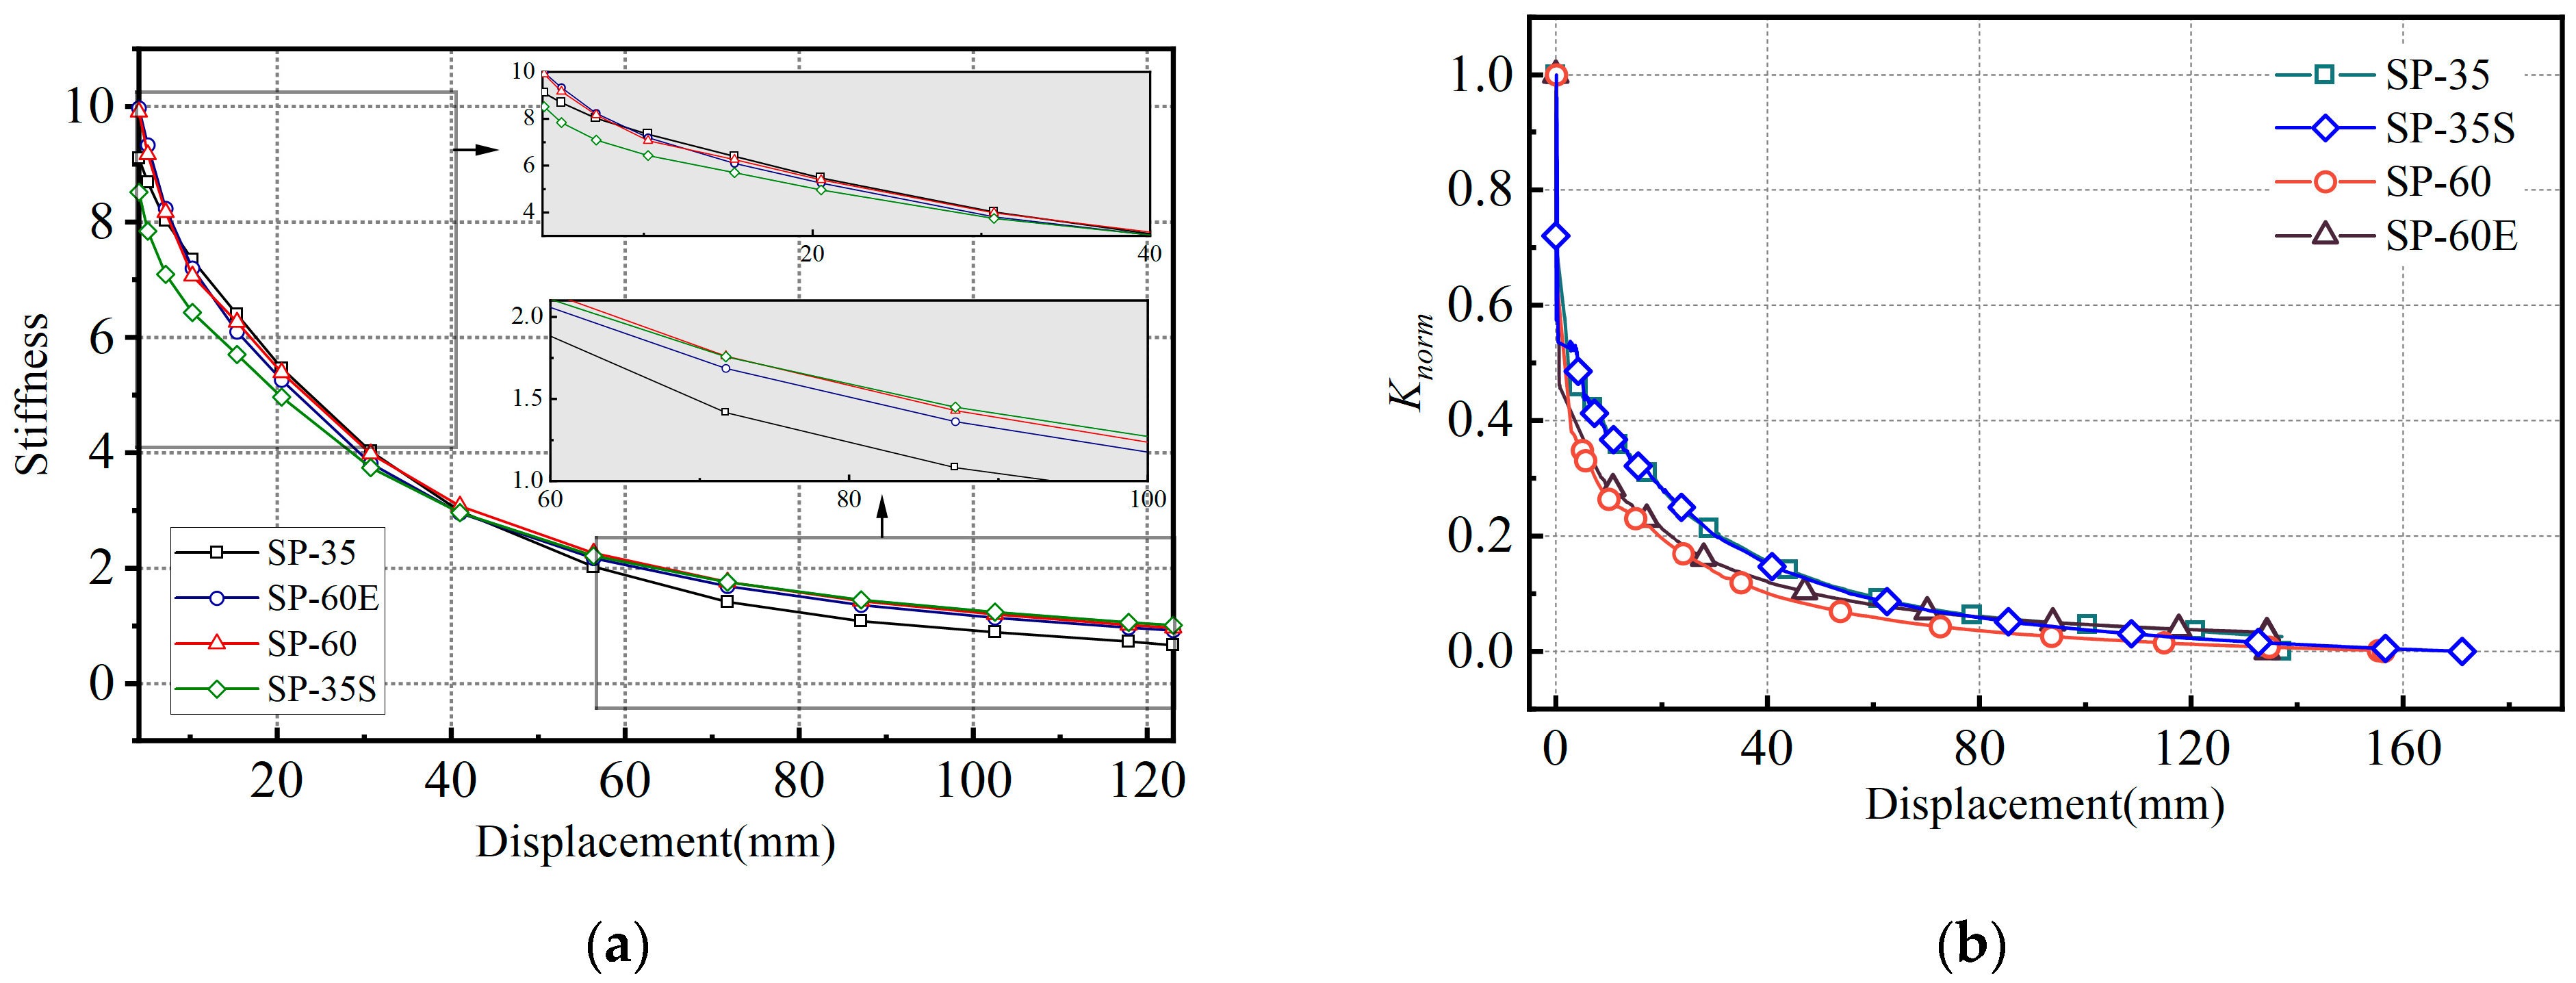
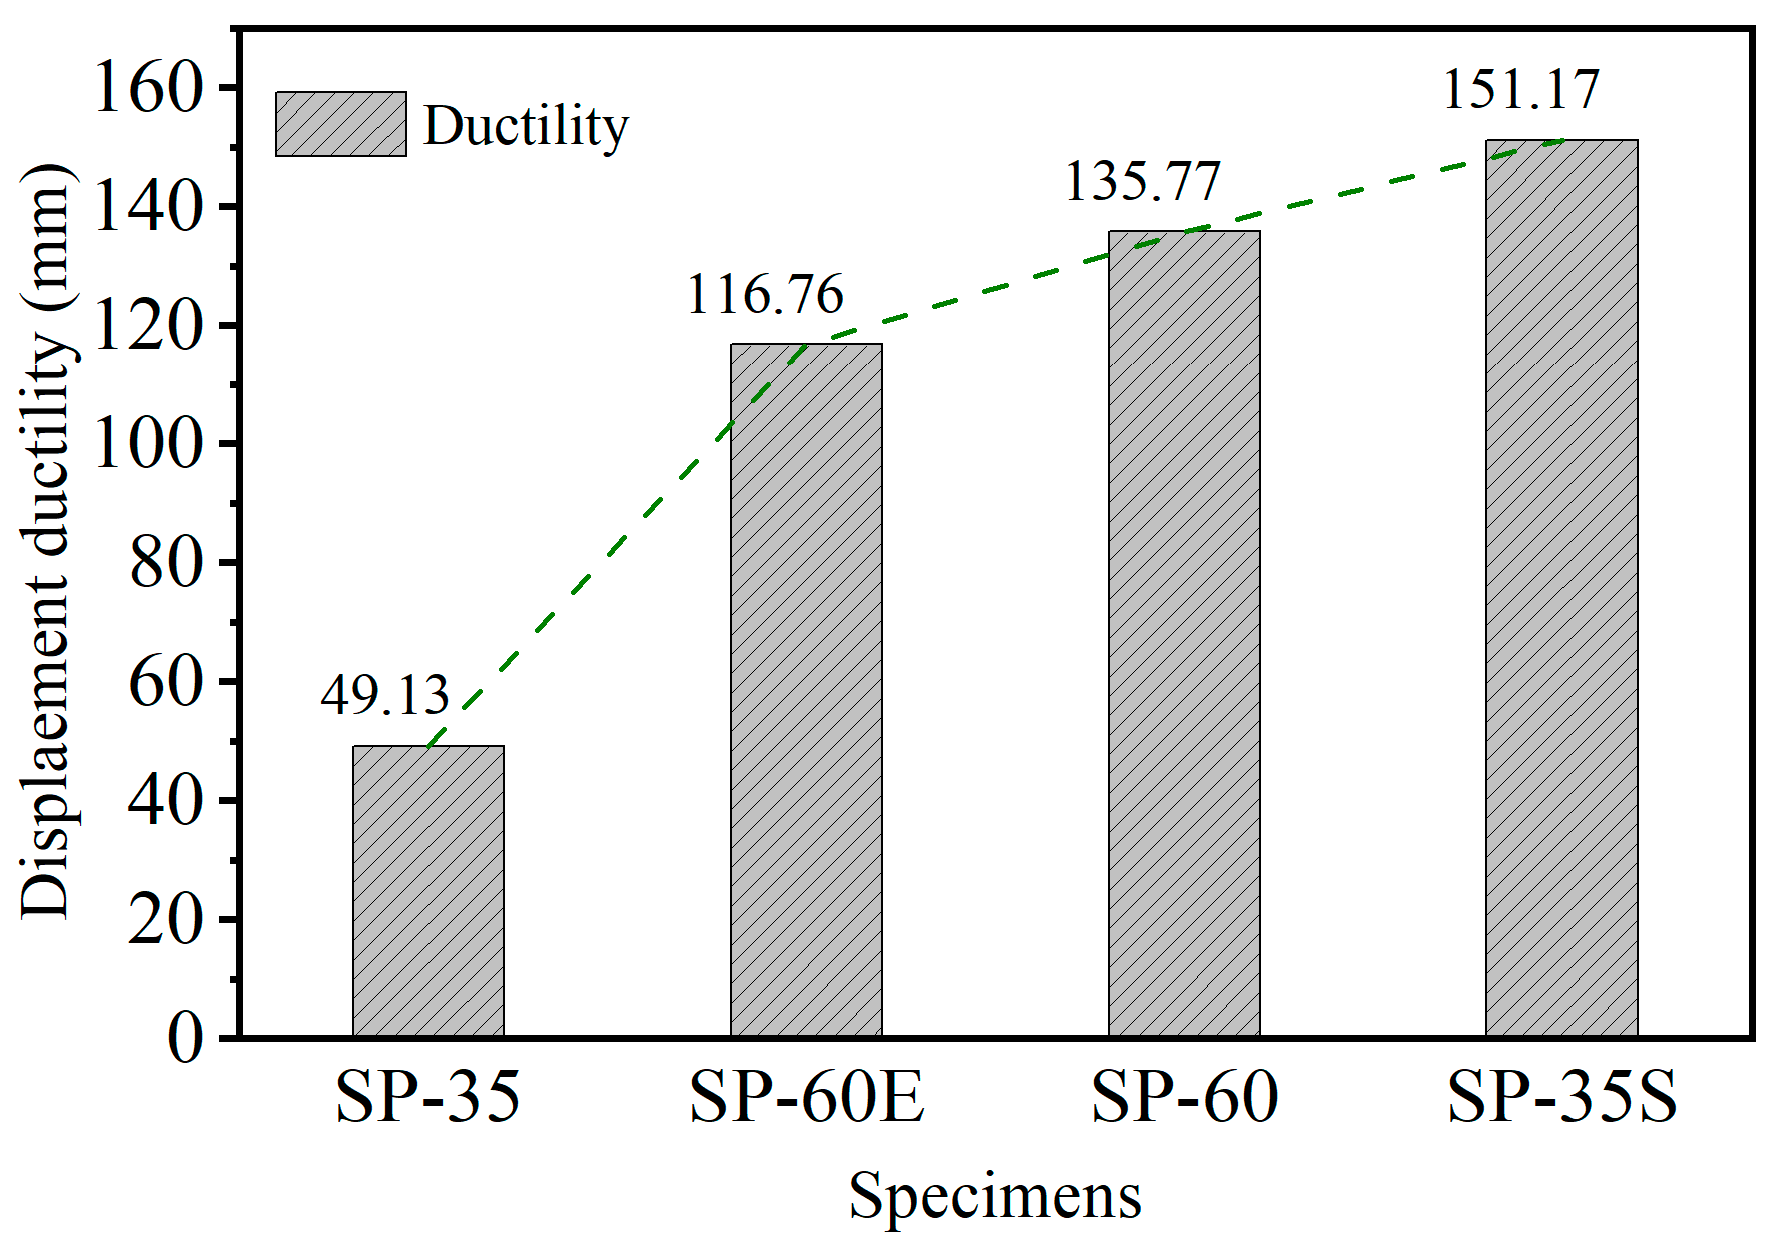
3.3. Stiffness Degradation and Ductility

The Stiffness of the specimens is depicted in Figure 10a. The stiffness decline modes of the three non-strengthened specimens are basically the same and can be divided into three stages. In the first stage (from the beginning of the loading until the first crack appears), stiffness declines rapidly. Then, stiffness declines more slowly and finally shows little degradation. Figure 10b shows the normalized stiffness Knorm. It can be seen that, in the early stage (drift ratio < 2%), there is little difference. As lateral displacement increased, SP-35 showed the lowest stiffness. SP-35 showed the lowest stiffness. This is because SP-35 reached its ultimate displacement and failed to resist the lateral loads. This demonstrates that insufficient splice length can lead to a decrease in both load-carrying capacity and stiffness. Figure 11 shows the ductility of the specimens. The displacement ductility can be calculated as (Δu/Δy), where Δu and Δy represents the ultimate and yielding displacement of the column, respectively. When compared with SP-35, SP-60E and SP-60 showed improvements of 91.25% and 90.25%, respectively.

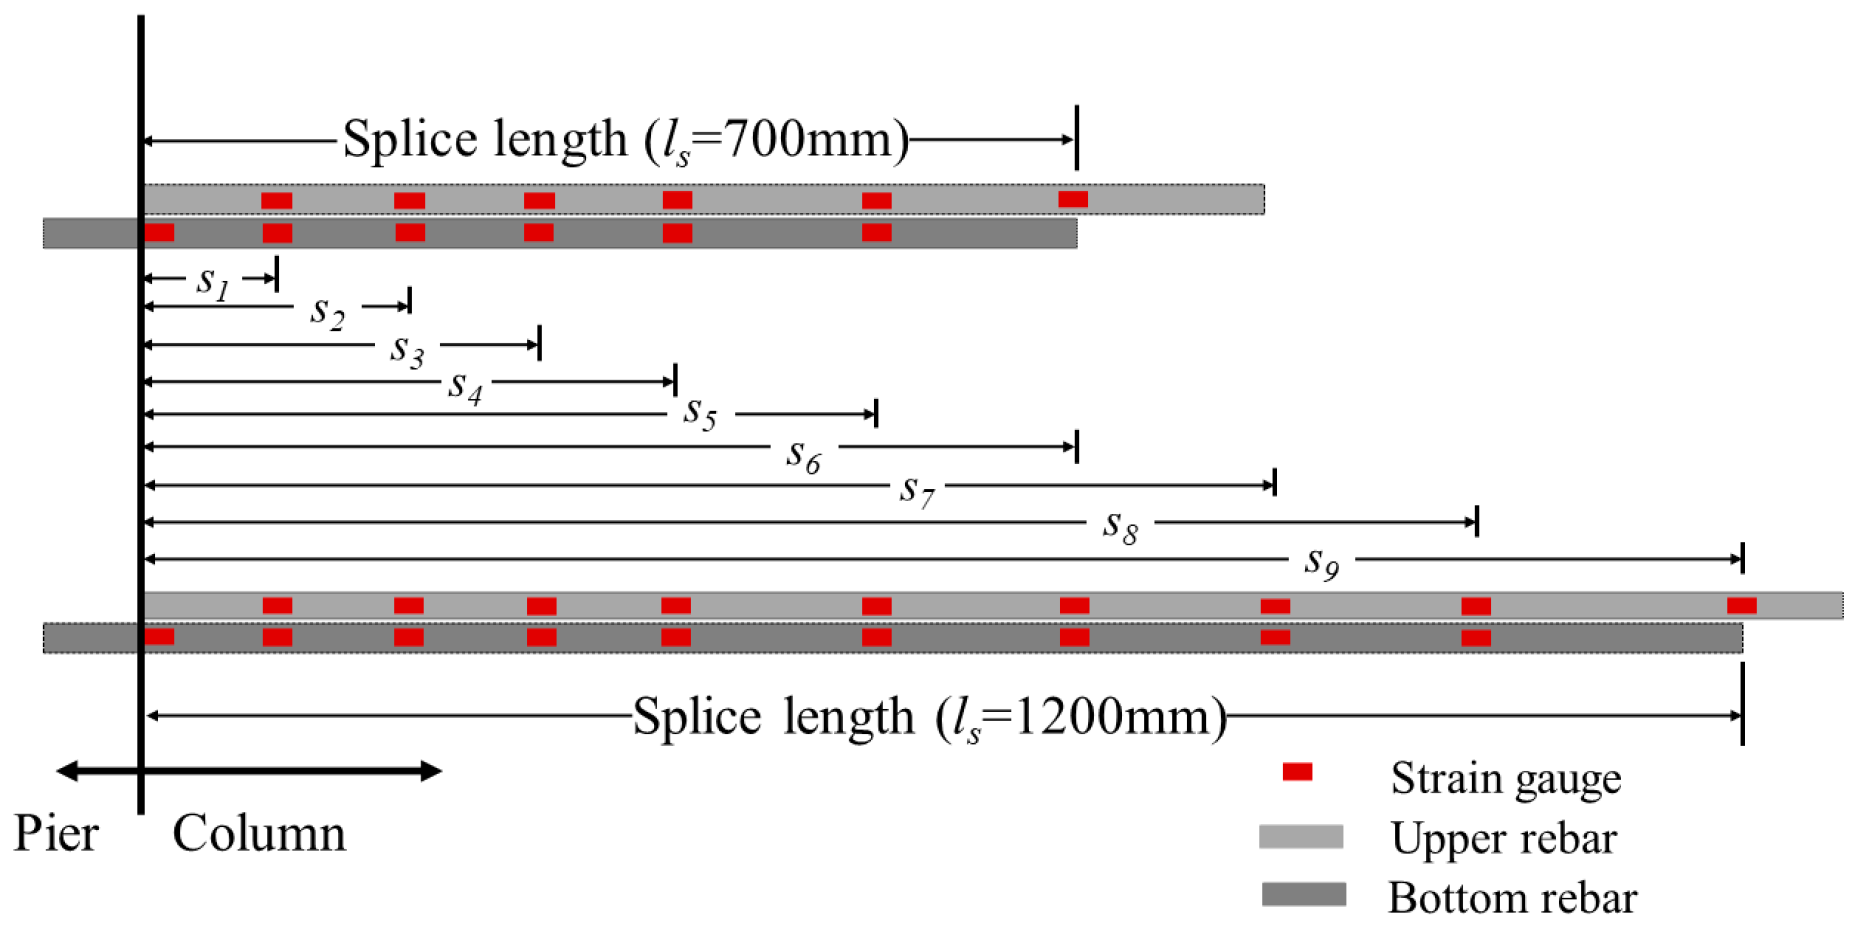
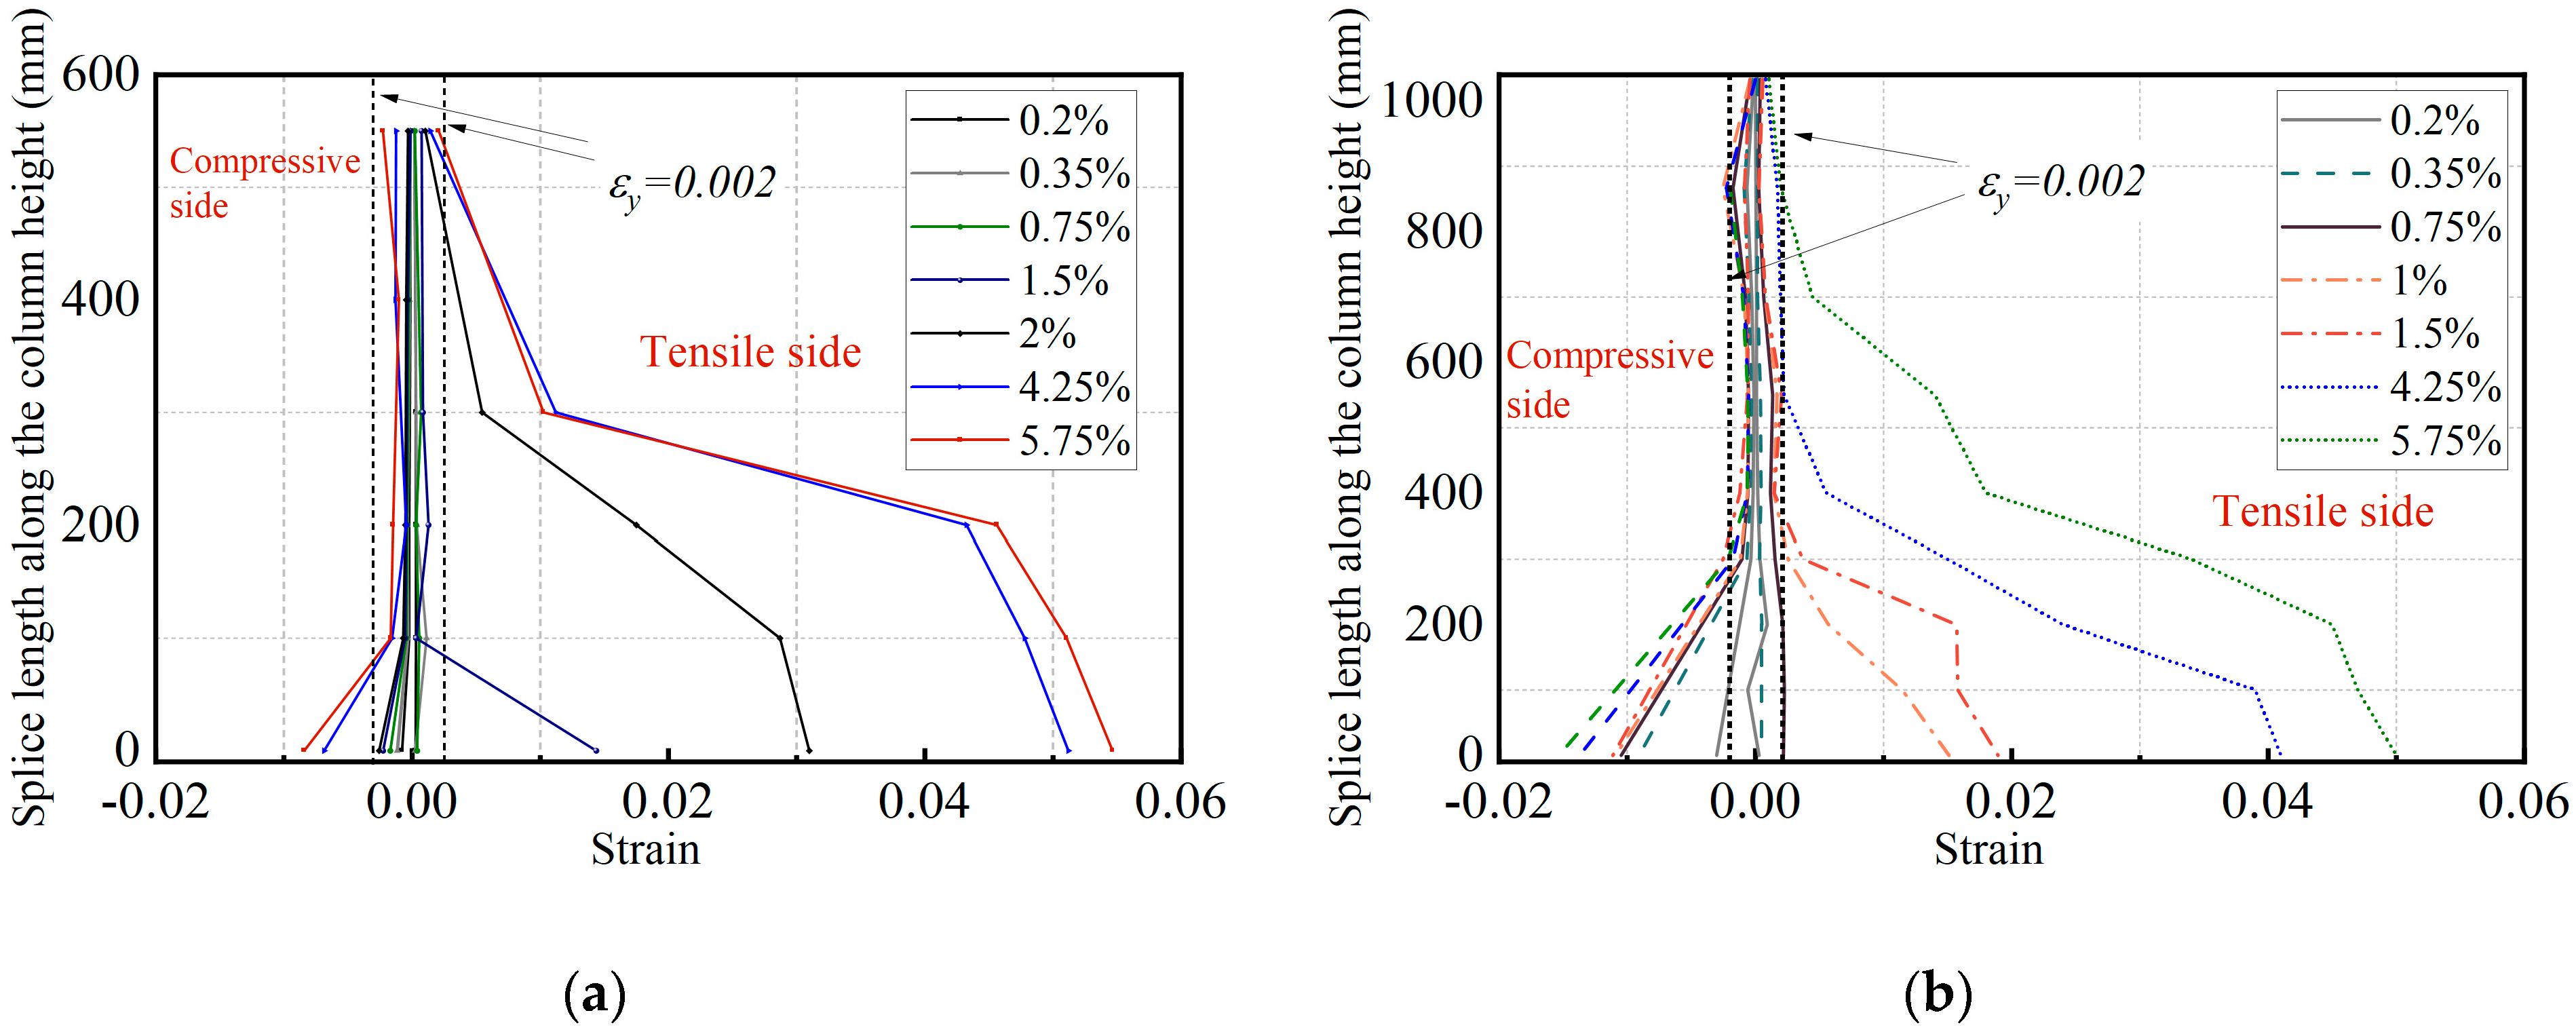
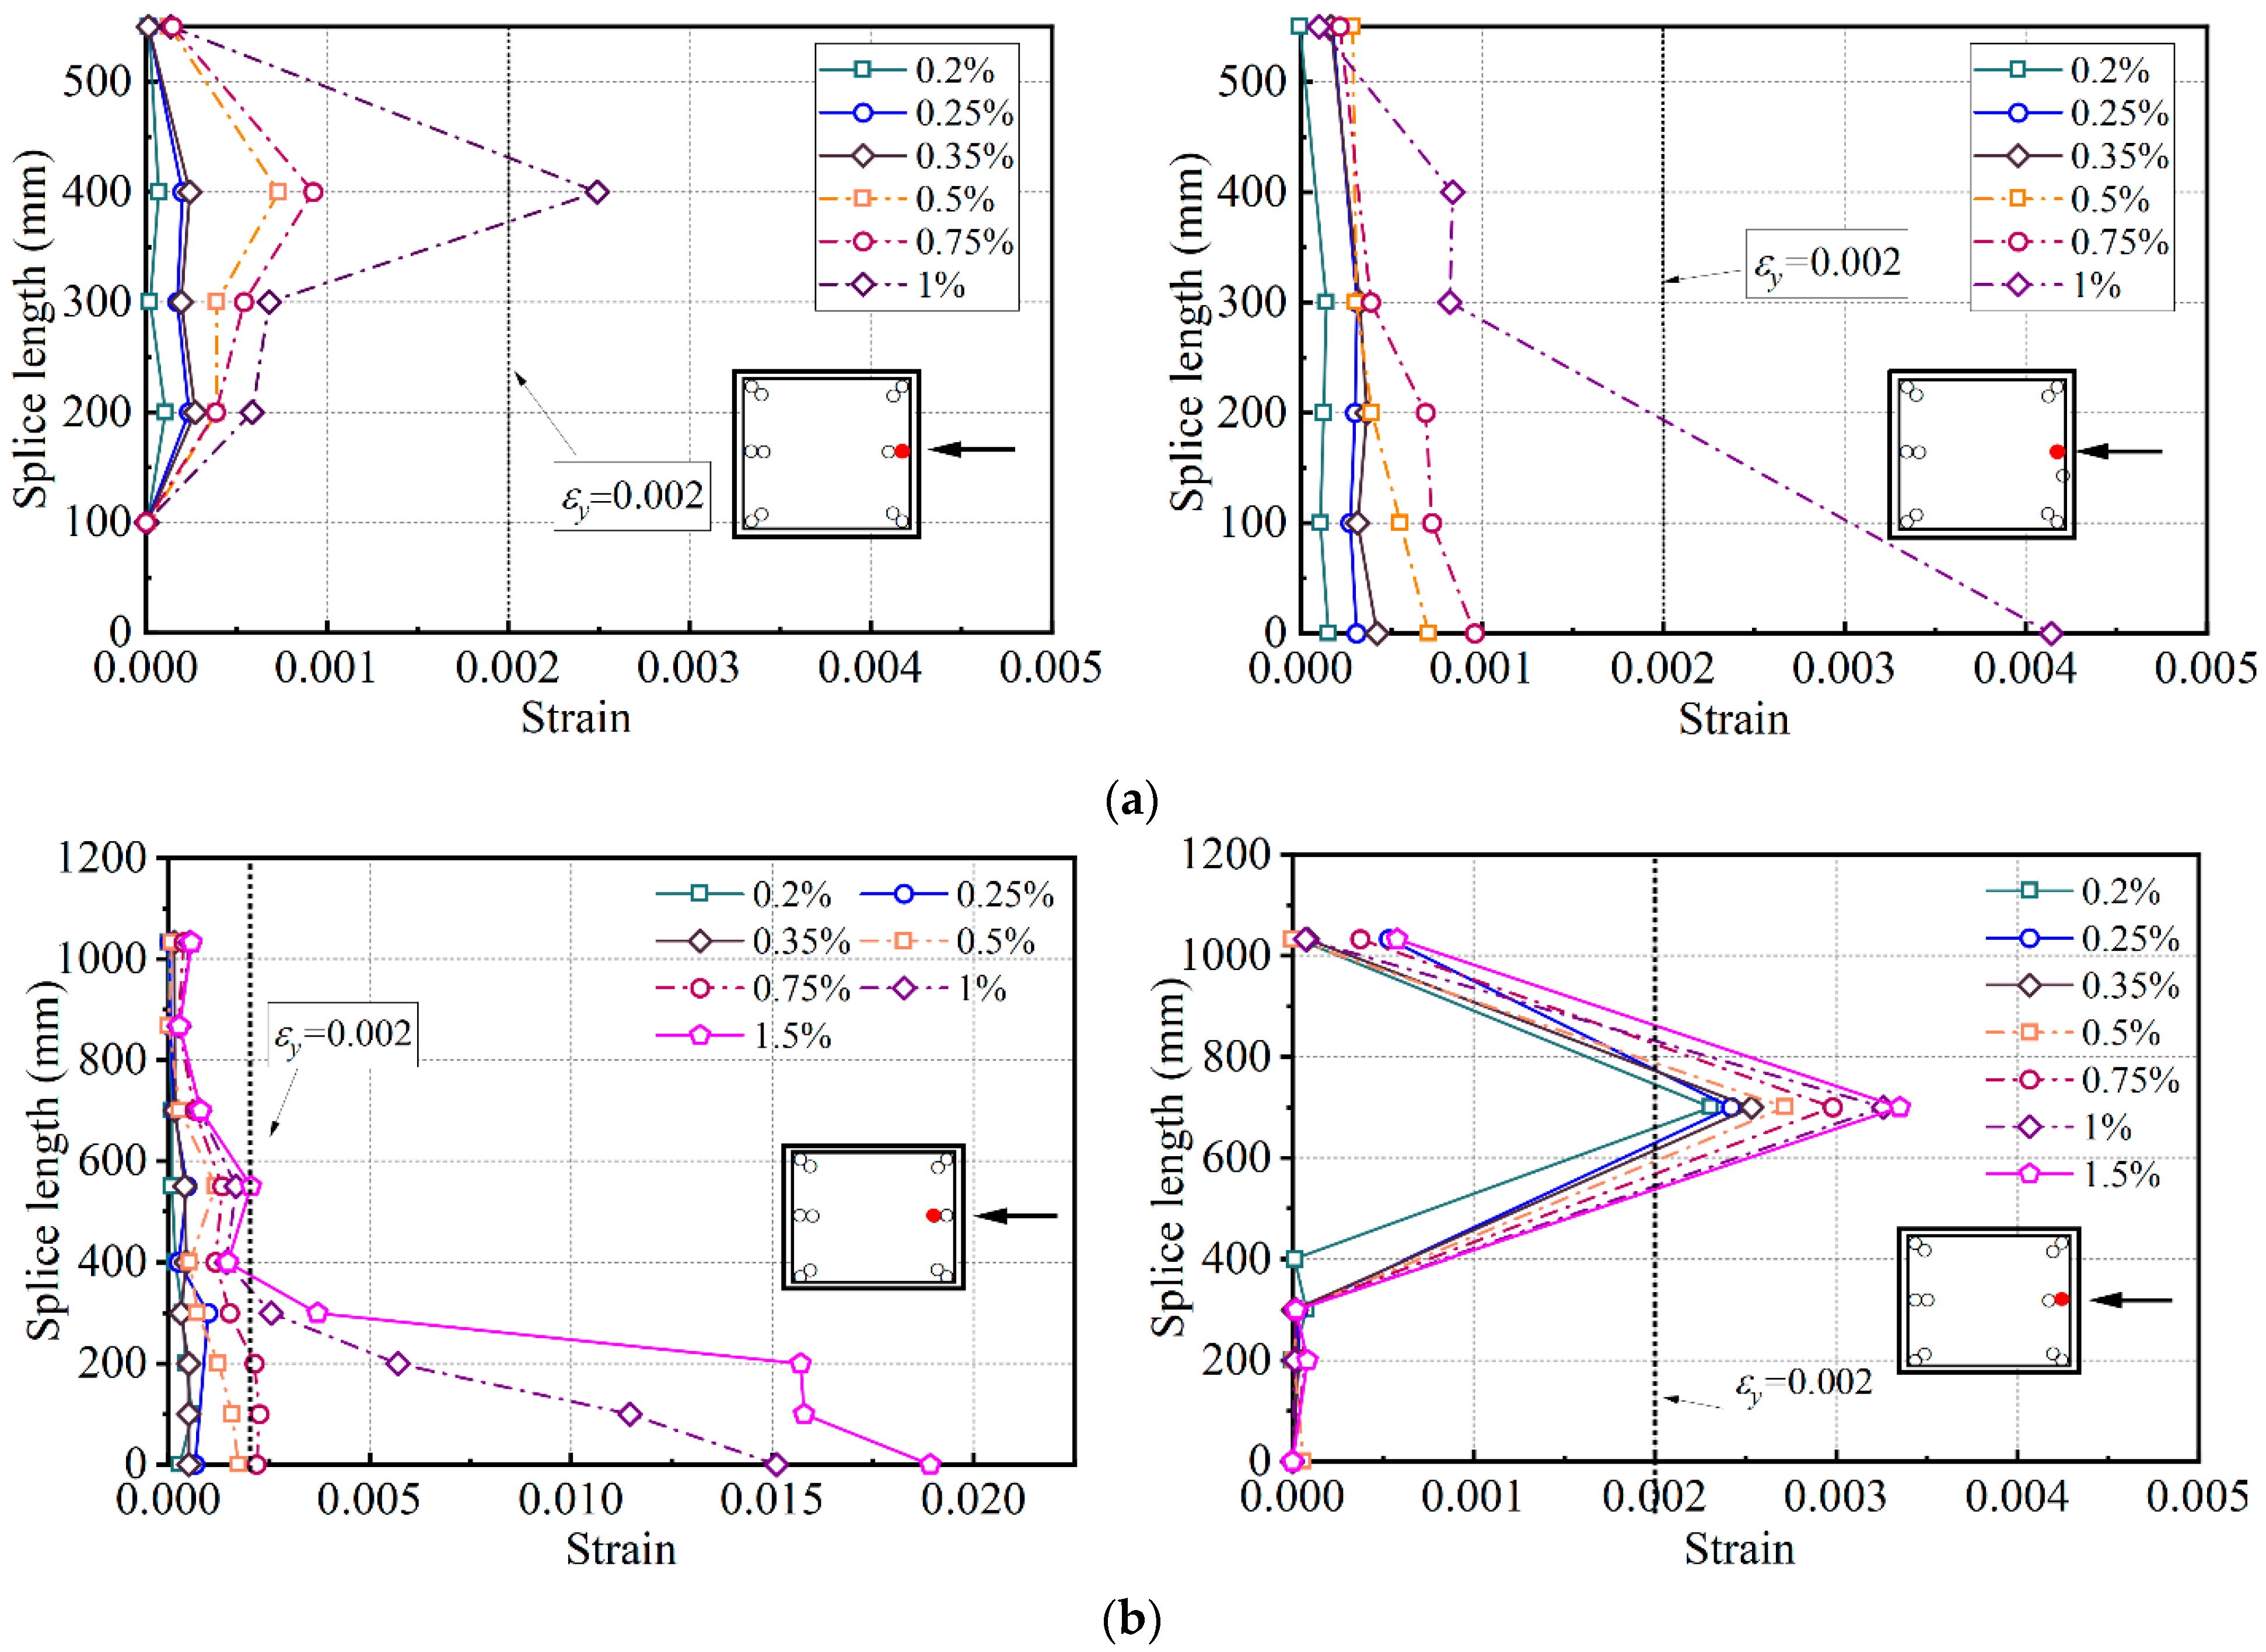
3.4. Strain Distribution

Figure 12 shows the typical strain distribution along the height of the column. SP-35 and SP-60E were chosen as examples, representing the worst and best seismic construction measures, respectively. Once the rebar strain exceeds 0.002, the longitudinal rebar is considered to have yielded. The legend in Figure 12 refers to the drift ratio. For specimen SP-35, it can be seen that the strain of the longitudinal rebar on the compressive side exceeds the yielding strain (εy = 0.002) at a height of 100 mm. This indicates that the rebar has yielded under compressive stress. On the tensile side, the rebar yields once the drift ratio reaches 2% at heights between 0 and 300 mm. This is because, with a short splice length of 700 mm, the splice bond strength is weakened. Consequently, the lap-spliced region failed to transfer stress from the bottom rebar to the top rebar. Relatively speaking, there was slip between the longitudinal rebar: the bottom rebar was stretched while the top rebar experienced lateral slip with the lateral movement of the concrete column.
For specimen SP-60E, the range of compressive yielding of the longitudinal rebar on the compressive side is approximately 0–400 mm, indicating that the longitudinal rebar is utilized more fully. At a drift ratio of 4.25%, the ratio of yield length to lap length on the tensile side decreased from 42% (SP-35) to 33% (SP-60E). The longitudinal rebar on the tensile side of SP-60E showed clear yielding until a drift ratio of 4.25% was reached.
For a lap-spliced column subjected to compressive force N and lateral loads P, the maximum moment and stress occurred at the bottom of the column. The stress can be transferred from the bottom rebar to the top rebar at the lap-spliced region. Longer splice length can lead to better stress-transfer capacity. The strain of lap-spliced rebar was monitored with strain gauges. Examples of measured strains for SP-35 and SP-60E are shown in Figure 13, illustrating variations in strains at the same height across different rebars, indicating slip between spliced rebars. The left plot represents anchor rebar strains, while the right plot represents spliced bar strains. The horizontal axes represent bar strains, and the vertical axes denote height from the column base. The rebar strains in Figure 8 were maximum tensile strains of spliced rebar at drift ratios of 0.2%, 0.25%, 0.5%, 0.75%, 1%, and 1.5%.
As can be seen in Figure 13, the strain in the bottom rebar decreased with increasing height from the base at each lateral drift ratio, whereas the strain in the upper rebar did not change significantly along the splice length. The lateral force provided by the actuator is firstly transferred to the bottom rebar at the base of the columns. Then, through the bonding between the spliced rebar and the concrete, the stress in the bottom rebar is passed to the upper rebar. While the bond strength can vary according to splice length, the bottom rebar has a substantially higher bond demand than the upper bars during loading. As can be seen in Figure 13a, the rebar strains of SP-35 were substantially smaller than the yield strains in the early stages, indicating that splice length impacts the magnitude of rebar strains. This is because columns with short splice lengths were unable to provide sufficient length for stress transfer, meaning that rebar in columns with lap splice defects had difficulty transmitting stress. The rebar strains of columns with sufficient splice length performed better in stress transmission, as shown in Figure 13b. The upper rebar in SP-60E absorbed much more stress than SP-35 at the same lateral drift ratio. The collapse of the load displacement curve is caused by insufficient transmission efficiency, which is why the SP-35 curve declined so quickly. As splice length increases, strain on SP-60E increases dramatically, with bottom rebar strains substantially larger than those on SP-35 and greater than yield strains.

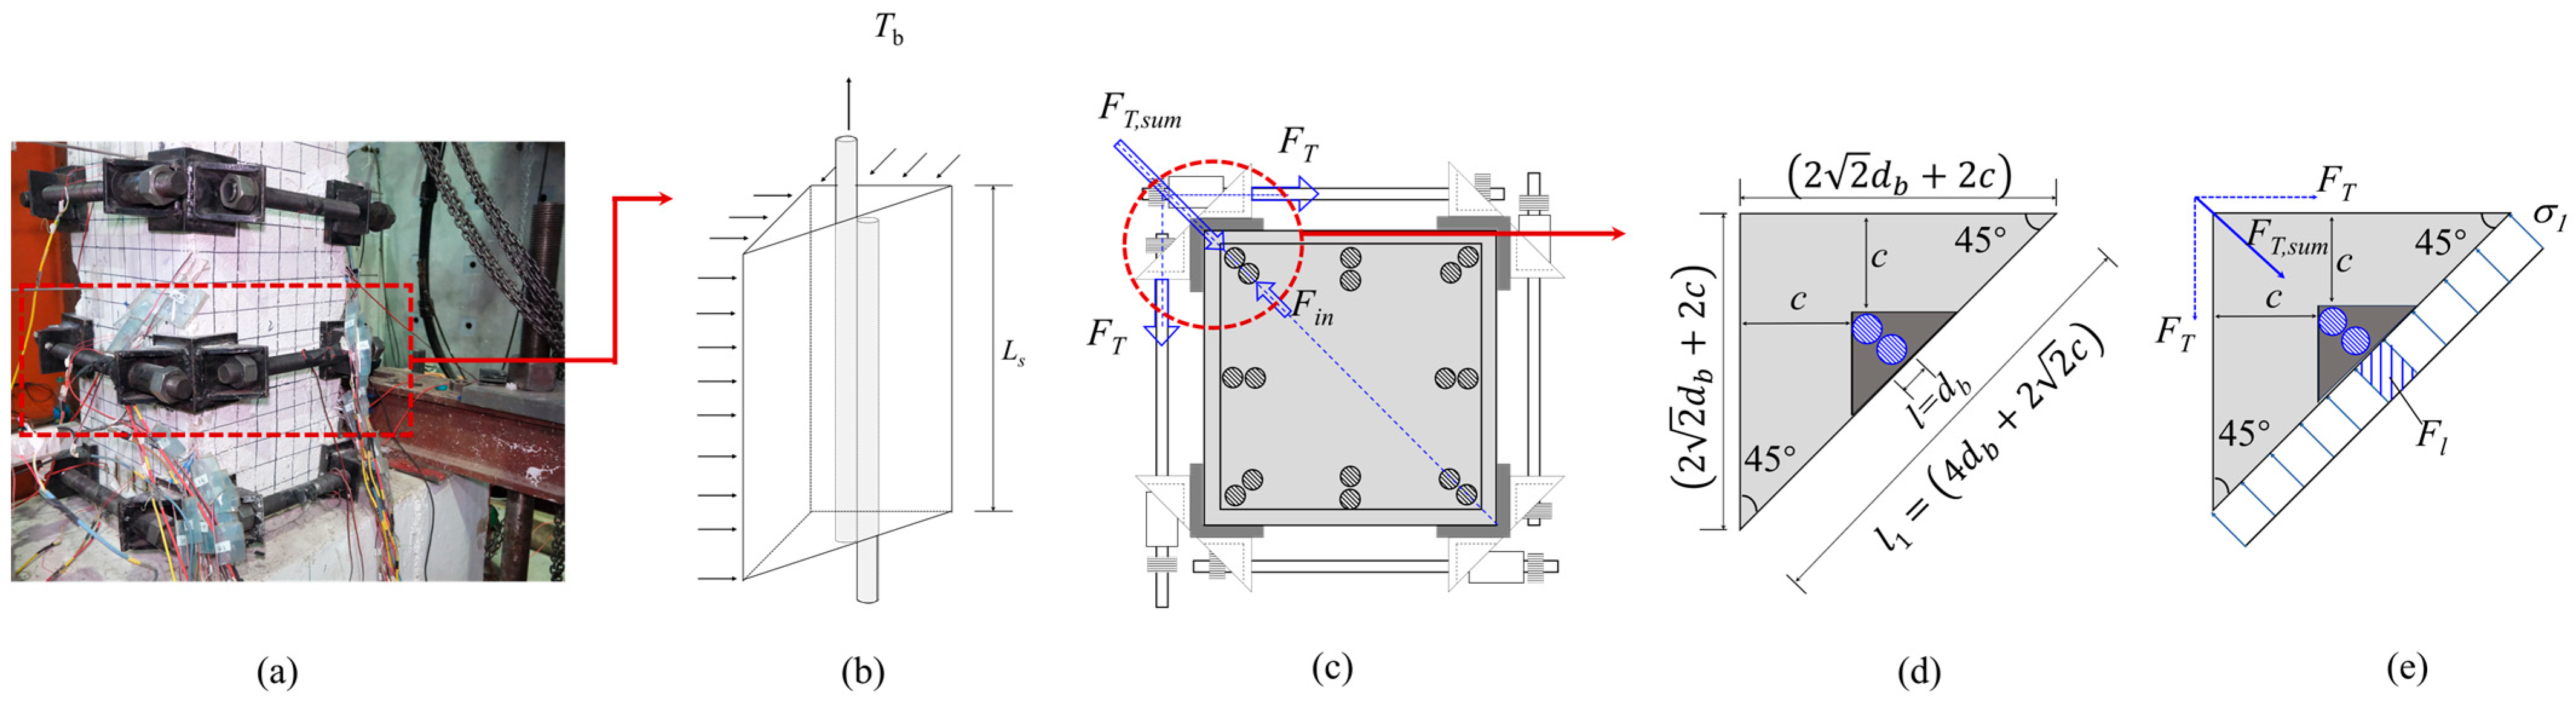
3.5. Stress Transfer

This section discusses the impact of the strengthening device on stress transfer efficiency. It has been proven that the proposed strengthening devices can improve mechanical performance, as shown in Ref. [43]. However, the effect on stress transfer has not yet been discussed. Figure 14 depicts a comparison of strains at heights between 0 and 550 mm along the columns for 35db specimens; the strengthened areas are marked in grey. When lap-spliced columns are subject to lateral loads, the moment gradient reaches its maximum value at the bottom of the column and gradually decrease in height, meaning that the bond strength required for the bottom rebar is much greater than that required for the top rebar. Stress transfers along a path starting from the bottom rebar and moving into the top rebar. In this test, the stress transfer efficiency can be evaluated using the rebar strains. Figure 14 shows that, for 35db specimens under the same lateral displacement, SP-35S exhibits greater strain than SP-35 at the same position. This indicates that the longitudinal rebar in the strengthened specimen is utilized more effectively. Due to the short lap-spliced length, the top rebar in the SP-35 specimen failed to transmit stress from the bottom rebar and showed greater relative slip. Conversely, with prestressing and lateral confinement, the longitudinal rebar showed less relative slip. This is consistent with the failure mode analysis of the 35db specimens (i.e., SP-35 showed splitting failure, while SP-35S showed pull-out failure, indicating greater ductility). Therefore, it can be concluded that short lap-spliced lengths fail to provide sufficient bond strength to transfer stress between lap-spliced rebars, which could lead to relative slippage between the rebars and ultimately result in a brittle splitting failure. This is in line with the conclusion provided by Kim et al. [11].

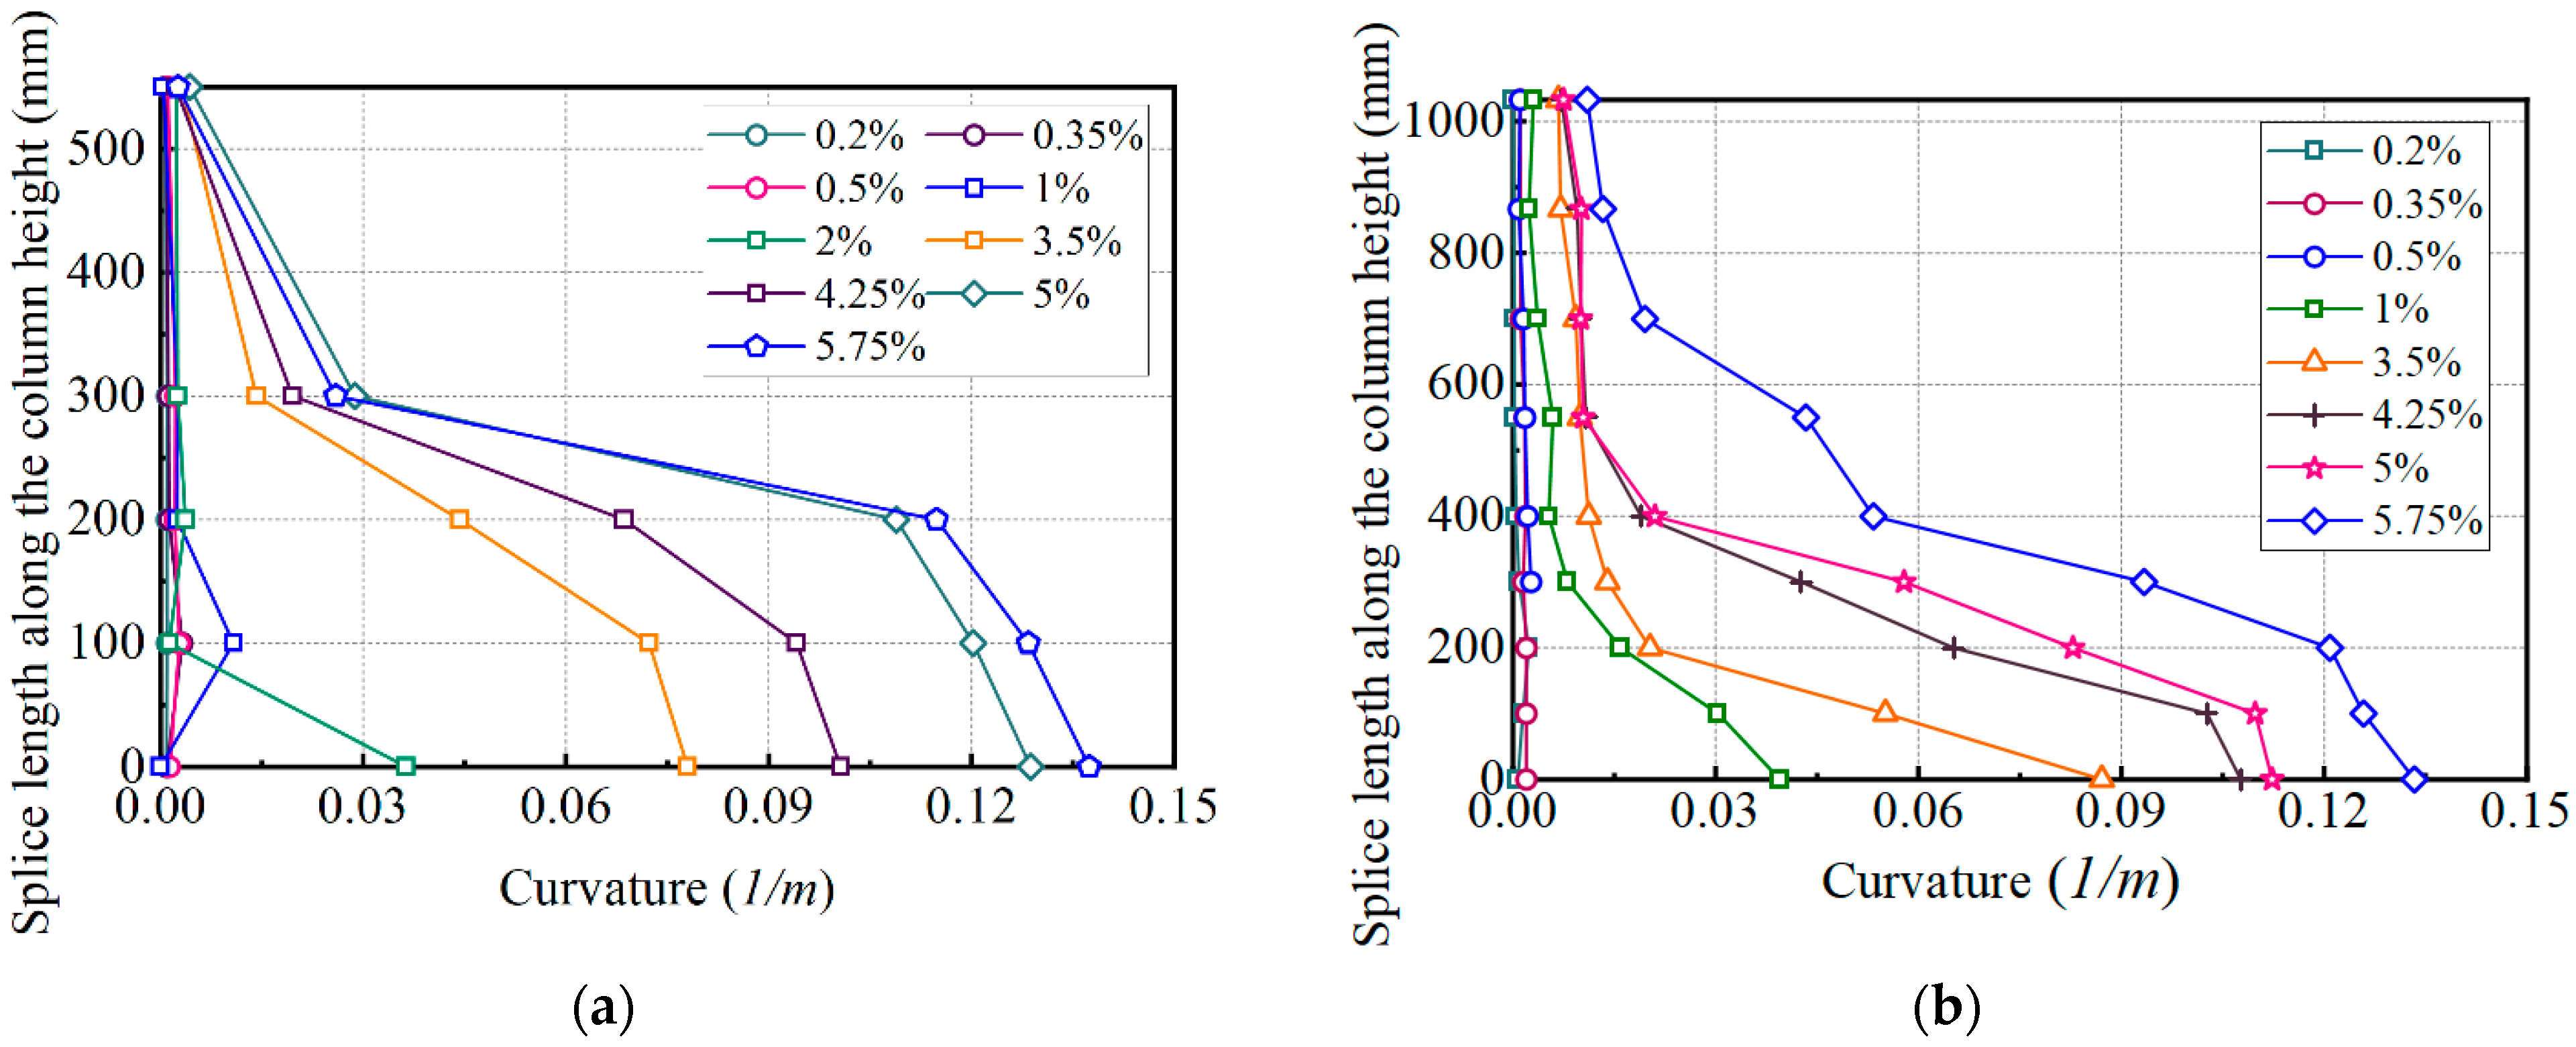
3.6. Curvature Along the Column Height

Reinforced concrete components undergo bending deformation when subjected to a combination of bending moments and axial forces. The concept of curvature, which is used to characterize the rotational ability of a cross-section, is adopted to describe changes in a member’s rotation in different zones or sections. As shown in Figure 15, R denotes the radius of curvature, kd denotes the depth of the neutral axis, εc is the strain in the compressive concrete, and εs is the strain of tensile rebar. A unit with a length of dx was selected to analyze. The relative rotation between the two end faces of the unit dx can be expressed as follows:
d x R = ε c d x k d = ε s d x d ( 1 k )
1 R = ε c k d = ε s d ( 1 k )
In Equations (7) and (8), the item 1/R is the curvature φ of this cross-section, the curvature can finally be calculated as
φ = ε c k d = ε s d ( 1 k ) = ε c + ε s d
Considering that cracks in concrete can lead to errors during strain monitoring, the authors adopted a geometric method to calculate the curvature. As can be seen in Figure 16, φ is the curvature of the column within a height of H, ΔL1 and ΔL2 denote the displacement variations on the tensile and compressive sides, respectively. B is the distance between two measured points. The curvature can be calculated using Equation (10). The displacement variations ΔL1 and ΔL2, were obtained using LVDT and 2D-DIC technology.
φ = Δ L 1 + Δ L 2 B H
Figure 17 shows the typical curvature distribution along the height of the column. This curvature distribution reflects the rotation amplitude of the different sections of the column. As the drift ratio increases, the curvature also increases. For specimen SP-35, the change in curvature of the column is relatively small before the drift ratio is less than 2%, indicating that little plastic deformation occurred. Once the drift ratio exceeds 2%, however, the curvature increases rapidly, indicating significant plastic deformation. This is consistent with the strain distribution of the lap-spliced zone in SP-35. That is, the short splice length of SP-35 failed to provide sufficient bond strength to transfer stress from the bottom of the column. As a result, splitting failure occurred in the lap-spliced zone and the relatively large slip between the longitudinal rebar led to significant rotation within a height of 300 mm. SP-60E, with a longer splice length, showed a relatively uniform curvature distribution. In summary, a larger splice length improves the deformation capacity of the column, whereas a short splice length can lead to relative slippage between the two longitudinal rebar, resulting in a sudden change in curvature along the column height.

3.7. Plastic Hinge

Early approaches to defining the member deformation using an equivalent rectangular plastic hinge length are summarized by Park and Paulay [45], as shown in Figure 18. Before the yielding, the curvature changes linearly along the height direction of the column; after yielding, it is assumed that the plastic rotation of the column is all concentrated in the equivalent plastic hinge area. Within the plastic hinge length (Lp), the curvature is consistent of yielding curvature φy and plastic curvature φp; the plastic curvature φp distributed uniformly and can be expressed as a constant (φp = φφy). The displacement of the top of the column can be calculated as follows:
Δ y = φ y L 2 3
Δ u = Δ y + Δ p = φ y L 2 3 + φ u φ y L p ( 1 0.5 L p )
where Δy and Δu denote the yielding and ultimate displacement of the top of the column, Δp denotes the plastic deformation of the top of the column. The equivalent plastic hinge length Lp is often calculated with Equation (13).
L p = φ p φ p 2 2 φ p Δ p φ p = L L 2 2 Δ p φ p
According to Ref. [41], when the load-bearing capacity of the specimen decreases to 85%, this can be considered the ultimate state. The author takes the lateral displacement at the top of the column and the curvature of the section at the bottom of the column at this point as the ultimate displacement Δu and the ultimate curvature φu. The yielding displacement Δy and yielding curvature φy can be obtained at the equivalent point, which is mentioned in Section 3.2. The measured curvatures are displayed in Table 2. It can be seen that SP-35, with a splice length of 700 mm, showed the smallest equivalent plastic hinge length. As the splice length increased, so did the equivalent plastic hinge length, indicating an increased rotation capacity of the column. However, the accuracy of the calculated plastic hinge length should be verified.

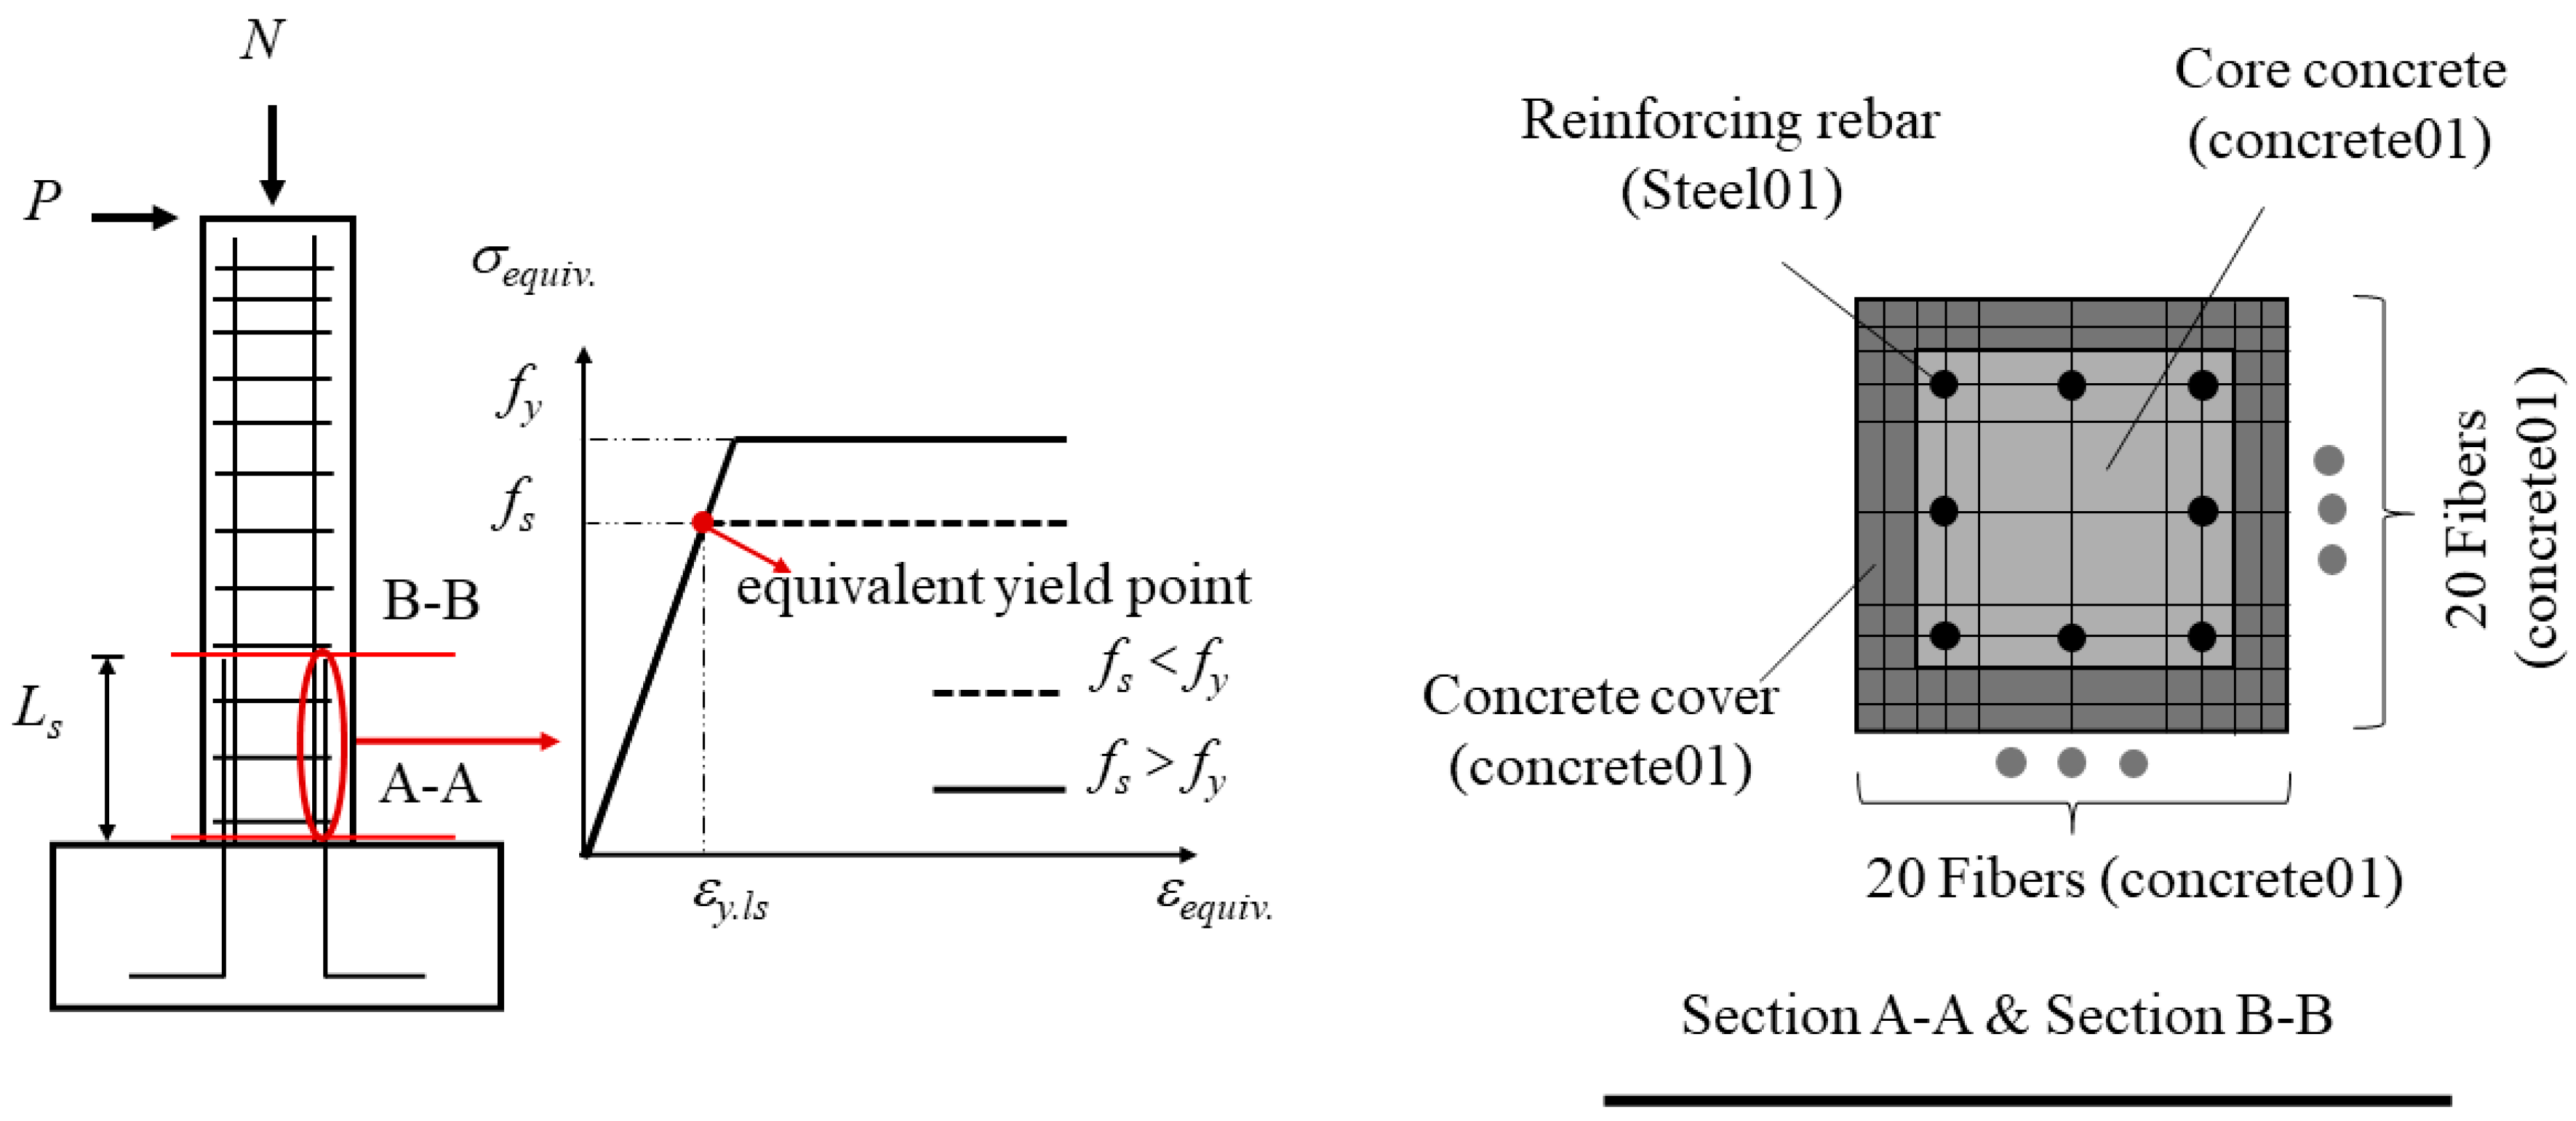
4. Equivalent Plastic Hinge Model of Lap-Spliced Columns

This part proposes an equivalent plastic hinge model is proposed to predict the load-deformation response of lap-spliced columns. The modelling of lap-spliced columns is complicated by the different cross-sectional details in the spliced and non-spliced zones. The proposed model addresses this issue by simplifying a column with spliced rebar to one with continuous rebar. This converts the impact of lap splices on the column into an equivalent plastic hinge of a specific length. This approach significantly enhances the analytical efficiency of the model. The equivalent plastic hinge model can be developed through a three-step process involving cross-section analysis, modified curvature distribution, and the establishment of the equivalent plastic hinge model. OpenSees software (3.3.0 version) was chosen for its simplicity and accuracy. The ForceBeamColumn element was adopted because it enables specific plastic hinge lengths to be defined.

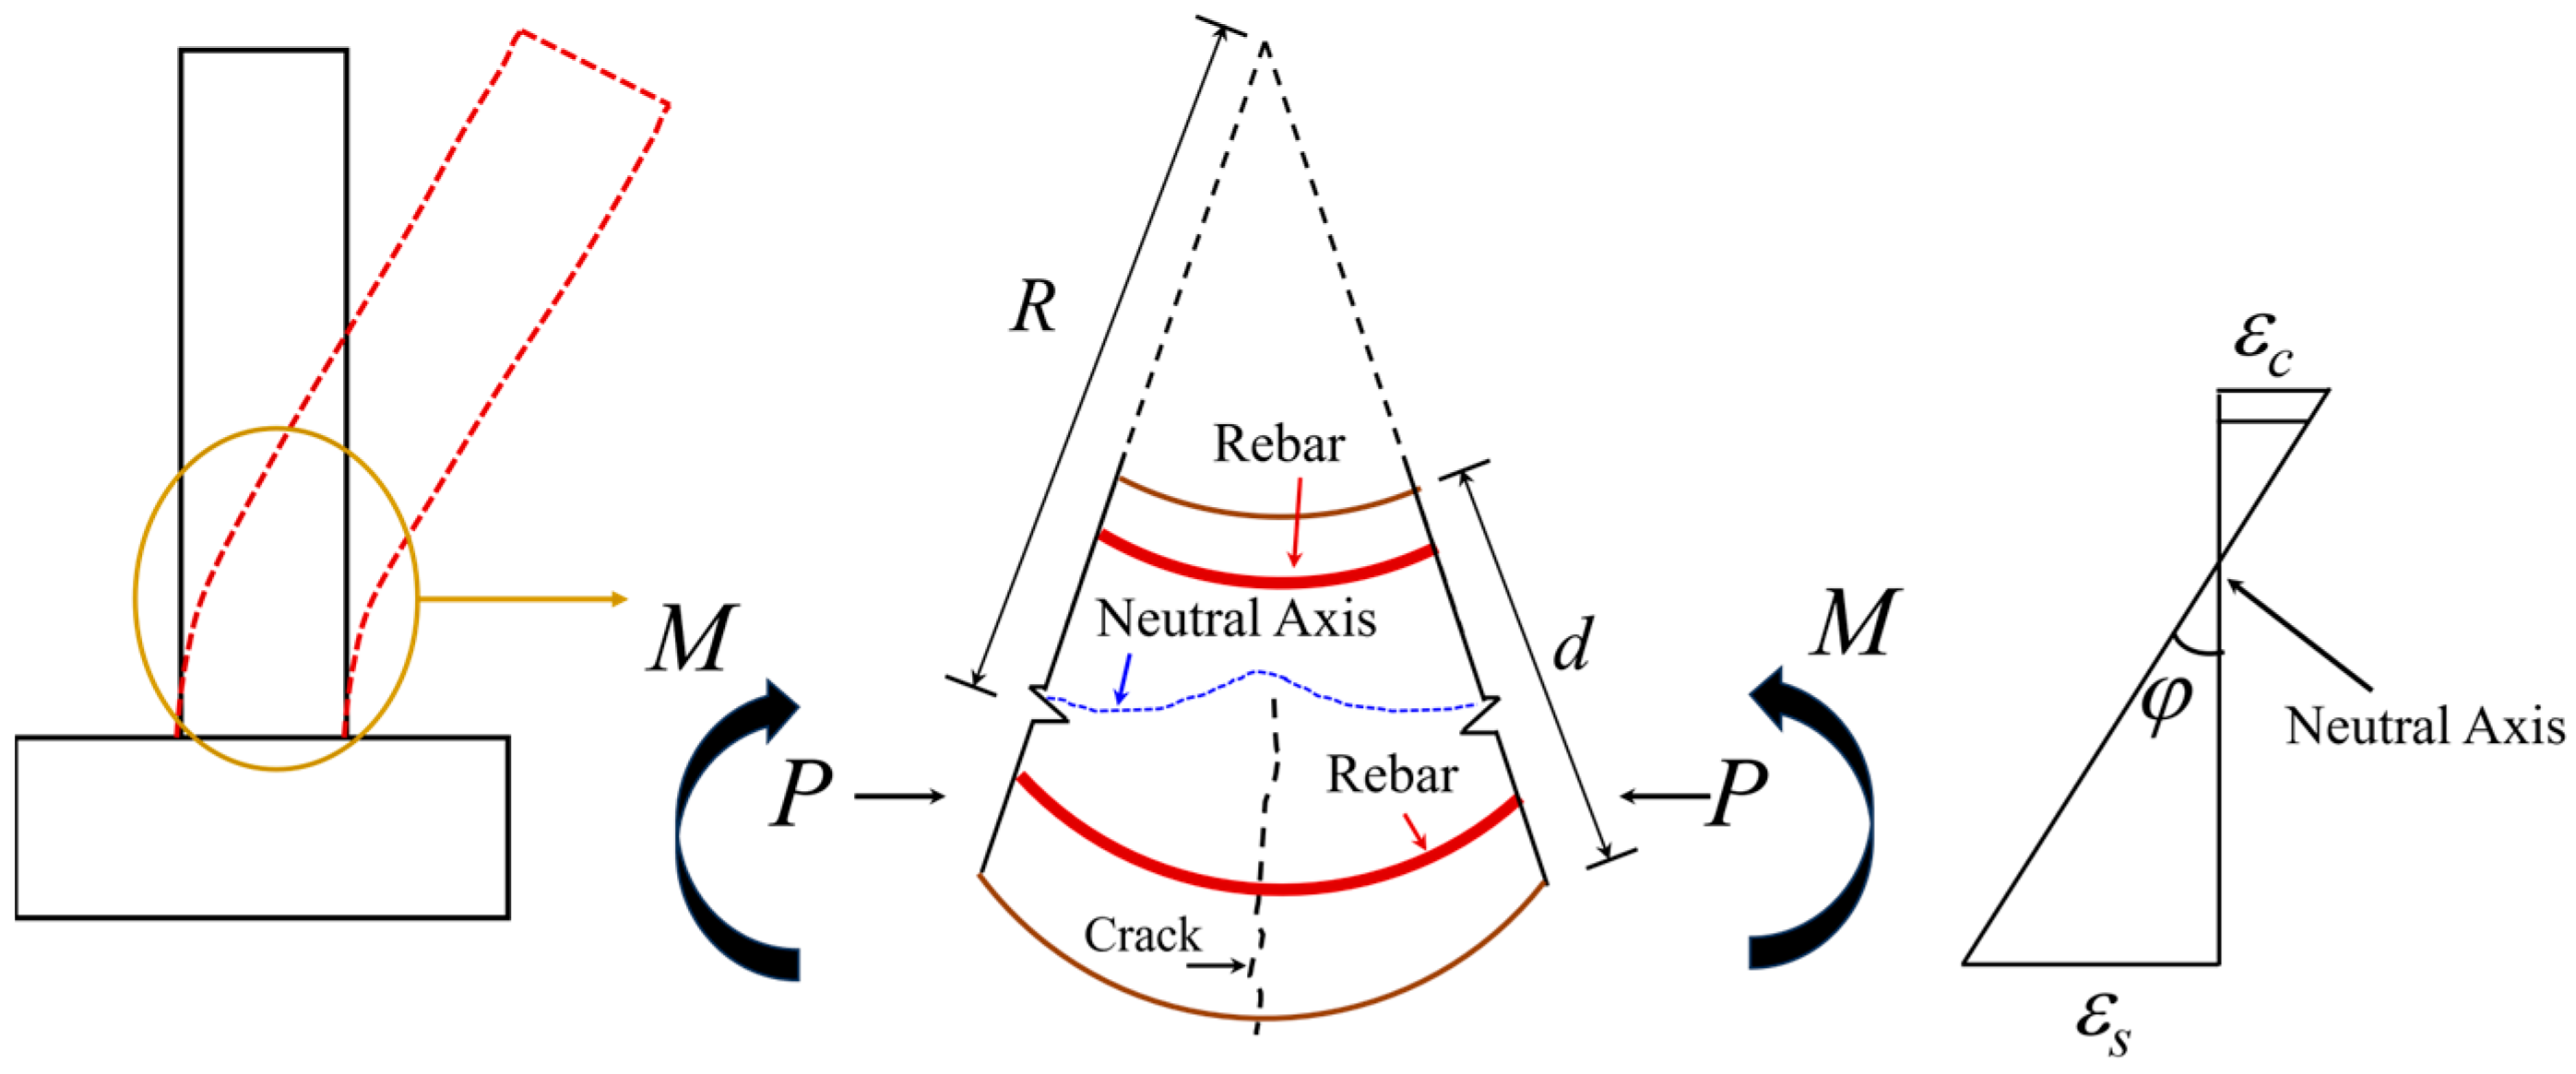
4.1. Cross-Section Analysis

In Step 1, the cross-section analysis of two sections (i.e., the lap-spliced and non-lap-spliced sections shown in Figure 13) was carried out in OpenSees, as shown in Figure 19. For the rebar in the non-lap-spliced region, the Steel 01 model was chosen as the constitutive model. For the rebar in the lap-spliced region, a modified Steel 01 model with splice strength fs was adopted because the lap-spliced rebar with a short splice length failed to achieve the yielding stress of one continuous rebar [21]. The bond strength fs can be calculated using Equations (14) to (18). Further details can be found in Ref. [46].
f s = F s p l i t t i n g + F s t i r r u p n A b tan β
For horizontal splitting failure:
F h , s p l i t t i n g = l s * [ 2 c s * + ( n 1 ) 2 c s i * ] 6 f c
F h , s t i r r u p s = N s t N l A s t σ s t [ n f c 170 ]
For vertical splitting failure:
F v , s p l i t t i n g = l s * [ 2 c b * v ( 0.1 c s o c b + 0.9 ) + 2 c b * ( n 1 ) ( 0.1 c s i c b + 0.9 ) ] 6 f c
F v , s t i r r u p s = N s t n A s t σ s t [ n f c 170 ]
The Concrete 01 material model was chosen for the section analysis. In this model, the tensile strength of the concrete is disregarded. The moment–curvature curve obtained from this step can be used to develop the equivalent curvature distribution in step 2.

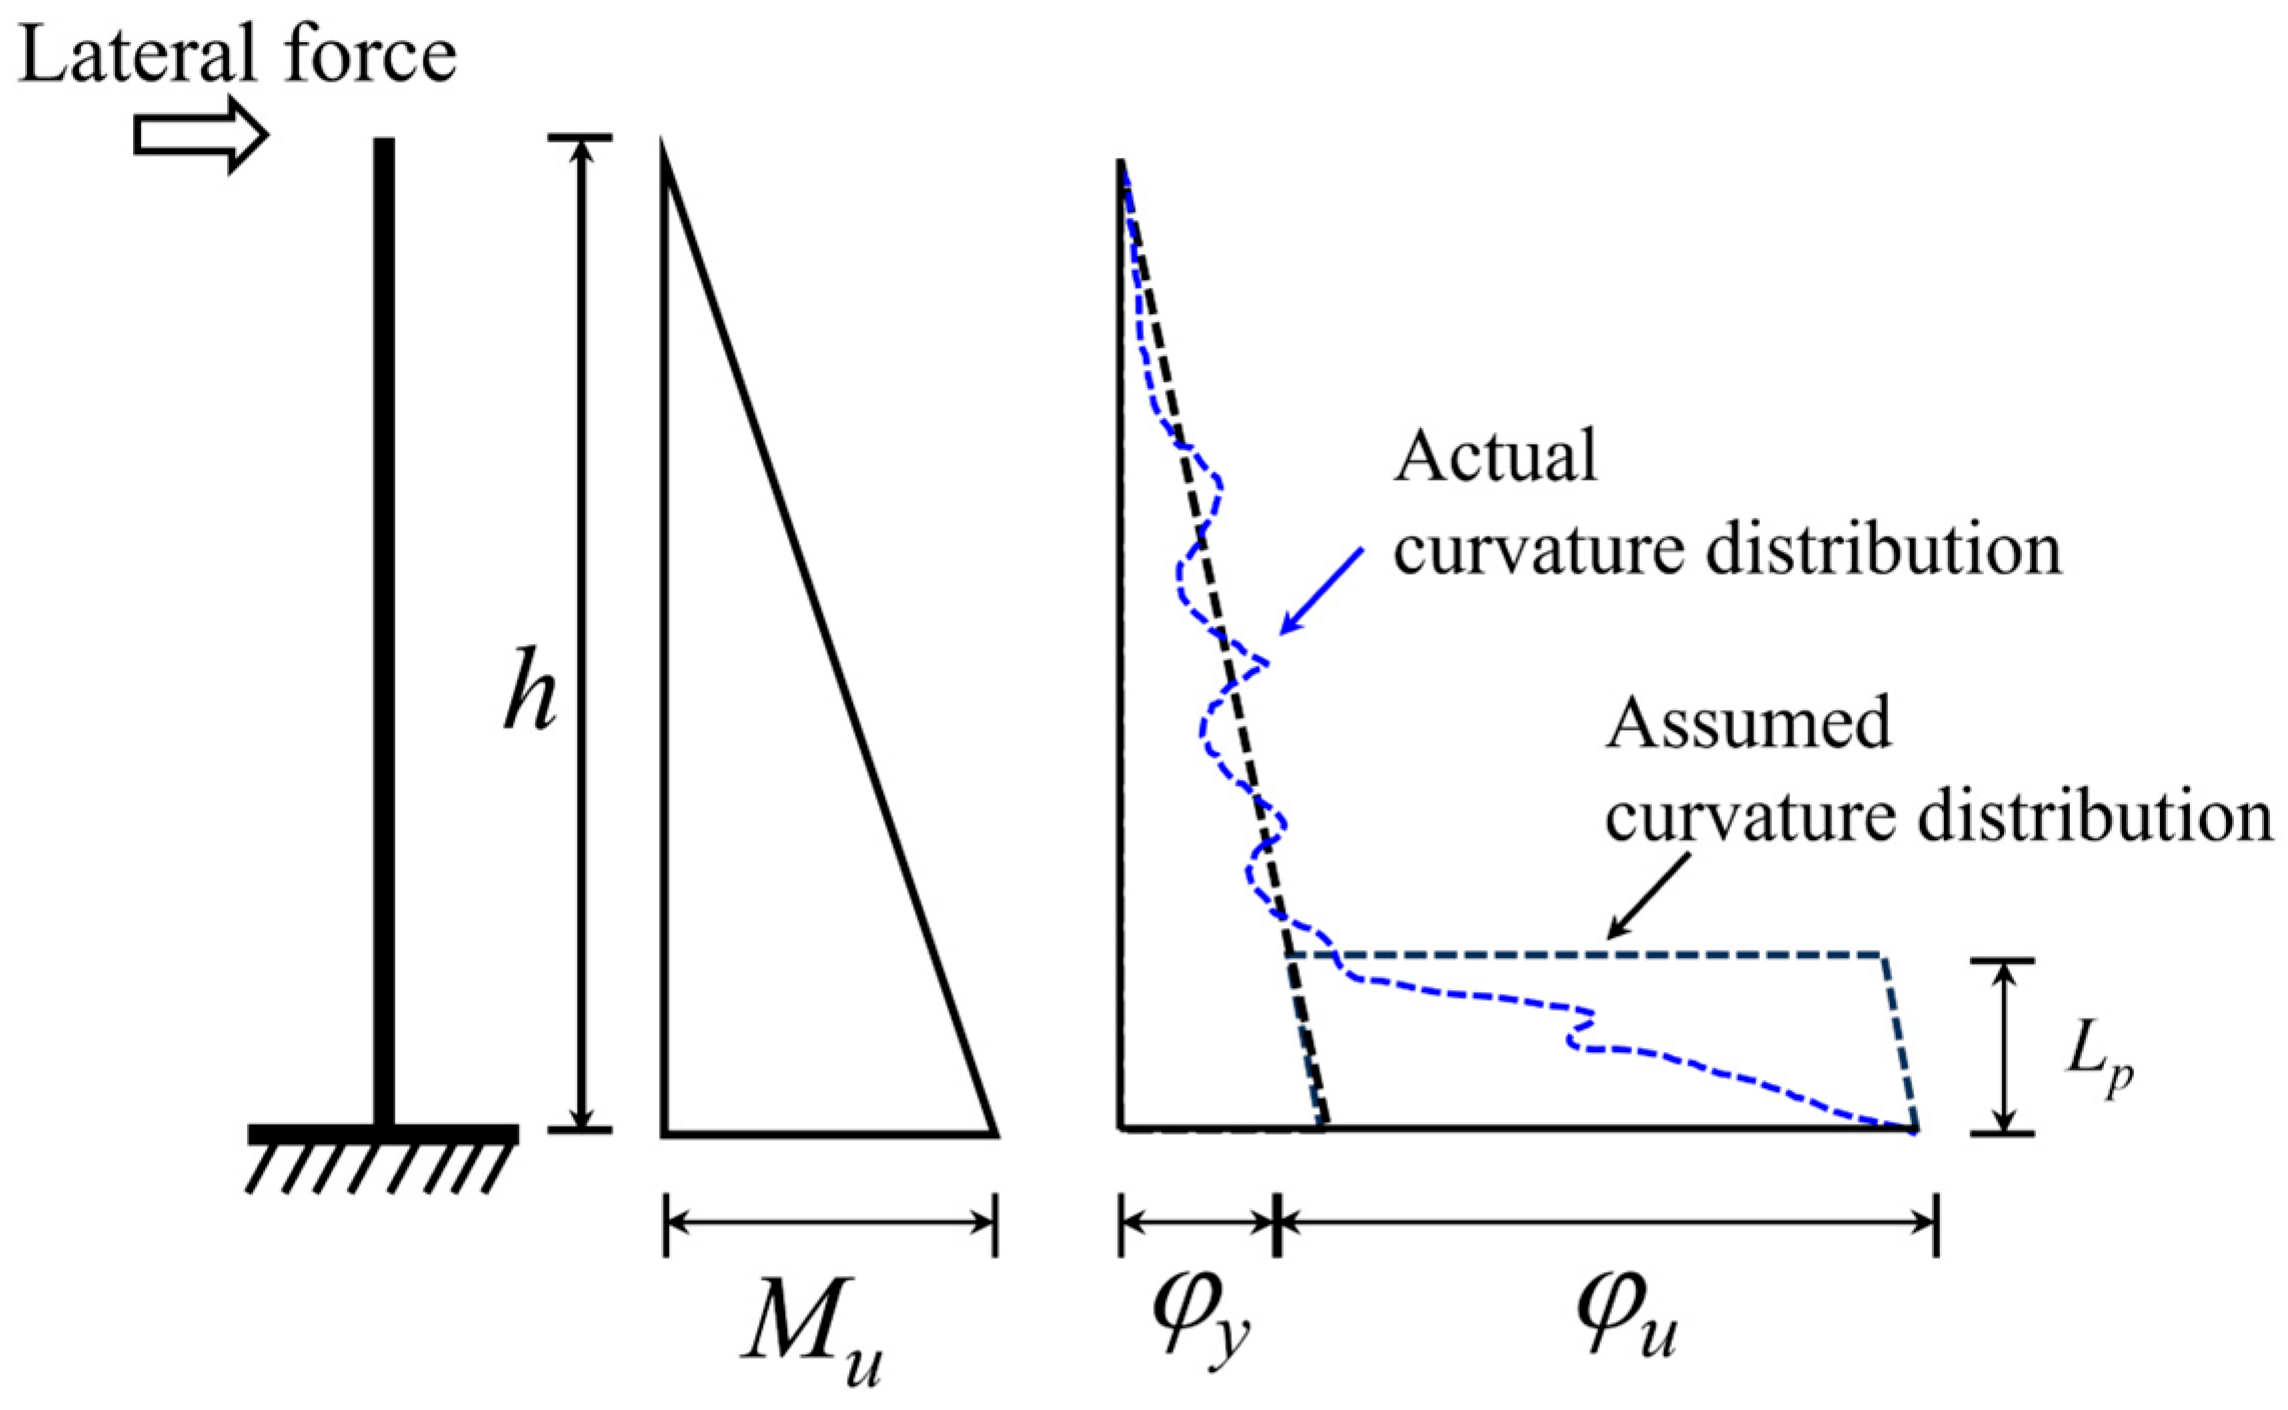
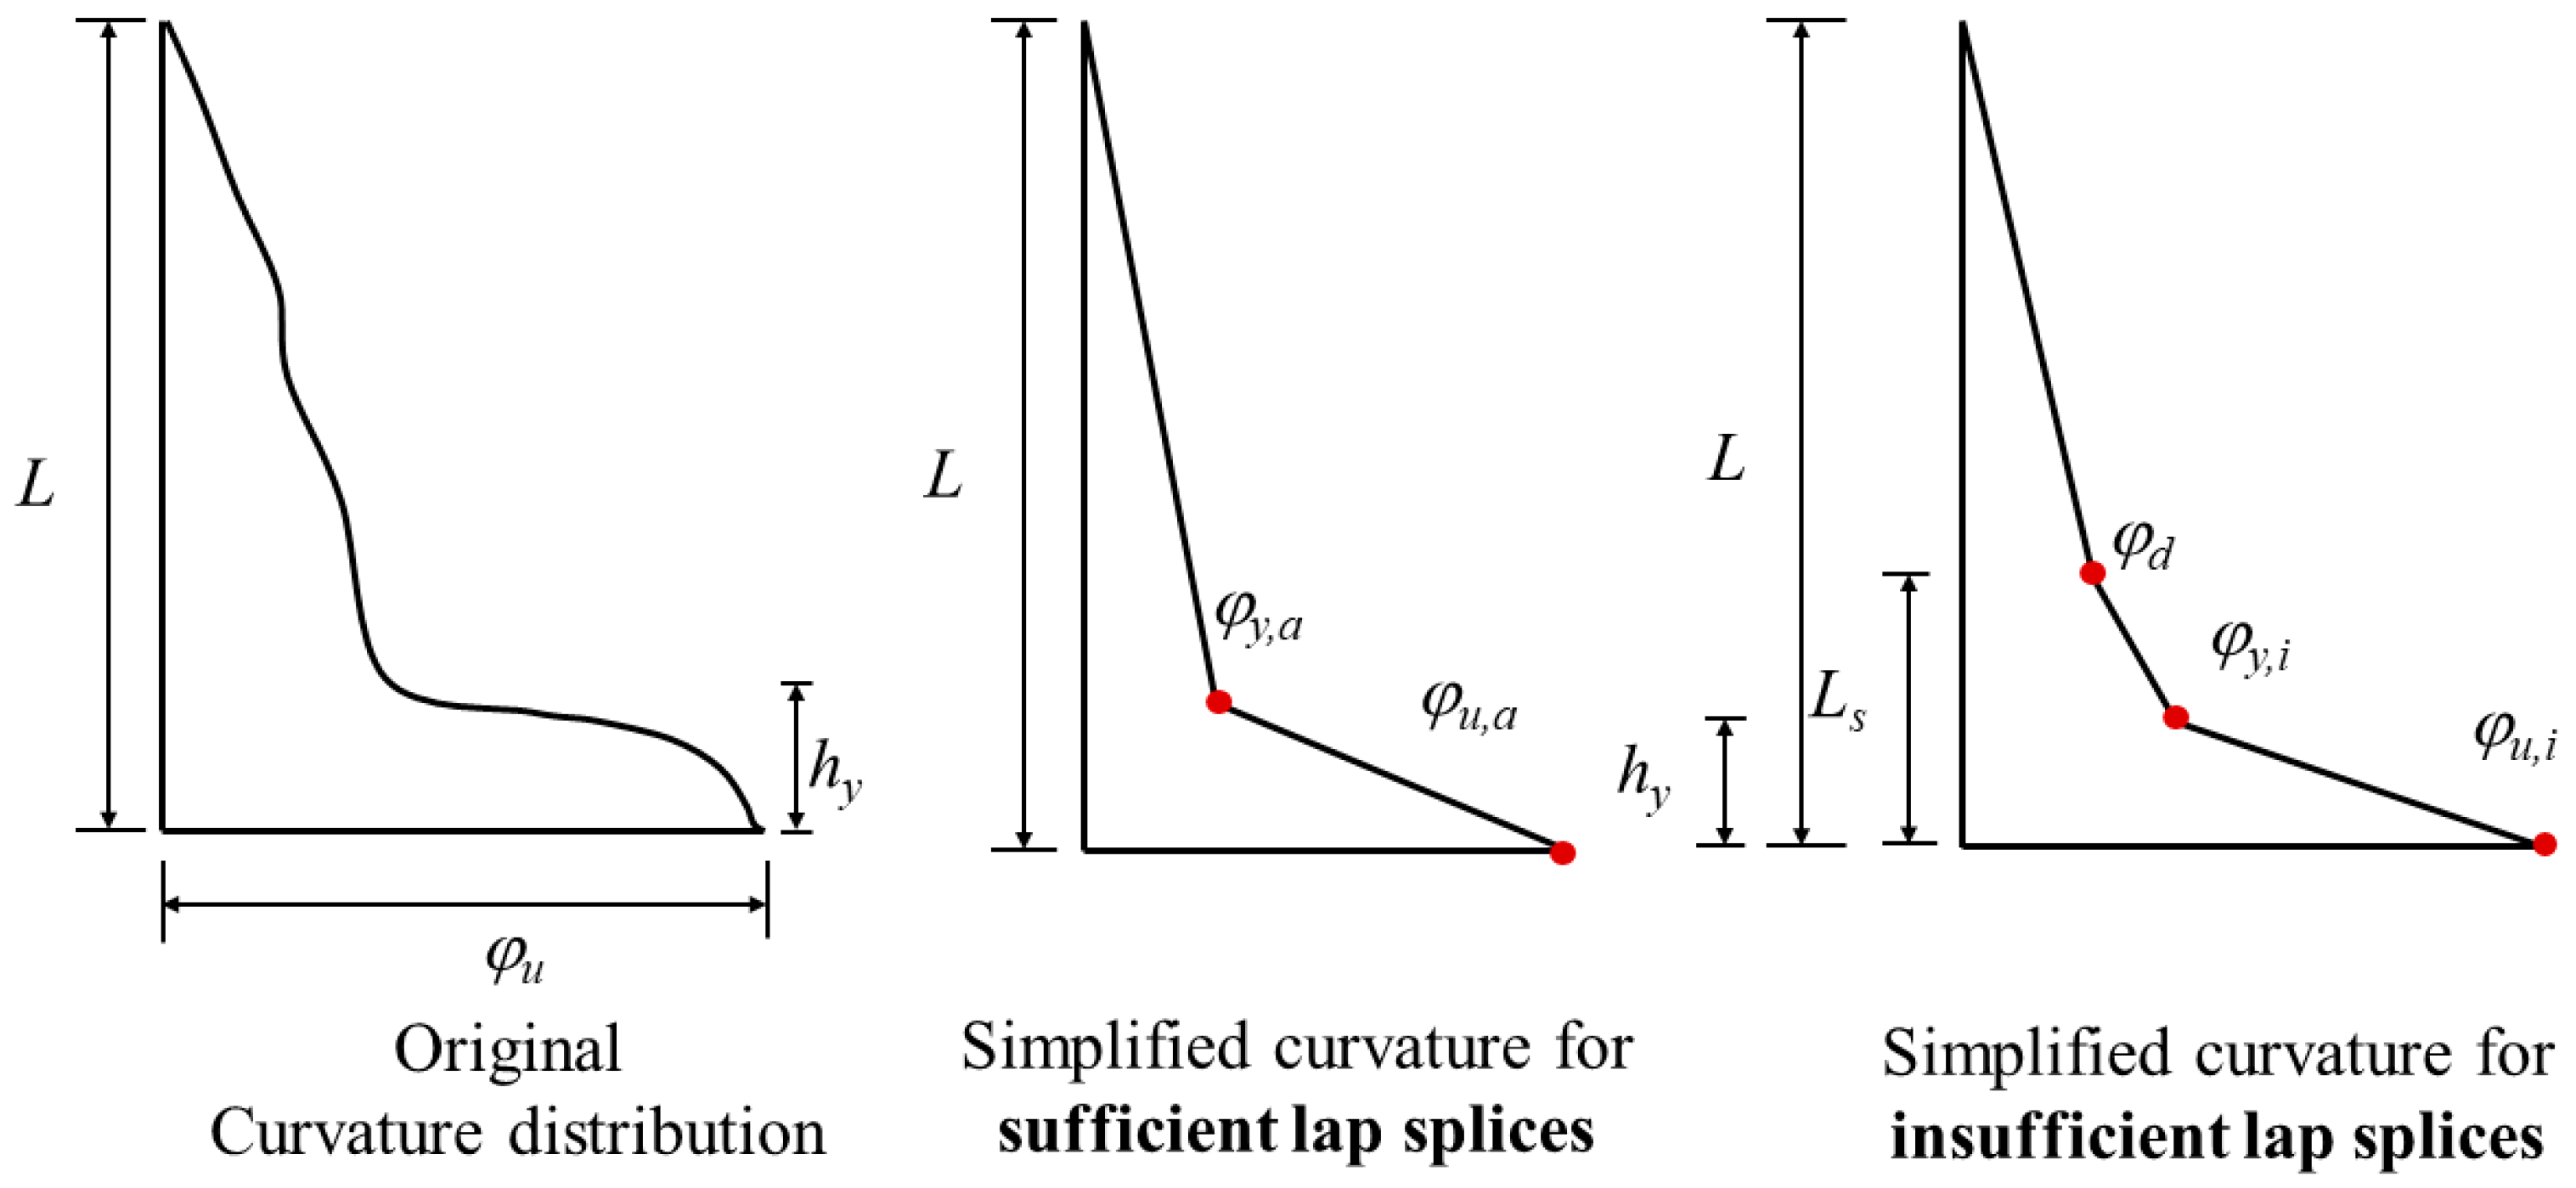
4.2. Equivalent Curvature Distribution

In step 2, once the curvature distribution along the height of the column for each section has been obtained, it becomes possible to calculate the displacement of the top of the column caused by flexural deformation. Figure 20 depicts the original curvature distribution along the column for a column subjected to an axial load N and a lateral load P applied at the top. Here, hy represents the length of the plastic zone, which can be determined using Equation (19).
h y = 1 ( M y / M max ) L
The existing modified plastic hinge model typically simplifies the curvature as a piecewise linear distribution along the column height and focuses primarily on columns with continuous longitudinal rebar. As shown in Figure 20, the authors provided two simplified curvature distributions for different splice lengths. When considering columns with insufficient splice length, the splice strength is smaller than that of one continuous rebar. Two different cross-sections should therefore be considered in the cross-section analysis: the spliced section and the non-spliced section. Generally, a plastic hinge occurs in the lap-spliced zone and the plastic hinge length is smaller than the splice length. Thus, at the intersection of the spliced and non-spliced sections, curvatures based on the two different cross-sections can be obtained. A variable φd was introduced to represent the curvature at the intersection point. φd,i and φd,a denote the curvatures of the spliced and non-spliced cross-sections at a height of ls (where ls denotes the splice length), respectively. φu,i denotes the ultimate curvature at the bottom of the column; φy,a denotes the yield curvature of the column. φd can be calculated as the average of these two parameters (i.e., φd = 0.5φd,a + 0.5φd,i).
For columns with sufficient splice length, the splice strength of a couple of spliced rebar can be equal to the strength of one continuous rebar with the same material properties. In this case, it can be considered that the column consists of only one cross-section (non-spliced section). In Figure 20, the author simplified the curvature to a bilinear distribution. When the section moment reached its yield moment, the section entered the plastic stage, and the curvature could not return to its original stage. Thus, the author took the maximum moment as the ultimate moment at the bottom of the column and the ultimate curvature moment at the bottom of the column and the ultimate curvature as the ultimate section curvature at the bottom of the column. Note that φy,a and φu,a denote the yield curvature and the ultimate curvature of the column.

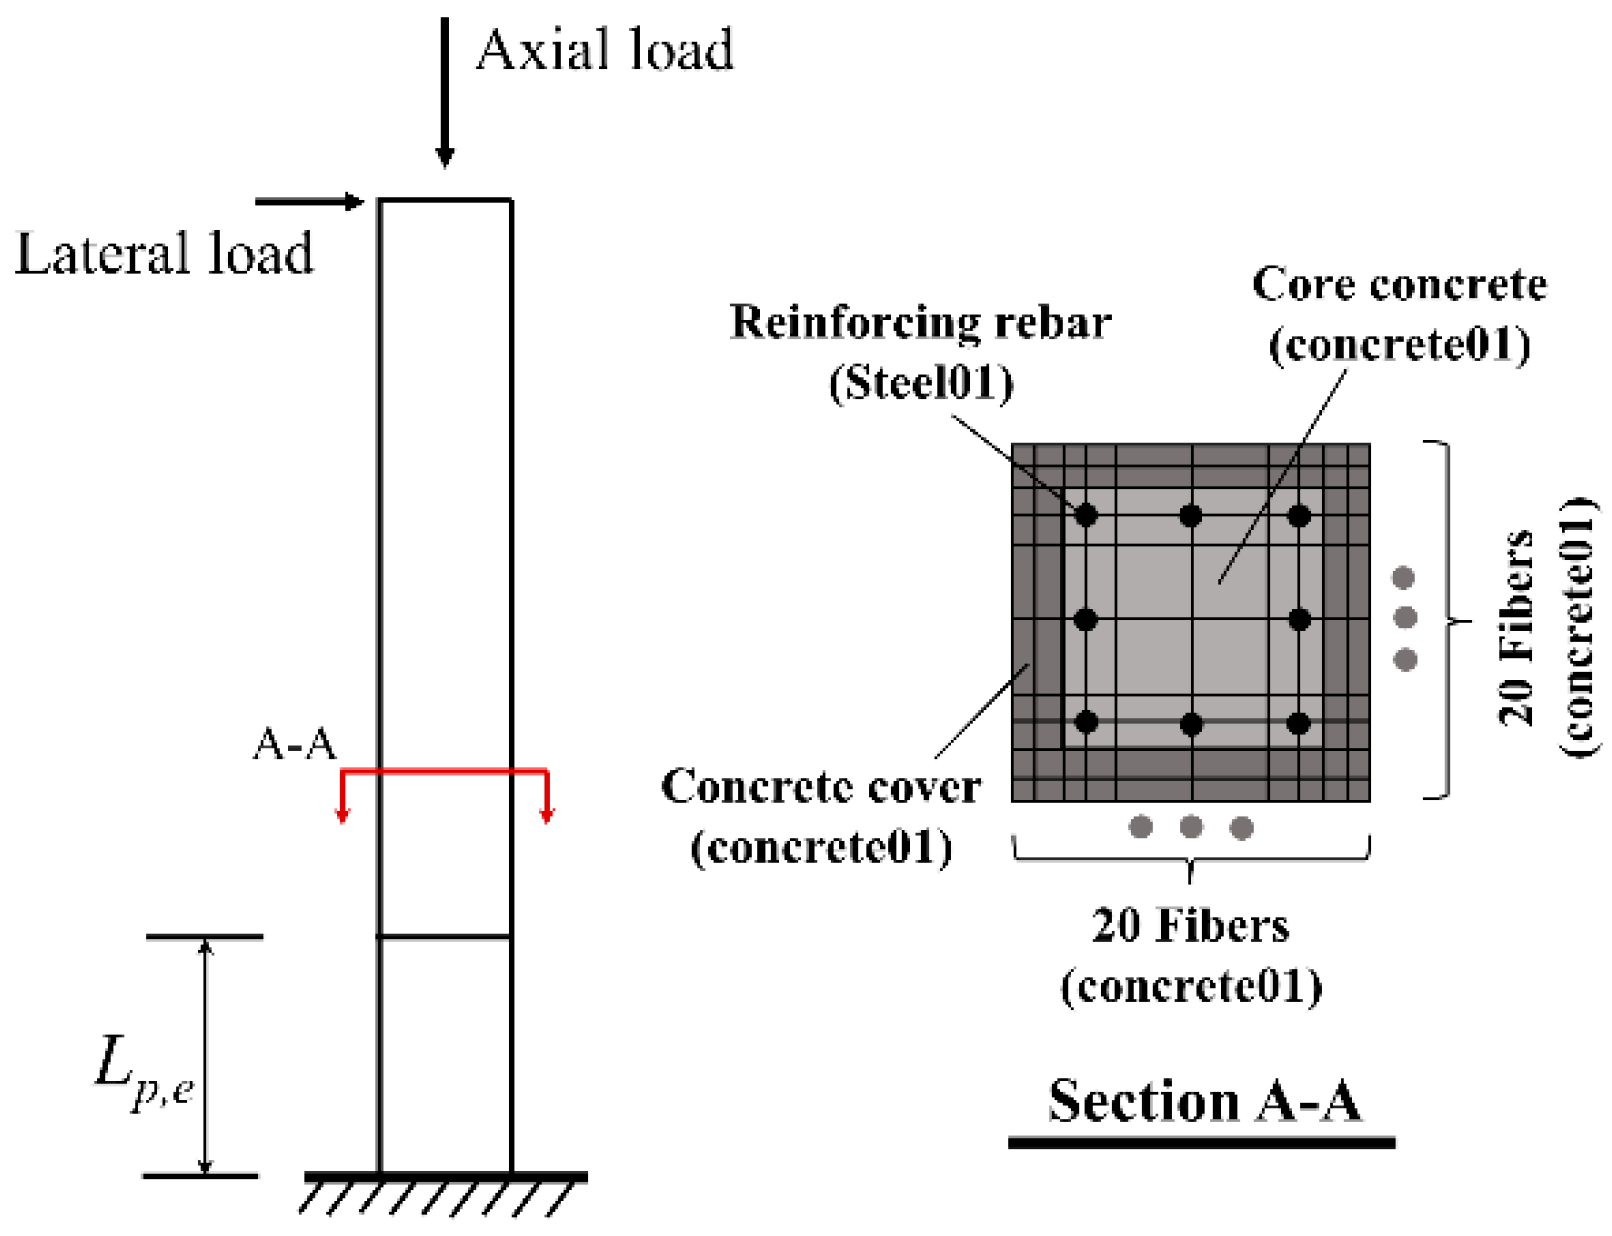
4.3. Equivalent Plastic Hinge Model

In part 3, the lateral displacement of RC column consists of three parts: flexural displacement Δflex, shear displacement Δshear, and slip displacement Δslip. This paper focused on columns with large shear span ratio (λ > 4); Δshear can be neglected. Based on the equation proposed by Park and Paulay [45], Paulay and Priestley [47] proposed a modified plastic hinge model shown as Equation (20); they considered that the plastic hinge length consists of two parts: 0.08Lc represents the plastic hinge length caused by flexural moment; 0.022 fy ds represents the plastic hinge length caused by bond slip. fy denotes expected yield stress of the longitudinal rebar expressed in megapascals; ds denotes the diameter of longitudinal rebar.
Based on the proposed equivalent curvature distribution, the curvature distribution function in relation to height φ = f(h) can be obtained; then, the ultimate displacement of the top of the column Δm, which is equal to flexural displacement Δflex, can be obtained by integrating curvatures along the height of column, as shown in Equation (21). By making an equation between Equation (21) and Equation (12), the equivalent plastic hinge length Lp,f only accounts for flexural force can be calculated as Equation (22), as shown in Figure 21. Replace 0.08Lc in Equation (20) with Lp,f, and the final expression for equivalent plastic hinge length of lap-spliced columns can be illustrated as Equation (23).
L p = 0.08 L c + 0.022 d s f y
Δ m = 0 L h f ( h ) d h
0 L h f ( h ) d h = 1 3 φ y L 2 + ( φ u φ y ) L p , f ( L 0.5 L p , f )
L p , e = L p , f + 0.022 d s f y

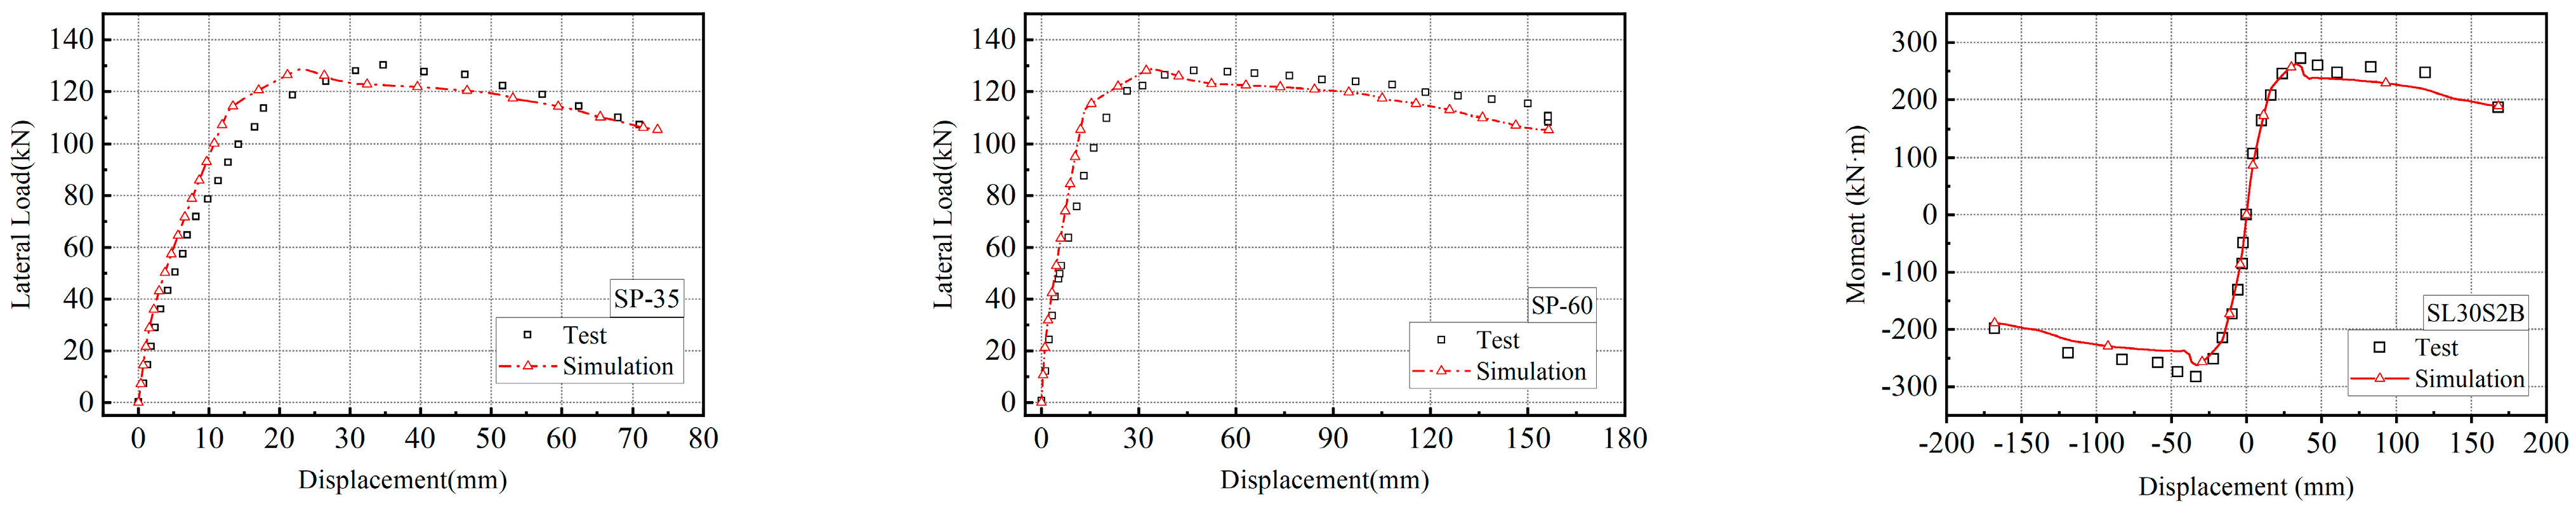
5. Verification of Proposed Modelling Method

In this section, the accuracy of the proposed modelling approach was verified using OpenSees, and the established test database is listed in Table 3. Figure 22 shows the schematic of the numerical model. The material properties of the core concrete were modified to take into account the confinement provided by the stirrups, in accordance with the model proposed by Scott [48]. The ForceBeamColumn element, which allows for users to customize the plastic hinge length, was selected to build the model. The Steel 01 material model was applied to simulate the longitudinal rebar; the detailed parameters of the rebars and concrete in the material models can be determined using the test database. Table 4 presents both the predicted values and the error δ. The error δ was calculated as (prediction–test result)/test result. A comparison of the simulated and tested curves is shown in Figure 23.
The proposed modelling method can accurately predict the load–deformation response. As shown in Figure 23, the predicted envelope curves show an acceptable level of agreement with the test curves. The model error for some parameters is greater than 10% because this method does not consider deterioration of the plastic hinge. When columns are subjected to a moderate-intensity earthquake, deterioration of the core zone at the bottom of the columns may gradually decrease their rotation capacity. Thus, subsequent studies will conduct further research to modify the proposed modelling method.

6. Conclusions

In this study, a modelling method for columns with lap splices was proposed. A strengthening method for short lap-spliced columns was introduced. Then, a test with four large-scale columns was carried out to verify the effectiveness of proposed modelling method and strengthening method. It should be explained that the experimental validation was conducted on a limited sample size of four large-scale specimens. While the inclusion of four additional specimens from the existing literature partially mitigates this constraint, the generalizability of the findings to columns with significantly different geometric configurations (e.g., varying cross-sectional aspect ratios, longitudinal rebar ratios, or splice length-to-diameter ratios) requires further validation. The restricted specimen pool was primarily dictated by the substantial material costs and fabrication complexity associated with full-scale column testing. Future studies incorporating parametric variations in splice length, stirrups spacing, and cross-sectional dimensions are essential to establish comprehensive design guidelines. According to the experimental results and simulated results, the following conclusions can be drawn:
(1) Compared with existing methods, the proposed method considers the effect of the columns’ geometric parameters through cross-section analysis. The author simplifies the effect of lap splices into an equivalent plastic hinge of a specific length and proposes a modified plastic hinge length equation. A numerical model based on OpenSees was established according to the proposed method. Comparisons between test and simulation results illustrate that this model can accurately predict the load–deformation response of columns with lap splices.
(2) An efficient active confinement method has been proposed to strengthen columns with lap splice defects. The suggested device can be installed on the exterior of columns and an equation has been proposed to calculate the minimum lateral force required for different lap-spliced lengths. Improving the bond behavior between spliced rebar and concrete can enhance the mechanical performance of columns with lap splice defects. Comparing strengthened and non-strengthened specimens shows that the former exhibit increased bond strength, slower bond degradation, and higher ductility. However, further research is required to validate the effectiveness of this strengthening approach for columns with various splice lengths under cyclic loads.
(3) The failure mode, bond strength, and ductility of columns with lap splices can be influenced by splice length. However, peak loads showed little sensitivity to splice length or the ratio of transverse stirrups. Specimens with lap splice defects demonstrated brittle failure due to inadequate stress transfer across the lap splice zone. This resulted in a rapid deterioration in bond strength upon crack initiation.
(4) While the proposed strengthening technique demonstrates improved load-bearing capacity under monotonic loading, its performance under cyclic loading conditions remains unverified. The absence of cyclic test data introduces uncertainties regarding potential strength degradation, stiffness deterioration, and energy dissipation characteristics during seismic reversals. This limitation stems from the primary research focus on establishing fundamental mechanical behavior under controlled static conditions. Future investigations incorporating reversed cyclic loading protocols are strongly recommended to comprehensively evaluate the method’s seismic retrofit effectiveness.

Author Contributions

Conceptualization, Y.Z. and X.Z.; methodology, F.J.; software, Y.G.; validation, Y.Z., X.Z. and Y.G.; formal analysis, Y.Z.; investigation, F.J.; resources, X.Z.; data curation, F.J.; writing—original draft preparation, Y.Z.; writing—review and editing, Y.Z.; visualization, Y.Z.; supervision, X.Z. and F.J.; project administration, F.J.; funding acquisition, X.Z. and F.J. All authors have read and agreed to the published version of the manuscript.

Funding

This research was funded by the National Natural Science Foundation of China, grant number No. 52278148; Research and Development Project of Ministry of Housing and Urban–Rural Development, grant number No. K20200641; and Beijing Tongzhou District Science and Technology Innovation Talent Support Project, grant number No. JCQN2024003.

Data Availability Statement

The original contributions presented in this study are included in the article. Further inquiries can be directed to the corresponding author.

Conflicts of Interest

Author Fangxin Jiang was employed by the company Senior Engineer, China Building Technique Group Co., Ltd. The remaining authors declare that the research was conducted in the absence of any commercial or financial relationships that could be construed as a potential conflict of interest.

References

  1. Aboutaha, R.S.; Engelhardt, M.D.; Jirsa, J.O.; Kreger, M.E. Experimental investigation of seismic repair of lap splice failures in damaged concrete columns. ACI Struct. J. 1999, 96, 297–306. [Google Scholar]
  2. Lucchini, A.; Franchin, P.; Kunnath, S. Failure simulation of shear-critical RC columns with non-ductile detailing under lateral load. Earthq. Eng. Struct. Dyn. 2017, 46, 855–874. [Google Scholar] [CrossRef]
  3. American Concrete Institute (ACI) Committee 318. Building Code Requirements for Structural Concrete (ACI 318-56) and Commentary; American Concrete Institute: Farmington Hills, MI, USA, 1956. [Google Scholar]
  4. American Concrete Institute (ACI) Committee 318. Building Code Requirements for Structural Concrete (ACI 318-63) and Commentary; American Concrete Institute: Farmington Hills, MI, USA, 1963. [Google Scholar]
  5. American Concrete Institute (ACI) Committee 318. Building Code Requirements for Structural Concrete (ACI 318-77) and Commentary; American Concrete Institute: Farmington Hills, MI, USA, 1977. [Google Scholar]
  6. Jeon, J.-S.; Lowes, L.N.; DesRoches, R.; Brilakis, I. Fragility curves for non-ductile reinforced concrete frames that exhibit different component response mechanisms. Eng. Struct. 2015, 85, 127–143. [Google Scholar] [CrossRef]
  7. Haavisto, J.; Alho, H.; Laaksonen, A. Behavior of lap splices in reinforced concrete beams after bar yielding. Struct. Concr. 2023, 24, 5245–5264. [Google Scholar] [CrossRef]
  8. Bousias, S.; Spathis, A.L.; Fardis, M.N. Seismic retrofitting of columns with lap splices through CFRP jackets. In Proceedings of the 13th World Conference on Earthquake Engineering, Vancouver, BC, Canada, 1–6 August 2004. (No. 765). [Google Scholar]
  9. Muhammad Gillani, A.S.; Lee, S.-G.; Lee, S.-H.; Lee, H.; Hong, K.J. Local Behavior of Lap-Spliced Deformed Rebars in Reinforced Concrete Beams. Materials 2021, 14, 7186. [Google Scholar] [CrossRef]
  10. Zhang, Y.; DesRoches, R.; Tien, I. Impact of corrosion on risk assessment of shear-critical and short lap spliced bridges. Eng. Struct. 2019, 189, 260–271. [Google Scholar] [CrossRef]
  11. Kim, C.-G.; Park, H.-G.; Eom, T.-S. Seismic Performance of Reinforced Concrete Columns with Lap Splices in Plastic Hinge Region. ACI Struct. J. 2018, 115, 235–245. [Google Scholar] [CrossRef]
  12. Kim, C.-G.; Park, H.-G.; Eom, T.-S. Effects of Type of Bar Lap Splice on Reinforced Concrete Columns Subjected to Cyclic Loading. ACI Struct. J. 2019, 116, 183–194. [Google Scholar] [CrossRef]
  13. American Concrete Institute (ACI) Committee 318. Building Code Requirements for Structural Concrete (ACI 318-95) and Commentary; American Concrete Institute: Farmington Hills, MI, USA, 1995. [Google Scholar]
  14. CAN/CSA-S6-06; Canadian Highway Bridge Design Code. Canadian Standards Association (CAN/CSA): Mississauga, ON, Canada, 2006.
  15. American Association of State Highway and Transportation Officials (AASHTO). LRFD Bridge Design Specifications; American Association of State Highway and Transportation Officials (AASHTO): Washington, DC, USA, 2013. [Google Scholar]
  16. Melek, M.; Wallace, J.W. Cyclic Behavior of Columns with Short Lap Splices. ACI Struct. J. 2004, 101, 802–811. [Google Scholar]
  17. Lynn, A.C.; Moehle, J.P.; Mahin, S.A.; Holms, W.T. Seismic Evaluation of Existing Reinforced Concrete Building Columns. Earthq. Spectra 1996, 12, 715–739. [Google Scholar] [CrossRef]
  18. Haroun, M.A.; Elsanadedy, H.M. Fiber-Reinforced Plastic Jackets for Ductility Enhancement of Reinforced Concrete Bridge Columns with Poor Lap-Splice Detailing. J. Bridge Eng. 2005, 10, 749–757. [Google Scholar] [CrossRef]
  19. Harries, K.A.; Ricles, J.M.; Pessiki, S.; Sause, R. Seismic Retrofit of Lap Splices in Nonductile Square Columns Using Carbon Fiber-Reinforced Jackets. ACI Struct. J. 2006, 103, 874–884. [Google Scholar]
  20. Harajli, M. Seismic Behavior of RC Columns with Bond-Critical Regions: Criteria for Bond Strengthening Using External FRP Jackets. J. Compos. Constr. 2008, 12, 69–79. [Google Scholar] [CrossRef]
  21. Tarquini, D.; Almeida, J.P.; Beyer, K. Influence of Lap Splices on the Deformation Capacity of RC Walls. II: Shell Element Simulation and Equivalent Uniaxial Model. J. Struct. Eng. 2017, 143, 04017157. [Google Scholar] [CrossRef]
  22. Tariverdilo, S.; Farjadi, A.; Barkhordary, M. Fragility curves for reinforced concrete frames with lap spliced columns. IJE Trans. A Basics 2009, 22, 213–224. [Google Scholar]
  23. Barkhordary, M.; Tariverdilo, S. Vulnerability of ordinary moment resistant concrete frames. Earthq. Eng. Eng. Vib. 2011, 10, 519–533. [Google Scholar] [CrossRef]
  24. Choi, E.; Park, S.H.; Chung, Y.S.; Kim, H.S. Seismic fragility analysis of lap spliced reinforced concrete columns retrofitted by SMA wire jackets. Smart Mat. Struct. 2013, 22, 085028. [Google Scholar] [CrossRef]
  25. Bai, Y.-L.; Bai, S.-C.; Mei, S.-J.; Jia, J.-F. Experimental and numerical study of PEN FRP-strengthened circular RC columns under lateral cyclic loading with high axial compression ratio. Eng. Struct. 2023, 294, 116711. [Google Scholar] [CrossRef]
  26. Iacobucci, R.D.; Sheikh, S.A.; Bayrak, O. Retrofit of square concrete columns with carbon fiber-reinforced polymer for seismic resistance. ACI Struct. J. 2003, 100, 785–794. [Google Scholar]
  27. Wang, D.Y.; Wang, Z.Y.; Smith, S.T.; Yu, T. Seismic performance of CFRP-confined circular high-strength concrete columns with high axial compression ratio. Constr. Build. Mater. 2017, 134, 91–103. [Google Scholar] [CrossRef]
  28. Kharal, Z.; Sheikh, S.A. Seismic behavior of square and circular concrete columns with GFRP reinforcement. J. Compos. Constr. 2020, 24, 04019059. [Google Scholar] [CrossRef]
  29. Ye, Y.-Y.; Liang, S.-D.; Feng, P.; Zeng, J.-J. Recyclable LRS FRP composites for engineering structures: Current status and future opportunities. Compos. Part. B-Eng. 2021, 212, 108689. [Google Scholar] [CrossRef]
  30. Anggawidjaja, D.; Ueda, T.; Dai, J.; Nakai, H. Deformation capacity of RC piers wrapped by new fiber-reinforced polymer with large fracture strain. Cem. Concr. Comp. 2006, 28, 914–927. [Google Scholar] [CrossRef]
  31. Zhang, C.; Wu, L.; Elchalakani, M.; Cai, J. Cyclic loading test for reinforced concrete columns strengthened with high-strength engineered cementitious composite jacket. Eng. Struct. 2023, 278, 115571. [Google Scholar] [CrossRef]
  32. Hong, S.-G.; Lee, J.-H.; Choi, Y.; Gu, I.-Y. Seismic Strengthening of Concrete Columns by Ultrahigh-Performance Fiber-Reinforced Concrete Jacketing. J. Struct. Eng. 2021, 47, 04021157. [Google Scholar] [CrossRef]
  33. Mansour, W.; Li, W.; Ghalla, M.; Badawi, M.; El Zareef, M.A. Improving the punching capacity of two-way RC flat slabs via external strengthening using various configurations of aluminum sheets. Constr. Build. Mater. 2024, 420, 135611. [Google Scholar] [CrossRef]
  34. Saleh, H.; Kalfat, R.; Abdouka, K.; Al-Mahaidi, R. Experimental and numerical study into the punching shear strengthening of RC flat slabs using post-installed steel bolts. Constr. Build. Mater. 2018, 188, 28–39. [Google Scholar] [CrossRef]
  35. Abas Golham, M.; Al-Ahmed, A.H.A. Behavior of GFRP reinforced concrete slabs with openings strengthened by CFRP strips. Results Eng. 2023, 18, 101033. [Google Scholar] [CrossRef]
  36. Harajli, M.H.; Hantouche, E.G. Effect of Active versus Passive Confinement on Seismic Response of Wide RC Columns with Lap Splices. J. Struct. Eng. 2014, 141, 04014221. [Google Scholar] [CrossRef]
  37. FEMA (Federal Emergency Management Agency). Multi-Hazard Loss Estimation Methodology-Earthquake Model (HAZUS-MH MR1); FEMA (Federal Emergency Management Agency): Washington, DC, USA, 2003.
  38. National Standards Authority of Ireland. Design of Structures for Earthquake Resistance: Part 3: Assessment and Retrofitting of Buildings (Eurocode 8); National Standards Authority of Ireland: Brussels, Belgium, 1998.
  39. American Concrete Institute (ACI) Committee 318. Building Code Requirements for Structural Concrete (ACI 318-14) and Commentary; American Concrete Institute: Farmington Hills, MI, USA, 2014. [Google Scholar]
  40. ACI Committee 374. Acceptance Criteria for Moment Frames Based on Structural Testing and Commentary (ACI 374.1-05); American Concrete Institute: Farmington Hills, MI, USA, 2005; pp. 1–9. [Google Scholar]
  41. Park, R. Valuation of ductility of structures and structural assemblages from laboratory testing. Bull. N. Z. Soc. Earthq. Eng. 1989, 22, 155–166. [Google Scholar]
  42. Pan, B.; Qian, K.M.; Xie, H.M.; Asundi, A. Two-dimensional digital image correlation for in-plane displacement and strain measurement: A review. Meas. Sci. Technol. 2009, 20, 062001. [Google Scholar] [CrossRef]
  43. Zhao, Y.H.; Zhang, X.; Zhuang, X.H. Seismic performance of squared lap-spliced RC columns strengthened by active confinement technique under quasi-static cyclic load. Structures 2025, 74, 108622. [Google Scholar] [CrossRef]
  44. Orangun, C.O.; Jirsa, J.O.; Breen, J.E. Strength of Anchored Bars: A Reevaluation of Test Data on Development Length and Splices; Research Rep. No. 154-3F1975; Center for Highway Research, University of Texas at Austin: Austin, TX, USA, 1975; p. 78. [Google Scholar]
  45. Park, R.; Paulay, T. Reinforced Concrete Structures; Wiley: New York, NY, USA, 1975. [Google Scholar]
  46. Canbay, E.; Frosch, R.J. Bond Strength of Lap-Spliced Bars. ACI Struct. J. 2005, 102, 605–614. [Google Scholar]
  47. Paulay, T.; Priestley, M.J.N. Seismic Design of Reinforced Concrete and Masonry Buildings; Wiley: New York, NY, USA, 1992. [Google Scholar]
  48. Scott, B.D.; Park, R.; Priestly, M.J.N. Stress-strain Behavior of Concrete Confined by Overlapping Hoops at Low and High Strain Rates. ACI Struct. J. 1982, 79, 13–27. [Google Scholar]
  49. Lee, C.S.; Han, S.W. Cyclic behaviour of lightly-reinforced concrete columns with short lap splices subjected to unidirectional and bidirectional loadings. Eng. Struct. 2019, 189, 373–384. [Google Scholar] [CrossRef]
Figure 1. Detailed parameters of specimen.
Buildings 15 01964 g001
Figure 2. Construction process.
Buildings 15 01964 g002
Figure 3. Experiment overview: (a) loading device; (b) loading pattern; (c) DIC technology measuring equipment.
Buildings 15 01964 g003
Figure 4. Details of strain gauges.
Buildings 15 01964 g004
Figure 5. Illustration of the proposed active confinement: (a) overview; (b) lap-spliced rebar at the corner of the cross-section; (c) force diagram of cross-section; (d) size of isolated body; (e) force diagram of isolated body.
Buildings 15 01964 g005
Figure 6. Detailed parameters of strengthening devices in this study.
Buildings 15 01964 g006
Figure 7. Typical failure phenomenon.
Buildings 15 01964 g007
Figure 8. Load–displacement curves for specimens.
Buildings 15 01964 g008
Figure 9. Load ratios for columns.
Buildings 15 01964 g009
Figure 10. Stiffness degradation: (a) original curve; (b) normalized curve.
Buildings 15 01964 g010
Figure 11. Contrast of displacement ductility.
Buildings 15 01964 g011
Figure 12. Strain distribution along the splice length: (a) SP-35; (b) SP-60E.
Buildings 15 01964 g012
Figure 13. Strain of lap-splice rebar: (a) SP-35; (b) SP-60E.
Buildings 15 01964 g013
Figure 14. Comparison of strains along the height of column for 35db specimens: (a) bottom rebar; (b) upper rebar.
Buildings 15 01964 g014
Figure 15. Deformation diagram of cross-section.
Buildings 15 01964 g015
Figure 16. Diagram of curvature calculation.
Buildings 15 01964 g016
Figure 17. Curvature distribution along the splice length: (a) SP-35; (b) SP-60E.
Buildings 15 01964 g017
Figure 18. Distribution of equivalent plastic hinge.
Buildings 15 01964 g018
Figure 19. Step 1: cross-section analysis.
Buildings 15 01964 g019
Figure 20. Step 2: Modified curvature distribution.
Buildings 15 01964 g020
Figure 21. Step 3: equivalent plastic hinge model for lap-spliced column.
Buildings 15 01964 g021
Figure 22. FEM model of lap-spliced columns (unit: mm).
Buildings 15 01964 g022
Figure 23. Comparison between simulated curves and test curves.
Buildings 15 01964 g023aBuildings 15 01964 g023b
Table 1. Test results.
SpecimenSplice Length
(mm or Ratio)
Load Capacity
(kN or Ratio)
Displacement
(mm or Ratio)
lsls/dbls/lsm aPyPmΔyΔmΔuΔu/Δy
SP-35700350.71111.20125.2316.3735.1765.54.00
SP-601200601.22110.8128.7120.5360.36156.37.61
SP-60E1200601.22107.48122.7819.9146.04134.37.65
SP-35S700350.7110.50127.8819.9781.72171.18.56
a lsm,ACI for all specimens in this test is 920 mm, which is calculated according to ACI 318-14.
Table 2. Summary of curvature and equivalent plastic hinge length.
SpecimenΔy
(mm)
φy
(1/m)
Δu
(mm)
φu
(1/m)
SP-3516.370.0180565.50.096
SP-6020.530.0202156.30.1302
SP-60E17.540.02038134.30.133
Table 3. Database of RC columns with lap splices.
No.SourceSection Dimensions
(mm or MPa)
Concrete
(MPa)
Envelope Curve Response
(mm or kN)
mncls/dbdbfyfuafcΔyΔuPyPm
1This study400400403520447.61637.29180020.616.3735.17111.20125.23
2400400406020447.61637.29180020.620.5360.36110.8128.71
3Kim et al. [11]400400403025.4557.5689.524002516.2132.089.41115.83
4400400404025.4557.5689.524002517.916892.79117.08
5Lee et al. [49]450450402025.4524/1800257.431.5121.44161
6450450402025.4524/1800256.023.4137.55185
Note: (a) m and n denote the section height and width, respectively. (b) Some specific values (e.g., the value of Py in the test results of Kim et al. [11]) were not provided in the literature; the missing values were defined based on the hysteresis curve in the corresponding literature. (c) The value of fu was not given in the study of Lee et al. [49]. This had no influence on the predicted results, because a bilinear stress–strain model was used in the finite element model to simulate the longitudinal rebar, which can be defined using existing parameters. (d) Some of the parameters required for the numerical simulation are not listed here for the sake of simplicity. More details can be found in the literature [11,49]. (e) Py and Pu can be obtained using the equation M = P·a.
Table 4. Predicted results and error of the numerical model.
No.SourcePredicted Results (mm or kN)Model Error (%)
DyDuPyPmDyDuPyPm
1This study16.3670.77114.73128.91−0.06+8.05+3.17+2.72
217.87142.5114.02128.68−3.56−8.83+3.11−0.02
3Kim et al. [11]16.7128.392.16109.38+3.1−2.8+0.5−5.6
414.916596.58115.95−16.8+1.7+4.1−1.0
5Lee et al. [49]6.230.0131.27156.22−16.2−4.8+8.1−3.0
66.319.8156.61188.27+5.0−15.4+13.9+1.8
Disclaimer/Publisher’s Note: The statements, opinions and data contained in all publications are solely those of the individual author(s) and contributor(s) and not of MDPI and/or the editor(s). MDPI and/or the editor(s) disclaim responsibility for any injury to people or property resulting from any ideas, methods, instructions or products referred to in the content.

