Article

Microstructural Evolution and Rheological Enhancement of Asphalt–Rubber Binders: Unveiling the Role of Morphology in Performance

by
Eslam Deef-Allah
1,2,
Mohyeldin Ragab
3,
Mohamed Attia
2 and
Magdy Abdelrahman
1,*
1
Department of Civil, Architectural, and Environmental Engineering, Missouri University of Science & Technology, Rolla, MO 65409, USA
2
Construction Engineering and Utilities Department, Faculty of Engineering, Zagazig University, Zagazig 44519, Egypt
3
Pure Asphalt Company, 3455 W 31st Pl, Chicago, IL 60608, USA
*
Author to whom correspondence should be addressed.
Buildings 2025, 15(12), 1963; https://doi.org/10.3390/buildings15121963
Submission received: 10 May 2025 / Revised: 31 May 2025 / Accepted: 4 June 2025 / Published: 6 June 2025

Abstract

:
Understanding the development of an asphalt binder’s internal network structure is essential when interacting asphalt and crumb rubber. Thus, the focus of this study was to reveal the development of asphalt–rubber binders’ (A-RBs) network structures at different interaction times and their correlation with performance. Atomic force microscopy (AFM) was utilized to image the morphologies of the binders, and the binders’ performances were explored rheologically with a dynamic shear rheometer. Extending the interaction time to 8 h and utilizing a soft binder altered the network structures from agglomerated dispersoids—minuscule distributed phase zones embedded in the continuous matrix of the asphalt binder—to well-organized lamellar structures. At 8 h, using a softer binder increased stiffness by 25% and elasticity by 15%, accelerating early rubber dissolution. Extending the interaction time from 4 to 8 h increased rubber dissolution by 5–23%, depending on the binder type. The 150% increase in stress overshoot for A-RBs with the soft binder versus those with the stiff one reflects the development of the network structure. At 8 h, the soft binder reduced the AFM mean phase angle by 10% and the standard deviation by 64%, indicating a more homogeneous and stable network than that obtained with the stiff binder. Thus, the 8 h interaction time and soft binder facilitated rubber swelling and enhanced component diffusion, aiding in the formation of a homogeneous network.

1. Introduction

Asphalt has a complex chemical composition, which gives rise to its unique physical and rheological characteristics [1,2]. Its microstructure can also play a decisive role in the elasticity and stiffness of the binder. Asphalt is primarily composed of asphaltenes and maltenes [3]. The most polar and complex fraction, named asphaltenes, tends to aggregate, so this fraction is the most complex component in an asphalt binder [4]. Their strong affinity for other components in the mixture is what defines the material’s rheological behavior. Several studies have used atomic force microscopy (AFM) to investigate the network structure of asphalt [5,6,7,8]. The distribution of asphaltenes within the asphalt matrix is a fundamental factor in the classification of asphalt types and also plays a key role in the determination of asphalt’s physical properties [9]. Variations in asphaltene distribution affect binder performance, thus drawing attention to their role in determining asphalt’s behavior.
The interrupted shear flow (ISF) test reflected the network structures’ development through the breakdown and rearrangement of the network structures inside polymer-modified binders [10,11]. The steps of this test involved applying a constant value of shear strain, followed by a rest period before applying the shear strain again [10,11]. During the shearing of the neat asphalt, the shear stress reached a constant “steady” condition immediately at the commencement of each shearing cycle and rapidly diminished upon the cessation of shearing strain [10,11]. Upon resumption of the shearing strain following a rest time, the stress remained constant at the initial level observed at the commencement of the test. The weak associations of hydrogen bonding and bipolar attractions [10] kept this behavior stable but were easily disrupted by stress or temperature changes. Conversely, polymer-modified asphalt binders exhibited overshoots in stress at the beginning of the shearing strain cycle. Overshoots have high shear stresses at the beginning of loading, which quickly relax, enabling the sample to reach a steady-state shear stress [10,11]. The extent of these overshoots in relation to the types and percentages of polymers yielded an internal polymer network in the binder matrix [10]. The ISF test methodology indicates the significant effect of polymer modification on the development of internal network structures rheologically.
Further extending the discussion on modification, crumb rubber reacts with asphalt through two basic mechanisms: swelling and dissolution [12,13,14,15,16,17]. Swelling controls the modification process under low-interaction conditions—depending on mixing time, mixing temperature, and mixing speed—when rubber absorbs light asphalt components and increases in size [12,18,19]. Under high-interaction conditions, those rubber particles in the asphalt start to break down, releasing their components into the asphalt matrix [18,20]. Several factors influence how rubber interacts with asphalt [18,21]. Generally, these factors are divided into material and interaction parameters [21]. Interaction parameters involve temperature, speed, and time, while material parameters address both rubber’s characteristics and asphalt’s properties [21]. Considering the practical applications, as asphalt–rubber binder (A-RB) blending technology is currently in place in some asphalt plants, establishing an understanding of the network structures’ effects on the asphalt thin layer on the aggregate would be advantageous. This knowledge could help improve asphalt modification techniques for better performance. The network structures in the A-RBs arise from the thermodynamic interaction between rubber particles and the maltene fraction in the asphalt binder. This process leads to the diffusion of maltenes into the rubber particles, causing the rubber to swell. As the swelling progresses, the partial dissolution of the rubber particles causes the hydrocarbon components (e.g., natural and synthetic polymers) to form interconnected chains in the asphalt matrix. These polymeric components create network structures that enhance the performance of the A-RBs [18,22].
To understand how these interaction mechanisms enhance performance, it is essential to examine the asphalt binder at a micro-level. Previous studies have shown that AFM can reveal valuable insights at this level. What AFM reveals about the surface morphology and physicochemical parameters of an asphalt binder can make a difference in how well that binder performs [23,24]. AFM is regarded as a versatile research technique for asphalt [23]. Notably, the microstructures discovered under AFM have been shown to represent a distinct and repeatable characteristic of asphalt binders [23]. During hot-mix asphalt paving, the asphalt layer on the aggregate is micro-sized. In simulating the behavior of asphalt layers under service conditions, using AFM to analyze the surface morphology of asphalt layers with equivalent thickness to the asphalt layers on the aggregate is quite beneficial.
Variations in binder performance are inherently linked to morphological evolution within the A-RB system. The main objective of this study was to explore the evolution of internal network structures and their homogeneous effect on enhancing the performance of the A-RB matrix. The multiscale approach used in this study provides deep insights into how asphalt–rubber interactions influence the microstructures and performance of binders, which has rarely been addressed previously. This was addressed by combining micro-level morphological, rheological, and thermal analyses of the A-RBs to uncover the effect of asphalt–rubber interactions on the network structures. Furthermore, the study correlated the morphological evolution of the A-RBs’ liquid phases, following the removal of rubber, with different interaction times, to the rheological characteristics of the overall binder matrix. The variations in the rubber compositions and dissolutions with the interaction times and with varying asphalt binder types were emphasized and correlated to changes in morphological and rheological properties.

2. Materials and Methods

2.1. Materials

One type of crumb rubber was evaluated, and it interacted with two sources of asphalt binders. The binder and rubber properties are summarized in Table 1. The rubber was cryogenically treated crumb rubber derived from scrap tires from a mixed source. The size range of the rubber particles was calculated from those that passed through a #30 sieve (0.60 mm) and were retained on a #40 sieve (0.42 mm). Rubber size (30–40) and dosage (10% of the weight of the asphalt binder) were selected based on the results obtained from a previous study [21]; these parameters represented an optimal improvement in both the complex shear modulus (G*) and phase angle (δ). The components of the rubber particles were assessed following ASTM E1131-20 [25], and they were 7.00% for the oily components (OCs), 28.00% for the natural rubber (NR), 21.00% for the synthetic rubber (SR), and 44.00% for the filler (F), like carbon black and ashes.
Two asphalt binders’ performance grades (PGs) were utilized to understand the mechanism behind the improvement in the modified asphalt. The selected binders were a soft binder with a PG of 52–34 (coded as B1) and a stiff binder with a PG of 64–22 (coded as B2). Asphalt fractions were measured according to ASTM D 4124-09 [26]. The B1 binder contained 7.73% less asphaltenes plus resins than the B2 binder. Moreover, the B1 binder had 7.73% more saturates plus aromatics than the B2 binder. Because of the higher concentration of saturates and aromatics and the lower concentration of asphaltenes and resins in the B1 binder, it was softer than the B2 binder [27].

2.2. Methods

The experimental program was divided into two stages: The first was for the entire AR-B matrix, and the second was for its components (extracted liquid phase and undissolved rubber particles). In the first stage, the rheological analysis of the A-RB matrix was conducted using a dynamic shear rheometer (DSR) to investigate the performance of A-RBs and the formation of the network structure. This stage involved an assessment of the rheological parameters (G* and δ) and shear stress overshoot of the A-RBs. However, assessing the dissolved rubber components in liquid phases and monitoring their morphology would shed light on the changes that occurred in the A-RBs. Thus, the second stage concentrated on examining the dissolved fraction of rubber particles and the morphology of the asphalt liquid phases following the removal of the undissolved rubber particles. The residual components in the undissolved rubber particles were evaluated thermally using a thermogravimetric analyzer (TGA). Understanding the original rubber components before their interaction with asphalt allows for an assessment of the components exchanged with asphalt. The morphologies of the asphalt liquid phases were investigated using AFM. Figure 1 shows more details about the experimental program.

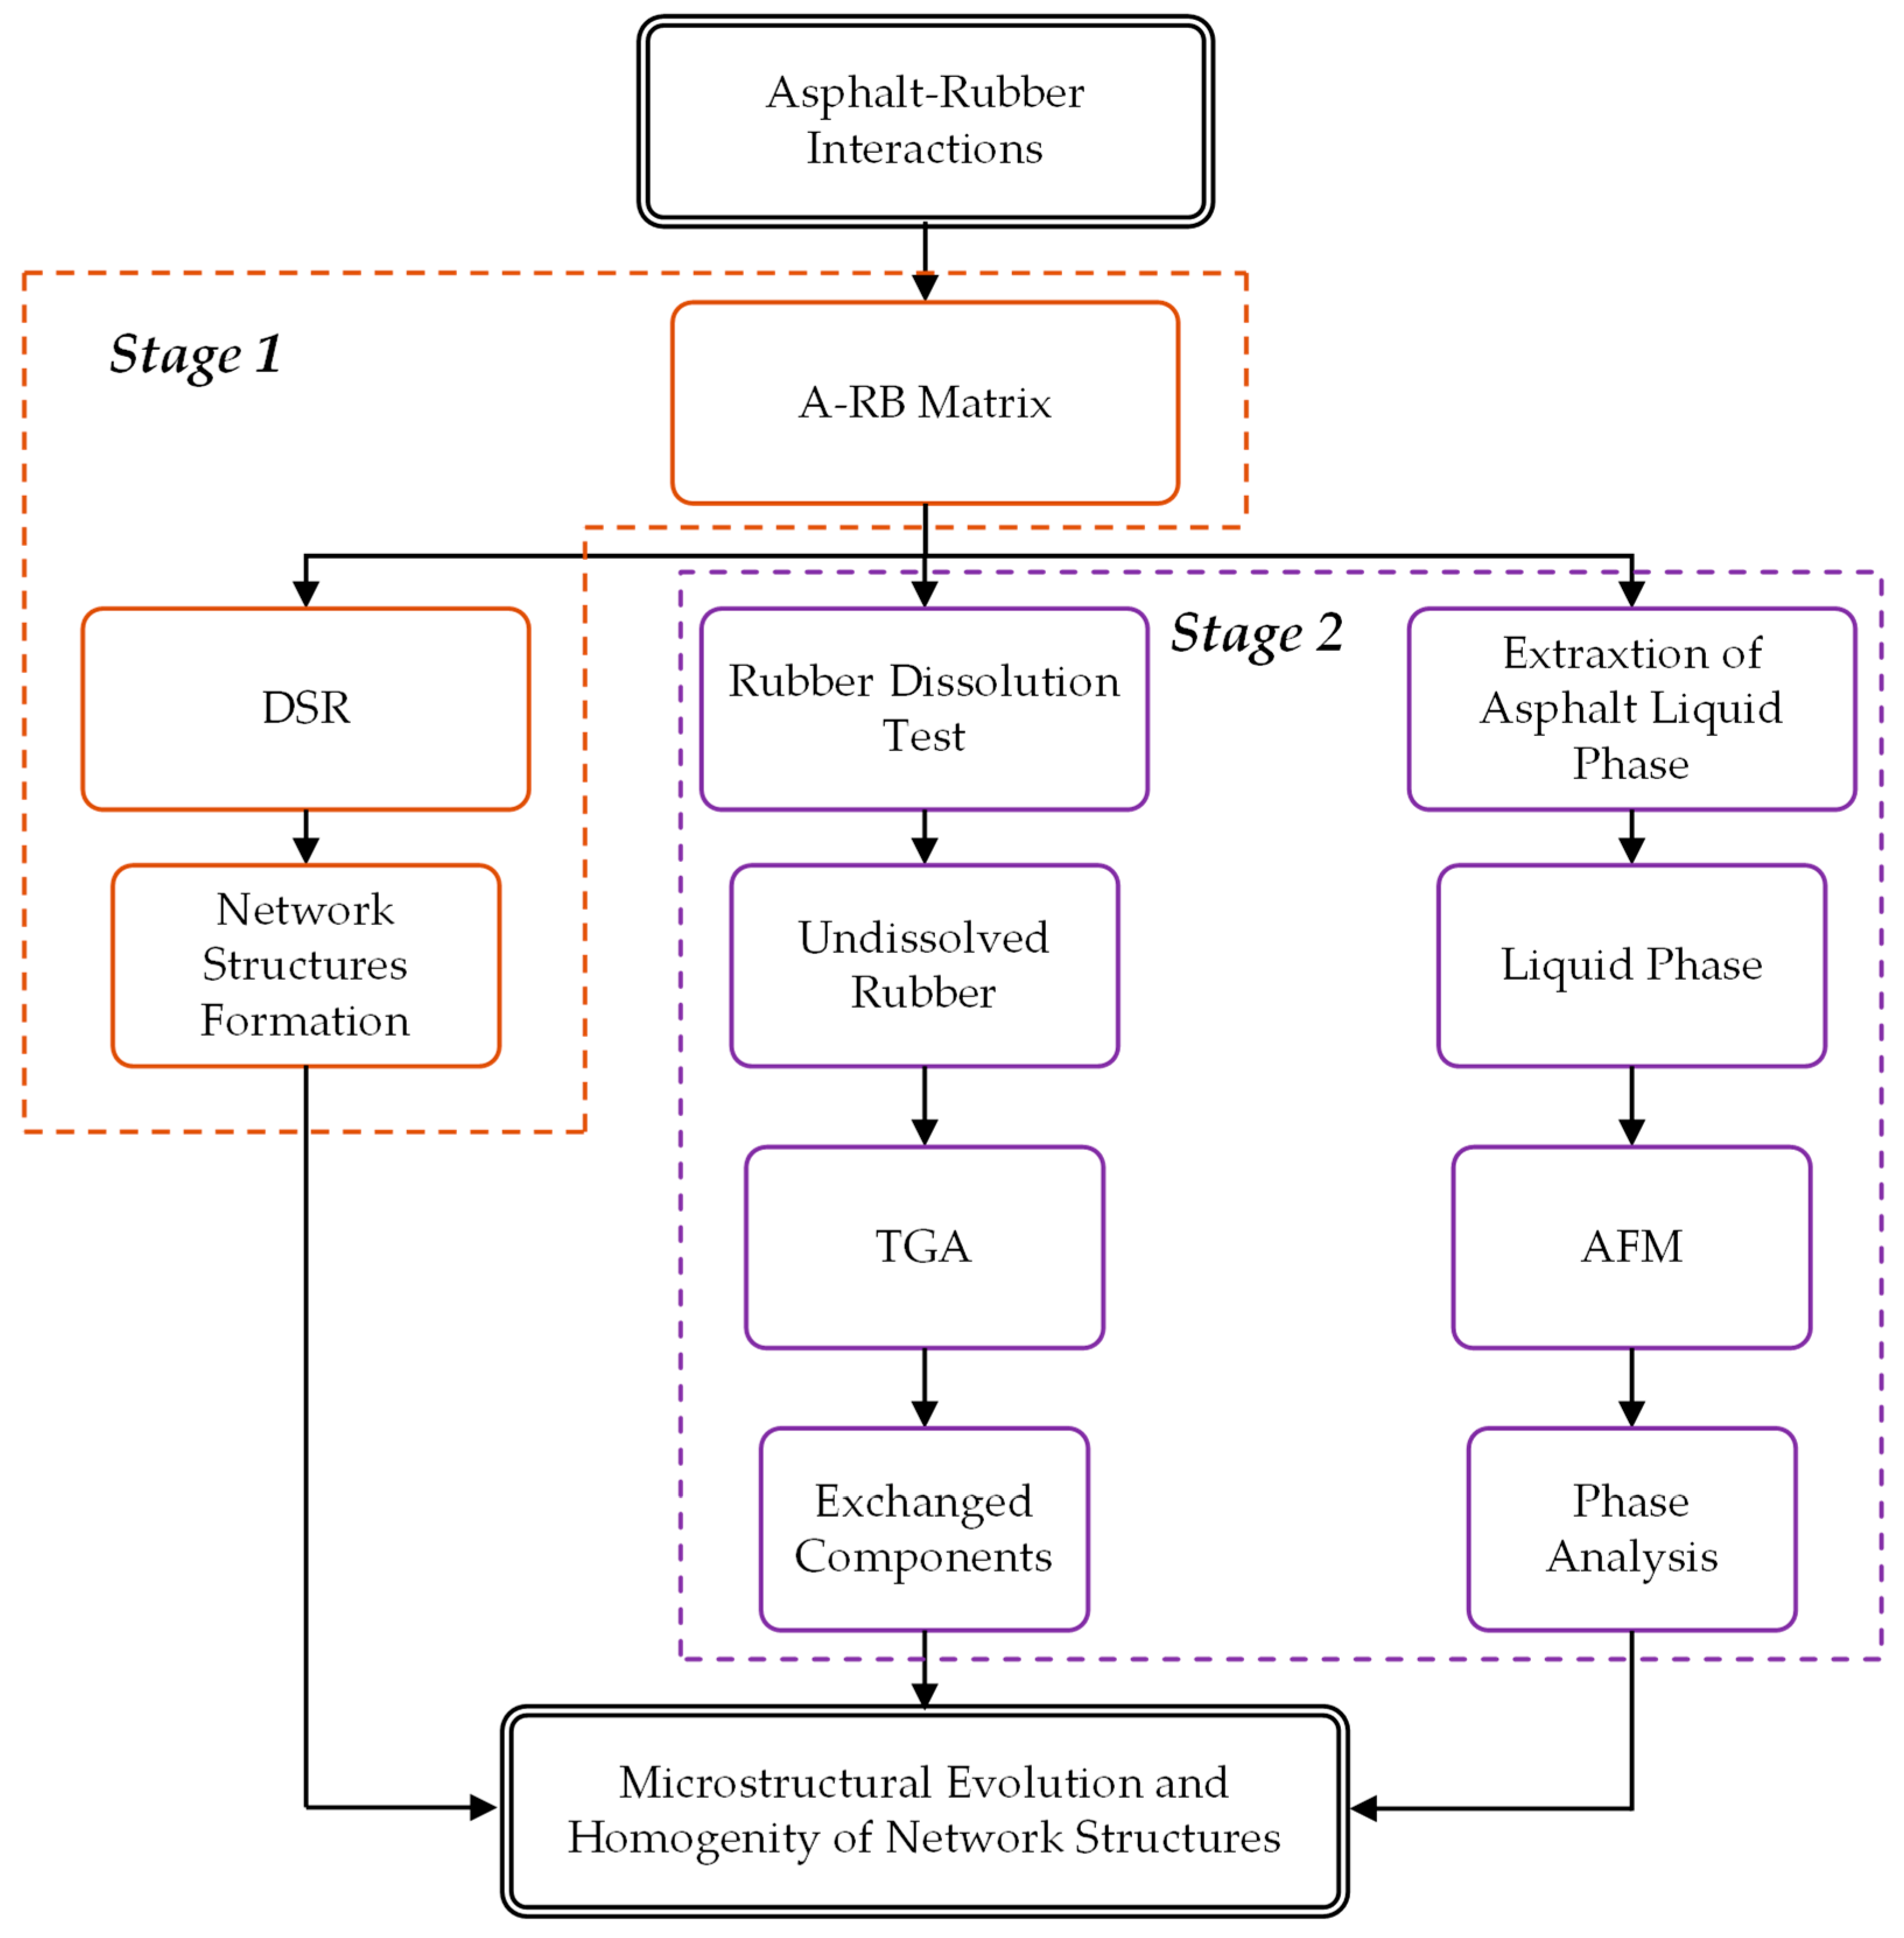
2.2.1. Asphalt–Rubber Interactions

Asphalt–rubber interactions were stimulated in a gallon can. The temperature was regulated by a heating mantle linked to a controller with a 12-inch-long J-type probe, and the mixing procedure was accomplished by a high-shear mixer. A-RB samples were taken after 15 min, 1 h, 2 h, 4 h, and 8 h of interaction. To minimize binder oxidation, all interactions in this study were implemented under a nitrogen gas blanket.
The interaction temperature and speed values were selected to be 190 °C and 50 Hz, respectively. The reason for these conditions is the ability of these combinations of parameters to break down the rubber particles quickly and enable the release of their components to asphalt, resulting in an optimal improvement in the physical properties of the resultant A-RB [18,20,27]. However, 160 °C was insufficient to release the rubber’s polymeric components into the asphalt liquid phase. Additionally, a too-high mixing temperature (e.g., 220 °C) leads to the interaction modification effect of the A-RBs being lost because of the excess devulcanization “breaking of the sulfur cross-links in the rubber” and depolymerization “breaking of long polymer rubber’s chains” [18,20,27]. Based on the selected parameters, sustained improvement for G* and δ was established for A-RB for up to 8 h after modification [27].

2.2.2. Stage 1: Asphalt–Rubber Matrix

The rheological characteristics of the neat and A-RBs were evaluated at different interaction times using a single-point test and ISF. The binder samples were 2 mm thick—the minimum gap that will not influence the results because of the rubber particles—and 25 mm in diameter.

Single-Point Test

The G* and δ values were assessed for the neat and modified binders via a single-point test following ASTM D7175-15 [28]. At a frequency of 10 rad/s, the test temperatures were selected at the investigated neat binder’s high-temperature grading of 52 °C for B1 and 64 °C for B2.

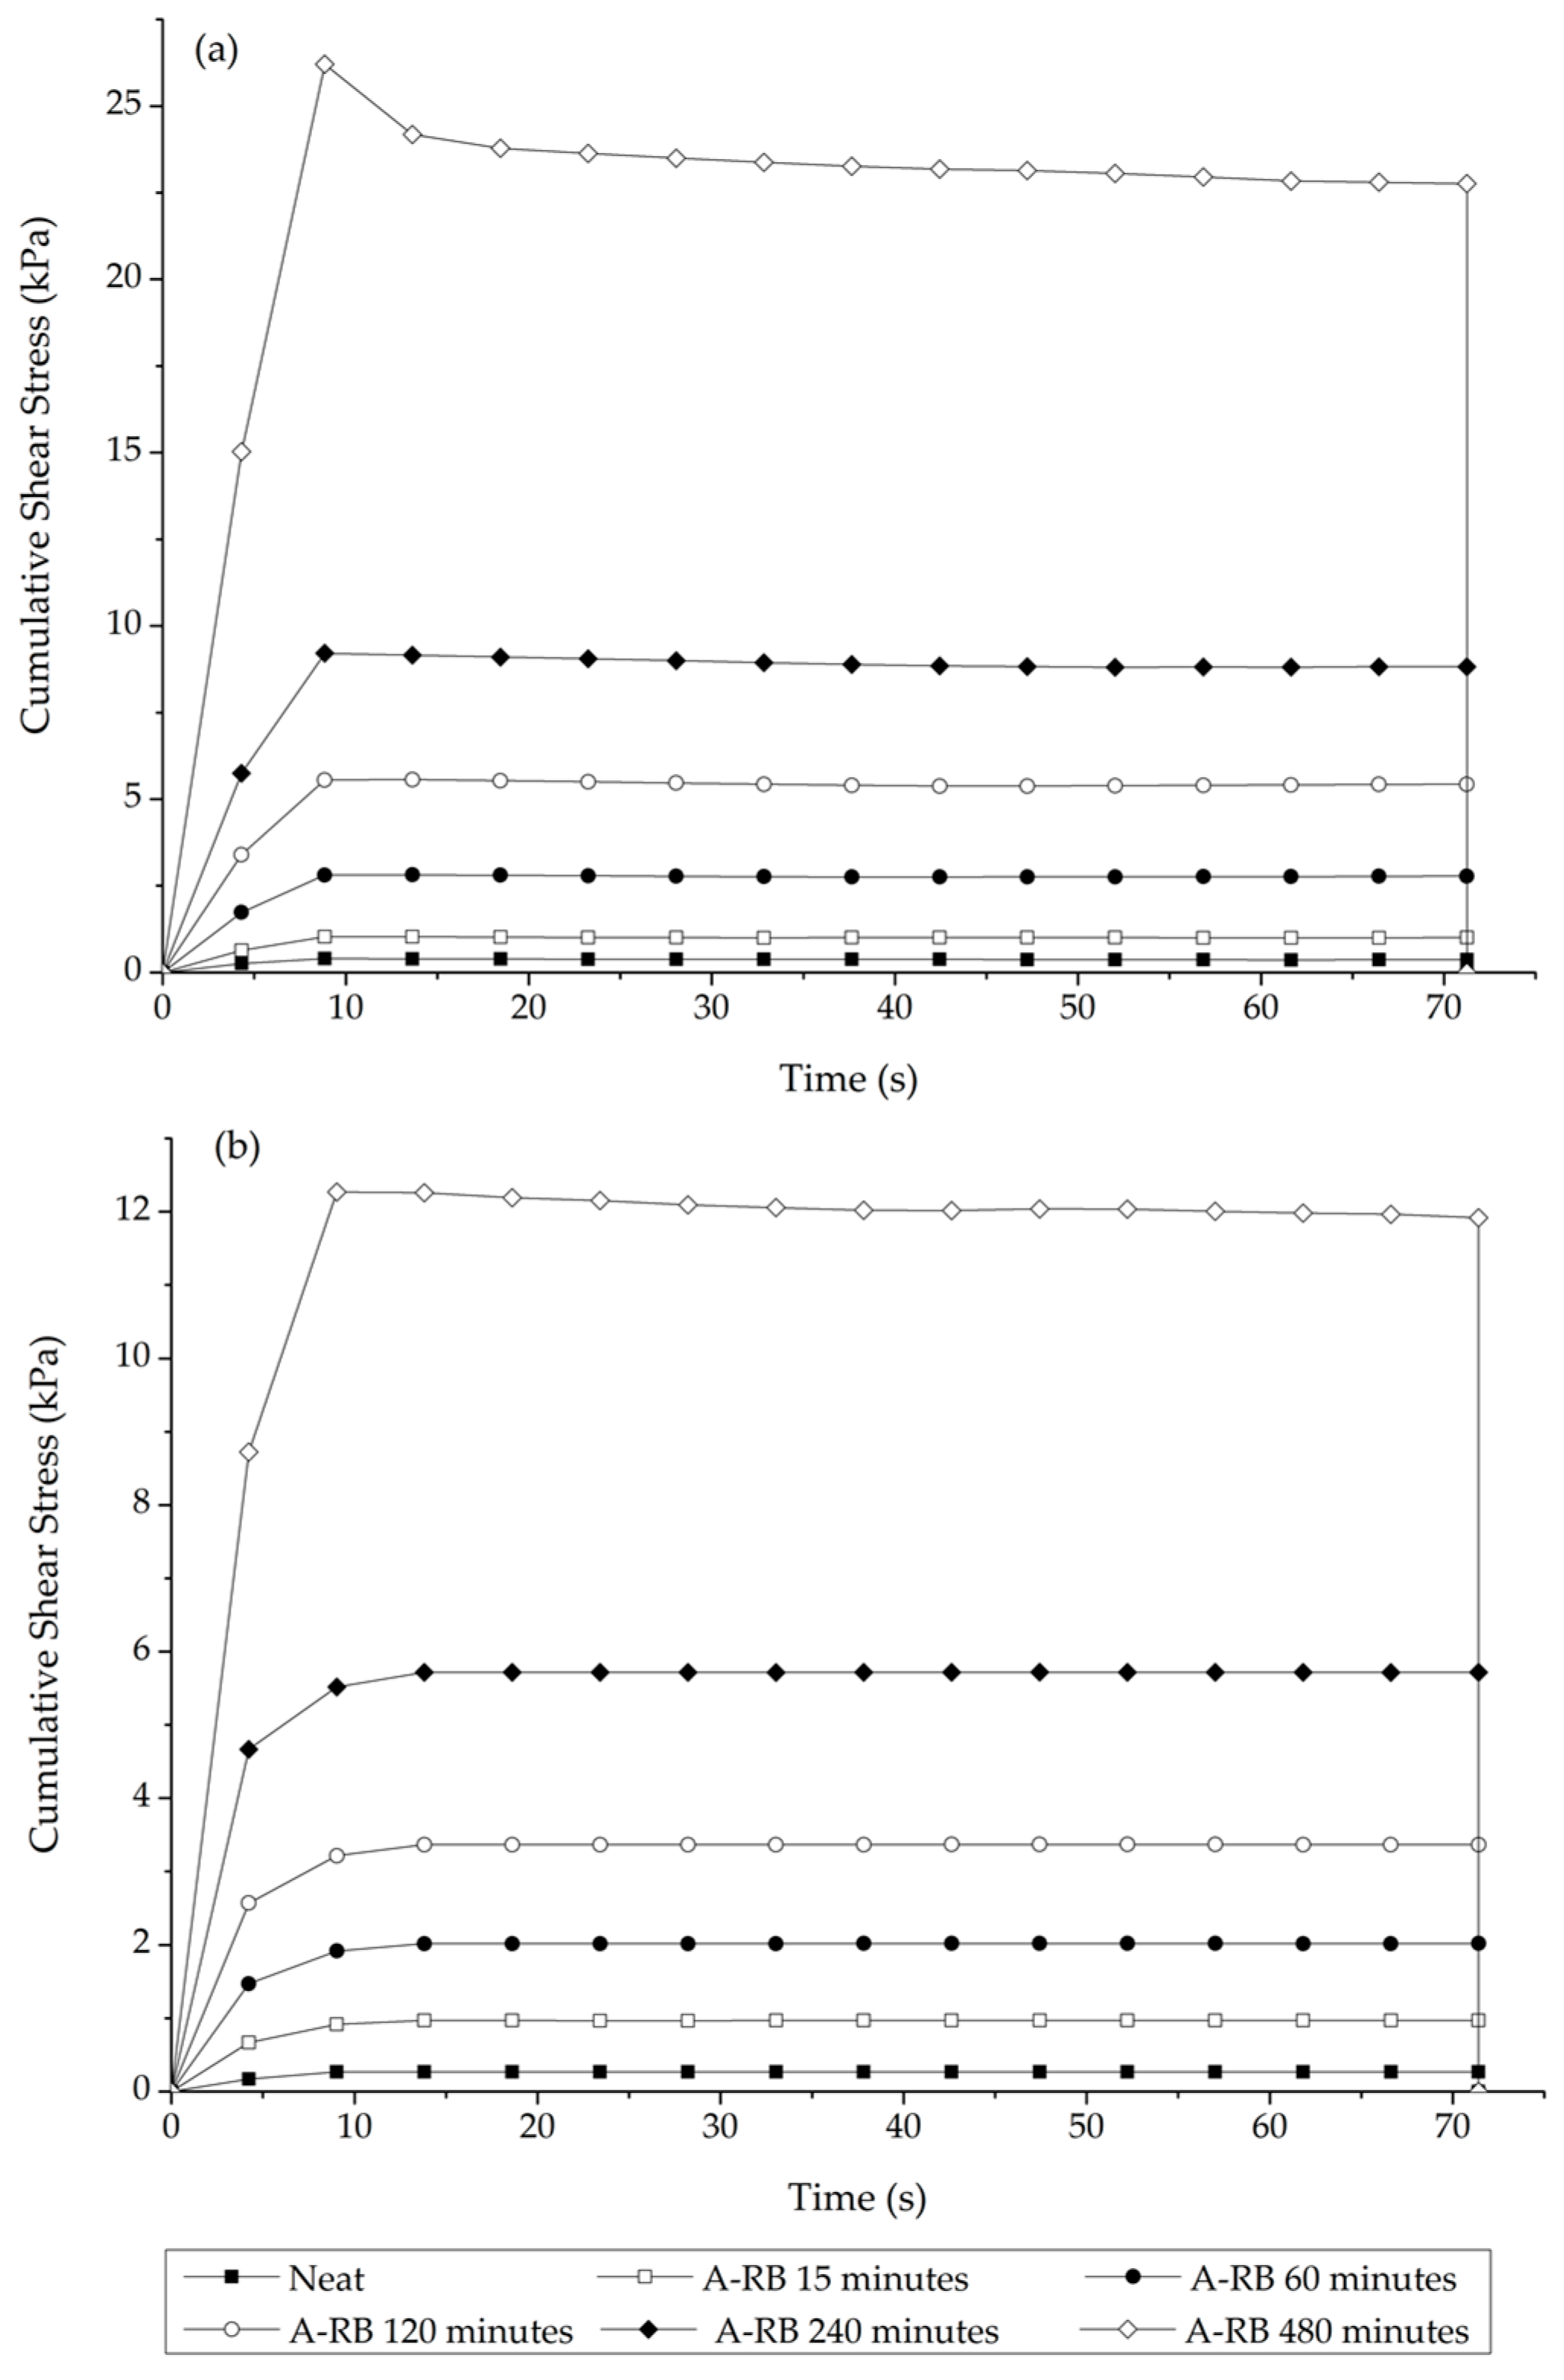
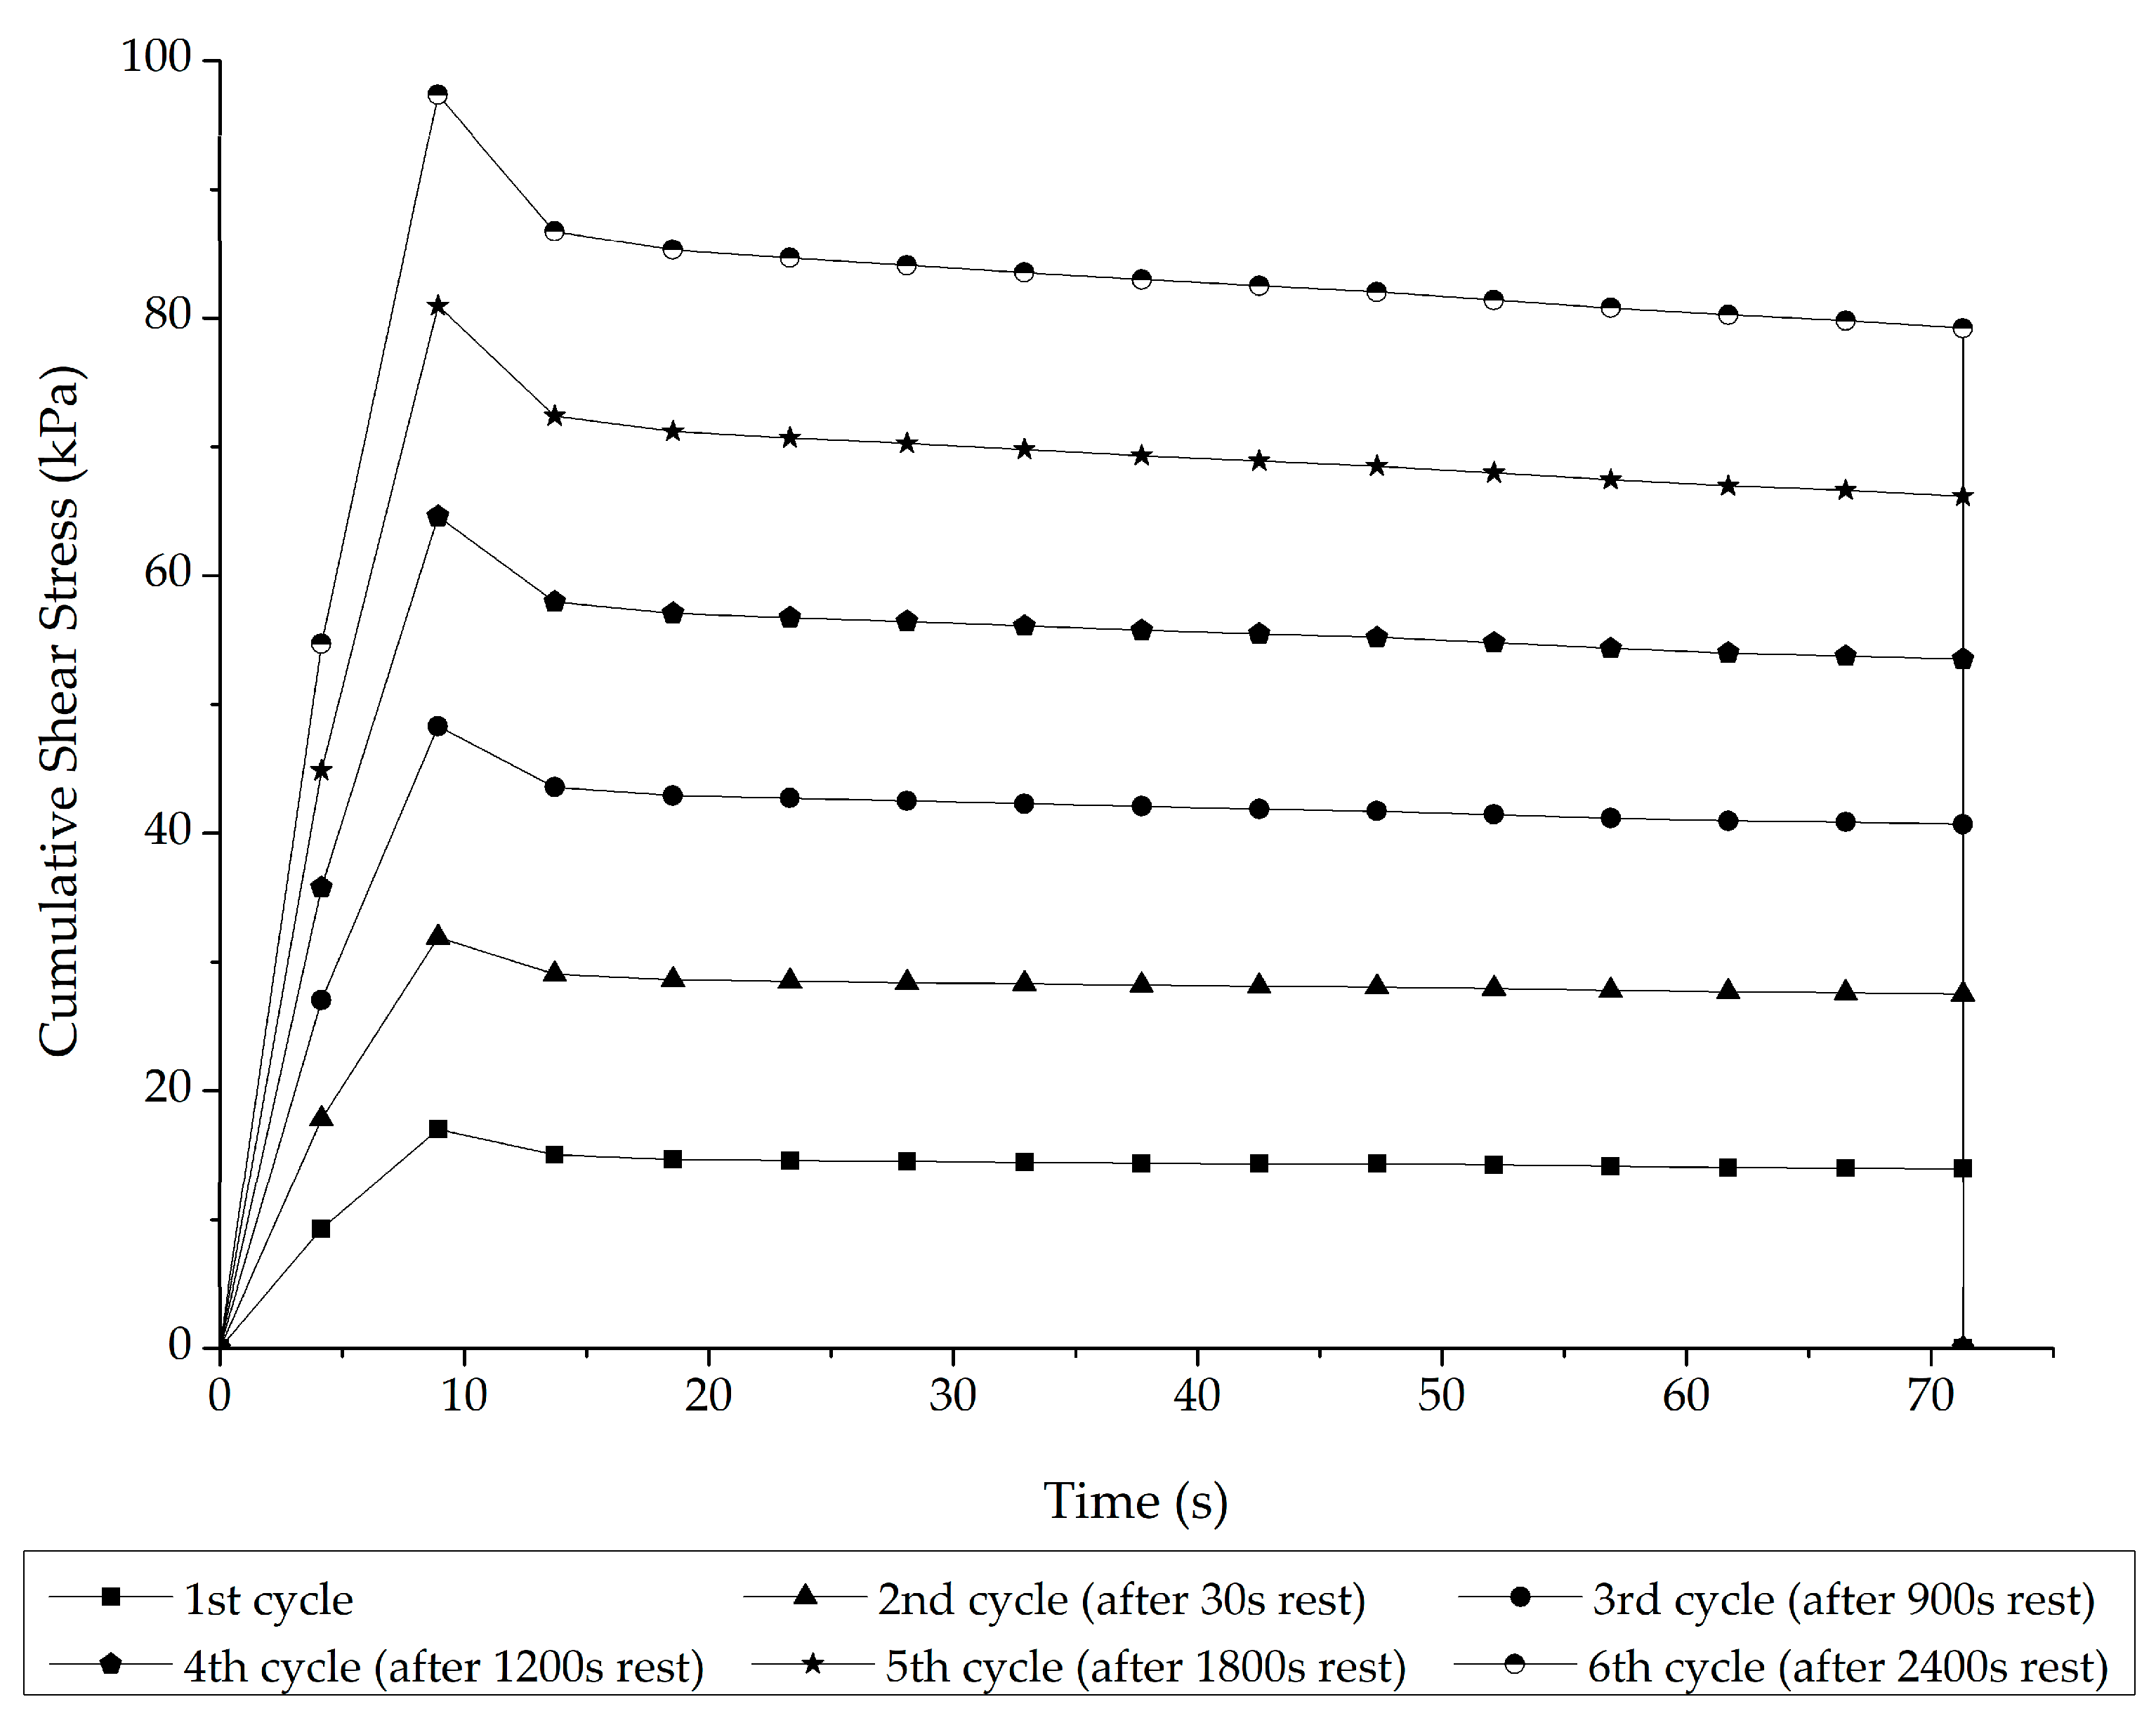
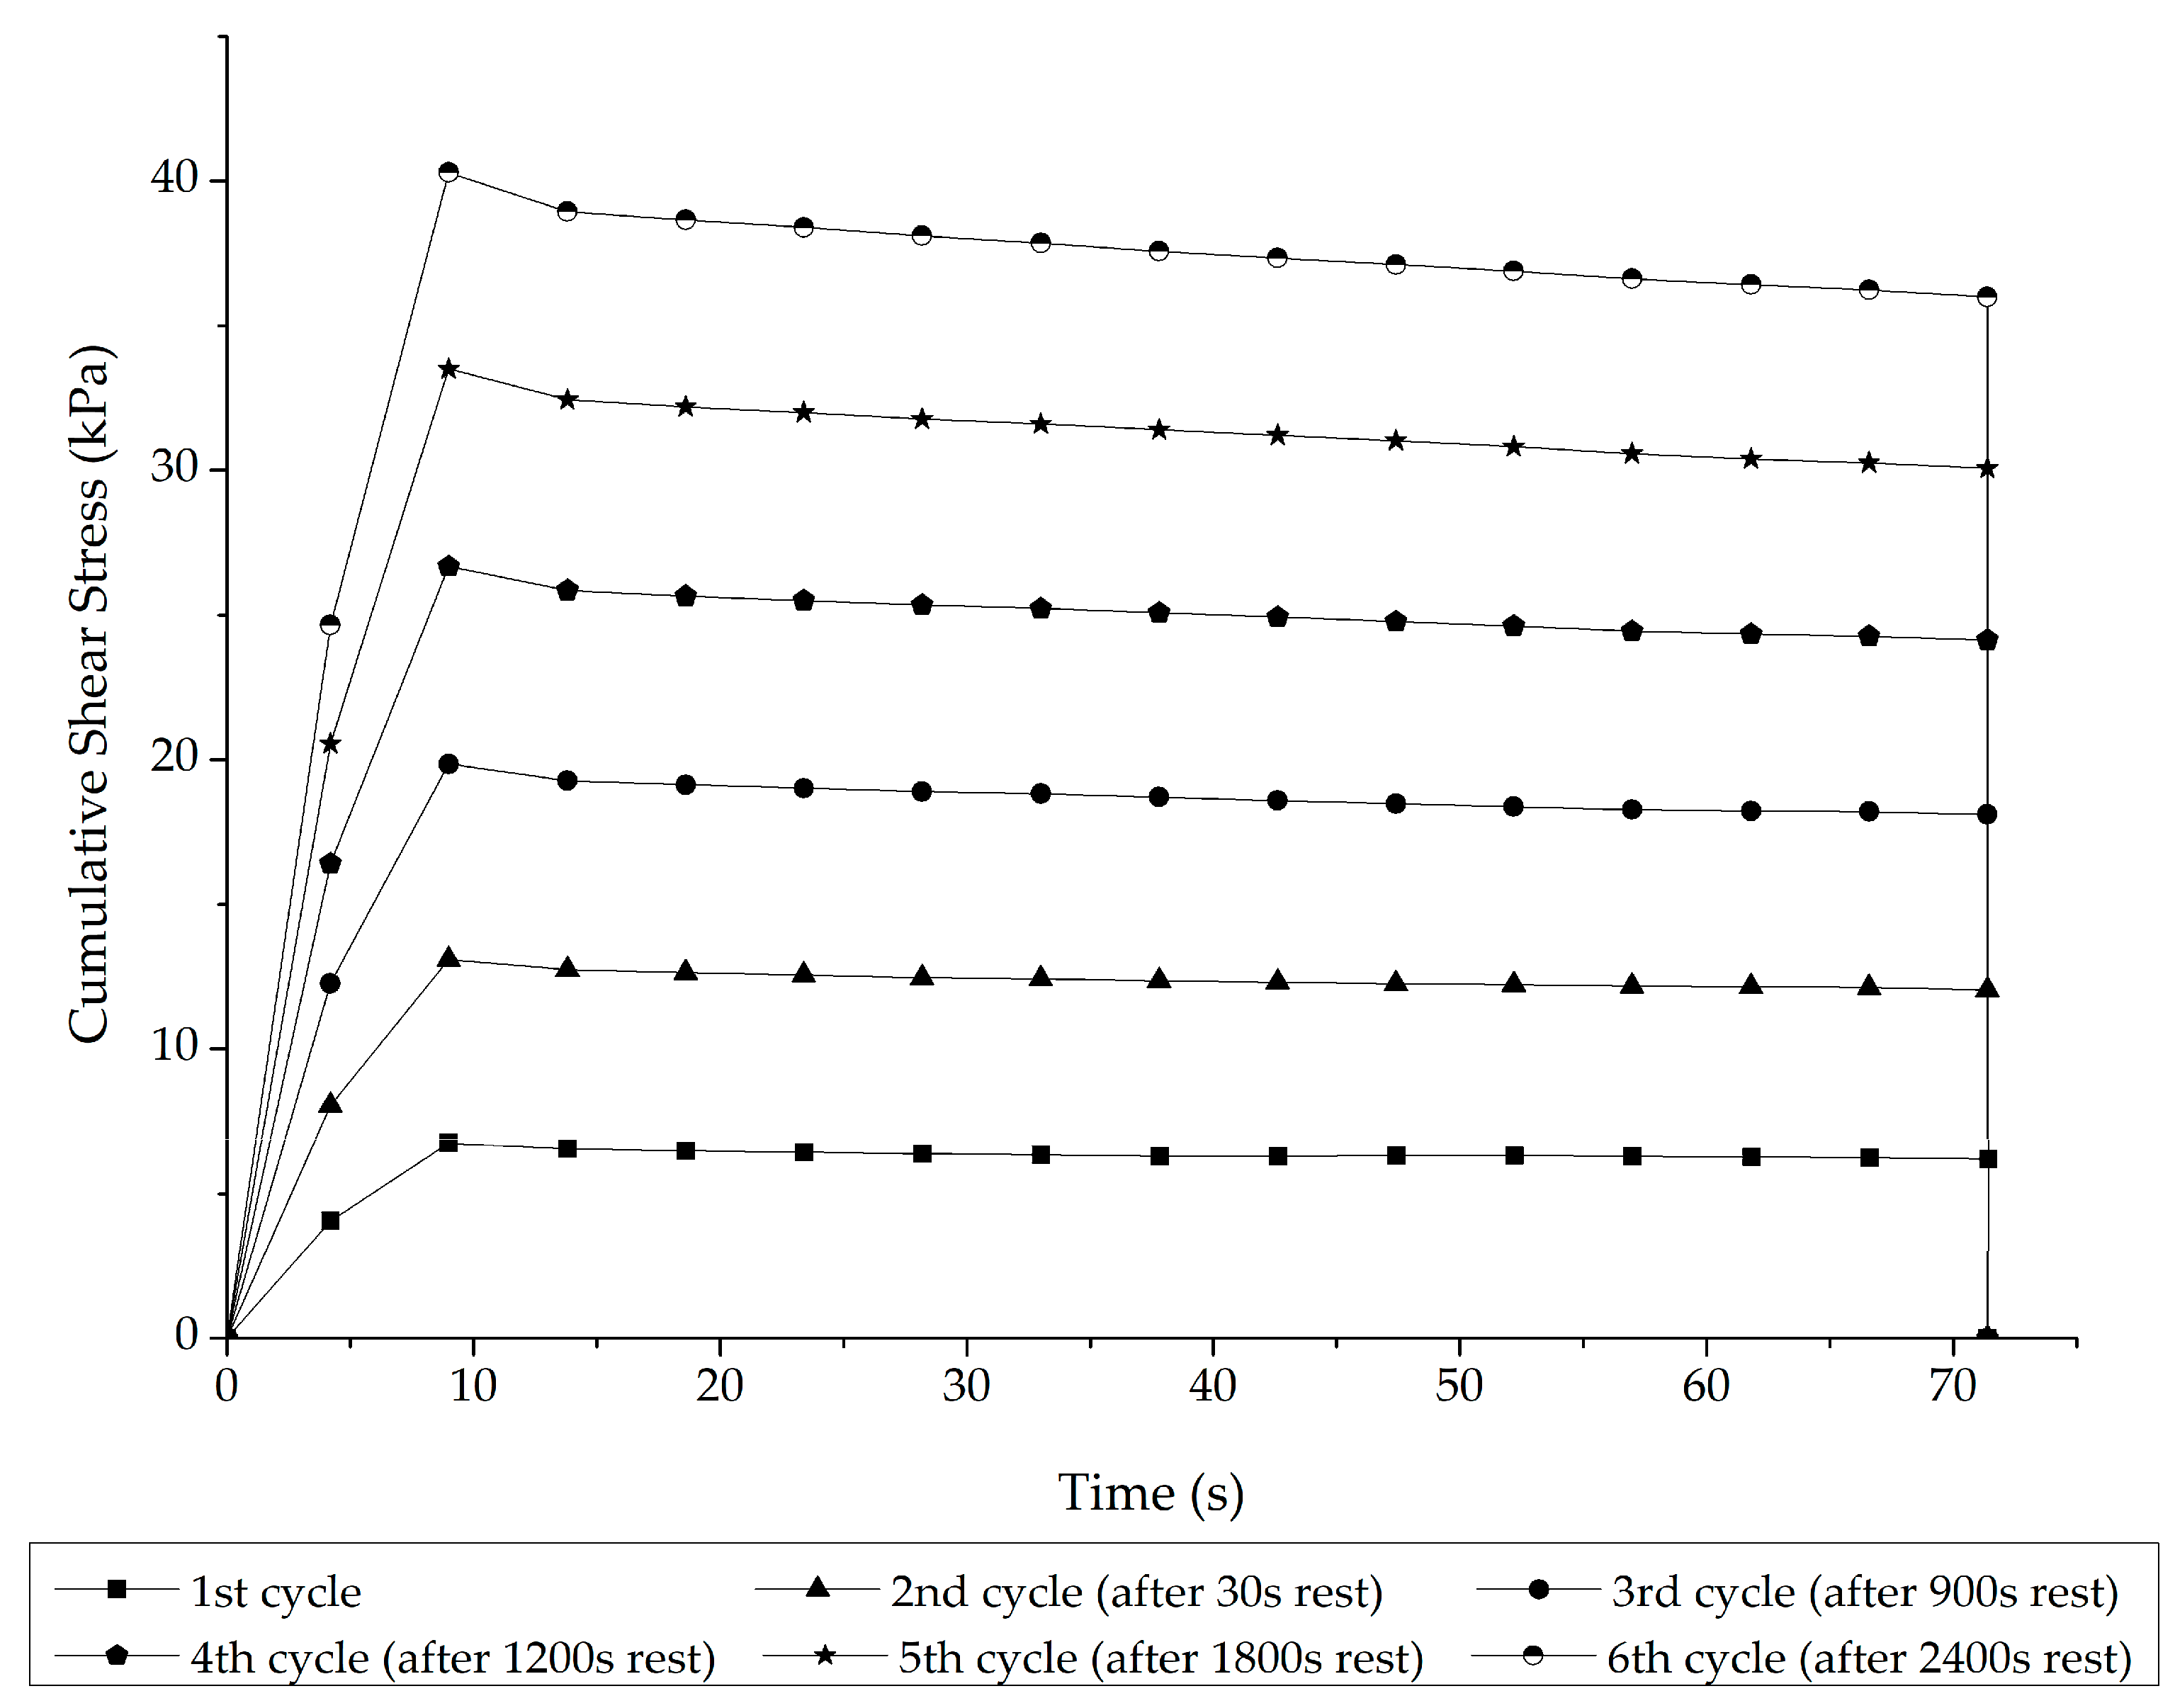
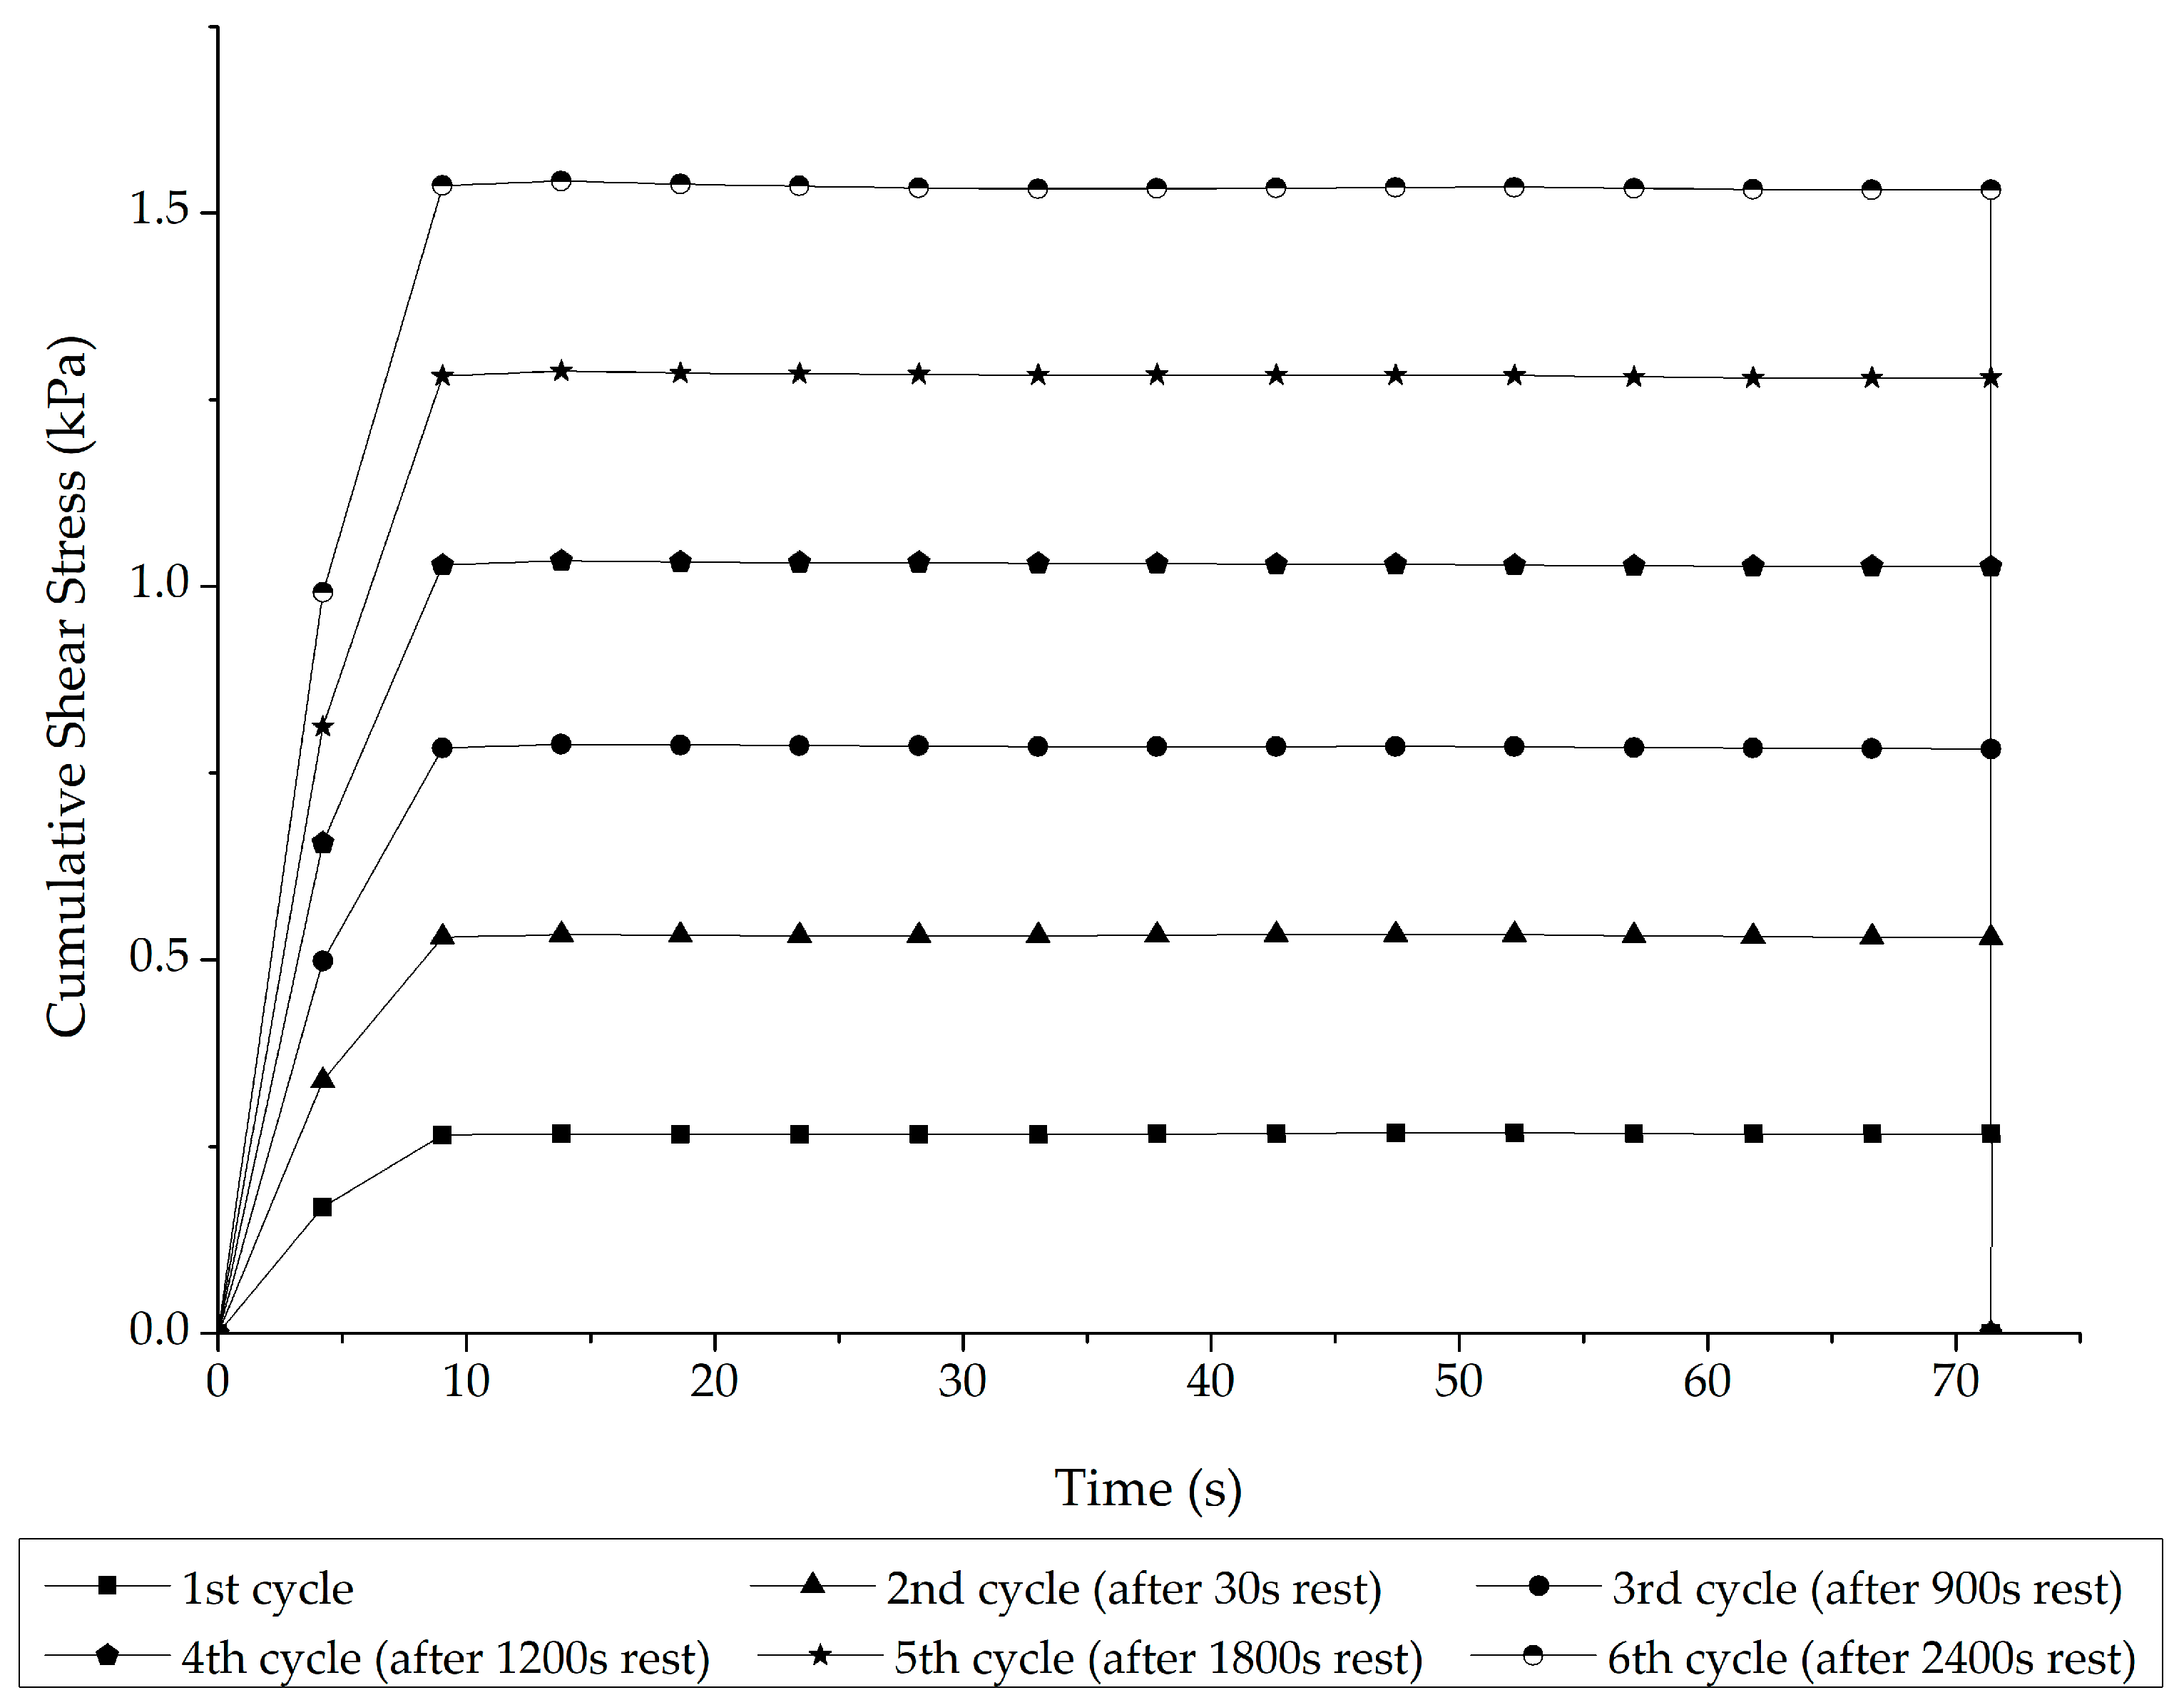
Interrupted Shear Flow Test

Both the neat binders and the matrix of the A-RBs were tested through the ISF test [10,27]. This test measures the shear stress resulting from the application of a defined shear rate to test the capacity of the material to self-heal. The shear stress profile of the samples was tested by employing a series of subsequent steps or shear stress cycles. The shear rate was maintained at a constant 2 rad/s for each of the loading cycles [10]. Following rest periods of 30, 900, 1200, 1800, and 2400 s, the shear rate was re-established in the binders.

2.2.3. Stage 2: Rubber and Liquid Phase

Rubber Dissolution Test

This test aimed to evaluate the influence of rubber dissolution on the formation of the network structure and thus the variation in performance. Undissolved rubber particles were extracted from the modified binders by diluting 5 ± 2 g of A-RB into toluene and using sieve #200 to filter the solution. The undissolved particles were washed with fresh toluene until becoming a colorless solution. Rubber particles were dried in the oven at 60 °C to evaporate any remaining traces of toluene. Following extraction from an A-RB sample with a known weight, the amount of dissolved rubber—that is, solubilized or disintegrated into the asphalt matrix—was calculated by subtracting the actual weight from the expected weight of rubber; see Equation (1). All procedures with toluene were conducted in a fume hood and with appropriate personal protective equipment to safeguard the health of personnel. The waste generated by the toluene–asphalt mixture was captured and disposed of based on institutional hazardous waste protocols to reduce the environmental impact.
The following equation represents the calculation of the dissolved rubber percentage:
DR % = ( A B ) A × 100 ,
where
  • DR: percentage of dissolved rubber;
  • A: total weight of rubber expected in an A-RB sample;
  • B: total weight of rubber extracted from an A-RB sample.

Rubber Thermogravimetric Analysis

The compositional alternations of the rubber samples during their interaction with asphalt were examined using TGA following ASTM E1131-20 [25]. The rubber samples were analyzed both in their original state, as received, and after the dissolution test (the extracted rubber). Numerous researchers have used the ramp method to examine the composition of rubber and other multi-component polymeric materials [29,30,31,32]. The ramp heating method parameters were a constant heating rate of 20 °C/min from 25 °C to 600 °C. The mass loss rate of each component in rubber from the TGA curves and the temperatures reported in other studies [33,34] was used to determine the decomposition temperature range of each component.
When a multi-component sample, such as rubber, is heated to high temperatures, the mass loss from its decomposition is tracked as a function of temperature and concurrently graphed in a thermograph to help identify the various components [35]. Rubber consists of OC, NR, SR, and F. The OC is related to mass loss between 25 °C and 300 °C, and the NR is related to mass loss between 300 °C and the midpoint between the two peaks in the derivative of the thermograph curve (DTG). The SR is related to mass loss between the midpoint of the two peaks in the DTG and 500 °C, and the residue at 500 °C is related to rubber residue (e.g., carbon black and ashes) [36]. After calculating the dissolved rubber percentage from Equation (1), the TGA test was conducted, and the rubber components were analyzed via Equation (2).
The following equation shows the percentage of each component in the rubber particles, following dissolution and TGA testing:
RC = C D × ( 1 D R % 100 ) ,
where
  • RC%: percentage of rubber components;
  • C: weight of a rubber component in TGA;
  • D: weight of a rubber sample in TGA.

Extraction of Asphalt Liquid Phase

By excluding the non-dissolved crumb rubber particles from the A-RB matrix, the liquid phase of A-RB was extracted. To accomplish this, a sufficient quantity of the A-RB sample was heated to 165 °C and drained in an oven for 25 min through mesh #200 (75 µm).

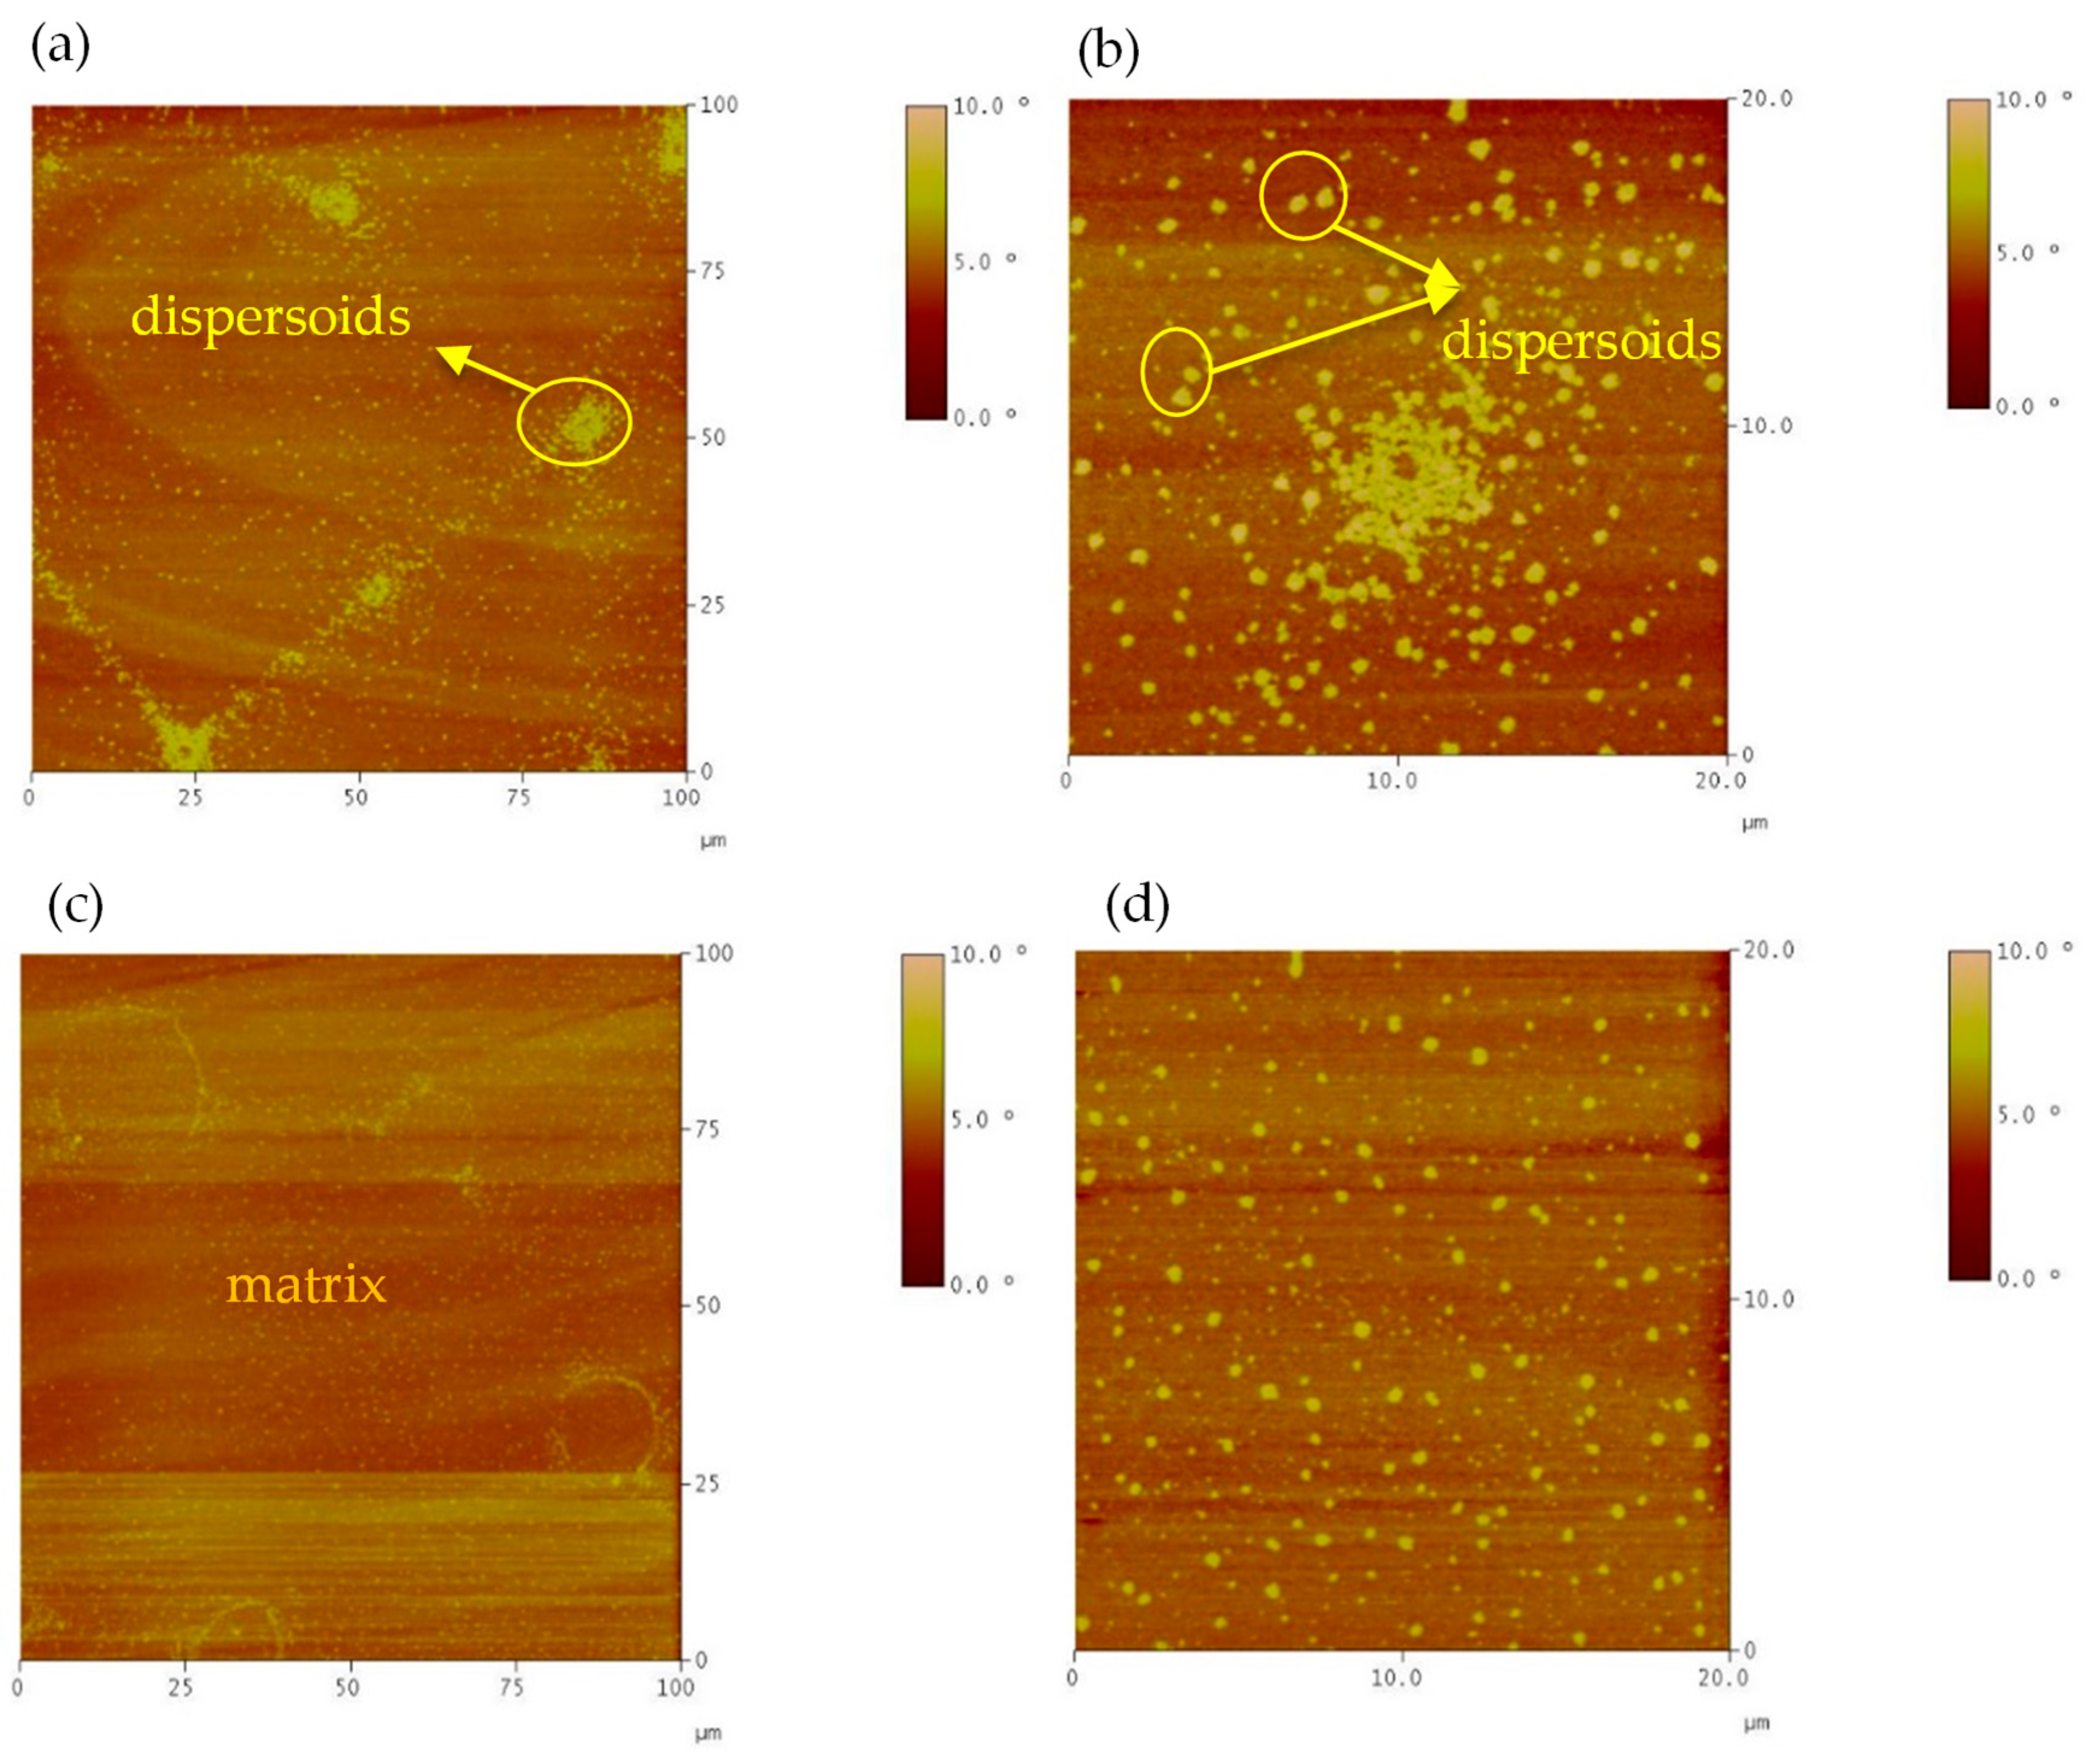
Atomic Force Microscopy Test

The change in the asphalt sample’s surface morphology due to interaction activities within the A-RB was investigated using an AFM. To ascertain the shift in the morphological profile of the asphalt liquid phase samples, phase detection mode (PDM) was utilized. The oscillating cantilever’s phase shift (phase angle) for the driving signal was measured to accomplish this. The material properties that contribute to the tip/sample interaction may be related to this phase shift. The phase shift that was recorded in AFM-PDM was used to separate friction, adhesion, and viscoelasticity, thereby showing the evolution of network structures.
An appropriate high-temperature-resistant tape was applied as a sealant for the glass slide to create a thin-film binder. A rectangular window measuring approximately 1.5 by 0.5 inches (3.81 by 1.27 cm) was cut into the tape to precisely outline a region for the binder film that would later be deposited. The binder was heated to 160 °C before being deposited into the windowed section created by the tape on the glass slide. The binder-coated glass slide underwent annealing for five minutes at 160 °C to achieve a smooth surface. The slide was taken out of the oven and allowed to cool to room temperature. The thickness of the binder film ranged from 550 to 600 μm.
AFM tests were performed following binder preparation to minimize surface morphology’s potential alterations due to environmental and aging effects. Following an intermittent contact “tapping” mode [37], the AFM-PDM test was implemented using a cantilever that had a resonance frequency of 150 kHz and a stiffness of 7.5 N/m. In this mode, the concerns arising from impairing the tip with a sticky binder were decreased [38]. An image was acquired by capturing the difference in the oscillation signal sent to the cantilever of the instrument and the oscillation induced by the interactions between the tip and the sample [39]. In this manner, by using AFM-PDM, domains that coexist with different rheological properties can be mapped [40,41].

3. Results and Discussion

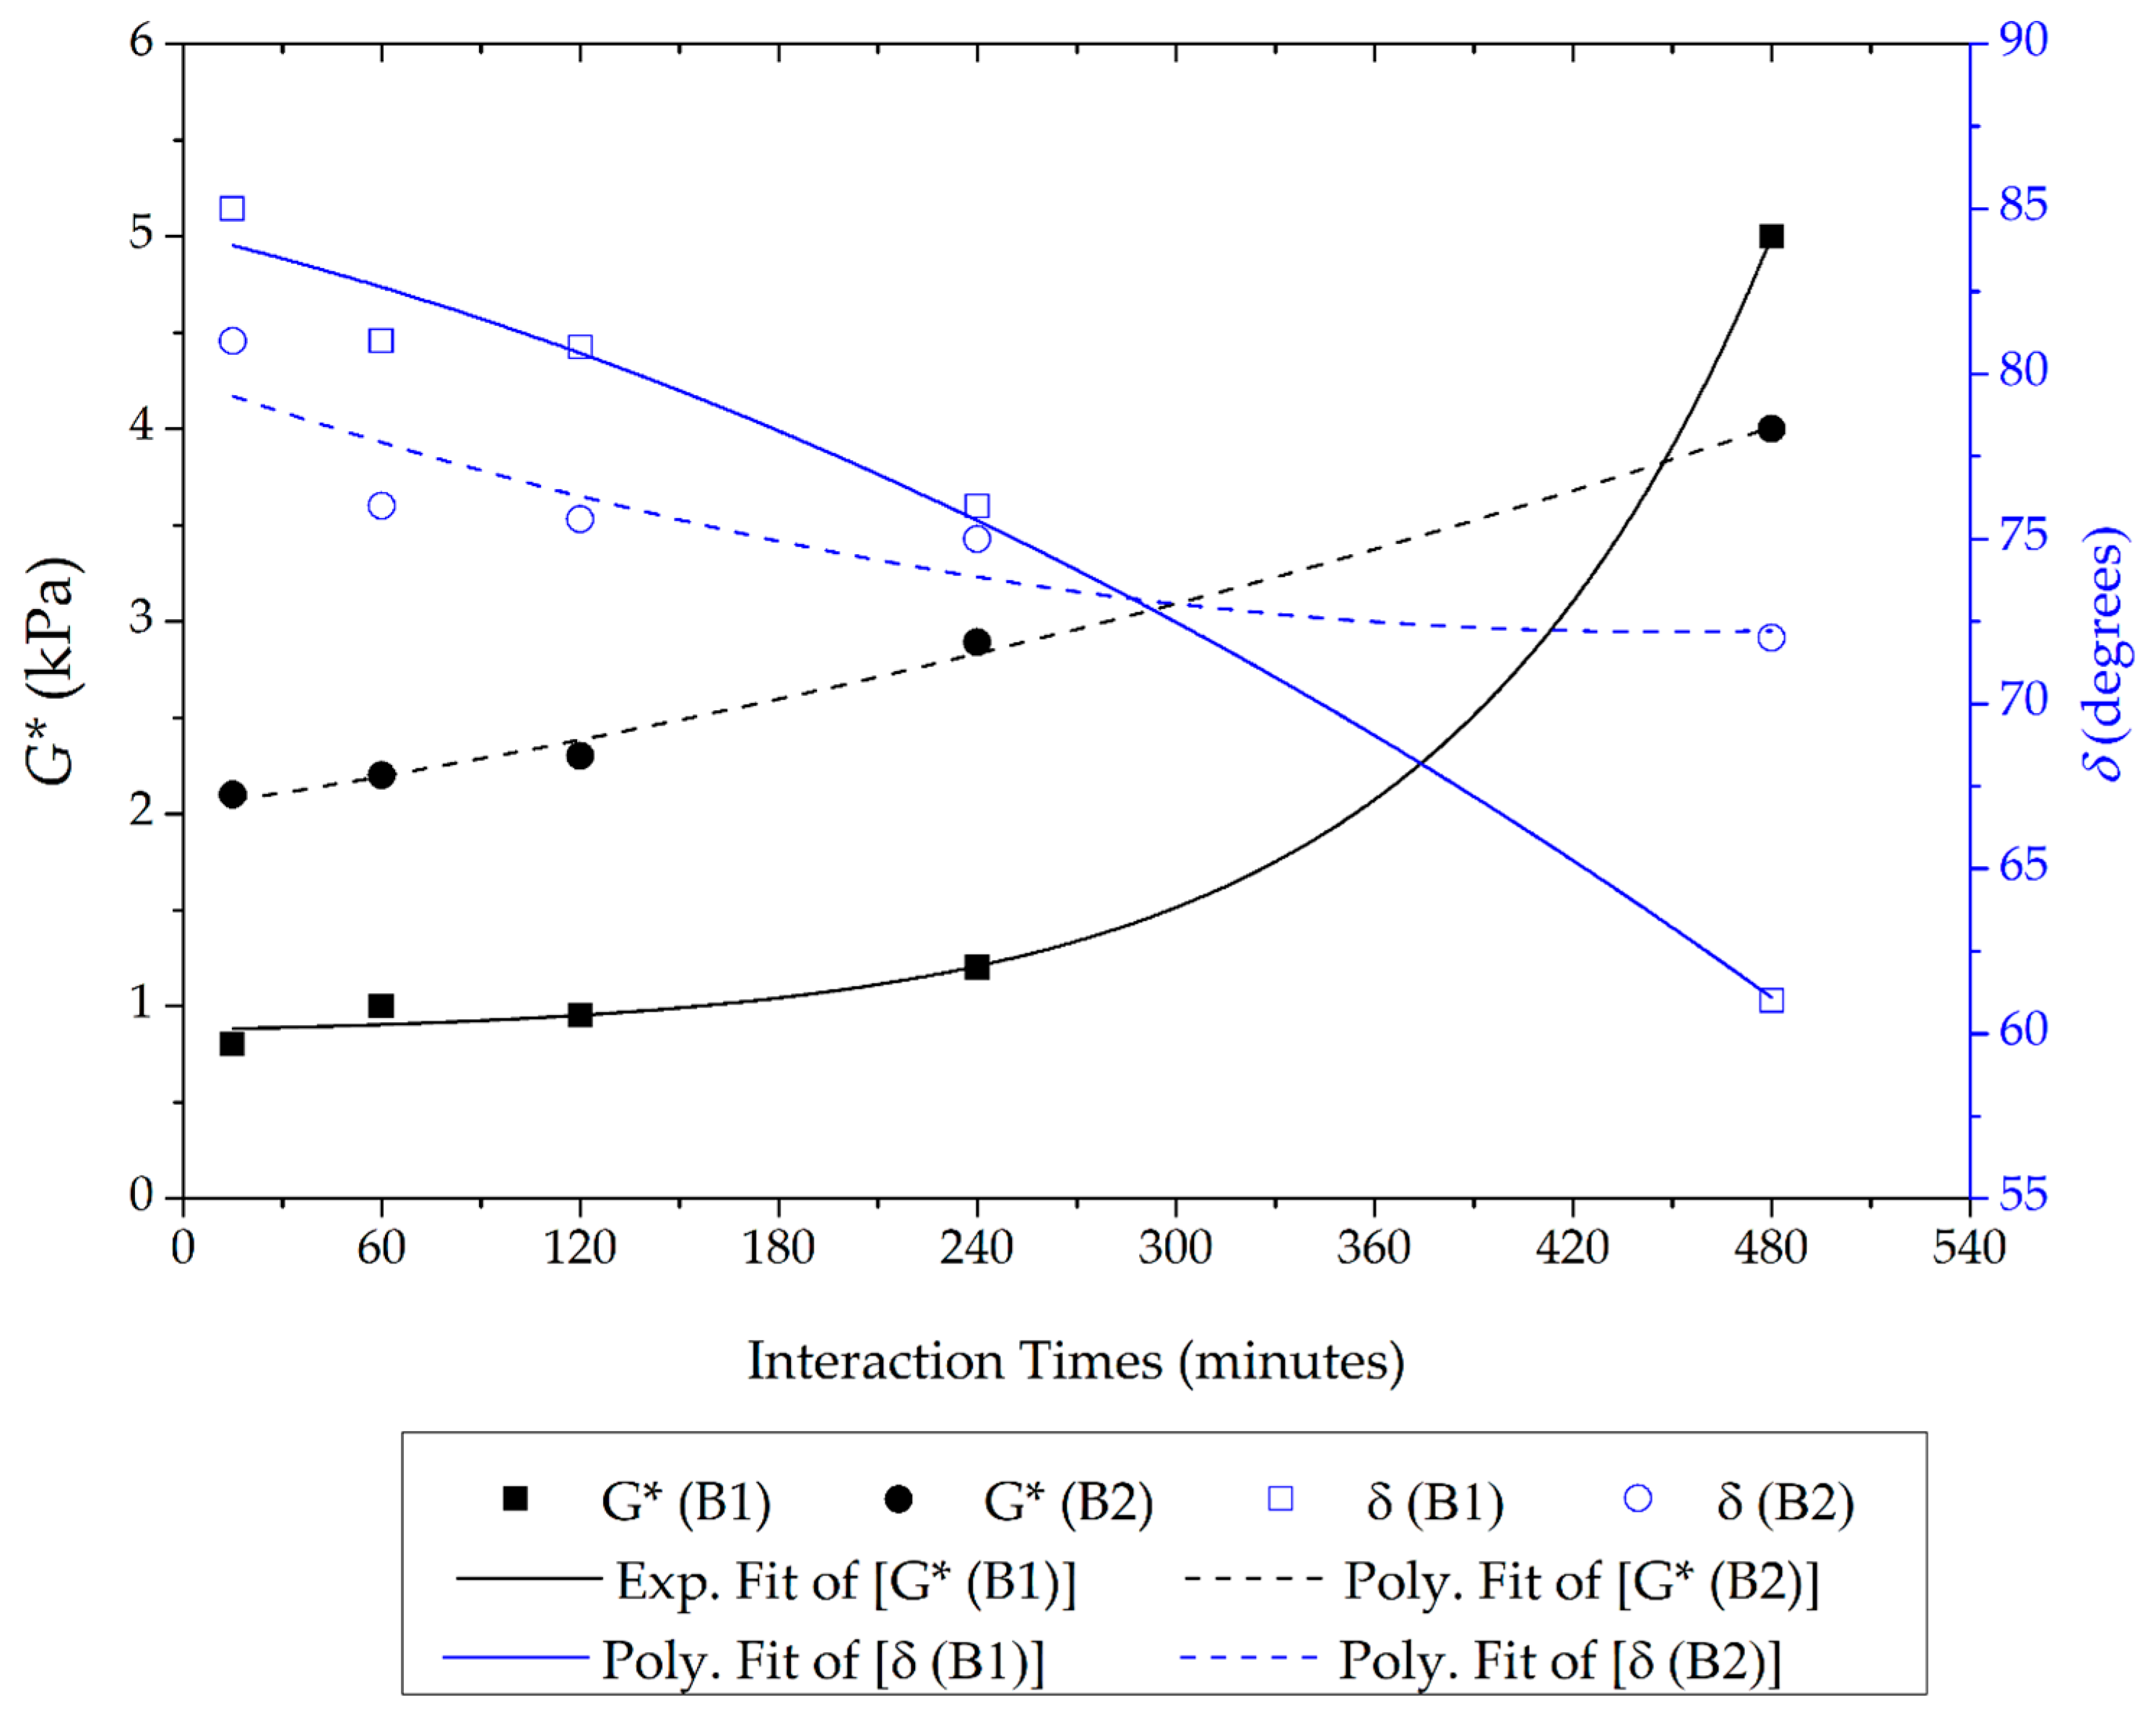
3.1. Stage 1 Analysis: Asphalt–Rubber Matrix Analysis

Figure 2 depicts the G* and δ values of the B1 and B2 AR-Bs at various interaction times. Both the B1 and B2 A-RBs generally displayed more elastic (lower δ values) and stiffer (higher G* values) characteristics as the interaction time increased. In comparison to the B1 A-RB, the B2 A-RB had lower δ values and higher G* values. However, after 8 h of interaction, the B1 A-RB’s internal structure underwent a significant transformation, as evidenced by its higher G* and lower δ values.
For the B1 A-RB, a well-structured polymer–rubber network was developed during the 8 h interaction time. The rubber was able to absorb more of asphalt’s light components and swell more because the neat B1 asphalt was softer than the neat B2 asphalt, creating a highly structured, well-organized network. As opposed to this, due to the higher stiffness of neat B2 asphalt, the B2 A-RB progressively changed with less effect on the inner network structure. As a result of this, after 8 h, the B1 AR-B underwent considerable alterations in terms of its rheological properties in comparison to the B2 A-RB regarding both stiffness and elasticity. The longer interaction times lead to the formation of stiff and highly elastic material, also providing improved rubber dispersion and enhanced structured networking, particularly in the softer binder. Both A-RBs exhibited increases in G* values with longer interaction times. This is due to the controlled interaction conditions, with a temperature of 190 °C, in which the rubber was able to swell and partially dissolve. These interactions aid in network structure formation, which will be presented in the following sections. At excessive temperatures (i.e., 240 °C), the rubber continued to devulcanize and depolymerize excessively, which resulted in lower G* values [21].
The results of the ISF test for B1 neat and A-RBs with various interaction times are shown in Figure 3a, which shows the formation of the A-RB’s internal network structure. The maximum shear stress rises with increasing interaction time. Additionally, the stress overshoot, which only occurred for the A-RB interaction at 8 h, is evidence of the network’s formation. The internal network structure formation in the B2 A-RB material at 8 h is confirmed in Figure 3b. At 8 h, the B1 A-RB’s network structure formation revealed a 17 kPa stress overshoot, which was higher than the B2 A-RB’s stress overshoot (6.8 kPa). This is consistent with the G* and δ values for the A-RBs that were discussed at 8 h.
The recorded shear stresses from the ISF test in different loading and rest cycles are presented in Figure 4 and Figure 5 for the A-RBs and in Figure 6 and Figure 7 for the neat binders. The A-RBs showed a stress overshoot—reaching the peak stress value before reaching a steady state—at the start of each loading cycle, reflecting the presence of internal network structures. Furthermore, the value of the overshoot increased when the duration of the rest period increased, reflecting the rearrangement of network structures after a breakdown. However, the neat binders showed steady-state stress with no overshoot, which confirmed the absence of network structures. The stress overshoots were more pronounced in the B1 A-RB (Figure 4) than in the B2 A-RB (Figure 5). The steady shear stress of the A-RBs ranged from 6 to 14 kPa, which was considerably higher than the 0.25 to 0.40 kPa range observed for neat asphalt.
The literature makes it clear that materials characterized by internal network structures and their entanglement exhibit an instantaneous shearing resistance to sudden shearing. This initial reaction is manifested in an overshoot of shear stress that relaxes with time. As the length of the rest time increases, the material’s ability to rebuild its network structures and entanglements will result in an increasing shear stress overshoot [10,14]. Entangled polymeric systems can be described as exhibiting similar characteristics regarding stress overshoots and the recovery of stress overshoot intensity with time, depending on the data gathered from this study and comparison with the prior literature. This suggests that at an 8 h interaction time, the B1 A-RB’s liquid phase featured a network structure.

3.2. Stage 2 Analysis: Rubber and Liquid Phase Analysis

3.2.1. Analysis of Rubber

Figure 8 shows how the compositional analysis of extracted rubber changes as the interaction time increases in comparison to the original. This figure is based on TGA and dissolution test results, with calculations performed using Equations (1) and (2). Thermal analysis revealed that the originally received rubber was composed of 7% OC, 28% NR, 21% SR, and 44% F.
Figure 3a shows that using a 15 min interaction time resulted in 25% dissolution in rubber, with the major components released being OC and NR. Nevertheless, increasing the interaction time to 8 h caused significant rubber component release, as evidenced by an increase in rubber dissolution of 30%, 62%, 78%, and 82% for the 1, 2, 4, and 8 h interactions, respectively. This agrees with findings discussed in a previous study [17]. The increase in rubber dissolution is linked to a significant release of most rubber components after 8 h of interaction time, with the OC reaching 0.5%, the NR reaching 5%, the SR reaching 2.5%, and the F components reaching 10%. After 8 h, the OC dropped by 92.9%, NR by 82.1%, SR by 88.1%, and F by 77.3% compared to the originally received rubber. Figure 3b similarly shows this trend for the rubber extracted from the B2 A-RB. After 8 h of interaction, the rubber dissolution rate was 85%, with OC at 1% and NR at around 2%. The SR decreased to 3%, while the F components diminished to 9%. After 8 h, the OC, NR, SR, and F values diminished by 85.7%, 92.9%, 85.7%, and 79.5%, respectively, in comparison to their original values. This shows that after 8 h of interaction, the majority of rubber components, including the remaining SR and F, were released. Notably, the F components did not settle in the asphalt binder samples; this was supported by the separation index calculations from previous studies [23].
Higher and earlier dissolution was observed for the rubber extracted from the A-RB with the softer binder (B1) compared to the rubber extracted from the A-RB with the stiffer binder (B2). These results agree with previous studies [42,43]: a greater compatibility is achieved between rubber and softer binders compared to stiffer ones. Furthermore, the influence of binder fractions on rubber particles was emphasized. The B1 binder had 7.73% more saturates plus aromatics than the B2 binder, allowing rubber particles to swell and partially dissolve faster in the B1 binder than in the B2 binder. The different trend in interaction between rubber and asphalt binders (B1 and B2) emphasized the different evolution of network structures and the homogeneity in both, as will be discussed in the next section.

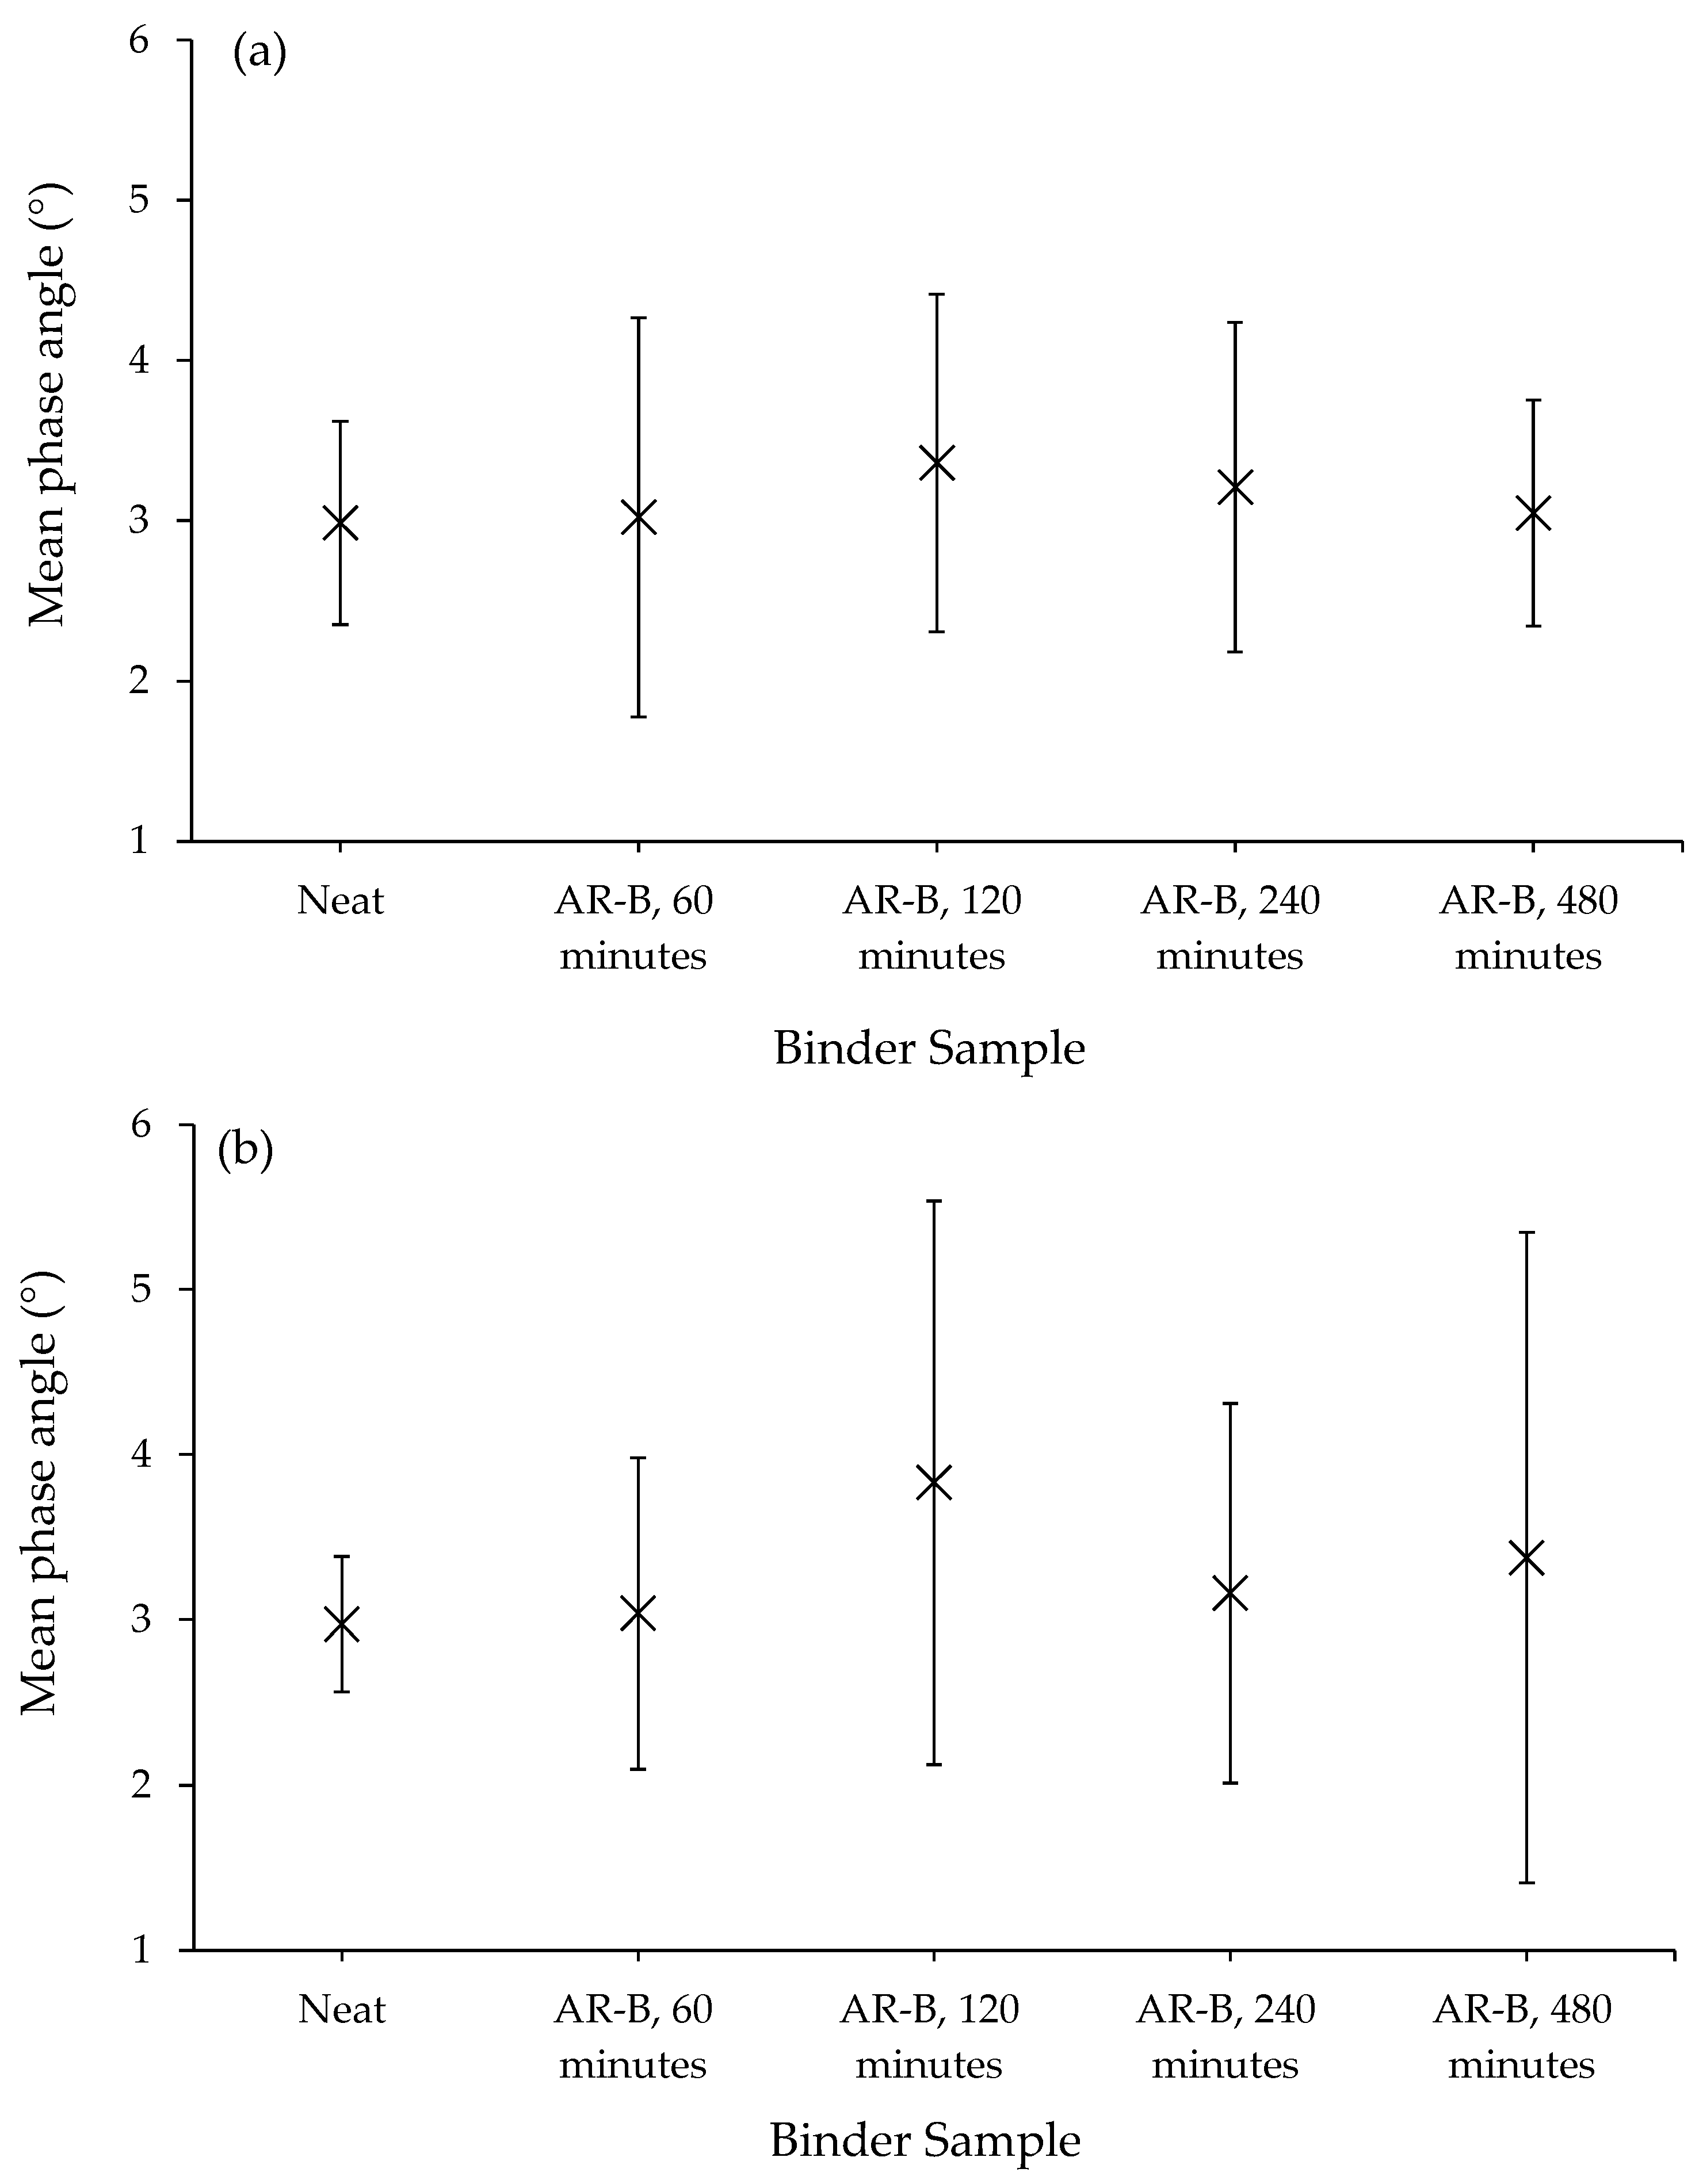
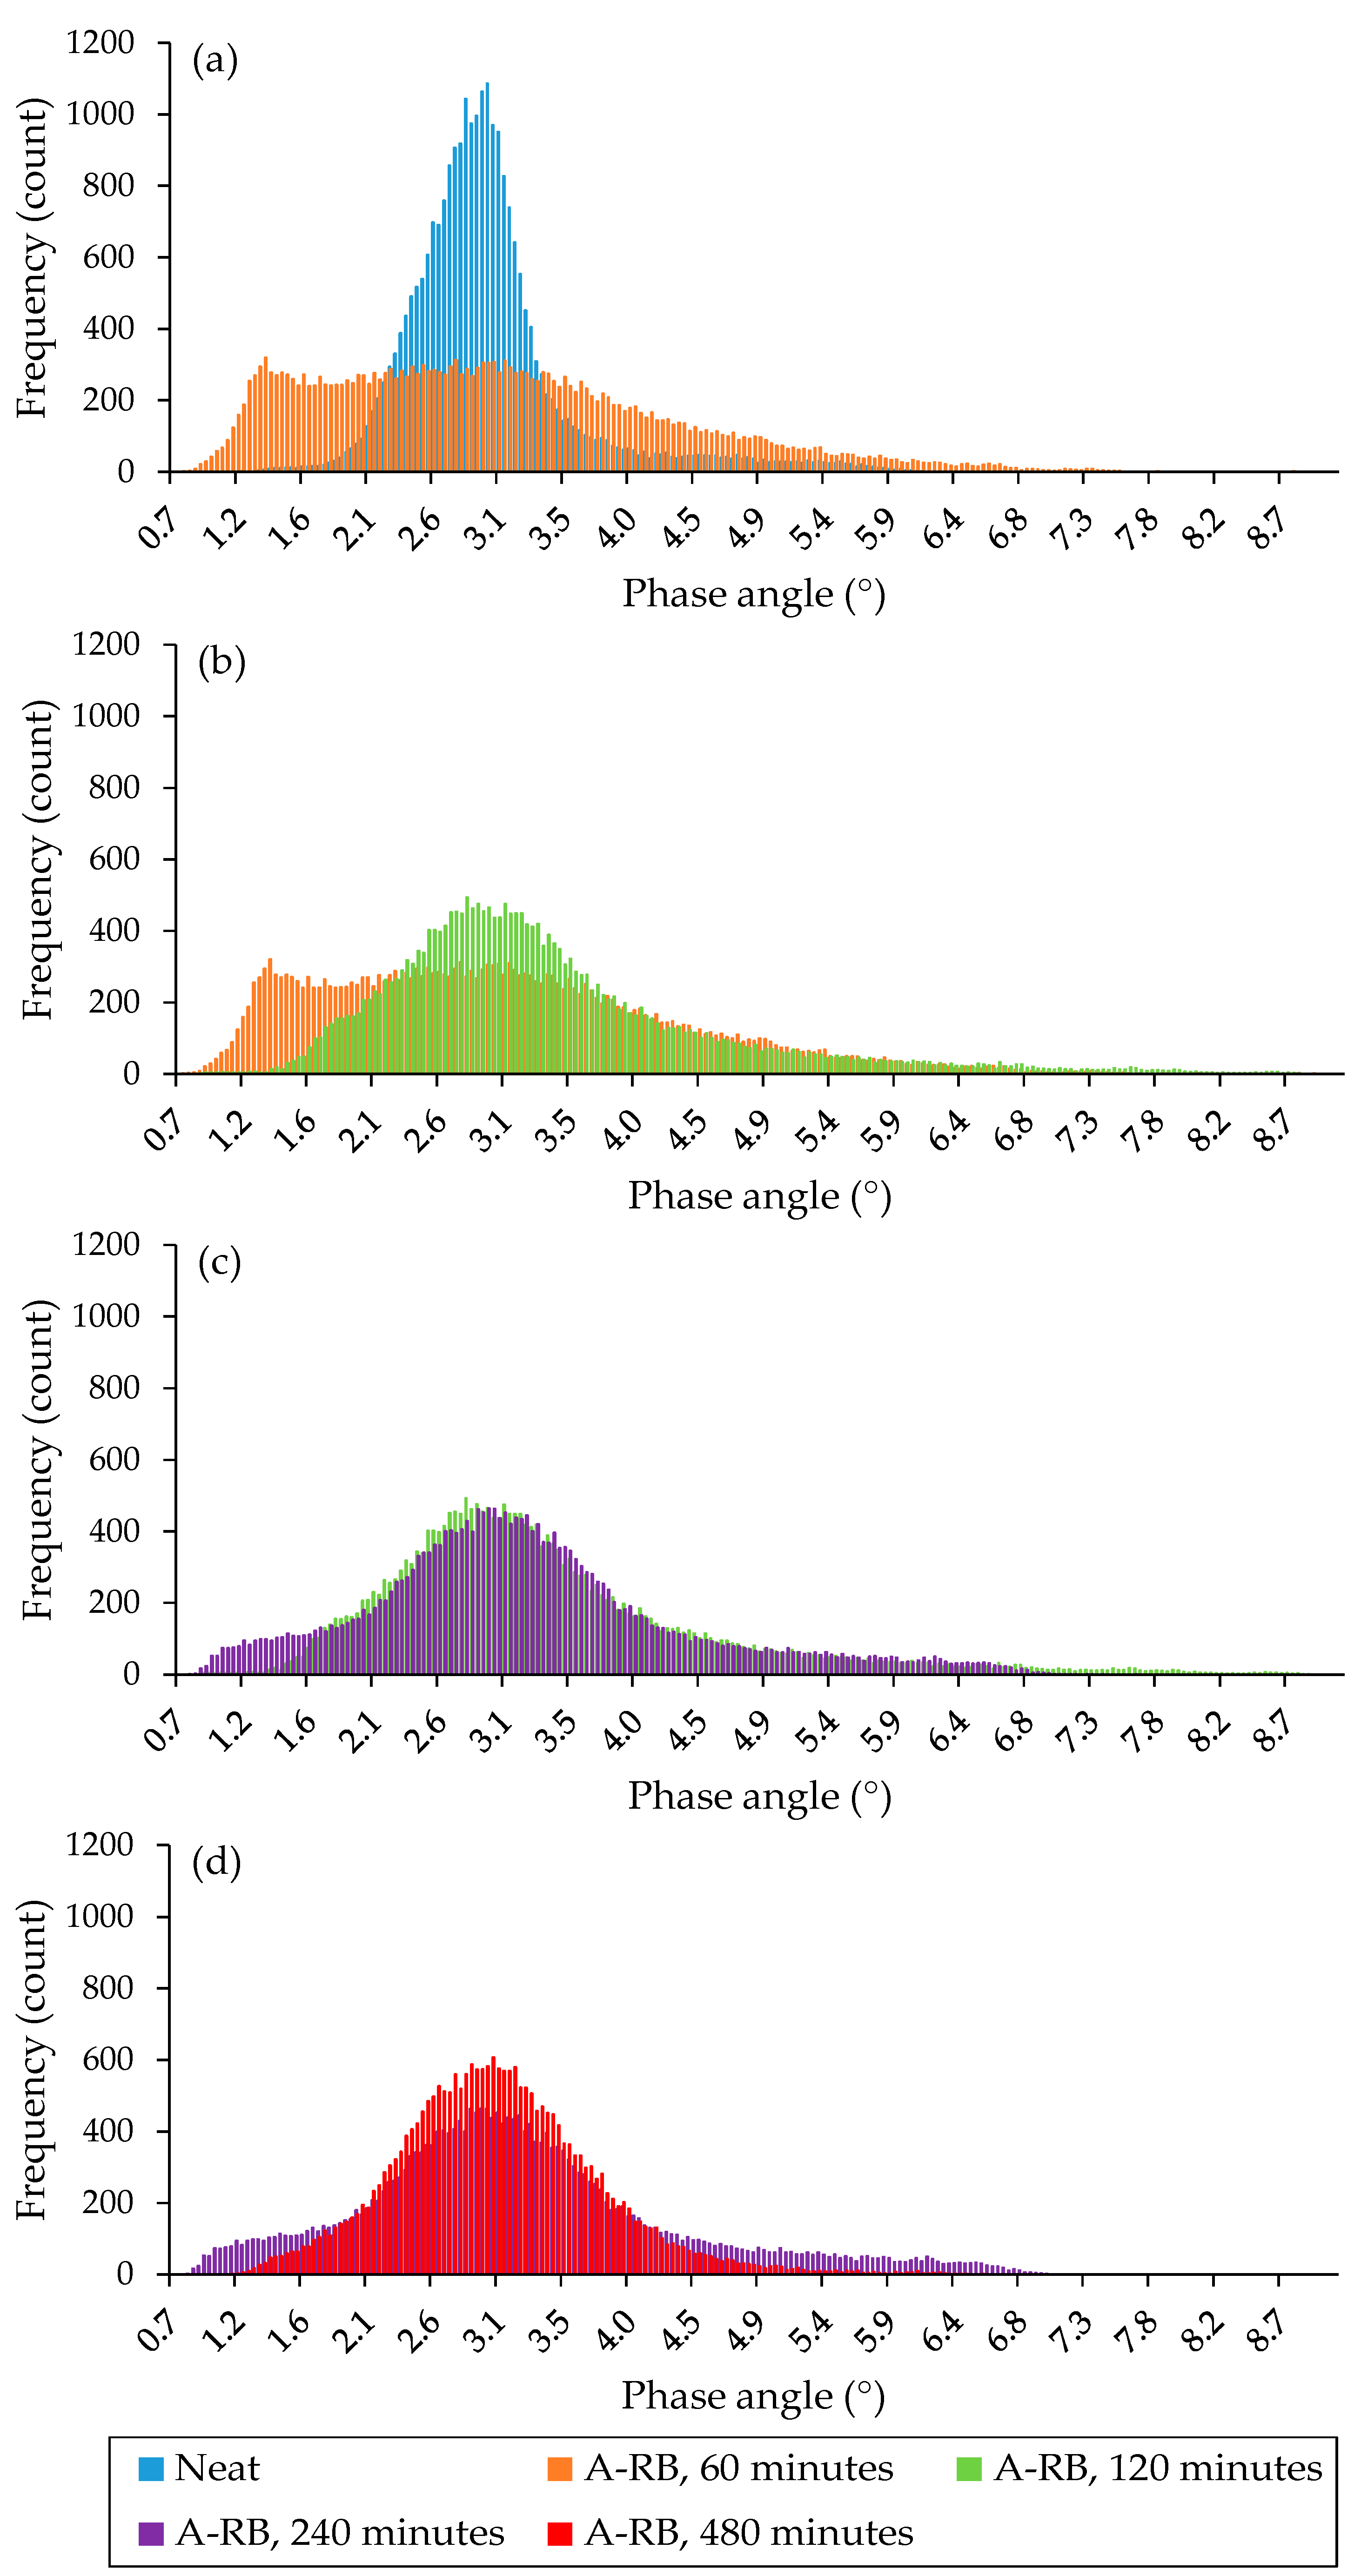
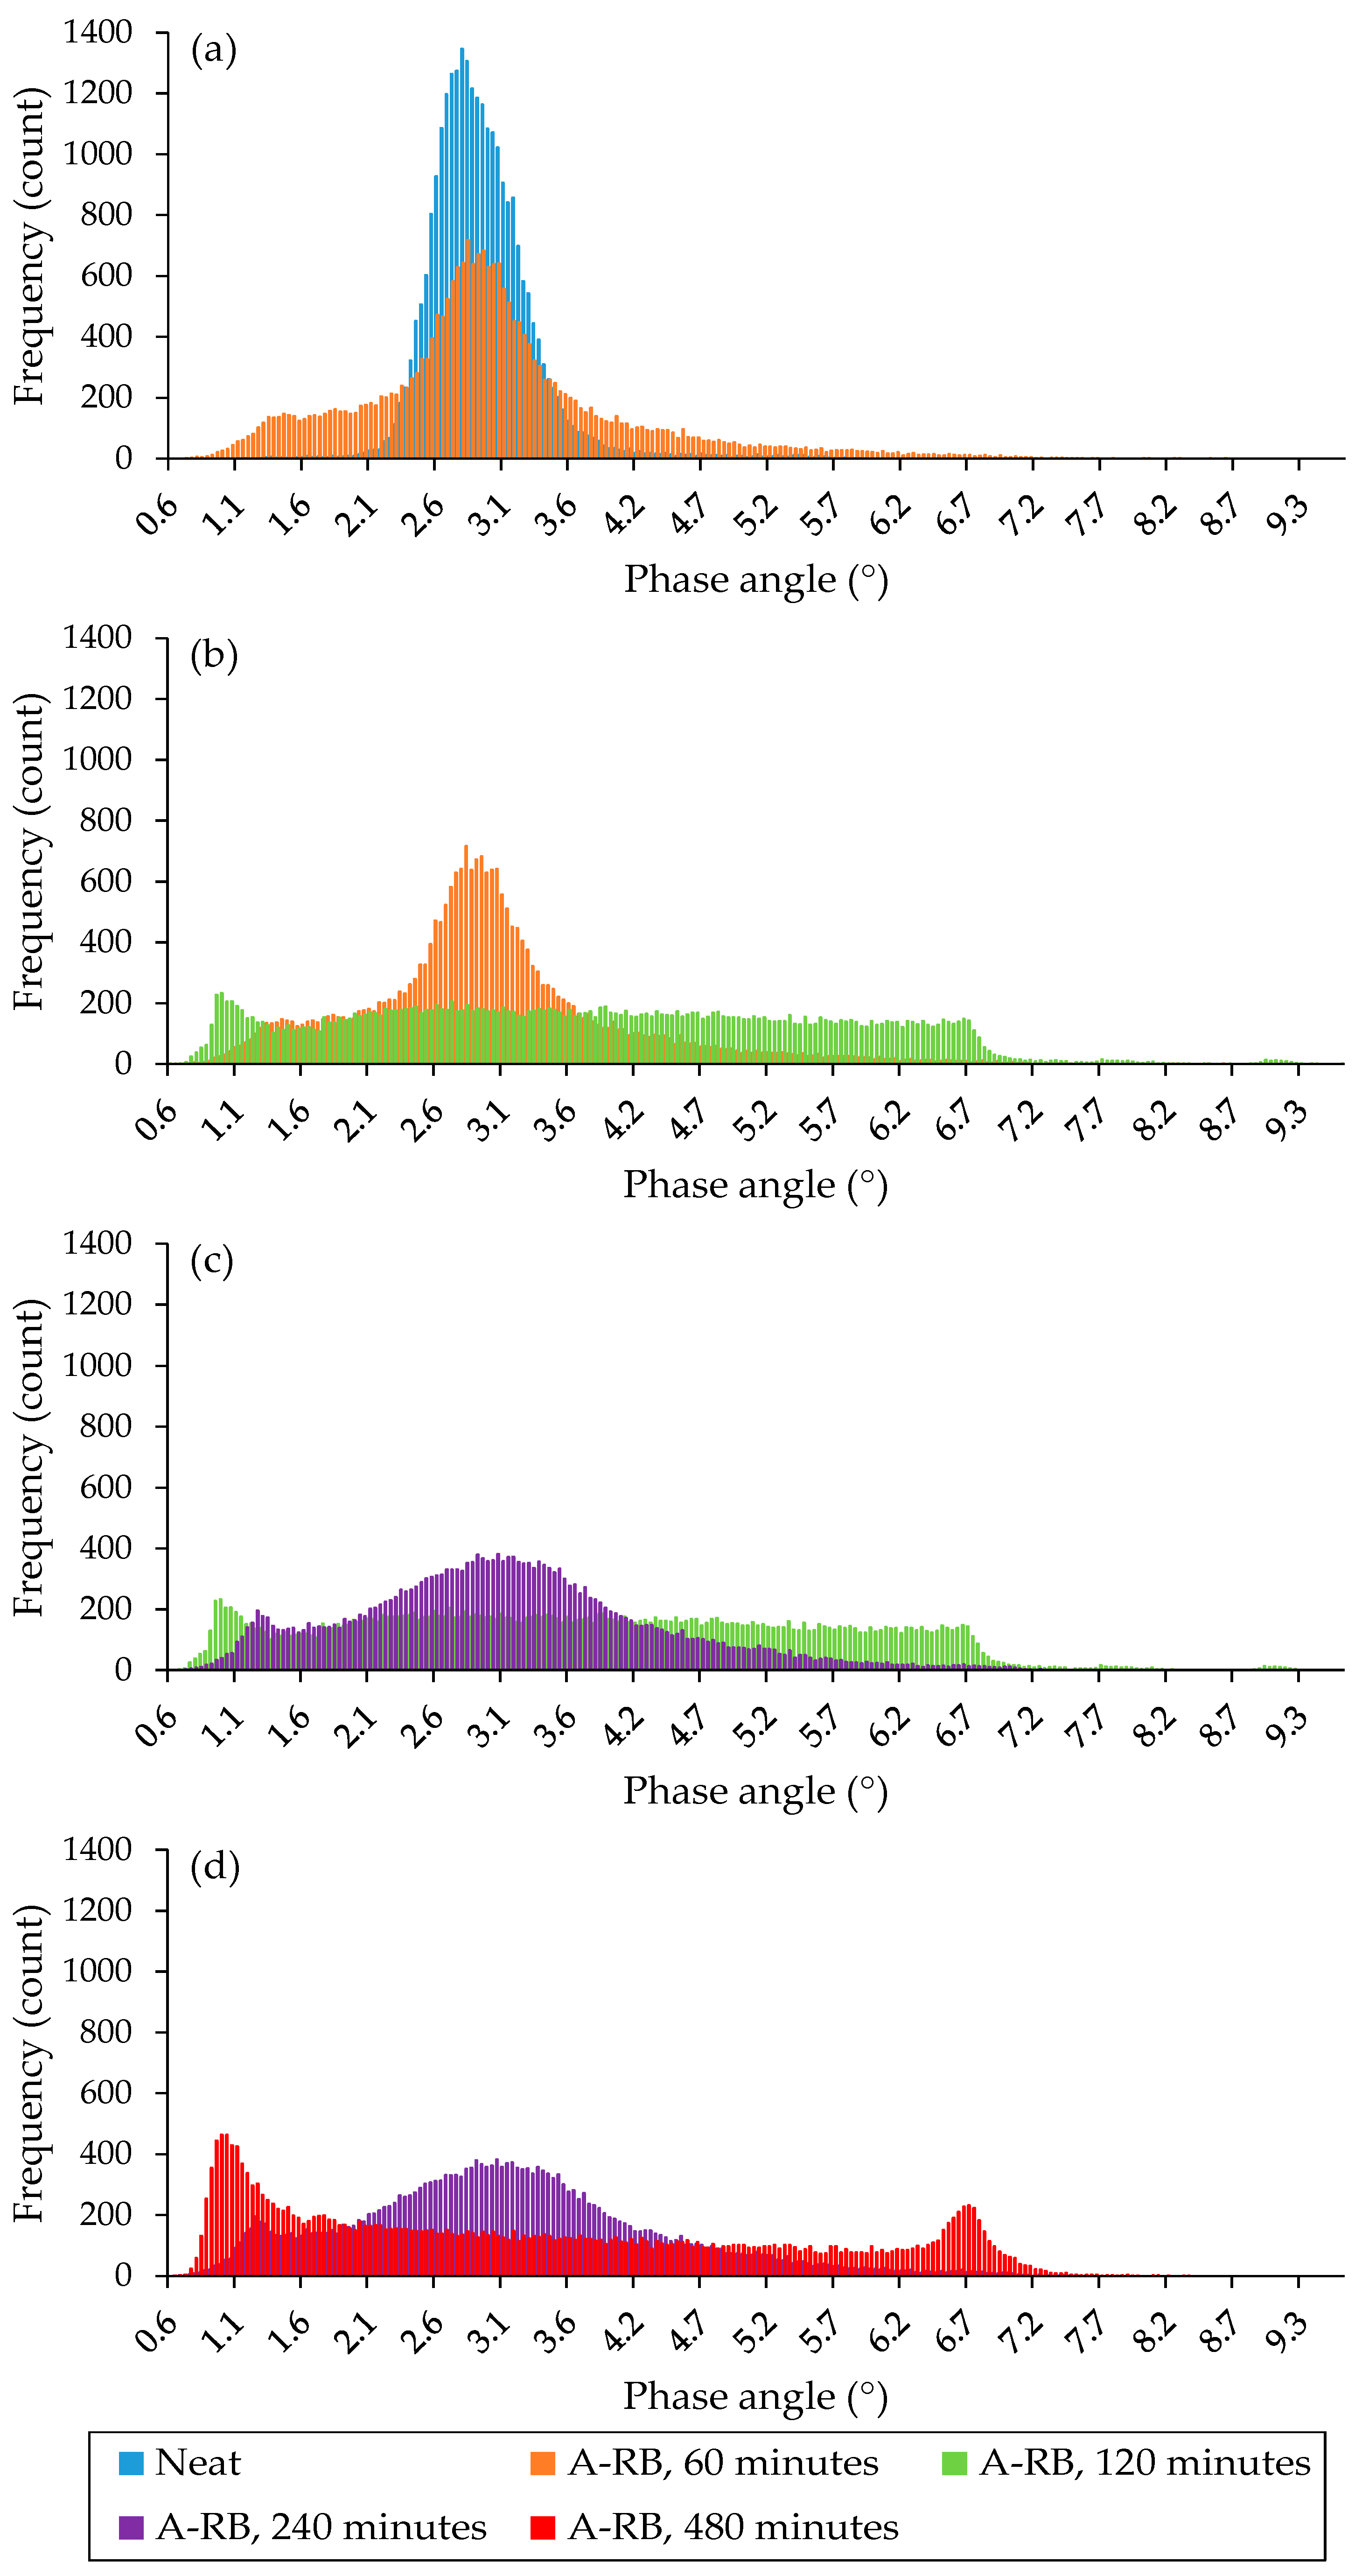
3.2.2. Morphology Analysis of Liquid Phases

Figure 9 presents the AFM-PDM images of the B1 and B2 neat binders for scan areas of 100 × 100 µm and 20 × 20 µm. When employing AFM-PDM to observe asphalt morphology, it is essential to consider that the asphalt microstructure is governed by fused aromatic rings aggregating into domains of varying sizes and shapes, as detailed in the literature [44]. The functional groups’ extent could also be a contributing factor, in addition to other factors that influence asphalt stiffness and the average ring structure [44]. Based on the morphology of the B1 neat binder shown in Figure 9, it can be inferred that the neat binder comprises two primary phases: the dispersoids (yellow dots) and the matrix (brown background beneath the dispersoids); see Figure 9. Dispersoids are minuscule dispersed phase domains integrated within the continuous matrix of the asphalt binder. Although the precise kind and type of such phases are outside the scope of this study, the alteration in A-RB morphology in comparison to that of the neat binder was examined. In a matrix of a different phase, the B2 neat binder is made up of uniformly distributed dispersoids that range in size from 0.5 to 1 µm.
Figure 10 presents the AFM-PDM morphologies of B1 and B2 A-RBs after 1, 2, 4, and 8 h interaction times within a 100 × 100 µm scan area. Figure 10a reveals circular agglomerated domains with their respective dispersed dispersoids after one hour of interaction. The pattern of agglomeration was characteristic of that observed in the neat binder. Figure 10b shows that after 2 h, the dispersoids began breaking up; nevertheless, circular domains were still obvious. Figure 10c reveals the formation of more refined and better organized dispersoids with little agglomeration after 4 h. After 8 h of interaction, as seen in Figure 10d, an extremely fine dispersed phase formed as a secondary phase, comprising a linear, lamellar-like structural pattern. Figure 10e illustrates circular clusters encircled by dispersed dispersoids for the B2 A-RB with a 1 h interaction time. These clusters are incomparable to those of the B2 neat binder, which showed no agglomeration in comparison to the B1 neat binder. Figure 10f, in comparison to the transformation viewed in B1 A-RB after two hours of interaction, illustrates that the clusters persisted, indicating a slower morphological evolution in comparison to the B1 A-RB. The dispersoids were in a more refined framework following 4 h of interaction; see Figure 10g. The rubber components that were exchanged with asphalt played a large role in the development of the network structure. This is shown in Figure 10h, which demonstrates the existence of accumulated phase structures encircling the original ones.
Figure 11 presents AFM-PDM images of the B1 and B2 A-RBs with interaction times of 1, 2, 4, and 8 h, scanned over an area of 20 × 20 µm. Figure 11a represents the circular domains, which consist of the initial dispersoids that exist in the unmodified binder. This can be utilized to infer that, even after one hour of interaction, the asphalt binder did not experience a loss of structural features. As indicated in Figure 11b, following two hours of interaction, the bigger agglomerates of dispersoids began breaking down and were increasingly replaced by finer and more orderly phases. This transformation reflects that a component exchange between the rubber and asphalt began, actively altering the binder’s internal structure. In Figure 11c, for the four-hour interaction, the dispersoids were more uniformly distributed with no agglomeration. Notably, the morphology of the B1 A-RB at this stage bore a close resemblance to that of low-polymer-modified asphalt [24,45,46]. Figure 11d reveals a more structured homogeneous phase morphology, with patterns resembling lamellar layers—a phenomenon often observed when network formation is initiated in modified asphalts [24]. It is not an instantaneous process; the process initiates as the original asphalt matrix begins to break. Then, with the ongoing interaction and component exchange between the rubber and asphalt, internal structures are developed progressively inside the binder [47].
Figure 11e presents particles that appear to be evenly distributed throughout the binder matrix. This image likely shows an area that did not portray the clustering previously seen in Figure 11a for the B1 A-RB. This means that although both the B1 and B2 A-RBs presented signs of network formation, the nature of these networks differed considerably. In Figure 11f, following two hours of interaction, there is a drastic morphology change—portions of one phase contain dispersoids of the other phase, suggesting a phase inversion, a phenomenon that has been observed for polymer-modified asphalts. Figure 11g exhibits more ordered surface dispersoids, and minimal or no aggregation is observed. It can be noted here that the morphology at this stage very much resembles that of low-polymer-modified asphalts [24,45,46]. Finally, Figure 11h shows a close-up of one of the clusters apparent in Figure 10h. Two different phases are apparent, with varying dispersoid sizes and heights from the surface. Polymer modifiers are known to contribute to the development of rougher surface textures in asphalt; also, while network structures were apparent in both types of binders, their arrangements and configurations differed based on the source of the asphalt.
The mean values of these phase angles extracted from the AFM-PDM images are highlighted in Figure 12 to reveal the evolution of the homogeneity and stability of the network structures in the A-RBs with the interaction time and varying asphalt binders. These angles are indicators of the lag time of the drive signal of the AFM cantilever compared to its response upon coming into contact with the sample surface, thereby highlighting the homogeneity of the internal network structures and their evolution with interaction time [48,49]. Lower average phase angles are indicative of more stable and homogeneous networks in the structures, which influence the performance properties of the binder as well.
The neat B1 and B2 binders had mean phase angles of around 2.99° and the lowest standard deviation. After 1 h of interaction, the phase angles remained nearly unchanged (3.03°), indicating that the rubber had not significantly affected the network formation. Nevertheless, after 2 h, the phase angles increased to a range of 3.36°–3.83°, indicating stiffer and more elastic binders due to the initial development of internal network structures. After 4 h, the phase angles decreased to 3.21° for B1 and 3.16° for B2 AR-Bs, underscoring the restructuring or reorganization of the network. The B1 AR-B showed a continuous declining phase angle (to 3.05°) after 8 h, thus stressing a more consistent and stable network structure. By showing a phase angle of 3.38°, the B2 AR-B revealed a delayed heterogeneous interaction between the rubber and the stiffer binder.
The 8 h B1 A-RB had the lowest mean phase angle and standard deviation among the B1 and B2 A-RBs, suggesting a more homogeneous network with a smoother surface. For the B2 A-RB, the phase angle decreased at 4 h and subsequently increased at 8 h, implying that due to the slow and unequal interaction of the stiff binder with rubber, the internal phases likely remained unstable and diverse during prolonged interaction durations. The rapid and extensive swelling of the rubber and its subsequent partial dissolution in the soft binder allowed for an even distribution of polymeric components into the liquid phase of the binder, which resulted in rather uniform network structures. Overall, these results underline the capacity of the soft binder with rubber particles to build a homogeneous network structure over a lengthy duration (8 h), which was less obvious and more diverse for the stiff binder.
Figure 13 and Figure 14 illustrate the histograms of the phases of the B1 and B2 neat and A-RBs, respectively. The histograms validate the results shown in Figure 12 by demonstrating the distribution and uniformity of the phase angles in the liquid phases of the asphalt binders. Broader distributions reflect heterogeneous surfaces, while narrower peaks resemble homogeneous surfaces. For the B1 A-RB’s histogram, the 1 h interaction initially transformed from a narrow peak for the neat binder into a more broadly distributed histogram, reflecting ongoing interactions with multiple diverse phase angles. The histograms narrowed between 2 and 4 h but stayed broader than that of the neat binder, implying heterogeneous phase evolution in the network. The B1 A-RBs’ narrow histogram after 8 h indicated the presence of homogeneous phases in the developed network structures. Conversely, the B2 A-RB histogram initially exhibited a wide distribution after 1 h, which evolved into a broader, more stabilized distribution after 2 h. The peaked histogram then re-emerged after 4 h of interaction and was indicative of temporary phase uniformity. After 8 h, the histogram was observed to be widely stabilized with two minor peaks and was indicative of a less uniform, heterogeneous network structure.

4. Conclusions

This study highlights the importance of considering both binder stiffness and the rubber–asphalt interaction time in establishing homogeneous internal network structures, which are crucial for binder performance. The microstructural changes are directly aligned with the improved elastic and stiffness properties of the binder, which are central to improving mixture durability and rutting resistance. The set goal was reached by establishing a relationship between the development of internal network structures and other factors (the dissolution of rubber, exchanging its components, the surface morphology of the liquid phase, and the rheological parameters of the asphalt matrix). Based on this study, the following conclusions were reached:
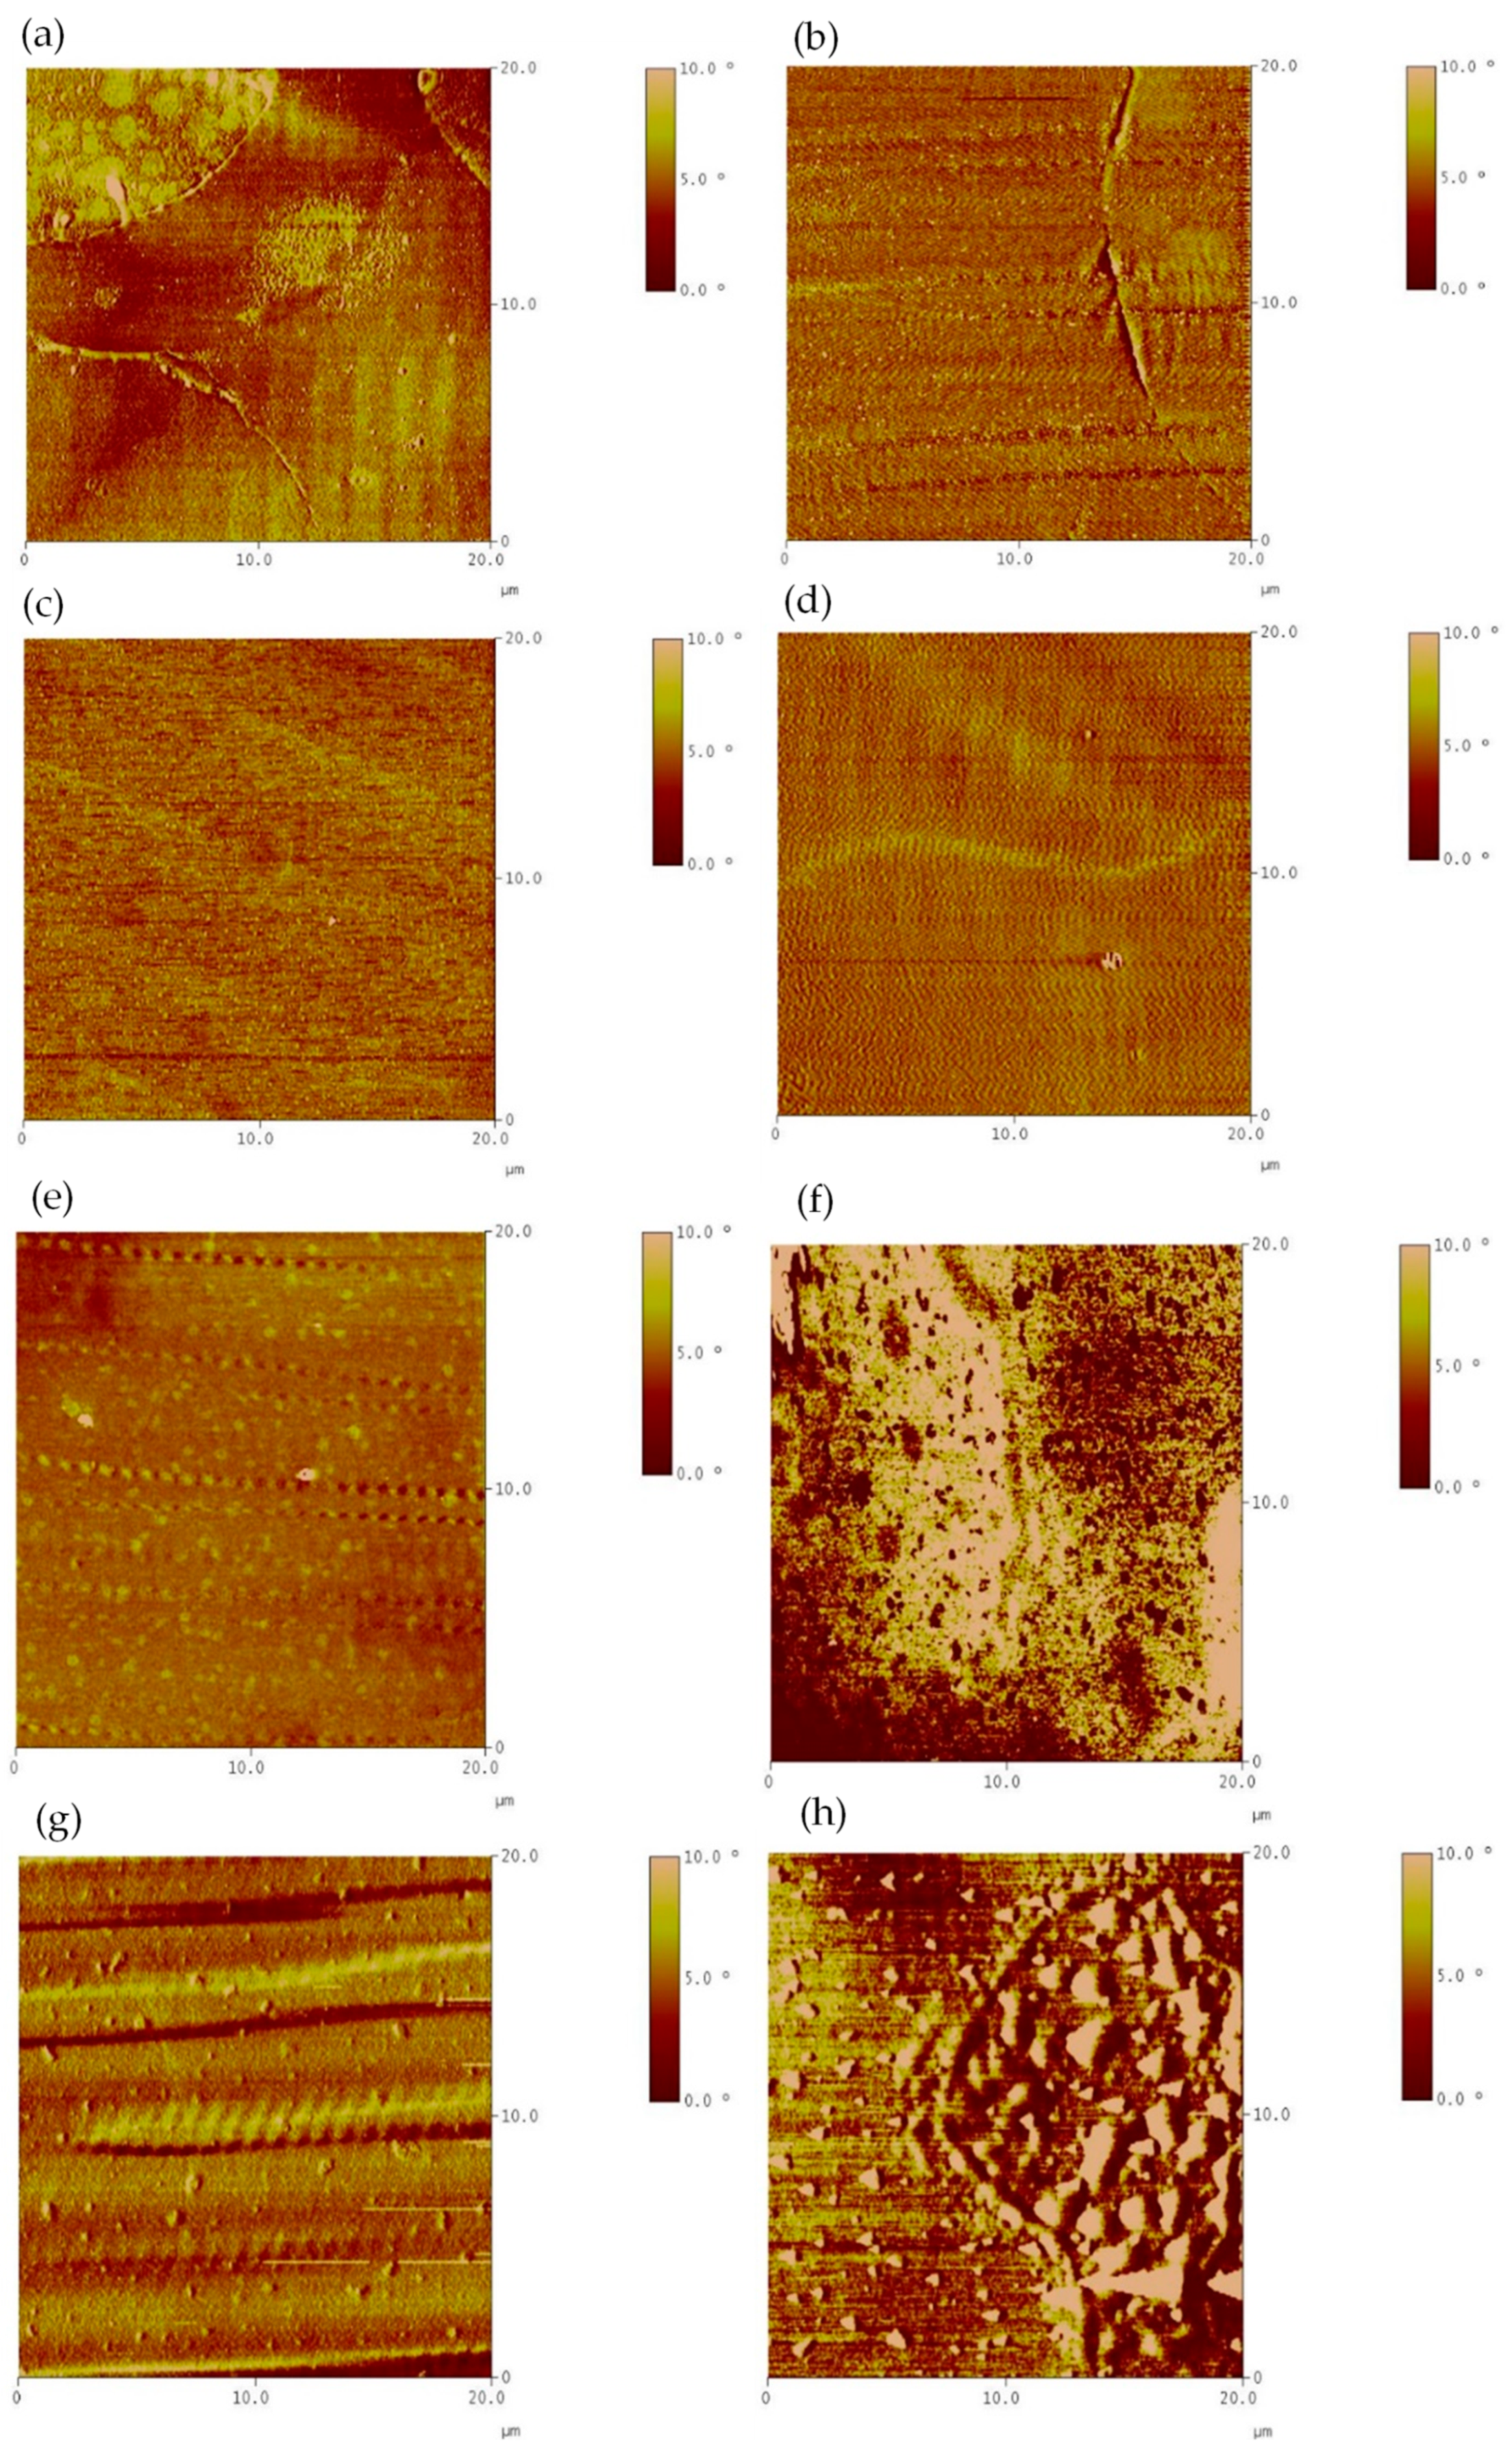
  • Time-driven morphological evolution: the morphology of the liquid phase evolved from agglomerated domains to a well-organized lamellar structure as the interaction time between soft asphalt and rubber increased after 4 h, especially after 8 h, due to the rubber dissolution and the exchange of its components with the asphalt. Extending the interaction time from 4 to 8 h increased rubber dissolution by 5–23%, depending on the binder type.
  • Influence of binder stiffness on network uniformity: the homogeneous network structures formed in A-RBs interacted with the rubber and soft binder. However, heterogeneous network structures were detected in the A-RBs that interacted with the same rubber and a stiffer binder.
  • Microstructural homogeneity was confirmed by AFM phase quantitative analysis: after 8 h of interaction between rubber and the soft binder, the A-RB displayed the lowest average phase angle and standard deviation, with a 10% decrease in the mean phase angle and a 64% reduction in the standard deviation, indicating a more homogeneous network with a smoother surface. These nanoscale findings validate the visual observations of the well-organized lamellar structures.
  • Rheological indicators of network formation: the stress overshoot effects were more pronounced, specifically by 150%, in the A-RBs that interacted with the soft binder after 8 h than those that interacted with the stiffer one.
  • Optimized blending guidelines for A-RBs: this study showed A-RB production with improved blending conditions (190 °C, 50 Hz, and 8 h) to gain uniform internal network development and maximize performance in A-RBs.

5. Recommendations and Future Work

This study recommends the following topics for future research:
  • The interaction conditions, 50 Hz speed, 8 h duration, and 190 °C temperature, were determined to be effective in inducing the formation of the internal network structures of the A-RBs.
  • For the enhancement of asphalt morphology understanding, AFM analysis should be combined with other methods, such as advanced chemical analyses.
  • Future studies must examine the influence of different rubber sources and their corresponding proportions on A-RB morphology.
  • Further studies should take into consideration aging, exposure to the environment, and different storage periods as variables affecting A-RB morphologies.

Author Contributions

Conceptualization, E.D.-A., M.R., and M.A. (Magdy Abdelrahman); methodology, E.D.-A., M.R., and M.A. (Magdy Abdelrahman); software, E.D.-A., M.R., and M.A. (Magdy Abdelrahman); validation, E.D.-A., M.R., and M.A. (Magdy Abdelrahman); formal analysis, E.D.-A., M.R., and M.A. (Magdy Abdelrahman); investigation, M.R. and E.D.-A.; resources, M.A. (Magdy Abdelrahman); data curation, E.D.-A., M.R., and M.A. (Magdy Abdelrahman); writing—original draft preparation, E.D.-A., M.R., and M.A. (Magdy Abdelrahman); writing—review and editing, E.D.-A., M.R., M.A. (Mohamed Attia), and M.A. (Magdy Abdelrahman); visualization, E.D.-A., M.R., and M.A. (Magdy Abdelrahman); supervision, M.A. (Magdy Abdelrahman); project administration, M.A. (Magdy Abdelrahman); funding acquisition, M.A. (Magdy Abdelrahman). All authors have read and agreed to the published version of the manuscript.

Funding

This research was partially funded by the Missouri University of Science and Technology (Missouri S&T), the Missouri Asphalt Pavement Association (MAPA) endowment fund. Experimental work and material testing were supported by the National Science Foundation, Award No. 0846861.

Data Availability Statement

The original contributions presented in this study are included in the article. Further inquiries can be directed to the corresponding author.

Conflicts of Interest

Author Mohyeldin Ragab was employed by the Pure Asphalt Company. The remaining authors declare that the research was conducted in the absence of any commercial or financial relationships that could be construed as a potential conflict of interest.

Abbreviations

The following abbreviations are used in this manuscript:
AFMAtomic Force Microscopy
A-RBAsphalt–Rubber Binder
DTGDerivative of Thermograph
FFiller
ISFInterrupted Shear Flow
NRNatural Rubber
OCOily Components
PDMPhase Detection Mode
PGPerformance Grade
SRSynthetic Rubber
TGAThermogravimetric Analysis

References

  1. Branthaver, J.F.; Petersen, J.; Robertson, R.; Duvall, J.; Kim, S.; Harnsberger, P.; Mill, T.; Ensley, E.; Barbour, F.; Scharbron, J. Binder Characterization and Evaluation Volume 2: Chemistry; SHRP-A-368; National Academy of Sciences: Washington, DC, USA, 1993. [Google Scholar]
  2. Lamontagne, J.; Dumas, P.; Mouillet, V.; Kister, J. Comparison by Fourier transform infrared (FTIR) spectroscopy of different ageing techniques: Application to road bitumens. Fuel 2001, 80, 483–488. [Google Scholar] [CrossRef]
  3. Martínez-Estrada, A.; Chávez-Castellanos, A.E.; Herrera-Alonso, M.; Herrera-Nájera, R. Comparative study of the effect of sulfur on the morphology and rheological properties of SB-and SBS-modified asphalt. J. Appl. Polym. Sci. 2010, 115, 3409–3422. [Google Scholar] [CrossRef]
  4. Zhang, B.; Xi, M.; Zhang, D.; Zhang, H.; Zhang, B. The effect of styrene–butadiene–rubber/montmorillonite modification on the characteristics and properties of asphalt. Constr. Build. Mater. 2009, 23, 3112–3117. [Google Scholar] [CrossRef]
  5. Siddiqui, M.N.; Ali, M.F. Studies on the aging behavior of the Arabian asphalts. Fuel 1999, 78, 1005–1015. [Google Scholar] [CrossRef]
  6. Siddiqui, M.N.; Ali, M.F.; Shirokoff, J. Use of X-ray diffraction in assessing the aging pattern of asphalt fractions. Fuel 2002, 81, 51–58. [Google Scholar] [CrossRef]
  7. Trejo, F.; Ancheyta, J.; Morgan, T.; Herod, A.; Kandiyoti, R. Characterization of asphaltenes from hydrotreated products by SEC, LDMS, MALDI, NMR, and XRD. Energy Fuel 2007, 21, 2121–2128. [Google Scholar] [CrossRef]
  8. De Moraes, M.; Pereira, R.; Simão, R.; Leite, L. High temperature AFM study of CAP 30/45 pen grade bitumen. J. Microsc. 2010, 239, 46–53. [Google Scholar] [CrossRef]
  9. Petersen, J.; Robertson, R.; Branthaver, J.; Harnsberger, P.; Duvall, J.; Kim, S.; Anderson, D.; Christiansen, D.; Bahia, H. Binder Characterization and Evaluation Volume 1; SHRP-A-367, Strategic Highways Research Program; National Research Council: Washington, DC, USA, 1994. [Google Scholar]
  10. Wekumbura, C.; Stastna, J.; Zanzotto, L. Destruction and recovery of internal structure in polymer-modified asphalts. J. Mater. Civ. Eng. 2007, 19, 227–232. [Google Scholar] [CrossRef]
  11. Deef-Allah, E.; Abdelrahman, M.; Ragab, M. Components’ exchanges between recycled materials and asphalt binders in asphalt mixes. Adv. Civ. Eng. Matls 2022, 11, 94–114. [Google Scholar] [CrossRef]
  12. Green, E.; Tolonen, W.J. The Chemical and Physical Properties of Asphalt Rubber Mixtures, Part I. Basic Material Behavior; FHWA-AZ-HPR14-162; Arizona DOT: Phoenix, AZ, USA, 1977. [Google Scholar]
  13. Airey, G.D.; Rahman, M.M.; Collop, A.C. Absorption of bitumen into crumb rubber using the basket drainage method. Int. J. Pavement Eng. 2003, 4, 105–119. [Google Scholar] [CrossRef]
  14. Zanzotto, L.; Kennepohl, G.J. Development of rubber and asphalt binders by depolymerization and devulcanization of scrap tires in asphalt. Transp. Res. Rec. 1996, 1530, 51–58. [Google Scholar] [CrossRef]
  15. Billiter, T.; Davison, R.; Glover, C.; Bullin, J. Production of asphalt-rubber binders by high-cure conditions. Transp. Res. Rec. 1997, 1586, 50–56. [Google Scholar] [CrossRef]
  16. Deef-Allah, E.; Abdelrahman, M. Effect of used motor oil as a rejuvenator on crumb rubber modifier’s released components to asphalt binder. Prog. Rubber Plast. Recycl. Technol. 2020, 37, 87–114. [Google Scholar] [CrossRef]
  17. Deef-Allah, E.; Abdelrahman, M.; Hemida, A. Improving asphalt binder’s elasticity through controlling the interaction parameters between CRM and asphalt binder. Adv. Civ. Eng. Mater. 2020, 9, 262–282. [Google Scholar] [CrossRef]
  18. Abdelrahman, M. Controlling performance of crumb rubber-modified binders through addition of polymer modifiers. Transp. Res. Rec. 2006, 1962, 64–70. [Google Scholar] [CrossRef]
  19. Gawel, I.; Stepkowski, R.; Czechowski, F. Molecular interactions between rubber and asphalt. Ind. Eng. Chem. Res. 2006, 45, 3044–3049. [Google Scholar] [CrossRef]
  20. Billiter, T.; Chun, J.; Davison, R.; Glover, C.; Bullin, J. Investigation of the curing variables of asphalt-rubber binder. Pet. Sci. Technol. 1997, 15, 445–469. [Google Scholar] [CrossRef]
  21. Abdelrahman, M.; Carpenter, S. Mechanism of interaction of asphalt cement with crumb rubber modifier. Transp. Res. Rec. 1999, 1661, 106–113. [Google Scholar] [CrossRef]
  22. Wang, H.; Apostolidis, P.; Zhu, J.; Liu, X.; Skarpas, A.; Erkens, S. The role of thermodynamics and kinetics in rubber–bitumen systems: A theoretical overview. Int. J. Pavement Eng. 2021, 22, 1785–1800. [Google Scholar] [CrossRef]
  23. Das, P.K.; Baaj, h.; Tighe, S.; Kringos, N. Atomic force microscopy to investigate asphalt binders: A state-of-the-art review. Road Mater. Pavement Des. 2016, 17, 693–718. [Google Scholar] [CrossRef]
  24. Król, J.; Radziszewski, P.; Kowalski, K.J. Influence of microstructural behavior on multiple stress creep recovery (MSCR) in modified bitumen. Procedia Eng. 2015, 111, 478–484. [Google Scholar] [CrossRef]
  25. ASTM E1131-20; Standard Test Method for Compositional Analysis by Thermogravimetry. ASTM International: West Conshohocken, PA, USA, 2020.
  26. ASTM D4124-09; Standard Test Method for Separation of Asphalt into Four Fractions. ASTM International: West Conshohocken, PA, USA, 2018.
  27. Ragab, M. Enhancing the Performance of Crumb Rubber Modified Asphalts Through Controlling the Internal Network Structure Developed. Ph.D. Thesis, NDSU, Fargo, ND, USA, 2016. [Google Scholar]
  28. ASTM D2872-22; Test Method for Effect of Heat and Air on a Moving Film of Asphalt (Rolling Thin-Film Oven Test). ASTM International: West Conshohocken, PA, USA, 2022.
  29. Williams, P.T.; Besler, S. Pyrolysis-thermogravimetric analysis of tyres and tyre components. Fuel 1995, 74, 1277–1283. [Google Scholar] [CrossRef]
  30. Senneca, O.; Salatino, P.; Chirone, R. A fast heating-rate thermogravimetric study of the pyrolysis of scrap tyres. Fuel 1999, 78, 1575–1581. [Google Scholar] [CrossRef]
  31. Seidelt, S.; Müller-Hagedorn, M.; Bockhorn, H. Description of tire pyrolysis by thermal degradation behaviour of main components. J. Anal. Appl. Pyrolysis 2006, 75, 11–18. [Google Scholar] [CrossRef]
  32. Lee, Y.S.; Lee, W.-K.; Cho, S.-G.; Kim, I.; Ha, C.-S. Quantitative analysis of unknown compositions in ternary polymer blends: A model study on NR/SBR/BR system. J. Anal. Appl. Pyrolysis 2007, 78, 85–94. [Google Scholar] [CrossRef]
  33. Chen, F.; Qian, J. Studies of the thermal degradation of waste rubber. Waste Manag. 2003, 23, 463–467. [Google Scholar] [CrossRef]
  34. Prime, R.B.; Bair, H.E.; Vyazovkin, S.; Gallagher, P.K.; Riga, A. Thermogravimetric analysis (TGA). In Thermal Analysis of Polymers, Fundamentals and Applications, 1st ed.; Menczel, J.D., Prime, R.B., Eds.; John Wiley & Sons, Inc.: Hoboken, NJ, USA, 2008; pp. 241–317. [Google Scholar]
  35. Hatakeyama, T.; Zhenhai, L. Handbook of Thermal Analysis; John Wiley & Sons, Inc.: Hoboken, NJ, USA, 1999. [Google Scholar]
  36. Ghavibazoo, A.; Abdelrahman, M. Composition analysis of crumb rubber during interaction with asphalt and effect on properties of binder. Int. J. Pavement Eng. 2013, 14, 517–530. [Google Scholar] [CrossRef]
  37. Zhong, Q.; Inniss, D.; Kjoller, K.; Elings, V. Fractured polymer/silica fiber surface studied by tapping mode atomic force microscopy. Surf. Sci. Lett. 1993, 290, L688–L692. [Google Scholar]
  38. Loeber, L.; Sutton, O.; Morel, J.; Valleton, J.M.; Muller, G. New direct observations of asphalts and asphalt binders by scanning electron microscopy and atomic force microscopy. J. Microsc. 1996, 182, 32–39. [Google Scholar] [CrossRef]
  39. Stark, M.; Guckenberger, R. Fast low-cost phase detection setup for tapping-mode atomic force microscopy. Rev. Sci. Instrum. 1999, 70, 3614–3619. [Google Scholar] [CrossRef]
  40. Anczykowski, B.; Krüger, D.; Fuchs, H. Cantilever dynamics in quasinoncontact force microscopy: Spectroscopic aspects. Phys. Rev. B 1996, 53, 15485–15488. [Google Scholar] [CrossRef] [PubMed]
  41. Winkler, R.; Spatz, J.; Sheiko, S.; Möller, M.; Reineker, P.; Marti, O. Imaging material properties by resonant tapping-force microscopy: A model investigation. Phys. Rev. B 1996, 54, 8908–8912. [Google Scholar] [CrossRef] [PubMed]
  42. Peralta, J.; Silva, H.M.R.D.; Machado, A.V.; Pais, J.; Pereira, P.A.A.; Sousa, J.B. Changes in rubber due to its interaction with bitumen when producing asphalt rubber. Road Mater. Pavement Des. 2010, 11, 1009–1031. [Google Scholar] [CrossRef]
  43. Bouldin, M.G.; Collins, J.H.; Berker, A. Rheology and microstructures of polymer/asphalt blends. Rubber Chem. Technol. 1991, 64, 577–600. [Google Scholar] [CrossRef]
  44. Masson, J.F.; Leblond, V.; Margeson, J. Bitumen morphologies by phase-detection atomic force microscopy. J. Microsc. 2006, 221, 17–29. [Google Scholar] [CrossRef]
  45. Sengoz, B.; Isikyakar, G. Evaluation of the properties and microstructure of SBS and EVA polymer modified bitumen. Constr. Build. Mater. 2008, 22, 1897–1905. [Google Scholar] [CrossRef]
  46. Wu, S.-P.; Pang, L.; Mo, L.-T.; Chen, Y.-C.; Zhu, G.-J. Influence of aging on the evolution of structure, morphology and rheology of base and SBS modified bitumen. Constr. Build. Mater. 2009, 23, 1005–1010. [Google Scholar] [CrossRef]
  47. Pauli, A.; Grimes, R.; Beemer, A.; Turner, T.; Branthaver, J. Morphology of asphalts, asphalt fractions and model wax-doped asphalts studied by atomic force microscopy. Int. J. Pavement Eng. 2011, 12, 291–309. [Google Scholar] [CrossRef]
  48. Nagao, E.; Dvorak, J.A. Phase imaging by atomic force microscopy: Analysis of living homoiothermic vertebrate cells. Biophys. J. 1999, 76, 3289–3297. [Google Scholar] [CrossRef]
  49. Marrese, M.; Guarino, V.; Ambrosio, L. Atomic force microscopy: A powerful tool to address scaffold design in tissue engineering. J. Funct. Biomater. 2017, 8, 7. [Google Scholar] [CrossRef]
Figure 1. Experimental program.
Buildings 15 01963 g001
Figure 2. G* and δ evolution in B1 and B2 A-RBs.
Buildings 15 01963 g002
Figure 3. ISF 1st-cycle results for (a) B1; (b) B2 neat and A-RBs.
Buildings 15 01963 g003
Figure 4. Shear stress overshoot of B1 A-RB with 8 h interaction time.
Buildings 15 01963 g004
Figure 5. Shear stress overshoot of B2 A-RB with 8 h interaction time.
Buildings 15 01963 g005
Figure 6. Shear stress steady state of B1 neat binder.
Buildings 15 01963 g006
Figure 7. Shear stress steady state of B2 neat binder.
Buildings 15 01963 g007
Figure 8. Compositional analysis of original and extracted rubber samples from (a) B1 AR-B and (b) B2 AR-B.
Buildings 15 01963 g008
Figure 9. Morphology of neat binders: (a) 100 × 100 µm B1; (b) 20 × 20 µm B1; (c) 100 × 100 µm B2; (d) 20 × 20 µm B2.
Buildings 15 01963 g009
Figure 10. Morphology of A-RBs within 100 × 100 µm scan area: (a) 1 h B1; (b) 2 h B1; (c) 4 h B1; (d) 8 h B1; (e) 1 h B2; (f) 2 h B2; (g) 4 h B2; (h) 8 h B2.
Buildings 15 01963 g010
Figure 11. Morphology of A-RBs within 20 × 20 µm scan area: (a) 1 h B1; (b) 2 h B1; (c) 4 h B1; (d) 8 h B1; (e) 1 h B2; (f) 2 h B2; (g) 4 h B2; (h) 8 h B2.
Buildings 15 01963 g011
Figure 12. Mean phase angles for (a) B1; (b) B2 neat and A-RBs.
Buildings 15 01963 g012
Figure 13. Comparisons of phase angle distributions for B1 (a) neat and 1 h A-RB; (b) 1 h A-RB and 2 h A-RB; (c) 2 h A-RB and 4 h A-RB; (d) 4 h A-RB and 8 h A-RB.
Buildings 15 01963 g013
Figure 14. Comparisons of phase angle distributions for B2 (a) neat and 1 h A-RB; (b) 1 h A-RB and 2 h A-RB; (c) 2 h A-RB and 4 h A-RB; (d) 4 h A-RB and 8 h A-RB.
Buildings 15 01963 g014
Table 1. Properties of binders and rubber.
Binder Properties
PropertyB1B2
Asphalt Fractions
(ASTM D 4124-09 [26])
Saturates (%)16.2311.85
Aromatics (%)40.4637.11
Resins (%)29.6435.37
Asphaltenes (%)13.6715.67
Rubber Properties
TypeCryogenic
SourceA mixed source of scrap tires
Rubber Components
(ASTM E1131-20 [25])
Oily Components (%)7.00
Natural Rubber (%)28.00
Synthetic Rubber (%)21.00
Filler (%)44.00
Disclaimer/Publisher’s Note: The statements, opinions and data contained in all publications are solely those of the individual author(s) and contributor(s) and not of MDPI and/or the editor(s). MDPI and/or the editor(s) disclaim responsibility for any injury to people or property resulting from any ideas, methods, instructions or products referred to in the content.

