Article

Impact Analysis of BIM on Power Substation Project Costs: Techno-Economic Data Evidence from China

by
Ding Liu
1,2,*,
Lizhong Qi
1,
Yi Sun
2,
Jingguo Rong
1,
Su Zhang
1 and
Guangze Yu
1
1
State Grid Economic and Technological Research Institute Co., Ltd., Beijing 102209, China
2
School of Electrical and Electronic Engineering, North China Electric Power University, Beijing 102206, China
*
Author to whom correspondence should be addressed.
Buildings 2025, 15(11), 1885; https://doi.org/10.3390/buildings15111885
Submission received: 30 April 2025 / Revised: 23 May 2025 / Accepted: 27 May 2025 / Published: 29 May 2025

Abstract

:
Due to the difficulty in measuring intangible effects and the reliance on experts for benefit evaluation, actual project data evidence of the impact of BIM is insufficient. To this end, this study collected total project cost data from 164 power substation projects and techno-economic statements from 34 power substation projects from SGCC to capture data evidence of the impact of BIM on project costs and explore its patterns. Algorithms such as hierarchical clustering based on improved DTW and feature selection based on QDA were designed for data mining. The findings demonstrate that the distribution of the CV% of total project costs and the CV% of some specific cost items became more concentrated after the application of BIM, which indicates that BIM enhanced the ability to predict and control project costs. Moreover, five cost items and five shape patterns of cost items were identified as key to the impact of BIM. It is therefore recommended that the related cost items should be controlled with focus during the application of BIM.

1. Introduction

Around the world, power grid construction is accelerating [1]. In the United States, the Investing in America agenda delivers more than $30 billion in grid infrastructure, the largest investment in history. In the European Union, the European Commission has proposed the EU Action Plan for Grids, which aims to accelerate the construction and upgrading of transmission and distribution networks [2]. In China, power grid investment continues to grow as the construction of new-type power systems accelerates [3], and the State Grid Corporation of China (SGCC) invested more than 600 billion yuan in the construction of ultra-high voltage grids and the digital and intelligent upgrading of distribution networks in 2024. In this round of power grid construction, digitalization is a keyword. Power substations, as part of the power grid, belong to industrial buildings. On the one hand, their construction procedures are similar to those of general construction projects, and their digital transformation process is also consistent with the construction industry. On the other hand, power grid projects have their own particularity, characterized by high technical complexity, large scale, long construction duration, and multi-participation [4]. Digital and intelligent technologies have demonstrated effective in addressing these characteristics, leading to substantial enhancements in efficiency, safety, and automation [5]. Compared to other construction projects, power grid projects have a stronger drive for digital transformation and a more urgent need for digital technology application.
BIM, as a fundamental and essential technology of building digitization [6,7], has drawn extensive attention in recent years, and has become a necessary technology for power grid projects. BIM is a technique for creating and managing information for buildings; it integrates structured and multidisciplinary data to produce a digital and intelligent representation of buildings across the lifecycle [8]. The capabilities and benefits of BIM, such as visualization, simulation, and clash detection, etc., have been widely acknowledged [9,10,11], the potential of BIM for smart design and smart construction has been widely explored. BIM provides a new technical path for power grid project cost management and a powerful tool for lean construction engineering management. When discussing construction engineering management and cost management, techno-economic statements are one of the core tools [12,13,14]. Techno-economic statements include information on design, construction, equipment, materials, labor and so on, which can provide data support for cost control, schedule management, quality control, resource optimization, risk management and so on. This is exactly the data basis of the present study: project costs are important indicators to reflect the practical value of BIM, and techno-economic statements are an effective channel to study the impact of BIM on the project.
In recent years, with the wide application of BIM in large-scale infrastructure or industrial projects such as power grid projects [15,16], some construction engineering management problems, such as delayed information update, inefficient collaboration, etc., as well as the resulting bias in quantity calculation and inaccurate cost control, have been solved to a certain extent [17]. But at the same time, the implementation of BIM seems to have entered a bottleneck: BIM is widely used in the design stage of projects, but the scenarios for further application of the design results in the construction stage and the operation stage are not clear enough [18,19]; the additional investment of time and resources generated by BIM application is clear, but its life-cycle benefits require further discussion, which often relies on expert opinion and is largely theoretical [20]. Demonstrating the techno-economic data evidence to prove the value of BIM is crucial for the application and promotion of BIM, as well as for the development of BIM business models [21,22]. To this end, this study collected sufficient and actual techno-economic data of power substation projects to carry out quantitative analysis, in order to reveal the law of the impact of BIM on project costs, which can provide support for systematic research on the impact mechanism of BIM and provide guidance for more effective cost management in the context of digital transformation of construction projects.

2. Literature Review

The implementation of BIM will create various effects [23]. Waqar et al. [24] examined the impact of BIM within the AEC sector and highlighted the positive outcomes of BIM implementation. Caglayan et al. [25] developed a framework for evaluating the effect of various factors on BIM effectiveness. These two pieces of literature provide a comprehensive overview of the two research focuses related to BIM applications: the positive impact of BIM implementation, i.e., the value of BIM, and the negative impact that limits the effectiveness of BIM, i.e., the barriers to BIM implementation. The research results of these two focuses are the basis of the present study, and the literature review will be organized around them.
In addition, both of these two pieces of literature used a questionnaire survey as the primary research method. In fact, questionnaire surveys and literature reviews have been widely used in related studies due to their advantages of convenient implementation and easy access to data. However, this research method relies excessively on expert opinions and lacks the support of actual project data, an approach that is inconsistent with the orientation of this study. There are a few case studies based on actual project data, which are more heuristic for this study, and, therefore, they are also reviewed in this section.

2.1. The Value of BIM

Research on the value of BIM in recent years has focused on how to quantify the effect of BIM [26]. Gharaibeh et al. [27] reviewed the investment value of BIM and categorized quantifiable factors, including productivity [28,29], changes and rework reduction [30], requests for information reduction [31,32], schedule efficiency [33,34], safety [35,36], environmental sustainability [37,38,39], and operations and facility management [40]. Besides comprehensive analyses of the effect of BIM, there are more studies that focus on specific effects. For instance, Gharaibeh et al. [41] directed attention toward the tangible economic effect and uncovered the positive correlation between higher levels of BIM implementation and greater economic benefits. Hwang et al. [42] made the first attempt to measure BIM’s effects on rework in construction projects using actual project data. The study showed that projects with BIM applications tend to have experienced lower incidence, magnitude, and impact of rework than those without BIM applications. Panya et al. [43] believed that BIM is insufficient in mitigating rework and proposed an interactive design change methodology using a BIM-based virtual reality and augmented reality to improve rework collaboration and communication among stakeholders. Furthermore, Huh et al. [44] introduced a priority policy in BIM-based design validation to optimize the number of BIM staff and reduce the waiting avoidance cost for engineers.
The above studies have several limitations. First, the quantitative method mainly converts the effect of BIM into costs, but the cost-benefit benchmarking has not been consistent. Second, the intangible effects, such as improving communication between participants, have not been given enough attention. Some studies have already focused on the intangible effects of BIM. Salleh et al. [45] identified five critical intangible benefits of BIM, i.e., better understanding of design, better information received and given, improved communication through visualization, reduced design error, and improved accuracy of drawings. Sompolgrunk et al. [46] developed an integrated model of BIM return on investment to examine the influence of intangible returning factors of BIM on the rate of BIM implementation. Wang et al. [47] revealed the effectiveness of BIM-based integration management in promoting information sharing and cooperation behavior in megaprojects for ultimate performance. The intangible effects are usually difficult to observe, and their value is also hard to quantify. However, research on the intangible aspects provides important references for a more comprehensive understanding of the value of BIM.

2.2. Obstacles to BIM Implementation

While BIM offers a range of benefits, there is ongoing debate regarding the extent to which these benefits are utilized in projects. Lidelöw et al. [48] contended that the benefits of BIM are not being achieved as expected in the mainstream architecture, engineering, construction, and operation (AECO) industries. There has always been a discussion in academia about the obstacles to BIM implementation. Deng et al. [49] identified 16 factors that affect the application of BIM, and constructed a system dynamics model to analyze the mechanism of these factors, which provided a comprehensive framework for analyzing the obstacles to BIM implementation.
In the early stages of BIM implementation, particularly in some developing countries, related studies identified technology, training, and expertise as the main obstacles [39,50,51,52,53]. This was somewhat consistent with Deng’s conclusion that BIM technology maturity, the difficulty level of BIM software operation, and the degree of collaboration among various departments within an enterprise are key influencing factors that initially drive BIM implementation [49]. With the deepening of BIM implementation, the obstacle role of economic factors has received further attention. Based on descriptive and empirical analysis, Altassan et al. [52] identified training, cost, and economic constraints as the main BIM implementation difficulties in Middle Eastern construction. In the field of facility management, Durdyev et al. [54] pointed out that the top two obstacles to BIM implementation are the high cost of software and hardware and the high cost of training. In the field of prefabricated construction, Xu et al. [55] studied the interaction mechanism of BIM application barriers and pointed out that investment is the main barrier for the owner. To optimize investment, Yu et al. [56] measured the cost requirements and related values for BIM adoption and suggested increasing budget allocation in the detail design phase and the construction phase from a value-oriented perspective. Sompolgrunk et al. [46] further pointed out that return on investment (ROI) is a key principle for capturing the value of BIM.
In some recent studies, the uncertainty of ROI has been identified as a major obstacle to BIM implementation [11,27,57]. Lechhab et al. [27,58] pointed out that the choice to invest in BIM is essentially an economic one. Therefore, the assessment of BIM ROI is necessary. However, there is, in fact, no standard method for calculating BIM ROI. Sompolgrunk et al. [59] identified and analyzed the key measurable returning factors associated with BIM ROI, i.e., schedule reduction and compliance, productivity improvement, request for information reduction, rework reduction, and change orders reduction. However, due to the lack of data, unmeasurable intangible effects, and complexity of productivity improvement, it is difficult to comprehensively and accurately calculate BIM ROI.
There are also some studies that proposed different viewpoints on the obstacles to BIM implementation. Cheng et al. [60] focused on the fragmentation of BIM application, which is a major issue in current BIM-based collaboration, and investigated the relational governance mechanism to enhance knowledge collaboration. Zhang et al. [61] conducted research from the perspective of construction practitioners, emphasizing that factors such as task–technology fit, effort expectancy, and performance expectancy can significantly improve practitioners’ behavioral intention. Olugboyega et al. [62] pointed out that merely lowering adoption obstacles (e.g., techno-economic obstacles) without sustained deployment tactics will not ensure the application of BIM. These viewpoints are instructive but not the main point of this paper.

2.3. Case Study Method

There are several methodological paradigms for quantifying the effects of BIM, each with its unique strengths and inherent limitations. According to Gharaibeh et al. [27], actual case studies are the most accurate method. Shin et al. [63] used the case study method to conduct a quantitative and qualitative analysis of applying BIM in the infrastructure design process. Six railway projects were selected as cases, and quantitative conclusions were obtained—BIM-implemented projects spent USD 65,800 less than their counterparts and could increase productivity by about 2.9%. Such studies typically focus on a small number of projects, and the conclusions are not representative or generalizable. Additionally, expert surveys serve as important data sources in these studies [64,65,66,67,68]. For example, Yu et al. [56] conducted the study based on a survey of 50 construction industry professionals. For complex situations such as intangible effects, experts can provide valuable and credible opinions. However, it is clear that expert surveys amplify the influence of people and lack evidence from actual data.
The present study also adopts the actual case study method. To ensure the objectivity of the conclusions, as much techno-economic data as possible from actual projects was collected for analysis. A small amount of expert opinion is used as supporting evidence to explain some counterintuitive conclusions.

3. Materials and Methods

3.1. Data Collection and Preprocessing

As a case study, the actual project data will determine how the study will be conducted. The techno-economic data for 164 power substation projects from SGCC, which have completed settlement from January 2020 to June 2024, were collected for analysis. These projects cover voltage levels of 35 kV, 110 kV, and 220 kV, of which 85 projects applied BIM in the preliminary design stage and construction drawing design stage, and 79 projects did not apply BIM. In fact, in 2018, SGCC put forward the requirement to fully apply 3D design technology in new power transmission and transformation projects of 35 kV and above. Therefore, the number of projects that have not applied BIM in recent years is not large. Considering the number of projects, the type of projects, the voltage levels, the construction time, and the proportion of projects with and without BIM applications, the data collection in this study is adequate and reasonable.
Directly comparing the costs of projects with and without BIM application is an intuitive approach to explore the impact of BIM. However, it is difficult to achieve the desired analytical results with this approach because the number of projects is not large enough and the current benefits of BIM are not significant [48,69], leading to the fact that the impact of BIM is easily masked by the difference in the data itself [63,70]. Considering that the application of BIM will have a direct impact on some cost items, such as causing an increase in the cost of 3D design, and may also have an indirect or potential impact on some cost items, which in turn affects the variance between the estimated project costs and the actual project costs [71], this study used the Cost Variance Percentage Between Settlement and Budget Estimation (CV%) to explore the impact of BIM on project costs, which is defined as follows:
CV % = settlement budget   estimation budget   estimation × 100 %
where the budget estimation is obtained by forecasting and calculating the total investment and its composition of the project based on the preliminary design documents, the budget estimation norms and standards, and the relevant regulations of SGCC, which can reflect the estimated project costs. The settlement is obtained by calculating and assessing the project quantities based on project documents, and calculating and adjusting the contract price, which can reflect the actual project costs. In the budget estimation, the direct impact of BIM is measured by some separate and well-defined cost items (e.g., the cost of 3D design and the cost of digital delivery). These cost items account for a small proportion of the total project costs and have an expected CV% of 0 [72,73]. As for the indirect or potential impact, since the basis for project cost estimation is consistent for projects with or without BIM applications, it cannot be reflected in the budget estimation. If the application of BIM has an indirect or potential impact on project costs, it should be reflected in the settlement so that the CV% of project costs of the two groups should be different, which is the starting point of this study.
The above data can support an analysis based on the CV% of total project costs (TPC-CV%). In order to support a more detailed analysis from the perspective of cost items, among the 164 power substation projects, the Project Settlement and Completion Schedules of 34 projects were collected. Among them, 14 projects did not apply BIM (Nos. 1–14) and 20 projects applied BIM. The Project Settlement and Completion Schedule is an optional form that contains detailed cost items for budget estimation and settlement. Based on the schedules, the CV% of cost items (CI-CV%) of the 34 projects were calculated, and 34 datasets with the structure shown in Table 1 were obtained. Each dataset is actually a sequence with three attributes: serial number, cost item, and value (CI-CV%). The 34 sequences have a similar structure but different lengths. The longest sequence has a length of 91 and the shortest 52.

3.2. Research Methodology

The literature review is instructive for both the identification of influence factors and the design of research methodology. Given that the study is to be conducted based on actual project data with no predetermined conclusion, the study will be a gradual exploration process, so a multi-step methodology was designed to capture the impact of BIM on substation projects and explore its patterns. Figure 1 illustrates the methodology, which consists of the following steps:
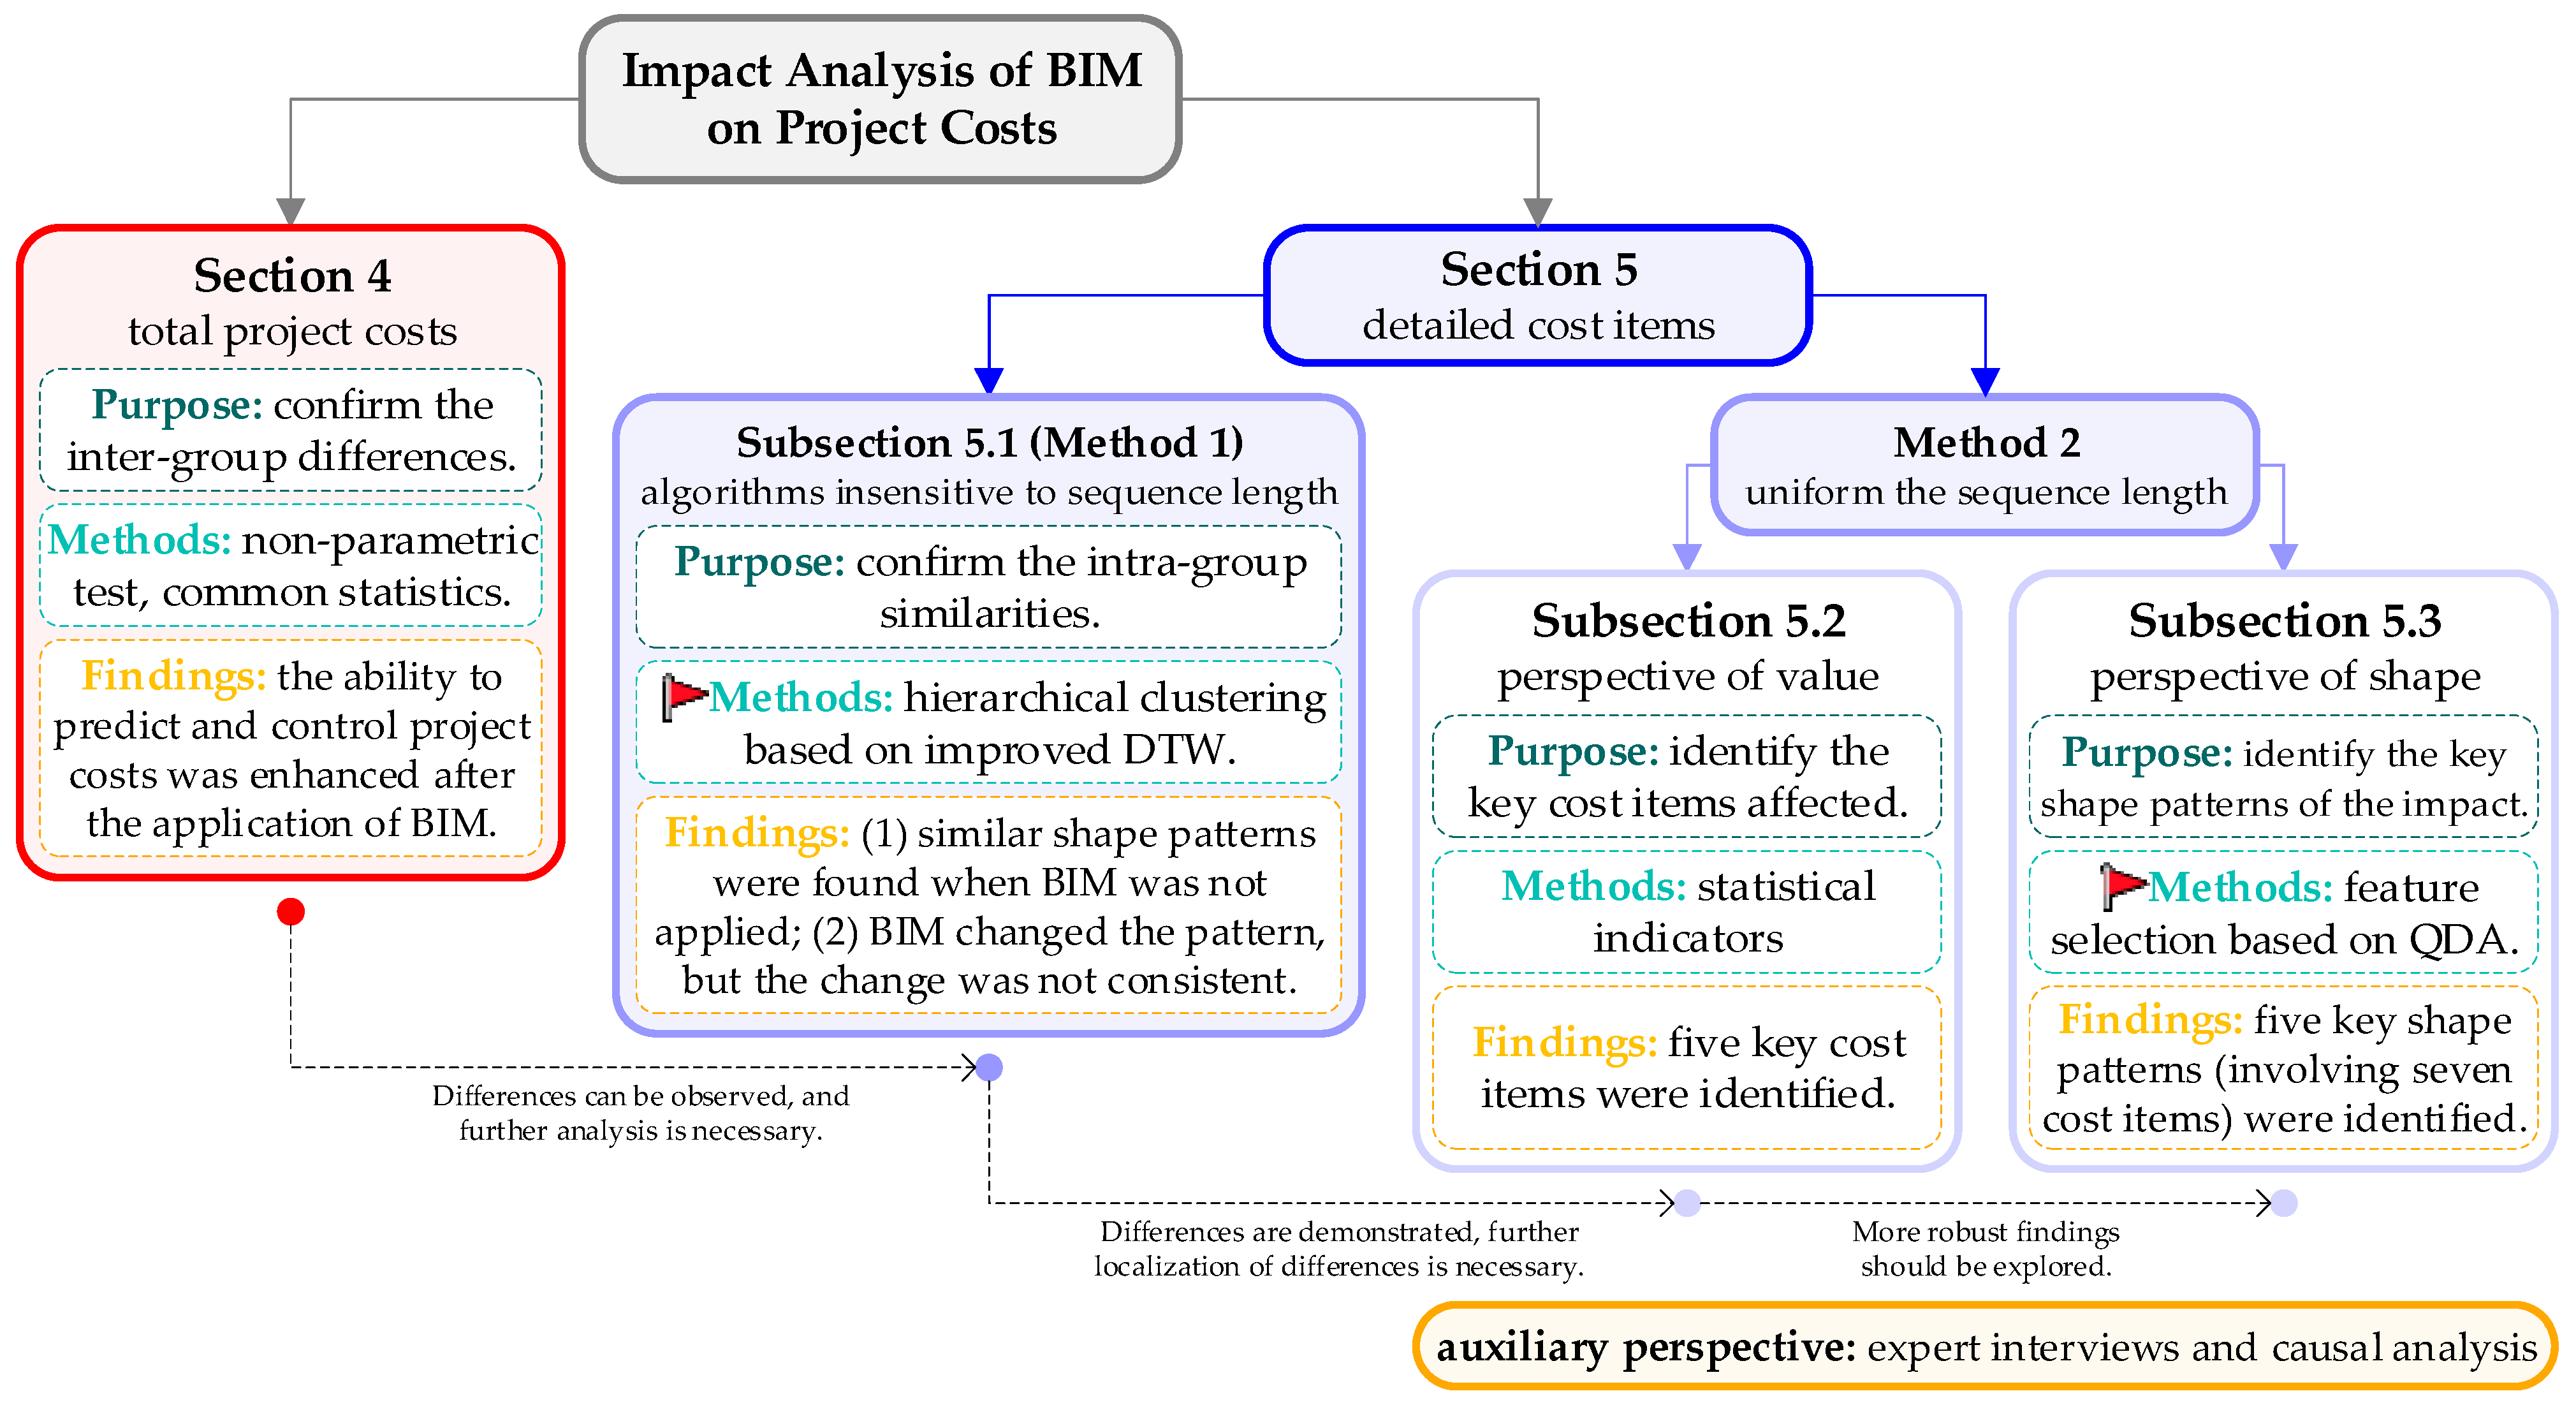
  • Section 4 preliminarily explored whether the impact exists from the perspective of total project costs. For the two groups of projects with and without BIM application, the inter-group differences were explored to reflect the existence of the impact. This process was rough, but the findings could indicate the necessity for further research.
  • Section 5 presented the impact more clearly from the perspective of detailed cost items. Two methods are adopted in this section. One is to design an algorithm that is insensitive to the sequence length, and the other is to unify the sequence length.
    • In Section 5.1, a hierarchical clustering algorithm based on improved DTW was designed to confirm the intra-group similarities. This process led to more detailed and definite findings, but they are not sufficiently interpretable and further research was required to locate the impact in the cost items.
    • In Section 5.2 and Section 5.3, the sequence lengths were unified for further analysis. Section 5.2 designed comparative analysis indicators based on common statistics and identified the key cost items affected in terms of value. This process was simple and effective, but the robustness of the findings was difficult to ensure. Section 5.3 continued the analysis from the perspective of shape. A feature selection algorithm based on QDA was designed to learn a subset with excellent classification performance from hundreds of shape features. The subset of shape features was considered to be the key shape pattern of the impact of BIM. This process led to robust findings, but they are less interpretable. Expert interviews and causal analysis could provide an auxiliary perspective to explain the findings to some extent.
The two methods marked with red flags in Figure 1, which are the core and innovative algorithms of the present study, are introduced as follows.

3.2.1. A Hierarchical Clustering Algorithm Based on Improved DTW

Dynamic Time Warping (DTW) is a powerful algorithm for time series analysis. It can align sequences that may be out of sync, making it particularly useful in handling sequences of different lengths [74]. Based on the data structure shown in Table 1, and considering that the serial number and cost item contain explicit alignment information, the DTW algorithm was improved to enhance its sequence alignment capability [75,76,77]. The idea of algorithm improvement is shown in Figure 2. The aligned and unaligned elements in the sequence are distinguished by the serial number and cost item. For aligned elements, the distance is defined as 0; for unaligned elements, the distance is defined as the absolute difference between their values. Therefore, a cost matrix is generated to find the optimal warping path. Finally, the improved DTW distance along the path is recalculated based on the value. The mathematical language is described as follows.
Given two sequences A = a 1 , a 2 , , a n and B = b 1 , b 2 , , b m , where a i = n u m , i t e m , v a l and b j = n u m , i t e m , v a l are elements of the sequences A and B , n u m represents the serial number of the element, i t e m represents the cost item, and v a l represents the value, i.e., CI-CV%.
Step 1: Cost matrix.
Define a cost matrix C of size n × m , where C i j represents the distance to align a i with b j . The distance is calculated as follows:
C i j = distance ( a i , b j ) = 0 , a i . n u m = b j . n u m , a i . i t e m = b j . i t e m , a i . v a l b j . v a l , e l s e .
Step 2: Accumulated cost matrix.
Construct an accumulated cost matrix M , where each element M i j represents the minimum cumulative distance to align the first i elements of A with the first j elements of B .
M i j = C i j + min M i 1 , j , M i , j 1 , M i 1 , j 1
where M i 1 , j corresponds to an insertion, M i , j 1 corresponds to a deletion, and M i 1 , j 1 corresponds to a match.
The boundary conditions are initialized as follows:
M 1 , 1 = C 1 , 1 , M i , 1 = M i 1 , 1 + C i , 1 f o r i = 2 , n , M 1 , j = M 1 , j 1 + C 1 , j f o r j = 2 , m .
Step 3: Optimal warping path.
The optimal warping path P = p 1 , p 2 , p L is a sequence of matrix indices that minimizes the cumulative distance, where p k = ( i k , j k ) . This path is found by backtracking from M n m to M 1 , 1 by following the minimum cost direction at each step.
Step 4: improved DTW distance
The improved DTW distance is recalculated according to the path P as follows:
D T W A , B = p P a p . i . v a l b p . j . v a l
The improved DTW distance can better describe the similarities and differences between sequences.

3.2.2. A Feature Selection Algorithm Based on QDA

Feature selection is to find a set of features that are as few as possible but have excellent classification performance. By observing the process of feature selection, the key features can be identified. Even after data augmentation, the amount of data is not large, so the algorithm design does not need to focus on the complexity and speed, but should focus on improving the effectiveness and robustness of feature selection. To this end, a feature selection algorithm based on QDA is designed as follows.
Step 1: Objective function.
Considering that high-dimensional data have heterogeneous variance-covariance matrices [78], Quadratic Discriminant Analysis (QDA) is adopted as the classification algorithm. QDA is a classical classification algorithm with advantages such as no need to adjust parameters, excellent performance, and more suitable for nonlinear data distributions [79,80].
QDA calculates a quadratic discriminant function:
δ i ( x ) = 1 2 log | Σ i | 1 2 ( x μ i ) T Σ i 1 ( x μ i ) + log p i
where Σ i is the covariance matrix. The unknown values of Σ i , μ i , and p i can be replaced by their sample-based estimates. The classification rule is to find the class i which maximizes the quadratic discriminant function:
G ^ ( x ) = arg max i δ i ( x )
The decision boundaries are quadratic equations in x .
Classification performance is measured using Minimum Classification Error (MCE), which is the number of misclassified observations divided by the number of observations [81,82].
Step 2: Feature selection.
In order to avoid information redundancy caused by the correlation between features, this study used the wrapper approach for feature selection based on the MCE of QDA. The wrapper feature selection approach is widely used and has been proven to have good performance [82,83,84]. The training set is used to select the features and fit the QDA model, with the test set used to evaluate the final performance. Subsets of features were obtained by forward sequential feature selection, with 10-fold cross-validation applied to the training set to evaluate the performance of each candidate feature subset. The algorithm stops when the first local minimum of the cross-validation MCE is found.

4. Results I: The Differences in Total Project Costs

The basic idea of this study is to explore the difference in techno-economic data for power substation projects with and without BIM applications, and clear differences will provide data evidence for the impact of BIM. To this end, the total project costs were analyzed first, followed by the cost items. The total project costs offered a rough perspective, and the related conclusions could provide guidance on whether and how further analysis was required.
Let group A denote the set of projects with BIM applications and group N denote those without BIM applications. First of all, independent samples non-parametric tests were performed on the TPC-CV% for the two groups to test whether their distributions are the same so as to directly determine whether BIM has an impact on TPC-CV%. The test results are shown in Table 2. As can be seen from Table 2, common tests did not find significant differences between the two groups, so it can be assumed that the application of BIM has no impact on TPC-CV%. This conclusion is consistent with the viewpoint of Lidelöw et al. [48] in the literature review and the conjecture of this study that the impact of BIM is not significant and is difficult to capture by TPC-CV%. Therefore, more detailed analyses are required to provide evidence for the impact of BIM.
However, it is noted that the significance level (Sig.) of the Kolmogorov–Smirnov test is patently smaller than that of the Mann–Whitney U Test, indicating that the shape of the distribution has a great impact on the test results. Further, differences in the shape of the frequency distribution histograms of the two groups can be observed (as shown in Figure 3), and they do not exactly show a bell shape. Therefore, it is necessary to test the normality of the TPC-CV% for the two groups. The results of one-sample Kolmogorov–Smirnov tests are shown in Table 3, and it can be assumed that the TPC-CV% of group A does not have a normal, uniform, or exponential distribution, whereas that of group N has a normal distribution.
Considering the decisions in Table 3, the distribution of TPC-CV% of group A was fitted using a t location-scale distribution, and the distribution of TPC-CV% of group N was fitted using a normal distribution. The fitting results are shown in Figure 4, and the goodness of fit is fairly good. By comparing the probability density curves of the two groups, it can be seen that the curve of group A is steeper, which indicates that the distribution of TPC-CV% of group A is more concentrated.
The conclusions drawn from the common statistics shown in Table 4 are consistent with the above conclusions. The mean, standard deviation, and median of the two groups are approximately equal; the skewness of group A is approximately 0, which implies that group N has a more pronounced left-skewed distribution than group A; the kurtosis of group N is approximately 0, which implies that the distribution of group N is approximately normal, while the distribution of group A is more concentrated; the interquartile range (IQR) of group A is less than that of group B, which also implies that the distribution of group A is more concentrated.
In conclusion, no significant impact of BIM on the TPC-CV% level was observed. However, the application of BIM resulted in a more concentrated distribution of TPC-CV% (precision improved, accuracy unchanged), which implies that the ability to predict and control project costs is enhanced after the application of BIM.

5. Results II: The Differences in Cost Items

The analysis of TPC-CV% is rough, and a more detailed analysis of the differences in CI-CV% is required to obtain stronger data evidence of the impact of BIM. The data collection and preprocessing of CI-CV% have been introduced in Section 3.1. The 34 sequences with similar structures but different lengths are the dataset for analysis in this section. To deal with such data, one method is to adopt an algorithm that is insensitive to sequence length, and the other method is to remove inconsistent cost items and unify the sequence length. These two methods are respectively adopted below to analyze the differences in cost items between the two groups of projects.

5.1. Confirming the Intra-Group Similarities and the Inter-Group Differences

According to the first method, the hierarchical clustering algorithm based on improved DTW, which has been introduced in Section 3.2.1, was adopted to measure the similarities and differences between sequences. Based on the improved DTW distance, hierarchical clustering was performed on the 34 sequences. By observing the process of hierarchical clustering and judging whether the two groups of projects are correctly distinguished, the intra-group similarities and inter-group differences of CI-CV% can be identified. The hierarchical clustering process is shown in Figure 5.
As can be seen from Figure 5, the following is true:
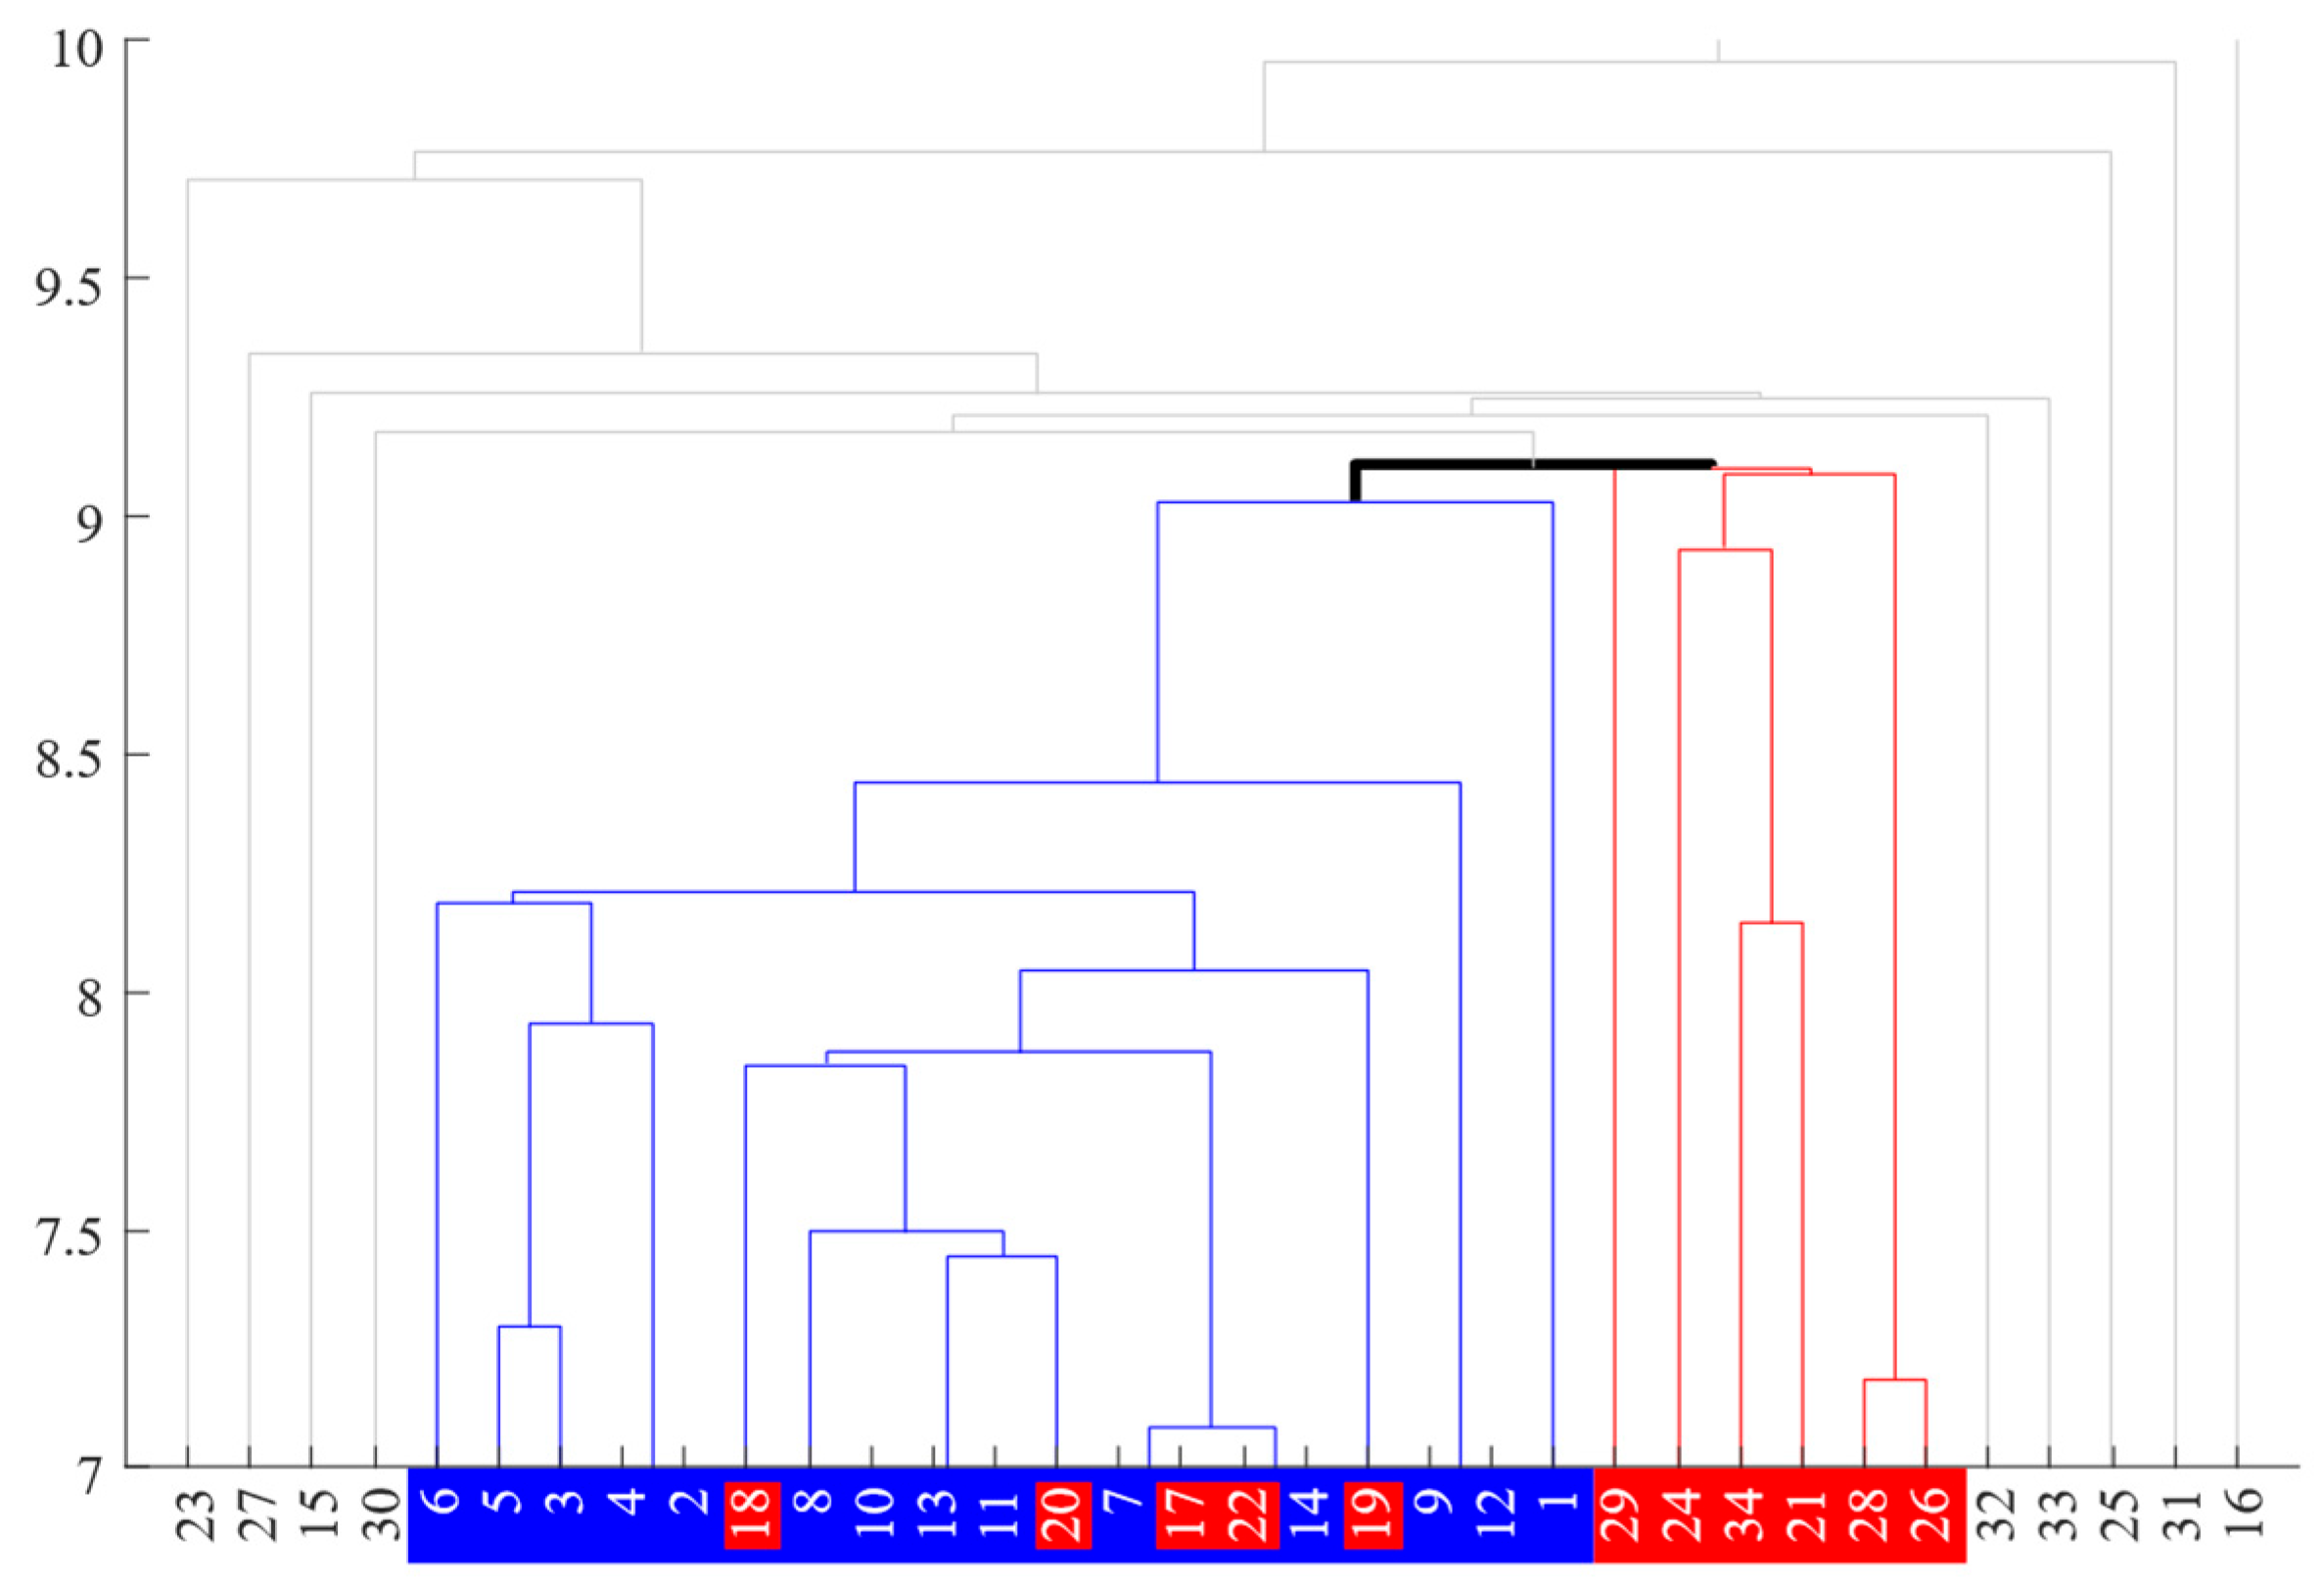
  • The first 24 clustering steps organize 25 projects into two main clusters. The clustering steps are respectively plotted as blue and red thin lines in Figure 5.
  • Among them, the first cluster includes projects numbered 1, 2, 3, 4, 5, 6, 7, 8, 9, 10, 11, 12, 13, 14, 17, 18, 19, 20, and 22, all of which are marked with blue shading in Figure 4. The 14 projects without BIM applications are exactly correctly grouped into this cluster, meaning that the improved DTW distances of CI-CV% of these projects are close, i.e., they have similar shape patterns. Five projects with BIM applications are incorrectly grouped into this cluster and are highlighted in red.
  • The second cluster includes projects numbered 21, 24, 26, 28, 29, and 34. These projects applied BIM and are correctly grouped into one cluster. It can be assumed that these projects represent the typical shape pattern of CI-CV% of projects with BIM applications.
  • The 25th clustering step (plotted as a black thick line in Figure 5) organizes the above two clusters into one large cluster, and the subsequent steps organize the remaining projects (projects numbered 15, 16, 23, 25, 27, 30, 31, 32, and 33) into this large cluster one by one. This indicates that the improved DTW distance of CI-CV% between the remaining projects and the above two clusters is far, and the improved DTW distance between the remaining projects is also far.
  • The clustering results of the projects with BIM applications show that:
    • Most of them are not organized into the first cluster, indicating that the application of BIM changes the similar shape pattern of CI-CV% of projects without BIM applications, thus distinguishing projects with BIM applications from those in the first cluster.
    • A few of them are organized into the second cluster, while most of them are not well organized into a particular cluster, indicating that although the application of BIM changed the similar shape pattern of CI-CV%, this change is not consistent.
In order to further explore the similar shape pattern and the inconsistent changes caused by BIM, the CI-CV% was further analyzed below to identify the impact of BIM from both value and shape perspectives.

5.2. Identifying the Key Cost Items Affected

According to the second method, the 34 sequences were processed. Cost items directly affected by BIM, such as the cost of 3D design and the cost of digital delivery, were excluded; cost items with poor data quality (with a large number of missing values or constant values) were excluded; and common cost items were selected to obtain a unified structure for Project Settlement and Completion Schedules, as shown in Table 5. CI-CV% of the 41 cost items were calculated to obtain 34 sequences of consistent length.
The comparative analysis indicators based on four common statistics, i.e., mean, standard deviation, skewness, and kurtosis, were designed as Formula (8) to analyze the differences in CI-CV% from the perspective of values and to identify the key cost items affected.
a v g _ i n d i = i t i A ¯ i t i N ¯ i t i ¯ ,   s t d _ i n d i = SD i t i A SD i t i N i t i ¯ k u r t _ i n d i = Kurt i t i A Kurt i t i N i t i ¯ ,   s k e w _ i n d i = Skew i t i A Skew i t i N i t i ¯
where iti is the CI-CV% of the cost item numbered i (1 ≤ I ≤ 41). The indicators of CI-CV% for the 41 cost items were calculated according to Formula (6), and the results are shown in Figure 6.
The larger the value of the indicator, the greater the difference in CI-CV% between the two groups, and the more likely it is to be a key cost item affected by BIM. According to the peaks of each subgraph in Figure 6, five key cost items affected by BIM were identified, i.e., it2 (the cost of installation work), it4 (the cost of distribution equipment), it8 (the cost of piping and earthing system), it17 (the cost of construction work), and it35 (the engineering construction test fee). Violin plots of CI-CV% for these cost items are shown in Figure 7 to provide a visual view of the differences between the two groups.
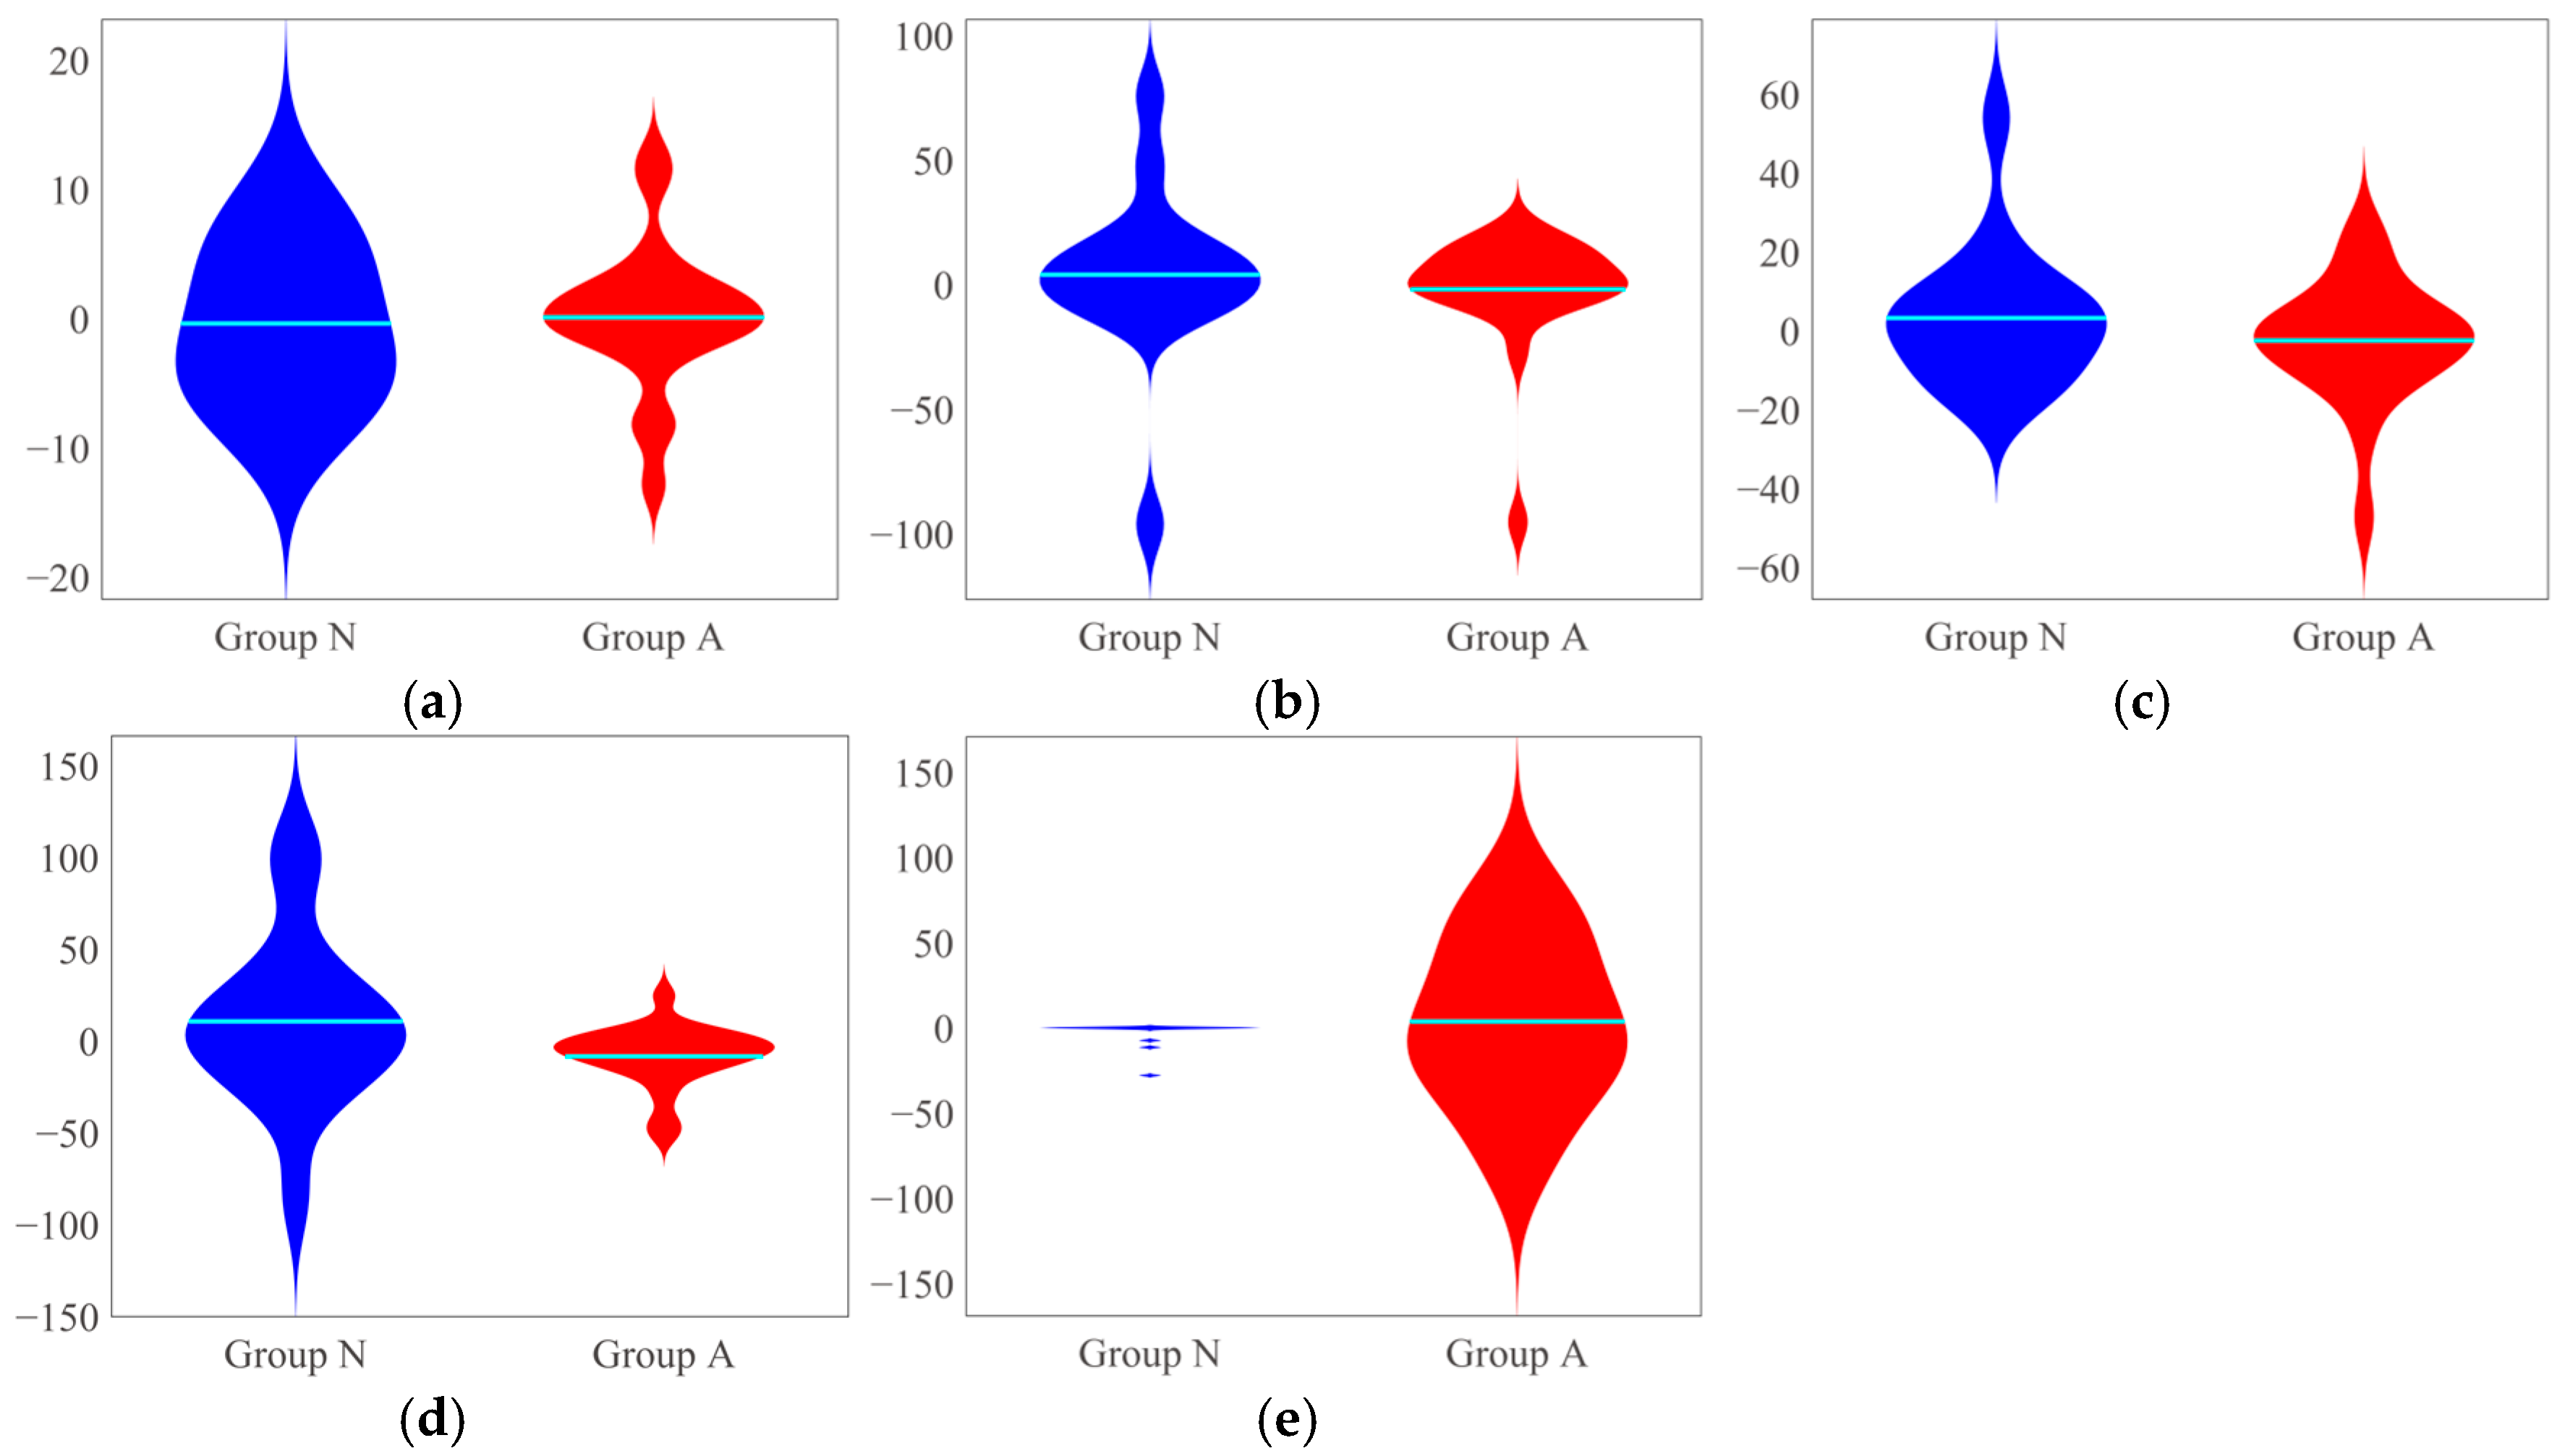
  • The shapes of the violin plots of the two groups are significantly different.
  • For all cost items except it35, the violins of group A are smaller and lower than those of group N. This difference is especially pronounced in the upper half of the violins, i.e., the tails where the CI-CV% is greater than 0. This result is consistent with the conclusion in Section 2.2 that the application of BIM resulted in a more concentrated distribution of CI-CV%, which implies that the ability to predict and control cost items is enhanced.
  • The application of BIM leads to a larger violin in it35. To explain this anomaly, further research is needed.
The comparative analysis based on common statistics is simple and effective, and some clear and easy-to-understand preliminary conclusions are obtained. However, the causal relationship between the key cost items and the application of BIM needs to be further explored in the context of actual projects. Through interviews with five project managers, it was concluded that at this stage, the application of BIM facilitates the lean management of installation and construction works, which are manifested as smaller and lower violins; it also brings some unexpected expenditure on the engineering construction test fee, manifested as a bigger violin and meaning that this cost item is out of control to a certain extent. The opinions of the five project managers are consistent with the conclusions reflected in Figure 7. When BIM is applied in power substation projects, these identified key cost items should be controlled with a focus. However, due to the small number of projects, the reliability of the conclusions needs further discussion: could the same conclusions be drawn with a larger sample size?

5.3. Identifying the Key Shape Patterns of the Impact

Compared to general statistical tests, the sample size of this study is not large, so it is difficult to obtain reliable conclusions if the analysis is conducted only from the perspective of values. To this end, this study drew on the research ideas of Liao et al. [85,86] and used the derivative or the difference to describe the shape of sequences, thus continuing to analyze the differences of CI-CV% between the two groups of projects from the perspective of shape. Considering that the cost items are not completely independent and unrelated, i.e., the Project Settlement and Completion Schedules contain a lot of information about the correlation between cost items, it is meaningful to analyze the shape pattern and can enhance the reliability and stability of the conclusions.

5.3.1. Data Augmentation

The feature selection algorithm based on QDA, which was introduced in Section 3.2.2, was adopted to identify the key shape patterns of the impact. As a machine learning algorithm, it requires sufficient data to ensure the effectiveness. Therefore, data augmentation is needed first. In order to avoid excessive distortion of the sequence shape, the crossover technique was used to generate new samples, and Gaussian noise was added to prevent overfitting. Note that the 22nd cost item, i.e., subtotal, divides the sequence into two relatively independent parts, and these two parts of the samples in the same group can be cross-combined to obtain 224 samples without BIM applications and 400 samples with BIM applications. Among them, two projects without BIM applications were not used in the previous analysis due to poor data quality. But their first 22 cost items have sufficiently good data quality to participate in cross-combination to generate new samples. Therefore, the expanded sample without BIM applications has a size of 16 × 14 = 224. Next, the differences at lag 1–21 of CI-CV% of the first 22 cost items and the differences at lag 1–18 of CI-CV% of the last 19 cost items for the 624 samples were calculated to obtain 402 shape features for each sequence.

5.3.2. Result Analysis

The method of generating shape features indicates that there is a certain correlation between the features. For example, the linear correlation coefficients between the top five shape features that achieve the lowest MCE are shown in Figure 8 with a maximum of |−0.53|. The correlation between the features leads to information redundancy. Therefore, the improved feature selection algorithm is necessary.
Ten-fold CV MCE was plotted in Figure 9. By observing the course of MCE, the key shape patterns can be identified. In addition, the resubstitution MCE on the training set, i.e., without cross-validation during feature selection, is also plotted in Figure 9 to provide an auxiliary observation.
As can be seen from Figure 9, the following is true:
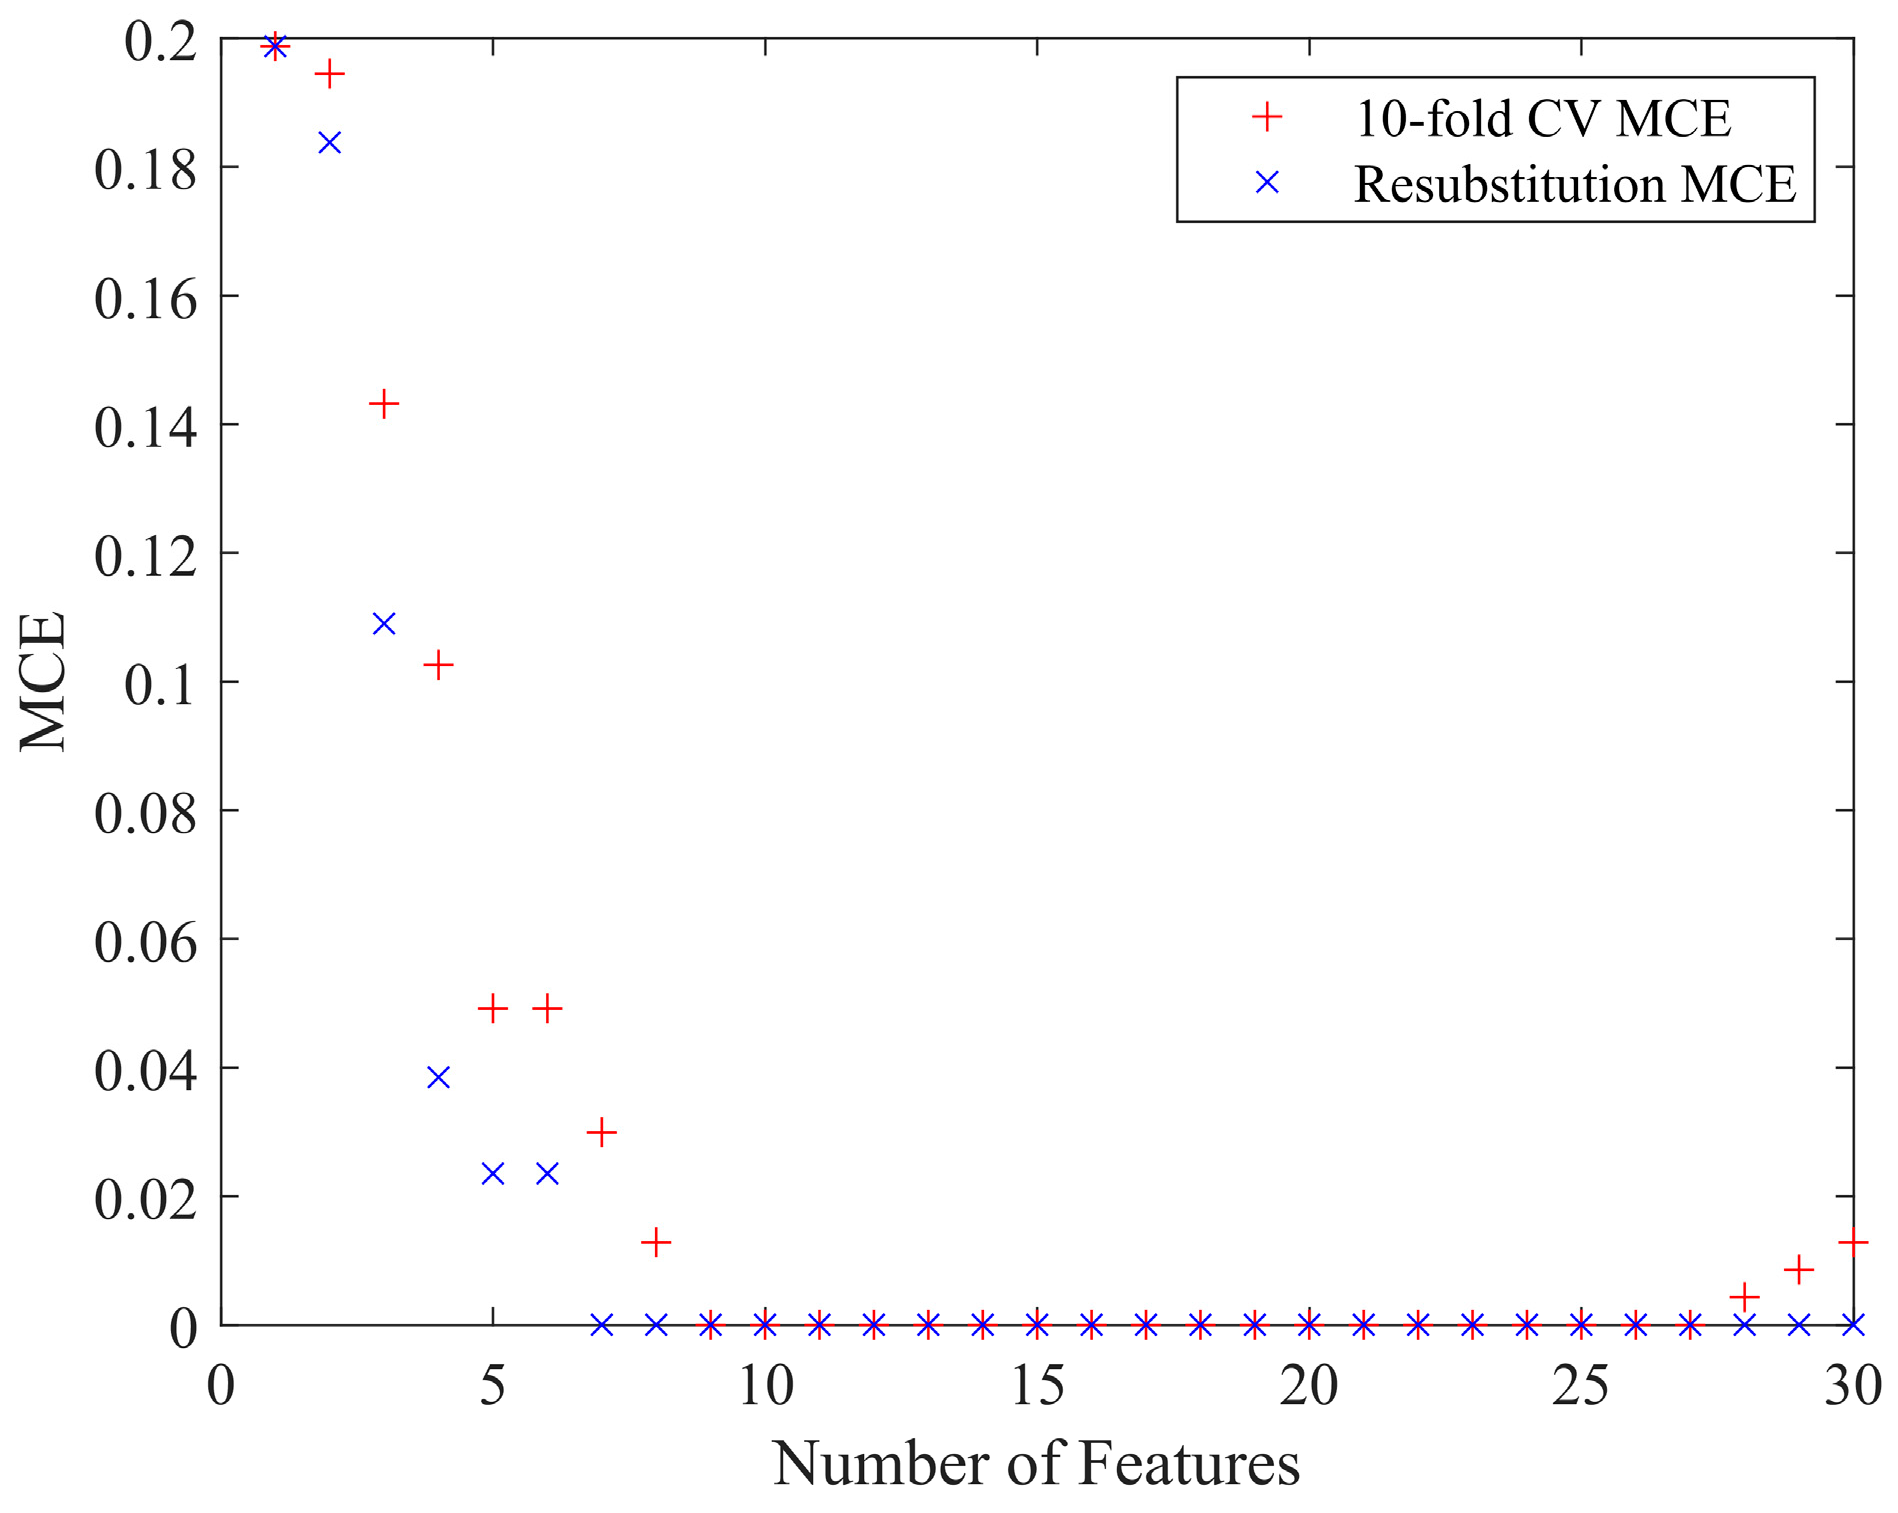
  • The overall trend of 10-fold CV MCE and resubstitution MCE is the same, indicating that the QDA model has good classification performance. The resubstitution MCE is more optimistic than the 10-fold CV MCE. Also, the curve of 10-fold CV MCE goes up when more than 27 features are used, which means overfitting may occur there. In fact, the two curves stay flat over the range from nine to 27 features. Therefore, it is reasonable to consider the first nine features.
  • When one shape feature is used for classification, the MCE is 0.2, which means poor classification performance. The performance is acceptable relative to the insignificant application effectiveness of BIM. However, due to the small sample size, it is difficult to guarantee the generalization ability of the classifier and the representativeness of MCE.
  • When the second shape feature is introduced, the improvement in MCE is not significant. When the third, fourth, and fifth shape features are introduced, the improvement of MCE is significant. These indicate that the classifier constructed with these five shape features could effectively improve the classification performance and expose the differences between the two groups of projects more significantly. Therefore, these five shape features are considered as the key shape patterns of the impact of BIM. Note that this conclusion is based on the course of MCE rather than the level of MCE.
  • When the sixth shape feature is introduced, the improvement of MCE is not significant. When the seventh shape feature is introduced, the MCE further decreases, with the resubstitution MCE decreasing to 0. When the eighth and ninth shape features are introduced, the 10-fold CV MCE also decreases to 0. Generally, according to the course of 10-fold CV MCE, it is considered that using nine shape features (as shown in Table 6) to construct a classifier will achieve better results. However, the resubstitution MCE decreased to 0 before the 10-fold CV MCE at seven features, indicating that the classification performance at this point has been dramatically affected by the sample size, i.e., the particularity of a few samples may be the main reason for the further improvement of MCE. Therefore, the seventh to ninth shape features were not considered the key shape patterns. Moreover, the sixth shape feature did not improve the MCE significantly and was not considered a key shape pattern.
Based on the above observations of the course of MCE, this study identifies five shape patterns of the impact of BIM. These five shape patterns involve seven cost items and are visualized in Figure 10.
In Figure 10, feature 249 is plotted as an example to show the comparison of the two groups. Feature 249 describes the relative changes of CI-CV% between the engineering surveillance costs and the design document review fee. As can be seen in Figure 10, the application of BIM leads to an upward trend in this shape pattern, i.e., an increase in the CI-CV% of the design document review fee compared to that of engineering surveillance costs, or a decrease in the CI-CV% of engineering surveillance costs compared to that of the design document review fee. Similarly, the application of BIM leads to (i) a downward trend in feature 100 (the relative changes of CI-CV% between the pre-project work fee and the equipment survey costs), i.e., a decrease in the CI-CV% of the pre-project work fee compared to that of the equipment survey costs, or an increase in the CI-CV% of the equipment survey costs compared to that of the pre-project work fee; (ii) an upward trend in feature 168 (the relative changes of CI-CV% between the design document review fee and the project construction technical service charge), i.e., an increase in the CI-CV% of the design document review fee compared to that of the project construction technical service charge, or a decrease in the CI-CV% of the project construction technical service charge compared to that of the design document review fee; (iii) a downward trend in feature 61 (the relative changes of CI-CV% between the engineering surveillance costs and the land-use and site-cleaning fee), i.e., a decrease in the CI-CV% of the engineering surveillance costs compared to that of the land-use and site-cleaning fee, or an increase in the CI-CV% of the land-use and site-cleaning fee compared to that of the engineering surveillance costs; and (iv) a downward trend in feature 96 (the relative changes of CI-CV% between the engineering surveillance costs and other costs), i.e., a decrease in the CI-CV% of the engineering surveillance costs compared to that of other costs, or an increase in the CI-CV% of other costs compared to that of the engineering surveillance costs. Note that the above conclusions can only illustrate the differences in the relative changes between the CI-CV% of cost items rather than the differences in the CI-CV%.
Further, it is noted that there are three shape features that are associated with the 26th cost item, i.e., engineering surveillance costs, among the identified five features. As shown in Figure 11, the distribution of these three shape features is plotted in 3D space to provide a rough view of the aggregation of the two groups of projects. As can be seen from Figure 11, in the 3D space, the aggregation of the red samples and the blue samples is obvious, and the two groups can be classified well, whereas they are less well classified in the 2D projected planes. These indicate that the engineering surveillance costs are widely correlated with other cost items, and these related cost items jointly exhibit a shape pattern that can capture the impact of BIM better. Similarly, the 30th cost item, i.e., pre-project work fee, is also widely correlated with other cost items and can capture the impact of BIM. When BIM is applied in power substation projects, these two cost items should be controlled with a focus.
Interviews were conducted with five project managers to understand why engineering surveillance costs and pre-project work fee are widely correlated with other cost items. At present, there is no clear and uniform regulation on how to account for the costs and benefits of BIM, and these costs and benefits are handled flexibly according to the actual situation. For example, if there is a balance in a cost item, it may be used for BIM-related business, which further conceals the impact of BIM. The analysis of the shape patterns of CI-CV% exposed this phenomenon to a certain extent.

5.3.3. Sensitivity Analysis

Whether the results of machine learning are reproducible or not is an important issue facing related research. To this end, 10 sensitivity tests were conducted in this study, and the results of feature selection are shown in Table 7. As can be seen from Table 7, the five key shape patterns selected in this study appeared with high frequency in the 10 tests, indicating that the results of this study can be replicated at a high level and that the conclusions are robust.

6. Discussion and Conclusions

Although it is difficult to directly draw conclusions about the impact of BIM on project costs in the form of indicators, this study captured clear data evidence of the existence of such an impact and explored the patterns of the impact. Total project cost data of 164 power substation projects and techno-economic statements of 34 power substation projects from SGCC were collected for research. Such an abundance of actual project data is rare in relevant studies. Algorithms such as hierarchical clustering based on improved DTW and feature selection based on QDA were designed to capture data evidence from multiple perspectives. The main conclusions are as follows:
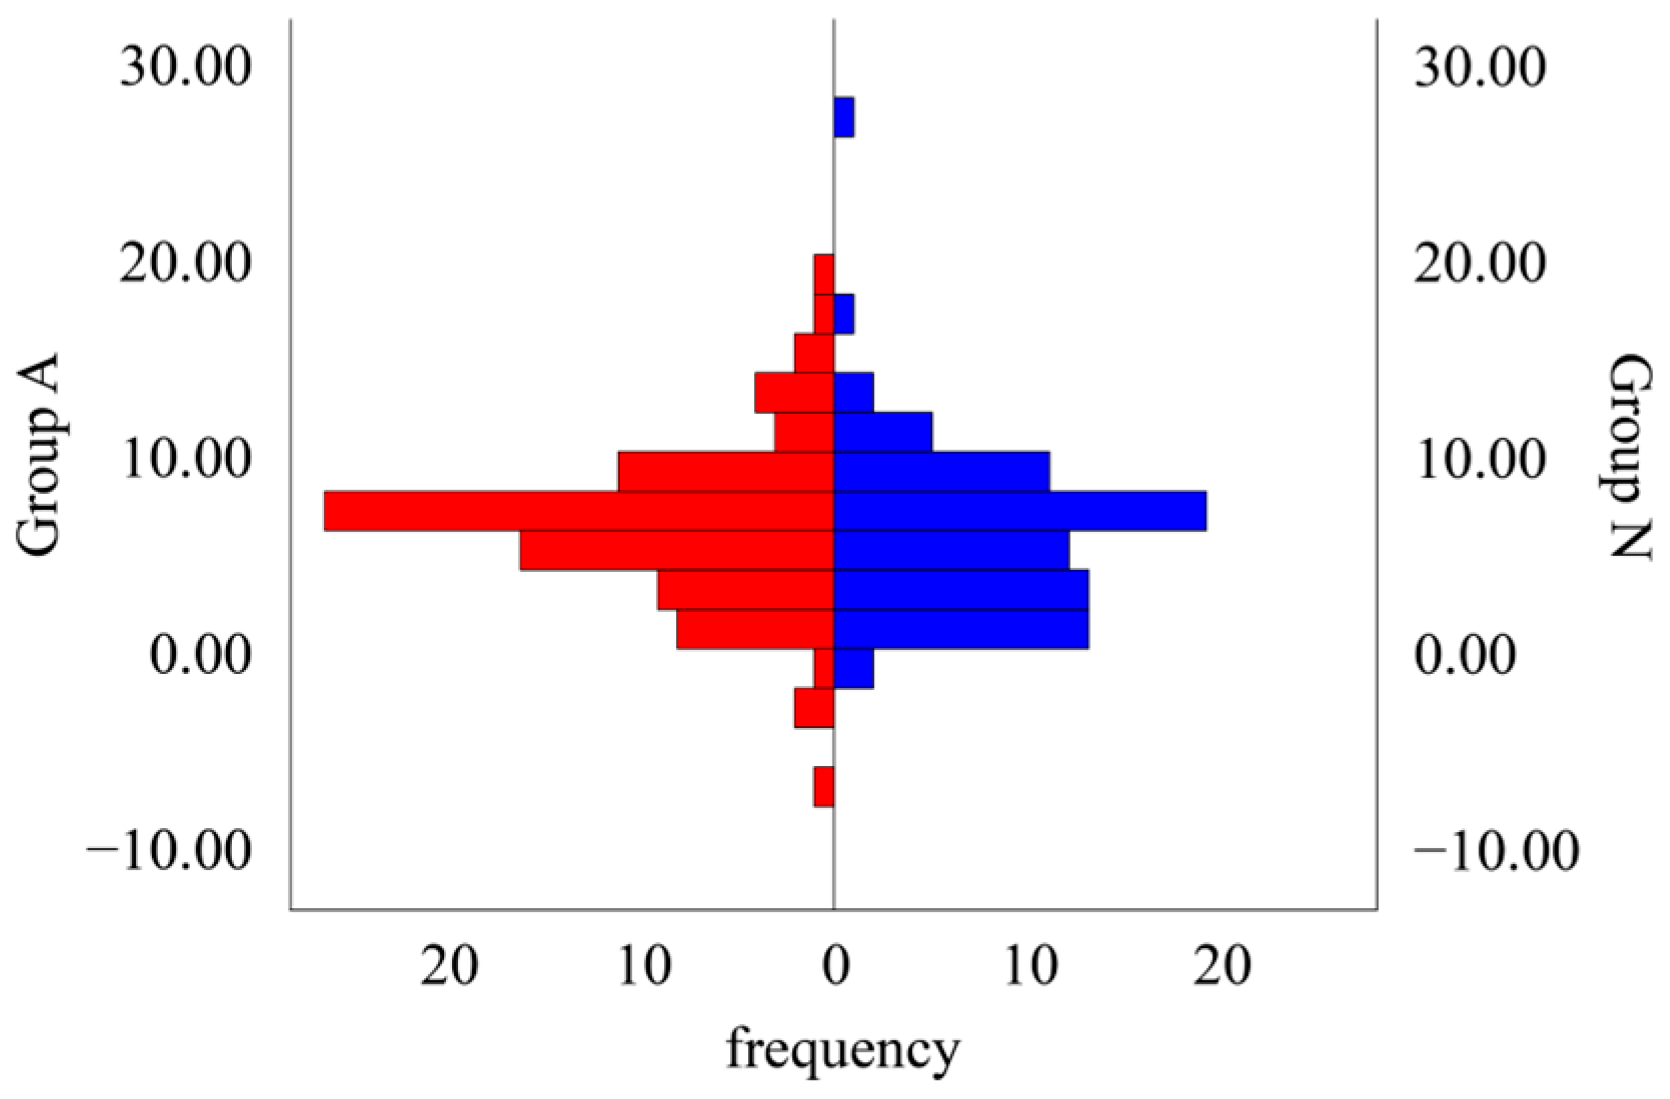
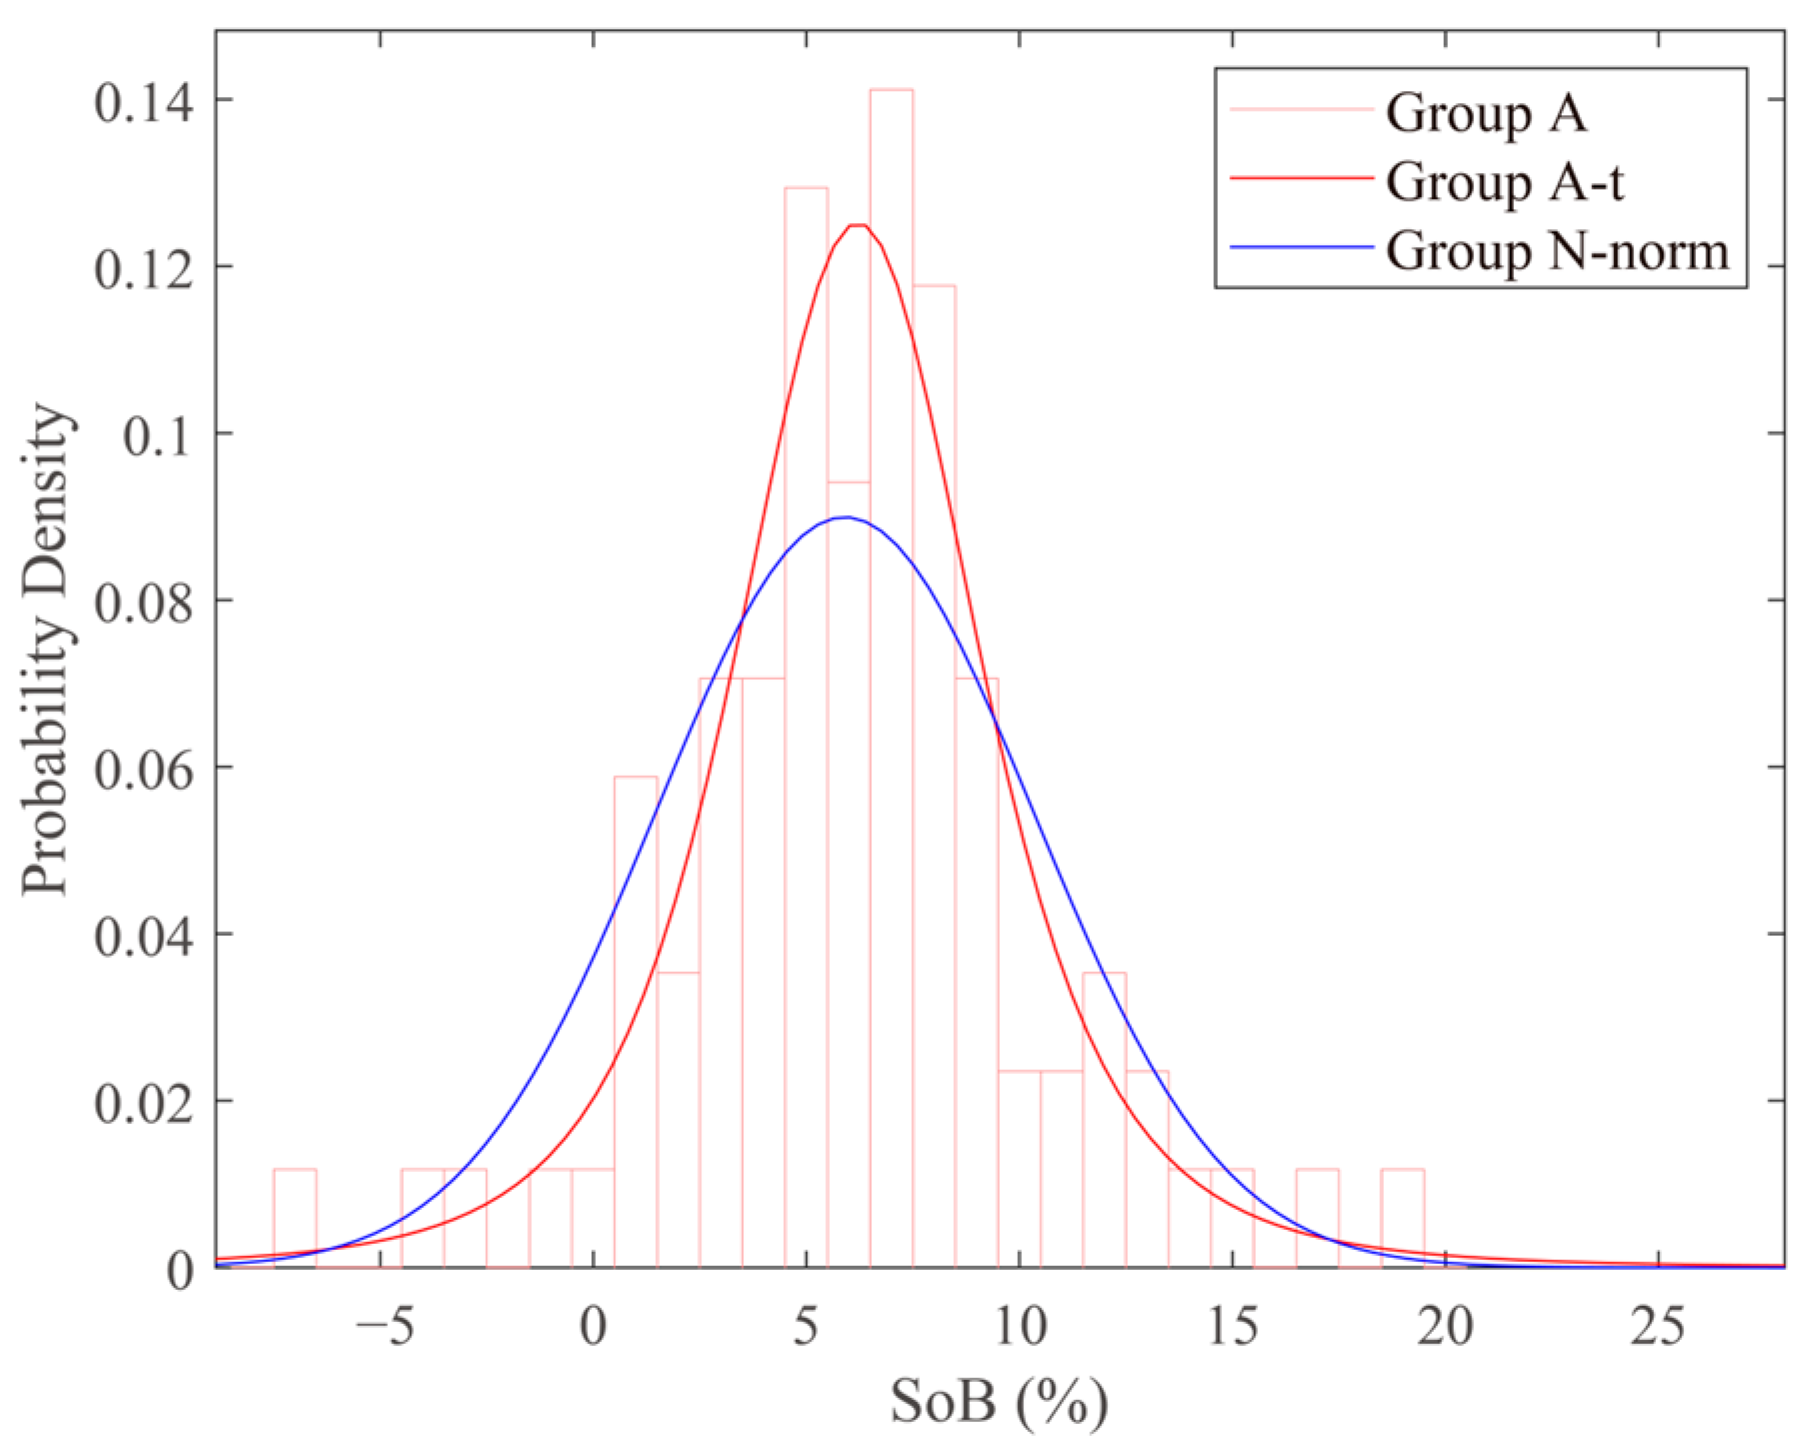
  • From the perspective of total project costs, no significant impact of BIM on TPC-CV% was observed, but the distribution of TPC-CV% was observed to be more concentrated after the application of BIM, indicating that the ability to predict and control project costs is enhanced as a consequence of the application of BIM.
  • From the perspective of cost items, it was observed that the CI-CV% of projects without BIM applications had a similar shape pattern, and the application of BIM changed this pattern, but the change was not consistent.
  • Five cost items, i.e., the cost of installation work, the cost of distribution equipment, the cost of piping and earthing system, the cost of construction work of auxiliary production engineering, and the engineering construction test fee, were identified as the key cost items affected by BIM. These five cost items should be controlled with a focus during the application of BIM. When these cost items are found to deviate significantly from the budget estimation, the project manager should promptly check the rationality of the costs and supervise the application of BIM. However, due to the small number of projects, the reliability of this conclusion needs further discussion.
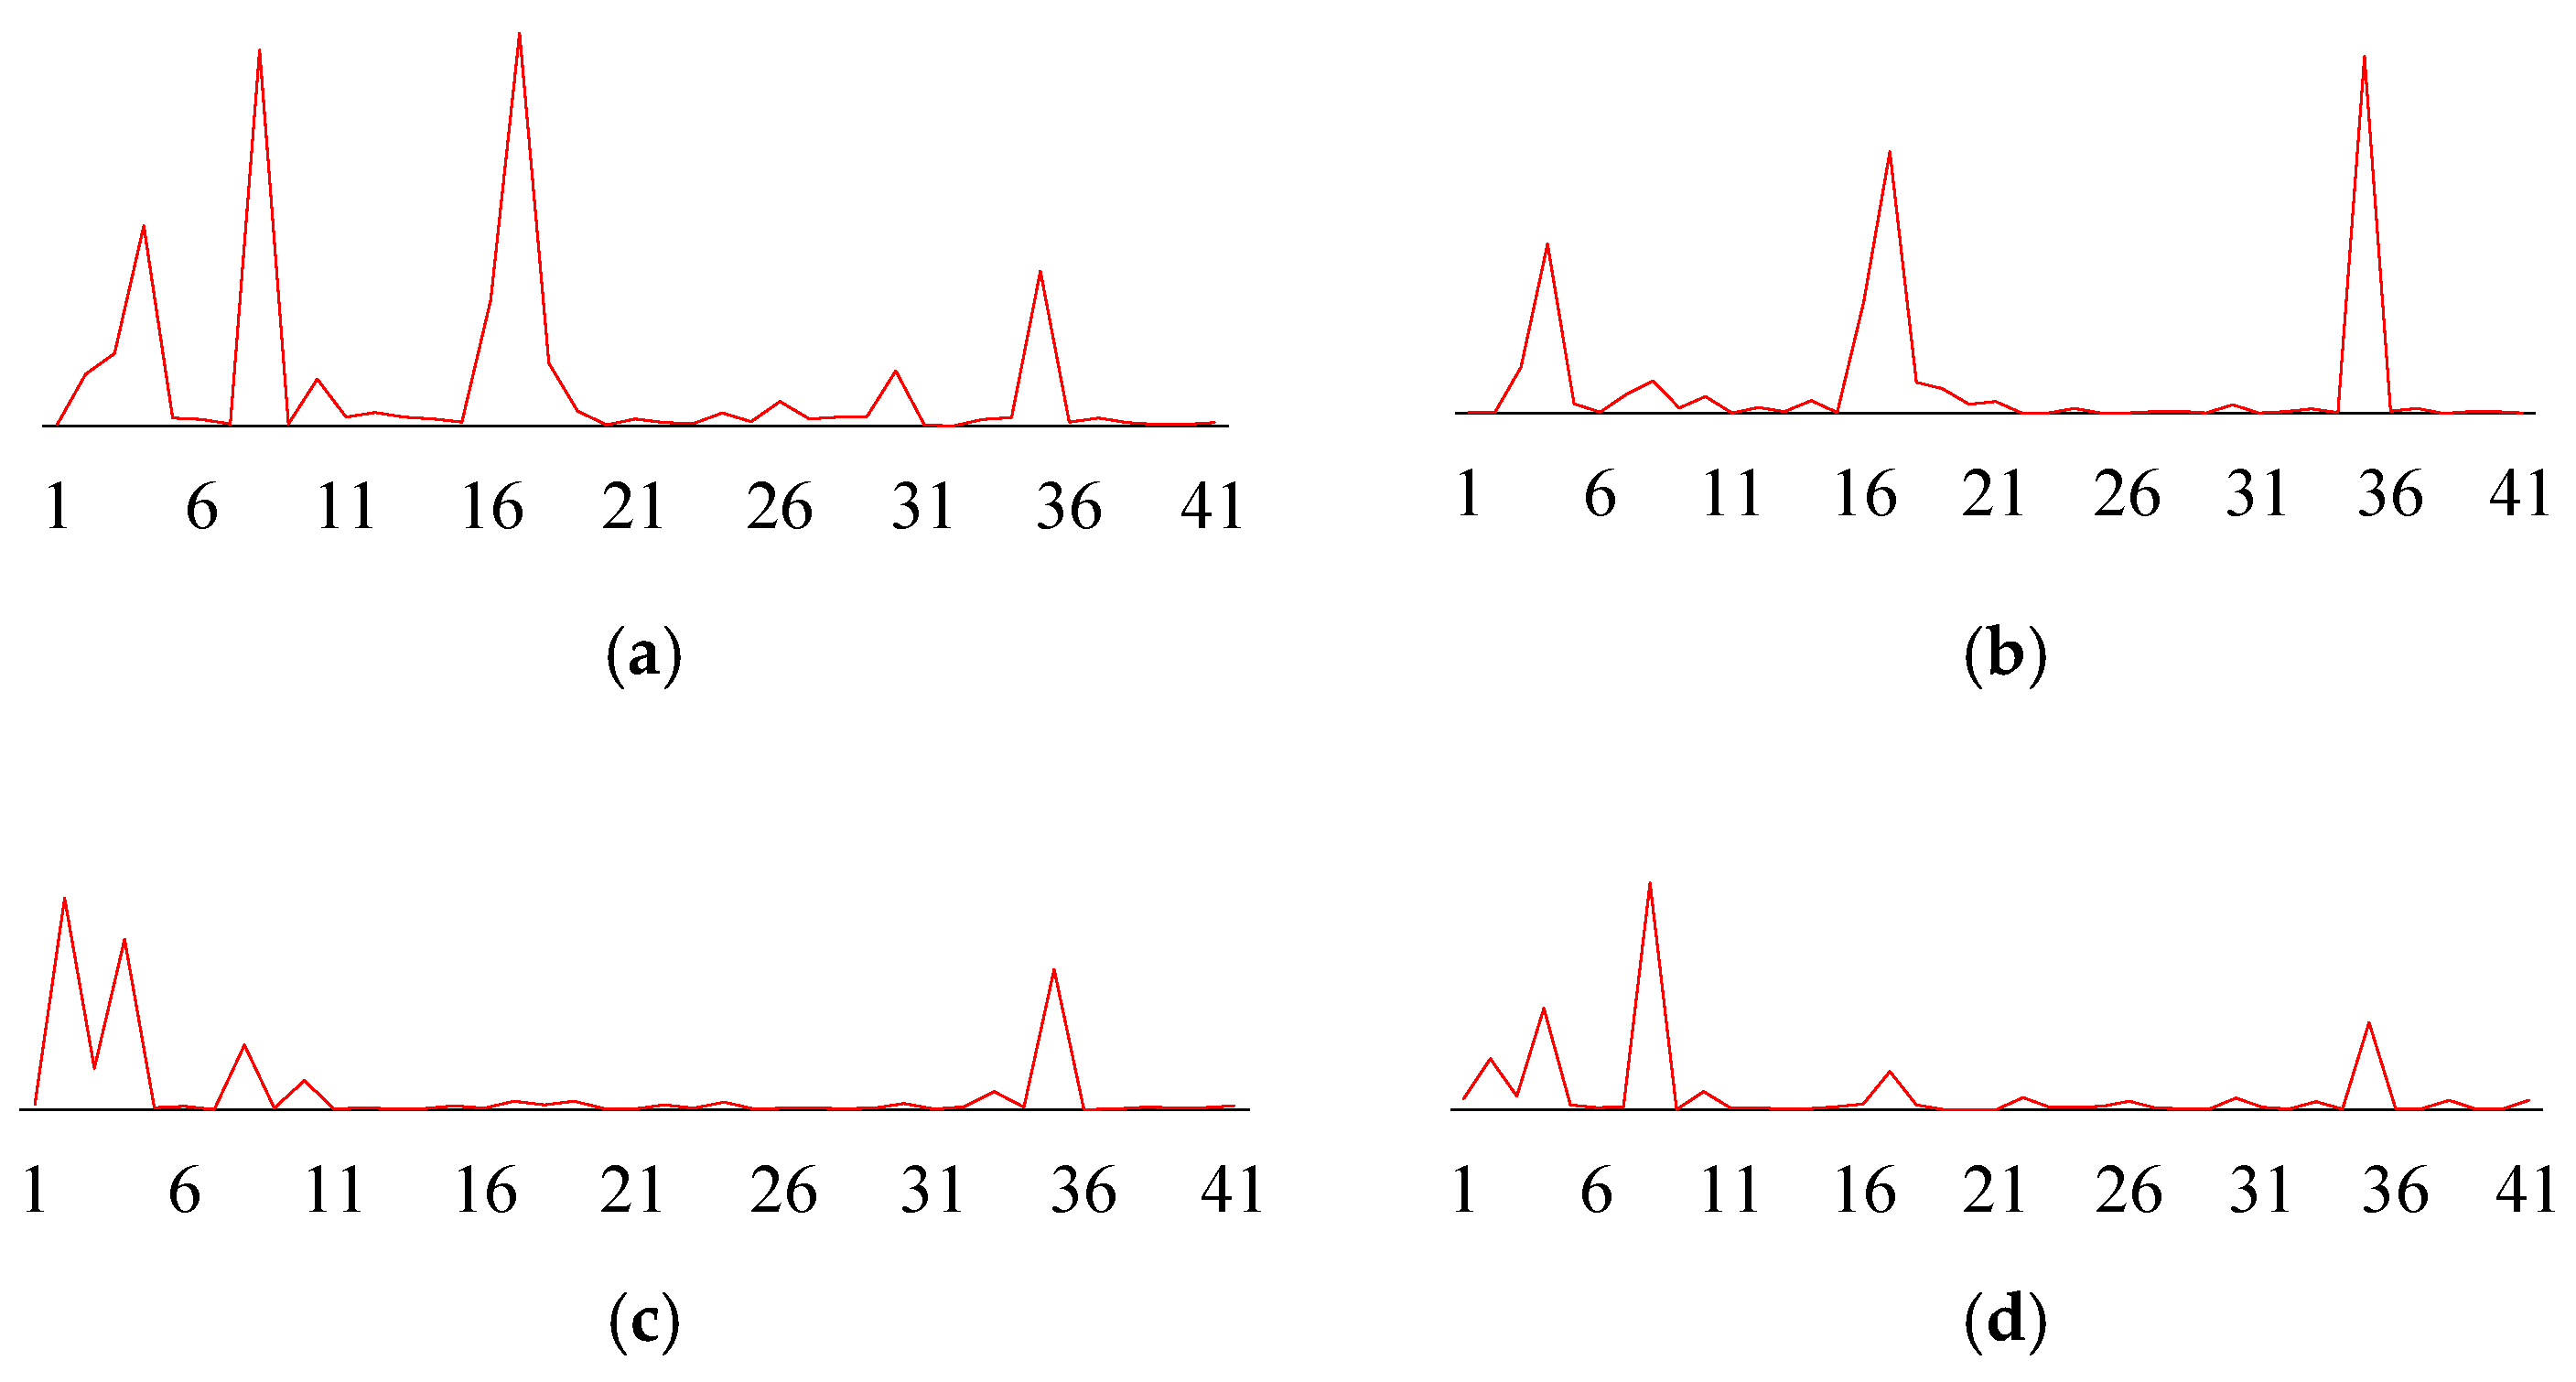
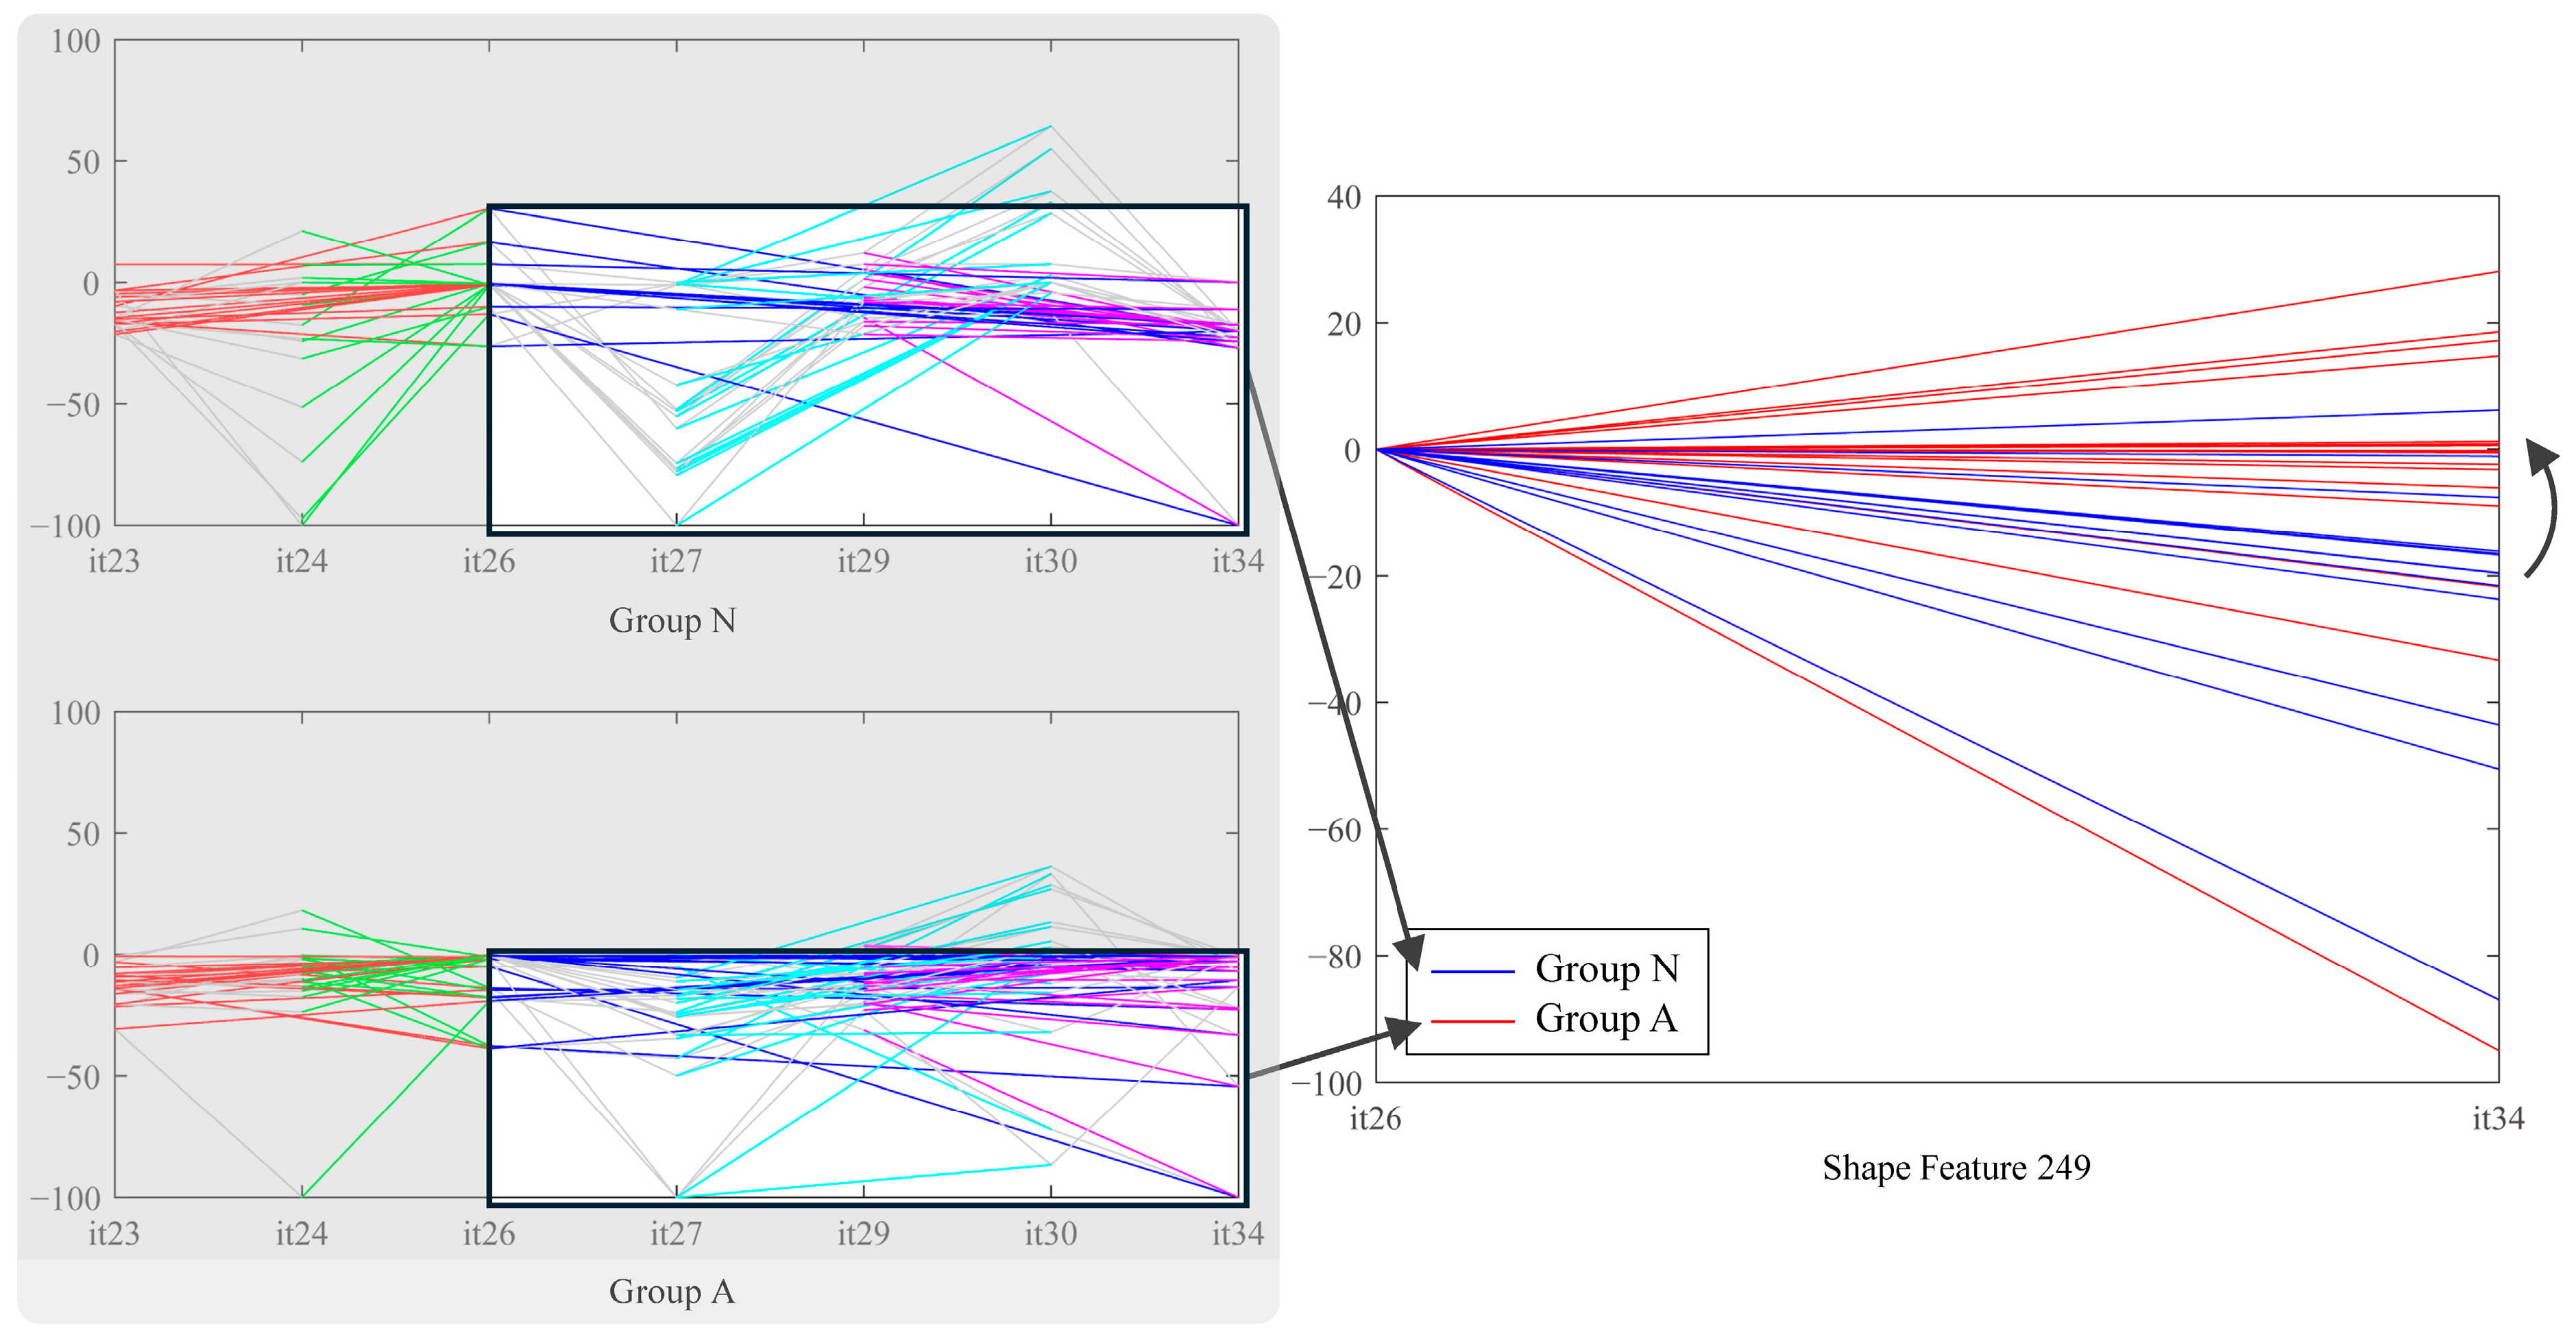
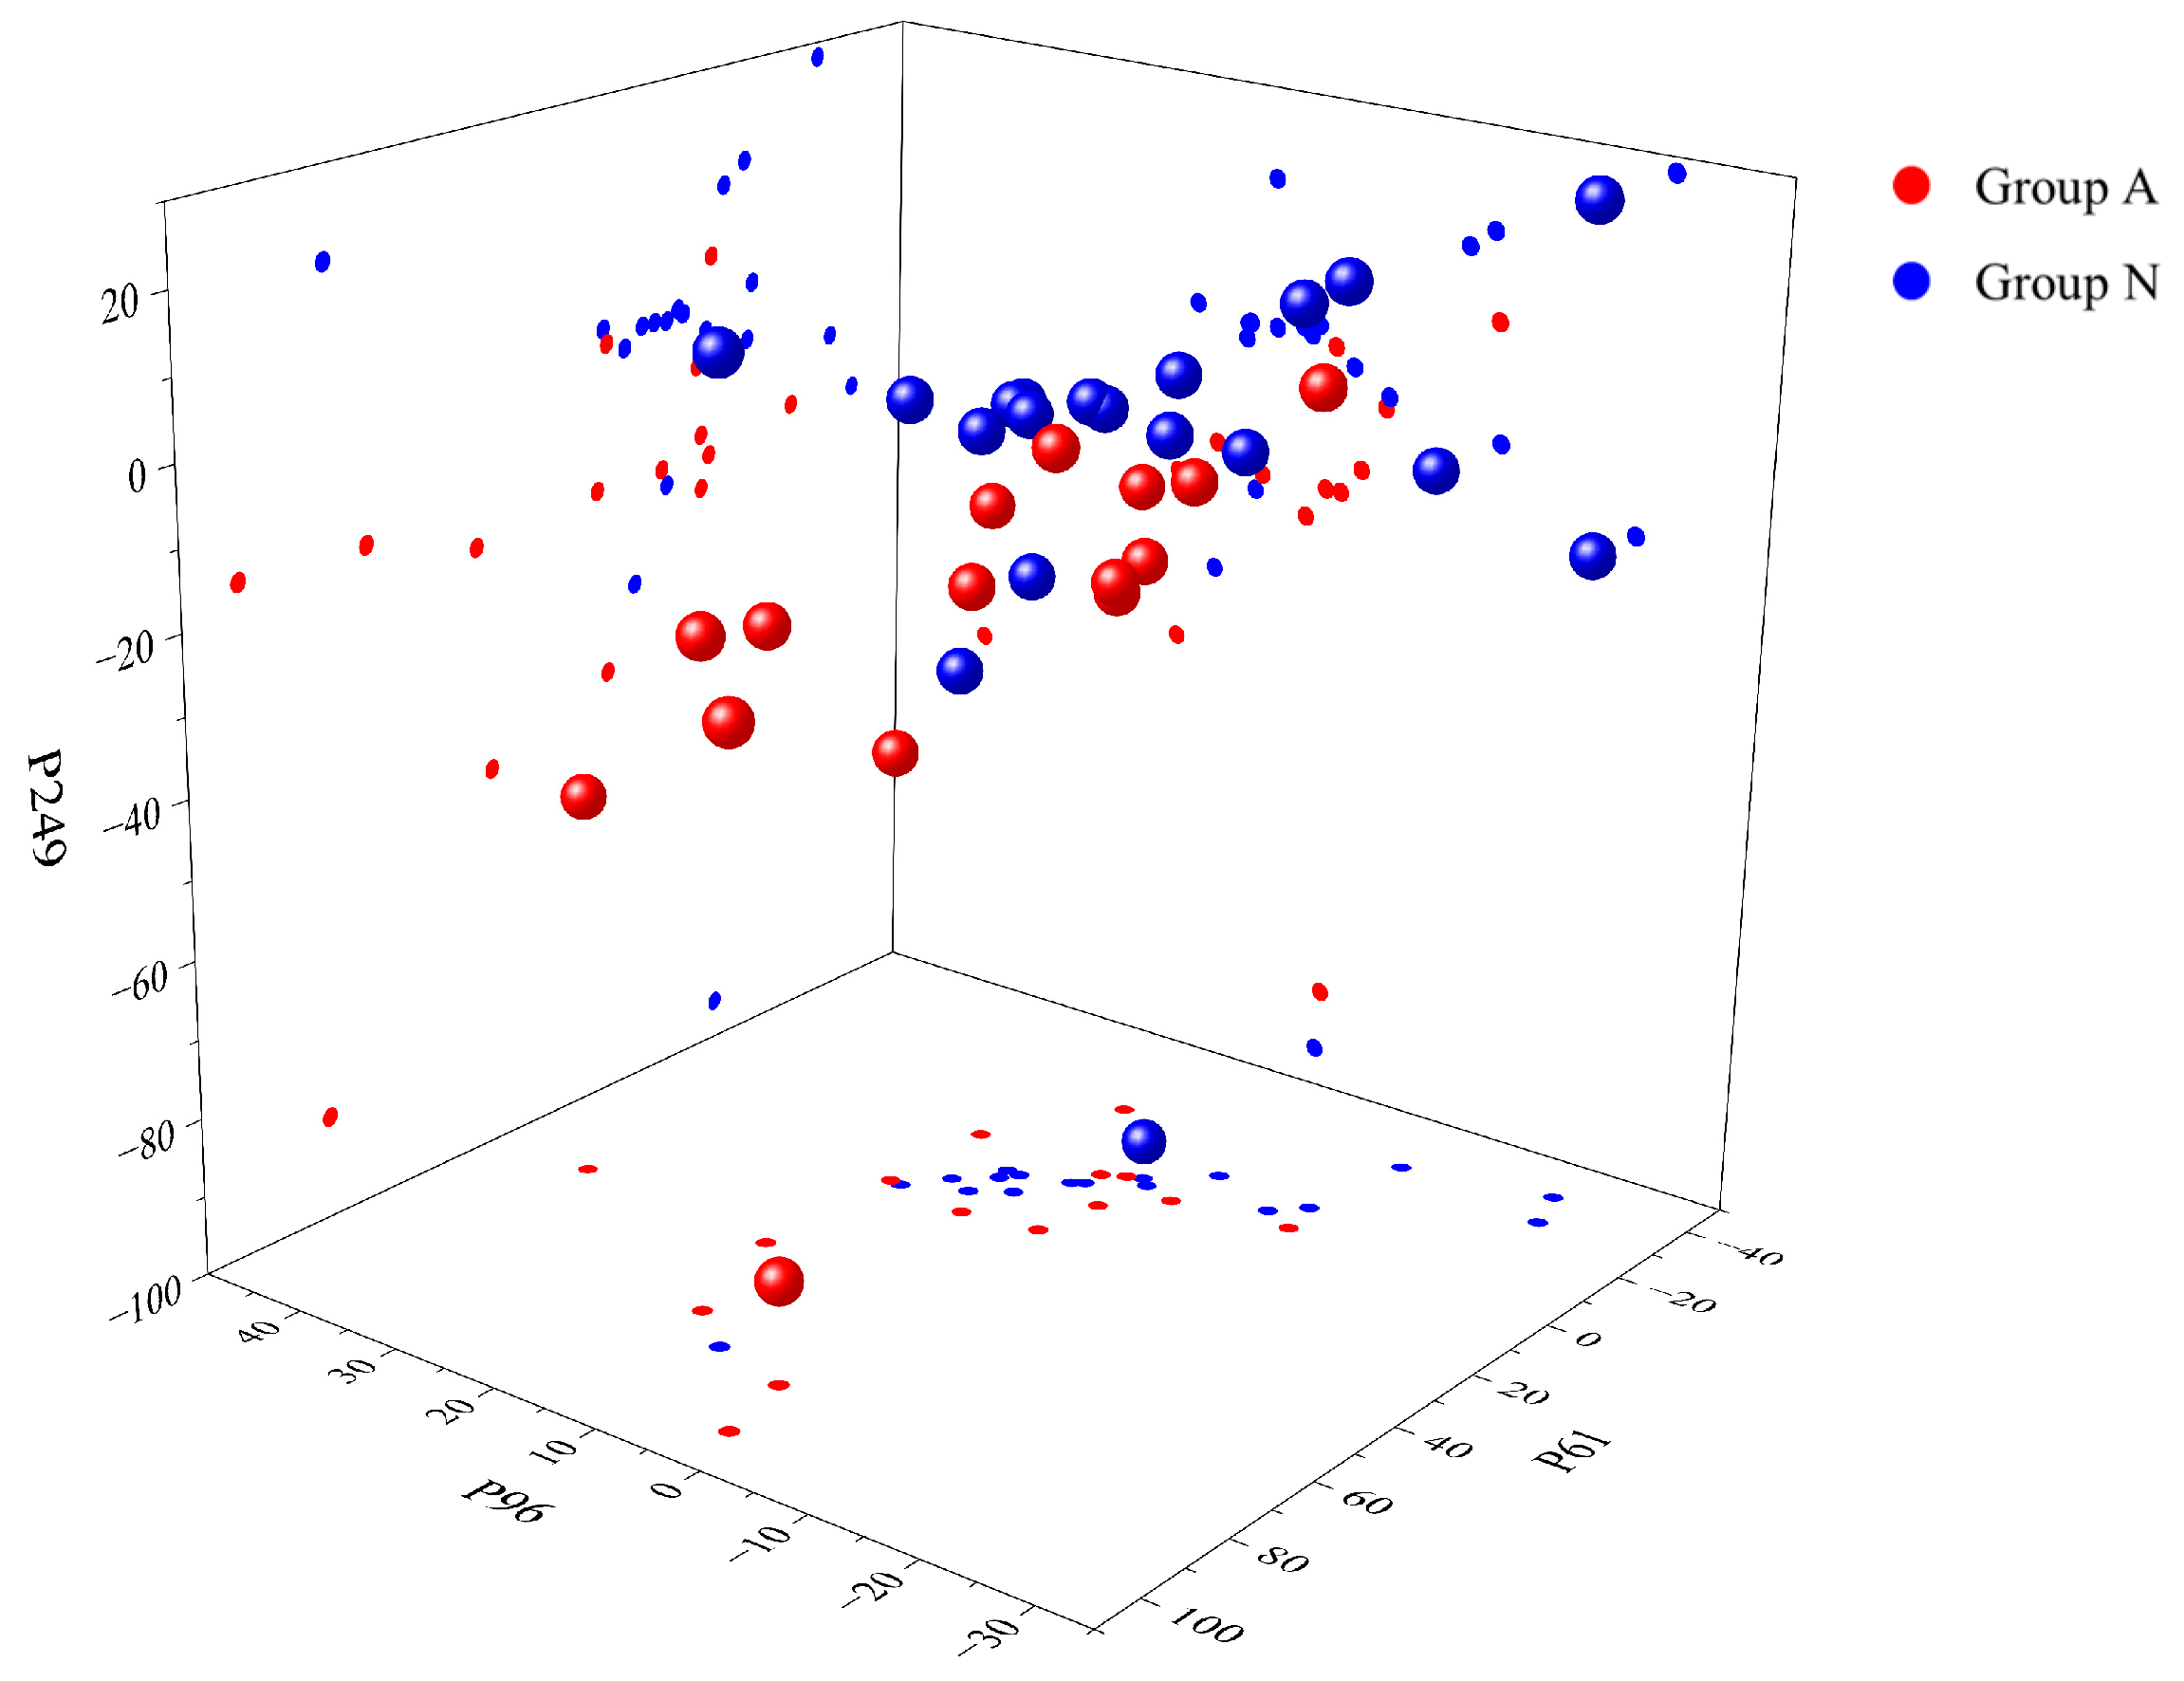
  • Five shape features numbered 249, 100, 168, 61, and 96 were identified as the key shape patterns of the impact of BIM. These shape patterns indicate that the application of BIM has caused impacts such as an increase in the CI-CV% of the design document review fee compared to that of engineering surveillance costs, or a decrease in the CI-CV% of engineering surveillance costs compared to that of the design document review fee.
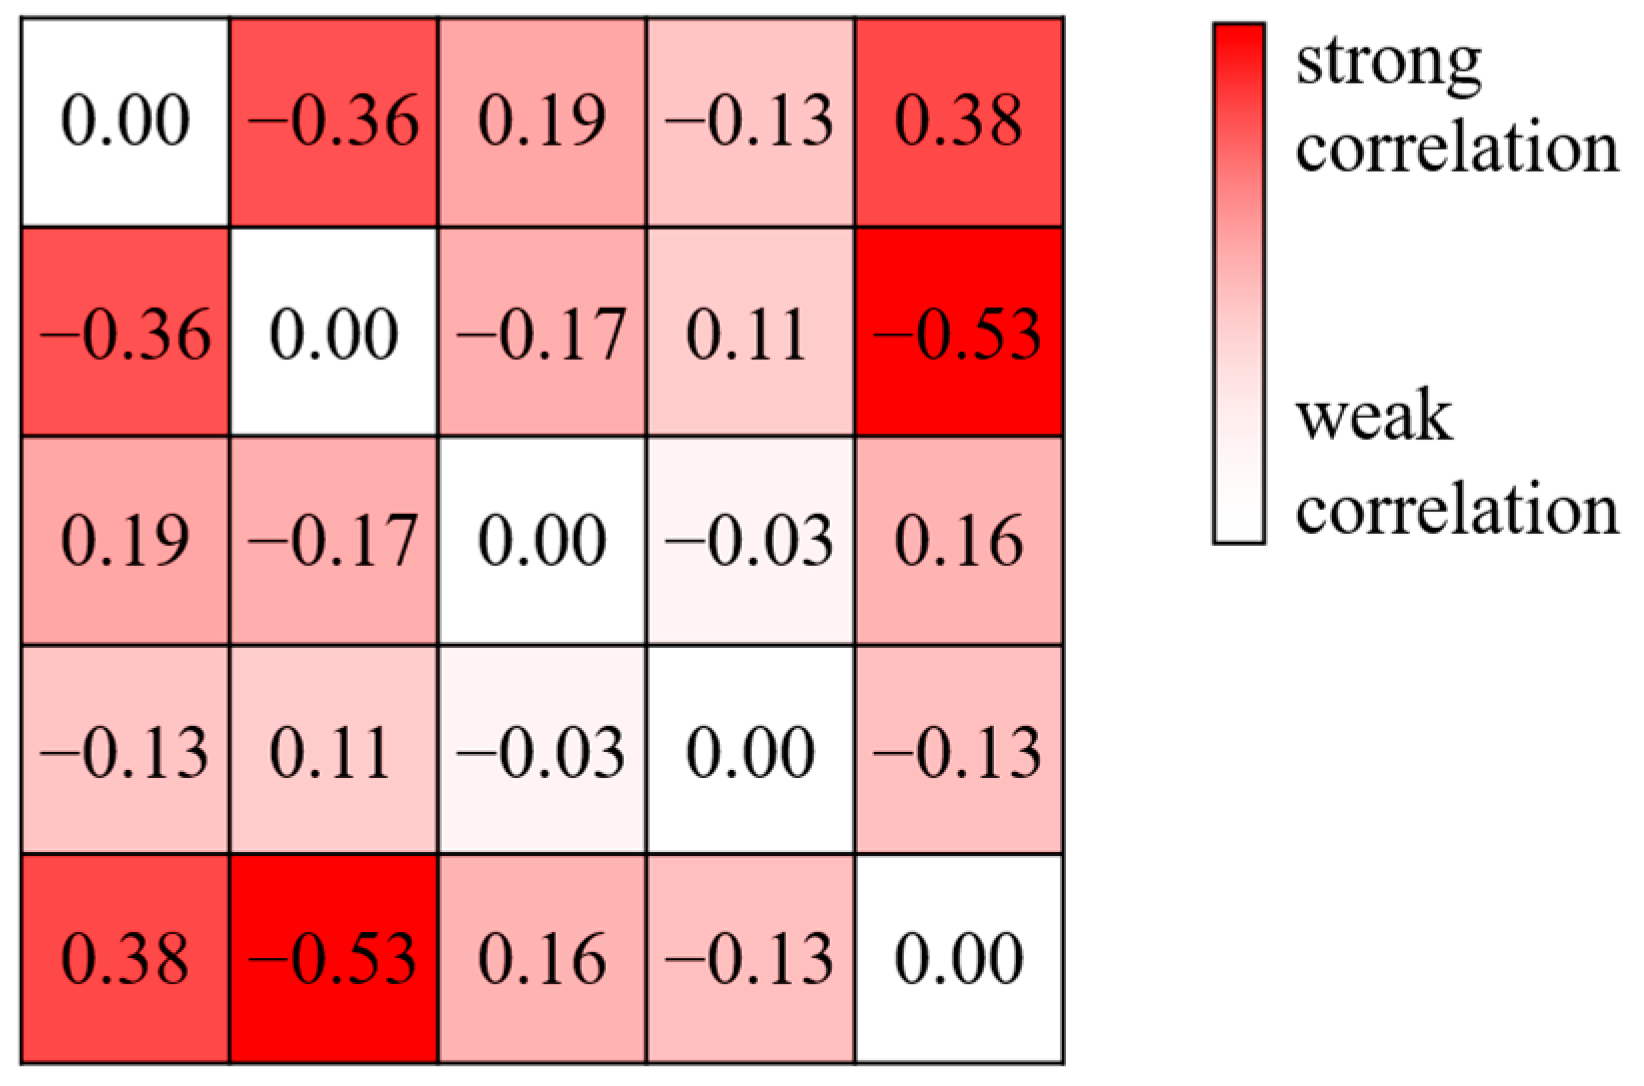
  • Based on the key shape patterns, it was identified that the engineering surveillance costs and the pre-project work fee are widely correlated with other cost items and can jointly reflect the impact of BIM, and these two cost items should also be controlled with a focus during the application of BIM.
Although the generalizability of the above conclusions is enhanced through innovative research perspectives and improved algorithms, these conclusions, especially the identified key cost items and key shape patterns, are context-dependent. A further research direction is to conduct analysis using data from other countries or regions, or data from other construction projects, in accordance with the methodology proposed in this paper. Furthermore, this study has the following limitations:
  • The conclusions based on shape patterns are not intuitive enough and are poorly interpretable. If interpretation is required, expert interviews and causal analyses based on expert opinions should be conducted.
  • In the process of unifying the sequence length, some cost items were excluded, which may cause bias in the analysis results. For example, for the cost items excluded due to poor data quality, whether their data quality was affected by BIM application is not fully considered in this study.
  • While data augmentation is necessary, it carries assumptions, reinforcing the value of the sensitivity analysis.
  • The crossover technique for data augmentation results in a loss of information on the correlation between cost items before and after the subtotal.
Based on the sufficient data collected and the research methods proposed in this study, some preliminary and clear conclusions about the impact of BIM on power substation project costs have been drawn. In view of the relevant cutting-edge research [87], further studies could consider focusing on how to expose the patterns of data more clearly, so as to study the joint changes of multiple cost items. For example, symbolizing the data using the quartile method could make the patterns of data more straightforward and, thus, easier to observe.

Author Contributions

Conceptualization, D.L. and L.Q.; methodology, D.L.; software, Y.S.; validation, J.R., S.Z., and G.Y.; formal analysis, D.L. and L.Q.; investigation, S.Z. and G.Y.; resources, L.Q.; data curation, D.L.; writing—original draft preparation, D.L.; writing—review and editing, L.Q. and Y.S.; visualization, D.L.; supervision, J.R.; project administration, L.Q.; funding acquisition, L.Q. All authors have read and agreed to the published version of the manuscript.

Funding

This paper is a crucial research result of the postdoctoral project “Research on Digital Construction Mode and Whole-process Data Management of Power Transmission and Transformation Projects”. This research was funded by the National Key Research and Development Program of China, “Research, Development and Application of Domestic BIM Software for Major Power Grid Projects” (2022YFC3802105).

Data Availability Statement

Some or all data, models, or codes that support the findings of this study are available from the corresponding author upon reasonable request.

Conflicts of Interest

Authors Ding Liu, Lizhong Qi, Jingguo Rong, Su Zhang and Guangze Yu were employed by the company State Grid Economic and Technological Research Institute Co., Ltd. The remaining author declares that the research was conducted in the absence of any commercial or financial relationships that could be construed as a potential conflict of interest.

Abbreviations

The following abbreviations are used in this manuscript:
BIMBuilding Information Modeling
SGCCState Grid Corporation of China
ROIReturn on Investment
Sig.Significance Level
IQRInterquartile Range
DTWDynamic Time Warping
QDAQuadratic Discriminant Analysis
CV%Cost Variance Percentage Between Settlement and Budget Estimation
TPC-CV%CV% of Total Project Costs
CI-CV%CV% of Cost Items
MCEMinimum Classification Error

References

  1. Qi, L.; Rong, J.; Zhang, S.; Liu, H.; Xu, F. Research on the Application of Domestic BIM Technology in the Lifecycle Management of Power Grid Projects. In Proceedings of the 2024 International Conference on Cloud Computing, Performance Computing, and Deep Learning, CCPCDL 2024, Zhengzhou, China, 14–16 August 2024; SPIE: Zhengzhou, China, 2024; Volume 13281. [Google Scholar]
  2. Edwardes-Evans, H. Interview: European regulatory reform needed to spur “DSO anticipatory investments”. Platts Power Eur. 2024, 916, 9–10. [Google Scholar]
  3. Zhang, Z.; Kang, C. Challenges and Prospects for Constructing the New-Type Power System Towards a Carbon Neutrality Future. Zhongguo Dianji Gongcheng Xuebao/Proc. Chin. Soc. Electr. Eng. 2022, 42, 2806–2818. [Google Scholar] [CrossRef]
  4. Zhang, C.; Jin, X.; Xie, G. Method to Extract Critical Characteristics of Power Grid Projects Adapting to New Situations and Construction of Index System. Energy Rep. 2022, 8, 533–539. [Google Scholar] [CrossRef]
  5. Zhang, L.; Li, Y.; Pan, Y.; Ding, L. Advanced Informatic Technologies for Intelligent Construction: A Review. Eng. Appl. Artif. Intell. 2024, 137, 109104. [Google Scholar] [CrossRef]
  6. Stojanovska-Georgievska, L.; Sandeva, I.; Krleski, A.; Spasevska, H.; Ginovska, M.; Panchevski, I.; Ivanov, R.; Perez Arnal, I.; Cerovsek, T.; Funtik, T. BIM in the Center of Digital Transformation of the Construction Sector—The Status of BIM Adoption in North Macedonia. Buildings 2022, 12, 218. [Google Scholar] [CrossRef]
  7. Piras, G.; Agostinelli, S.; Muzi, F. Digital Twin Framework for Built Environment: A Review of Key Enablers. Energies 2024, 17, 436. [Google Scholar] [CrossRef]
  8. Fonseca Arenas, N.; Shafique, M. Recent Progress on BIM-Based Sustainable Buildings: State of the Art Review. Dev. Built Environ. 2023, 15, 100176. [Google Scholar] [CrossRef]
  9. Yilmaz, G.; Akcamete, A.; Demirors, O. BIM-CAREM: Assessing the BIM Capabilities of Design, Construction and Facilities Management Processes in the Construction Industry. Comput. Ind. 2023, 147, 103861. [Google Scholar] [CrossRef]
  10. Chen, Y.; Cai, X.; Li, J.; Lin, P.; Song, H.; Liu, G.; Cao, D.; Ma, X. The Values and Barriers of BIM Implementation Combination Evaluation Based on Stakeholder Theory: A Study in China. Eng. Constr. Archit. Manag. 2023, 30, 2814–2836. [Google Scholar] [CrossRef]
  11. Toyin, J.O.; Mewomo, M.C. Overview of BIM contributions in the construction phase: Review and bibliometric analysis. J. Inf. Technol. Constr. 2023, 28, 500–514. [Google Scholar] [CrossRef]
  12. Shokouhi, M.; Senisel Bachari, M. An Overview of the Aspects of Sustainability in Project Management. Prog. Eng. Sci. 2025, 2, 100048. [Google Scholar] [CrossRef]
  13. Chen, J.; Zhuang, Y.; Chen, S.; Zhang, Z.; Zhang, Y. Post-Evaluation Model for 500 kV Substation Engineering Projects Using the Fuzzy Comprehensive Evaluation Method. Heliyon 2025, 11, e42327. [Google Scholar] [CrossRef]
  14. Qi, X.; Ma, X.; Zhang, X.; Zhao, Z. Economic Life-Cycle Model for the Cost of a Power Grid Line Engineering Project. Infrastruct. Asset Manag. 2024, 11, 88–99. [Google Scholar] [CrossRef]
  15. Li, Y.; Li, Y.; Ding, Z. Building Information Modeling Applications in Civil Infrastructure: A Bibliometric Analysis from 2020 to 2024. Buildings 2024, 14, 3431. [Google Scholar] [CrossRef]
  16. Cavieres-Lagos, S.; Muñoz La Rivera, F.; Atencio, E.; Herrera, R.F. Integration of BIM Tools for the Facility Management of Railway Bridges. Appl. Sci. 2024, 14, 6209. [Google Scholar] [CrossRef]
  17. Shin, M.-H.; Kim, H.-Y.; Liao, J.-F. Performance Measurement and Analysis of Building Information Modeling (BIM) Applications in the Railway Infrastructure Construction Phase. Appl. Sci. 2024, 14, 502. [Google Scholar] [CrossRef]
  18. Abideen, D.K.; Yunusa-Kaltungo, A.; Cheung, C.; Manu, P. Development and Evaluation of a Maturity Assessment Tool for Integrating Building Information Modelling into Operations and Maintenance Phase of Buildings. Dev. Built Environ. 2025, 21, 100619. [Google Scholar] [CrossRef]
  19. Leygonie, R.; Motamedi, A.; Iordanova, I. Development of Quality Improvement Procedures and Tools for Facility Management BIM. Dev. Built Environ. 2022, 11, 100075. [Google Scholar] [CrossRef]
  20. Hu, Z.; Liu, Y.; Lin, C. Research Prospect of BIM-Based Information Technologies for Engineering Management. Industrial Construction 2022, 52, 195–203. [Google Scholar] [CrossRef]
  21. Gouda Mohamed, A.; Alqahtani, F.K.; Ismail, E.R.; Nabawy, M. Synergizing BIM and Value Engineering in the Construction of Residential Projects: A Novel Integration Framework. Buildings 2024, 14, 2515. [Google Scholar] [CrossRef]
  22. Ma, X.; Li, X.; Yuan, H.; Huang, Z.; Zhang, T. Justifying the Effective Use of Building Information Modelling (BIM) with Business Intelligence. Buildings 2023, 13, 87. [Google Scholar] [CrossRef]
  23. Biswas, H.K.; Sim, T.Y.; Lau, S.L. Impact of Building Information Modelling and Advanced Technologies in the AEC Industry: A Contemporary Review and Future Directions. J. Build. Eng. 2024, 82, 108165. [Google Scholar] [CrossRef]
  24. Waqar, A.; Shafiq, N.; Othman, I.; Alqahtani, F.K.; Alshehri, A.M.; Sherif, M.A.; Almujibah, H.R. Examining the Impact of BIM Implementation on External Environment of AEC Industry: A PEST Analysis Perspective. Dev. Built Environ. 2024, 17, 100347. [Google Scholar] [CrossRef]
  25. Caglayan, S.; Ozorhon, B. Determining Building Information Modeling Effectiveness. Autom. Constr. 2023, 151, 104861. [Google Scholar] [CrossRef]
  26. Kim, S.; Chin, S.; Han, J.; Choi, C.-H. Measurement of Construction BIM Value Based on a Case Study of a Large-Scale Building Project. J. Manag. Eng. 2017, 33, 05017005. [Google Scholar] [CrossRef]
  27. Gharaibeh, L.; Eriksson, K.; Lantz, B. Quantifying BIM Investment Value: A Systematic Review. J. Eng. Des. Technol. 2024. ahead-of-print. [Google Scholar] [CrossRef]
  28. Kim, Y.; Chin, S.; Choo, S. Quantitative Evaluation Method and Process of BIM Data for Generating BIM-Based 2D Deliverables. Buildings 2023, 13, 3124. [Google Scholar] [CrossRef]
  29. Martin, H.; Watson, C.; Brooks, T. Synergizing BIM and RIBA in Architectural Practice–Technology Workflow Efficiencies, Challenges, and Insights. Archit. Eng. Des. Manag. 2024, 21, 35–59. [Google Scholar] [CrossRef]
  30. Liao, J.; Kim, H.Y.; Shin, M.H. Quantitative and Qualitative Benefits of Using BIM in Design and Construction Stages for Railway Development. Buildings 2025, 15, 180. [Google Scholar] [CrossRef]
  31. Morales, F.; Herrera, R.F.; Rivera, F.M.-L.; Atencio, E.; Nuñez, M. Potential Application of BIM in RFI in Building Projects. Buildings 2022, 12, 145. [Google Scholar] [CrossRef]
  32. Eldeep, A.; Farag, M.; El-Hafez, L.A. Using BIM as a Lean Management Tool in Construction Processes—A Case Study: Using BIM as a Lean Management Tool. Ain Shams Eng. J. 2022, 13, 101556. [Google Scholar] [CrossRef]
  33. Al-Roumi, H.; Al-Sabah, R. Exploring the Rate of Adoption and Implementation Depth of Building Information Modeling (BIM): A Case of Kuwait. J. Eng. Res. 2024, 12, 86–99. [Google Scholar] [CrossRef]
  34. Wefki, H.; Elnahla, M.; Elbeltagi, E. BIM-Based Schedule Generation and Optimization Using Genetic Algorithms. Autom. Constr. 2024, 164, 105476. [Google Scholar] [CrossRef]
  35. Hire, S.; Sandbhor, S.; Ruikar, K. A Conceptual Framework for BIM-Based Site Safety Practice. Buildings 2024, 14, 272. [Google Scholar] [CrossRef]
  36. Salzano, A.; Cascone, S.; Zitiello, E.P.; Nicolella, M. Construction Safety and Efficiency: Integrating Building Information Modeling into Risk Management and Project Execution. Sustainability 2024, 16, 4094. [Google Scholar] [CrossRef]
  37. Akbari, S.; Sheikhkhoshkar, M.; Pour Rahimian, F.; El Haouzi, H.B.; Najafi, M.; Talebi, S. Sustainability and Building Information Modelling: Integration, Research Gaps, and Future Directions. Autom. Constr. 2024, 163, 105420. [Google Scholar] [CrossRef]
  38. Jayasanka, T.A.D.K.; Darko, A.; Edwards, D.J.; Chan, A.P.C.; Jalaei, F. Automating Building Environmental Assessment: A Systematic Review and Future Research Directions. Environ. Impact Assess. Rev. 2024, 106, 107465. [Google Scholar] [CrossRef]
  39. Cheng, Q.; Tayeh, B.A.; Abu Aisheh, Y.I.; Alaloul, W.S.; Aldahdooh, Z.A. Leveraging BIM for Sustainable Construction: Benefits, Barriers, and Best Practices. Sustainability 2024, 16, 7654. [Google Scholar] [CrossRef]
  40. Altwassi, E.J.; Aysu, E.; Ercoskun, K.; Abu Raed, A. From Design to Management: Exploring BIM’s Role across Project Lifecycles, Dimensions, Data, and Uses, with Emphasis on Facility Management. Buildings 2024, 14, 611. [Google Scholar] [CrossRef]
  41. Gharaibeh, L.; Lantz, B.; Jaradat, M.; Eriksson, K. The Interplay Between BIM Implementation Level and Perceived Benefits: Insights from Industry Practitioners. In Sustainable Production Through Advanced Manufacturing, Intelligent Automation and Work Integrated Learning; IOS Press: Amsterdam, The Netherlands, 2024; pp. 370–382. [Google Scholar]
  42. Hwang, B.-G.; Zhao, X.; Yang, K.W. Effect of BIM on Rework in Construction Projects in Singapore: Status Quo, Magnitude, Impact, and Strategies. J. Constr. Eng. Manag. 2019, 145, 04018125. [Google Scholar] [CrossRef]
  43. Panya, D.S.; Kim, T.; Choo, S. An Interactive Design Change Methodology Using a BIM-Based Virtual Reality and Augmented Reality. J. Build. Eng. 2023, 68, 106030. [Google Scholar] [CrossRef]
  44. Huh, S.-H.; Ham, N.; Kim, J.-H.; Kim, J.-J. Quantitative Impact Analysis of Priority Policy Applied to BIM-Based Design Validation. Autom. Constr. 2023, 154, 105031. [Google Scholar] [CrossRef]
  45. Salleh, H.; Ahmad, A.A.; Abdul-Samad, Z.; Alaloul, W.S.; Ismail, A.S. BIM Application in Construction Projects: Quantifying Intangible Benefits. Buildings 2023, 13, 1469. [Google Scholar] [CrossRef]
  46. Sompolgrunk, A.; Banihashemi, S.; Hosseini, M.R.; Golzad, H.; Hajirasouli, A. An Integrated Model of BIM Return on Investment for Australian Small- and Medium-Sized Enterprises (SMEs). Eng. Constr. Archit. Manag. 2023, 30, 2048–2074. [Google Scholar] [CrossRef]
  47. Wang, S.; Chong, H.-Y.; Zhang, W. The Impact of BIM-Based Integration Management on Megaproject Performance in China. Alex. Eng. J. 2024, 94, 34–43. [Google Scholar] [CrossRef]
  48. Lidelöw, S.; Engström, S.; Samuelson, O. The Promise of BIM? Searching for Realized Benefits in the Nordic Architecture, Engineering, Construction, and Operation Industries. J. Build. Eng. 2023, 76, 107067. [Google Scholar] [CrossRef]
  49. Deng, J.; Li, X.; Rao, J. Research on Influencing Factors and Driving Path of BIM Application in Construction Projects Based on the SD Model in China. Buildings 2023, 13, 2794. [Google Scholar] [CrossRef]
  50. Vigneshwar, R.V.K.; Shanmugapriya, S.; Sindhu Vaardini, U. Analyzing the Driving Factors of BIM Adoption Based on the Perception of the Practitioners in Indian Construction Projects. Iran. J. Sci. Technol. Trans. Civ. Eng. 2022, 46, 2637–2648. [Google Scholar] [CrossRef]
  51. Youkhanna Zaia, Y.; Mustafa Adam, S.; Heeto Abdulrahman, F. Investigating BIM Level in Iraqi Construction Industry. Ain Shams Eng. J. 2023, 14, 101881. [Google Scholar] [CrossRef]
  52. Altassan, A.; Othman, M.; Elbeltagi, E.; Abdelshakor, M.; Ehab, A. A Qualitative Investigation of the Obstacles Inherent in the Implementation of Building Information Modeling (BIM). Buildings 2023, 13, 700. [Google Scholar] [CrossRef]
  53. Alshibani, A.; Aldossary, M.S.; Hassanain, M.A.; Hamida, H.; Aldabbagh, H.; Ouis, D. Investigation of the Driving Power of the Barriers Affecting BIM Adoption in Construction Management through ISM. Results Eng. 2024, 24, 102987. [Google Scholar] [CrossRef]
  54. Durdyev, S.; Ashour, M.; Connelly, S.; Mahdiyar, A. Barriers to the Implementation of Building Information Modelling (BIM) for Facility Management. J. Build. Eng. 2022, 46, 103736. [Google Scholar] [CrossRef]
  55. Xu, H.; Chang, R.; Dong, N.; Zuo, J.; Webber, R.J. Interaction Mechanism of BIM Application Barriers in Prefabricated Construction and Driving Strategies from Stakeholders’ Perspectives. Ain Shams Eng. J. 2023, 14, 101821. [Google Scholar] [CrossRef]
  56. Yu, W.-D.; Chang, H.-K.; Wang, K.-C. Measuring the Value and Cost of BIM Use—An Empirical Lesson Learned from Taiwan’s Social Housing Projects. Can. J. Civ. Eng. 2023, 50, 1047–1065. [Google Scholar] [CrossRef]
  57. Ghaffarianhoseini, A.; Tookey, J.; Ghaffarianhoseini, A.; Naismith, N.; Azhar, S.; Efimova, O.; Raahemifar, K. Building Information Modelling (BIM) Uptake: Clear Benefits, Understanding Its Implementation, Risks and Challenges. Renew. Sustain. Energy Rev. 2017, 75, 1046–1053. [Google Scholar] [CrossRef]
  58. Lechhab, N.; Iordanova, I.; Forgues, D. Evaluation of the Return on Investment of BIM—The Case of an Architectural Firm. In Proceedings of the Annual Conference of the Canadian Society of Civil Engineering, CSCE 2021, Niagara Falls, ON, Canada, 26–29 May 2021; Springer Science and Business Media Deutschland GmbH: Berlin/Heidelberg, Germany, 2023; Volume 251, pp. 431–443. [Google Scholar]
  59. Sompolgrunk, A.; Banihashemi, S.; Mohandes, S.R. Building Information Modelling (BIM) and the Return on Investment: A Systematic Analysis. Constr. Innov. 2023, 23, 129–154. [Google Scholar] [CrossRef]
  60. Cheng, J.; Huang, L.; Jiang, L.; Chen, J.; Chen, W.; He, Y. Fostering Knowledge Collaboration in Construction Projects: The Role of BIM Application. Buildings 2023, 13, 812. [Google Scholar] [CrossRef]
  61. Zhang, W.; Li, J.; Liang, Z. Barriers to Building Information Modeling from an Individual Perspective in the Chinese Construction Industry: An Extended Unified Theory of Acceptance and Use of Technology. Buildings 2023, 13, 1881. [Google Scholar] [CrossRef]
  62. Olugboyega, O. Differential Relationships in the BIM Implementation Process in a Developing Country: The Role of Essential BIM Implementation Strategies. Eng. Constr. Archit. Manag. 2024, 31, 3283–3307. [Google Scholar] [CrossRef]
  63. Shin, M.-H.; Jung, J.-H.; Kim, H.-Y. Quantitative and Qualitative Analysis of Applying Building Information Modeling (BIM) for Infrastructure Design Process. Buildings 2022, 12, 1476. [Google Scholar] [CrossRef]
  64. Yılmaz, İ.C.; Yılmaz, D.; Kandemir, O.; Tekin, H.; Atabay, Ş.; Bulut Karaca, Ü. Barriers to BIM Implementation in the HVAC Industry: An Exploratory Study. Buildings 2024, 14, 788. [Google Scholar] [CrossRef]
  65. Rupasinghe, C.; Ranadewa, K.A.T.O.; Jayanetti, J.K.D.D.T.; Perera, B.A.K.S. Developing a Green-BIM Team to Improve the Construction of Green Buildings in Sri Lanka. Eng. Constr. Archit. Manag. 2025. ahead-of-print. [Google Scholar] [CrossRef]
  66. Zhang, S.; Li, Z.; Ma, S.; Li, L.; Yuan, M. Critical Factors Influencing Interface Management of Prefabricated Building Projects: Evidence from China. Sustainability 2022, 14, 5418. [Google Scholar] [CrossRef]
  67. Waqar, A.; Qureshi, A.H.; Alaloul, W.S. Barriers to Building Information Modeling (BIM) Deployment in Small Construction Projects: Malaysian Construction Industry. Sustainability 2023, 15, 2477. [Google Scholar] [CrossRef]
  68. Olanrewaju, O.I.; Kineber, A.F.; Chileshe, N.; Edwards, D.J. Modelling the Relationship between Building Information Modelling (BIM) Implementation Barriers, Usage and Awareness on Building Project Lifecycle. Build. Environ. 2022, 207, 108556. [Google Scholar] [CrossRef]
  69. Wang, J.; Zhang, S.; Fenn, P.; Luo, X.; Liu, Y.; Zhao, L. Adopting BIM to Facilitate Dispute Management in the Construction Industry: A Conceptual Framework Development. J. Constr. Eng. Manag. 2023, 149, 03122010. [Google Scholar] [CrossRef]
  70. Manifold, J.; Renukappa, S.; Suresh, S.; Georgakis, P.; Perera, G.R. Dual Transition of Net Zero Carbon and Digital Transformation: Case Study of UK Transportation Sector. Sustainability 2024, 16, 7852. [Google Scholar] [CrossRef]
  71. Rong, J.; Qi, L.; Wu, H.; Zhang, M.; Hu, X. Framework for Evaluating the BIM Application Performance: A Case Study of a Grid Information Modeling System. Sustainability 2023, 15, 11658. [Google Scholar] [CrossRef]
  72. Liu, J.; Zhang, X.; Jin, L.; Hui, J.; Zhao, J.; Gong, K. BIM model construction standards and digital delivery of hydraulic engineering. Yellow River 2021, 43, 268–271. [Google Scholar]
  73. Chen, T.; Ren, Y.; Wen, W. Calculation method of three-dimensional design cost of power grid engineering. China Power Enterp. Manag. 2019, 12, 68–69. [Google Scholar]
  74. Sumanaweera, D.; Suo, C.; Cujba, A.-M.; Muraro, D.; Dann, E.; Polanski, K.; Steemers, A.S.; Lee, W.; Oliver, A.J.; Park, J.-E.; et al. Gene-Level Alignment of Single-Cell Trajectories. Nat. Methods 2024, 22, 68–81. [Google Scholar] [CrossRef] [PubMed]
  75. Górecki, T.; Łuczak, M. Non-Isometric Transforms in Time Series Classification Using DTW. Knowl. Based Syst. 2014, 61, 98–108. [Google Scholar] [CrossRef]
  76. Niu, C. The Application of Improved DTW Algorithm in Sports Posture Recognition. Syst. Soft Comput. 2024, 6, 200163. [Google Scholar] [CrossRef]
  77. Lee, C.K.H.; Leung, E.K.H. Spatiotemporal Analysis of Bike-Share Demand Using DTW-Based Clustering and Predictive Analytics. Transp. Res. Part E Logist. Transp. Rev. 2023, 180, 103361. [Google Scholar] [CrossRef]
  78. Zhang, Q. Testing the Homogeneity of Two High-Dimensional Population Covariance matrices. Ph.D. Thesis, Northeast Normal University, Jilin, China, 2020. [Google Scholar]
  79. Bose, S.; Pal, A.; SahaRay, R.; Nayak, J. Generalized Quadratic Discriminant Analysis. Pattern Recognit. 2015, 48, 2676–2684. [Google Scholar] [CrossRef]
  80. Wu, R.; Hao, N. Quadratic Discriminant Analysis by Projection. J. Multivar. Anal. 2022, 190, 104987. [Google Scholar] [CrossRef]
  81. Tran, B.; Xue, B.; Zhang, M. Variable-Length Particle Swarm Optimization for Feature Selection on High-Dimensional Classification. IEEE Trans. Evol. Comput. 2019, 23, 473–487. [Google Scholar] [CrossRef]
  82. Li, J.; Luo, T.; Zhang, B.; Chen, M.; Zhou, J. IMOABC: An Efficient Multi-Objective Filter–Wrapper Hybrid Approach for High-Dimensional Feature Selection. J. King Saud Univ. Comput. Inf. Sci. 2024, 36, 102205. [Google Scholar] [CrossRef]
  83. Sağbaş, E.A. A Novel Two-Stage Wrapper Feature Selection Approach Based on Greedy Search for Text Sentiment Classification. Neurocomputing 2024, 590, 127729. [Google Scholar] [CrossRef]
  84. Cilia, N.D.; D’Alessandro, T.; De Stefano, C.; Fontanella, F.; Scotto di Freca, A. Comparing Filter and Wrapper Approaches for Feature Selection in Handwritten Character Recognition. Pattern Recognit. Lett. 2023, 168, 39–46. [Google Scholar] [CrossRef]
  85. Liao, Z.; Xie, X.; Zheng, G.; Wang, B.; Liu, Y. Phase Identification of Low-Voltage Distribution Station Area Based on Morphological Characteristic Clustering of Voltage Curves. Dianli Xitong Zidonghua/Autom. Electr. Power Syst. 2023, 47, 142–149. [Google Scholar] [CrossRef]
  86. Lin, L.; Xiao, S.; Fei, H.; Pan, X. Regional Scaled Wind Power Output Scene Segmentation Based on Curve Morphological Features. Power Syst. Clean Energy 2020, 36, 74–81+88. [Google Scholar]
  87. Liu, D.; Li, C.; Zhao, D.; Wang, Q. Research on the Joint Fluctuation Laws between Locational Marginal Price and Renewables Based on Complex Networks: A Case Study in Independent System Operator New England. Energy Sci. Eng. 2019, 7, 2866–2883. [Google Scholar] [CrossRef]
Figure 1. Framework of the research methodology.
Buildings 15 01885 g001
Figure 2. Algorithm improvement idea.
Buildings 15 01885 g002
Figure 3. Frequency distribution histograms of the two groups.
Buildings 15 01885 g003
Figure 4. Distribution fitting results for the two groups.
Buildings 15 01885 g004
Figure 5. Hierarchical clustering process.
Buildings 15 01885 g005
Figure 6. Comparative analysis indicators of CI-CV% for the 41 cost items: (a) avg_indi; (b) std_indi; (c) kurt_indi; (d) skew_indi.
Buildings 15 01885 g006
Figure 7. Violin plots of CI-CV% for the key cost items: (a) it2; (b) it4; (c) it8; (d) it17; (e) it35.
Buildings 15 01885 g007
Figure 8. Linear correlation coefficients among the top five shape features.
Buildings 15 01885 g008
Figure 9. MCE during feature selection.
Buildings 15 01885 g009
Figure 10. Visualization of the key shape patterns.
Buildings 15 01885 g010
Figure 11. Visualization of the key shape patterns associated with it26.
Buildings 15 01885 g011
Table 1. The data structure of CI-CV%.
Serial NumberCost ItemValue
I, II, III…/(I), (II), (III)…/1, 2, 3…/1.1, 1.2, 1.3…CI-CV%
Table 2. Results of independent samples non-parametric tests.
TestSig.Decision
Mann–Whitney U Test0.452The distribution is the same.
Kolmogorov–Smirnov Test0.345The distribution is the same.
Wald–Wolfowitz Runs Test0.687The distribution is the same.
Median Test0.755The medians are the same.
Moses Test of Extreme Reaction0.432The range is the same.
Table 3. Results of one-sample Kolmogorov–Smirnov tests.
K-S TestSig.Decision
Group A—normal0.013The distribution is not normal.
Group A—uniform<0.001The distribution is not uniform.
Group A—exponential<0.001The distribution is not exponential.
Group N—normal0.091The distribution is normal with μ = 5.90 and σ = 4.44 .
Table 4. Common statistics of TPC-CV% of the two groups.
GroupMeanStandard DeviationSkewnessKurtosisMedianIQR
Group A6.234.170.041.656.324.01
Group N5.904.410.26 *−0.01 *5.965.09
* An extremely large outlier was excluded. It was verified to strongly affect both skewness and kurtosis, distorting them.
Table 5. The unified structure for the Project Settlement and Completion Schedules.
NumberSerial
Number
Cost ItemNumberSerial
Number
Cost Item
1IMain production engineering22 Subtotal
2(I)Installation work23IVOther costs
31Main transformer system241Land-use and site-cleaning fee
42Distribution equipment252Overhead of client
53Reactive power (VAr) compensator262.3Engineering surveillance costs
64Control and DC system272.4Equipment survey costs
75Auxiliary power system282.6Construction insurance fee
86Piping and earthing system293Project construction technical service charge
97Communication and telecontrol system303.1Pre-project work fee
108Total station debugging313.3Cost of survey and design
11(II)Construction work323.3.1Cost of survey
121Main production building333.3.2Cost of design
132Distribution equipment building343.4Design document review fee
143Water supply system building353.6Engineering construction test fee
154FAS364Operational production preparation fee
16IIAuxiliary production engineering374.2Acquisition expenses of equipment, instruments, and office furniture
17(II)Construction work38 Static investment
182Station building39VIIDynamic costs
194Station greening402Interest during construction period
20IIISectional works related to the site41 Dynamic investment
21(II)construction work
Table 6. Results of feature selection.
Pattern
Number
Feature
Number
Description
of Features
Pattern
Number
Feature
Number
Description
of Features
Pattern
Number
Feature
Number
Description
of Features
124934-2646126-24722737-30
210030-2759626-2382325-24
316834-29619936-3096530-28
Table 7. Feature selection results of the 10 tests.
Patterns123456789
Test
12491681931671006196272186
2163100168612491932962227
3249100611689616366272186
42491861991681006596272167
52491001631686115722710367
6163100249168137611652386
7163100666116724922719962
81631002491671376219919396
924937561296596100157311
1024996168611001866629272
The present study24910016861961992272365
Frequency100%100%70%80%60%30%30%10%20%
Disclaimer/Publisher’s Note: The statements, opinions and data contained in all publications are solely those of the individual author(s) and contributor(s) and not of MDPI and/or the editor(s). MDPI and/or the editor(s) disclaim responsibility for any injury to people or property resulting from any ideas, methods, instructions or products referred to in the content.

