Article

Probabilistic Cash Flow Analysis Considering Risk Impacts by Integrating 5D-Building Information Modeling and Bayesian Belief Network

by
Mohammad Hosein Madihi
1,
Mohammadsoroush Tafazzoli
2,
Ali Akbar Shirzadi Javid
1,* and
Farnad Nasirzadeh
3
1
School of Civil Engineering, Iran University of Science and Technology (IUST), Tehran 16846-13114, Iran
2
Department of Civil Engineering and Construction, Georgia Southern University, P.O. Box 8077, Statesboro, GA 30460, USA
3
Faculty of Science, Engineering and Built Environment, School of Architecture & Built Environment, Deakin University, Geelong Waterfront Campus, Geelong, VIC 3220, Australia
*
Author to whom correspondence should be addressed.
Buildings 2025, 15(11), 1774; https://doi.org/10.3390/buildings15111774
Submission received: 8 April 2025 / Revised: 29 April 2025 / Accepted: 20 May 2025 / Published: 22 May 2025

Abstract

Unrealistic cash flow forecasts negatively affect project stakeholders and are a common issue for construction practitioners. This study proposes a new method for predicting the probabilistic cash flow of a project that can automate the calculation process while considering the impact of risks and their inter-related structure. This research integrates a Bayesian Belief Network (BBN) and 5D-BIM to provide a new probabilistic cash flow analysis approach. Here, 5D-BIM is used to facilitate cash flow calculations and automate the process. The BBN has also been implemented to assess the impact of risk factors on project cash flow, considering their complex inter-related structure. In addition, a hybrid approach combining fuzzy set theory, decision-making trial and evaluation laboratory (DEMATEL), and interpretive structural modeling (ISM) is used to form the BBN. The proposed method provides a robust tool for calculating the probabilistic cash flow of the project. The results showed that the project’s cash flow in the last month was IRR 14.4 billion without considering the impact of risks. The probabilistic cash flow of the project indicates that due to the impact of the risks, the project cash flow will be in the range of IRR −142.2 billion and IRR 1.11 billion at the end of the project. This shows the possibility of experiencing between 11 and 130% deviation in the project cash flow due to existing risks. In conclusion, project cash flow is unreliable without considering the impact of risks. This framework supports better financial decisions and allows for the evaluation of cash flow risk management scenarios.

1. Introduction

The failure of construction companies in over 60% of cases is related to financial factors. These companies fail due to lacking liquidity to carry out activities [1,2]. Accurate cash flow predictions enable companies to plan for the liquidity, ensuring timely project delivery and reducing the risk of financial failure. Despite its significant importance, cash flow predictions are prone to inaccuracies because of errors resulting from manual calculation and failing to account for risks impacting project cash flow [1,3,4].
Various methods have been trialed to accurately forecast cash flow by integrating schedule and cost data [1]. In the last decade, automated approaches have received significant attention, as the manual process has been proven to be tiresome, error prone, and time consuming [5,6,7,8]. Specifically, building information modeling (BIM) has resolved many of the problems caused by traditional methods [4,9]. BIM offers a powerful solution to consistently produce takeoffs, counts, and measurements through the 3D model [10,11]. The intelligent relationship between 3D-BIM models, time, and cost information is now known as 5D-BIM [12,13]. The 5D-BIM technology can quickly update schedules, budgets, and visualizations to improve efficiency [14]. Several studies have investigated the application of 5D-BIM in cash flow calculations. Kim and Grobler [7] suggested a method for analyzing cash flows based on automated BIM processes, including quantity takeoff (QTO), scheduling, and cost estimating. Lu et al. [1] presented a framework for financial decision making in construction projects based on 5D-BIM. In this study, the cash inflow and outflow patterns based on contract conditions were considered in cash flow calculations based on the BIM model. Latif Khalaf [15] presented a parametric model for cash flow calculation using BIM and a simulation platform. Le and Cong [16] presented an integrated system for cash flow estimation in the early phases of the project life cycle by integrating 3D-BIM, schedule data, and cost estimation. Abma et al. [17] investigated the project cash flow forecasting system based on 5D-BIM in a case study in Indonesia. Yoon and Pishdad-Bozorgi [13] proposed an enhanced method for processing pay applications that utilize blockchain-enabled smart contracts and the 5D-BIM platform to accelerate cash flow in construction projects via a semi-automated payment process. In a study, the benefits of the use of BIM-based cash flow forecasting have been investigated. The prevailing obstacles to developing this tool have then been outlined, and strategies for overcoming these obstacles have been suggested [18].
Despite recent advancements in cash flow calculations using 5D-BIM, the impact of project risks on cash flow has been overlooked in these studies, as BIM alone cannot comprehensively model the effects of risk factors. Ignoring the impact of risks on project cash flow is a limitation of past studies, since the construction industry faces various risks [19,20]. Risks significantly affect the accuracy of cost forecasts, often leading to over-runs and affecting the distribution of cash flows [21]. Therefore, automated cash flow calculations using 5D-BIM must be made more accessible and accurate by considering the impact of risks [7,20].
Considering the existing uncertainties, several studies have tried integrating risk assessment into cash flow calculations for a more accurate prediction [2,22,23,24]. Many studies have addressed the use of BIM in risk management, particularly regarding safety risks [25,26]. However, only one study has integrated automated cash flow analysis using 5D-BIM with risk assessment [20]. Amin Ranjbar et al. [20] tried integrating risk analysis into BIM-based cash flow calculations. They predicted the probabilistic cash flow of the project using Monte Carlo simulation by considering the probability of occurrence and impact of individual risk factors. However, their adopted approach for risk analysis simplifies the evaluation process by ignoring the interactions between risk factors. In addition, it ignores the uncertainties surrounding the risk analysis process by assigning a deterministic value to the probability and impact of risks. To accurately predict cash flow, the impact of risks must be assessed, considering their interdependencies and the existing uncertainties. The Bayesian Belief Network (BBN) provides an efficient method for modeling the interdependent risk factors and evaluating their impact on project cash flow [27]. A Bayesian network, or a Bayes net or belief network, is a probabilistic graphical model representing a set of variables and their conditional dependencies using a directed acyclic graph comprising two structural and parametric parts [28]. One study used a BBN to investigate the effect of risks on cash flow [29]; however, their research has two shortcomings: (1) they did not use BIM for cash flow calculations, and (2) the use of BBN in this study was also faced with limitations that may prevent its practical use for a real-world project. These limitations are explained in the next section.

Research Significance and Identified Gaps

Recent studies on cash flow calculations show a trend toward automating these calculations using 5D-BIM to reduce effort and increase the speed and accuracy of predictions. However, almost all these 5D-BIM studies have ignored the impact of risks on their predictions. Despite its importance, only one study [20] considered the impact of risks on cash flow calculations using 5D-BIM. This study lacks an efficient approach, such as a BBN, that can consider the complex, inter-related structure of risk factors. Bayesian networks are a powerful tool for risk assessment and have been utilized in numerous studies [27,30,31]. Some studies have used a BBN for cash flow risk analysis but cannot integrate their BBN risk assessment module into 5D-BIM, besides facing several computational challenges related to their BBN part [27,29]. Therefore, integrating an efficient risk assessment method such as a BBN with 5D-BIM can overcome some fundamental challenges in the field of cash flow predictions
BIM, as a digital model of a construction project, allows for storing, retrieving, and updating project-oriented data while enabling rapid and accurate calculations. Despite these benefits, BIM does not have advanced analytical as well as inferential capacity, especially in the domain of risk assessment. BBNs, due to their ability under conditions of uncertainty and supporting probabilistic inference, provide a good supplement for BIM. Combined together, BIM and BBNs provide a substantial decision-support environment that complements the analytical shortcomings of BIM. This hybrid method has commonly been implemented within the construction industry as a means of filling the gap of decision-making support for numerous applications such as deterioration modeling, building occupant comfort, green performance evaluation, and condition assessment [32,33,34,35].
The contributions of this research to the body of knowledge are listed below:
  • Contribution 1: The study is the first to combine 5D-BIM with a BBN for cash flow prediction. This can provide an efficient approach that automates the cash flow calculations while considering the complex impact of inter-related risk factors.
  • Contribution 2: The proposed approach will also address three significant challenges associated with traditional BBN methods, including the following:
    The inability to consider uncertainty and vagueness in experts’ opinions:
    One significant challenge in using BBNs is relying on professionals’ expertise and subjective judgment because of the scarcity of objective project-specific data for risk assessment during the project’s initial phase [36]. However, such judgment-based assessment is often biased, inconsistent, and imprecise [37]. To address the challenge, this research integrates fuzzy logic into the BBN to handle the vagueness or uncertainty in expert’s opinions when limited information is available. A hybrid approach combining fuzzy theory and a BBN has been widely employed in risk management research, yielding robust outcomes and gaining substantial attention from scholars [27,38,39].
    Failure to provide a suitable systematic method to determine the BBN structure:
    Another challenge in using a BBN is confirming the BBN structure with reality and project complexities [40]. To overcome this challenge, the Fuzzy DEMATEL-ISM method will be used to form the structure of the BBN.
    A lack of ability to reduce the elicitation workload to complete the parametric component of the BBN:
In BBNs, a large volume of information is required to complete the parametric part of the network, resulting in the BBN model’s inapplicability for real projects [41]. To address this challenge, the ranked node method (RNM) will complete the parametric part of the BBN and reduce the elicitation workload.
Finally, this study aims to propose the integration of 5D-BIM with a BBN in a novel attempt to provide a more reliable prediction of project cash flow using an automated approach. To achieve this, the key contributions of the study are as follows: the first fully integrated 5D-BIM and BBN framework for probabilistic cash flow prediction is developed and validated; a hybrid fuzzy DEMATEL-ISM procedure systematically constructs the BBN structure by mapping inter-related risk influences; fuzzy logic captures experts’ ambiguous judgments; and the RNM reduces elicitation workload.
The following sections detail the research method, present the results of applying the proposed 5D-BIM integrated with a BBN to a case study project, and offer concluding remarks.

2. Materials and Methods

This research integrates a BBN and 5D-BIM to introduce a new probabilistic cash flow analysis approach. In addition, a hybrid method combining fuzzy set theory, decision-making trial and evaluation laboratory (DEMATEL), and interpretive structural modeling (ISM) is developed to create the BBN structure. The flowchart diagram of the model proposed in this research is shown in Figure 1. According to Figure 1, the proposed model has two main components: analyzing cash flow using 5D-BIM and assessing risks using the BBN.
A 3D model of the project is created using Revit software (version 2023) to analyze cash flow using BIM. Then, the 5D-BIM model of the project is developed by integrating time and cost information into the 3D model. Finally, cash inflow and cash outflow are calculated. The risks affecting the project are first identified to assess project risks and calculate the probabilistic cash flow, considering uncertainties. The project’s risk network is then formed using the fuzzy DEMATEL-ISM method, and the impact of risks on project costs is evaluated using the BBN. The probability distribution functions for the cost over-runs of materials, equipment, workforce, and indirect costs are calculated, ultimately providing the project’s probabilistic cash flow.
In summary, the model proposed in this research combines a BBN-based risk assessment method with cash flow calculation based on the 5D-BIM model. The following describes the required steps and the method of combining the obtained results to calculate the probabilistic cash flow of the project:

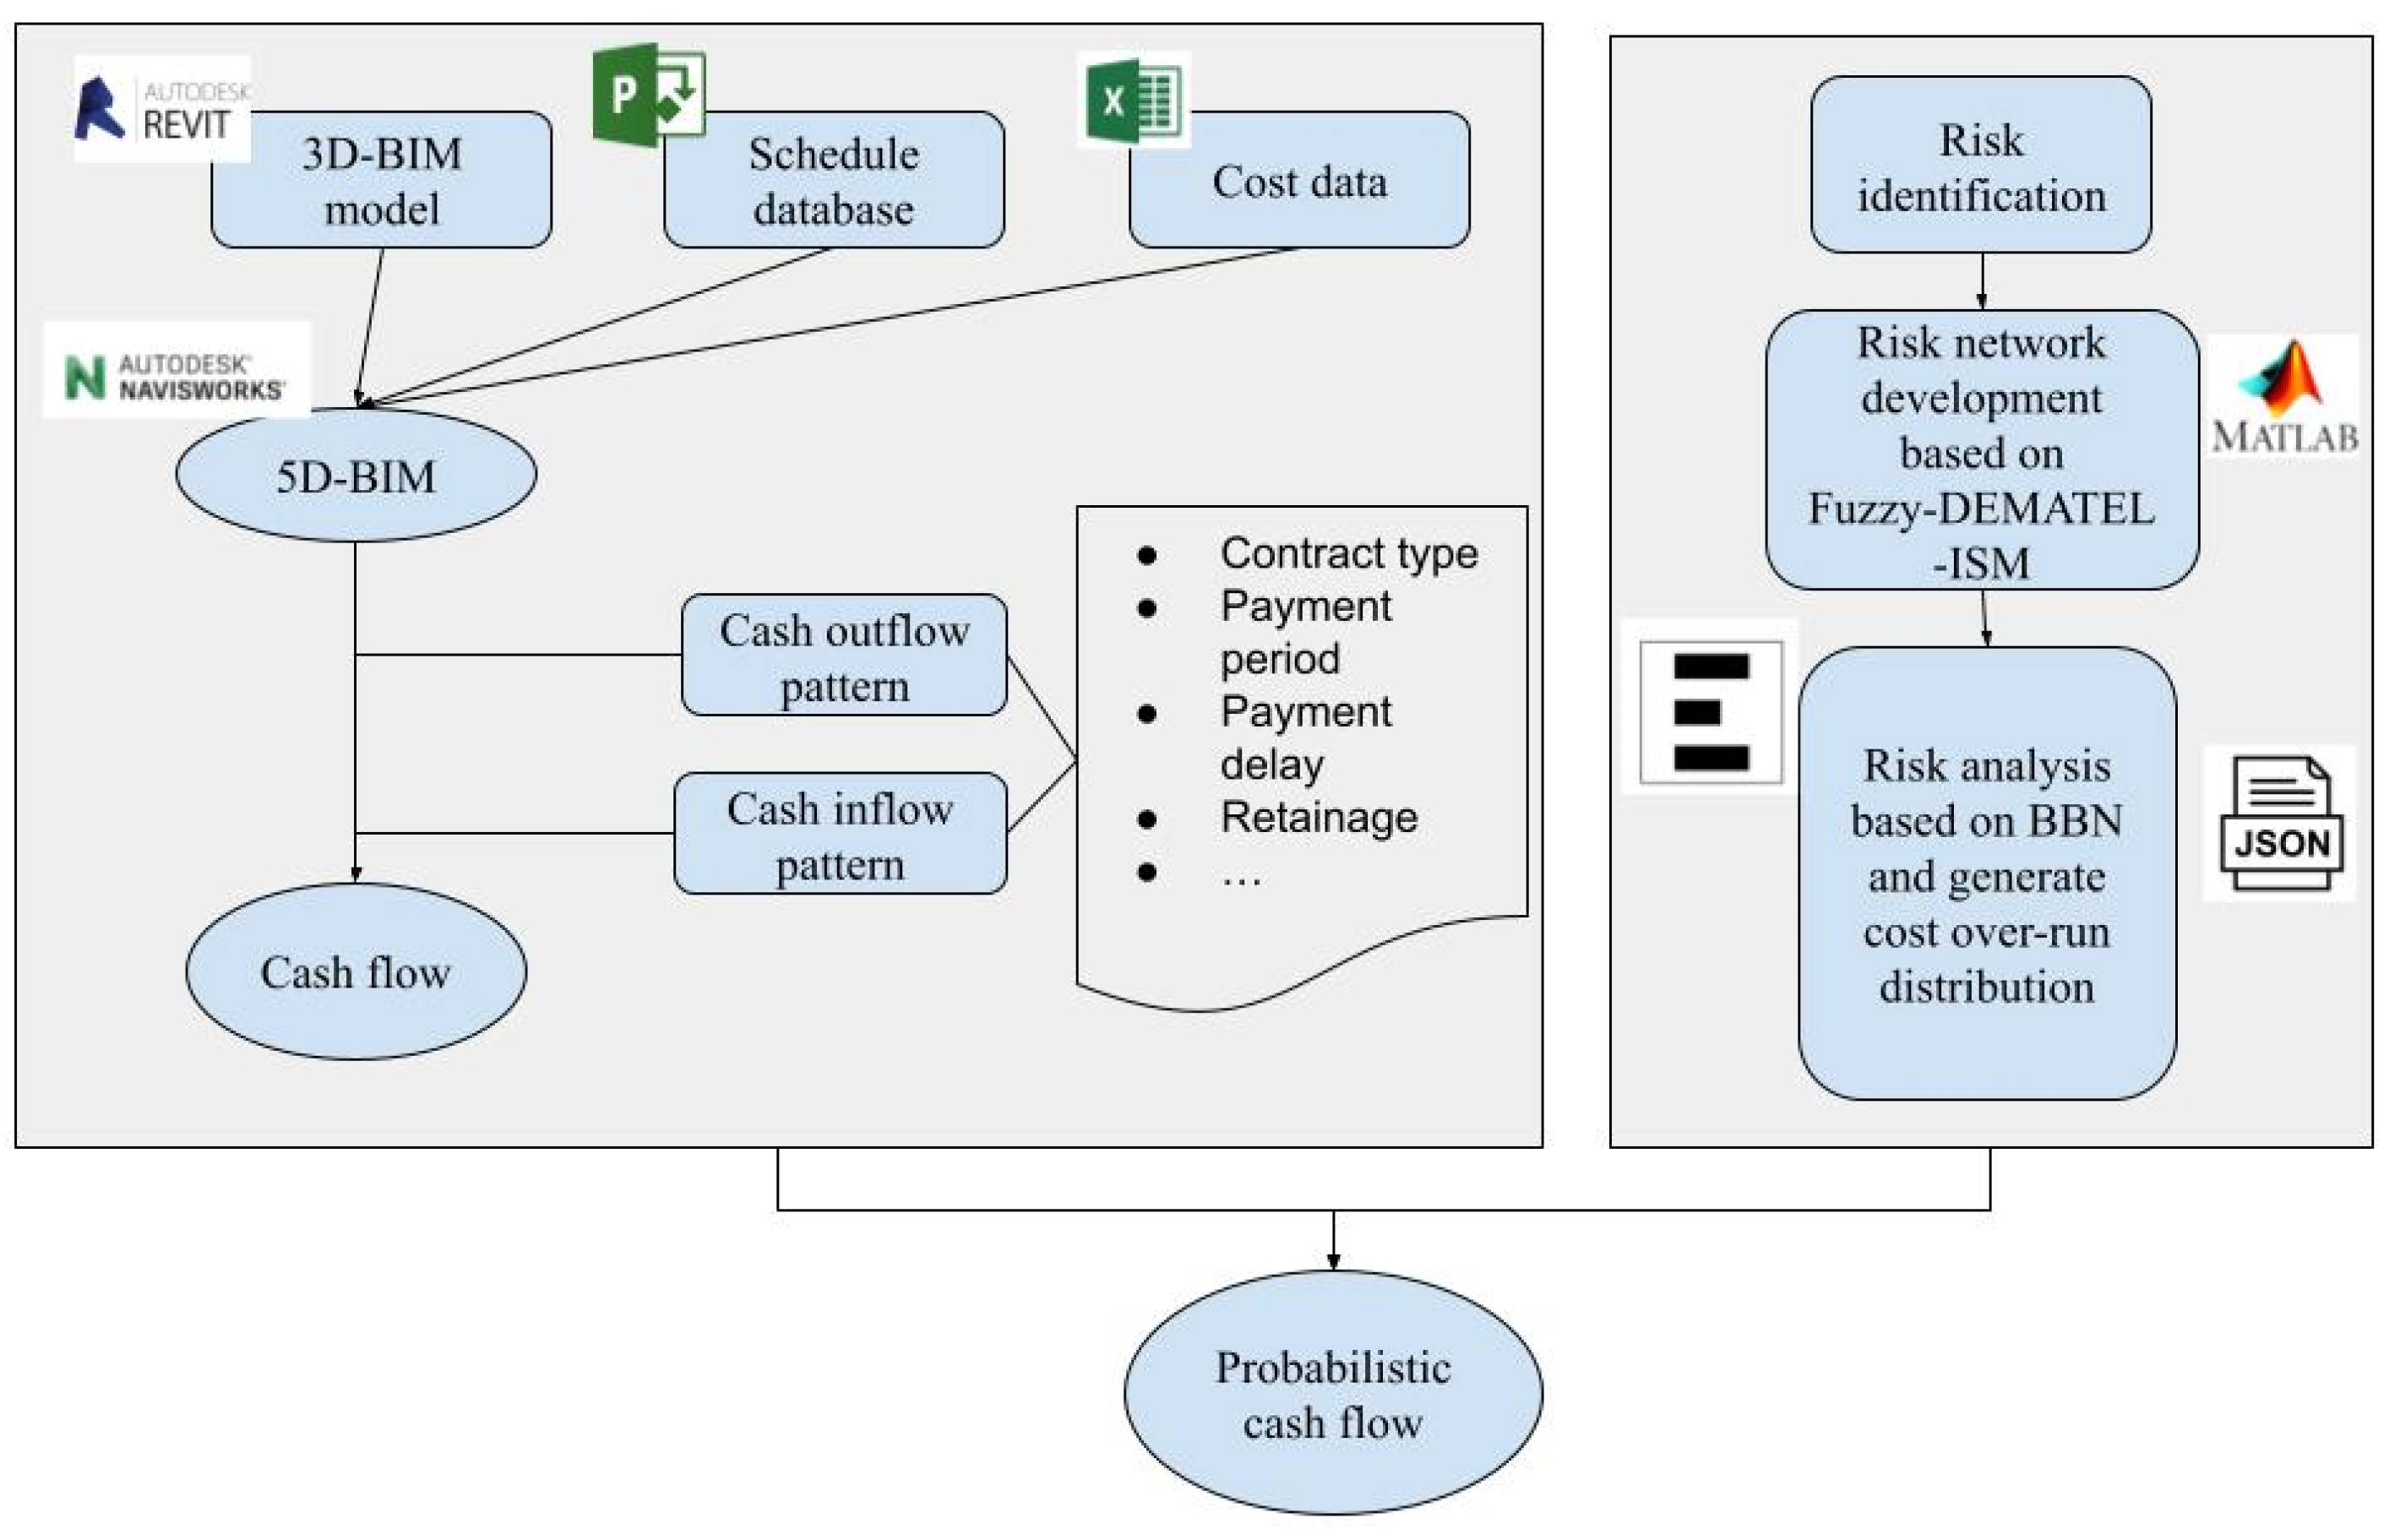
2.1. Cash Flow Analysis Using 5D-BIM

This section describes the step of cash flow calculation using 5D-BIM and analyzes the project cash inflow and outflow.

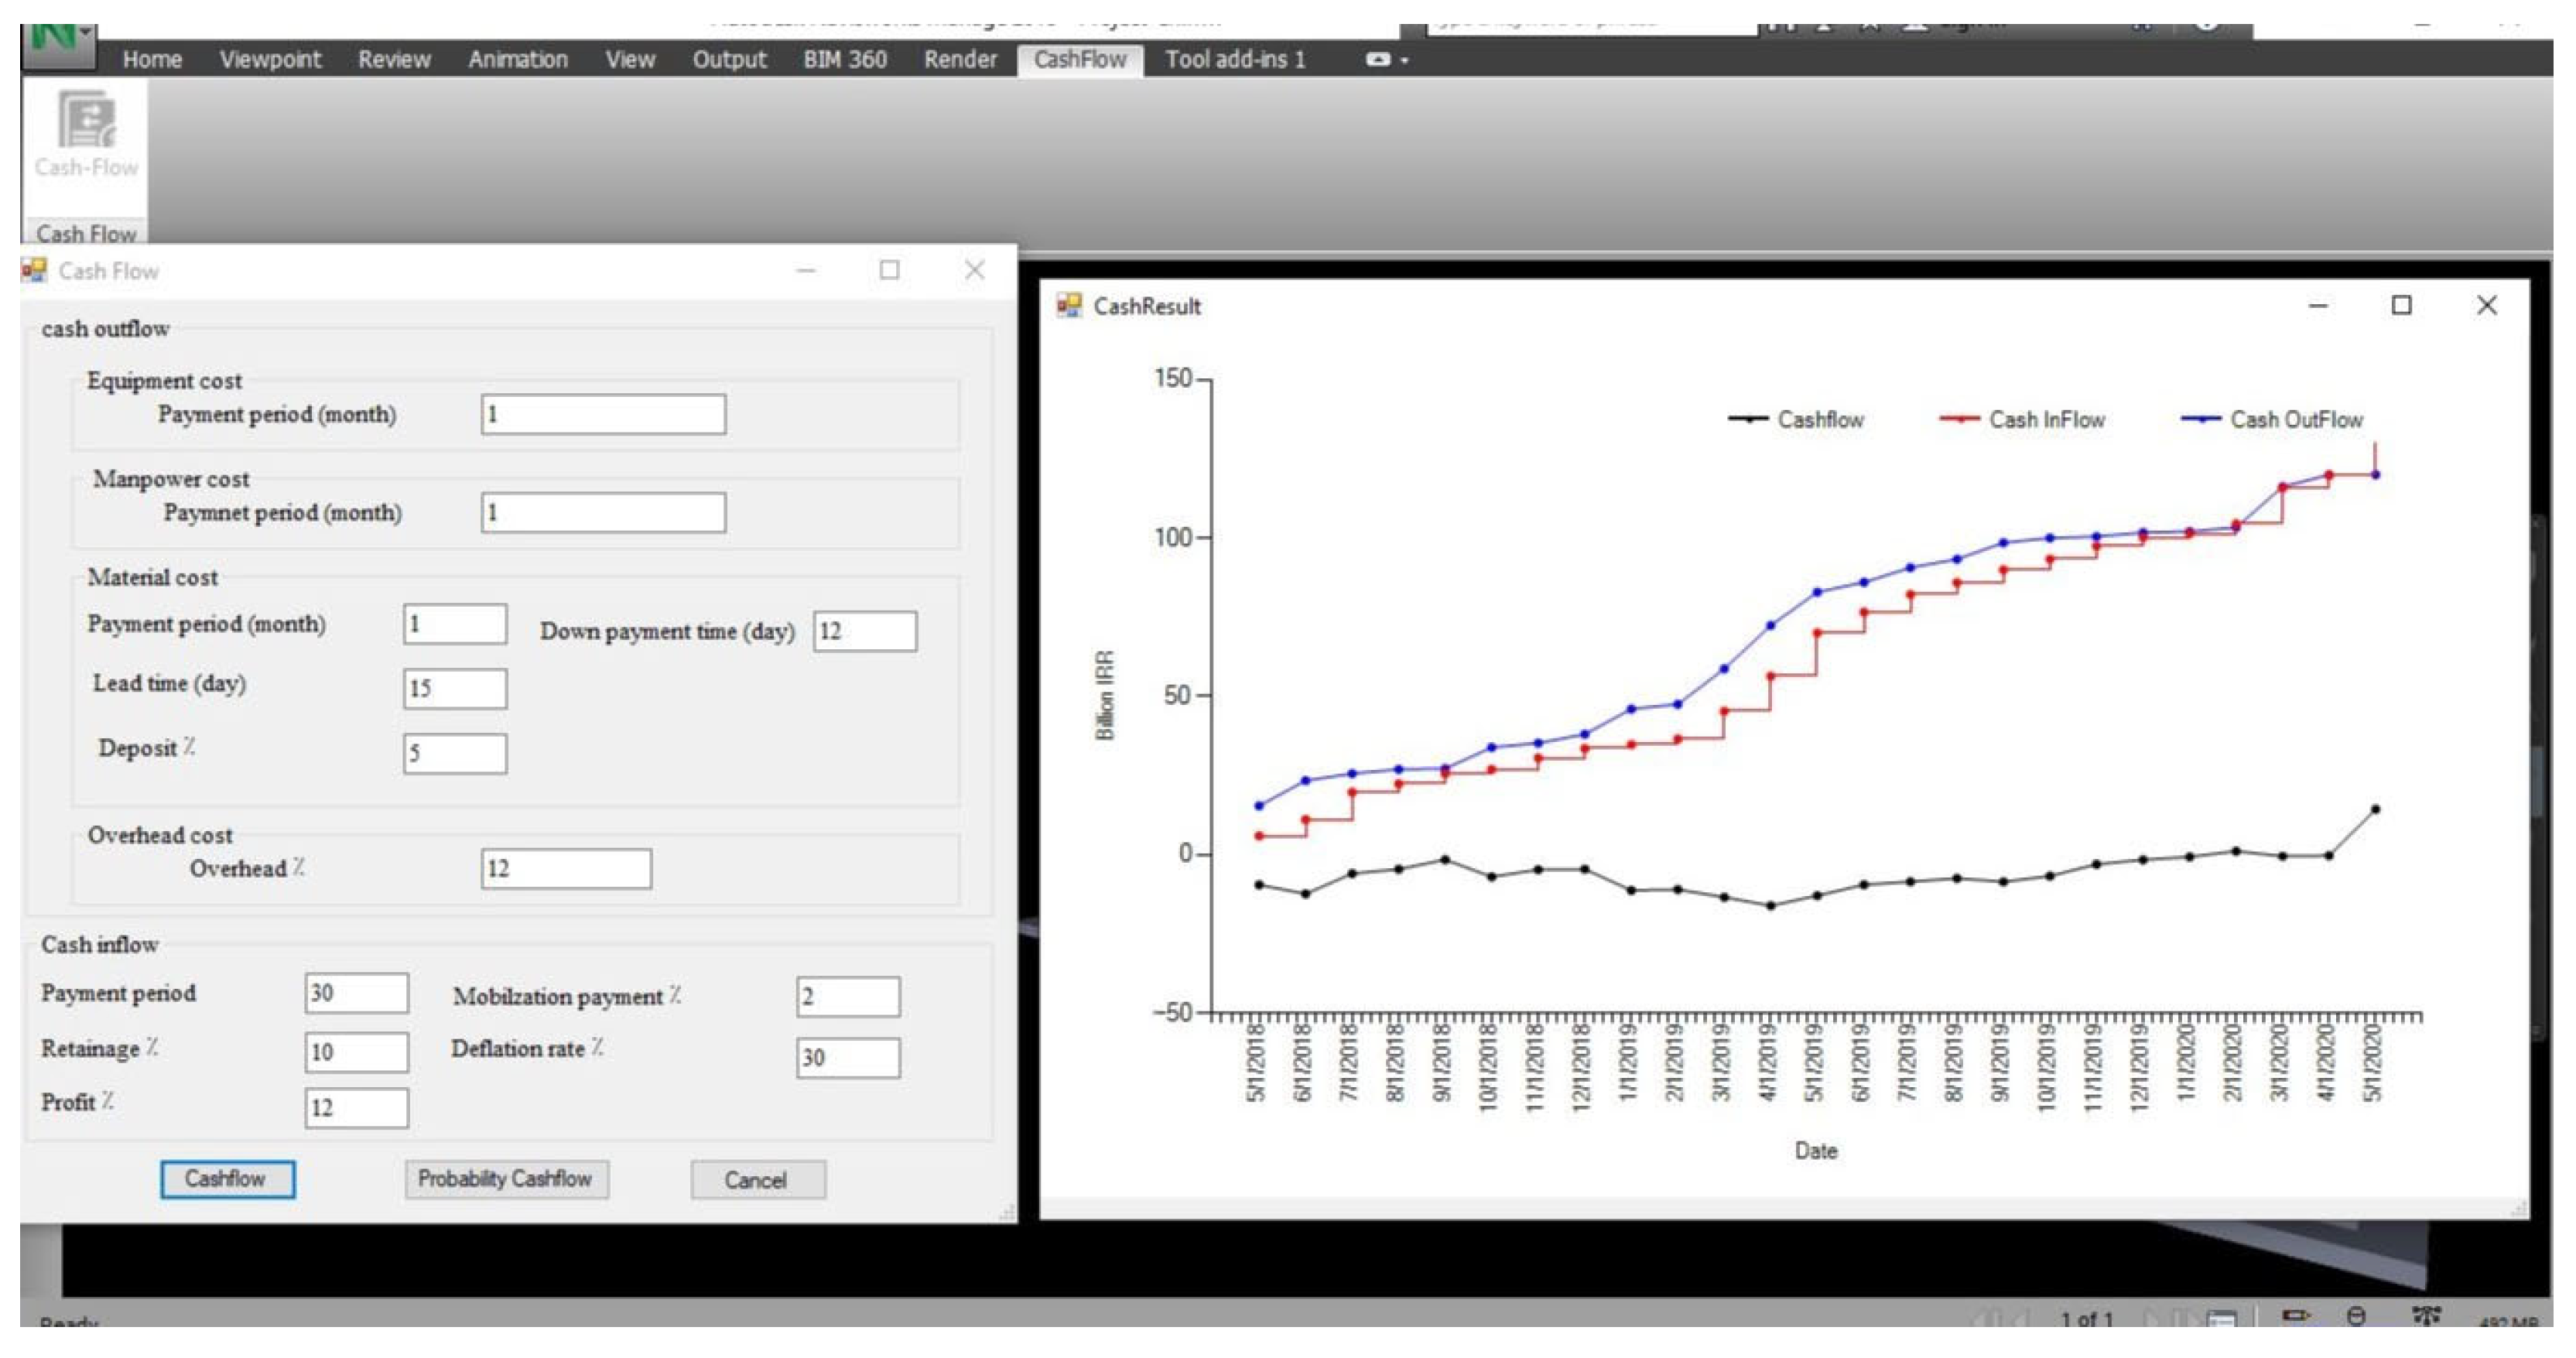
2.1.1. Preparation of 5D-BIM

BIM is a digital representation of a building’s product and process that contains information related to the project life cycle and facilitates data exchange and interoperability in digital format [42]. It can capture both geometric and non-geometric information. Establishing a smart connection between the information in a 3D-BIM model and the associated time and cost data results in a 5D model [1]. This enhanced model enables contractors to calculate project cash flow based on integrated data [43]. Accordingly, a 5D-BIM model of the project is created in this step. First, a 3D model is developed using Revit software (version 2023), CAD drawings (version 2022), and project information. Then, the model is transferred to Navisworks software (version 2018), where schedule and cost information are incorporated to form the 5D model.

2.1.2. Cash Flow Analysis

The project’s cash flow can be determined by analyzing patterns of cash inflow and outflow based on the contract type, legal terms, and payment schedule. A 5D-BIM model enables the calculation of cash inflows and outflows using quantity takeoff (QTO) data, project costs, and scheduling information [20]. In this study, cash flow calculations for unit price contracts were carried out following the methodologies proposed by Amin Ranjbar et al. and Lu et al. [1,20].
The cash inflow in unit price contracts is obtained by multiplying the quantity of work ( Q w ) performed by the price considered for each unit ( U P w ) , as shown in Equation (1), to determine the project’s cash flow in the contract period.
C I = w = 1 W Q w × U P w
Q w shows the quantity of work in the specified period, and U P w denotes the unit price of the work carried out, which includes the cost of materials ( C O w M T ) , equipment ( C O w E Q ) , workforces ( C O w M P ) , and a percentage of the contractor’s profit ( P % ) from doing the work based on Equation (2).
U P w = C O w E Q + C O w M T + C O w M P Q w × 1 + P %
Cash outflow Equation (3) includes the total cost of the workforce ( C O m W F ) , materials ( C O m M T ) , equipment ( C O m E Q ) , and indirect costs ( C O m I N ) .
C O = m = 1 M ( C O m E Q + C O m M T + C O m W F + C O m I N )
Readers can refer to Amin Ranjbar et al.’s research [20] for more details about calculating the cash outflow related to equipment, materials, workforces, indirect costs, and payment patterns.

2.2. Risk Assessment Using BBN

This section describes how the existing risks are quantified using the BBN to calculate the probabilistic cash flow of the project. The BBN allows for the estimation of a child node’s probability from its parent node using Bayes’ theorem:
P X A = P A X P ( X ) P ( A )
Here, P(X|A) is the conditional probability of X given A, while P(A) and P(X) represent the prior probabilities of events A and X. A Bayesian network can be represented as:
N = {(X, E), P}
where X represents the set of nodes, E stands for the directed acyclic graph (DAG) that captures the relationships between the variables, and P is the set of the corresponding conditional distributions of the nodes.
Given that a node X will have n parent nodes, the parents are considered conditionally independent. Thus, the node X’s conditional probability given the parents Pa(X) may be represented as:
P X 1 , X 2 , , X n = i = 1 n P ( X i P a r e n t ( X i ) )
This section has three main steps: risk identification, project risk network development, and BBN risk analysis (Figure 1). The output of this section would be the probability distribution function of cost over-runs related to materials, equipment, workforces, and indirect costs. Details related to each step are described below.

2.2.1. Risk Identification

First, the risks affecting project cost over-runs are identified to assess their impact on cash flow. In the case study project described in Section 3, a combination of a literature review and expert judgment was used. Information collected from the existing literature helped establish a preliminary inventory of potential risks. These risks were then examined in a focus group with experts from the mass housing project, who added additional risks to the initial list. Finally, the complete list of risk factors was compiled.

2.2.2. Risk Network Development

After identifying the risks, a hybrid approach combining fuzzy set theory, DEMATEL, and ISM was used to develop the project risk network. Researchers have previously employed a combination of DEMATEL and ISM [40,44] to explore the inter-relation among various risk factors and their hierarchical structure for portraying the BBN structure. This approach efficiently identifies links between risk factors in terms of cause and effect. While DEMATEL uses expert knowledge to map cause-and-effect relationships, it cannot determine hierarchical structures. To address this limitation, combining ISM with DEMATEL is recommended [45]. However, DEMATEL-ISM still has the limitation of not accounting for uncertainties in expert judgment. In other words, DEMATEL-ISM cannot handle the vagueness in experts’ linguistic expressions during decision making [44,46]. In the current study, we integrate fuzzy set theory with the DEMATEL approach to overcome the limitations associated with imprecision and vagueness in language phrases.
Fuzzy DEMATEL calculations will be performed in seven steps, beginning with the following: (1) evaluating risk factor inter-relations; (2) transforming the verbal phrases into triangular fuzzy numbers; and (3) defuzzifying the direct-influence fuzzy matrices.
The following method was employed for converting fuzzy numbers into crisp scores [39]. First, the triangular fuzzy numbers (l, m, r) in direct-influence fuzzy matrices are standardized using Equations (6)–(8). K represents the quantified judgments of the kth expert about the degree to which risk i has a direct impact on risk j.
x l i j k = l i j k m i n 1 k K   l i j k Δ m i n m a x
x m i j k = m i j k m i n 1 k K   m i j k Δ m i n m a x
x r i j k = r i j k m i n 1 k K   r i j k Δ m i n m a x
where
Δ m i n m a x = m a x 1 k K   r i j k m i n 1 k K   l i j k
After calculating the left and right normalized values using Equations (10) and (11), the total normalized value can be computed with Equation (12).
x l s i j k = x m i j k 1 + x m i j k x l i j k
x r s i j k = x r i j k 1 + x r i j k x m i j k
x i j k = x l s i j k 1 x l s i j k + x r s i j k x r s i j k 1 x l s i j k + x r s i j k
The crisp values of the kth expert’s judgments of the interaction between two risks can be calculated with Equation (13).
a i j k = m i n 1 k k   l i j k + x i j k Δ m i n m a x
We continue with step (4): determining the direct influence matrix.
Finally, the integrated crisp values can be obtained by averaging the crisp values of all expert’s judgments, which is shown in Equation (14).
z i j = 1 k k = 1 k   a i j k
Since aij indicates the direct impact of factor i on factor j, the direct influence matrix Z is constructed as:
Z = z 11 z 12 z 1 n z 21 z 22 z 2 n z n 1 z n 2 z n n
The final steps are as follows: (5) normalizing the direct influence matrix and determining the comprehensive direct influence matrix; (6) measuring the degrees of influencing, being influenced, centrality, and causality for each factor; and (7) representing the cause-and-effect links between risk factors. These steps are explicitly explained by Cheng et al. [39]. The ISM approach is adopted to create a hierarchical structure of risks and to investigate the transmission pathways between risk factors based on the comprehensive influence matrix generated by DEMATEL. The ISM analysis is conducted in three main steps: (1) establishing the overall influence matrix, (2) creating the reachability matrix, and (3) dividing the hierarchy of risk factors [39]. The results from the fuzzy DEMATEL analysis, which determines the interactions between components, and the hierarchical structure derived from the ISM analysis are combined to create the BBN structure.

2.2.3. Risk Analysis Using BBN

The BBN will assess project cost vulnerabilities and is a suitable method for modelling the complex interactions between risk elements. Risk analysis using a BBN has two main steps: (1) forming the Bayesian network structure, which is drawn using the output of the relationships between risk factors and the hierarchy between factors from the fuzzy DEMATEL-ISM method, and (2) completing the parametric part of the Bayesian network, which is explained below.
The BBN’s parametric and quantitative aspects involve determining each node’s probability distributions based on the states of its influencing nodes, often referred to as ’parent’ nodes. The number of questions needed to complete CPTs will grow exponentially as the number of parents increases. Hence, reducing the amount of data required from experts and determining suitable methods for extracting these data are crucial components of working with BBNs [41,47]. This study constructed CPTs using the Ranked Nodes Method (RNM) [47]. The RNM requires less data than other methods for creating a BBN [48]. The fuzzy data from the fuzzy DEMATEL-ISM section re utilized to complete the parametric part of the BBN using the RNM. Fuzzy logic helps address vagueness and uncertainty in expert opinions. Ultimately, the BBN determines the probability distributions for project cost over-run, which can vary based on different scenarios and inform probabilistic cash flow calculations. Subsequently, to analyze the impact of risk factors on project cash flow, the variable R m i is calculated based on the probabilistic distributions of cost over-run for various cost items, including workforce, materials, equipment, and indirect costs, as defined in Equation (16). The fractions in this Equation represent the weight of each monthly cost item, which are extracted from the BIM model. The variable ri refers to the cost over-run associated with each cost item, while i denotes the iteration number.
R m i = C O m E Q C O m × r i E Q + C O m M T C O m × r i M T + C O m W F C O m × r i W F + C O m I N C O m × r i I N

2.3. Integrating 5D-BIM and BBN Models

After completing cash flow analysis using 5D-BIM and the risk assessment model using the BBN, they are integrated to calculate the probabilistic cash flow of the project. At this stage, information about the probability distributions of cost over-runs for materials, equipment, workforce, and indirect costs is extracted from AgenaRisk software (version 10) through a JSON format output. This information is then used as input for a plugin developed for Navisworks software (version 2018). The data are updated automatically whenever the project’s risk network information is updated. Subsequently, the proposed integrated 5D-BIM–BBN model is implemented on a real project. The project’s probabilistic cash flow is calculated using random numbers generated based on the probability distributions of cost items obtained from the BBN and the cash flow information available in the 5D-BIM. This process is carried out using the plugin developed in Navisworks. The equation below formulates how the BBN and BIM outputs are integrated to calculate probabilistic cash flows. C F m is the project cash flow without considering the impact of risks for month m, which is calculated using BIM. R m i is a random number that is extracted from the Bayesian network of the project based on the probability distribution of the cost over-run in each iteration (i). The product of these two numbers at each iteration gives a probable cash flow. By performing different iterations, the probabilistic cash flow of the project is calculated based on this method.
P r o b a b i l i s t i c   C F = m = 1 M ( C F m × R m i )

2.4. Source of Expert and Information

BIM modeling uses data from a real-world project to collect the information required to implement the presented framework, as detailed in Section 3. Five experts were selected to collect the opinions of experts for the Fuzzy DEMATEL-ISM method and BBN, as explained in Section 2. These experts were selected based on the following criteria: (1) work experience related to the case study project to ensure their familiarity with the risks and their impact on the project objectives, (2) more than 15 years of relevant work experience and a senior practitioner, and (3) having a relevant university degree or equivalent knowledge. Finally, the characteristics of the selected experts can be seen in Table 1.

3. Results

The proposed method integrating 5D-BIM and a BBN was applied in a housing project in Iran to assess its applicability and performance. The case study project involves a mass housing development project with 16,080 residential units. Each building is five stories high, containing eight units per floor, totaling 40 units per building. The contract type is a unit price contract. This project is supposed to be built with an estimated cost of IRR 120 billion and is expected to be completed within 24 months. The following steps apply the suggested model and assess the project’s probabilistic cash flow while considering the complicated and interconnected structure of risk factors.

3.1. Cash Flow Analysis Using 5D-BIM for the Case Study Project

In this stage, the project’s cash flow is calculated based on the collected information using the 5D-BIM.

3.1.1. Preparation of 5D-BIM for the Mass Housing Project

First, a 5D-BIM model of the project was developed to calculate the cash flow. The 3D model was created using Revit software (version 2023) and then transferred to Navisworks to implement the intended framework. In Navisworks, project planning and cost information were added to the model to create a complete 5D representation, as illustrated in Figure 2.

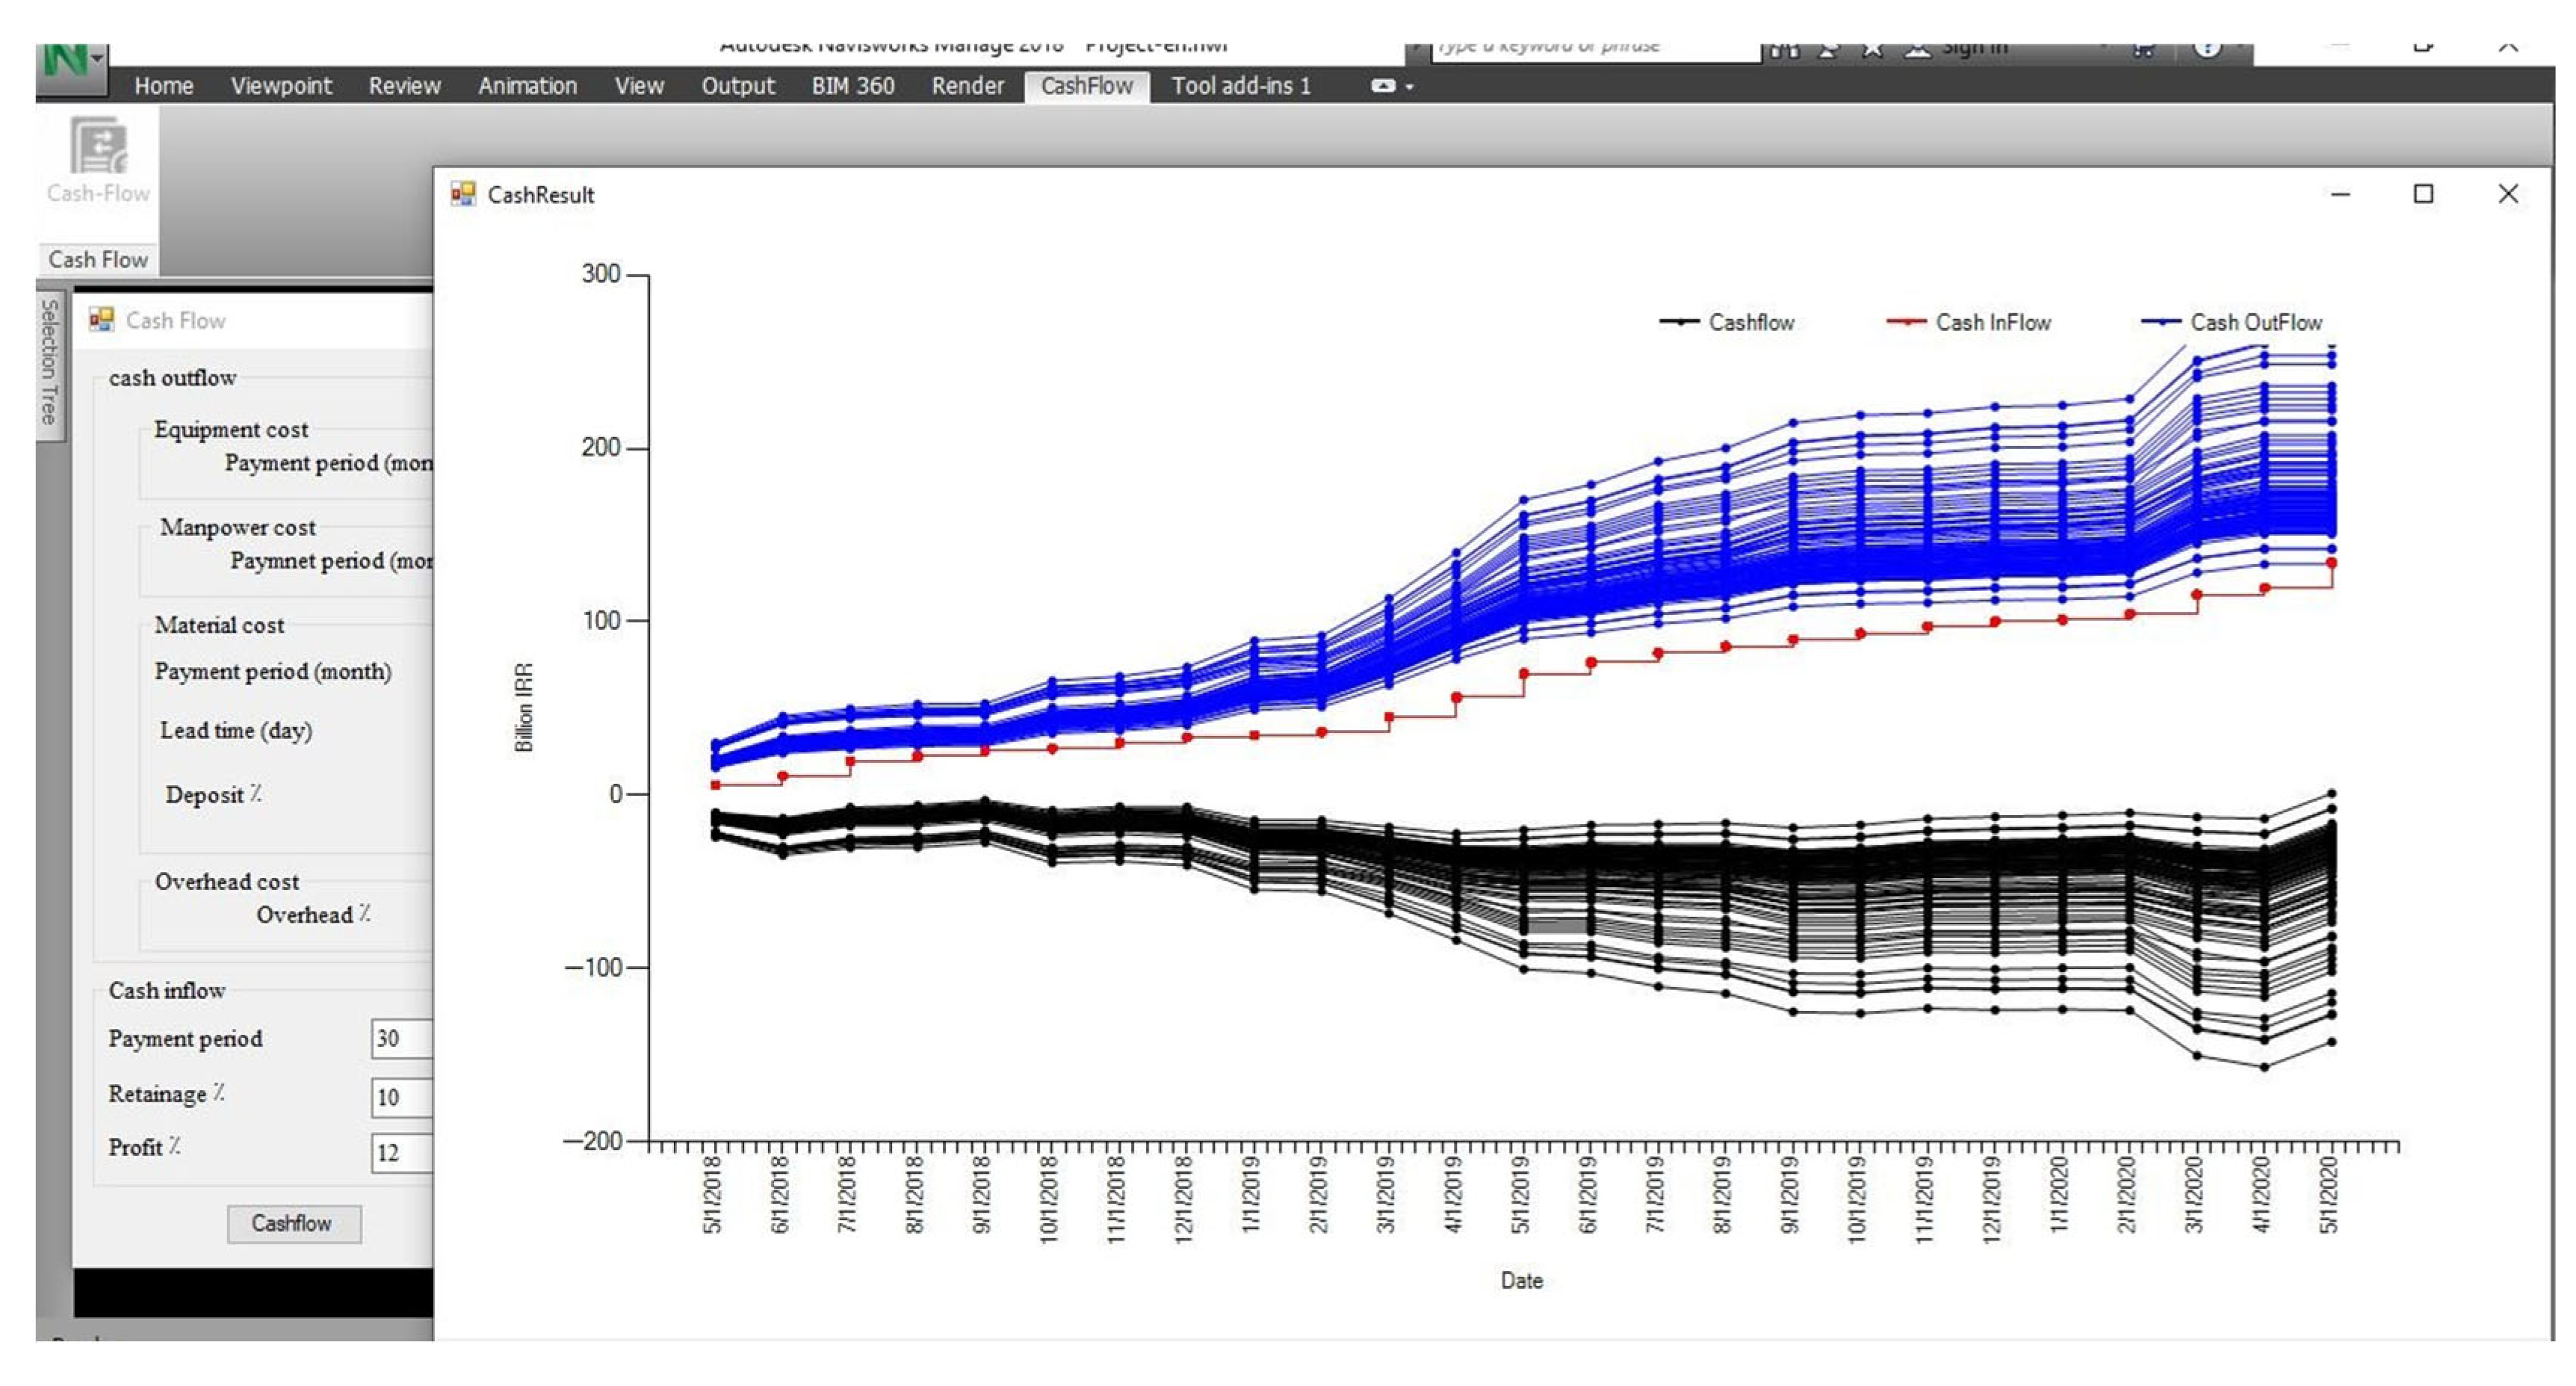
3.1.2. Cash Flow Analysis for the Mass Housing Project

Using the 5D-BIM model, the project’s cash inflow, cash outflow, and, consequently, the overall cash flow were calculated. To facilitate this process, a plugin was developed and integrated into Navisworks software (version 2018)using an API (Application Programming Interface) to automate cash flow calculations. Based on information from the project’s quantity takeoff, cost estimates, project schedule, and additional user-provided data, the plugin calculates and displays the cash inflow, cash outflow, and net cash flow of the project, as shown in Figure 3.
The cash inflow and outflow analysis showed that the project’s final cost and income were IRR 120 billion (BR) and 134.4 BR, respectively. These amounts are reported in BR to better account for the effects of major risks, such as inflation, in the probabilistic cash flow calculations. These values are calculated without considering the impact of risk factors. The contractor would need to rely on overdraft facilities to address monthly shortfalls between cash inflow and cash outflow. In the final month, the cash flow recorded a positive value of 14.4 BR, reflecting the contractor’s profit at project completion (Figure 3).

3.2. Risk Assessment Using a BBN for the Case Study Project

This section introduces the identified risks associated with the case study project. It then presents the calculations that form the risk network structure and the BBN risk analysis results.

3.2.1. Risk Identification Results

For the cast study project, a preliminary list of risks influencing the project was prepared by conducting a literature review. This list was thoroughly deliberated in a focus group to identify the most significant risk factors. This group consisted of five experts whose characteristics are described in Section 2.4 of the methodology. The literature-derived risk list was presented to the participants during the meeting, where each risk was examined individually. As a result of these discussions, some risk factors were removed, some extra risks were included, and the initial classification was modified based on expert opinions. In total, 31 risks were detected, as detailed in Table 2.

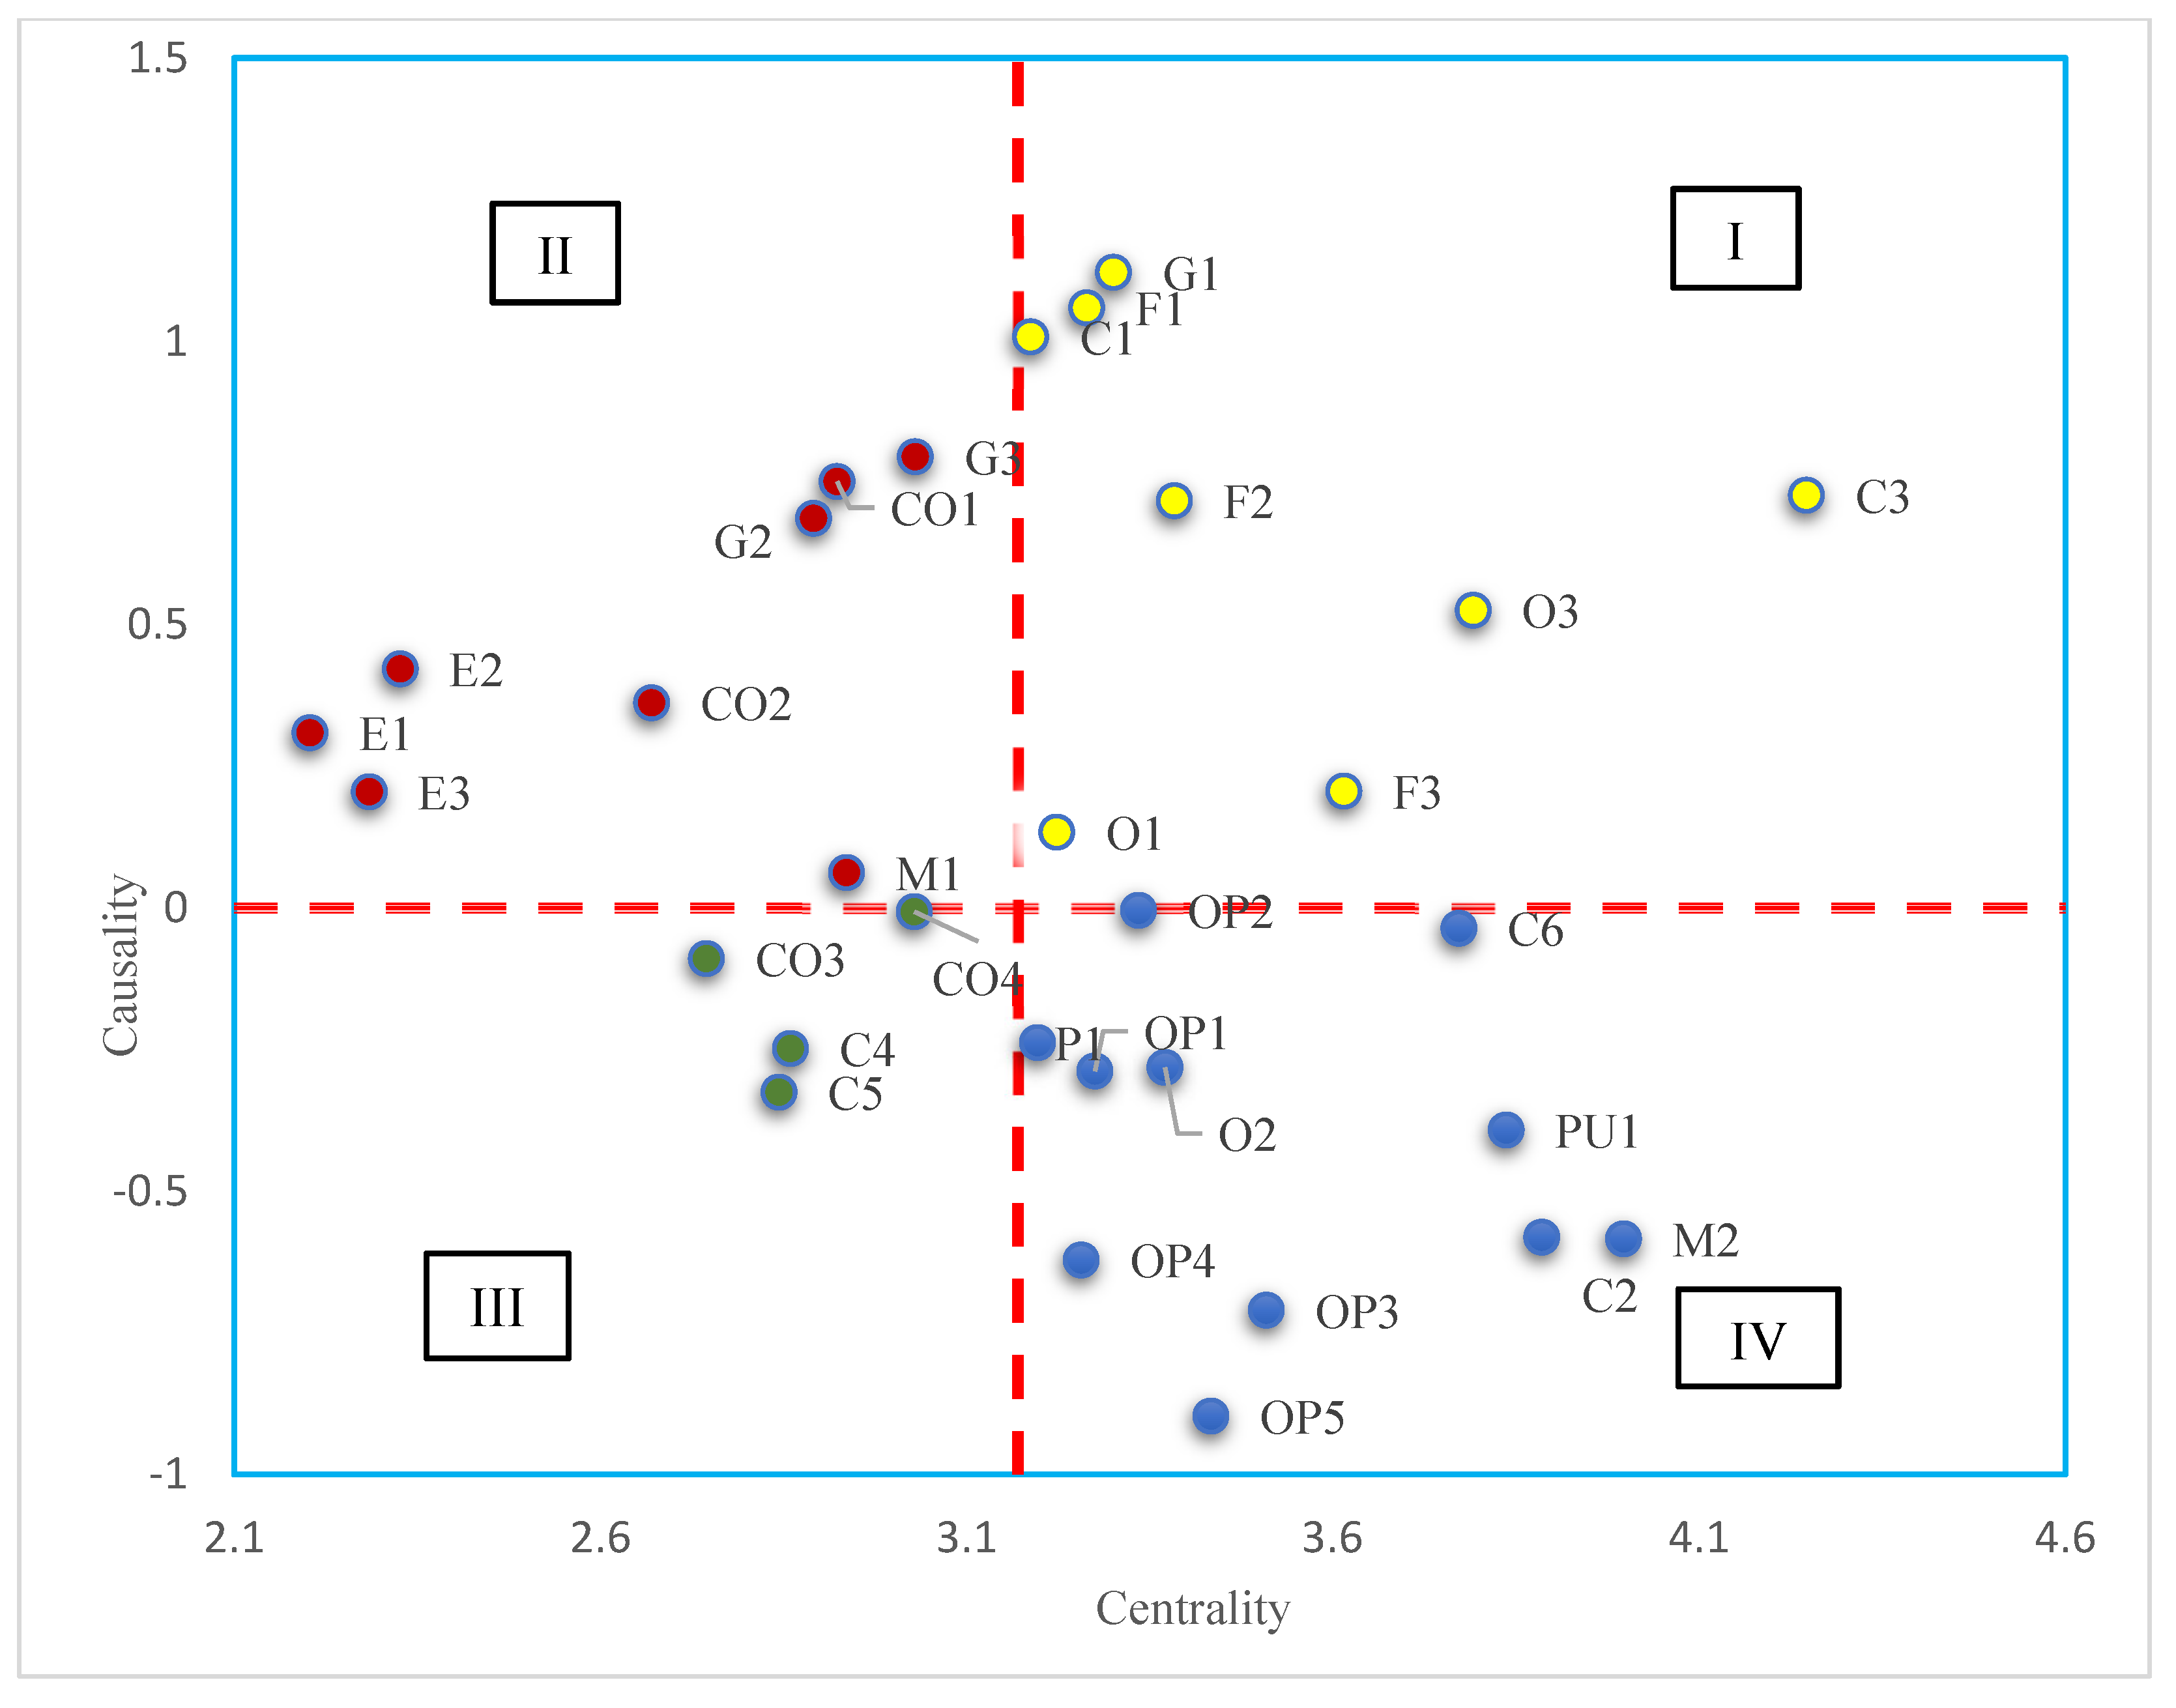
3.2.2. Risk Network Development Result

As outlined in Section 2.2.2, the risk network for the project is developed in two steps. First, the fuzzy DEMATEL approach is used to establish causal connections between risks. The ISM technique is implemented to construct a hierarchical structure of risks based on the total influence matrix derived using DEMATEL.
To apply fuzzy DEMATEL, an initial 35 × 35 matrix was constructed. The first rows and columns of the matrix represent 31 risk factors (as listed in Table 2) along with four cost items: material cost over-run (MCR), equipment cost over-run (ECR), workforce cost over-run (WCR), and indirect cost over-run (ICR). In-person interviews were conducted to populate this matrix with input from a team of five experts, whose profiles are described in Section 2.4 of the methodology. During the meetings, the experts individually assessed the impact of each factor. Linguistic expressions from Table 3 were used to specify the level of impact while accounting for uncertainties. Fuzzy numbers corresponding to each linguistic term were then used to convert these qualitative assessments into numerical values, addressing the inherent ambiguity of linguistic terminology [49,50].
Then, metrics such as degrees of influencing, being influenced, centrality, and causality were computed. The analysis findings obtained using the fuzzy DEMATEL approach are displayed in Figure 4. As illustrated, centrality denotes the significance and dominance of a component, while causality displays its influence on other elements. Based on the position of the factors within the influence diagram, the factors identified are classified into the following four categories: Category I: Key Influencers (Tangled Givers)—factors of high influence and high importance; Category II: Driving Factors—factors that have significant influence on others while being under the influence of very few factors of themselves; Category III: Independent Factors—factors of low influence and lower importance, largely independent of the system; and Category IV: Impacted Factors (Receivers)—factors under the significant influence of the other factors while having very minimal influence of themselves.
The ISM method is subsequently employed to construct a hierarchical structure of risk factors. The ISM output shown in Table 4 reveals the level of risk factors across ten categories.

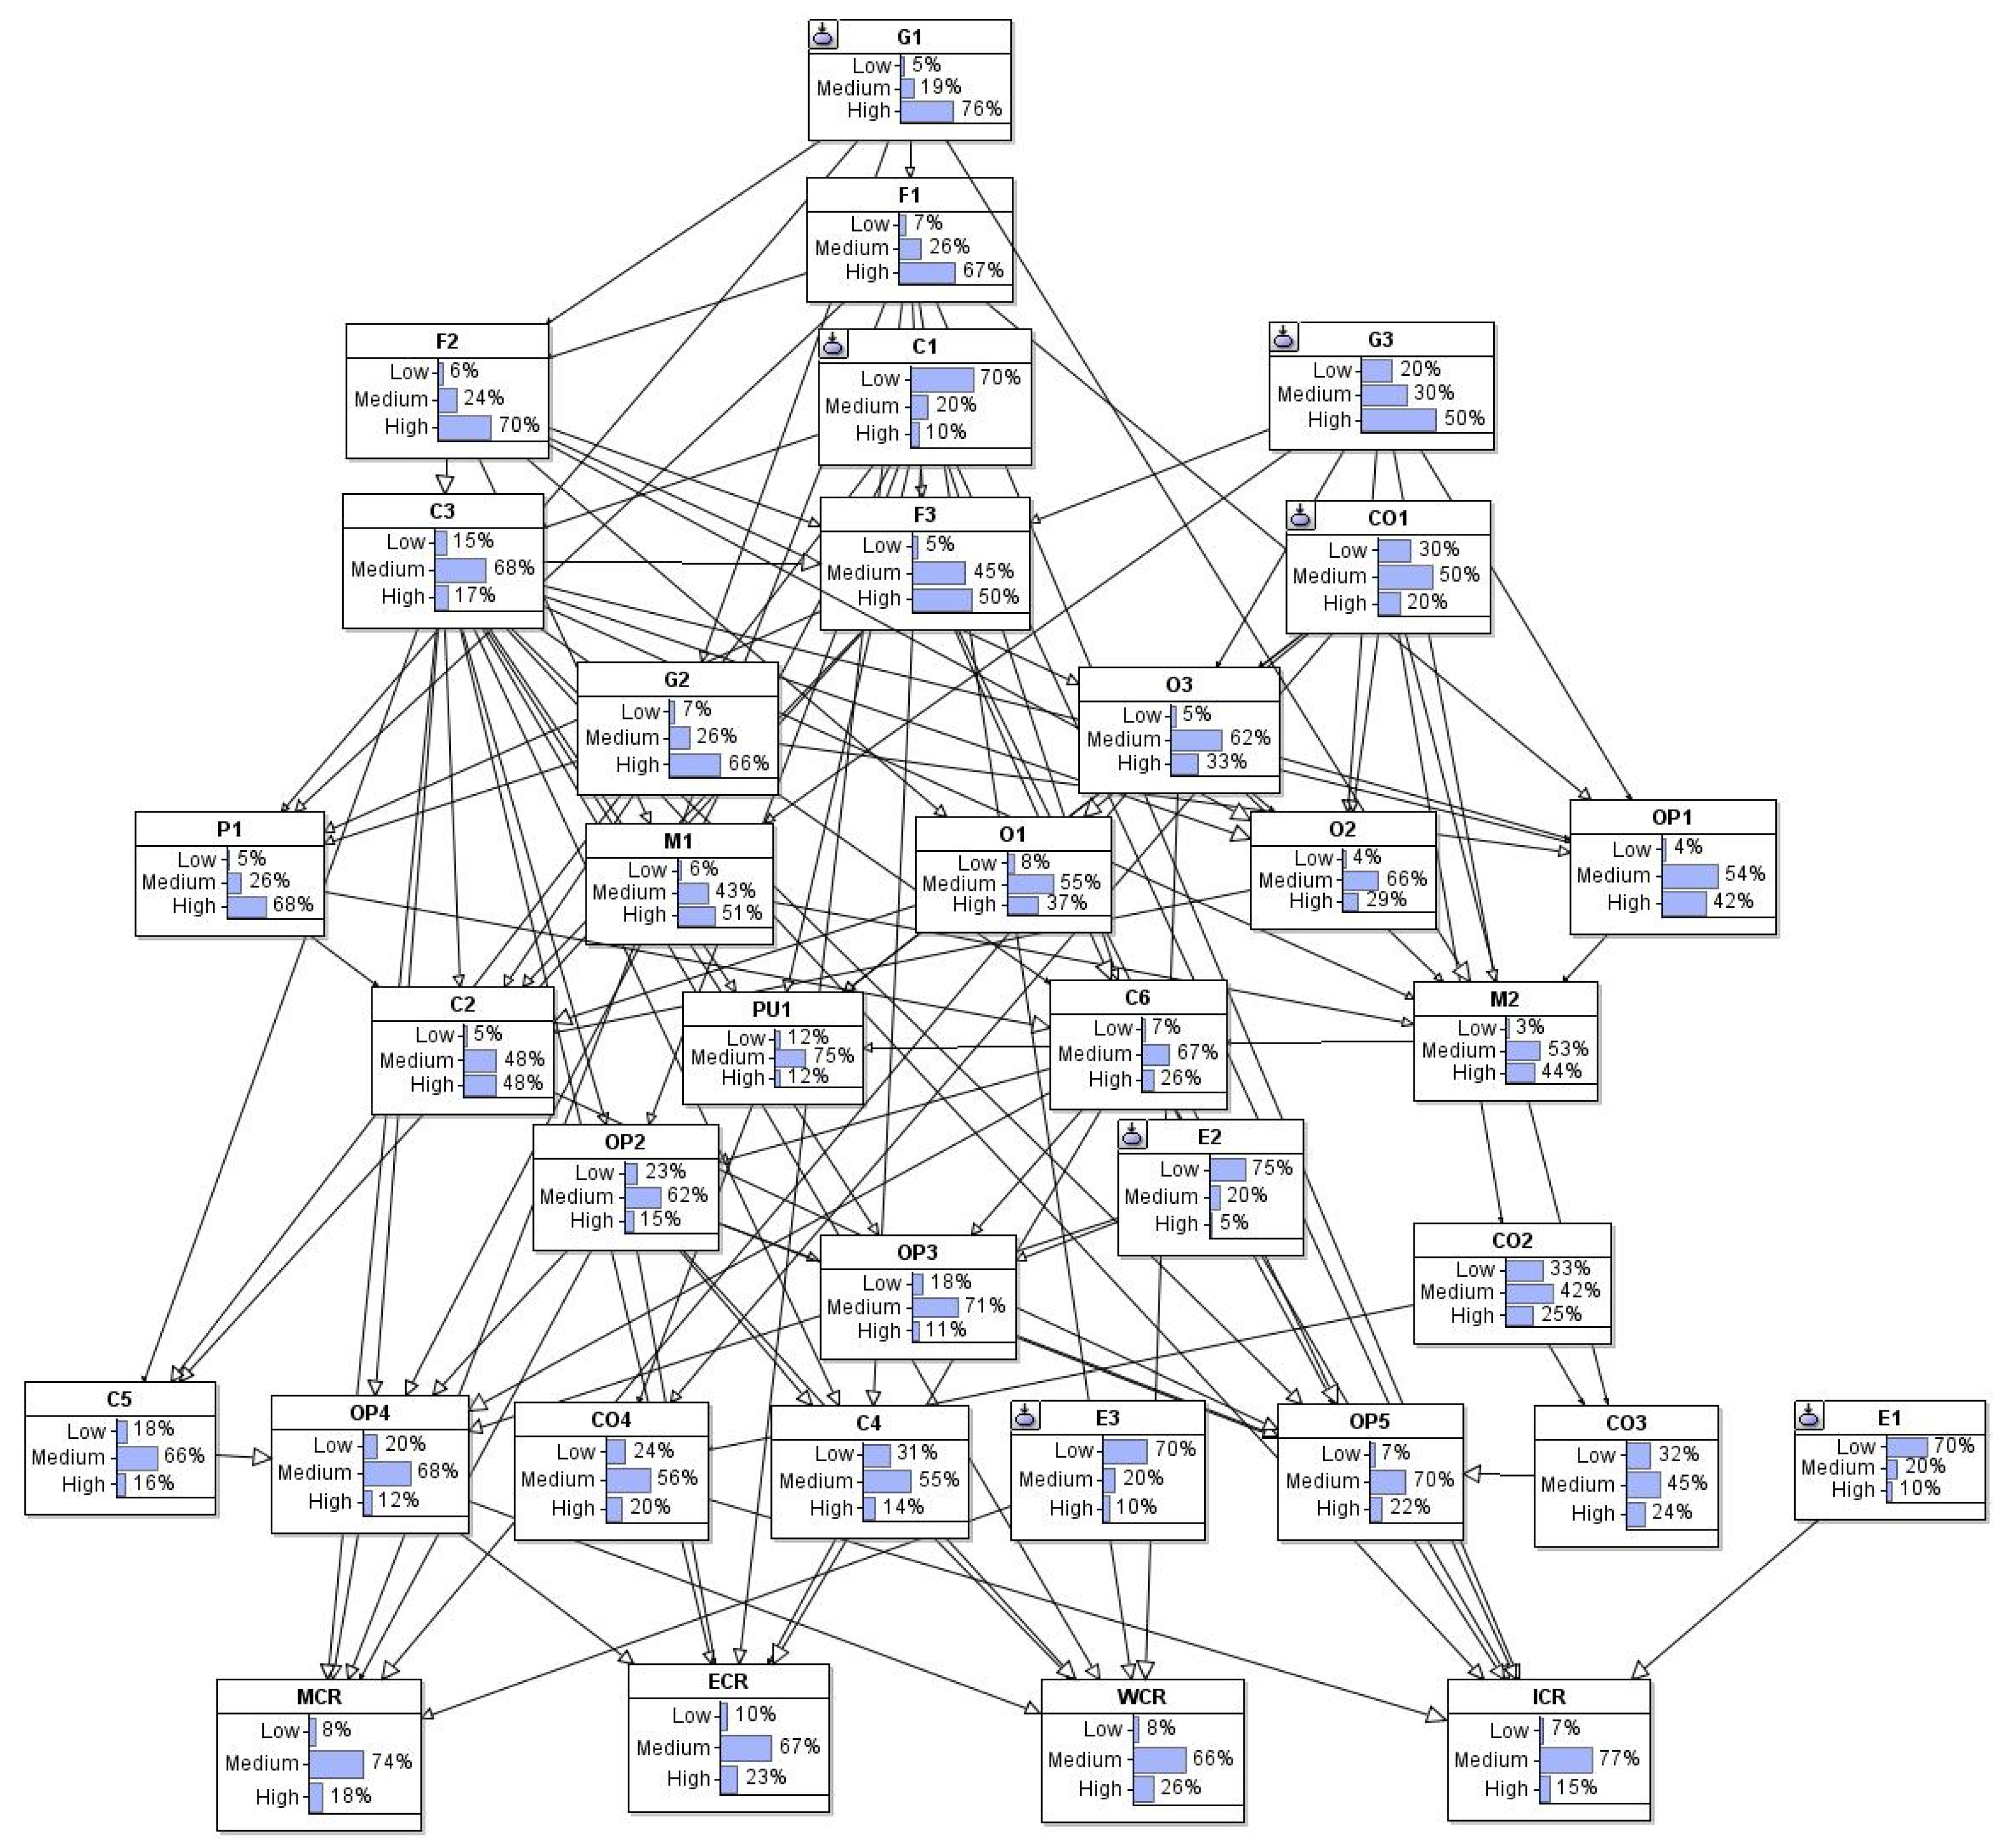
3.2.3. Risk Analysis Results Using BBN

The BBN was implemented using Agenarisk software (version 10), considering the results obtained from the preceding phases. The resulting BBN is depicted in Figure 5. The final BBN comprised seven nodes (G1, C1, G3, E1, CO1, E3, and E2) that lacked a parent. The probabilities of these nodes were determined during a focus group, as illustrated in Figure 5. Unlike binary or yes/no variables, each node was defined in low, medium, and high states. Based on insights from project experts, these states correspond to values shown in Table 5. The experts considering project circumstances and their prior experience with cost over-runs in comparable projects determine the values. Evaluations are conducted for one year in the project.
As outlined in the methodology section, the CPTs were completed using the RNM, and the model was prepared to run and check the results.

3.3. Result of Integrating 5D-BIM and BBN Models
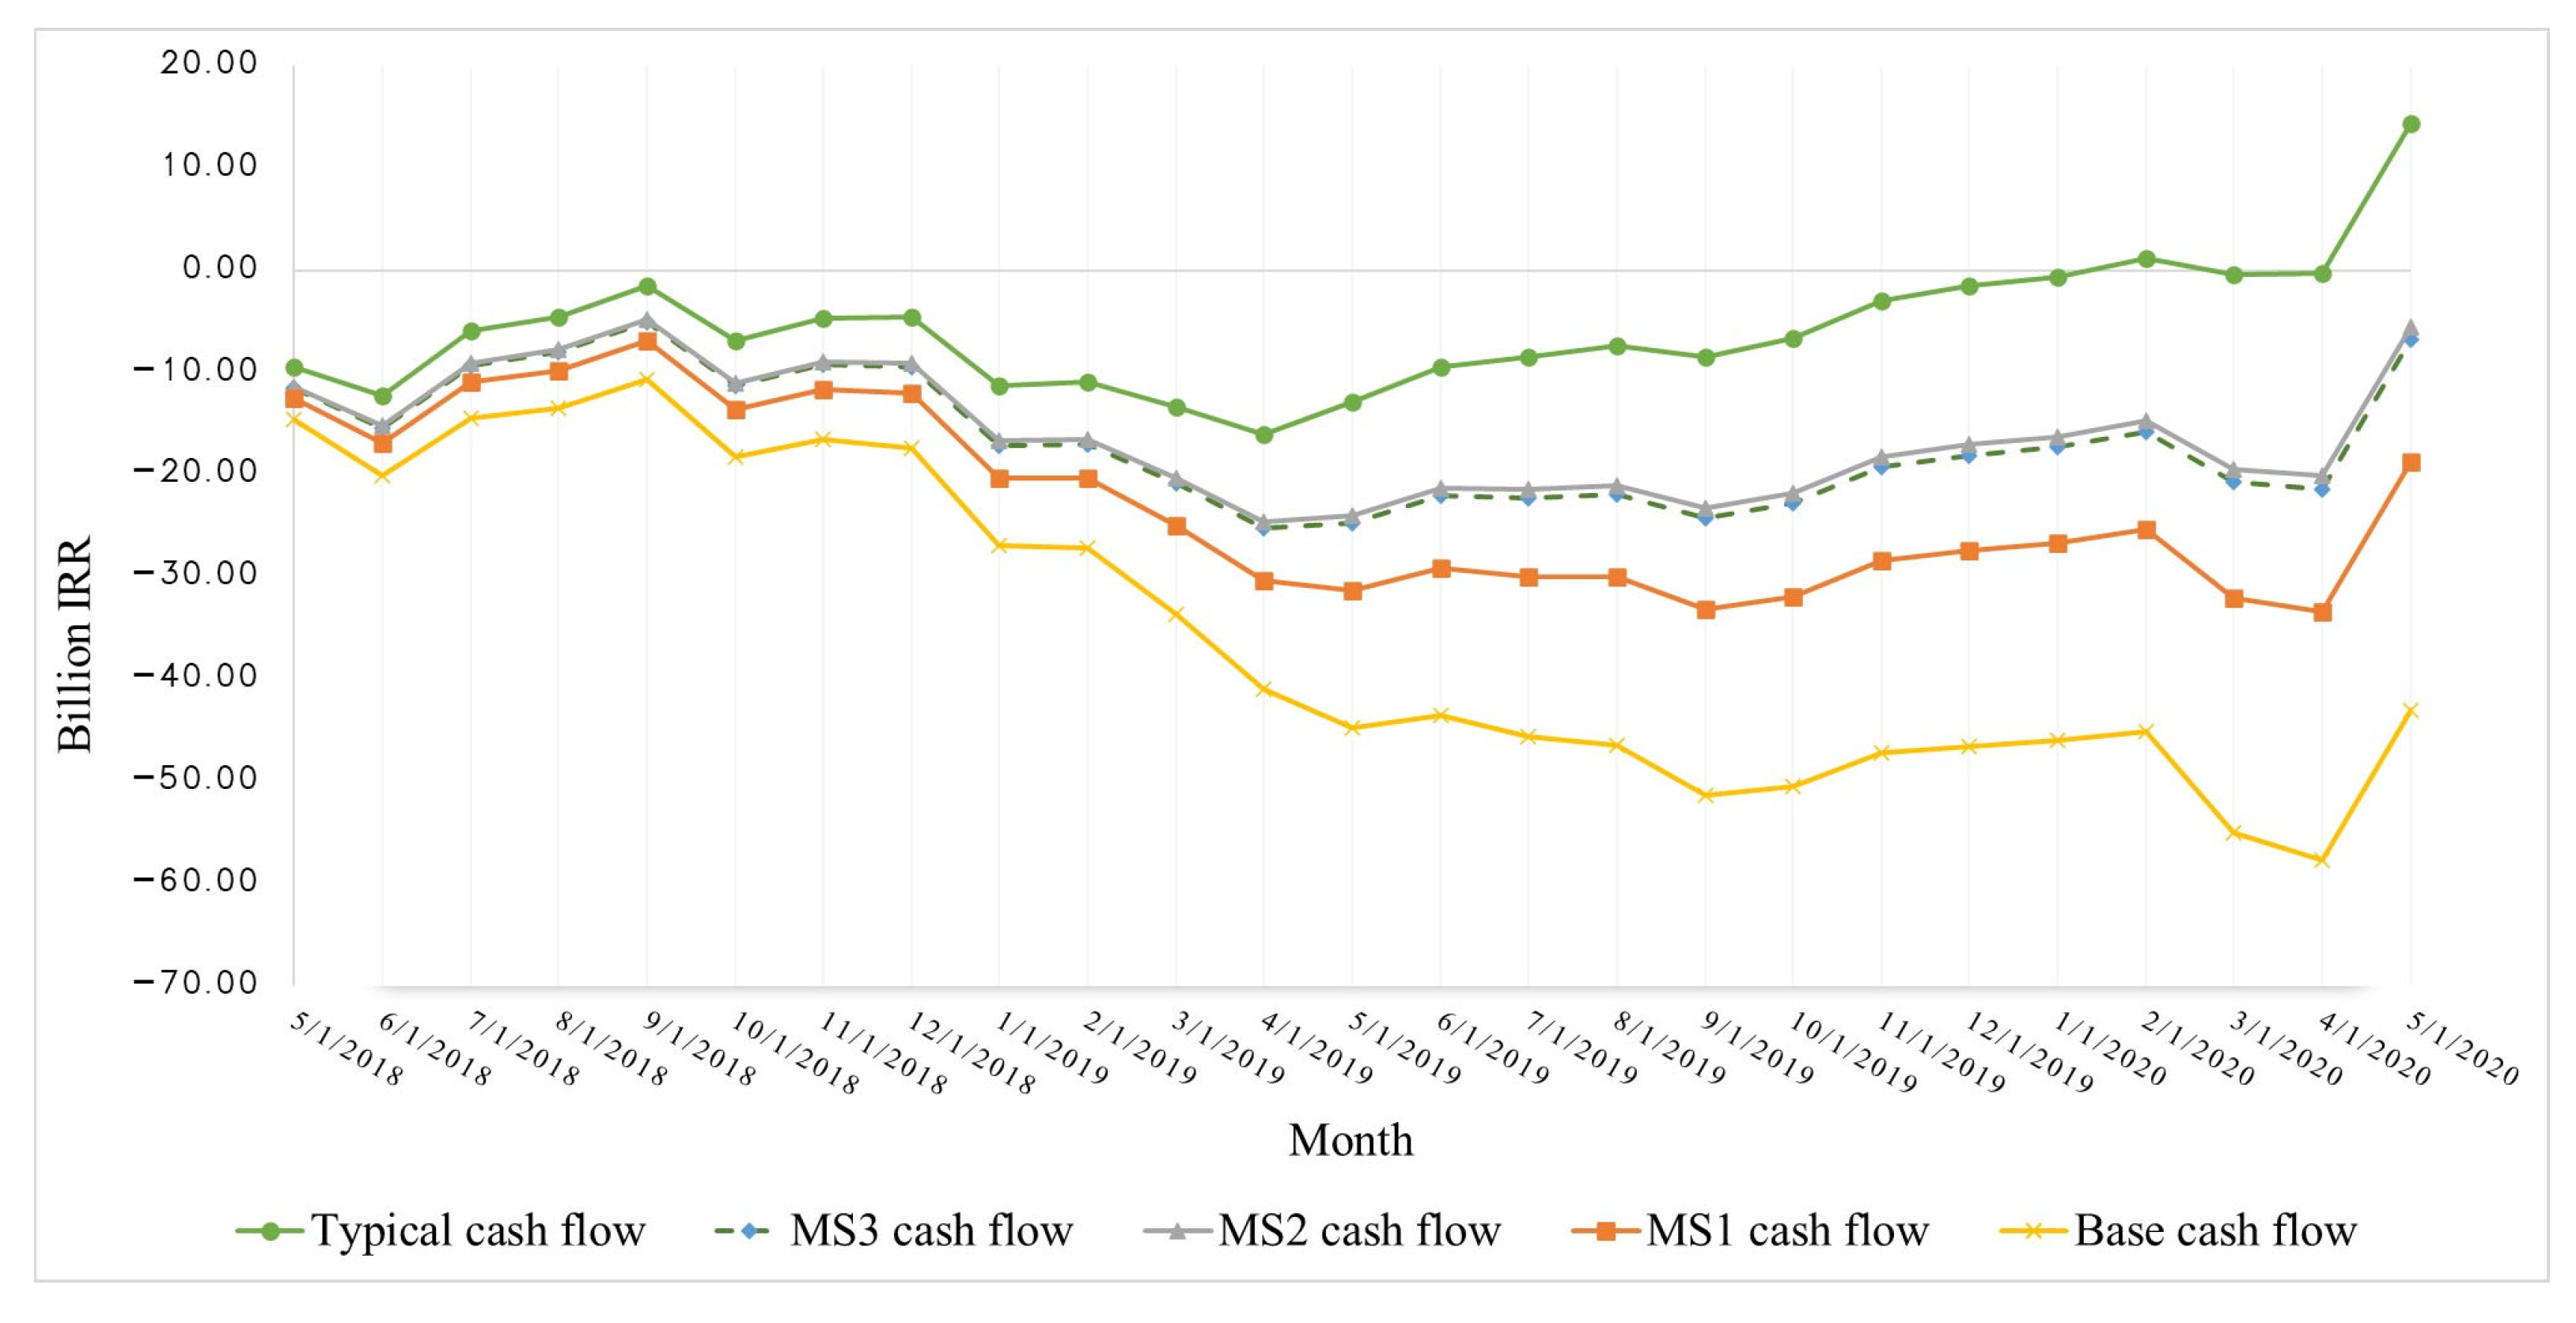
Finally, the 5D-BIM model and the BBN risk model were integrated to calculate the probabilistic cash flow of the project. The BBN was used to extract information on the impact of risks on the project’s cost items, including materials, equipment, workforce, and indirect costs. This information includes the probability distribution of cost over-runs in these items. The cost over-run was then calculated by performing 100 iterations using the Monte Carlo simulation, and the probabilistic cash flow of the project was derived by applying the effect of the cost over-run to the cash flow obtained in the previous step.
The BBN model developed for the case study project is shown in Figure 5. The probability of each risk factor in various states, along with the possibility of cost over-runs in these states, is presented in Figure 5. The output of the BBN indicates that the highest probability of cost over-run occurs in the medium range (15–40%) for all cost items. Specifically, the probability of a medium cost over-run for materials, equipment, human resources, and indirect costs is 74%, 67%, 66%, and 77%, respectively.
Then, the probabilistic cash flow for the case study project was calculated, as depicted in Figure 6.
As discussed before, the project’s cash flow in the last month was IRR 14.4 billion (BR) without considering the impact of risks (Figure 3). This net cash flow, however, is unreliable, as it ignores the impact of risks. The probabilistic cash flow of the project shown in Figure 6 indicates that due to the impact of the risks, the project cash flow will be in the range of −142.2 BR to 1.11 BR at the end of the project. In other words, in the worst-case scenario, the project’s cash flow will have the lowest value of −142.2 BR, and the project will have a significant loss due to the cost over-run resulting from the risks. In the best-case scenario, the project’s cash flow will have the highest value of 1.11 BR, and the project will have a small profit. This graph will give the project manager a reliable estimation of the project cash flow based on their selected confidence level. The reported values show the possibility of experiencing between 11 and 130% cost over-runs in the project due to existing risks.
The cumulative distribution function (CDF) of the cash flow at the end of the project is shown in Figure 7. This figure will give the project manager a reliable estimation of the project cash flow based on their selected confidence level. For instance, when the probability is selected as 1, the cash flow will be more than −142.2 BR. The CDF curve shows that with an 80% probability, the project’s cash flow will not be less than −65 BR at the end of the project. In other words, there is a 20% probability that the cash inflow at the end of the project will be less than −65 BR. Comparing the probabilistic cash flow of the project (Figure 6) with the initial cash flow of the project (Figure 3) shows the significant impact of risks on project cash flow. This comparison also shows that in this specific project, the net cash flow is unfavorable due to the considerable impact of risks.
Predicting the cash flow in advance will enable the contractors to make informed decisions when signing the contract. In addition, it will help contractors have a more reliable estimate of the required cash after starting the project, ensuring they can provide the necessary funds each month to proceed with the construction without interrupting the work, which could result in the termination of the contract by the client.

Scenario Analysis

The developed 5D-BIM-BBN tool helps project managers analyze project cash flow in different scenarios. These scenarios can be defined based on the contractor’s risk response decisions or their desired level of control over various risk factors. This way, the contractor can assess the impact of these scenarios on the project’s probabilistic cash flow. Therefore, the contractor can make informed decisions about the financial management of the project and respond to risks. The following outlines three management scenarios (MSs) as examples, with the probabilistic cash flow of the project calculated for each scenario. These scenarios are defined using the AgenaRisk software (version 10) feature.
The first scenario (MS1) investigates how controlling the inflation risk (F1) affects the project’s cash flow. To implement this scenario, it is assumed that controlling the risk increases the probability of a low state in the inflation risk node in the BBN from 7% (Figure 5) to 100%. In other words, the probability of a medium and high state will decrease from 26% and 67% (Figure 5) to 0.
In the second scenario (MS2), the effect of the contractor’s simultaneous response to three risks—namely inflation (F1), insufficient expertise and experience (C1), and contractor’s managerial deficiency (C3)—on the project’s cash flow is examined. In this scenario, the response to risk includes increasing knowledge and experience and improving management skills for tasks such as documentation and workforce training. For the implementation of this scenario, it is assumed that these risks (F1, C1, and C3) will occur with a 100% probability for the low-state intensity.
The third scenario (MS3) assumes that inflation risk is not within the contractor’s control. As a result, the focus will be on controlling a set of contractor and operational risks. In this scenario, we will simultaneously control the risks associated with the contractor, including insufficient expertise and experience (C1), contractor’s managerial deficiency (C3), inadequate site safety management (C4), poor workmanship (C5), poor planning and scheduling (C6), along with some operational risks, including defects in construction method (OP2), rework (OP4), not adhering to job orders, and delays in completing the predecessors (OP5). Then, the impact of controlling these risks on cash flow is assessed. Controlling these risks means responding to risk and reducing their impact on cash flow. For example, the contractor can reduce the risk of rework (OP4) in the project by conducting training courses and improving the workforce’s skills. To implement this scenario, similar to the previous ones, the probability of the low state in the nodes related to the risks is set to 100%.
The cumulative distribution function (CDF) of the cash flow at the end of the project for these three scenarios is depicted in Figure 8. As shown, the cash flow at the end of the project for the first scenario is in the range of −102 to 12 BR. The initial project probabilistic cash flow was in the range of −142.2 BR to 1.11 BR at the end of the project. This shows that controlling the risk of inflation has improved the project’s cash flow. This figure will also give the project manager a reliable estimate of the project cash flow based on their selected confidence level. For instance, with a probability of 90%, the cash flow at the end of the project will be more than −44 BR for MS1. Comparing the cash flow for MS1 at the end of the project (Figure 8) with the typical case (Figure 3) shows that the project costs may increase between 2 and 97% at the end of the project. These presented results show that by controlling the risk of inflation in MS1, the cost over-run will be less than 49%, with a probability of 90%. This number, compared to the 130% cost over-run shown in the probabilistic cash flow of Figure 6, shows a significant decrease in the project cost over-run by controlling the risk of inflation.
The CDF of cash flow in the second scenario is also shown in Figure 8. As shown, the cash flow at the end of the project is in the range of −39 to 12 BR for MS2. In contrast, the cash flow at the end of the project for the first scenario was in the range of −102 to 12 BR. This shows that MS2 has been more successful in improving the project’s cash flow than MS1, as it targeted controlling two risk factors related to the contractor (C1 and C3) in addition to the inflation risk (F1).
The CDF diagram of the cash flow at the end of the project for the third scenario is also shown in Figure 8, where it falls in the range of −43 to 11 BR. In this scenario, the risks associated with the contractor (C1, C3, C4, C5, and C6) and the operational risk factors (OP2, OP4, and OP5) are controlled, while the significant inflation risk is not. Comparing this scenario with the result of MS1 shows that controlling these risks has been more successful in improving project cash flow than controlling the inflation risk alone in MS1.
In Figure 8, the CDF of project cash flow at the end of the project in the three risk control scenarios has been compared with the CDF of the base case. This diagram shows that the second scenario, i.e., controlling inflation (F1) along with the two contractor-related risks (C1 and C3), represents the best cash flow for the project.

4. Discussion

An efficient approach to cash flow prediction is required to make cash flow calculations straightforward and automated while considering the impact of risks. Integrating BBN and BIM can offer a robust tool for calculating the probabilistic cash flow of the project. Compared to the method used in the past study conducted by Lu et al. [1], our proposed method can account for the impact of risks. The results showed that considering the impact of risks significantly impacts cash flow, and ignoring these risks makes the cash flow forecast invalid.
In this study, the Fuzzy DEMATEL-ISM-BBN method was used to analyze the effects of risks on the project cash flow, which has significant advantages compared to the method used in the previous study [20]. The interaction between the risk factors ignored in past studies can be considered using the BBN, and the risk assessment results are more reliable than the methods used in similar studies, such as that of Amin Ranjbar et al. [20]. The study also addressed two fundamental challenges associated with the traditional BBN method that have prevented its practical use. Using the Fuzzy DEMATEL-ISM method enabled us to develop the structural part of the BBN systematically. However, in the study conducted by Khanzadi et al. [29], this network was extracted based on the opinion of the researcher, which will hinder its validity [29]. Additionally, the RNM technique was used to accomplish the parametric component of the BBN, reducing the elicitation effort. For instance, in a BBN node such as (OP1) with three states and five parents, the number of required parameters for CPT using the conventional approach by Khanzadi et al. [29] is 486. In contrast, the RNM method decreases this number to just six. The use of fuzzy logic to convert experts’ opinions into desired data is also an additional feature of the proposed method, helping to overcome the ambiguity and uncertainty in experts’ opinions, an issue not addressed in previous similar studies, including those by Lu et al. and Amin Ranjbar et al. [1,20]. This further highlights the unique achievements and novelty of the current study. One feature of the presented method is the ability to easily update the system according to changes in project conditions and calculate the new probabilistic cash flow. Given the repetitive nature of some construction projects, such as mass housing, this capability can be used to dynamically calculate the project’s probabilistic cash flow in different construction phases. This feature can also be used to examine different scenarios to control risk factors. Project managers can model the results of alternative risk control strategies on cash flow to make well-informed decisions and choose the best scenario.
To make practical application easier, a 5D-BIM model should be developed at the pre-construction stage and periodically updated throughout the entire lifecycle of the project. The cash flow analysis would be kept aligned with the actual state of the project and its changing risk profile. The creation of awareness among stakeholders regarding the advantages of such a method can promote its adoption as a part of routine planning and risk management. Future development could make the model adaptable to different types of contracts and the application of historical information as well as dynamic Bayesian networks. Such advances would enable the monitoring of risks on a real-time basis and more precise forecasting throughout the various phases of the project. Figure 9 compares the deterministic cash flow of the project disregarding the risks (green graph) with the average probabilistic cash flow of the project considering risks (yellow graph) as well as the three management scenarios for controlling the risks (MS1, MS2, and MS3).
The average probabilistic cash flow of the project considering risks (yellow graph) shows a significant difference compared to the deterministic cash flow of the project, disregarding the risks (green graph). As shown, the project’s actual (probabilistic) cash flow is always lower than the deterministic cash flow, which disregards the risks. By comparing the two graphs, it is observed that the cash at the end of the project drops from 14.4 BR to −43 BR when the impact of risks is considered. This further highlights the importance of our proposed approach, as ignoring the risks would provide an unreliable prediction of the project’s cash flow.
In the three management scenarios, MS1, MS2, and MS3, the average cash flow will significantly increase compared to the probabilistic cash flow of the project considering risks (yellow graph). However, the project is still in the loss zone, with a negative cash flow at the end of the project.
The results of the study conducted by Amin Ranjbar et al. [20] show that there is less than a 1% probability that the project’s cash flow considering risks matches the calculated cash flow without considering the impact of risks. A review of the results of the study by Khanzadi et al. [29] also confirms the same conclusion. This result is fully consistent with the findings of the present study, which demonstrate that calculating the project cash flow without considering the impact of risks is unreliable.

5. Conclusions

This study proposed a practical model for probabilistic cash flows forecasting by integrating a BBN and 5D-BIM. The proposed approach facilitates the automatic calculation of cash flows by considering the complex impact of inter-related risk factors, which has not been widely considered in previous studies. The model consists of two main parts: (1) cash flow calculation using 5D-BIM and (2) a representation of the impact of risks using a hybrid fuzzy DEMATEL-ISM-BBN approach. The contribution of the present work is threefold:
  • Presenting an integrated 5D-BIM and BBN approach for probabilistic cash flow forecasting;
  • Improving reliability by using fuzzy logic to deal with expert opinion uncertainty;
  • Overcoming the shortcomings of classical BBNs by introducing a hybrid fuzzy DEMATEL-ISM approach to systematically define the network structure and using the RNM method to reduce the parameter elicitation workload.
To validate the feasibility of the proposed method, a prototype plugin was developed in Navisworks software (version 2018) and implemented on a case study project. The results showed that considering risks significantly changed the predicted cash flows from traditional deterministic models. In particular, a positive net cash balance was expected with a deterministic model, while considering the effects of risks showed a significant deficit, confirming the shortcomings of traditional methods. The results showed that the project’s cash flow in the last month was IRR 14.4 billion (BR) without considering the impact of risks. The probabilistic cash flow of the project indicates that due to the impact of the risks, the project cash flow will be in the range of −142.2 BR and 1.11 BR at the end of the project. This shows the possibility of experiencing between 11 and 130% deviation in the project cash flow due to existing risks. In conclusion, project cash flow is unreliable without considering the impact of risks.
Despite its contributions, this study has limitations. The model is currently customized for unit price contracts. Future research may extend the method to other types of contracts. Furthermore, expert-based parameter estimation can be replaced with historical project data to improve objectivity. Another promising direction is to consider dynamic BBNs to better reflect changes in risk effects throughout the project life cycle.
Overall, the proposed method provides a powerful and flexible decision support tool for project managers, enabling accurate economic planning, risk-informed scenario analysis, and better cash flow forecast management in construction projects.

Author Contributions

Conceptualization, M.H.M. and A.A.S.J.; methodology, M.H.M.; software, M.H.M. and M.T.; validation, M.H.M. and F.N.; investigation, F.N. and M.T. and M.H.M.; resources, A.A.S.J.; writing—original draft preparation, M.H.M. and F.N.; writing—review and editing, A.A.S.J. and M.T. and F.N.; supervision, A.A.S.J. and M.T.; All authors have read and agreed to the published version of the manuscript.

Funding

This research received no external funding.

Data Availability Statement

Data available on request from the authors.

Conflicts of Interest

The authors declare no conflicts of interest.

Abbreviations

The following abbreviations are used in this manuscript:
BIMBuilding information modeling
BBNBayesian Belief Network
RNMRanked Node Method
DEMATELDecision-making trial and evaluation laboratory
ISMInterpretive structural modeling

References

  1. Lu, Q.; Won, J.; Cheng, J.C. financial decision making framework for construction projects based on 5D Building Information Modeling (BIM). JPMA 2016, 34, 3–21. [Google Scholar] [CrossRef]
  2. Zayed, T.; Liu, Y. Cash flow modeling for construction projects. Eng. Constr. Archit. Manag. 2014, 21, 170–189. [Google Scholar] [CrossRef]
  3. Govan, P.; Damnjanovic, I. Structural network measures for risk assessment of construction projects. ASCE-ASME J. Risk Uncertain. Eng. Syst. Part A Civ. Eng. 2020, 6, 4019024. [Google Scholar] [CrossRef]
  4. Banihashemi, S.; Khalili, S.; Sheikhkhoshkar, M.; Fazeli, A. Machine learning-integrated 5D BIM informatics: Building materials costs data classification and prototype development. Innov. Infrastruct. Solut. 2022, 7, 1–25. [Google Scholar] [CrossRef]
  5. Barbosa, P.S.F.; Pimentel, P.R. A linear programming model for cash flow management in the Brazilian construction industry. Constr. Manag. Econ. 2001, 19, 469–479. [Google Scholar] [CrossRef]
  6. Hegazy, T.; Ersahin, T. Simplified spreadsheet solutions. II: Overall schedule optimization. J. Constr. Eng. Manag. 2001, 127, 469–475. [Google Scholar] [CrossRef]
  7. Kim, H.; Grobler, F. Preparing a Construction Cash Flow Analysis Using Building Information Modeling (BIM) Technology. J. Constr. Eng. Proj. Manag. 2013, 3, 1–9. [Google Scholar] [CrossRef]
  8. Park, H.K.; Han, S.H.; Russell, J.S. Cash flow forecasting model for general contractors using moving weights of cost categories. J. Manag. Eng. 2005, 21, 164–172. [Google Scholar] [CrossRef]
  9. Al-Yami, A.; Sanni-Anibire, M.O. BIM in the Saudi Arabian construction industry: State of the art, benefit and barriers. Int. J. Build. Pathol. Adapt. 2021, 39, 33–47. [Google Scholar] [CrossRef]
  10. Ferdosi, H.; Abbasianjahromi, H.; Banihashemi, S.M. Ravanshadnia BIM applications in sustainable construction: Scientometric and state-of-the-art review. Int. J. Constr. Manag. 2023, 23, 1969–1981. [Google Scholar]
  11. Liu, X.; Li, Z.; Jiang, S. Ontology-based representation and reasoning in building construction cost estimation in China. Future Internet 2016, 8, 39. [Google Scholar] [CrossRef]
  12. Zhang, C.; Kumar, D.; Li, H.; Zhou, R.; Lv, L.; Tian, J. Development of a BIM-Enabled Automated Cost Segregation System. Buildings 2023, 13, 1805. [Google Scholar] [CrossRef]
  13. Yoon, J.H.; Pishdad-Bozorgi, P. Potentials of 5D BIM with Blockchain-enabled Smart Contracts for Expediting Cash Flow in Construction Projects. In Proceedings of the International Symposium on Automation and Robotics in Construction, ISARC, Bogota, Colombia, 12–15 July 2022; pp. 238–245. [Google Scholar]
  14. Stanley, R.; Thurnell, D. The benefits of, and barriers to, implementation of 5D BIM for quantity surveying in New Zealand. Australas. J. Constr. Econ. Build. 2014, 14, 105–117. [Google Scholar] [CrossRef]
  15. Abdel, M.; Khalaf, L. Parametric Construction Cash Flow Modeling Combined with Building Information Modeling and Simulation Cash Flow Generation and Alternatives Analysis Through Bim and Simulation View Project Parametric Construction Cash Flow Modeling Combined with Building. 2019. Available online: https://www.researchgate.net/publication/332951025 (accessed on 21 November 2019).
  16. Le, H.T.T.; Cong, T.D. Bim-Integrated System: A successful alternative for estimating cash flow in building projects. ASEAN Eng. J. 2023, 13, 103–112. [Google Scholar]
  17. Abma, V.; Farhana, A.; Rachmawati, S. Cash flow simulation planning based on building information modeling for construction projects. AIP Conf. Proc. 2024, 3114, 030010. [Google Scholar] [CrossRef]
  18. Mahboob, A.; Rathnasinghe, A.; Ekanayake, P.; Tennakoon, P. Evaluating BIM’s Role in Transforming Cash Flow Forecasting Among Construction SMEs: A Saudi Arabian Narrative. Sustainability 2024, 16, 10221. [Google Scholar] [CrossRef]
  19. El-Sayegh, S.M.; Mansour, M.H. Risk assessment and allocation in highway construction projects in the UAE. J. Manag. Eng. 2015, 31, 4015004. [Google Scholar] [CrossRef]
  20. Ranjbar, A.A.; Ansari, R.; Taherkhani, M.R. Hosseini Developing a novel cash flow risk analysis framework for construction projects based on 5D BIM. J. Build. Eng. 2021, 44, 103341. [Google Scholar] [CrossRef]
  21. Dada, J.O.; Jagboro, G.O. An evaluation of the impact of risk on project cost overrun in the Nigerian construction industry. J. Financ. Manag. Prop. Constr. 2007, 12, 37–44. [Google Scholar] [CrossRef]
  22. Lee, D.-E.; Lim, T.-K.; Arditi, D. Stochastic project financing analysis system for construction. J. Constr. Eng. Manag. 2012, 138, 376–389. [Google Scholar] [CrossRef]
  23. Hwee, N.G.; Tiong, R.L. Model on cash flow forecasting and risk analysis for contracting firms. Int. J. Proj. Manag. 2002, 20, 351–363. [Google Scholar] [CrossRef]
  24. Odeyinka, H.A.; Lowe, J.; Kaka, A. An evaluation of risk factors impacting construction cash flow forecast. J. Financ. Manag. Prop. Constr. 2008, 13, 5–17. [Google Scholar] [CrossRef]
  25. Kim, D.; Yoo, T.; Tran, S.V.-T.; Lee, D.; Park, C.; Lee, D. Automated Safety Risk Assessment Framework by Integrating Safety Regulation and 4D BIM-Based Rule Modeling. Buildings 2024, 14, 2529. [Google Scholar] [CrossRef]
  26. Ganbat, T.; Chong, H.-Y.; Liao, P.-C. Mapping BIM uses for risk mitigation in international construction projects. Adv. Civ. Eng. 2020, 2020, 5143879. [Google Scholar] [CrossRef]
  27. Afzal, F.; Yunfei, S.; Nazir, M.; Bhatti, S.M. A review of artificial intelligence based risk assessment methods for capturing complexity-risk interdependencies: Cost overrun in construction projects. Int. J. Manag. Proj. Bus. 2019, 14, 300–328. [Google Scholar] [CrossRef]
  28. Liu, J. Bayesian network inference on risks of construction schedule-cost. In Proceedings of the 2010 International Conference of Information Science and Management Engineering, Xi’an, China, 7–8 August 2010; Volume 2, pp. 15–18. [Google Scholar]
  29. Khanzadi, M.; Eshtehardian, E.; Mokhlespour, M. Esfahani Cash flow forecasting with risk consideration using Bayesian Belief Networks (BBNS). J. Civ. Eng. Manag. 2017, 23, 1045–1059. [Google Scholar] [CrossRef]
  30. Hon, C.K.H.; Sun, C.; Xia, B.; Jimmieson, N.L.; Way, K.A.; Wu, P.P.-Y. Applications of Bayesian approaches in construction management research: A systematic review. Eng. Constr. Archit. Manag. 2022, 29, 2153–2182. [Google Scholar] [CrossRef]
  31. Li, Z.; Zhu, X.; Liao, S.; Yin, J.; Gao, K.; Liu, X. Integrating Bayesian Network and Cloud Model to Probabilistic Risk Assessment of Maritime Collision Accidents in China’s Coastal Port Waters. J. Mar. Sci. Eng. 2024, 12, 2113. [Google Scholar] [CrossRef]
  32. Morgenstern, H.; Raupach, M. Predictive BIM with Integrated Bayesian Inference of Deterioration Models as a Four-Dimensional Decision Support Tool. CivilEng 2023, 4, 185–203. [Google Scholar] [CrossRef]
  33. Hosamo, H.H.; Nielsen, H.K.; Kraniotis, D.; Svennevig, P.R.; Svidt, K. Improving building occupant comfort through a digital twin approach: A Bayesian network model and predictive maintenance method. Energy Build. 2023, 288, 112992. [Google Scholar] [CrossRef]
  34. Fan, W.; Yan, B.; Bao, Q.; Zhao, Y.; Zhou, J. Green Evaluation for Building Interior Decoration Based on BIM-BN Technology. Buildings 2023, 13, 744. [Google Scholar] [CrossRef]
  35. Alavi, H.; Bortolini, R.; Forcada, N. BIM-based decision support for building condition assessment. Autom. Constr. 2021, 135, 104117. [Google Scholar] [CrossRef]
  36. Cárdenas, I.C.; Al-Jibouri, S.S.; Halman, J.I.; van Tol, F.A. Capturing and integrating knowledge for managing risks in tunnel works. Risk Anal. Int. J. 2013, 33, 92–108. [Google Scholar] [CrossRef]
  37. Guyonnet, D.; Bourgine, B.; Dubois, D.; Fargier, H.; Co, B.; Chilès, J.-P. Hybrid approach for addressing uncertainty in risk assessments. J. Environ. Eng. 2003, 129, 68–78. [Google Scholar] [CrossRef]
  38. Wang, Q.; Zhang, J.; Zhu, K.; Guo, P.; Shen, C.; Xiong, Z. The safety risk assessment of mine metro tunnel construction based on fuzzy Bayesian network. Buildings 2023, 13, 1605. [Google Scholar] [CrossRef]
  39. Cheng, M.; Liu, L.; Cheng, X.; Tao, L. Risk analysis of public-private partnership waste-to-energy incineration projects in China: A hybrid fuzzy DEMATEL-ISM approach. Eng. Constr. Archit. Manag. 2023; ahead-of-print. [Google Scholar] [CrossRef]
  40. Qin, M.; Wang, X.; Du, Y. Factors affecting marine ranching risk in China and their hierarchical relationships based on DEMATEL, ISM, and BN. Aquaculture 2021, 549, 2022. [Google Scholar] [CrossRef]
  41. Zhang, G.; Thai, V.V. Expert elicitation and Bayesian Network modeling for shipping accidents: A literature review. Saf. Sci. 2016, 87, 53–62. [Google Scholar] [CrossRef]
  42. Sacks, R.; Eastman, C.; Lee, G.; Teicholz, P. BIM Handbook: A Guide to Building Information Modeling for Owners, Designers, Engineers, Contractors, and Facility Managers; Wiley: Hoboken, NJ, USA, 2018. [Google Scholar]
  43. Elghaish, F.; Abrishami, S.; Samra, S.A.; Gaterell, M.; Hosseini, R.; Wise, R. Cash flow system development framework within integrated project delivery (IPD) using BIM tools. Int. J. Constr. Manag. 2019, 21, 1–16. [Google Scholar] [CrossRef]
  44. Li, F.; Wang, W.; Dubljevic, S.; Khan, F.; Xu, J.; Yi, J. Analysis on accident-causing factors of urban buried gas pipeline network by combining DEMATEL, ISM and BN methods. J. Loss Prev. Process Ind. 2019, 61, 49–57. [Google Scholar] [CrossRef]
  45. Madihi, M.H.; Javid, A.A.S.; Nasirzadeh, F. Enhancing risk assessment: An improved Bayesian network approach for analyzing interactions among risks. Eng. Constr. Archit. Manag. 2023, 32, 2022–2043. [Google Scholar] [CrossRef]
  46. Şeker, Ş.; Zavadskas, E. Application of fuzzy DEMATEL method for analyzing occupational risks on construction sites. Sustainability 2017, 9, 2083. [Google Scholar] [CrossRef]
  47. Fenton, N.E.; Neil, M.; Caballero, J.G. Using ranked nodes to model qualitative judgments in Bayesian networks. IEEE Trans. Knowl. Data Eng. 2007, 19, 1420–1432. [Google Scholar] [CrossRef]
  48. Laitila, P.; Virtanen, K. Improving Construction of Conditional Probability Tables for Ranked Nodes in Bayesian Networks. IEEE Trans. Knowl. Data Eng. 2016, 28, 1691–1705. [Google Scholar] [CrossRef]
  49. Xu, Y.; Yeh, C.-H.; Yang, S.; Gupta, B. Risk-based performance evaluation of improvement strategies for sustainable e-waste management. Resour. Conserv. Recycl. 2020, 155, 104664. [Google Scholar] [CrossRef]
  50. Zhou, Q.; Huang, W.; Zhang, Y. Identifying critical success factors in emergency management using a fuzzy DEMATEL method. Saf. Sci. 2011, 49, 243–252. [Google Scholar] [CrossRef]
Figure 1. The proposed framework for probabilistic cash flow analysis using the 5D-BIM integrated with the BBN.
Buildings 15 01774 g001
Figure 2. 5D-BIM model of the case study project.
Buildings 15 01774 g002
Figure 3. The format of the required data to calculate the project’s cash flow.
Buildings 15 01774 g003
Figure 4. Fuzzy DEMATEL causal diagram with risk factors (The dash lines on the diagram were drawn based on the mean of the data on each axis.).
Buildings 15 01774 g004
Figure 5. The BBN of the case study project.
Buildings 15 01774 g005
Figure 6. The probabilistic cash flow of the case study project.
Buildings 15 01774 g006
Figure 7. The cumulative distribution function of the project’s cash flow.
Buildings 15 01774 g007
Figure 8. The cumulative distribution function (CDF) of the project cash flow for the three management scenarios (MS1, MS2, and MS3).
Buildings 15 01774 g008
Figure 9. Typical cash flow and average probabilistic cash flow for the three management scenarios (MS1, MS2, and MS3) and base case.
Buildings 15 01774 g009
Table 1. Experts’ information.
ExpertsAgeWork ExperienceDegreeJob Title
017342 yearsM.S/Civil EngineeringProject manager
026330 yearsB.S/Civil EngineeringHead of the technical office
035522 yearsB.S/Civil EngineeringSite manager
044918 yearsB.S/Civil EngineeringDeputy site manager
055321 yearsB.S/Civil EngineeringDeputy site manager
Table 2. Chosen risk factors at the end of the selection process.
Risk ClassificationRisk FactorsCodes
Risks associated with owner Specification variations during buildingO1
Delays in approvalsO2
Owner’s managerial deficiencyO3
Risks associated with contractorInsufficient expertise and experienceC1
Delay in procurementC2
Contractor’s managerial deficiencyC3
Inadequate site safety managementC4
Poor workmanshipC5
Poor planning and schedulingC6
Financial risksInflationF1
Client’s payment delayF2
Financial insufficiency of the contractorF3
Management risksInadequate communication of project stakeholdersM1
Conflict among project stakeholdersM2
Procurement risksInsufficient supplies of materials and equipmentP1
Public conditions risksComplexity of the projectPU1
Risks associated with consultantInsufficient expertise and experience, as well as managerial shortcomingsCO1
Design mistakesCO2
Delay in design deliveryCO3
Modifying the specs of materials and equipment throughout the building processCO4
Country conditions risksEconomic volatilityG1
Non-economic instabilitiesG2
Legal systems’ immaturity and weak bureaucracyG3
Environmental conditions risksBad weather conditionE1
Force majeureE2
Risks imposed by environmental regulationsE3
Operational risksCorruption and fraudOP1
Defects in construction methodOP2
Damage incurred to the contractor’s equipment and toolsOP3
ReworkOP4
Not adhering to the job orders and delay in completing the predecessorsOP5
Table 3. Triangular fuzzy numbers for linguistic terms [39].
Linguistic TermsTriangular Fuzzy Numbers
Very high influence(0.75, 1, 1)
High influence(0.5, 0.75, 0.1)
Medium influence(0.25, 0.5, 0.75)
Low influence(0, 0.25, 0.5)
No influence(0, 0, 0.25)
Table 4. The risk factors hierarchy derived from the ISM.
Level1st2nd3rd4th5th6th7th8th9th10th
Risk factorsG1F1C1; G3; F2F3; CO1; C3G2; O3P1; M1; O2; OP1; O1;C2; C6; M2; PU1E2; OP2CO2; OP3C4; E3; C5; OP4 CO3; CO4; OP5; E1
Table 5. The interval associated with each state of the cost item nodes.
StateCost Over-Run Magnitude (Percentage)
Low0–15%
Medium15–40%
High40–100%
Disclaimer/Publisher’s Note: The statements, opinions and data contained in all publications are solely those of the individual author(s) and contributor(s) and not of MDPI and/or the editor(s). MDPI and/or the editor(s) disclaim responsibility for any injury to people or property resulting from any ideas, methods, instructions or products referred to in the content.

