Article

The Coupling Coordination Degree and Spatio-Temporal Divergence Between Land Urbanization and Energy Consumption Carbon Emissions of China’s Yangtze River Delta Urban Agglomeration

College of Architecture, Xi’an University of Architecture and Technology, Xi’an 710054, China
*
Author to whom correspondence should be addressed.
Buildings 2025, 15(11), 1880; https://doi.org/10.3390/buildings15111880
Submission received: 19 September 2024 / Revised: 23 May 2025 / Accepted: 27 May 2025 / Published: 29 May 2025

Abstract

:
The strategic coordinated development of land urbanization and carbon emission systems in urban agglomerations is crucial for achieving dual carbon goals and sustainable development. While existing studies emphasize population and economic urbanization, the spatiotemporal coupling mechanisms between land urbanization (encompassing size, input, and output dimensions) and carbon emissions remain underexplored. This study collects data on land urbanization and carbon emissions from 27 cities in China’s Yangtze River Delta urban agglomeration between 2010 and 2019. By establishing evaluation systems for land urbanization and energy consumption carbon emission subsystems, by and employing coupling coordination degree models with spatial autocorrelation analysis methods, this paper analyzes the spatiotemporal dynamic evolution characteristics of the coupled coordination relationship between land urbanization and energy consumption carbon emissions in the Yangtze River Delta urban agglomeration. The results indicate the following: (1) From 2010 to 2019, the comprehensive level of the land urbanization subsystem in the Yangtze River Delta urban agglomeration continued to rise, with higher comprehensive indices in the southern and northern peripheral regions and lower values in central urban areas. The carbon emission subsystem showed sustained stable decline, with a gradual reduction in the number of cities maintaining low carbon emission levels. (2) Temporally, the overall coupling coordination degree of the urban agglomeration system demonstrated an upward trend, progressing from severe imbalance to the primary coordination stage. (3) Spatially, significant regional differences in coupling coordination degree were observed, showing higher values in the southeastern areas compared to the northwestern regions. (4) Most areas exhibited no significant clustering characteristics in the coupling coordination degree between land urbanization and energy consumption carbon emissions, while the local spatial clustering patterns demonstrated temporal variations. These findings systematically reveal the transition mechanisms of land–carbon coordination in urban agglomerations, providing empirical evidence to resolve the theoretical debate on urbanization’s dual role in emission promotion and reduction.

1. Introduction

The Intergovernmental Panel on Climate Change (IPCC) reports that over 70% of global carbon emissions originate from cities [1]. Notably, urban areas are critical target regions for reducing global carbon emissions. In China, national development strategies such as new-type urbanization have further promoted the spatial concentration of regional economies. Balancing urban economic growth with emission reduction targets poses a severe challenge for China’s future. China’s ‘14th Five-Year Plan for Modern Energy Systems’ explicitly aims to reduce carbon emissions per unit of GDP by 18% and energy consumption per unit of GDP by 13.5% cumulatively by 2025. Meanwhile, for both developed and emerging economies, urbanization has entered the era of urban agglomerations, which have become focal areas for a range of environmental issues. As economic scales expand, carbon emission pressures will continue to rise [2]. In 2023, the 28th Conference of the Parties (COP28) to the United Nations Framework Convention on Climate Change (UNFCCC) was held in Dubai, UAE. During the conference, the China Pavilion hosted a themed side event titled “Narrating China’s Climate Action Stories and Global Climate Governance for Low-Carbon Cities and Urban Agglomerations”, which jointly explored pathways for carbon peaking and carbon neutrality in cities and urban agglomerations. The coordination between urbanization and carbon emission systems in urban agglomerations is essential for advancing low-carbon sustainable urbanization and planning. Consequently, studying the development and emission reduction patterns of representative urban agglomerations holds significant reference value for other regions globally [3,4,5,6].
In recent years, the relationship between urbanization and carbon emissions has attracted considerable academic attention. It is widely recognized that urbanization, as a critical driver of energy consumption and economic growth, is closely associated with carbon emissions [7,8,9,10,11,12,13,14]. However, most existing studies focus predominantly on population urbanization and economic urbanization, while land urbanization, which constitutes the physical and spatial foundation of urban expansion, has received comparatively limited attention. For instance, Xu et al. [15] incorporated economic, social, and ecological benefits into their evaluation of land urbanization quality and found a suppressive effect on carbon emissions. Tang et al. [16] further identified land-use intensity, structure, and efficiency as key positive drivers of emissions. Nevertheless, the impact of land urbanization on carbon emissions remains debatable, with findings varying across different development stages and regional contexts [17,18,19]. Moreover, most existing analyses are conducted at national or provincial levels, lacking detailed examination of the structural characteristics of land urbanization and their carbon implications at the urban agglomeration scale [20,21,22].
Urban agglomerations, as major hubs of economic activity and energy demand, have become critical focal points for carbon emission research [23,24,25,26,27,28,29,30,31,32,33]. Liu et al. [34] found that spatial structure within agglomerations significantly affects emissions: spatial concentration and transportation accessibility tend to increase emission efficiency, whereas compact urban form helps mitigate emissions. Dong et al. [35] revealed the short-term inhibitory effects of land-use efficiency on carbon intensity in the Yangtze River Delta through stochastic frontier and entropy-based models. Zhou et al. [36] estimated land-use carbon emissions in the Beijing-Tianjin-Hebei region, highlighting built-up land expansion as a key contributor to increasing emissions. Although these studies have deepened understanding of emissions in urban clusters, they seldom construct comprehensive index systems for evaluating land urbanization–carbon interactions, nor do they systematically analyze spatial coordination mechanisms [22,37,38].
With the advancement of spatial econometric methodologies, recent studies have increasingly emphasized spatial heterogeneity and spillover effects in carbon emissions research [39,40,41]. Xu et al. [39] employed the Environmental Kuznets Curve (EKC) framework in the Pearl River Delta to reveal that economic urbanization exerts the strongest impact on emissions, followed by land and population urbanization. Chen et al. [40] used spatial autocorrelation and panel models to analyze multidimensional urbanization effects, identifying sustained emission increases in areas with rapid land expansion. Zhu et al. [41] showed that land fragmentation exacerbates emissions, while improved urban land connectivity supports mitigation. However, these approaches primarily rely on regression-based correlations, which fall short in capturing the interactive and dynamic coordination between systems. Particularly lacking are models that can evaluate mutual interactions and co-evolutionary trends across multiple urban systems, especially within spatially integrated agglomerations.
In summary, although considerable progress has been made in investigating the urbanization–carbon emission nexus—especially regarding multidimensional urbanization and urban agglomeration scales [7,10,15,16,33,35,40]—several critical research gaps persist. First, current studies rarely conduct systematic analyses of the internal structure of land urbanization, including its scale, investment, and output dimensions [18,20,22]. Second, the intercity heterogeneity within urban agglomerations is often overlooked, limiting the understanding of spatial coordination and spillover patterns [32,34,35,37]. Third, most analyses are based on static or linear models, which are inadequate for capturing the spatiotemporal evolution and coordination mechanisms between land use and emissions [39,40,41]. Therefore, there is a pressing need for integrated quantitative frameworks that evaluate both interaction strength and coordination trends, supplemented by spatial diagnostic tools to assess regional synergy.
To address these gaps, this study focuses on the Yangtze River Delta, China’s most representative urban agglomeration. Using panel data from 27 cities from 2010 to 2019, a comprehensive evaluation index system is constructed, encompassing land urbanization indicators (scale, input, output) and energy-related carbon emissions. A Coupling Coordination Degree (CCD) model is employed to assess the interactive dynamics between these two systems, while global and local spatial autocorrelation (e.g., Moran’s I) are used to analyze the spatial clustering and evolution patterns [41,42]. Compared to traditional methods such as LMDI decomposition, IPAT/Kaya identity models, and regression analysis [22,37], the CCD approach offers significant advantages: (1) it quantifies the degree and quality of system interaction and coordination over time, which is critical for multi-system studies [20,21,43,44]; and (2) it is well-suited for integration with GIS and spatial econometric tools, enabling dynamic spatial pattern analysis and comparison [40,42,45,46]. The key innovations of this study are threefold: (1) it provides the first systematic quantification of the coordinated dynamics between land urbanization and carbon emissions; (2) it addresses spatial imbalance within urban agglomerations, revealing spatiotemporal coordination disparities; and (3) it integrates methodological innovation and spatial-scale precision to offer theoretical and practical guidance for achieving coordinated low-carbon urbanization.

2. Study Area and Data Sources

2.1. Study Area

The Yangtze River Delta urban agglomeration is located in the lower reaches of the Yangtze River, spanning 114°54′–123°10′ E and 27°02′–35°08′ N, adjacent to the Yellow Sea and East China Sea. It forms an alluvial plain before the Yangtze River flows into the sea. The urban agglomeration covers Shanghai, Jiangsu, Zhejiang, and Anhui provinces, encompassing 27 cities with a total area of 225,000 km2. By 2021, the average urbanization rate in the Yangtze River Delta urban agglomeration exceeded 68%, and its GDP reached CNY 27.3 billion. As a critical intersection of China’s “Belt and Road” initiative and the Yangtze River Economic Belt, it holds strategic significance in national modernization. The region heavily relies on fossil fuels such as coal, oil, and natural gas, with total primary energy demand reaching approximately 840 million tons of standard coal in 2020, facing substantial challenges in low-carbon sustainable development and energy transition.

2.2. Data Sources

Following the Outline of the Yangtze River Delta Regional Integration Development Plan issued by the Central Committee of the Communist Party of China and the State Council in 2019, this study focuses on 27 core cities in the Yangtze River Delta from 2010 to 2019. These include Shanghai, nine cities in Jiangsu (Nanjing, Zhenjiang, Yangzhou, Changzhou, Suzhou, Wuxi, Nantong, Taizhou, Yancheng), nine cities in Zhejiang (Hangzhou, Jiaxing, Huzhou, Shaoxing, Ningbo, Wenzhou, Zhoushan, Jinhua, Taizhou), and eight cities in Anhui (Hefei, Wuhu, Chuzhou, Ma’anshan, Tongling, Chizhou, Anqing, Xuancheng). Data were sourced from the China National Bureau of Statistics (2010–2019), China Urban Construction Statistics Yearbook (2010–2019), and Carbon Emission Accounts and Datasets (CEADs) (2010–2019) (Table 1). Missing values were predicted and supplemented using linear regression [38,47]. Data for all 27 cities from 2010 to 2019 were systematically compiled and standardized for analysis.

3. Methods

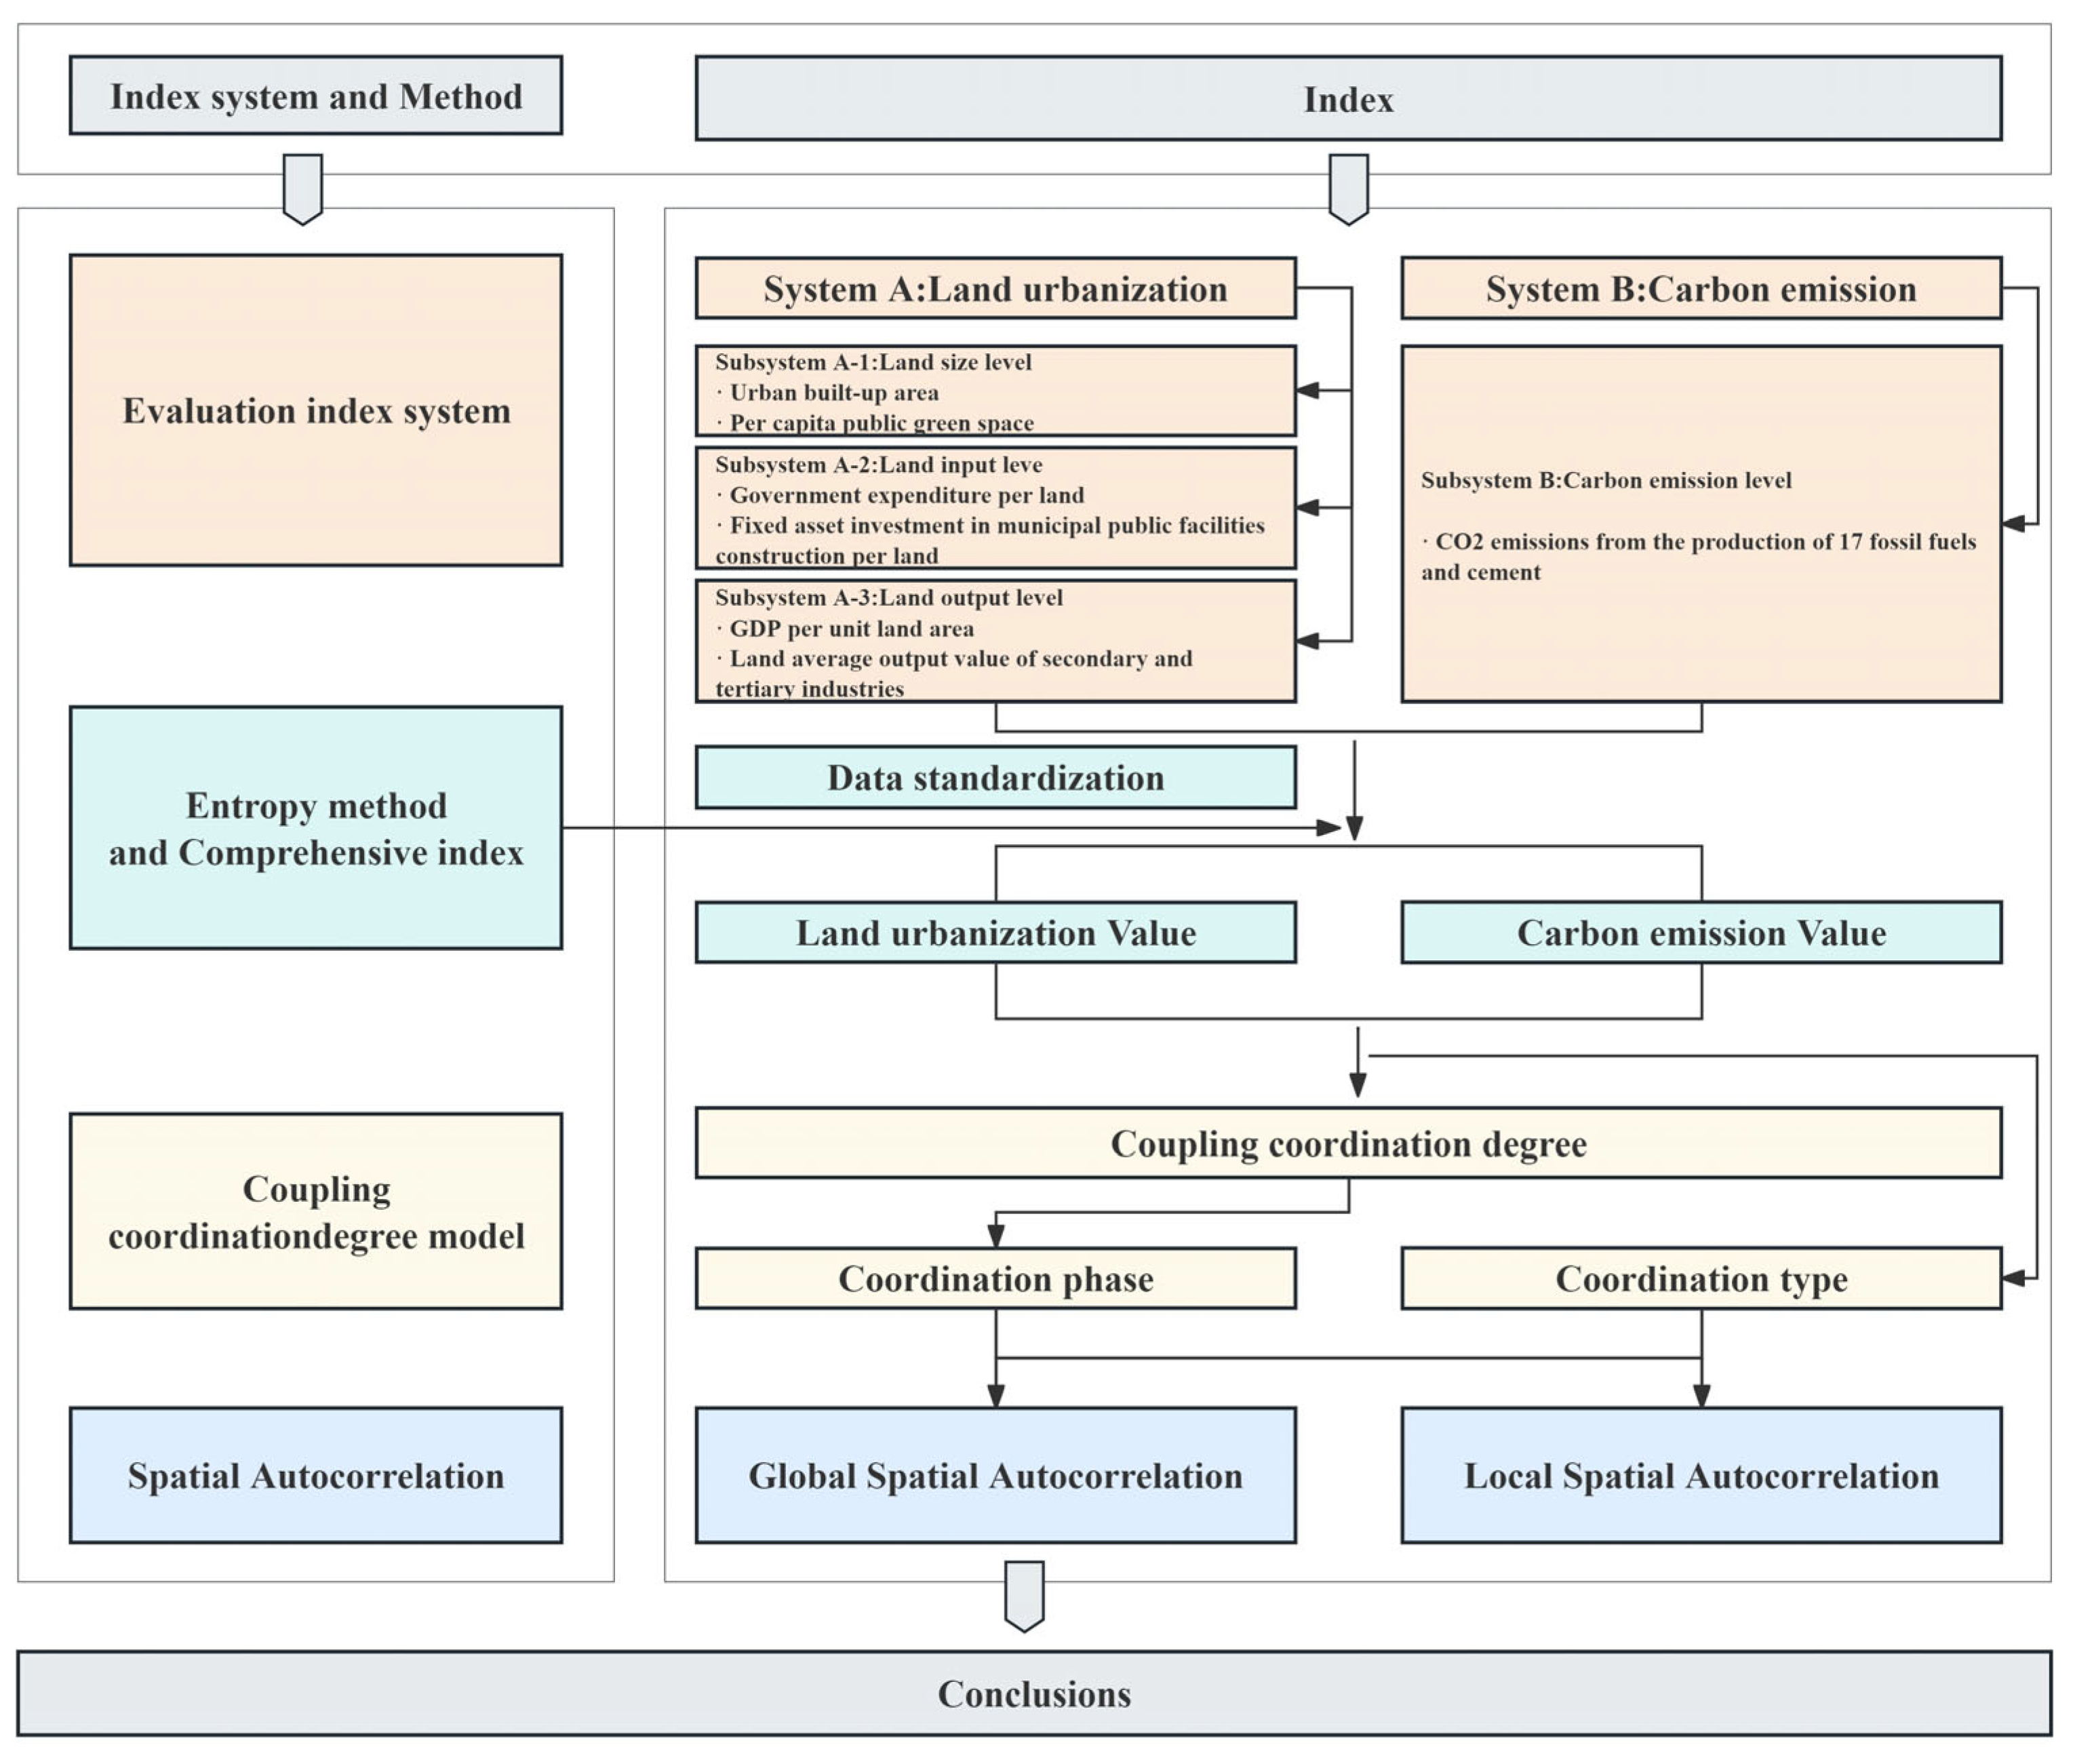
3.1. Evaluation Indicator System Construction

First, this study defines the concept of land urbanization [52]. Second, principles of scientific rigor and data availability are applied to integrate land urbanization and energy consumption carbon emissions. Third, existing evaluation index systems for land urbanization at the urban agglomeration level from the domestic and international literature are referenced. Finally, a coupled coordination degree index system for land urbanization and energy consumption carbon emissions in the Yangtze River Delta urban agglomeration is constructed (Table 2). The system includes aggregate indicators, reflecting regional-scale and relative indicators and representing average levels across regions to mitigate inaccuracies caused by differences in regional scope and size.

3.2. Framework of Coupling Coordination Analysis

Based on panel data from 27 cities in the Yangtze River Delta (2010–2019), this study first employs the entropy method to calculate the comprehensive indices of land urbanization and carbon emissions. Subsequently, a CCD model is introduced to compute system and subsystem CCD. Finally, global and local spatial autocorrelation methods are applied to analyze the spatiotemporal dynamic evolution characteristics of the coupled coordination relationship between land urbanization and energy consumption carbon emissions in the Yangtze River Delta urban agglomeration (Figure 1).

3.2.1. Entropy Method

Entropy is a measure of the uncertainty of the state or of its average information content [58]. Shannon stated that the entropy can be interpreted as the average rate at which information is produced by a stochastic source of data. When the data source produces a low-entropy value, the event carries more “information”. The entropy method is an objective and comprehensive weighting method which is based on the dispersion degree of the evaluation index data to measure the index weight [59]. As an objective weight measurement method, the entropy weight method is widely used in the assessment of urbanization and sustainable development level [44,60]. This study utilizes information entropy to calculate indicator weights, providing a basis for analyzing the comprehensive indices of land urbanization and carbon emissions in the Yangtze River Delta urban agglomeration.
For the entropy method, negative-effect indicators require forward processing. The extremum method is used to standardize raw indicator values. The standardization formulas for positive-benefit and negative-benefit indicators are as follows [16,38,60]:
x i j = ( x i j x j m i n ) / ( x j m a x x j m i n ) ( x j m a x x i j ) / ( x j m a x x j m i n ) , i = 1 , 2 , , m ; j = 1 , 2 , , n
where x i j is the standardized information value, x i j is the original value of the j th indicator in year i ; m is the number of years; and n is the number of evaluation indicators.
The information entropy and utility values of the metrics are further calculated with the following formula:
P i j = x i j / i = 1 m x i j
e j = ( 1 / ln ( m ) ) × i = 1 m P i j ln ( P i j )
g i = 1 e j
The final calculation of the weights of the indicators is based on the following formula:
ω j = g j / j = 1 n g j

3.2.2. Comprehensive Index

The comprehensive index is an evaluation approach that synthesizes and reflects multiple indicators [61]. This study adopts the standard deviation normalization method to calculate the comprehensive indices of land urbanization and carbon emissions in the Yangtze River Delta urban agglomeration [20]. This method enables the measurement of comprehensive indices for the land urbanization system, energy consumption carbon emission system, and their subsystems, laying the foundation for subsequent CCD analysis. The calculation formula is as follows [20,62]:
Y k = j = 1 n ω j × x i j , k = 1 , 2 , , 27
where Y k represents the comprehensive index, ω j denotes indicator weights, and x i j is the standardized value of the j -th indicator for the i -th sample.
Y k - t = ω × Y k
ω = t / t = 1 m t , t = 1 , 2 , , m
Based on this, a comprehensive evaluation and analysis are conducted. A higher comprehensive index indicates a higher level of urbanization development, while a lower index suggests the opposite. By combining the variance of ranking results, the overall volatility of the sample is assessed. A smaller ranking variance implies lower volatility in the urban agglomeration’s development, whereas a larger variance reflects higher volatility.

3.2.3. Coupling Coordination Degree Model

The concept of “coupling” originated in physics, referring to the interaction between systems. It has since been applied to studies on economic development, industrial structure, social environments, and technological innovation [63]. Coupling degree measures the intensity of interaction between systems, such as land urbanization and energy consumption carbon emissions, to assess their temporal development order [21,64]. Coordination degree, on the other hand, reflects the level of mutual alignment between systems within the same period, evaluating their harmonious consistency.
This study defines the CCD as the extent to which land urbanization and energy consumption carbon emissions interact and influence each other through their respective elements. The model comprises three components: coordination degree (T), coupling degree (C), and CCD, with classification criteria and thresholds.
(1)
Coordination Degree
The coordination degree represents the comprehensive evaluation index of the development levels of land urbanization and energy consumption carbon emissions, reflecting their overall synergistic benefits. The formula is as follows [47,62]:
T = a μ 1 + b μ 2
In the formula, a and b are the weights to be determined, and this study considers that the contribution of land urbanization and energy consumption carbon emissions were the same, so a and b take the same weight value of 0.5 [16,60]; μ 1 and μ 2 represent land urbanization and energy consumption carbon emissions, respectively.
(2)
Coupling Degree
Drawing from the physics concept of “capacity coupling” and the coupling coefficient model, the coupling degree quantifies the interdependence between systems. For land urbanization and energy consumption carbon emissions, the formula is as follows [60]:
C = ( U 1 × U 2 × U 3 × U n ) / ( U i + U j ) 1 / m
C = 2 ( μ 1 × μ 2 ) / ( μ 1 + μ 2 ) 2 1 / 2
where μ (n = 1, 2, … m ) in each subsystem assessment value, m was the number of subsystems, and because this study only uses 2 systems of land urbanization and energy consumption carbon emissions, m = 2. C was the coupling degree, and C ∈ [0, 1] [20], if the larger the value of C, the more coupled the two developments are, C = 1, to reach the best coupling state.
(3)
Coupling Coordination Degree
Relying solely on T or C may introduce errors, obscure dynamic trends, and hinder cross-sectional comparisons. Thus, the CCD integrates both metrics to measure the coordinated development status [21,60,62]:
C C D = C × T
where CCD ∈ [0, 1] [20].
(4)
Classification Standards
Based on existing studies, CCD values are classified into distinct coordination levels (Table 3) [53].

3.2.4. Spatial Autocorrelation

Spatially, the CCD between land urbanization and energy consumption carbon emissions in the Yangtze River Delta exhibits significant spatial correlations. To analyze these patterns, this study employs Exploratory Spatial Data Analysis (ESDA), a suite of spatial statistical methods to assess spatial dependencies [41,65]. Global Spatial Autocorrelation: Measured using Moran’s I index, this evaluates the overall spatial clustering of the observed indicator (e.g., CCD) across the study area. Local Spatial Autocorrelation: Assessed via Local Moran’s I index, this identifies spatial clusters or outliers and quantifies the association between each spatial unit and its neighbors [40,42]. Its calculation formula is as follows [23]:
M o r a n s I = n i i j w i j ( y i y ¯ ) ( y j y ¯ ) ( i i j w i j ) i ( y i y ) 2
where n is the number of spatial units, w i j is the value in the spatial weights matrix w corresponding to the geographic districts, and y is the value of CCD in this paper. The value of M o r a n s   I ranges from −1 to 1. A positive value of M o r a n s   I means the positive spatial correlation among the spatial units; a negative value of M o r a n s   I indicates negative spatial correlation, and 0 implies no spatial correlation. Statistical tests of spatial autocorrelation can be judged by the z-value of M o r a n s   I . High z-values indicate highly significant spatial correlation.
Using ArcGIS 10.8 (Esri, Redlands, CA, USA) and GeoDa software 1.20 (GeoDa Center, Tempe, AZ, USA), this study analyzes the spatial autocorrelation of the CCD between land urbanization and energy consumption carbon emissions in the Yangtze River Delta urban agglomeration.

4. Results

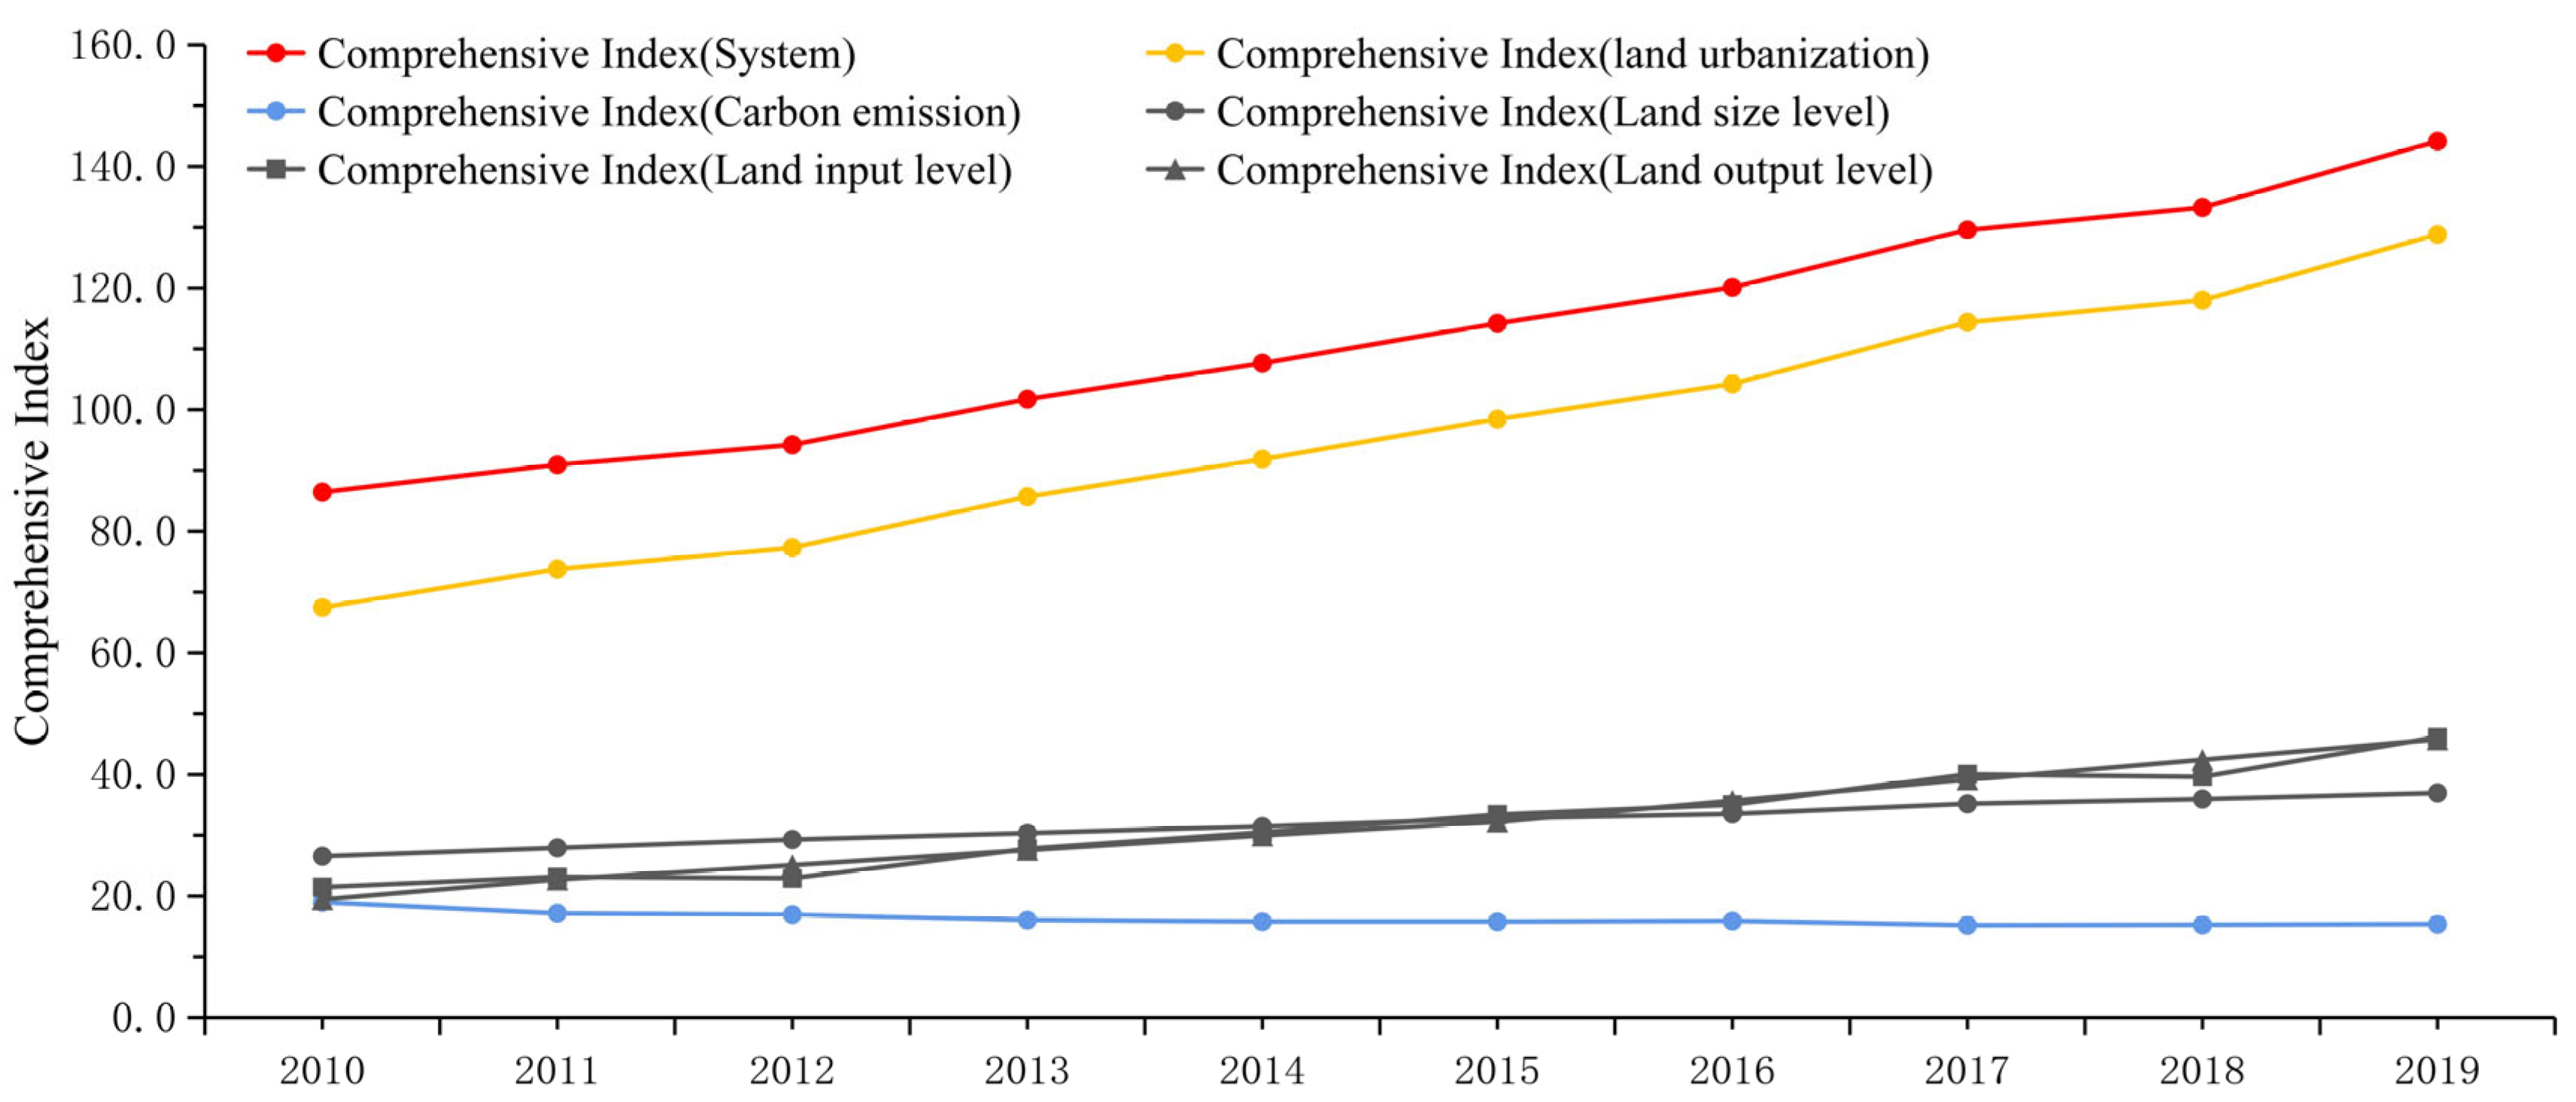
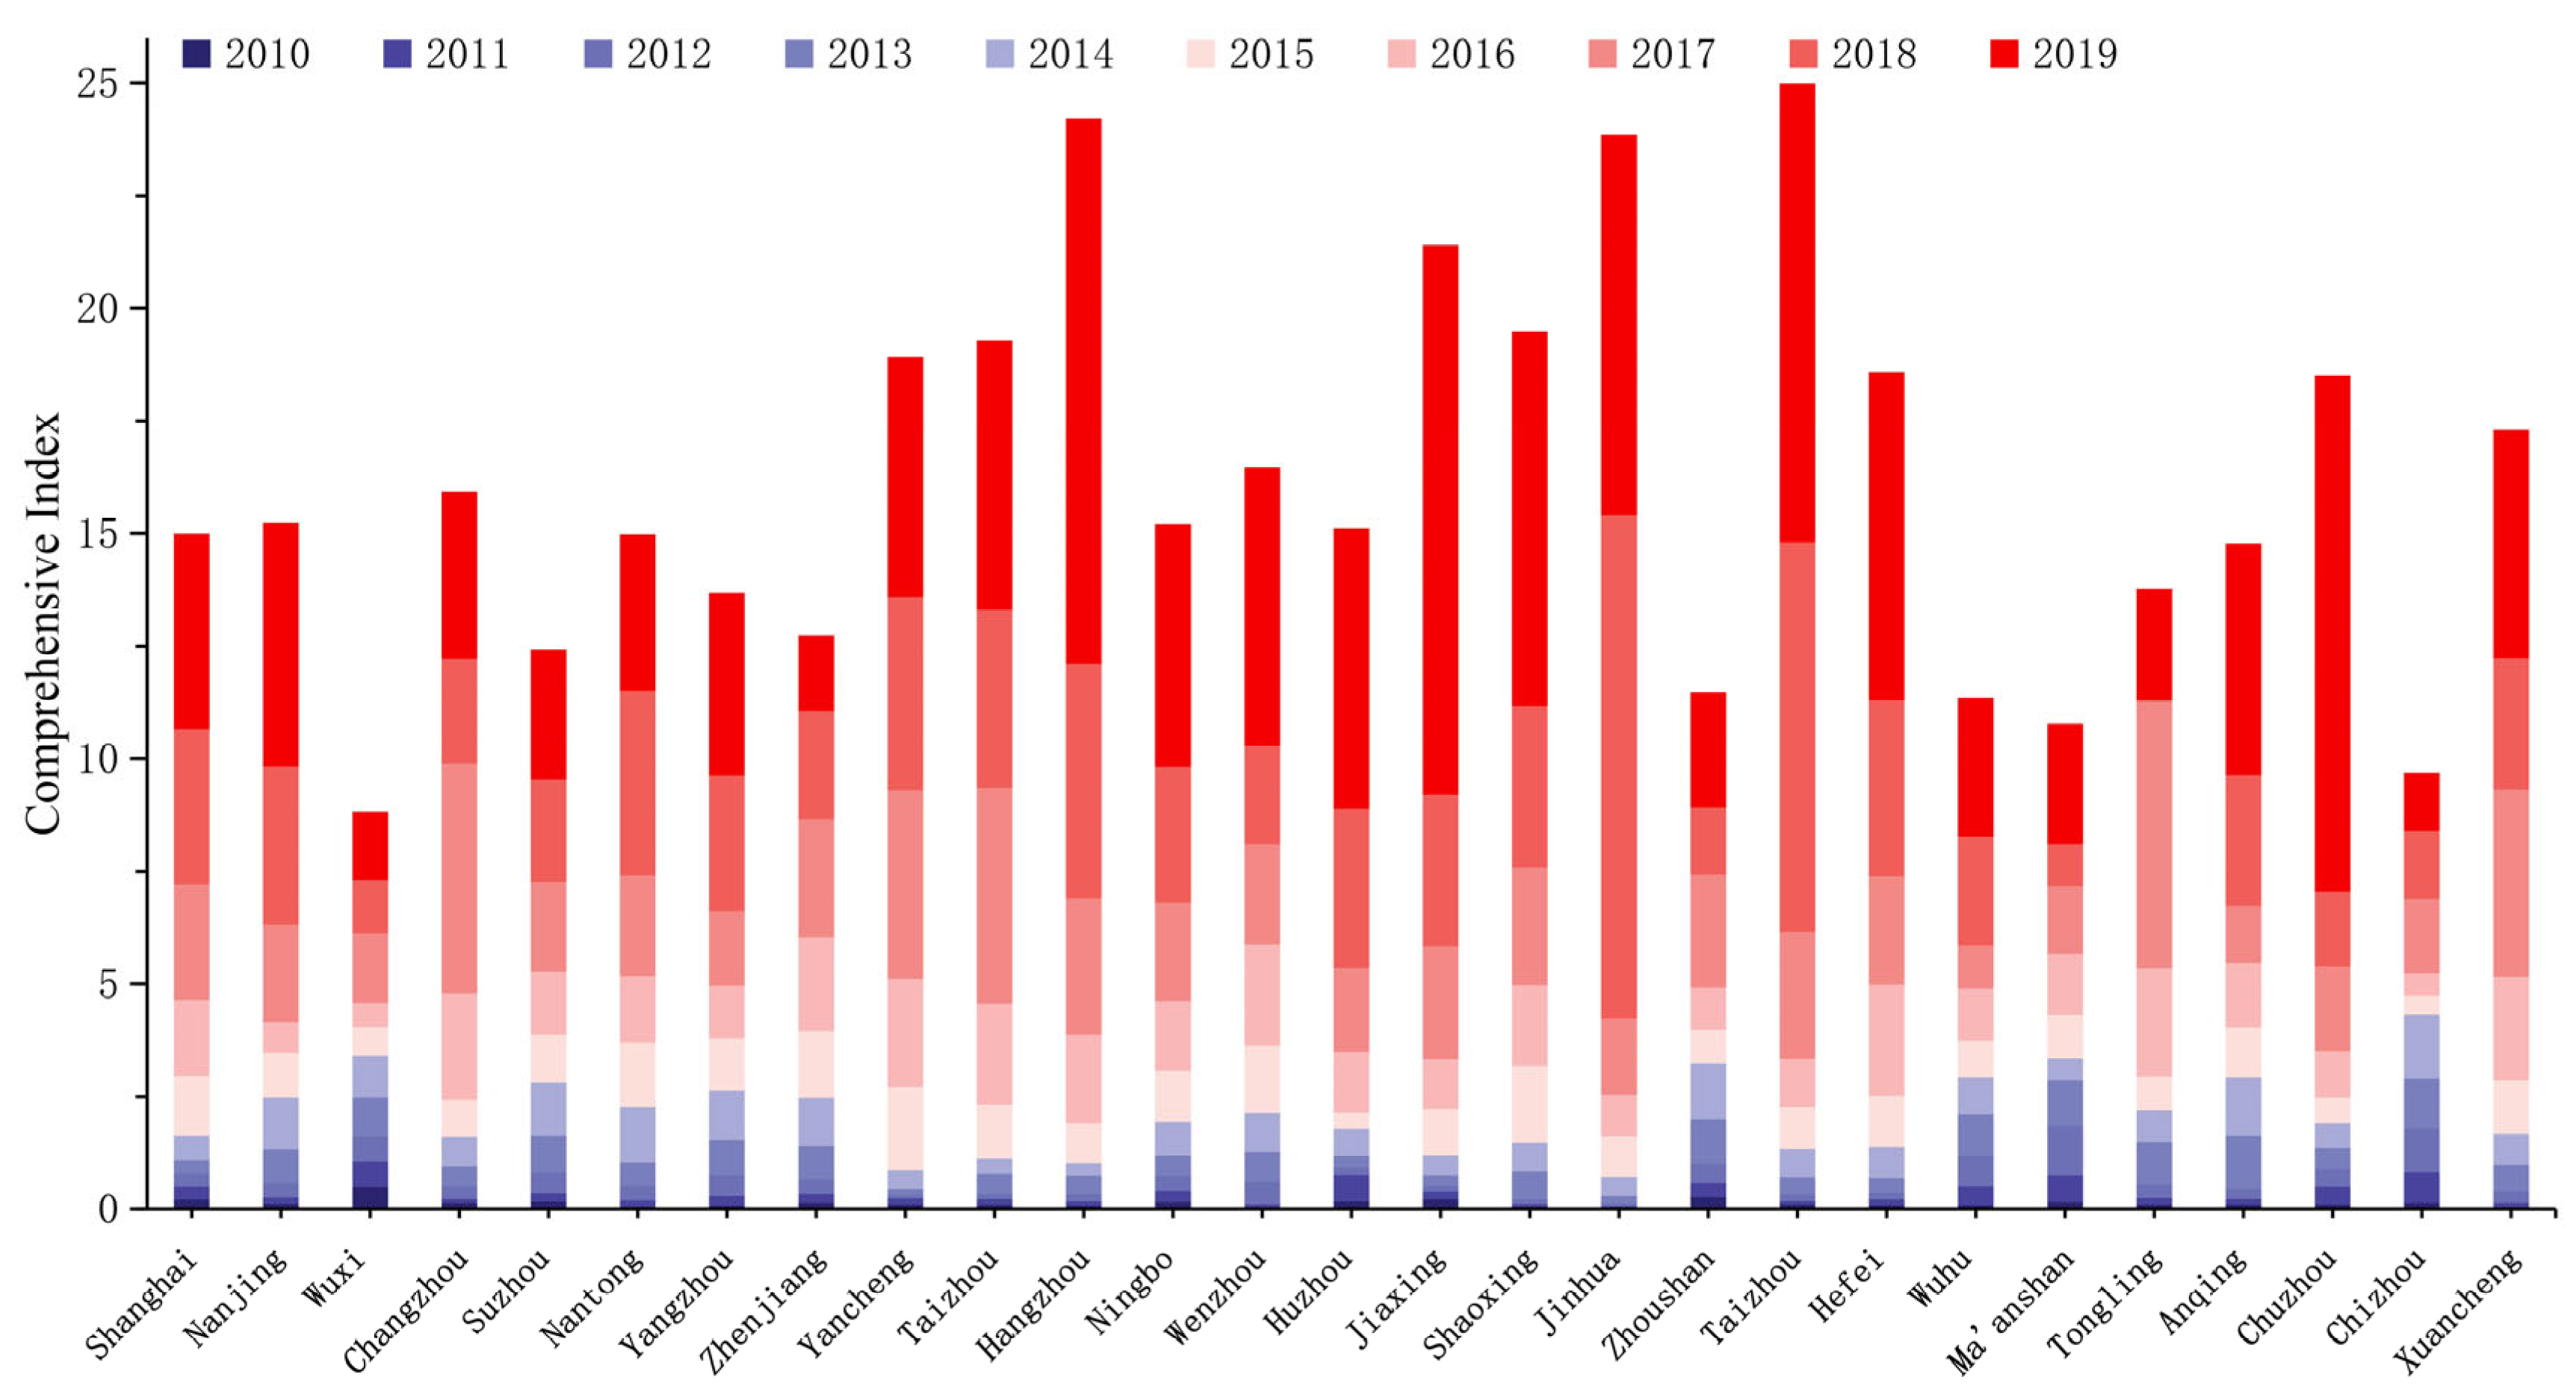
4.1. Analysis of the Land Urbanization and Carbon Emissions Comprehensive Index

To investigate the comprehensive development level of the Yangtze River Delta urban agglomeration from 2010 to 2019, this study employs the inter-group addition and intra-group multiplication calculation method based on the established evaluation system to analyze the multi-indicator comprehensive indices at the urban agglomeration level, as shown in Figure 2. The comprehensive index of the Yangtze River Delta urban agglomeration system increased from 86.442 in 2010 to 144.164 in 2019, with an average annual growth rate of 5.772%. The comprehensive index of the land urbanization subsystem rose from 67.471 in 2010 to 128.804 in 2019, with an average annual growth rate of 4.762%, indicating an overall positive upward trend in the land urbanization and carbon emission systems. Meanwhile, the comprehensive index of the carbon emission subsystem decreased from 18.971 in 2010 to 15.36 in 2019, with an average annual decline rate of 1.903%. These results demonstrate that the overall system exhibited a positive upward trend, with the comprehensive indices of the system and the land urbanization subsystem showing highly similar growth trajectories (annual growth rate difference: 1.01%). This suggests that the system’s comprehensive index was predominantly influenced by the land urbanization subsystem, while the carbon emission subsystem had a minimal impact on the system’s overall index.
Following the analysis of the comprehensive indices at the urban agglomeration level, this study further examines the comprehensive indices of the 27 cities within the Yangtze River Delta urban agglomeration from 2010 to 2019 (Figure 3). Based on their comprehensive index growth rates, the cities are categorized into four development levels from low to high. Cities with growth rates between 0% and 0.3% include Wuxi, Suzhou, Zhenjiang, Zhoushan, Tongling, Ma’anshan, and Chizhou, totaling seven cities. Cities with growth rates ranging from 0.3% to 0.6% encompass Shanghai, Nanjing, Changzhou, Nantong, Yangzhou, Yancheng, Taizhou, Ningbo, Wuhu, Anqing, and Xuancheng, comprising 11 cities. Cities with growth rates of 0.6% to 1.0% consist of Wenzhou, Huzhou, Shaoxing, Jinhua, and Hefei, totaling five cities. Cities with growth rates exceeding 1.0% include Hangzhou, Jiaxing, Taizhou, and Chuzhou, amounting to four cities. Overall, significant progress in comprehensive indices was observed across all 27 cities during the study period.
Following the analysis of comprehensive indices at both the urban agglomeration and individual city levels, this study further examines the comprehensive indices of the land urbanization subsystem and carbon emission subsystem across the 27 cities in the Yangtze River Delta urban agglomeration from 2010 to 2019 (Figure 4a,b). From 2010 to 2019, the comprehensive index of land urbanization consistently exceeded that of carbon emissions. The smallest gap between the two indices occurred in 2010 (48.5), while the largest gap reached 113.444 in 2019, with an annual average difference of 79.7659. These results highlight a persistent imbalance in the development between the land urbanization and carbon emission subsystems.

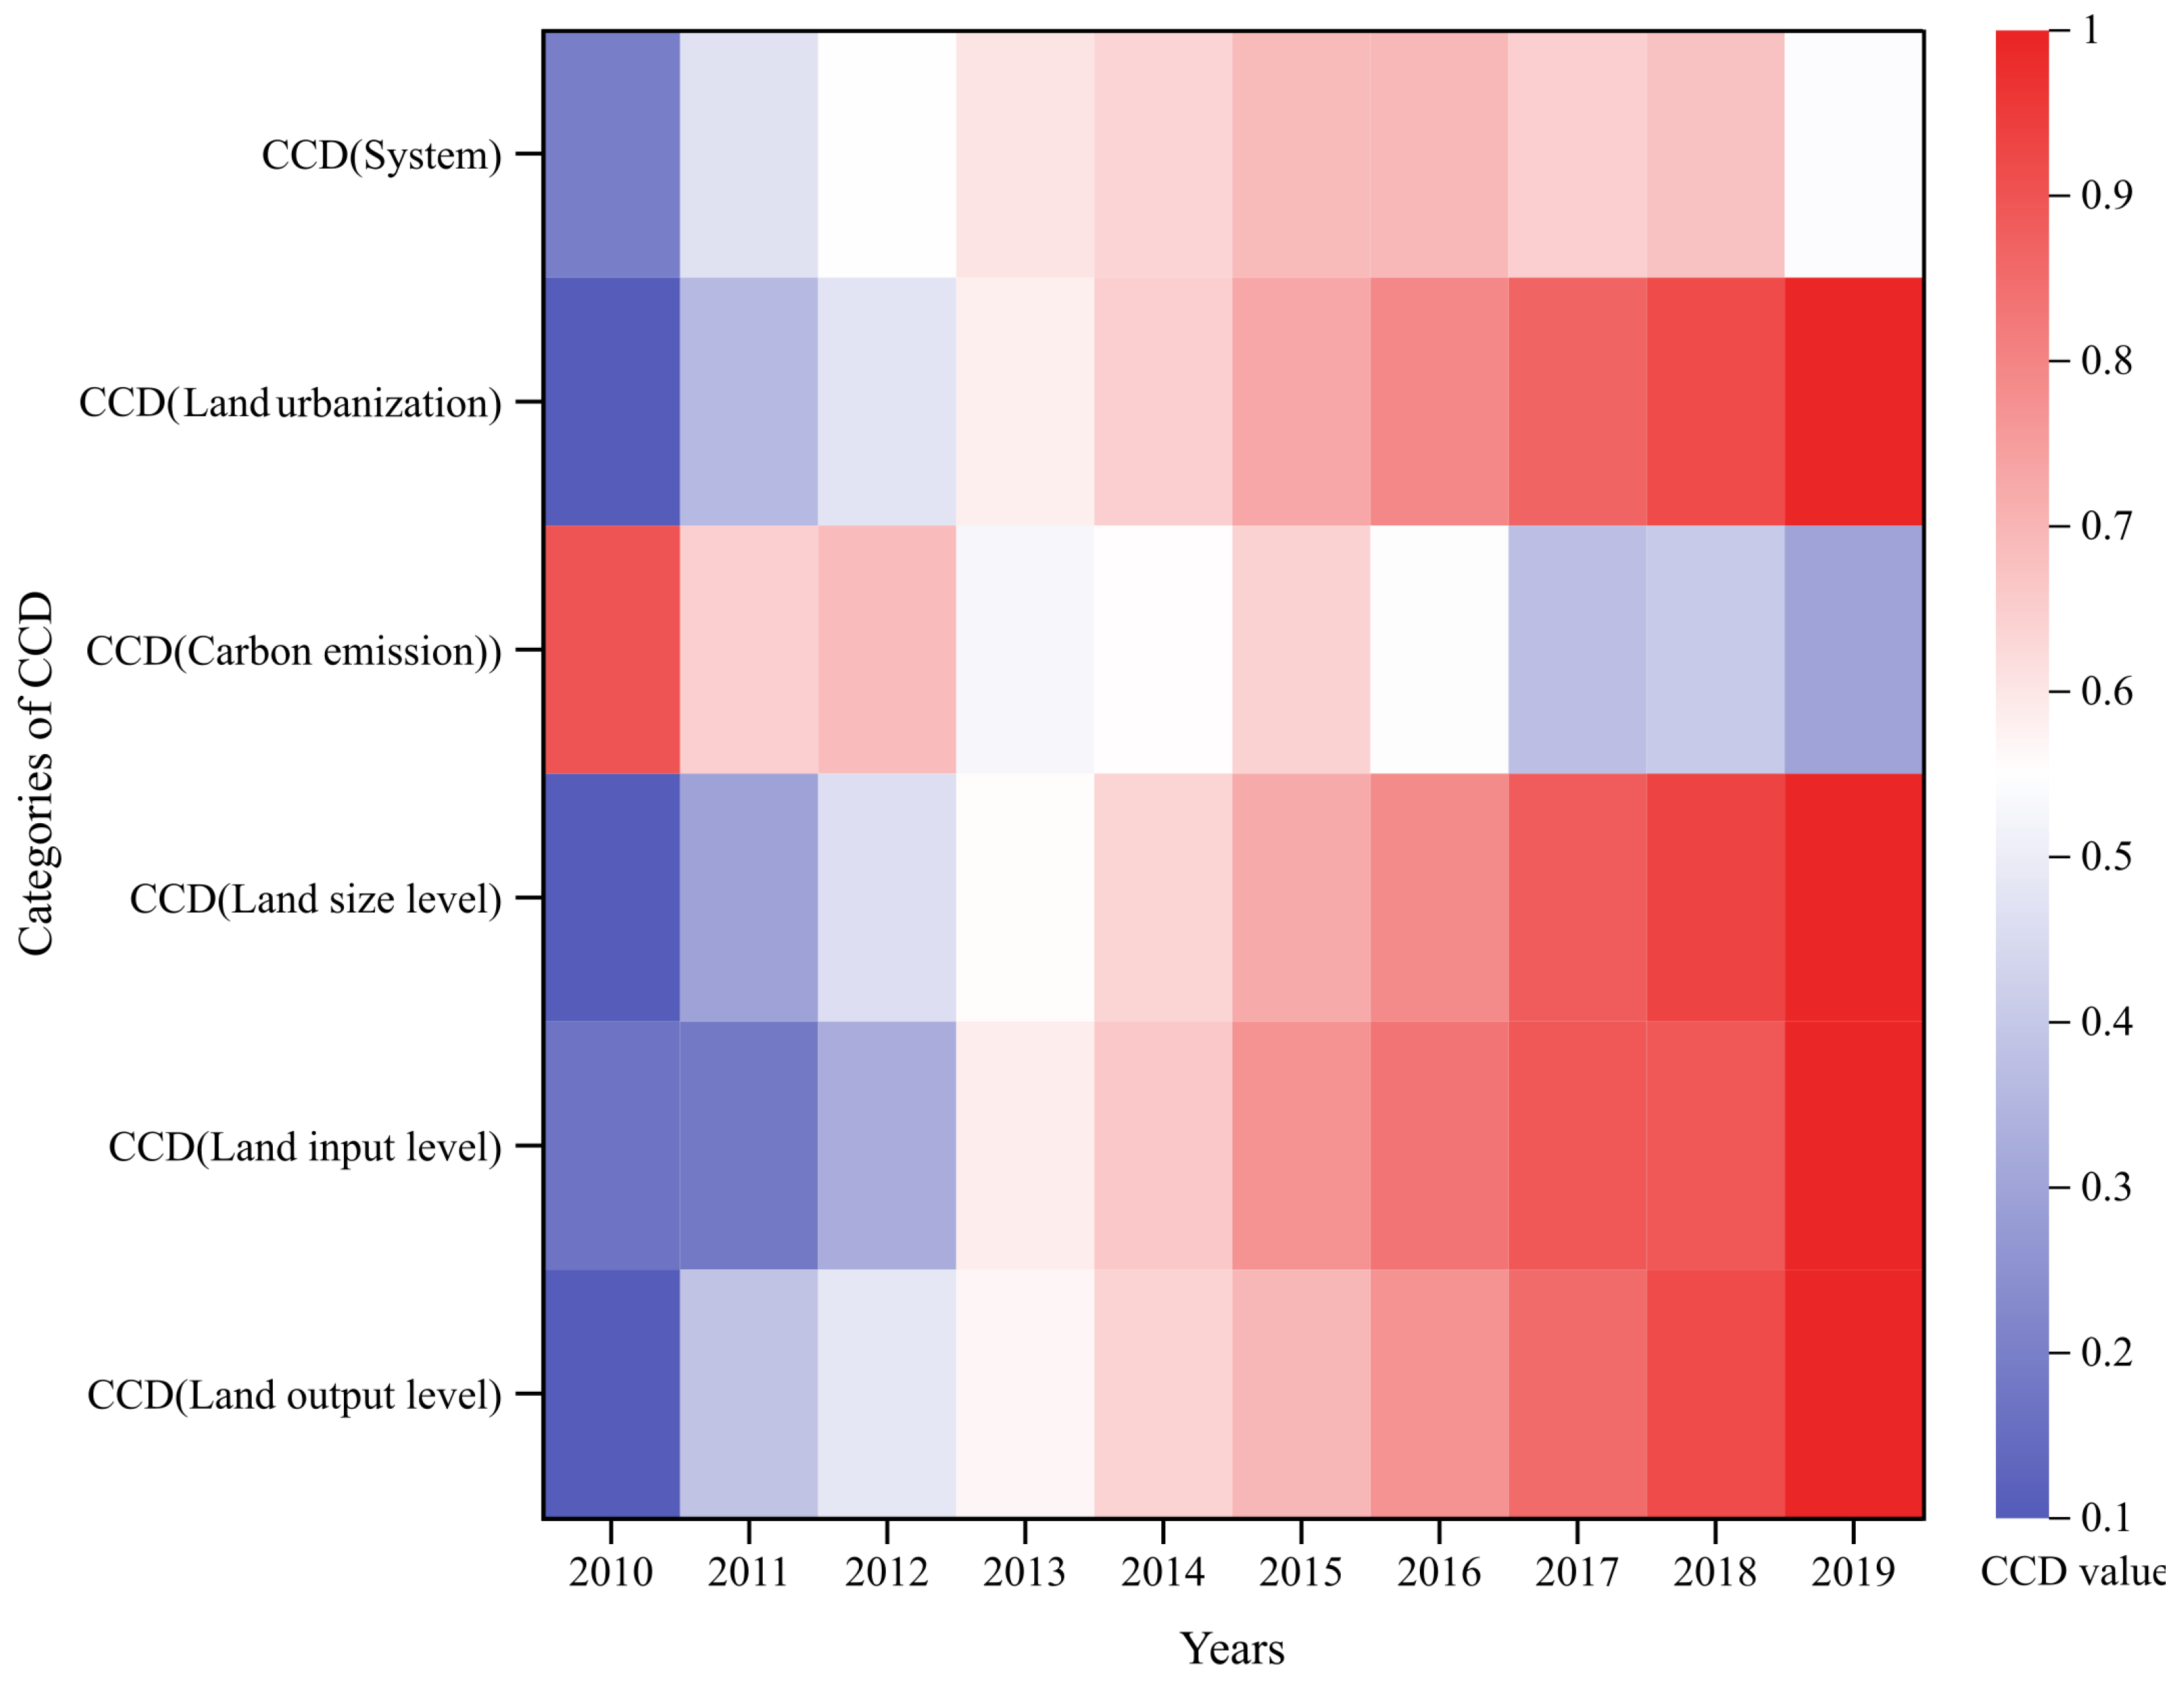
4.2. Time Variation Characteristics of the Coupled Coordination Between the Land Urbanization and Carbon Emissions

Based on the calculation steps of the CCD model, including data processing and weight determination, the CCD between land urbanization and carbon emissions in the Yangtze River Delta urban agglomeration from 2010 to 2019 was derived (Figure 5). The system’s CCD increased from 0.195 (severe imbalance) in 2010 to 0.541 (marginal coordination) in 2019, demonstrating an overall upward trend. Subsystem analysis revealed divergent trajectories: (1) The CCD of the land urbanization subsystem rose steadily from 0.1 (extreme imbalance) in 2010 to 0.995 (high-quality coordination) in 2019. (2) The CCD of the carbon emission subsystem declined from 0.902 (high-quality coordination) in 2010 to 0.296 (moderate imbalance) in 2019. (3) The CCD trends of the two subsystems exhibited opposite directions. The largest gap between subsystem CCD values occurred in 2010 (0.098), coinciding with the lowest system CCD (0.195). The smallest gap (0.057) was observed in 2013, when the system CCD reached a relatively high level (0.605). For secondary indicators of land urbanization (land scale, land input, and land output), their CCD values followed similar upward trajectories. Overall, these findings indicate a continuous improvement in the coordination between land urbanization and carbon emissions over the decade, with low-carbon urbanization gradually progressing in a positive direction.

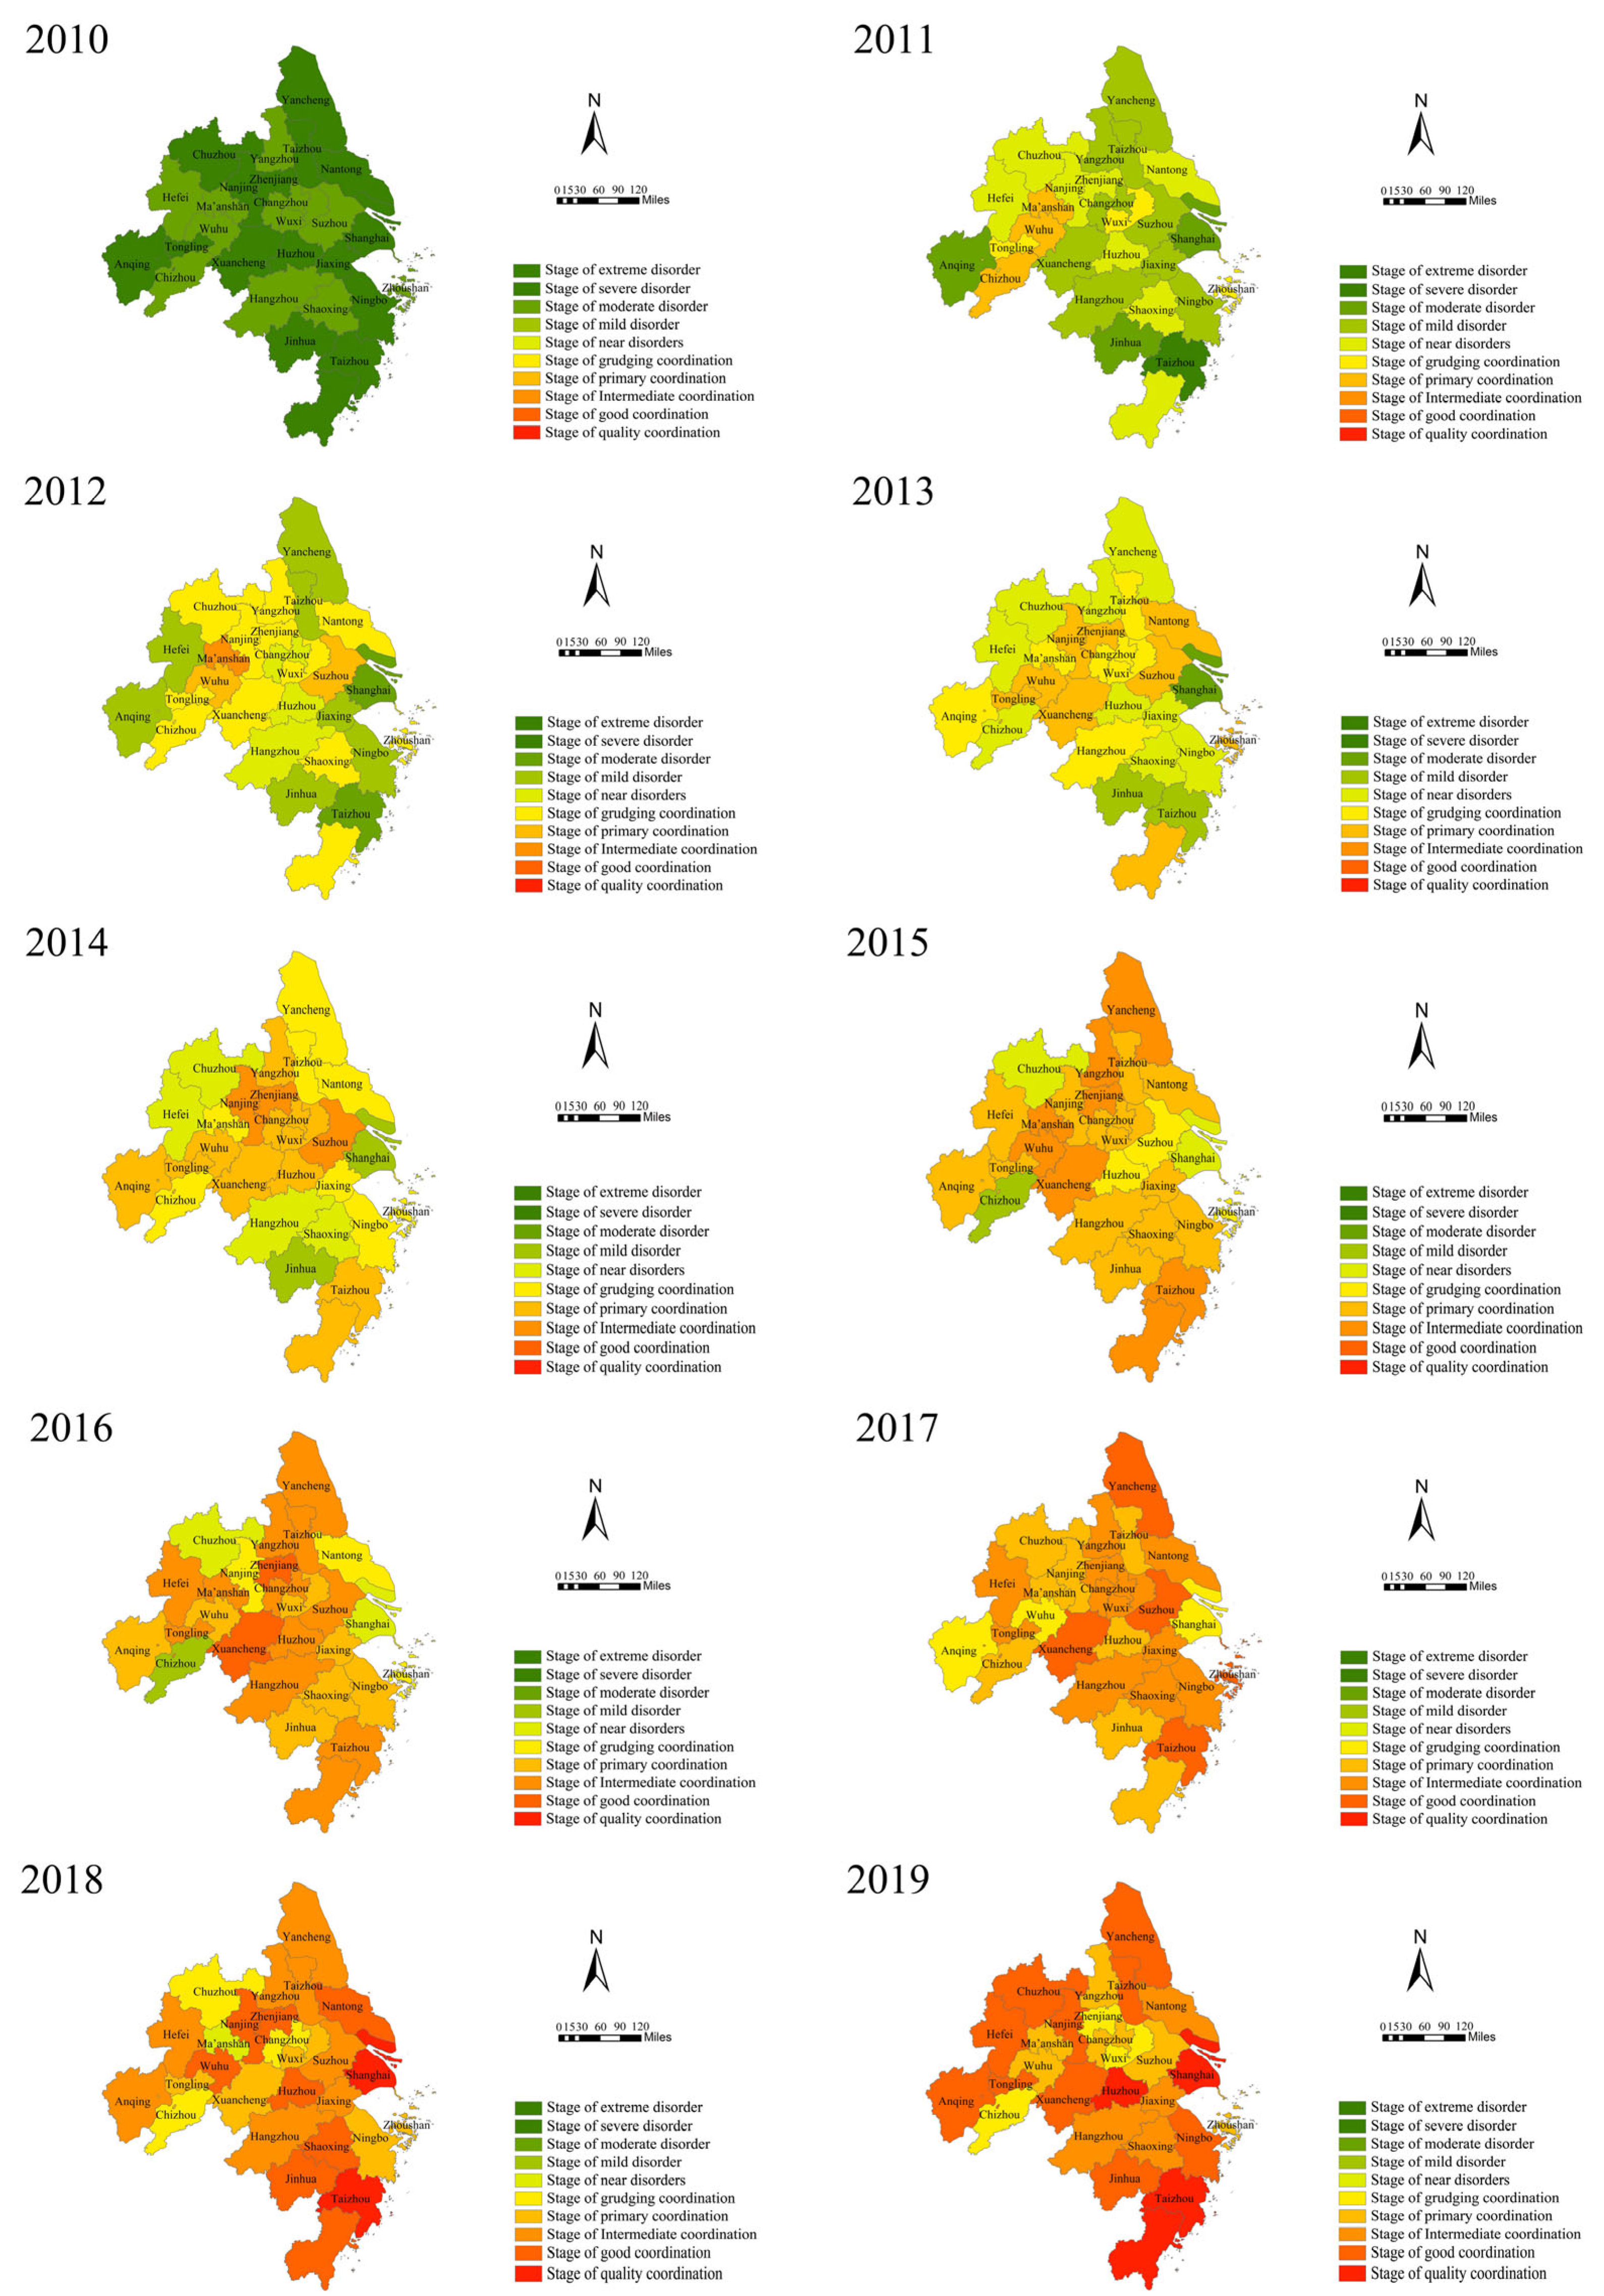
4.3. Spatial Variation in CCD Between Land Urbanization and Carbon Emissions

Based on ArcGIS 10.4 software, the spatial distribution of CCD across the 27 cities in the Yangtze River Delta urban agglomeration from 2010 to 2019 is illustrated in Figure 6. In 2010, all cities were categorized into extreme imbalance or severe imbalance stages. By 2019, most cities transitioned into various coordination stages. Only Zhenjiang, Chuzhou, and Wuxi (three cities) remained in the marginal coordination stage, while the rest advanced to primary coordination or higher. The number of cities in high coordination stages gradually increased: Shanghai, Huzhou, Taizhou, and Wenzhou (four cities) reached the high-quality coordination stage, and Nanjing, Hefei, Anqing (ten cities) achieved the good coordination stage. Cities in high-quality coordination were predominantly concentrated in the eastern and southern coastal regions, whereas those in good coordination were mainly located in the western regions. Notably, Shanghai transitioned from marginal coordination in 2017 to high-quality coordination in 2018, while cities such as Wuhu, Zhenjiang, and Shaoxing experienced minor regressions. The analysis reveals significant growth trends in CCD across all cities, although notable disparities persist among them.

4.4. Spatial Autocorrelation Analysis of Land Urbanization and Carbon Emissions

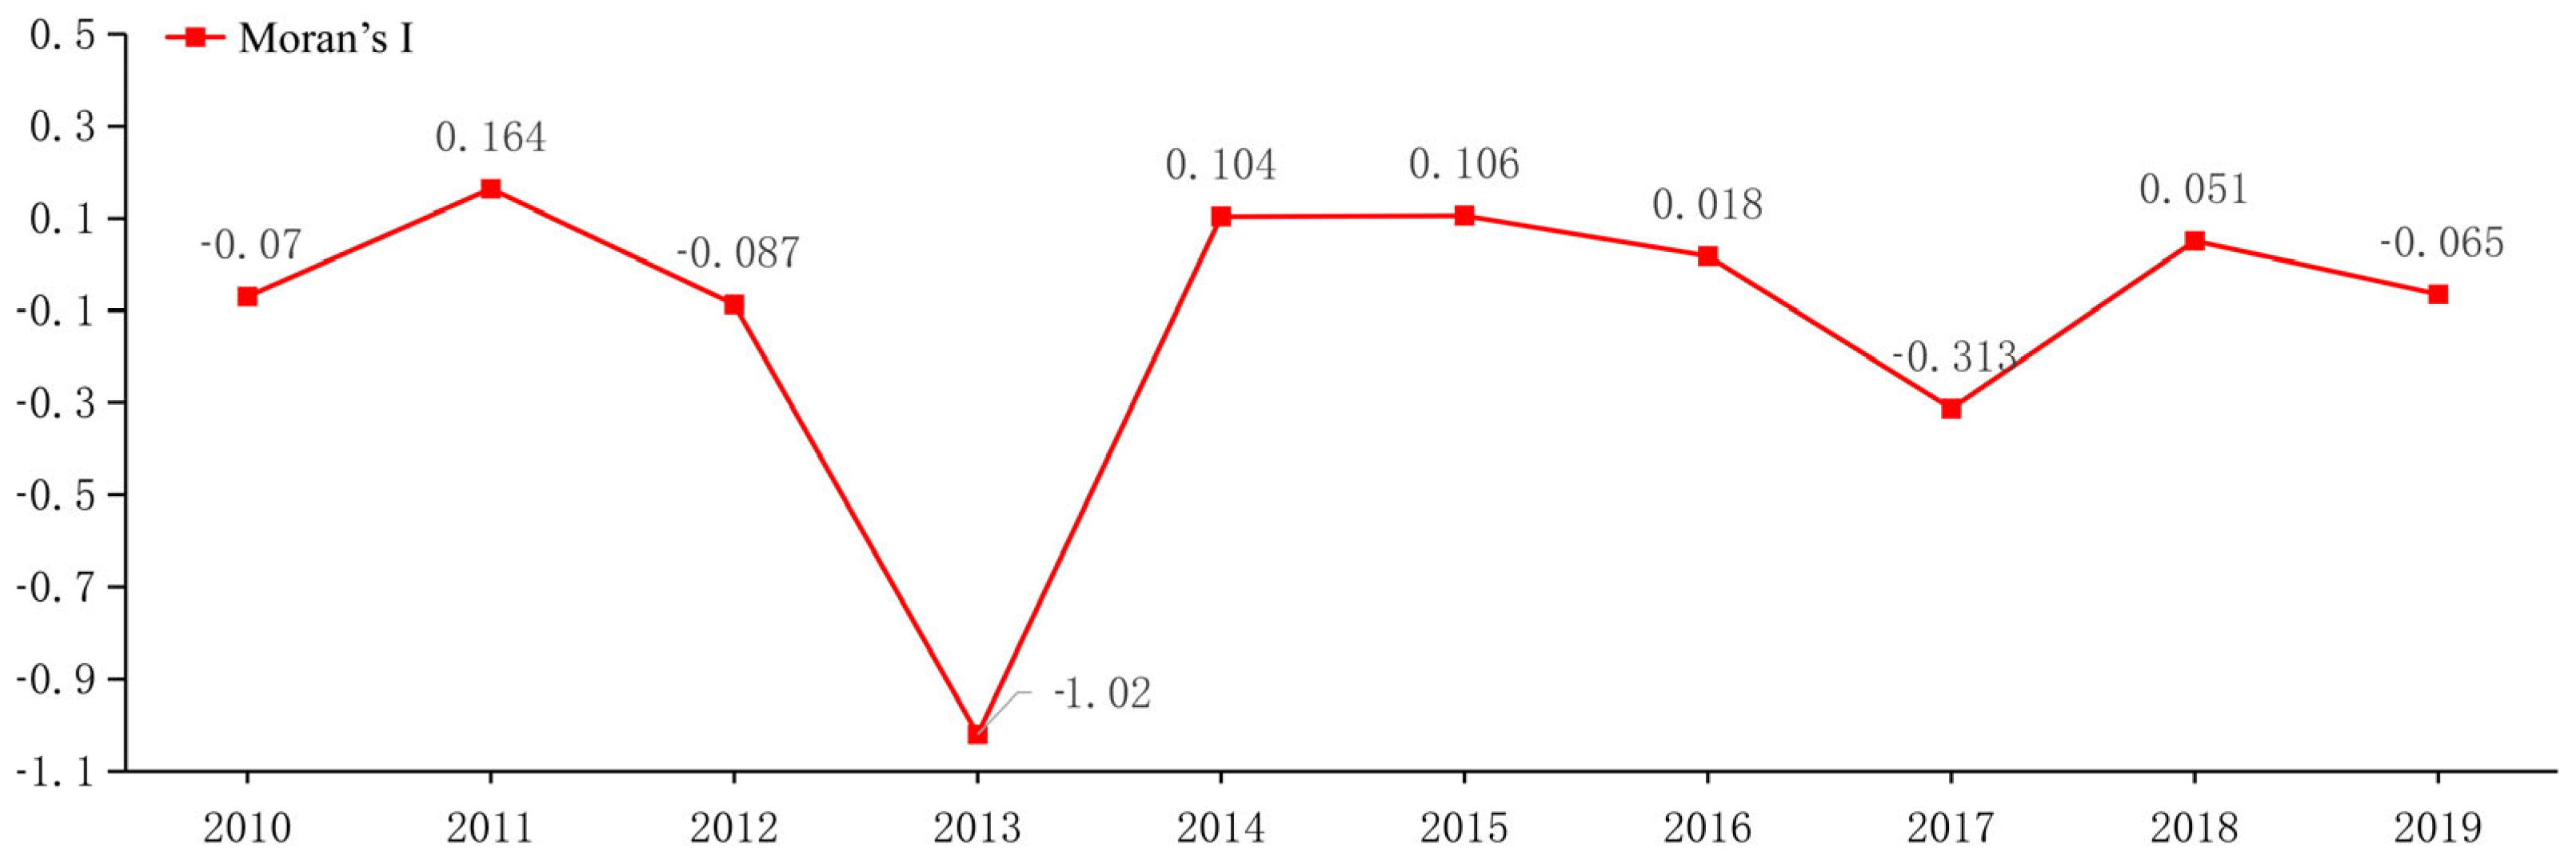
4.4.1. Global Spatial Autocorrelation

Using panel data from the 27 cities within the Yangtze River Delta urban agglomeration (2010–2019), this study calculates the Global Moran’s I index for the CCD between land urbanization and energy consumption carbon emissions using GeoDa software 1.20 (GeoDa Center, Tempe, AZ, USA) (Figure 7). The Moran’s I values alternated between negative and positive during the study period, indicating unstable spatial correlations in CCD levels. This fluctuation reflects heterogeneous coordination levels among neighboring cities, with unstable interdependencies and spatially clustered patterns.

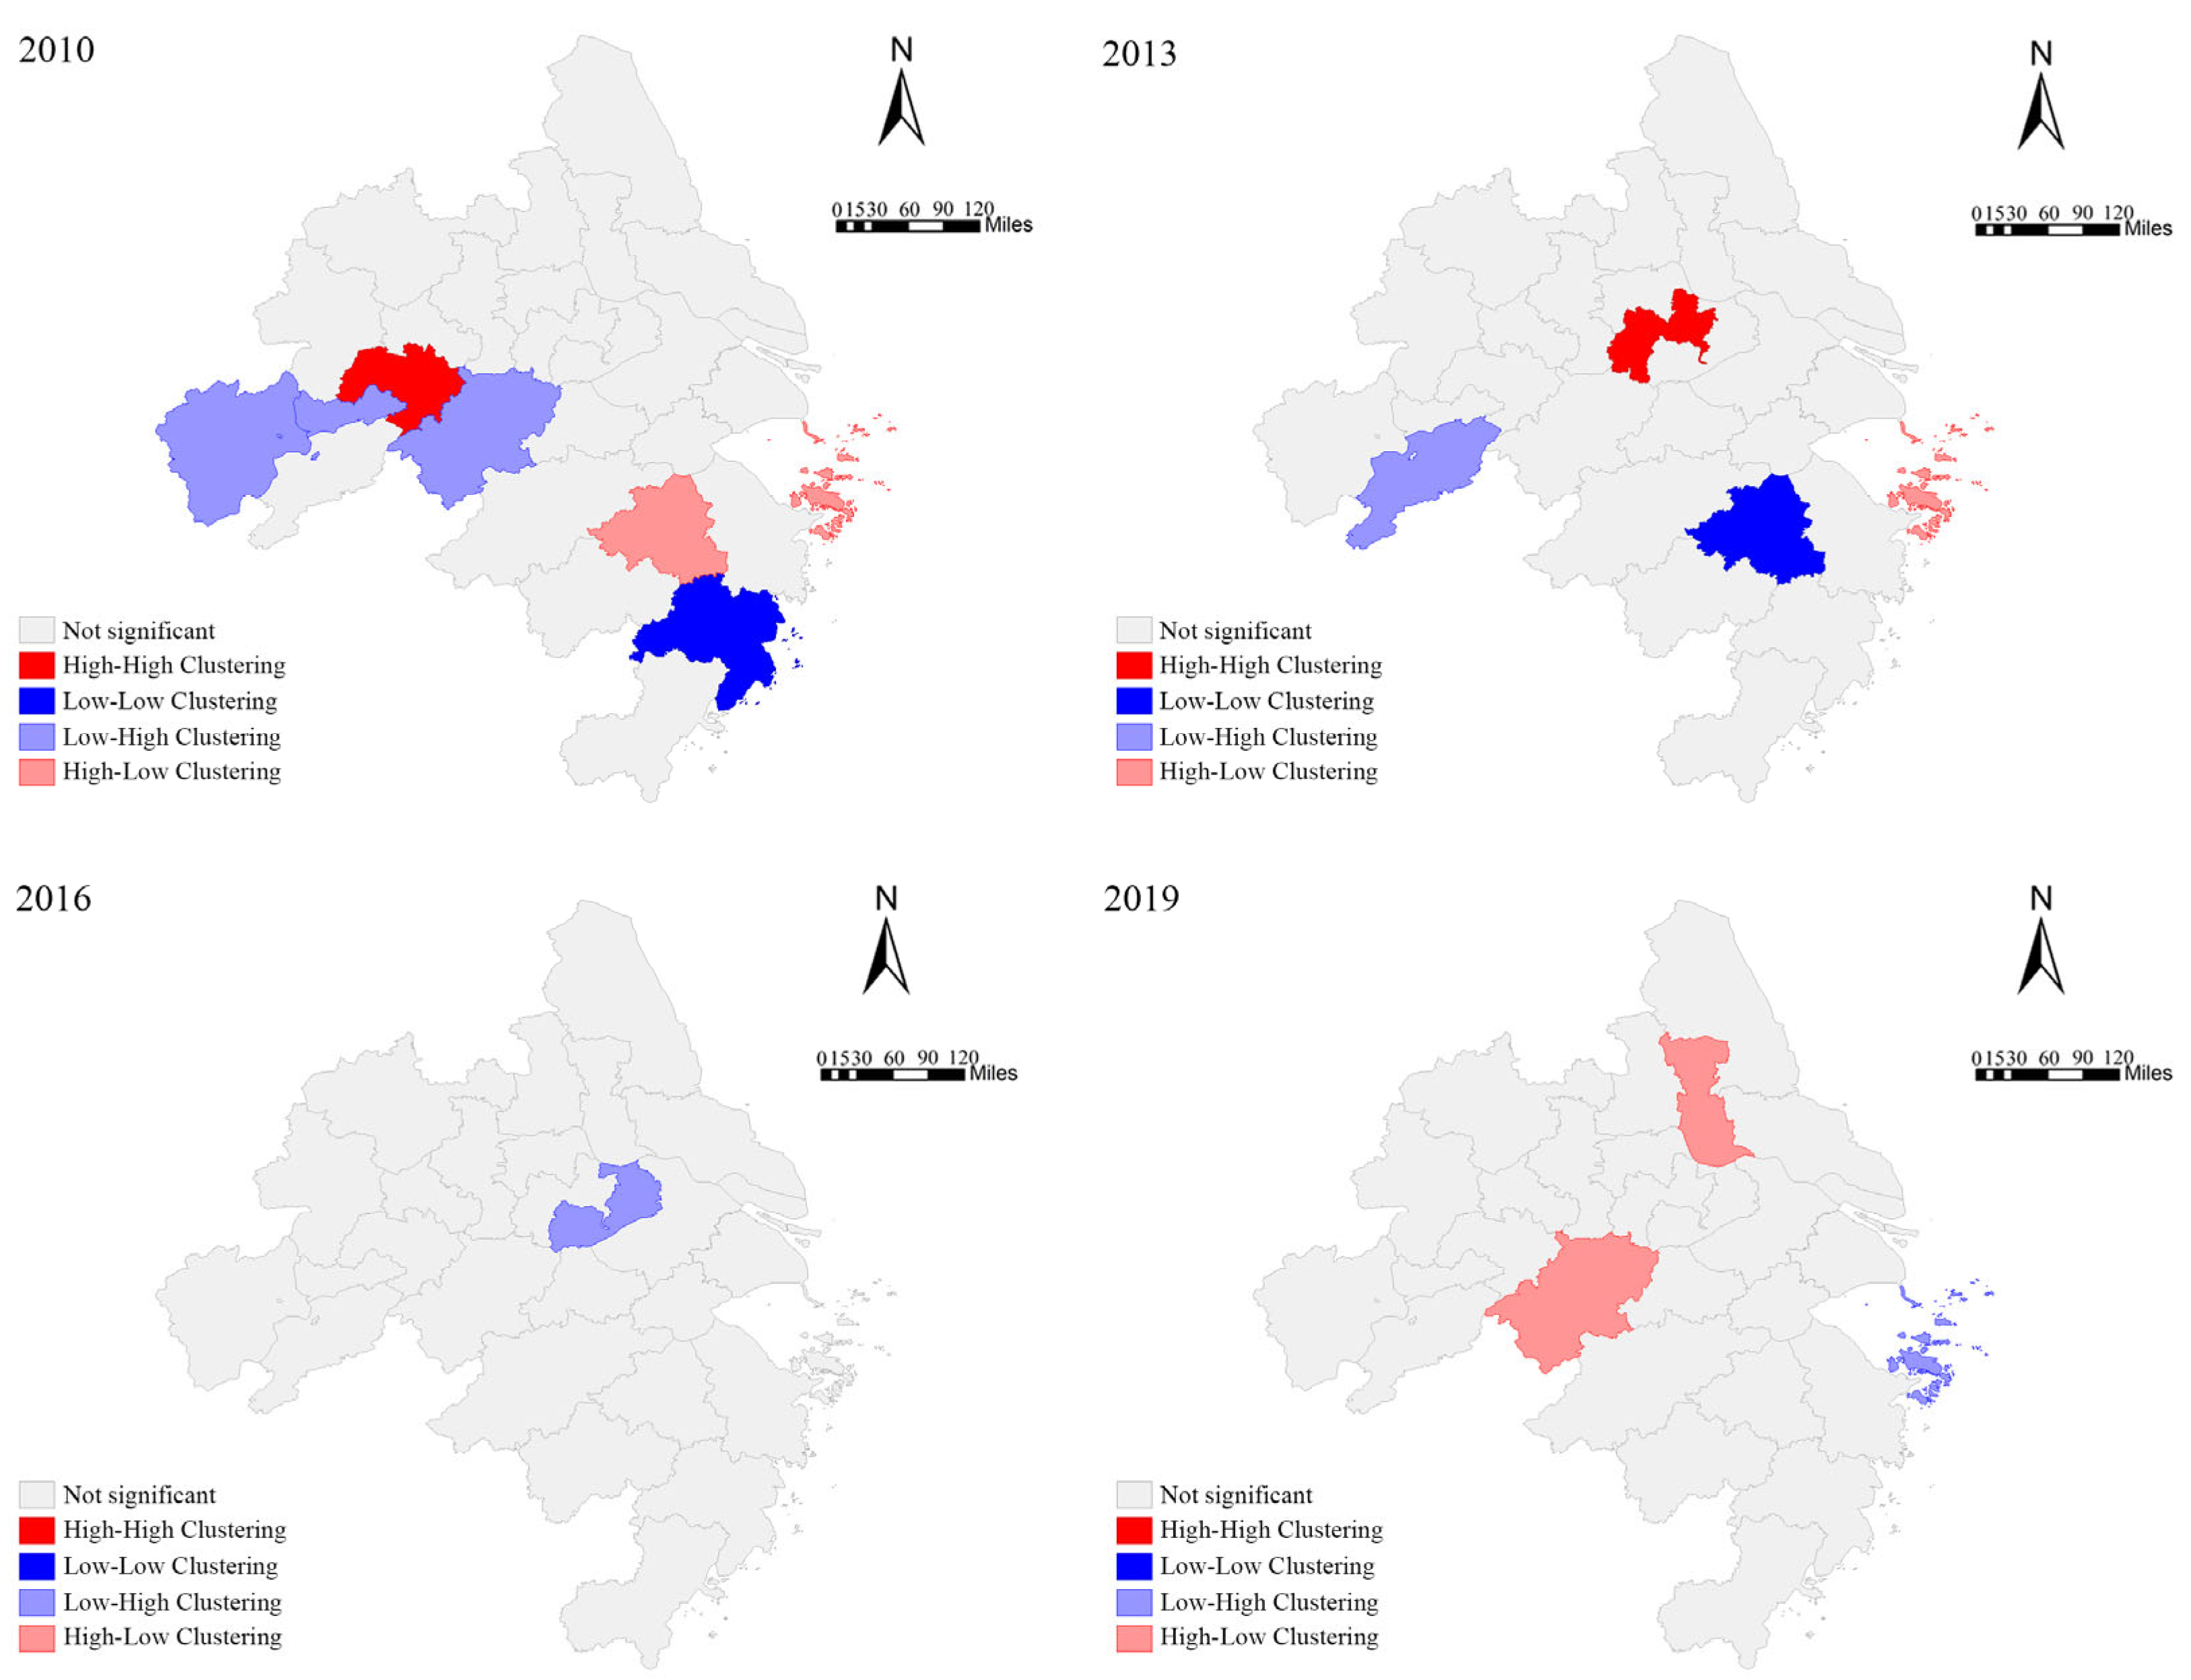
4.4.2. Local Spatial Autocorrelation

To further examine the localized spatial associations of CCD, a local spatial autocorrelation analysis was conducted using GeoDa software 1.20 (GeoDa Center, Tempe, AZ, USA) (Figure 8). From 2010 to 2019, most areas in the Yangtze River Delta urban agglomeration exhibited no significant clustering characteristics in CCD. However, localized spatial aggregation patterns showed minor changes: (1) 2010: Spatial clusters emerged in the western region, with Wuhu forming a “high–high” cluster and Tongling, Anqing, and Xuancheng classified as “low–high” clusters. (2) 2013: Clustering diminished in the west, with only Chizhou remaining a “low–high” cluster. Shaoxing became a “low–low” cluster, while Changzhou emerged as a “high–high” cluster. Zhoushan appeared as a “high–low” outlier. (3) 2016: Most areas showed insignificant clustering, except Changzhou, which transitioned from “high–high” to “low–high”. (4) 2019: Localized clusters persisted in Zhoushan (“low–high”) and Xuancheng and Taizhou (“high–low”), but no widespread spatial aggregation patterns formed. These results highlight the dynamic and fragmented nature of spatial coordination patterns in the Yangtze River Delta urban agglomeration.
Specifically, in 2010, spatial clustering occurred in the western Yangtze River Delta urban agglomeration, where cities exhibited synergistic coordination. Wuhu formed a “high–high” cluster, indicating that its rising CCD level positively influenced neighboring cities. Tongling, Anqing, and Xuancheng were categorized as “low–high” clusters. By 2013, western cities exited clustering patterns, halting the synergistic development trend, with only Chizhou emerging as a “low–high” cluster. Simultaneously, Shaoxing became a “low–low” cluster, reflecting lagging development in land urbanization and energy consumption carbon emissions. Changzhou formed a “high–high” cluster, exerting a positive driving effect on coordination levels in surrounding cities. Zhoushan appeared as a “high–low” cluster, suggesting that its improved CCD level suppressed coordination in adjacent areas. In 2016, only Changzhou transitioned from a “high–high” to a “low–high” cluster, while other regions showed no significant clustering. This indicates that the CCD levels of land urbanization and energy consumption carbon emissions failed to form widespread spatial aggregation during this period, with limited interdependencies or driving effects among cities. By 2019, coordinated development remained localized rather than regionally aggregated. Zhoushan persisted as a “low–high” cluster, while Xuancheng and Taizhou became “high–low” clusters. These findings underscore the fragmented and unstable spatial coordination patterns across the Yangtze River Delta urban agglomeration.

5. Discussion

5.1. Composite Index Characteristics of Land Urbanization and Carbon Emissions from Energy Consumption

This study constructs composite indices for land urbanization and carbon emissions from energy consumption, revealing the dynamic relationship between the two in the Yangtze River Delta urban agglomeration. From 2010 to 2019, the composite index for land urbanization increased from 67.471 to 128.804, while the composite index for carbon emissions decreased from 18.971 to 15.36, indicating a gradual coordination between urbanization and carbon emissions reduction. These findings are consistent with the studies of Xu et al. [15], Liu et al. [62] and Xu et al. [66] which also suggest that, as land urbanization progresses, carbon emissions are to some extent controlled in certain regions. However, this study further reveals that, despite overall improvements in coordination, regional differences remain significant. For instance, the composite index for land urbanization in Shanghai increased from 0.65 to 0.85, while in peripheral cities such as Suqian and Yangzhou, the index only increased from 0.40 to 0.52, indicating a disparity in low-carbon urbanization processes between core cities and peripheral cities [67,68].
These findings align with the research by Lin et al. [19] and Shan et al. [51], who also noted that improvements in land urbanization are generally associated with reductions in carbon emissions, but the actual effects are influenced by factors such as urban development stages and policy support. Therefore, this study emphasizes that, although core cities have made significant progress in low-carbon transformation, peripheral cities still face greater transformation pressures and require differentiated low-carbon policies.

5.2. Characteristics of the Horizontal Time Dynamics of the CCD

Based on the analysis of the Coupling Coordination Degree (CCD), this study finds that, from 2010 to 2019, the CCD for the Yangtze River Delta urban agglomeration steadily increased from 0.195 (severe imbalance) to 0.541 (near coordination). This upward trend aligns with the findings of Shan et al. [48], who also observed a gradual increase in the coordination between land urbanization and carbon emissions over time. However, despite the overall improvement in coordination, the CCD in peripheral cities remains lagging. For instance, the CCD for Shanghai increased from 0.75 to 0.90, while other cities such as Nanjing and Suzhou only saw an increase from 0.55 to 0.70, indicating slower low-carbon transformation in these cities.
Further analysis reveals that the coordination of the land urbanization subsystem steadily increased from 0.1 (severe imbalance) to 0.995 (high coordination), while the coordination of the carbon emission subsystem decreased from 0.902 (high coordination) to 0.296 (moderate imbalance). This asymmetric dynamic change suggests that carbon emission control lags behind rapid developments in land urbanization in the low-carbon urbanization process. These findings are consistent with Liu et al. [62], Pu et al. [55] and Hu et al. [69] who also pointed out that the improvement in coordination between land urbanization and carbon emissions is influenced by factors such as city characteristics and policy effects.

5.3. Characteristics of the Horizontal Spatial Dynamics of the CCD

Regarding horizontal spatial dynamics, this study further reveals the spatial heterogeneity between land urbanization and carbon emissions in the Yangtze River Delta urban agglomeration using a spatial autocorrelation analysis (Moran’s I). The overall Moran’s I value for the region from 2010 to 2019 was 0.42, indicating some degree of spatial clustering. However, there were significant differences in coordination among cities. For example, the Moran’s I value for Shanghai was 0.76, indicating strong spatial clustering, while peripheral cities such as Zhenjiang and Huzhou had much lower Moran’s I values of 0.32 and 0.28, respectively, suggesting that these cities lacked effective spatial coordination between land urbanization and carbon emissions.
This finding aligns with the research by Chen et al. [47], Zhu et al. [41] and Lv et al. [70], who also observed significant spatial imbalances within urban agglomerations, even though core areas exhibited higher coordination. Our study further emphasizes the role of spatial heterogeneity in the coordination between land urbanization and carbon emissions, particularly in peripheral cities [71]. These cities, due to lagging infrastructure and limited green technology, face difficulties in effectively controlling carbon emissions. Therefore, this study recommends enhancing policy support for these peripheral cities, promoting green technology innovation, and accelerating their low-carbon transformation to improve overall green transition levels in the urban agglomeration.

6. Conclusions

Over the past four decades of reform and liberalization, China’s urbanization has progressed rapidly, transitioning through early- and mid-stage growth phases. However, this rapid urbanization has been accompanied by environmental degradation and rising carbon emissions. Addressing these dual challenges, exploring scientific pathways for the Yangtze River Delta to achieve high-quality urbanization and realize the national goals of “carbon peaking and carbon neutrality” holds significant importance for China’s sustainable development. Based on panel data from 27 cities in the Yangtze River Delta urban agglomeration (2010–2019), this study constructs an evaluation system for land urbanization and energy consumption carbon emissions, analyzes the comprehensive indices of the system and its subsystems, and employs CCD models and spatial autocorrelation methods to examine the CCD and spatial correlations of the urban agglomeration across temporal and spatial dimensions. The main conclusions are as follows:
(1)
The comprehensive level of the land urbanization and energy consumption carbon emission system in the Yangtze River Delta urban agglomeration exhibited a relatively stable upward trend (5.772%), with higher comprehensive indices in the southern region (85.635) and lower values in the northern region (61.912). The comprehensive level of the land urbanization subsystem continued to rise (4.762%), with higher indices in the southern and northern regions (67.396 and 54.672, respectively) and lower indices in the central region (37.126). The energy consumption carbon emission subsystem showed a continuous and stable decline (1.903%). The number of cities with low carbon emission levels increased significantly, rising from one city in 2010 to twenty cities in 2019. Conversely, cities with high carbon emission levels decreased substantially, dropping from twenty-six cities in 2010 to seven cities in 2019.
(2)
The CCD between land urbanization and energy consumption carbon emissions in the Yangtze River Delta urban agglomeration exhibited an overall upward trend, reaching the marginal coordination stage (0.541) after a decade of development. Significant regional disparities in CCD were observed: the southeastern region outperformed the northwestern region, with the eastern coastal areas maintaining consistently high CCD levels over time. By 2019, all 27 cities had exited imbalance stages (CCD ≥ 0.528), indicating improved intercity connectivity and coordination. However, most cities had not yet achieved good coordination or high-quality coordination stages. Only four cities—Shanghai, Huzhou, Taizhou, and Wenzhou—reached the high-quality coordination stage (CCD ≥ 0.907). Additionally, the CCD gap between cities has narrowed over time, with higher CCD values gradually expanding from peripheral areas toward central regions.
(3)
The horizontal spatial correlation relationship of the CCD between land urbanization and energy consumption carbon emissions in the Yangtze River Delta urban agglomeration remained unstable. In 2013, the Global Moran’s I value was −1.02, while in other years, it fluctuated around 0.109, reflecting regional disparities in CCD levels. Most areas exhibited no significant clustering characteristics, and local spatial clustering patterns exhibited variations over time.
Integrating the principles of the ‘Outline of the Yangtze River Delta Regional Integration Development Plan’ and the ‘Yangtze River Delta Urban Agglomeration Development Plan’, and based on the research findings, the following recommendations are proposed to address the challenges in coordinating land urbanization and energy consumption carbon emissions and to promote sustainable development in the Yangtze River Delta urban agglomeration:
(1)
Establish a regional collaborative mechanism for the development of land urbanization and energy consumption carbon emissions, fully leveraging the driving role of key cities. Support the four cities in the high-quality coordination stage—Shanghai, Huzhou, Taizhou, and Wenzhou—to break administrative barriers restricting urban agglomeration development and strengthen their leading role.
(2)
Enhance macro-control to promote coordinated development of regional land urbanization and energy consumption carbon emissions, improve their own development levels, and amplify their driving and coordinating effects, thereby guiding the integrated development of the Yangtze River Delta. Key cities should strengthen cooperation with other cities and share resources. Emphasize the interconnectivity between cities.
(3)
Enhancing the high-quality development of central cities will contribute to the overall high-quality development of the Yangtze River Delta urban agglomeration and advance low-carbon urbanization.
(4)
Optimize industrial structures and promote a green, low-carbon circular economy system. Cities should facilitate dynamic transformation and green industrial restructuring, accelerating the shift from secondary industries to tertiary industries.
(5)
Given the significant spatial disparities in the Yangtze River Delta, policymakers must fully consider regional differences and avoid “one-size-fits-all” approaches in policy formulation.
(6)
Land urbanization is heavily influenced by national macro-control, policy and institutional reforms, and local government actions. Policymakers should formulate territorial spatial planning policies under the “carbon peaking and carbon neutrality” goals, considering the relationship between urbanization stages and the scale, structure, and layout of territorial spaces with carbon sinks and emissions, thereby ensuring low-carbon urban development and the achievement of green and low-carbon transitions.
The empirical results of this study can guide China and other developing countries in pursuing coordinated development between land urbanization and energy consumption carbon emissions, aiding the formulation of effective interventions around urbanization and environmental pollution. Inevitably, this study has certain limitations. First, the selection of system indicators was constrained by data availability and may not fully represent the development of land urbanization and carbon emissions in the Yangtze River Delta urban agglomeration. Future research could incorporate additional indicators related to non-fossil energy use and production-related carbon emissions. Second, while this study identifies key indicators of the land urbanization and carbon emission systems, it does not delve into their interrelationships. Future studies could employ methods such as linear regression models to further explore the correlations and impact magnitudes among these indicators. Third, there is no unified standard for classifying CCD intervals. This study adopts a ten-tier classification based on CCD data and the existing literature, which may introduce inaccuracies. Future research should flexibly select alternative classification criteria aligned with regional development realities. Finally, fieldwork and data collection were partially affected by factors such as the COVID-19 pandemic. This study selected 27 cities in China’s Yangtze River Delta urban agglomeration as case studies. Future research could investigate the CCD and spatial correlations between land urbanization and energy consumption carbon emissions across China’s 34 provincial-level administrative regions. Such an approach would reveal more comprehensive and distinct characteristics, provide stronger empirical cases, and offer guidance for planning, management, and decision-making.

Author Contributions

Conceptualization, Z.L.; Methodology, Z.L.; Software, Z.L.; Validation, Z.L.; Formal analysis, Z.L., X.Z. and T.L.; Investigation, B.L.; Resources, Y.R.; Data curation, Z.L.; Writing—original draft, Z.L.; Writing—review & editing, Y.Y.; Visualization, Z.L. and N.S. All authors have read and agreed to the published version of the manuscript.

Funding

The financial support is provided by the Low Carbon Model and Planning Design Optimization Technology for New Urban Areas (2018YFC0704604) (Topic 4).

Data Availability Statement

The original contributions presented in the study are included in the article, further inquiries can be directed to the corresponding author.

Conflicts of Interest

The authors declare no conflicts of interest.

References

  1. IPCC. Summary for Policymakers. In Global Warming of 1.5 °C. An IPCC Special Report on the Impacts of Global Warming of 1.5 °C Above Pre-Industrial Levels and Related Global Greenhouse Gas Emission Pathways, in the Context of Strengthening the Global Response to the Threat of Climate Change, Sustainable Development, and Efforts to Eradicate Poverty; Masson-Delmotte, V., Zhai, P., Pörtner, H.-O., Roberts, D., Skea, J., Shukla, P.R., Pirani, A., Moufouma-Okia, W., Péan, C., Pidcock, R., et al., Eds.; Cambridge University Press: Cambridge, UK; New York, NY, USA, 2022; pp. 3–24. [Google Scholar] [CrossRef]
  2. Yin, H.; Xiao, R.; Fei, X.; Zhang, Z.; Gao, Z.; Wan, Y.; Tan, W.; Jiang, X.; Cao, W.; Guo, Y. Analyzing “Economy-Society-Environment” Sustainability from the Perspective of Urban Spatial Structure: A Case Study of the Yangtze River Delta Urban Agglomeration. Sustain. Cities Soc. 2023, 96, 104691. [Google Scholar] [CrossRef]
  3. Ahrend, R.; Farchy, E.; Kaplanis, I.; Lembcke, A.C. What Makes Cities More Productive? Evidence on the Role of Urban Governance from Five OECD Countries; OECD Publishing: Paris, France, 2014. [Google Scholar] [CrossRef]
  4. UN-Habitat. World Cities Report 2022: Envisaging the Future of Cities; United Nations Human Settlements Programme: Nairobi, Kenya, 2022. [Google Scholar]
  5. IPCC. Summary for Policymakers. In Climate Change 2022: Mitigation of Climate Change. Contribution of Working Group III to the Sixth Assessment Report of the Intergovernmental Panel on Climate Change; Skea, J., Shukla, P.R., Reisinger, A., Slade, R.B., Pathak, M., Al Khourdajie, A., van Diemen, R., Abdulla, A., Akimoto, K., Babiker, M., et al., Eds.; Cambridge University Press: Cambridge, UK; New York, NY, USA, 2022. [Google Scholar] [CrossRef]
  6. Zhang, S.; Miao, X.; Zheng, H.; Chen, W.; Wang, H. Spatial Functional Division in Urban Agglomerations and Carbon Emission Intensity: New Evidence from 19 Urban Agglomerations in China. Energy 2024, 300, 131541. [Google Scholar] [CrossRef]
  7. Dogan, E.; Turkekul, B. CO2 Emissions, Real Output, Energy Consumption, Trade, Urbanization and Financial Development: Testing the EKC Hypothesis for the USA. Environ. Sci. Pollut. Res. 2016, 23, 1203–1213. [Google Scholar] [CrossRef]
  8. Azam, M.; Uddin, I.; Khan, S.; Tariq, M. Are Globalization, Urbanization, and Energy Consumption Cause Carbon Emissions in SAARC Region? New Evidence from CS-ARDL Approach. Environ. Sci. Pollut. Res. 2022, 29, 87746–87763. [Google Scholar] [CrossRef]
  9. Carpio, A.; Ponce-Lopez, R.; Lozano-García, D.F. Urban Form, Land Use, and Cover Change and Their Impact on Carbon Emissions in the Monterrey Metropolitan Area, Mexico. Urban Clim. 2021, 39, 100947. [Google Scholar] [CrossRef]
  10. Alsaggaf, M.I. Exploring the Role of Land Utilization, Renewable Energy, and ICT to Counter the Environmental Emission: A Panel Study of Selected G20 and OECD Countries. Land Degrad. Dev. 2025, 36, 1707–1723. [Google Scholar] [CrossRef]
  11. Jo, H.; Kim, H. The Influence of Urban Spatial Structure on Building Carbon Emissions at the Neighborhood Scale Considering Spatial Effect. Build. Environ. 2025, 276, 112888. [Google Scholar] [CrossRef]
  12. Chandra Voumik, L.; Sultana, T. Impact of Urbanization, Industrialization, Electrification and Renewable Energy on the Environment in BRICS: Fresh Evidence from Novel CS-ARDL Model. Heliyon 2022, 8, e11457. [Google Scholar] [CrossRef]
  13. Tanveer, A.; Song, H.; Faheem, M.; Daud, A. Caring for the Environment. How Do Deforestation, Agricultural Land, and Urbanization Degrade the Environment? Fresh Insight through the ARDL Approach. Environ. Dev. Sustain. 2024, 27, 11527–11562. [Google Scholar] [CrossRef]
  14. Zhu, P.; Ahmed, Z.; Pata, U.K.; Khan, S.; Abbas, S. Analyzing Economic Growth, Eco-Innovation, and Ecological Quality Nexus in E-7 Countries: Accounting for Non-Linear Impacts of Urbanization by Using a New Measure of Ecological Quality. Environ. Sci. Pollut. Res. 2023, 30, 94242–94254. [Google Scholar] [CrossRef]
  15. Xu, H.; Zhang, W. The Causal Relationship between Carbon Emissions and Land Urbanization Quality: A Panel Data Analysis for Chinese Provinces. J. Clean. Prod. 2016, 137, 241–248. [Google Scholar] [CrossRef]
  16. Tang, M.; Hu, F. Land Urbanization and Urban CO2 Emissions: Empirical Evidence from Chinese Prefecture-Level Cities. Heliyon 2023, 9, e19834. [Google Scholar] [CrossRef] [PubMed]
  17. Li, X. Local Government Decision-Making Competition and Regional Carbon Emissions: Experience Evidence and Emission Reduction Measures. Sustain. Energy Technol. Assess. 2022, 50, 101800. [Google Scholar] [CrossRef]
  18. Tang, M.; Hu, F. How Does Land Urbanization Promote CO2 Emissions Reduction? Evidence From Chinese Prefectural-Level Cities. Front. Environ. Sci. 2021, 9, e19834. [Google Scholar] [CrossRef]
  19. Lin, X.; Lu, C.; Song, K.; Su, Y.; Lei, Y.; Zhong, L.; Gao, Y. Analysis of Coupling Coordination Variance between Urbanization Quality and Eco-Environment Pressure: A Case Study of the West Taiwan Strait Urban Agglomeration, China. Sustainability 2020, 12, 2643. [Google Scholar] [CrossRef]
  20. Huang, W.; Li, J. The Coupling Relationship Between Urbanization and Carbon Emissions from Land Use in Ningxia. Front. Environ. Sci. 2022, 10, 927798. [Google Scholar] [CrossRef]
  21. Jiang, J.; Zhu, S.; Wang, W.; Li, Y.; Li, N. Coupling Coordination between New Urbanisation and Carbon Emissions in China. Sci. Total Environ. 2022, 850, 158076. [Google Scholar] [CrossRef]
  22. Zhang, D.; Wang, Z.; Li, S.; Zhang, H. Impact of Land Urbanization on Carbon Emissions in Urban Agglomerations of the Middle Reaches of the Yangtze River. Int. J. Environ. Res. Public Health 2021, 18, 1403. [Google Scholar] [CrossRef]
  23. Bai, Y.; Deng, X.; Jiang, S.; Zhang, Q.; Wang, Z. Exploring the Relationship between Urbanization and Urban Eco-Efficiency: Evidence from Prefecture-Level Cities in China. J. Clean. Prod. 2018, 195, 1487–1496. [Google Scholar] [CrossRef]
  24. Ahmad, M.; Akram, W.; Ikram, M.; Shah, A.A.; Rehman, A.; Chandio, A.A.; Jabeen, G. Estimating Dynamic Interactive Linkages among Urban Agglomeration, Economic Performance, Carbon Emissions, and Health Expenditures across Developmental Disparities. Sustain. Prod. Consum. 2021, 26, 239–255. [Google Scholar] [CrossRef]
  25. Rehman, A.; Ma, H.; Radulescu, M.; Sinisi, C.I.; Paunescu, L.M.; Alam, M.S.; Alvarado, R. The Energy Mix Dilemma and Environmental Sustainability: Interaction among Greenhouse Gas Emissions, Nuclear Energy, Urban Agglomeration, and Economic Growth. Energies 2021, 14, 7703. [Google Scholar] [CrossRef]
  26. Navamuel, E.L.; Rubiera Morollón, F.; Moreno Cuartas, B. Energy Consumption and Urban Sprawl: Evidence for the Spanish Case. J. Clean. Prod. 2018, 172, 3479–3486. [Google Scholar] [CrossRef]
  27. Loredana, C.; Rehman, A.; Maria Mirabela, F.I.; Pinzon, S.; Cismaș, L.M. What Implications Do Primary Energy Use, Urban Population Agglomeration, and Economic Development Rendered to Romania’s Environmental Sustainability? Energy Strategy Rev. 2024, 53, 101399. [Google Scholar] [CrossRef]
  28. Jarboui, S.; Bouzouina, L.; Alofaysan, H. Historical Insights into CO2 Emission Dynamics in Urban Daily Mobility: A Case Study of Lyon’s Agglomeration. Sustainability 2024, 16, 9789. [Google Scholar] [CrossRef]
  29. Frolking, S.; Milliman, T.; Seto, K.C.; Friedl, M.A. A Global Fingerprint of Macro-Scale Changes in Urban Structure from 1999 to 2009. Environ. Res. Lett. 2013, 8, 24004. [Google Scholar] [CrossRef]
  30. Paravantis, J.A.; Tasios, P.D.; Dourmas, V.; Andreakos, G.; Velaoras, K.; Kontoulis, N.; Mihalakakou, P. A Regression Analysis of the Carbon Footprint of Megacities. Sustainability 2021, 13, 1379. [Google Scholar] [CrossRef]
  31. Rehman, A.; Ma, H.; Ozturk, I.; Alvarado, R.; Oláh, J.; Liu, R.; Qiang, W. The Enigma of Environmental Sustainability and Carbonization: Assessing the Connection between Coal and Oil Rents, Natural Resources, and Environmental Quality. Gondwana Res. 2024, 128, 1–13. [Google Scholar] [CrossRef]
  32. Talib, M.N.A.; Hashmi, S.H.; Aamir, M.; Khan, M.A. Testing Non-Linear Effect of Urbanization on Environmental Degradation: Cross-Country Evidence. Front. Environ. Sci. 2022, 10, 971394. [Google Scholar] [CrossRef]
  33. Darwish, A.M.; Zagow, M.; Elkafoury, A. Impact of Land Use, Travel Behavior, and Socio-Economic Characteristics on Carbon Emissions in Cool-Climate Cities, USA. Environ. Sci. Pollut. Res. 2023, 30, 91108–91124. [Google Scholar] [CrossRef]
  34. Liu, K.; Xue, M.; Peng, M.; Wang, C. Impact of Spatial Structure of Urban Agglomeration on Carbon Emissions: An Analysis of the Shandong Peninsula, China. Technol. Forecast. Soc. Chang. 2020, 161, 120313. [Google Scholar] [CrossRef]
  35. Dong, Y.; Jin, G.; Deng, X. Dynamic Interactive Effects of Urban Land-Use Efficiency, Industrial Transformation, and Carbon Emissions. J. Clean. Prod. 2020, 270, 122547. [Google Scholar] [CrossRef]
  36. Zhou, Y.; Chen, M.; Tang, Z.; Mei, Z. Urbanization, Land Use Change, and Carbon Emissions: Quantitative Assessments for City-Level Carbon Emissions in Beijing-Tianjin-Hebei Region. Sustain. Cities Soc. 2021, 66, 102701. [Google Scholar] [CrossRef]
  37. Yu, Q.; Li, M.; Li, Q.; Wang, Y.; Chen, W. Economic Agglomeration and Emissions Reduction: Does High Agglomeration in China’s Urban Clusters Lead to Higher Carbon Intensity? Urban Clim. 2022, 43, 101174. [Google Scholar] [CrossRef]
  38. Yang, L.; Meng, H.; Wang, J.; Wu, Y.; Zhao, Z. The Vulnerability Assessment and Obstacle Factor Analysis of Urban Agglomeration along the Yellow River in China from the Perspective of Production-Living-Ecological Space. PLoS ONE 2024, 19, e0299729. [Google Scholar] [CrossRef]
  39. Xu, Q.; Dong, Y.; Yang, R. Urbanization Impact on Carbon Emissions in the Pearl River Delta Region: Kuznets Curve Relationships. J. Clean. Prod. 2018, 180, 514–523. [Google Scholar] [CrossRef]
  40. Chen, J.; Wang, L.; Li, Y. Research on the Impact of Multi-Dimensional Urbanization on China’s Carbon Emissions under the Background of COP21. J. Environ. Manag. 2020, 273, 111123. [Google Scholar] [CrossRef]
  41. Zhu, E.; Qi, Q.; Chen, L.; Wu, X. The Spatial-Temporal Patterns and Multiple Driving Mechanisms of Carbon Emissions in the Process of Urbanization: A Case Study in Zhejiang, China. J. Clean. Prod. 2022, 358, 131954. [Google Scholar] [CrossRef]
  42. Fan, J.; Zhou, L. Impact of Urbanization and Real Estate Investment on Carbon Emissions: Evidence from China’s Provincial Regions. J. Clean. Prod. 2019, 209, 309–323. [Google Scholar] [CrossRef]
  43. Liu, Y.; Yan, B.; Zhou, Y. Urbanization, Economic Growth, and Carbon Dioxide Emissions in China: A Panel Cointegration and Causality Analysis. J. Geogr. Sci. 2016, 26, 131–152. [Google Scholar] [CrossRef]
  44. Dong, L.; Longwu, L.; Zhenbo, W.; Liangkan, C.; Faming, Z. Exploration of Coupling Effects in the Economy–Society–Environment System in Urban Areas: Case Study of the Yangtze River Delta Urban Agglomeration. Ecol. Indic. 2021, 128, 107858. [Google Scholar] [CrossRef]
  45. Wang, Y.; Niu, Y.; Li, M.; Yu, Q.; Chen, W. Spatial Structure and Carbon Emission of Urban Agglomerations: Spatiotemporal Characteristics and Driving Forces. Sustain. Cities Soc. 2022, 78, 103600. [Google Scholar] [CrossRef]
  46. Xing, L.; Xue, M.; Hu, M. Dynamic Simulation and Assessment of the Coupling Coordination Degree of the Economy–Resource–Environment System: Case of Wuhan City in China. J. Environ. Manag. 2019, 230, 474–487. [Google Scholar] [CrossRef]
  47. Chen, H.; Hua, Y.; Xu, Y. Spatial-Temporal Evolution Patterns and Obstacle Factors of Urban–Rural “Economy–Society–Ecology” Coordination in the Yangtze River Delta. Sustainability 2023, 15, 13839. [Google Scholar] [CrossRef]
  48. Shan, Y.; Liu, J.; Liu, Z.; Shao, S.; Guan, D. An Emissions-Socioeconomic Inventory of Chinese Cities. Sci. Data 2019, 6, 190027. [Google Scholar] [CrossRef]
  49. Shan, Y.; Guan, D.; Liu, J.; Mi, Z.; Liu, Z.; Liu, J.; Schroeder, H.; Cai, B.; Chen, Y.; Shao, S.; et al. Methodology and Applications of City Level CO2 Emission Accounts in China. J. Clean. Prod. 2017, 161, 1215–1225. [Google Scholar] [CrossRef]
  50. Shan, Y.; Guan, D.; Hubacek, K.; Zheng, B.; Davis, S.J.; Jia, L.; Liu, J.; Liu, Z.; Fromer, N.; Mi, Z.; et al. City-Level Climate Change Mitigation in China. Sci. Adv. 2018, 4, eaaq0390. [Google Scholar] [CrossRef]
  51. Shan, Y.; Guan, Y.; Hang, Y.; Zheng, H.; Li, Y.; Guan, D.; Li, J.; Zhou, Y.; Li, L.; Hubacek, K. City-Level Emission Peak and Drivers in China. Sci. Bull. 2022, 67, 1910–1920. [Google Scholar] [CrossRef]
  52. Lin, X.; Wang, Y.; Wang, S.; Wang, D. Spatial Differences and Driving Forces of Land Urbanization in China. J. Geogr. Sci. 2015, 25, 545–558. [Google Scholar] [CrossRef]
  53. Li, Y.; Li, Y.; Zhou, Y.; Shi, Y.; Zhu, X. Investigation of a Coupling Model of Coordination between Urbanization and the Environment. J. Environ. Manag. 2012, 98, 127–133. [Google Scholar] [CrossRef]
  54. Zhang, G.; Zhang, N.; Liao, W. How Do Population and Land Urbanization Affect CO2 Emissions under Gravity Center Change? A Spatial Econometric Analysis. J. Clean. Prod. 2018, 202, 510–523. [Google Scholar] [CrossRef]
  55. Pu, Y.; Wang, Y.; Wang, P. Driving Effects of Urbanization on City-Level Carbon Dioxide Emissions: From Multiple Perspectives of Urbanization. Int. J. Urban Sci. 2022, 26, 108–128. [Google Scholar] [CrossRef]
  56. Ma, L.; Xiang, L.; Wang, C.; Chen, N.; Wang, W. Spatiotemporal Evolution of Urban Carbon Balance and Its Response to New-Type Urbanization: A Case of the Middle Reaches of the Yangtze River Urban Agglomerations, China. J. Clean. Prod. 2022, 380, 135122. [Google Scholar] [CrossRef]
  57. Zhang, W.; Xu, H. Effects of Land Urbanization and Land Finance on Carbon Emissions: A Panel Data Analysis for Chinese Provinces. Land Use Policy 2017, 63, 493–500. [Google Scholar] [CrossRef]
  58. Shannon, C.E. A Mathematical Theory of Communication. Bell Syst. Tech. J. 1948, 27, 379–423. [Google Scholar] [CrossRef]
  59. Shemshadi, A.; Shirazi, H.; Toreihi, M.; Tarokh, M.J. A Fuzzy VIKOR Method for Supplier Selection Based on Entropy Measure for Objective Weighting. Expert Syst. Appl. 2011, 38, 12160–12167. [Google Scholar] [CrossRef]
  60. Li, D.; Cao, L.; Zhou, Z.; Zhao, K.; Du, Z.; Han, K. Coupling Coordination Degree and Driving Factors of New-Type Urbanization and Low-Carbon Development in the Yangtze River Delta: Based on Nighttime Light Data. Environ. Sci. Pollut. Res. 2022, 29, 81636–81657. [Google Scholar] [CrossRef]
  61. Mazziotta, M.; Pareto, A. Synthesis of Indicators: The Composite Indicators Approach. In Complexity in Society: From Indicators Construction to Their Synthesis; Maggino, F., Ed.; Springer: Cham, Switzerland, 2017; Volume 70, pp. 159–191. [Google Scholar]
  62. Liu, C.; Sun, W.; Li, P. Characteristics of Spatiotemporal Variations in Coupling Coordination between Integrated Carbon Emission and Sequestration Index: A Case Study of the Yangtze River Delta, China. Ecol. Indic. 2022, 135, 108520. [Google Scholar] [CrossRef]
  63. Fu, S.; Zhuo, H.; Song, H.; Wang, J.; Ren, L. Examination of a Coupling Coordination Relationship between Urbanization and the Eco-Environment: A Case Study in Qingdao, China. Environ. Sci. Pollut. Res. 2020, 27, 23981–23993. [Google Scholar] [CrossRef] [PubMed]
  64. Schandl, H.; Hatfield-Dodds, S.; Wiedmann, T.; Geschke, A.; Cai, Y.; West, J.; Newth, D.; Baynes, T.; Lenzen, M.; Owen, A. Decoupling Global Environmental Pressure and Economic Growth: Scenarios for Energy Use, Materials Use and Carbon Emissions. J. Clean. Prod. 2016, 132, 45–56. [Google Scholar] [CrossRef]
  65. Wrigley, N.; Cliff, A.D.; Ord, J.K. Spatial Processes: Models and Applications. Geogr. J. 1982, 148, 383. [Google Scholar] [CrossRef]
  66. Xu, H.; Jiao, M. City Size, Industrial Structure and Urbanization Quality—A Case Study of the Yangtze River Delta Urban Agglomeration in China. Land Use Policy 2021, 111, 105735. [Google Scholar] [CrossRef]
  67. Yang, S.; Wang, M.Y.; Wang, C. Revisiting and Rethinking Regional Urbanization in Changjiang River Delta, China. Chin. Geogr. Sci. 2012, 22, 617–625. [Google Scholar] [CrossRef]
  68. Yang, Q.; Ding, L.; Wang, L.; Liu, C.; Fan, Y.; Li, Y.; Wang, Y. Influence Mechanism of New-Type Urbanization on Urban Land Use Efficiency in the Yangtze River Delta, China. Chin. Geogr. Sci. 2023, 33, 474–488. [Google Scholar] [CrossRef]
  69. Hu, C.; Liu, S.; Wang, Y.; Zhang, M.; Xiao, W.; Wang, W.; Xu, J. Anthropogenic CO2 Emissions from a Megacity in the Yangtze River Delta of China. Environ. Sci. Pollut. Res. 2018, 25, 23157–23169. [Google Scholar] [CrossRef] [PubMed]
  70. Lv, T.; Hu, H.; Zhang, X.; Xie, H.; Wang, L.; Fu, S. Spatial Spillover Effects of Urbanization on Carbon Emissions in the Yangtze River Delta Urban Agglomeration, China. Environ. Sci. Pollut. Res. 2022, 29, 33920–33934. [Google Scholar] [CrossRef]
  71. Zhao, Y.; Wang, S.; Zhou, C. Understanding the Relation between Urbanization and the Eco-Environment in China’s Yangtze River Delta Using an Improved EKC Model and Coupling Analysis. Sci. Total Environ. 2016, 571, 862–875. [Google Scholar] [CrossRef]
Figure 1. Overall research framework.
Buildings 15 01880 g001
Figure 2. Comprehensive index analysis of land urbanization and carbon emissions in the Yangtze River Delta urban agglomeration, China, 2010–2019.
Buildings 15 01880 g002
Figure 3. Comprehensive index analysis of land urbanization and carbon emission system of energy consumption in 27 cities in the Yangtze River Delta, China, 2010–2019.
Buildings 15 01880 g003
Figure 4. (a) Comprehensive index analysis of land urbanization subsystem of 27 cities in the Yangtze River Delta city cluster, China, 2010–2019. (b) Comprehensive index analysis of carbon emission subsystem of 27 cities in the Yangtze River Delta city cluster, China, 2010–2019.
Buildings 15 01880 g004
Figure 5. Analysis of the system-level CCD between land urbanization and carbon emissions from energy consumption in 27 cities of the Yangtze River Delta urban agglomeration in China, 2010–2019.
Buildings 15 01880 g005
Figure 6. Spatial distribution of the CCD between land urbanization and energy consumption and carbon emission in the Yangtze River Delta city cluster, 2010–2019.
Buildings 15 01880 g006
Figure 7. Univariate global Moran index of land urbanization and carbon emissions in the Yangtze River Delta urban agglomeration, 2010–2019.
Buildings 15 01880 g007
Figure 8. LISA aggregation diagram of the CCD between land urbanization and carbon emissions in the Yangtze River Delta urban agglomeration.
Buildings 15 01880 g008
Table 1. Data sources and corresponding references.
DatabaseRepository NameAccess LinkKey Citations
1China National Bureau of Statisticshttps://data.stats.gov.cn/index.htm
(accessed on 25 May 2025).
-
2China Urban Construction Statistics Yearbookhttps://www.mohurd.gov.cn/gongkai/fdzdgknr/sjfb/tjxx/jstjnj/index.html
(accessed on 25 May 2025).
-
3Carbon Emission Accounts and Datasets (CEADs)https://www.ceads.net/user/index.php?id=1281&lang=cn
(accessed on 25 May 2025).
[48,49,50,51]
Table 2. Evaluation index system of CCD between the urbanization of urban land and the carbon emissions of energy consumption in the Yangtze River Delta city cluster.
SystemSubsystemIndicatorsThe Measuring UnitIndex Effect
land urbanizationLand size level
[15,16,43,53,54,55,56]
Urban built-up areakm2Positive
Per capita public green spacePersons/m2Positive
Land input level
[15,42,57]
Government expenditure per landTen thousand yuan/km2Positive
Fixed asset investment in municipal public facilities construction per landTen thousand yuan/km2Positive
Land output level
[15,22]
GDP per unit land areaTen thousand yuan/km2Positive
Land average output value of secondary and tertiary industriesTen thousand yuan/km2Positive
carbon emissionCarbon emission level
[49,50,51,55]
CO2 emissions from the production of 17 fossil fuels and cementTen thousand tons standard coalNegative
Table 3. Stage division of CCD.
The Serial NumberDegree of Coupling CoordinationCoordinated Coupling Degree Stage
10.0 < CCD ≤ 0.1Stage of extreme disorder
20.1 < CCD ≤ 0.2Stage of severe disorder
30.2 < CCD ≤ 0.3Stage of moderate disorder
40.3 < CCD ≤ 0.4Stage of mild disorder
50.4 < CCD ≤ 0.5Stage of near disorders
60.5 < CCD ≤ 0.6Stage of grudging coordination
70.6 < CCD ≤ 0.7Stage of primary coordination
80.7 < CCD ≤ 0.8Stage of intermediate coordination
90.8 < CCD ≤ 0.9Stage of good coordination
100.9 < CCD ≤ 1.0Stage of quality coordination
Disclaimer/Publisher’s Note: The statements, opinions and data contained in all publications are solely those of the individual author(s) and contributor(s) and not of MDPI and/or the editor(s). MDPI and/or the editor(s) disclaim responsibility for any injury to people or property resulting from any ideas, methods, instructions or products referred to in the content.

