Article

Optimization Design Research of Architectural Layout and Morphology in Multi-Story Dormitory Areas Based on Wind Environment Analysis

School of Architecture, Chang’an University, Xi’an 710061, China
*
Author to whom correspondence should be addressed.
Buildings 2025, 15(10), 1747; https://doi.org/10.3390/buildings15101747
Submission received: 12 April 2025 / Revised: 6 May 2025 / Accepted: 16 May 2025 / Published: 21 May 2025

Abstract

Optimizing the wind environment within university dormitory areas is essential for ensuring student safety, enhancing living comfort, and improving building energy efficiency. In this study, the wind environment of multi-story university dormitories in cold regions is comprehensively investigated through computational fluid dynamics (CFD) simulations conducted with the PHONECIS software (version 2019), combined with orthogonal experimental design methods for systematic analysis and optimization. Through orthogonal experimental design, the effects of key morphological parameters—including building layout, length, width, and height—on the near-ground wind environment were evaluated. Among these, building width exerted the greatest influence, followed by building length, layout form, and finally building height. Based on the analysis, the optimal design scheme features a staggered building layout, with individual dormitory buildings measuring 60 m in length, 16 m in width, and 11.4 m in height. This optimized design was implemented in the multi-story dormitory area of the eastern section of Chang’an University’s New Campus. A comparative analysis of wind speed distribution before and after optimization, conducted specifically for the outdoor spaces during the winter season, revealed that the average near-ground wind speed was reduced from 3.3 m/s to 2.7 m/s, achieving an 18% reduction. The staggered arrangement and adjusted building proportions effectively dispersed airflow, mitigated high-velocity zones, and significantly enhanced outdoor wind comfort and pedestrian safety. This study introduces a morphology–wind environment coupling strategy from an architectural perspective to guide the design of dormitory buildings in cold regions. Rather than focusing on mathematical modeling, the research emphasizes design-oriented outcomes aimed at informing and optimizing practical architectural solutions for safer, more comfortable, and energy-efficient campus living environments.

1. Introduction and Literature Review

1.1. Introduction

In Chinese universities, students are typically accommodated in centralized multi-story dormitory complexes, which are integral components of the overall campus planning. Among these, multi-story dormitory buildings constitute a significant portion [1]. A favorable outdoor wind environment is crucial for the comfort and well-being of students [2]. It not only enhances their quality of life but also plays a key role in the energy efficiency and safety of multi-story dormitory buildings [3]. Therefore, optimizing the outdoor wind environment is a key factor in achieving sustainable campus planning.
Although significant progress has been made in optimizing the wind environment of buildings, research specifically focused on the wind conditions within university multi-story dormitory areas remains relatively scarce. Most existing studies, on the one hand, concentrate on the wind environments of high-rise towers or urban street canyons [4], with limited attention given to campus dormitory complexes. On the other hand, many studies on campus dormitories tend to examine the effects of individual factors, often lacking a systematic approach for the comprehensive optimization of multiple influencing factors [5,6,7,8,9]. For example, while some studies propose localized improvements, such as enhancing greenery or optimizing the design of individual buildings, there is a noticeable absence of a comprehensive optimization framework or multi-scenario comparisons for the wind environment in dormitory areas [10].
In conclusion, there exists an academic gap in systematically studying the wind environment of multi-story dormitory complexes under varying climatic conditions, identifying key influencing factors, and proposing targeted optimization strategies. This gap presents both the entry point and motivation for the current study.

1.2. Literature Review

Numerous studies have examined the influence of building layout forms, dimensions, and shapes on pedestrian wind environments, providing theoretical support for building design (Table 1). Zheng et al. [11] used CFD and wind tunnel tests to evaluate residential layouts and surrounding building layers in cold regions, highlighting the role of height and density. Ma et al. [12] found that middle-level, non-enclosed layouts are optimal for low-density areas, while middle-high-rise forms suit higher-density zones. Key parameters such as coverage rate and frontal area density also significantly affect wind comfort.
With respect to building dimensions, Mou et al. [13] demonstrated that aspect ratio and building width strongly impact wind speed and pressure distribution, with taller, narrower buildings generating higher wind speeds but reduced comfort zones.
In terms of building shapes, Qureshi et al. [14] showed that L-shaped and U-shaped buildings enhance ventilation when appropriately spaced. While much of the literature centers on high-rise buildings, multi-story dormitory buildings in cold climates remain underexplored [15,16,17].
In building wind environment research, three primary methods are widely used: field measurements, wind tunnel testing, and computational fluid dynamics (CFD) simulations. Field measurements offer on-site wind data but are limited by site constraints and long durations and are mainly applicable to existing buildings [18]. Wind tunnel tests, while accurate in simulating wind flow under varying layouts, require costly equipment and strict experimental conditions, restricting their broader application [19]. In contrast, CFD simulations have become the preferred approach due to their efficiency, lower cost, and ability to generate comprehensive spatial datasets for detailed analysis and optimization [14,20,21,22]. In this study, a combination of field measurements and CFD simulation is adopted to leverage the strengths of both methods, improving the reliability and accuracy of the wind environment evaluation.
Table 1. Overview of foundational studies on building morphology and wind environment excluding dormitory contexts.
Research FactorsBuilding TypesSpecific FactorsLiteratureResearch Methods
Layout formsHigh-rise residential buildingInfluence factors of layout pattern on wind environment[4,11,12,23]Numerical simulation
Influence of greening and building layout patterns on the wind and Thermal environment of residential quarters[10,20,21]Numerical simulation
Influence factors of layout pattern on wind environment[21]Wind tunnel test
Influence factors of layout pattern on wind environment[4,11,14]Numerical simulation + Wind tunnel test
Influence factors of layout pattern on wind environment[12,22]Numerical simulation + On-site measurement
Multistory residential buildingInfluence of layout patterns on outdoor wind environment[4,12]Numerical simulation
Block buildingsInfluence of layout mode on wind environment[23,24]Numerical simulation
Block buildingsInfluence of layout mode on wind environment[19]Numerical simulation + Wind tunnel test
/Influence of layout mode on wind environment[25,26]Numerical simulation
Influence of layout patterns and plant arrangements on wind environment and thermal comfort[27]Numerical simulation
Building dimensionsBlock buildingsInfluence of building height and width on wind environment[27,28,29]Numerical simulation
/Influence of building height and width on wind environment[13,30]Numerical simulation
Building shapesHigh-rise residential buildingInfluencing factors of building form on wind environment for surrounding pedestrians[14]Numerical simulation + Wind tunnel test
Office buildingThe relationship between architectural form and wind environment[18]Numerical simulation
/The influence of high-rise building forms on the surrounding environment[15,16,17]Numerical simulation
Note: / Undefined building type, for testing ideal models.

2. Materials and Methods

2.1. Selection of Research Cases

Xi’an, located in Shaanxi Province, China, is classified as Zone IIB in the national building climate zoning for cold regions [31]. The city experiences distinct seasonal variations, with average temperatures ranging from −1.2 °C to 0.0 °C in January (the coldest month) and from 26.3 °C to 26.6 °C in July (the hottest month). Wind environment data for both winter and summer conditions in Xi’an are presented in Table 2 [32]. According to the Beaufort scale as defined in GB/T 19201-2006 [33], the prevailing wind force in Xi’an is categorized as a light breeze, indicating relatively low wind speeds throughout the year. Given these climatic characteristics, the planning and design of dormitory areas must address both wind protection during winter and adequate natural ventilation during the summer months [34].
In addition, Xi’an is situated within a seismic intensity zone classified at magnitude 8. This imposes specific seismic fortification requirements that restrict architectural variability and influence building design. Consequently, dormitory complexes in the region are primarily composed of multi-story buildings arranged in regular, uniform layouts. This architectural typology reflects a key characteristic of dormitory design in seismic-prone, cold-climate regions.
This study uses the multi-story dormitory area in the typical slab form of Xi’an as a research case for field investigation. The measurement points are located in three distinct multi-story dormitory areas: the determinant formation in the eastern section of the new campus of CHD, the enclosed formation in the western section of the new campus of Xidian University (XD), and the staggered formation in the eastern section of the new campus of XD. An overview of these case buildings is provided in Table 3. These three cases are representative examples of multi-story dormitory layouts, chosen to capture a range of architectural configurations.

2.2. Numerical Simulation and Orthogonal Test Method

To analyze the relationship between the architectural layout of multi-story dormitory areas in colleges and universities and the outdoor wind environment, simulations are conducted on the selected research cases. This study employs computational fluid dynamics (CFD) numerical simulation and orthogonal experimental design, each offering significant advantages in the study of natural ventilation driven by building-induced wind. Both methods contribute to enhancing the efficiency of design and analysis. CFD numerical simulation provides accurate flow field data by simulating the gas flow dynamics both inside and outside the building. This overcomes the limitations of experimental conditions and scales inherent in traditional experiments. CFD can handle complex building geometries and offer detailed airflow analysis in varying wind environments, thus optimizing natural ventilation design [36]. Orthogonal experimental design reduces the number of experiments and associated costs by selecting representative experimental points, while maintaining the universality and representativeness of the results. This approach simplifies the study of complex problems, allowing for the extraction of the influence of multiple factors at a limited number of points. The experimental results are easily analyzed, and orthogonal design facilitates efficient comparisons of the impacts of various factors using statistical methods such as range analysis and variance analysis, thereby helping to identify the optimal solution in multi-factor environments [37].
The combination of CFD and orthogonal experimental design provides a more comprehensive and efficient optimization strategy for the design of building natural ventilation. CFD delivers accurate airflow simulations, while orthogonal experimental design streamlines the experimental process and parameter selection. Together, they complement each other, enhancing both design efficiency and research accuracy [38].
A 3D steady-state CFD model was used in this study. The simulation adopted the standard k-ε turbulence model and neglected temperature variation. From Table 4, we can see the computational domain was extended to 5 × 5 × 3 times the building size. Boundary conditions included velocity inlets based on local meteorological wind data and pressure outlets on the downwind sides. Local mesh refinement was implemented near building surfaces to improve accuracy. A convergence criterion of 10−4 residuals was applied with a total of 1000 iterations.

3. Results and Analysis

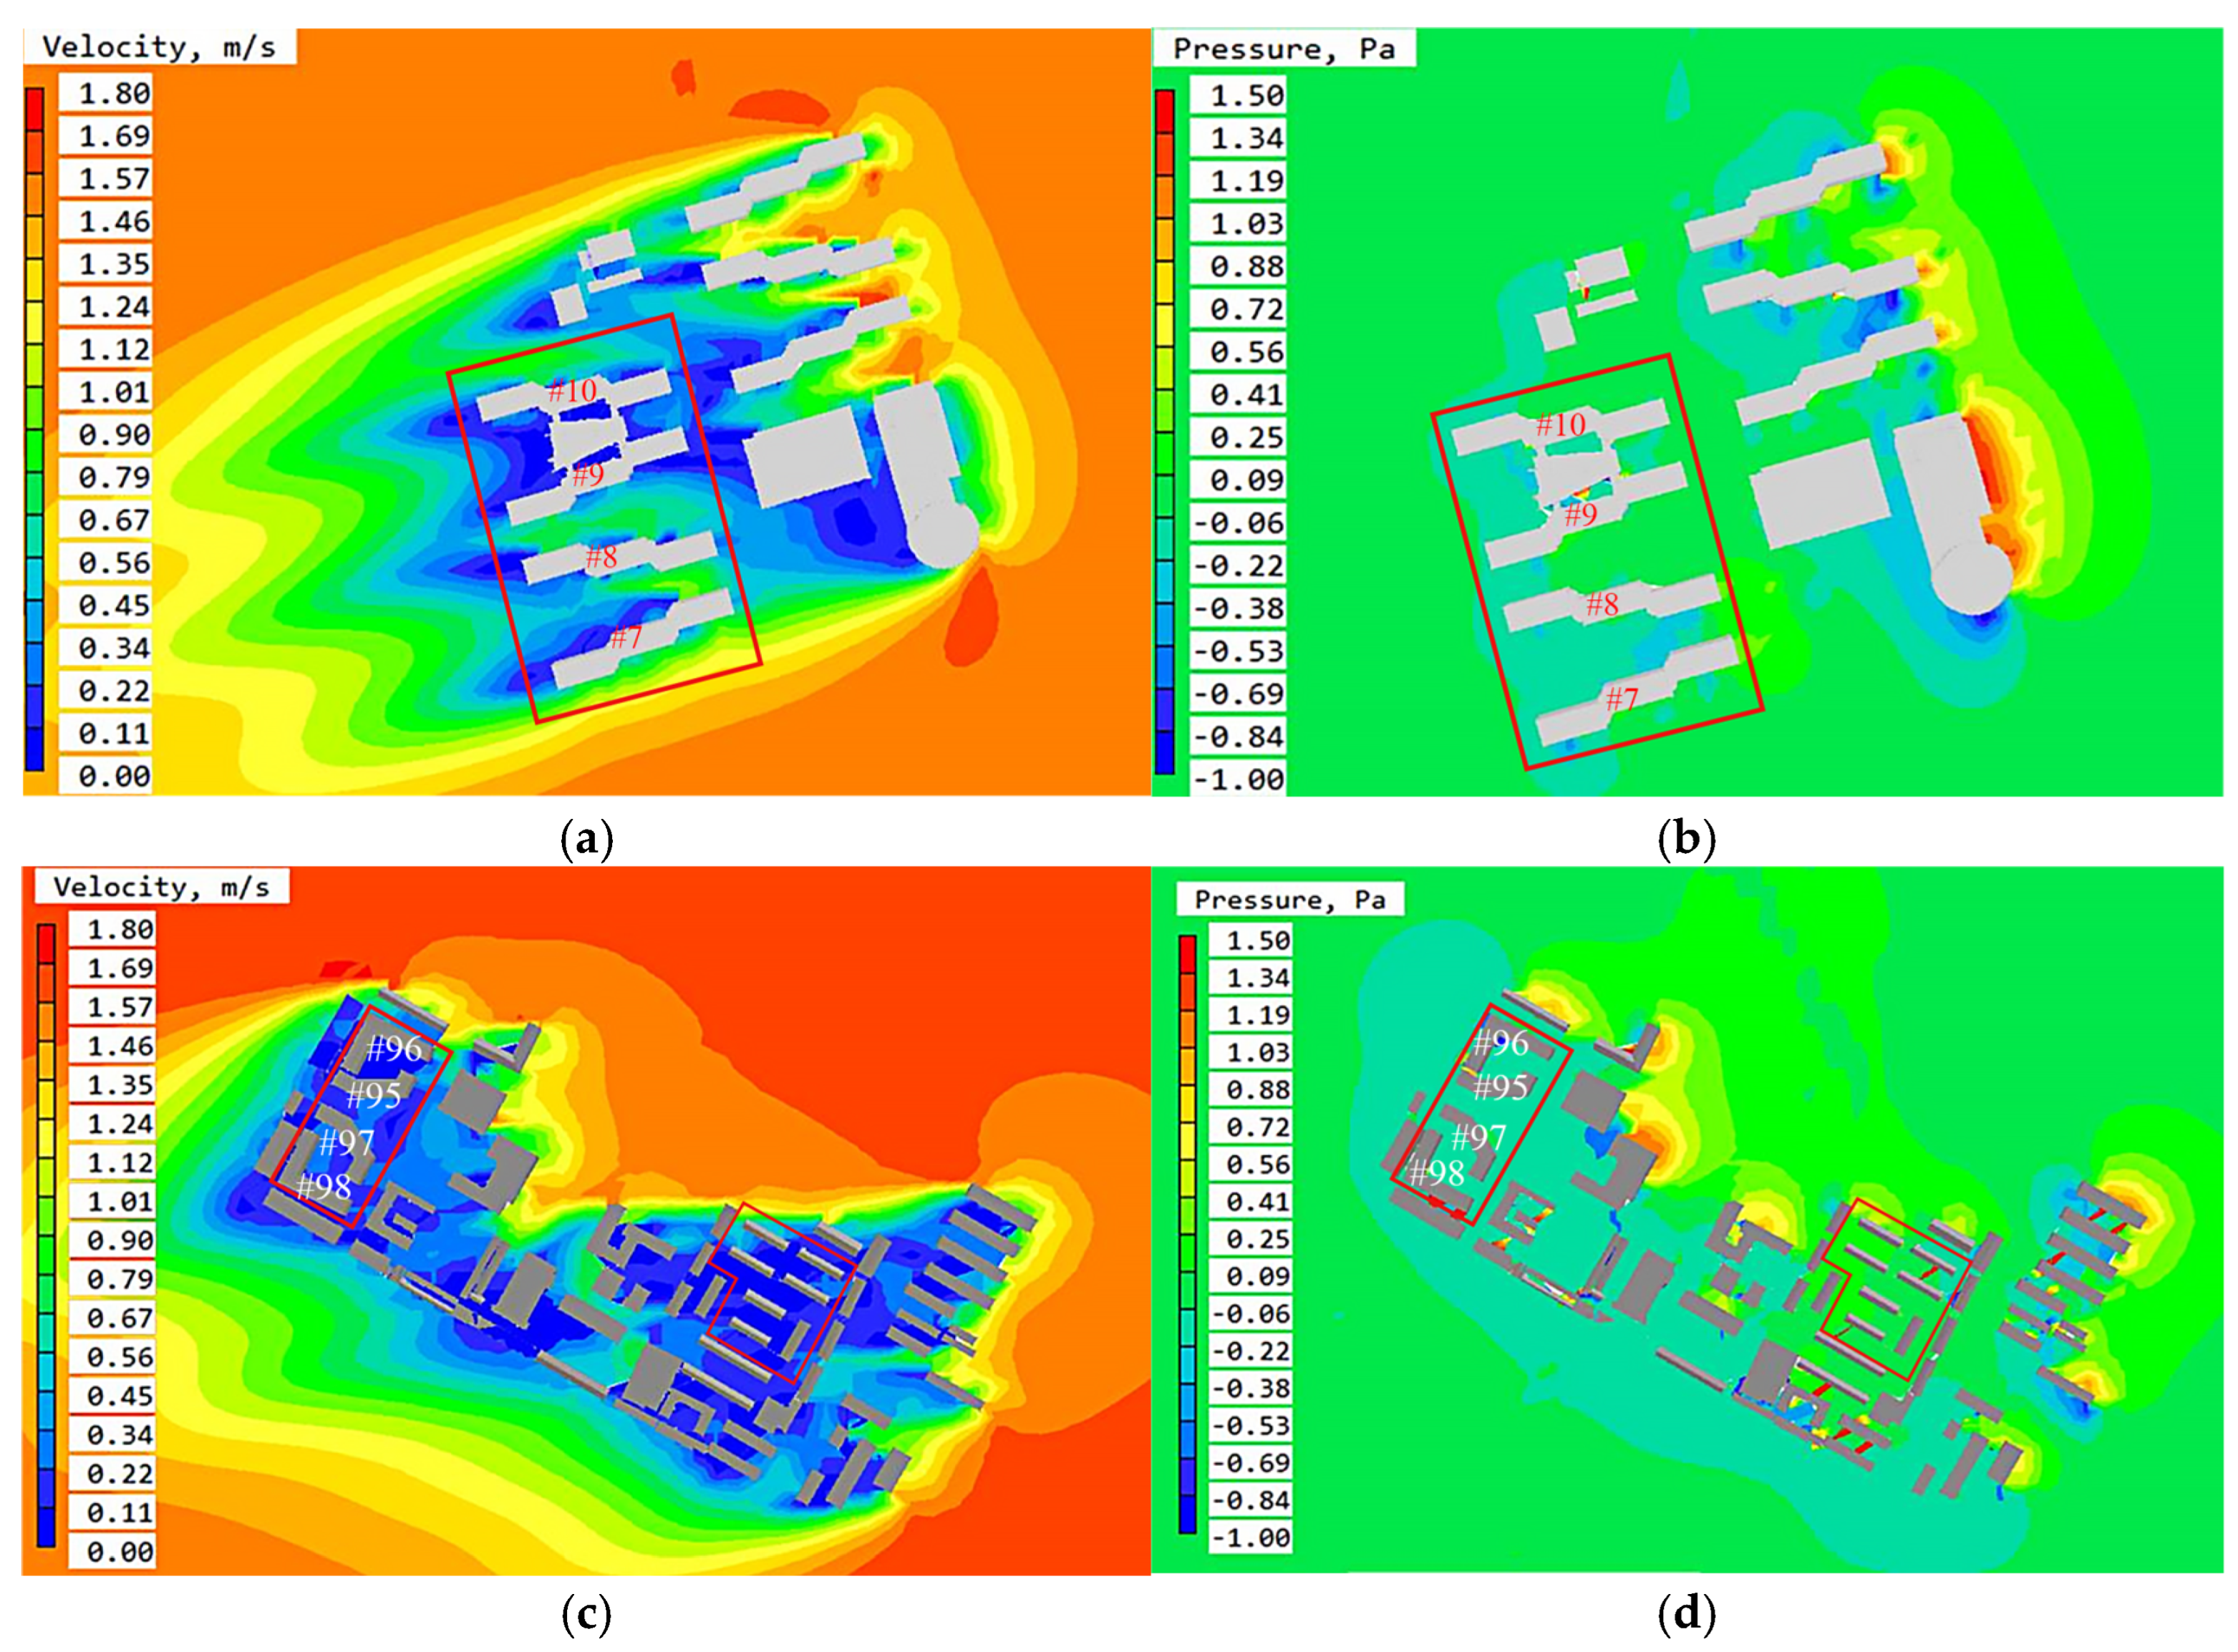
3.1. Outdoor Wind Environment Simulation Analysis

As shown in Table 2, the prevailing wind direction in Xi’an during both summer and winter originates from the northeast. Although seasonal variations in wind speed are observed, the overall characteristics of the outdoor wind environment remain consistent across seasons. Therefore, for the purpose of analysis, this study takes the summer condition as a representative scenario. The simulation results at a pedestrian height of 1.5 m are analyzed for the selected case building, as illustrated in Figure 1.
Based on the wind speed contours (a) and (c) and the wind pressure contours (b) and (d), the common issues in the east and west districts of the XD new campus and the east district of the CHD new campus can be summarized as follows:
  • Wind Speed Issue
In all three areas, the dormitory areas generally exhibit low wind speeds, particularly in regions with enclosed or staggered layouts, where airflow is obstructed, resulting in large calm wind zones. For example, on the leeward face of Building No. 95 in the western district of XD, a wind shadow is formed. Similarly, the enclosed courtyards of Buildings No. 97 and No. 98 experience poor ventilation. A similar reduction in wind speeds is observed in both the eastern district of XD and the eastern district of CHD. Notably, in areas exhibiting the narrow tube effect between dormitory buildings, local wind speeds are slightly enhanced. However, the overall impact remains limited, failing to significantly improve the overall ventilation.
2.
Wind Pressure Issue
The wind pressure contours show that the wind pressure on the windward face of the buildings is generally high, particularly at the building corners, where there is a significant wind pressure differential. For instance, the wind pressure difference before and after the first row of buildings in the western district of XD is 1.35 Pa, while the maximum wind pressure difference in the eastern district reaches 1.56 Pa. Similarly, the wind pressure difference in the eastern district of CHD also reaches 1.56 Pa. Although the wind pressure inside the dormitory areas remains relatively stable, the pressure difference before and after the buildings is generally small, leading to poor airflow and limited ventilation. Particularly in low wind speed conditions, the wind pressure and wind speed are proportional, which hampers the effective enhancement of natural ventilation within the buildings.
3.
Poor Ventilation
Whether in the western or eastern districts of XD, or in the eastern district of CHD, the dormitory areas generally suffer from poor ventilation. This issue is particularly pronounced in the summer months, when internal wind pressure is relatively low, resulting in stuffy conditions that adversely affect ventilation. The enclosed layouts and internal blockages within the buildings hinder the free flow of air, leading to areas with insufficient ventilation [39].
In summary, both of these areas experience issues related to poor ventilation and uneven distribution of wind speed and pressure, which can primarily be attributed to the building layout and dimensions. In particular, airflow obstructions and wind pressure imbalances, resulting from the buildings’ layout and dimensions, significantly impair the natural ventilation performance within the dormitory areas [40].

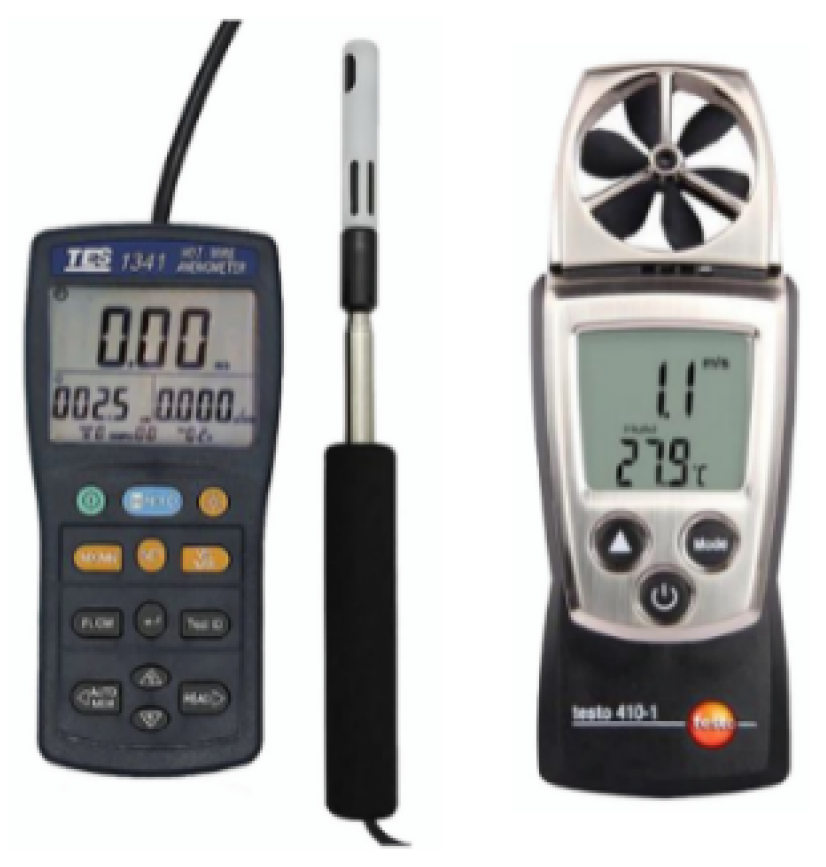
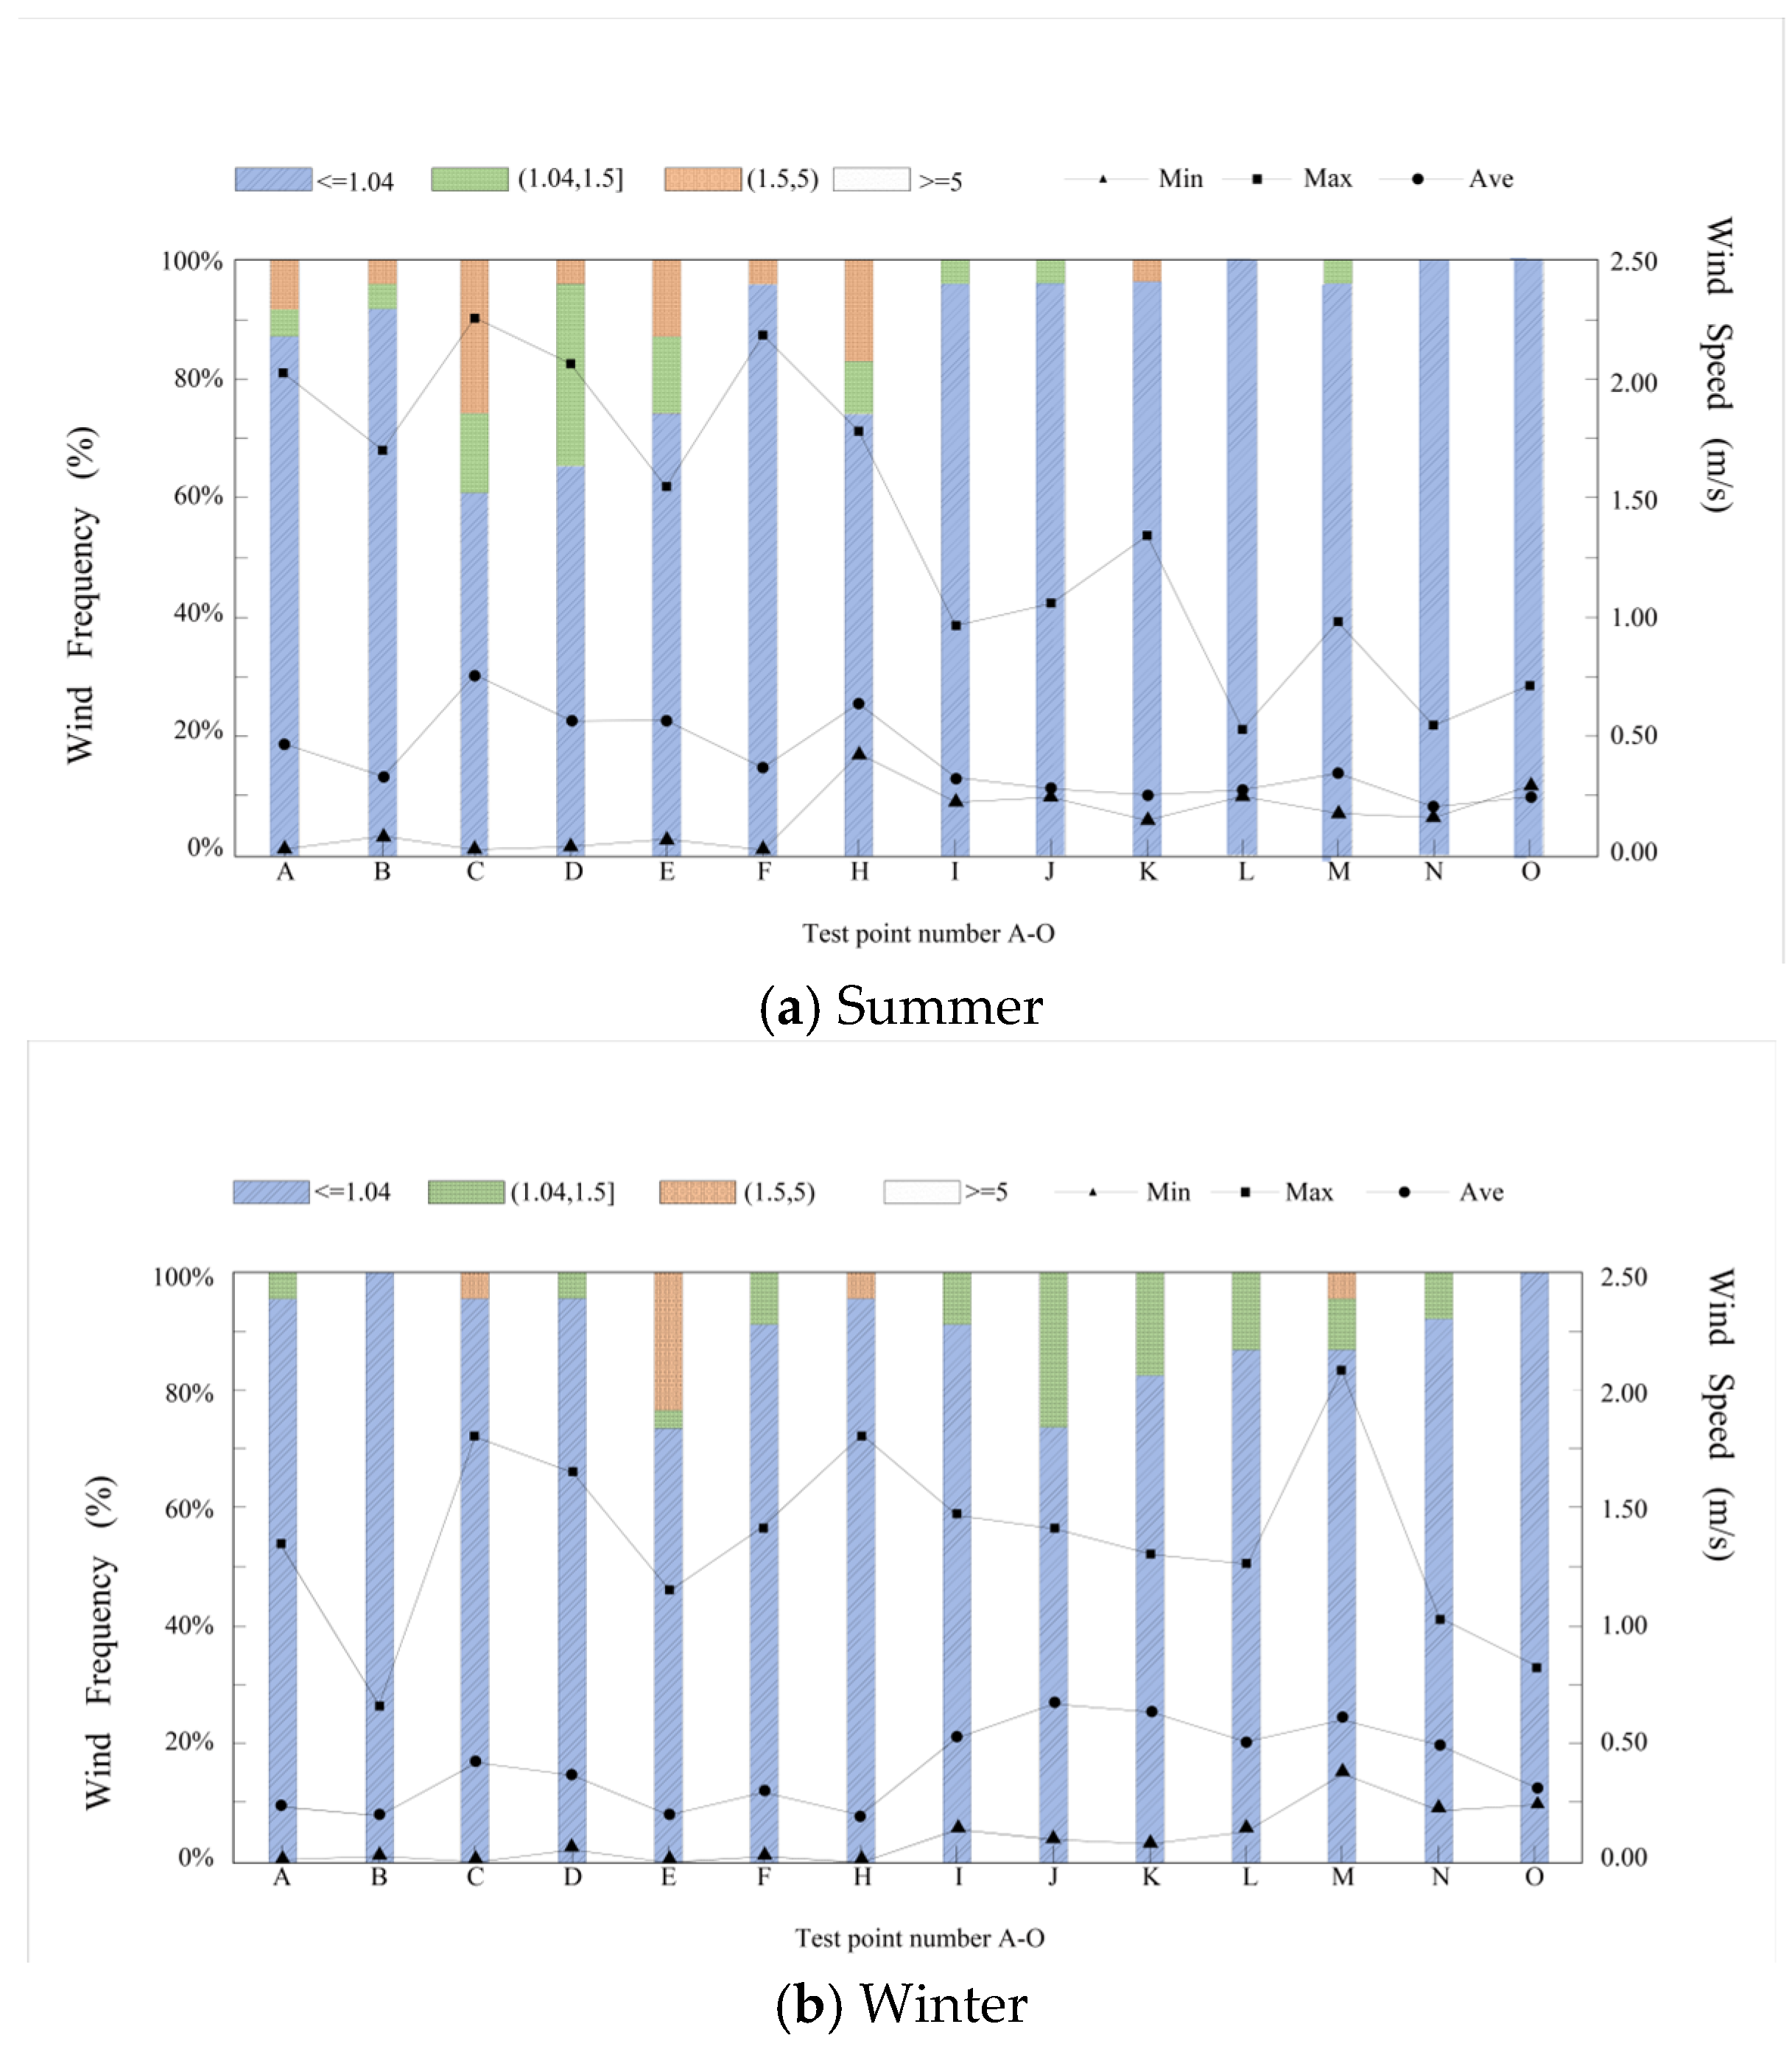
3.2. Measured Data Analysis and Simulation Verification

The multi-story buildings in the eastern area of the new campus of CHD and the multi-story buildings on the new campus of XD were measured on 10 January 2024, and 28 June 2024, respectively. Measurement points were placed at key locations, including the windward and leeward sides, the spaces between adjacent buildings, and at the building corners, to ensure comprehensive data collection. The test instruments used were the TES-1341 hot-wire anemometer (accuracy: ±3% of reading ±0.1 m/s) and the Testo 410-1 impeller anemometer (accuracy: ±1.5% of reading ±0.2 m/s), as shown in Figure 2. Wind speed measurements were conducted from 8:00 a.m. to 7:00 p.m., with data recorded every 0.5 h. The measured results for the eastern area of the new campus of CHD are presented in Figure 3.
In the summer, the outdoor average wind speed throughout the day in the multi-story dormitory area is less than 1 m/s. Overall poor ventilation hinders pollutant diffusion, which adversely affects the health of students. In the winter, the maximum wind speed at measurement point M of the multi-story building in the eastern area of the new campus of CHD reaches 2.09 m/s. Based on the “Evaluation Standards for Green Campuses (GB/T 51356-2019 [41])”, the wind speed in recreational and activity zones outdoor should not exceed 2 m/s. The wind speed at this measurement point exceeds the recommended limit, which is unfavorable for wind proofing and thermal insulation during winter [42]. Similarly, in the dormitory zone of the new campus of XD, poor ventilation is observed in the summer, and both wind proofing and heat preservation in the winter are similarly compromised.
This study employs two indicators, the Mean Absolute Percentage Error (MAPE) and the Root Mean Square Error (RMSE), to verify the accuracy of the simulation results. These are calculated using Formulas (1) and (2), respectively. In the formulas, Xsim represents the simulated value, Xmed represents the measured value, and N is the number of measurements. According to Figure 4, the average absolute percentage error for the slab-type multi-story dormitories is 15.54%, and the Root Mean Square Error is 8.22%, both of which fall within a reasonable error range. The results for both the eastern and western areas of the new campus of XD exhibit similar consistency, indicating that the model and simulation method accurately reflect the real conditions. Furthermore, by comparing the measured and simulated wind speed data graphically, it is evident that the overall trends align closely, with very high similarity at individual measurement points. The observed errors are attributed to factors such as the presence of pedestrians and vegetation during the measurements.
M A P E = i = 1 n X m e d X s i m X m e d N ,
R M S E = i = 1 n ( X m e d X s i m ) 2 N .

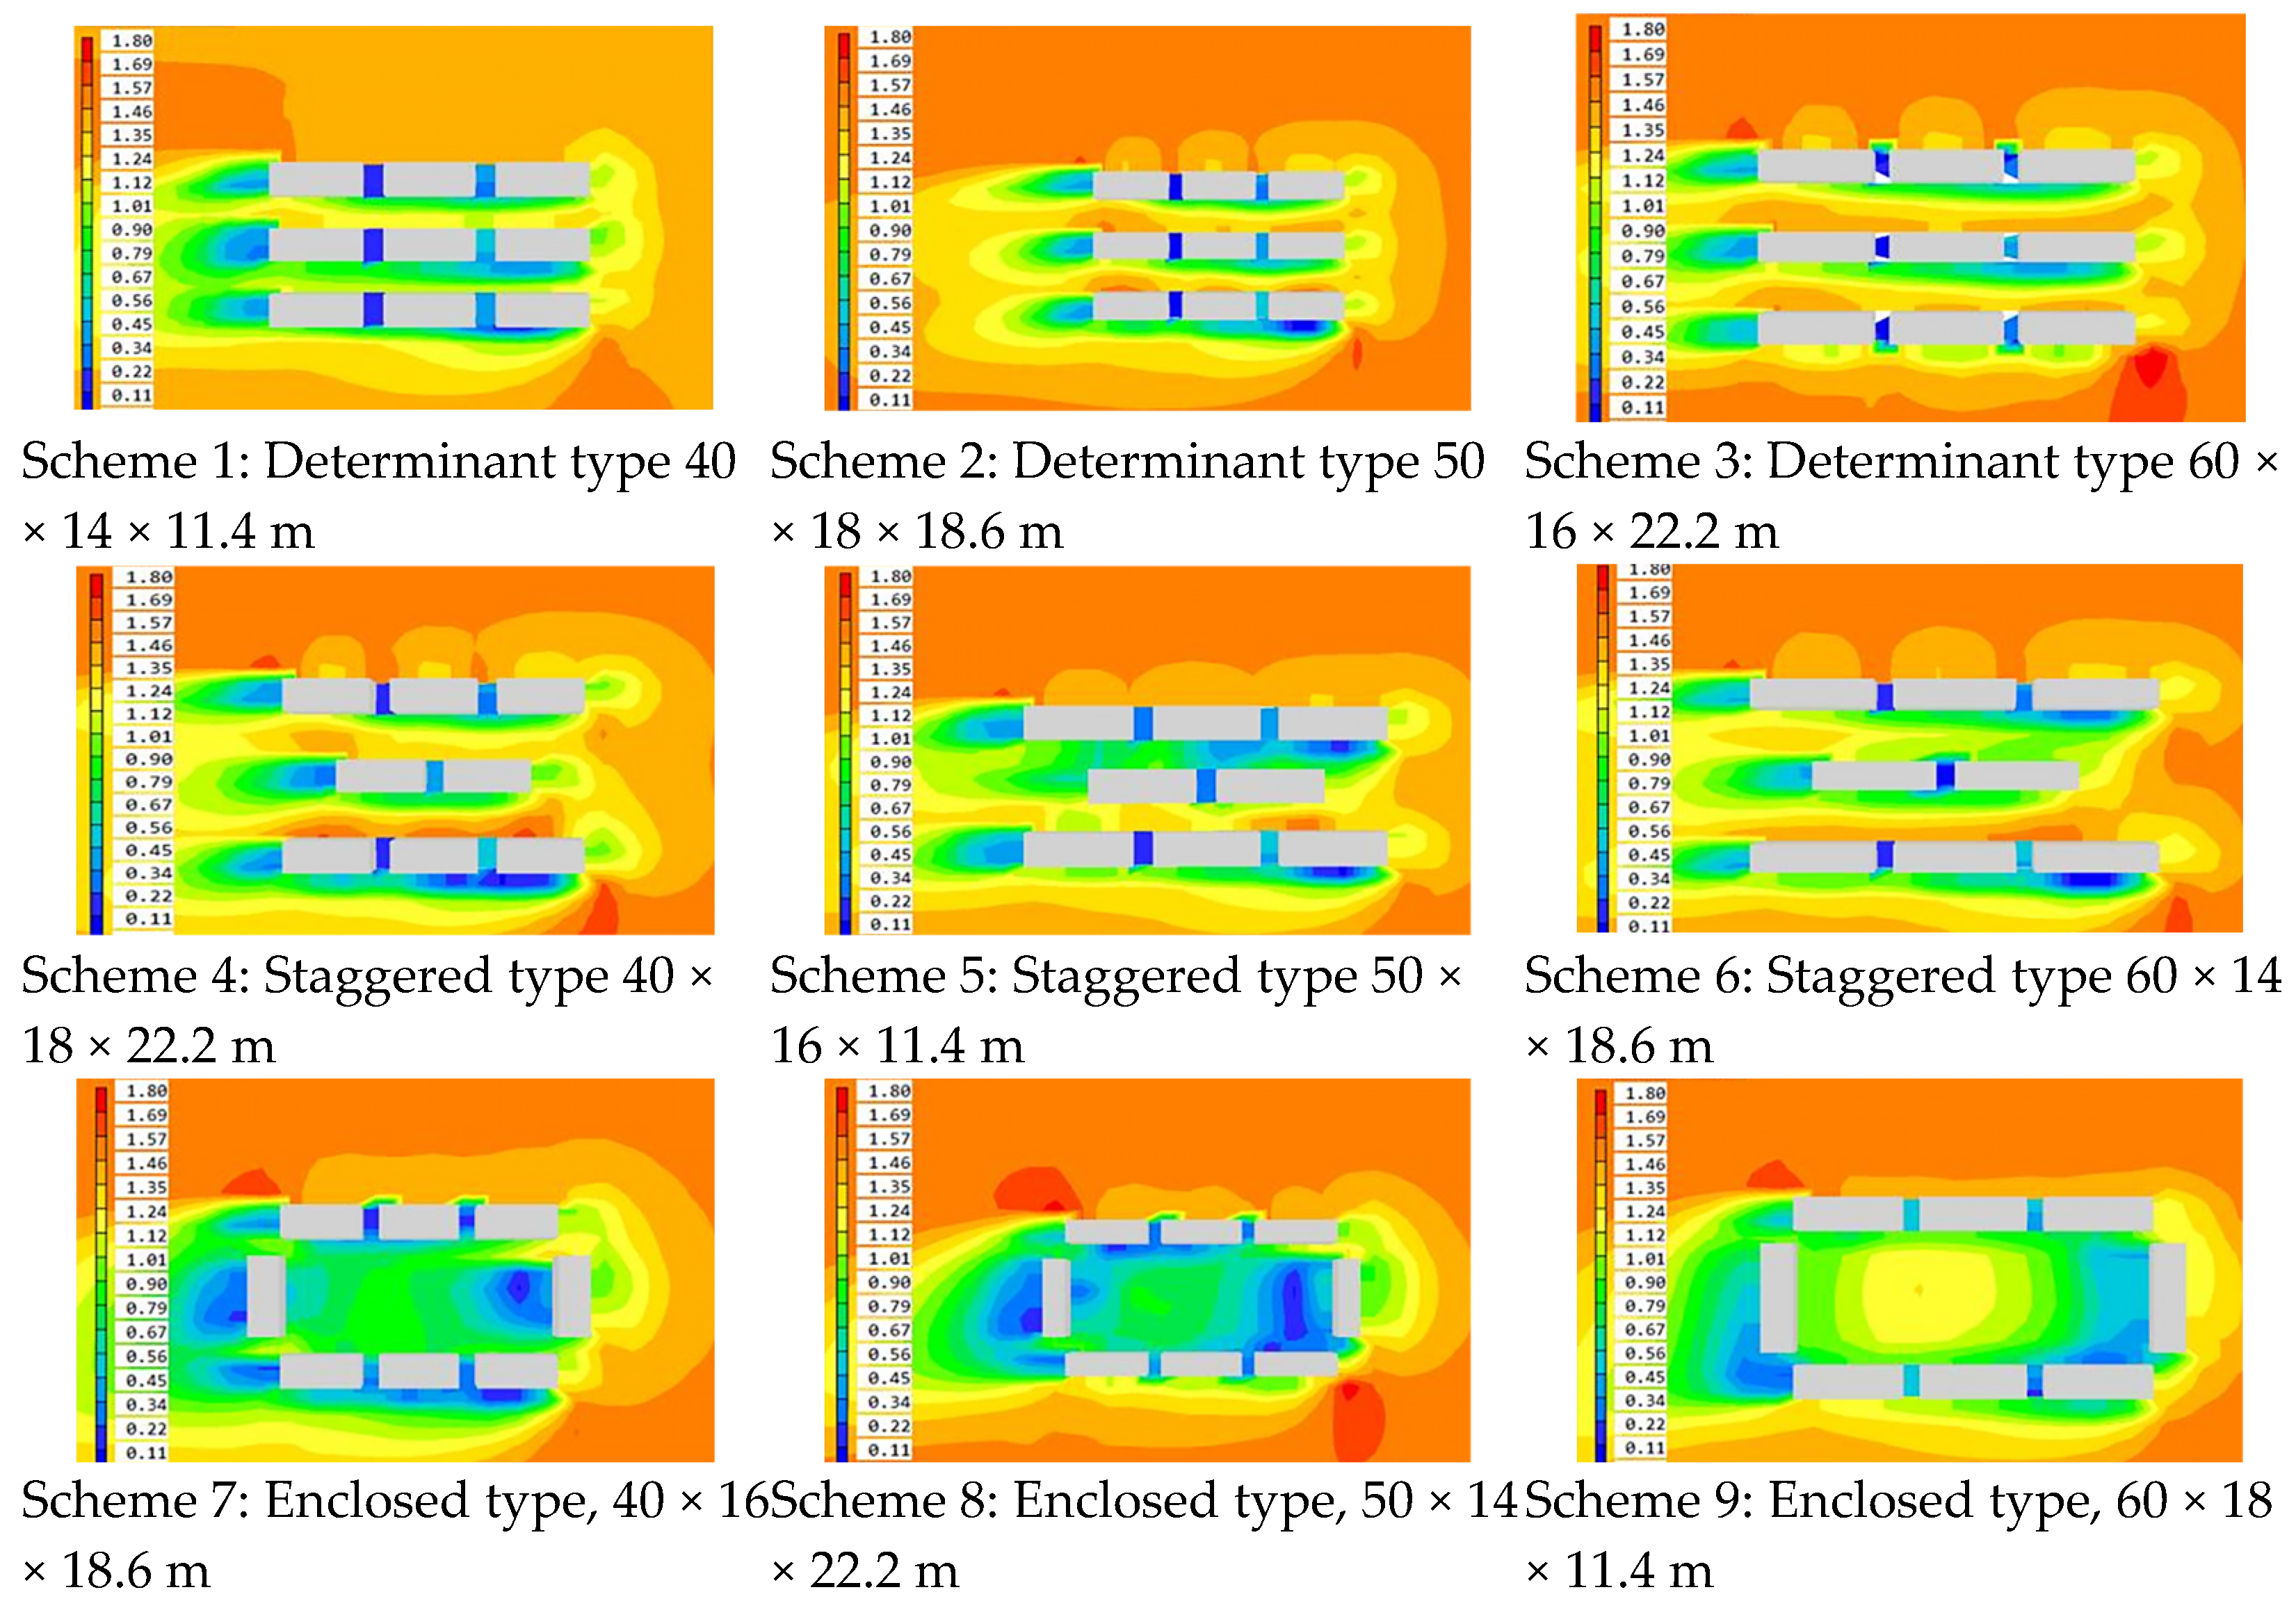
3.3. Orthogonal Experimental Design

The building layout of each scheme needs to set constraint conditions, mainly including fire prevention, sunshine and relevant planning requirements, as shown in Table 5. The simulated wind direction is northeast by east (ENE), which is the dominant wind direction in Xi’an [43]. The wind speed is a typical speed of 1.9 m/s.
The wind environment is influenced by various factors, including layout form, building size, geomorphic conditions, and wind direction. Among these, layout form and building size are particularly critical, as they are more easily optimized during the planning and design phases [46]. Therefore, for multi-story dormitory buildings, this study selects four key influencing factors, each set at three levels, as outlined in Table 6.
This study employs the L9 (4 × 3) orthogonal table for test design, as shown in Table 7. The orthogonal experiment matrix was generated and analyzed using SPSS Statistics 27, a widely used statistical software. SPSS was chosen for its robust data handling capabilities, flexibility in experimental design, and ease of statistical analysis [47].
Figure 5 presents the CFD-simulated wind flow patterns under nine orthogonal design schemes, including determinant, staggered, and enclosed layouts with varying building dimensions. The comparative visualization of airflow distribution allows for intuitive evaluation of how different morphological parameters affect the near-ground wind environment. This figure serves as a key reference for supporting the analysis of wind environment characteristics across the tested configurations.
A total of 90 measurement points are selected from nine different schemes. These points are uniformly distributed across the windward face, leeward face, and between the gable walls of adjacent structures. The specific layout of the measurement points is shown in Figure 6.
As shown in Figure 7, the wind speed values at each simulated measurement point reflect the influence of building layout and size on wind speed. Generally, the wind speed on the windward face of buildings is relatively high, while the wind speed on the leeward face and between the gable walls of adjacent buildings is relatively low. In the determinant layout (Schemes 1–3), the wind speed distribution is uniform, and the wind speed on the windward face increases slightly as building width increases. In the staggered layout (Schemes 4–6), the overall wind speed is relatively high, especially on the leeward face and between the gable walls of adjacent buildings. As building height and length increase, wind speed is enhanced. The enclosed layout (Schemes 7–9) results in the lowest wind speed, which could result in inadequate ventilation. In general, building schemes with larger scale and width lead to higher wind speeds, while enclosed layouts tend to cause low wind speeds and insufficient ventilation.
By calculating the average wind speed at the simulated measurement points for each scheme, the simulation results of the orthogonal test for the multi-story dormitory block are presented in Table 8. It is observed that Scheme 3 yields the highest average wind speed, while Scheme 7 produces the lowest. Table 8 presents the simulation schemes established through an orthogonal experimental design conducted using SPSS software. The schemes investigate the influence of various building layouts—namely determinant, staggered, and enclosed configurations—on the average wind speed within the building cluster. The aim is to identify an optimal spatial arrangement that promotes favorable wind flow conditions.
Based on the average wind speed values, the statistical parameters K, Kavg, and R are calculated, as presented in Table 9. According to the magnitude of R, the factors influencing wind speed are ranked as follows: building width > building length > layout form > building height. Therefore, in the planning and design of multi-story buildings, building width should be the primary consideration, followed by building length and layout form, with building height having relatively little impact on the outdoor wind environment.
The comfortable wind speed range of 1–2 m/s is used as the evaluation criterion. the optimal combination for the multi-story dormitory buildings is A2B3C2D1, corresponding to a staggered layout, a building length of 60 m, a width of 16 m, and a height of 11.4 m.

3.4. Influencing Factor Analysis

The wind speed characteristics in the built environment of cold regions should comply with the provisions outlined in the “Assessment Standard for Green Buildings (GB/T 50378-2019)” [48]. In the section on environmental livability, the pedestrian activity areas on the site should not contain vortex or windless zones under typical summer wind conditions. During typical winter wind conditions, the wind speed at a height of 1.5 m in the pedestrian area around the building should be less than 5 m/s [49], while the wind speed in outdoor rest areas should be less than 2 m/s [20]. Additionally, according to relevant studies, people tend to feel comfortable when the wind speed exceeds 1 m/s. Therefore, the comfortable wind speed range is set between 1 and 2 m/s, and the coupling relationship analysis is conducted based on this standard [50].
According to the results of the orthogonal experiments, the relationship between the influencing factors and the wind environment is shown in Figure 8. For multi-story dormitory areas, the wind environment index is highest when the building layout is staggered. The average wind speeds, in descending order, are as follows: staggered form > determinant form > enclosed form. The building length is directly proportional to wind speed, as the building length increases, so does the wind speed. When the building width increases from 14 m to 18 m, the wind speed initially increases, then decreases. Similarly, an increase in building height from three to six stories leads to an initial decrease followed by a subsequent increase in wind speed.

3.5. Optimal Scheme Verification

In this study, based on the optimal combination scheme for multi-story buildings, a layout optimization simulation is conducted for the dormitory area in the eastern district of the new CHD campus. The optimization scheme adopts the optimal combination of multi-story buildings as A2B3C2D1, which corresponds to a staggered layout, a building length of 60 m, a width of 16 m, and a height of 11.4 m. By simulating and analyzing the airflow within the dormitory area under the optimal layout, as shown in Figure 9 and Figure 10, the following conclusions are drawn:
  • Uniform Wind Speed Distribution.
The optimized design results in a relatively uniform wind speed distribution without extreme peaks. The airflow is smooth, and the fluctuation in wind speed is minimal, thus preventing discomfort caused by strong winds.
2.
Improvement in Human Comfort.
Through layout and size optimization, areas of high wind speed are minimized, reducing the potential for wind-related discomfort and enhancing overall comfort within the dormitory area.
3.
Good Ventilation Effect.
The spacing and arrangement of the buildings are suitable, with no significant wind speed dead zones or areas with excessively high wind speeds. This ensures effective ventilation and smooth airflow within the building complex, promoting good air mobility.

3.6. Strategy Analysis Summary

  • Staggered Layout Design.
The staggered layout is a core design strategy in this study, aimed at reducing direct convective obstruction between buildings through the staggered arrangement [51]. This layout prevents buildings from facing the wind directly by disrupting potential wind speed dead zones that may form between them. As a result, it not only mitigates the risk of excessively high or stagnant wind speeds but also significantly enhances airflow smoothness [52]. Consequently, the wind speed distribution within the dormitory area becomes more uniform, and airflow is more continuous, leading to a substantial improvement in ventilation efficiency.
2.
Optimization of Building Dimensions.
In the optimal scheme, a building dimension combination of 60 m in length, 16 m in width, and 11.4 m in height is selected. These dimensions are designed to avoid extreme wind conditions, preventing both excessively high and low wind speeds. The optimized building dimensions effectively alleviate discomfort caused by excessive wind speeds, while maintaining adequate airflow to support a comfortable living environment. This design strategy not only reduces the extent of high-wind-speed zones but also lowers the risk of wind-induced hazards to residents, thereby enhancing overall living comfort.
3.
Avoidance of Wind Speed Dead Zones and High Wind Speed Obstacles.
In the optimal layout, no obvious wind speed dead zones are formed between building gaps and areas. Wind speed dead zones typically result from an unreasonable building layout or insufficient spacing between buildings, leading to airflow stagnation and reduced ventilation efficiency [5]. By adopting a staggered layout and rational building dimensions, the design enhances inter-building airflow. It effectively avoids airflow disruptions due to extreme wind speeds and substantially improves the ventilation performance of the dormitory area.
4.
Improved Ventilation Effect.
By incorporating a staggered layout and optimizing building dimensions, the dormitory area achieves a more balanced wind speed distribution and smoother airflow. The wind speed fluctuations are relatively mild, preventing extreme variations. This leads to improved ventilation efficiency and reduced discomfort caused by excessively high or low wind speeds. Overall, the optimized design ensures optimal ventilation within the multi-story dormitory layout, fostering a more comfortable living environment.

4. Discussion

4.1. Comparison with the Existing Literature

The preceding literature review categorized representative studies based on building layout forms, dimensions, and shapes, as summarized in Table 1. However, a comparison with Table 10—which lists studies specifically focusing on multi-story dormitory buildings—reveals that such studies are relatively few in number. This contrast underscores that, despite some recent efforts, the majority of existing research remains concentrated on residential and block-type buildings, with limited attention paid to dormitory-specific wind environment analysis, particularly in cold regions.
Tie et al. examined winter wind conditions in dormitory areas at Hohhot University using CFD simulations. Their results show that diagonal and enclosed layouts of U- and L-shaped buildings improve outdoor comfort, offering climate-adaptive design strategies for cold region dormitories [6]. Zhang et al. investigated pedestrian wind comfort around lift-up buildings with varying aspect ratios and core configurations. Wind tunnel tests revealed that recessed core designs reduce high-wind zones, providing guidance for urban morphological optimization [54]. Janssen et al. compared multiple pedestrian wind comfort criteria using CFD simulations around university buildings. Their study revealed inconsistencies among prevailing standards, emphasizing the need for more unified evaluation frameworks [50].
These studies highlight the crucial role of building form and layout in shaping outdoor wind environments, while also revealing the scarcity of research focused on dormitory settings in cold regions.

4.2. Limitations and Future Research

To address this gap, the present study investigates the outdoor wind environment of multi-story dormitory buildings in a cold-region context using an integrated approach that combines field measurements with CFD simulations. This methodology enhances the accuracy of the analysis and provides a practical framework for assessing wind performance in similar climatic conditions.
Nevertheless, this study has the following limitations:
(1) The simulation only covers winter and summer conditions in Xi’an, without considering transitional seasons. Future studies should incorporate full-year climatic data to support more comprehensive and accurate evaluations of outdoor wind comfort.
(2) The analysis focuses on layout form, building dimensions, and shape, but does not account for other potential factors such as building density and morphological complexity. These variables should be integrated into future models for a more robust prediction of wind performance.
(3) The study concentrates on the outdoor wind environment of dormitory buildings and does not address other aspects of the physical environment, such as indoor ventilation or thermal comfort. A more holistic approach is needed to guide integrated improvements in campus living environments.

5. Conclusions

This study investigates the optimization of the outdoor wind environment in multi-story university dormitory areas in cold regions, using CFD simulation combined with orthogonal experimental design. The work is grounded in architectural practice, aiming to inform early-stage design decisions rather than relying solely on theoretical modeling.
(1) Building layout and dimensional parameters (length, width, height) significantly influence pedestrian-level wind conditions, with building width identified as the most critical factor.
(2) The optimal configuration—a staggered layout with dormitory dimensions of 60 m (length), 16 m (width), and 11.4 m (height)—enhances airflow uniformity and spatial balance.
(3) CFD results from the CHD show that this scheme reduces near-ground wind speed by 18%, improving outdoor comfort in both summer and winter.
(4) The findings underscore the importance of considering not only individual parameters, but also the interaction between building form and wind flow in design evaluation.
By aligning environmental simulation with architectural thinking, this study provides a practical reference for climate-responsive dormitory design and supports the development of sustainable campus environments in cold regions.

Author Contributions

Conceptualization, X.C. and Q.L.; methodology, X.C., H.K. and Q.L.; software, X.C.; validation, X.C., H.K. and J.Z.; formal analysis, X.C.; investigation, H.K. and J.Z.; resources, X.C. and H.K.; data curation, X.C. and H.K.; writing—original draft preparation, X.C. and Q.L.; writing—review and editing, Q.L.; visualization, H.K. and J.Z.; supervision, X.C. and Q.L.; project administration, Q.L.; funding acquisition, Q.L. All authors have read and agreed to the published version of the manuscript.

Funding

This research was funded by Shaanxi Provincial Department of Science and Technology, the key international cooperation projects (grant number 2024GH-ZDXM-03).

Data Availability Statement

The data presented in this study are available on request from the corresponding author.

Conflicts of Interest

The authors declare no conflicts of interest.

References

  1. Du, Y.X.; Mak, C.M. Improving Pedestrian Level Low Wind Velocity Environment in High-Density Cities. Sustain. Cities Soc. 2018, 42, 314–324. [Google Scholar] [CrossRef] [PubMed]
  2. Alnusairat, S.; Al-Shatnawi, Z.; Ayyad, Y.; Alwaked, A.; Abuanzeh, N. Rethinking Outdoor Courtyard Spaces on University Campuses to Enhance Health and Wellbeing: The Anti-Virus Built Environment. Sustainability 2022, 14, 5602. [Google Scholar] [CrossRef]
  3. Liu, Q.; Ren, J. Research on the building energy efficiency design strategy of Chinese universities based on green performance analysis. Energy Build. 2020, 224, 110242. [Google Scholar] [CrossRef]
  4. Shui, T.T.; Liu, J.; Yuan, Q.; Qu, Y.; Jin, H.; Cao, J.L.; Liu, L.; Chen, X. Assessment of pedestrian-level wind conditions in severe cold regions of China. Build. Environ. 2018, 135, 53–67. [Google Scholar] [CrossRef]
  5. Myroniuk, K.; Furdas, Y.; Zhelykh, V.; Yurkevych, Y. Examining Wind Flow’s Impact on Multi-Storey Buildings: A Quest for Quality Improvement. Prod. Eng. Arch. 2024, 30, 57–66. [Google Scholar] [CrossRef]
  6. Tie, W.; Wang, W.; Lin, D. Enhancing the winter wind conditions in the dormitory vicinity of Hohhot University through a biomechanical perspective. Mol. Cell. Biomech. 2025, 22, 1076. [Google Scholar] [CrossRef]
  7. Deng, J.Y.; Xia, Y.; Lao, H.; Ye, Y.K.; Wang, Z.J.; Jiang, H.Y. Natural ventilation potential of teaching building complexes with different block shapes and layout patterns. J. Build. Eng. 2024, 96, 110420. [Google Scholar] [CrossRef]
  8. Mei, S.J.; Hu, J.T.; Liu, D.; Zhao, F.Y.; Li, Y.G.; Wang, Y.; Wang, H.Q. Wind driven natural ventilation in the idealized building block arrays with multiple urban morphologies and unique package building density. Energy Build. 2017, 155, 324–338. [Google Scholar] [CrossRef]
  9. Wu, Z.G.; Li, B.L.; Shi, F.; Xiao, Z.H.; Hong, X.C. Analysis of the Impact of Layout Mode on the Wind Environment of Dormitories in Coastal Universities in Southern Fujian Province. Buildings 2023, 13, 3030. [Google Scholar] [CrossRef]
  10. Poddaeva, O.; Churin, P. Improving the comfort of pedestrian and recreational areas of the stylobate part of the residential complex. Energy Rep. 2021, 7, 395–402. [Google Scholar] [CrossRef]
  11. Zheng, S.; Wang, Y.; Zhai, Z.Q.; Xue, Y.; Lin, D.M. Characteristics of wind flow around a target building with different surrounding building layers predicted by CFD simulation. Build. Environ. 2021, 201, 107962. [Google Scholar] [CrossRef]
  12. Ma, T.; Chen, T. Classification and pedestrian-level wind environment assessment among Tianjin’s residential area based on numerical simulation. Urban Clim. 2020, 34, 100702. [Google Scholar] [CrossRef]
  13. Mou, B.; He, B.J.; Zhao, D.X.; Chau, K.W. Numerical simulation of the effects of building dimensional variation on wind pressure distribution. Eng. Appl. Comput. Fluid Mech. 2017, 119, 293–309. [Google Scholar] [CrossRef]
  14. Zahid Iqbal, Q.M.; Chan, A.L.S. Pedestrian level wind environment assessment around group of high-rise cross-shaped buildings: Effect of building shape, separation and orientation. Build. Environ. 2016, 101, 45–63. [Google Scholar] [CrossRef]
  15. Wu, Y.H.; Li, W.F.; Zeng, N.Y.; Bai, X.X. Analyzing the Impact of Tall Building Geometries on Wind Environment in a Hypothetical Urban Context: A Typological and Parametric Study. Lect. Notes Civ. Eng. 2023, 559, 565–577. [Google Scholar]
  16. Dai, Y.W.; Mak, C.M.; Ai, Z.T. Computational fluid dynamics simulation of wind-driven inter-unit dispersion around multi-storey buildings: Upstream building effect. Indoor Built Environ. 2017, 28, 217–234. [Google Scholar] [CrossRef]
  17. Druenen, V.T.; Hooff, T.V.; Montazeri, H.; Blocken, B. CFD evaluation of building geometry modifications to reduce pedestrian level wind speed. Build. Environ. 2019, 163, 106293. [Google Scholar] [CrossRef]
  18. Xie, Z.Y.; Yang, N. Optimization Design Strategy of High-Rise Building Form for Improving Outdoor Wind Environment. Archit. J. 2013, 2. [Google Scholar]
  19. Adamek, K.; Vasan, N.; Elshaer, A.; English, E.; Bitsuamlak, G. Pedestrian level wind assessment through city development: A study of the financial district in Toronto. Sustain. Cities Soc. 2017, 35, 179–190. [Google Scholar] [CrossRef]
  20. Hong, B.; Lin, B.R. Numerical studies of the outdoor wind environment and thermal comfort at pedestrian level in housing blocks with different building layout patterns and trees arrangement. Renew. Energy 2015, 73, 18–27. [Google Scholar] [CrossRef]
  21. Shirzadi, M.; Tominaga, Y. CFD evaluation of mean and turbulent wind characteristics around a high-rise building affected by its surroundings University campus. Build. Environ. 2022, 225, 109637. [Google Scholar] [CrossRef]
  22. Le, D.; Li, N.P.; Su, L. Study on wind environment characteristic of different height high-rise residential buildings in Changsha, China. Nat. Environ. Pollut. Technol. 2016. [Google Scholar]
  23. Taseiko, O.V.; Mikhailuta, O.V.; Pitt, A.; Lezhenin, A.A.; Zakharov, Y.V. Air pollution dispersion within urban street canyons. Atmos. Environ. 2009, 43, 245–252. [Google Scholar] [CrossRef]
  24. Poddaeva, O.; Churin, P. Numerical simulation of the pedestrian comfort of the micro district. Sci. Direct. 2022, 8, 1491–1500. [Google Scholar]
  25. Shi, X.; Zhu, Y.Y.; Duan, J.; Shao, R.Q.; Wang, J.G. Assessment of pedestrian wind environment in urban planning design. Landsc. Urban Plan. 2015, 140, 17–28. [Google Scholar] [CrossRef]
  26. Kaseb, Z.; Hafezi, M.; Tahbaz, M.; Delfani, D. A framework for pedestrian-level wind conditions improvement in urban areas: CFD simulation and optimization. Build. Environ. 2020, 184, 107191. [Google Scholar] [CrossRef]
  27. Tsichritzis, L.; Nikolopoulou, M. The effect of building height and façade area ratio on pedestrian wind comfort of London. J. Wind Eng. Ind. Aerodyn. 2019, 191, 63–75. [Google Scholar] [CrossRef]
  28. Tse, K.T.; Weerasuriya, A.U.; Zhang, X.L.; Li, S.W.; Kwok, K.C.S. Effects of twisted wind flows on wind conditions in passages between buildings. J. Wind Eng. Ind. Aerodyn. 2017, 167, 87–100. [Google Scholar] [CrossRef]
  29. Ramponi, R.; Blocken, B.; Laura Bde, C.; Janssen, W.D. CFD simulation of outdoor ventilation of generic urban configurations with different urban densities and equal and unequal street widths. Build. Environ. 2015, 92, 152–166. [Google Scholar] [CrossRef]
  30. Chen, L.; Hang, J.; Sandberg, M.T.; Claesson, L.; Sabatino, S.D.; Wigo, H. The impacts of building height variations and building packing densities on flow adjustment and city breathability in idealized urban models. Build. Environ. 2017, 118, 334–361. [Google Scholar] [CrossRef]
  31. GB 50352-2019; Unified Design Standards for Civil Buildings. Architecture & Building Press: Beijing, China, 2019.
  32. CBA Clima Tool. Available online: https://clima.cbe.berkeley.edu/ (accessed on 10 January 2025).
  33. GB/T 19201-2006; Grade of Tropical Cyclones. China National Standardization Management Committee: Beijing, China, 2006.
  34. Lei, Z.; Liu, C.; Wang, L.; Li, N. Effect of natural ventilation on indoor air quality and thermal comfort in dormitory during winter. Build. Environ. 2017, 125, 240–247. [Google Scholar] [CrossRef]
  35. World Meteorological Organization. Available online: https://public.wmo.int/en (accessed on 10 January 2025).
  36. Jiru, T.E.; Bitsuamlak, G.T. Application of CFD in Modelling Wind-Induced Natural Ventilation of Buildings—A Review. Int. J. Vent. 2010, 9, 131–147. [Google Scholar] [CrossRef]
  37. Zhu, J.J.; Chew, D.A.; Lv, S.; Wu, W.W. Optimization method for building envelope design to minimize carbon emissions of building operational energy consumption using orthogonal experimental design (OED). Habitat Int. 2013, 37, 148–154. [Google Scholar] [CrossRef]
  38. Lu, Y.; Wang, T.; Zhao, C.; Zhu, Y.; Jia, X.; Zhang, L.; Shi, F.; Jiang, C. An efficient design method of indoor ventilation parameters for high-speed trains using improved proper orthogonal decomposition reconstruction. J. Build. Eng. 2023, 71, 106600. [Google Scholar] [CrossRef]
  39. Ren, C.; Wang, J.; Feng, Z.; Kim, M.K.; Haghighat, F.; Cao, S.-J. Refined design of ventilation systems to mitigate infection risk in hospital wards: Perspective from ventilation openings setting. Environ. Pollut. 2023, 333, 122025. [Google Scholar] [CrossRef]
  40. Yang, T.; Clements-Croome, D.J. Natural Ventilation in Built Environment. Sustain. Built Environ. 2018, 23, 434–464. [Google Scholar]
  41. GB/T 51356-2019; Assessment Standard for Green Campus. Ministry of Housing and Urban-Rural Development of the People’s Republic of China: Beijing, China, 2019.
  42. Abdollahzadeh, N.; Biloria, N. Outdoor thermal comfort: Analyzing the impact of urban configurations on the thermal performance of street canyons in the humid subtropical climate of Sydney. Front. Archit. Res. 2021, 10, 394–409. [Google Scholar] [CrossRef]
  43. Weather Spark. Available online: https://zh.weatherspark.com/ (accessed on 10 January 2025).
  44. JGJ36-2016; Code for Design of Dormitory Building. Ministry of Housing and Urban-Rural Development: Beijing, China, 2017.
  45. GB-50016-2014; Fire Protection Code for Building Design. Ministry of Housing and Urban-Rural Development: Beijing, China, 2015.
  46. Yang, S.; Zhou, D.; Wang, Y. Comparing impact of multi-factor planning layouts in residential areas on summer thermal comfort based on orthogonal design of experiment (ODOE). Build. Environ. 2020, 182, 107145. [Google Scholar] [CrossRef]
  47. Rahman, A.; Muktadir, M.G. SPSS: An Imperative Quantitative Data Analysis Tool for Social Science Research. Int. J. Res. Innov. Soc. Sci. 2021, 5, 300–301. [Google Scholar] [CrossRef]
  48. GB/T 50378-2019; Green Building Evaluation Standard. Ministry of Housing and Urban-Rural Development: Beijing, China, 2024.
  49. Mittal, H.; Sharma, A.; Gairola, A. A review on the study of urban wind at the pedestrian level around buildings. J. Build. Eng. 2018, 18, 154–163. [Google Scholar] [CrossRef]
  50. Janssen, W.D.; Blocken, B.; Hooff, T.V. Pedestrian wind comfort around buildings: Comparison of wind comfort criteria based on whole-flow field data for a complex case study. Build. Environ. 2013, 59, 547–562. [Google Scholar] [CrossRef]
  51. You, W.; Shen, J.L.; Ding, W.W. Improving residential building arrangement design by assessing outdoor ventilation efficiency in different regional spaces. Archit. Sci. Rev. 2018, 61, 202–214. [Google Scholar] [CrossRef]
  52. Cheung, J.O.P.; Liu, C.H. CFD simulations of natural ventilation behaviour in high-rise buildings in regular and staggered arrangements at various spacings. Energy Build. 2011, 43, 1149–1158. [Google Scholar] [CrossRef]
  53. Fan, L.Q.; Ren, S.W.; Ma, Y.; Liu, Q.B. The Coupling Relationship between Building Morphology and Outdoor Wind Environment in the High-Rise Dormitory Area in China. Energies 2023, 16, 3655. [Google Scholar] [CrossRef]
  54. Zhang, X.L.; Tse, K.T.; Weerasuriya, A.U.; Li, S.W.; Kwok, K.C.S.; Mak, C.M.; Niu, J.L.; Lin, Z. Evaluation of pedestrian wind comfort near ‘lift-up’ buildings with different aspect ratios and central core modifications. Build. Environ. 2017, 124, 245–247. [Google Scholar] [CrossRef]
  55. Du, Y.X.; Mak, C.M.; Liu, J.L.; Xia, Q.; Niu, J.L.; Kwok, K.C.S. Effects of lift-up design on pedestrian level wind comfort in different building configurations under three wind directions. Build. Environ. 2017, 117, 84–99. [Google Scholar] [CrossRef]
Figure 1. Wind Speed and Wind Pressure Contour Maps at Pedestrian Height of Plate-Type Multi-Story Building. (a) Plate-type multi-story wind speed cloud map of the new campus of CHD. (b) Plate-type multi-story wind pressure cloud map of the new campus of CHD. (c) Plate-type multi-story wind speed cloud map of XD new campus. (d) Plate-type multi-story wind pressure cloud chart of XD new campus.
Buildings 15 01747 g001
Figure 2. Test instruments: hot-wire anemometer and impeller anemometer.
Buildings 15 01747 g002
Figure 3. Average wind speed, maximum and minimum wind speed, and wind frequency at all points in winter and summer on the new campus of CHD.
Buildings 15 01747 g003
Figure 4. Comparison of measured and simulated wind speeds of CHD.
Buildings 15 01747 g004
Figure 5. Simulation cloud diagrams of each orthogonal test scheme.
Buildings 15 01747 g005
Figure 6. Schematic diagram of simulated measuring point layout.
Buildings 15 01747 g006
Figure 7. Wind speed values at simulated measurement points of multi-story dormitory.
Buildings 15 01747 g007
Figure 8. Analysis of the advantages and disadvantages of different levels of various influencing factors.
Buildings 15 01747 g008
Figure 9. Schematic diagram of outdoor wind environment simulation of original building layout.
Buildings 15 01747 g009
Figure 10. Schematic diagram of outdoor wind environment simulation of adjusted building layout.
Buildings 15 01747 g010
Table 2. Wind direction, wind speed and wind frequency table of Xi’an City [35].
SeasonMonthsPrevailing Wind DirectionAverage Wind SpeedWind FrequencySubdominant Wind DirectionAverage Wind SpeedWind Frequency
SummerJune, July, AugustNortheast by east2.5 m/s42.2%Southwest2.3 m/s18.1%
WinterDecember, January, FebruaryNortheast by east2.2 m/s37.5%Southwest2.0 m/s25.1%
Table 3. Basic overview and measuring point distribution of typical cases.
Case 1. Multistory Dormitories in the East Area of the New Campus of CHD
Orientation15 degrees east of southBuildings 15 01747 i001
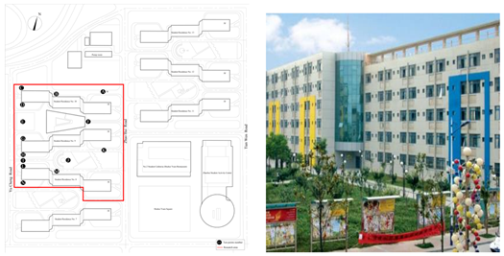
(a) General layout and measured scheme   (b) Facade real scene
Number of floors and heightMiddle part: 6 floors.
Both sides: 5 floors.
21.2 m.
Architectural formPlate multi-layer
Layout formDeterminant type
Case 2. Multi-story dormitories in the west area of XD’s new campus
Orientation30 degrees west of southBuildings 15 01747 i002
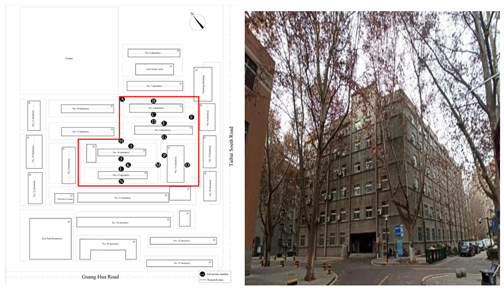
(c) General layout and measured scheme    (d) Facade real scene
Number of floors and height6 layers, 22.5 m
Architectural formPlate-type multi-story
Layout formEnclosed type
Case 3. Multi-story dormitory in the east area of XD’s new campus
Orientation30 degrees south by west.Buildings 15 01747 i003
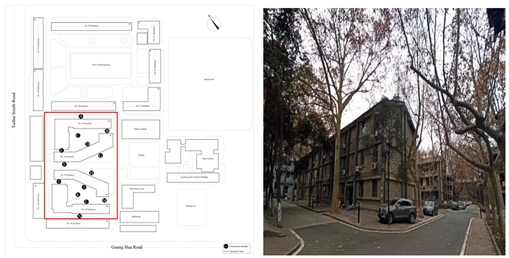
(e) General layout and measured scheme       (f) Facade real scene
Number of floors and height3 layers, 13.8 m
Architectural formPlate-type multi-story
Layout formStaggered type
Table 4. Simulation parameter setting.
ParameterSpecific SettingParameterSpecific Setting
Model creationRHINO modeling into PHOENICSSelection governing equationsStandard k-ε turbulence model
Computational domainLength × width × height: 5X × 5Y × 3ZMeteorological parametersWind direction: East–Northeast
Wind speed: 1.9 m/s in summer, 1.4 m/s in winter
Number of iterations1000Grid divisionBuilding local encryption
Table 5. Scheme constraint conditions.
Constraint NameConstraint ConditionsBasis
Dormitory design requirementsThe spacing between dormitory buildings should meet the fire prevention, sunlight, and other relevant requirements, as well as comply with local urban planning regulations.Code for design of dormitory building (JGJ36-2016) [44]
Fire prevention requirementsThe minimum distance between multi-story civil buildings should be 9 m.Code for fire protection design of buildings (GB-50016-2014) [45]
Sunshine requirementsEnsure that shaded buildings meet the sunlight requirement of ≥2 h on the winter solstice. The calculation starts from the bottom window sill, which is set at 0.9 m.Building sunshine standard
Spacing requirements for gable wallsThe minimum spacing between multi-story civil buildings on the gable side is 9 m.Provisions on Urban Planning Administration of Xi’an City
Table 6. Influencing factors and levels of outdoor wind environment of multi-story buildings.
A. Building LayoutB. Building Length (m)C. Building Width (m)D. Building Height (m)
1A1 (Aligned layout)B1 (40)C1 (14)D1 (11.4)
2A2 (Staggered layout)B2 (50)C2 (16)D2 (18.6)
3A3 (Enclosed layout)B3 (60)C3 (18)D3 (22.2)
Table 7. Orthogonal test table for plate-type multi-layer.
Simulation SchemesFactor A: Building LayoutFactor B: Building Length (m)Factor C: Building Width (m)Factor D: Building Height (m)
1. A1B1C1D1A1 (Aligned layout)B1 (40)C1 (14)D1 (11.4)
2. A1B2C3D2A1B2 (50)C2 (16)D2 (18.6)
3. A1B3C2D3A1B3 (60)C3 (18)D3 (22.2)
4. A2B1C3D3A2 (Staggered layout)B1C3D3
5. A2B2C2D1A2B2C2D1
6. A2B3C1D2A2B3C1D2
7. A3B1C2D2A3 (Enclosed layout)B1C2D2
8. A3B2C1D3A3B2C1D3
9. A3B3C3D1A3B3C3D1
Table 8. Table of simulation results of plate-type multilayer orthogonal experiment.
Simulation
Schemes
A: Building
Layout
B: Building
Length (m)
C: Building Width (m)D: Building Height (m)(V) Average Wind Speed (m/s)
1. A1B1C1D1A1 (Aligned layout)B1 (40)C1 (14)D1 (11.4)0.71
2. A1B2C3D2A1B2 (50)C2 (16)D2 (18.6)0.76
3. A1B3C2D3A1B3 (60)C3 (18)D3 (22.2)1.03
4. A2B1C3D3A2 (Staggered layout)B1C3D30.81
5. A2B2C2D1A2B2C2D10.98
6. A2B3C1D2A2B3C1D21.02
7. A3B1C2D2A3 (Enclosed layout)B1C2D20.56
8. A3B2C1D3A3B2C1D30.76
9. A3B3C3D1A3B3C3D10.93
Table 9. Range table of plate-type multilayer orthogonal experiment.
LevelsA. Building
Layout
B. Building
Length (m)
C. Building
Width (m)
D. Building
Height (m)
K12.52.082.492.62
22.812.52.572.34
32.252.982.52.6
Kavg10.8330.6930.4150.873
20.9340.8330.8570.780
30.7500.9930.8330.867
Optimal LevelA2B2C2D1
R0.1840.3000.4420.093
Optimization percentageA3 (Enclosed layout)B3 (60)C3 (18)D3 (22.2)
Table 10. Representative studies on the optimization of outdoor wind environment in multi-story dormitories.
Research FactorsBuilding TypesSpecific FactorsLiteratureResearch Methods
Layout formCampus architectureInfluence of layout mode on wind environment[6,7,8,9,53]Numerical simulation
Building dimensionsCampus architectureInfluence of building height and width on wind environment[54]Wind tunnel test
Building formsCampus architectureInfluence of building shape on wind environment[55]Numerical simulation
Influence of building shape on wind environment[50]Numerical simulation + On-site measurement
Disclaimer/Publisher’s Note: The statements, opinions and data contained in all publications are solely those of the individual author(s) and contributor(s) and not of MDPI and/or the editor(s). MDPI and/or the editor(s) disclaim responsibility for any injury to people or property resulting from any ideas, methods, instructions or products referred to in the content.

