
Multiple Regression-Based Dynamic Amplification Factor Investigation of Monorail Tourism Transit Systems
Abstract
1. Introduction
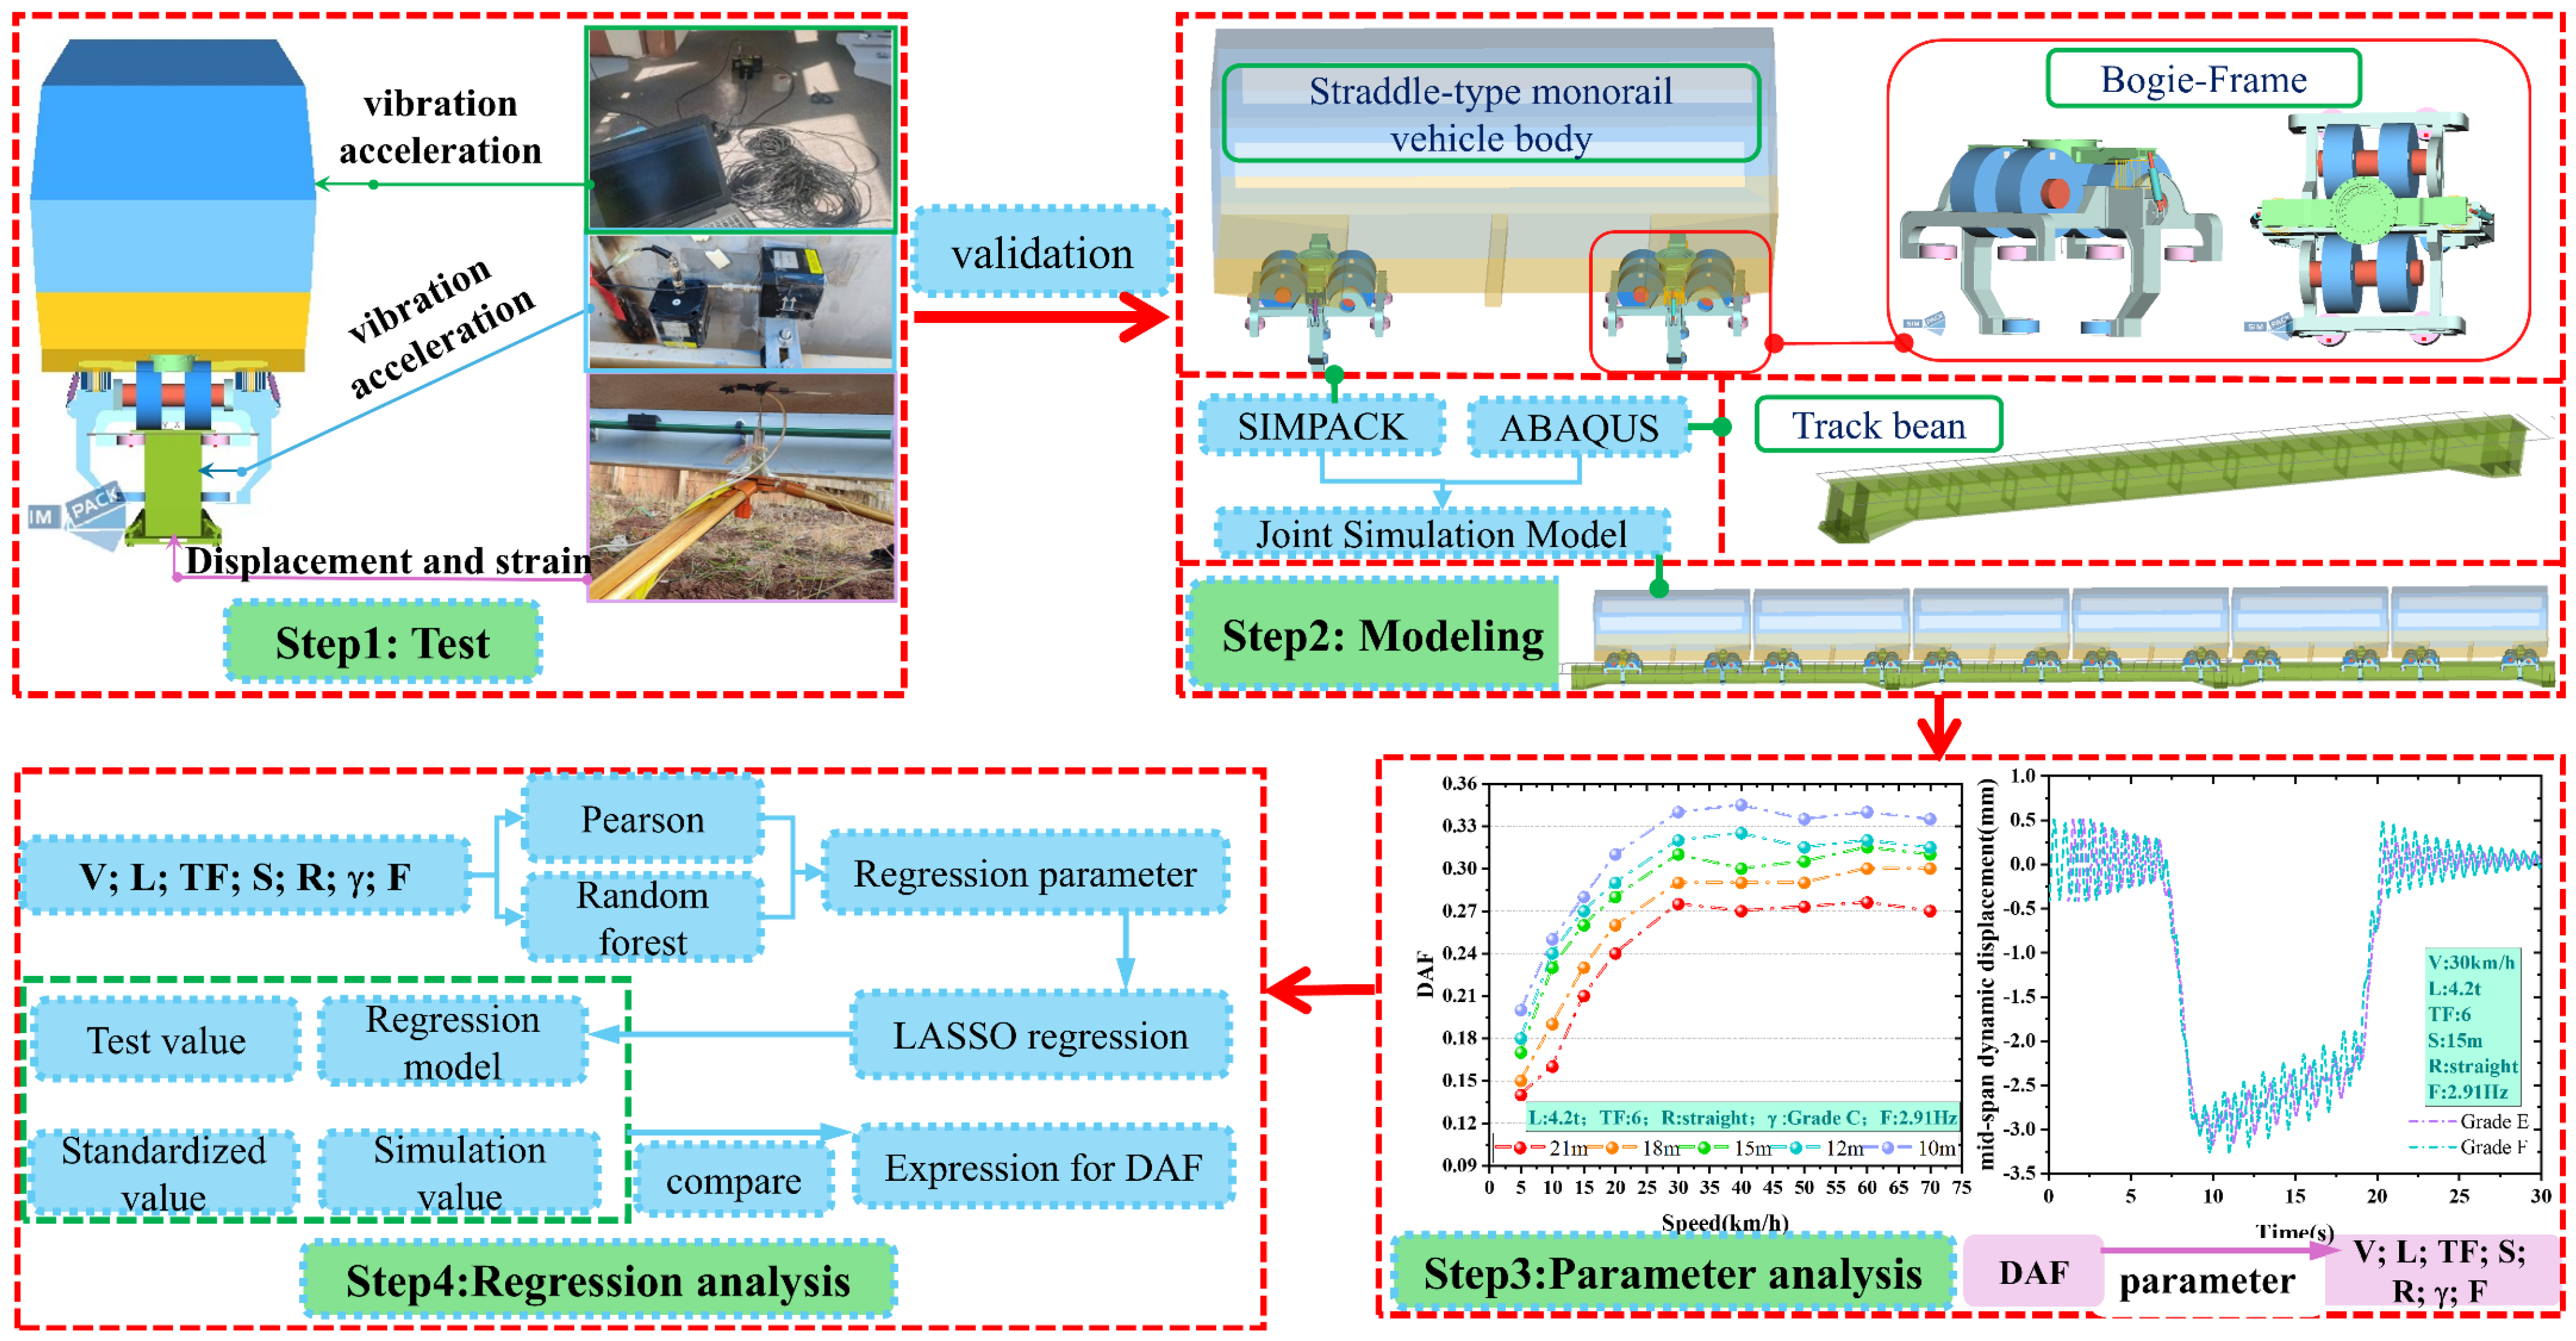
2. Methodologies
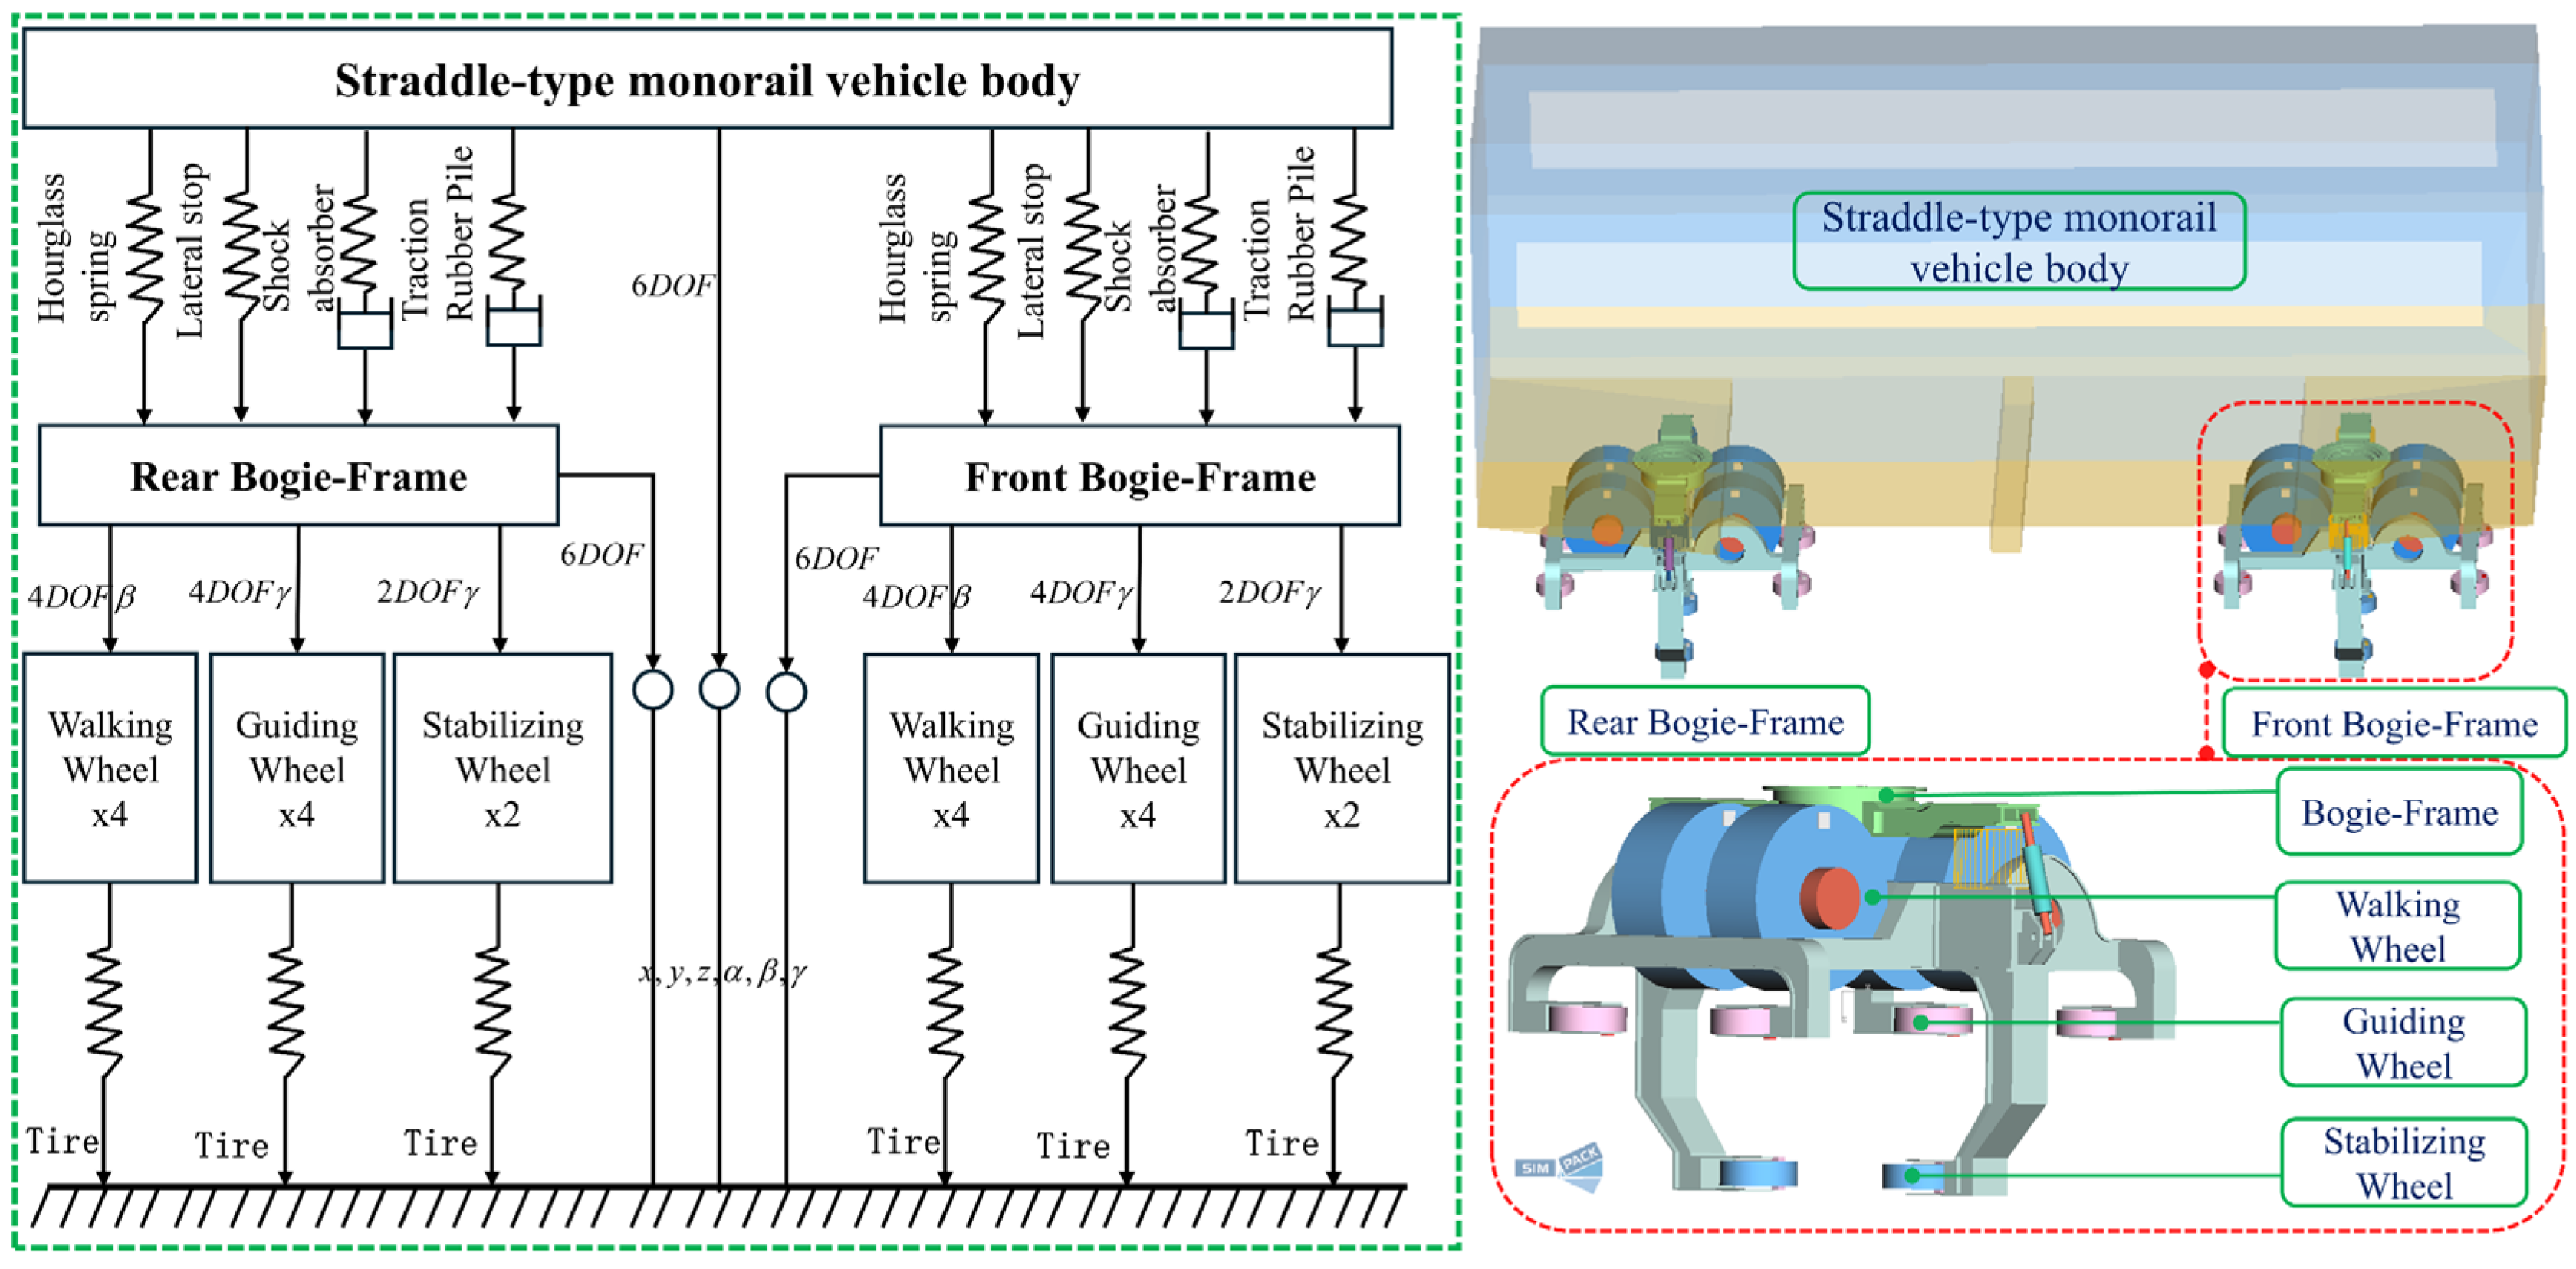
2.1. Joint Simulation Model of MTTS
2.1.1. Modeling Monorail Trains
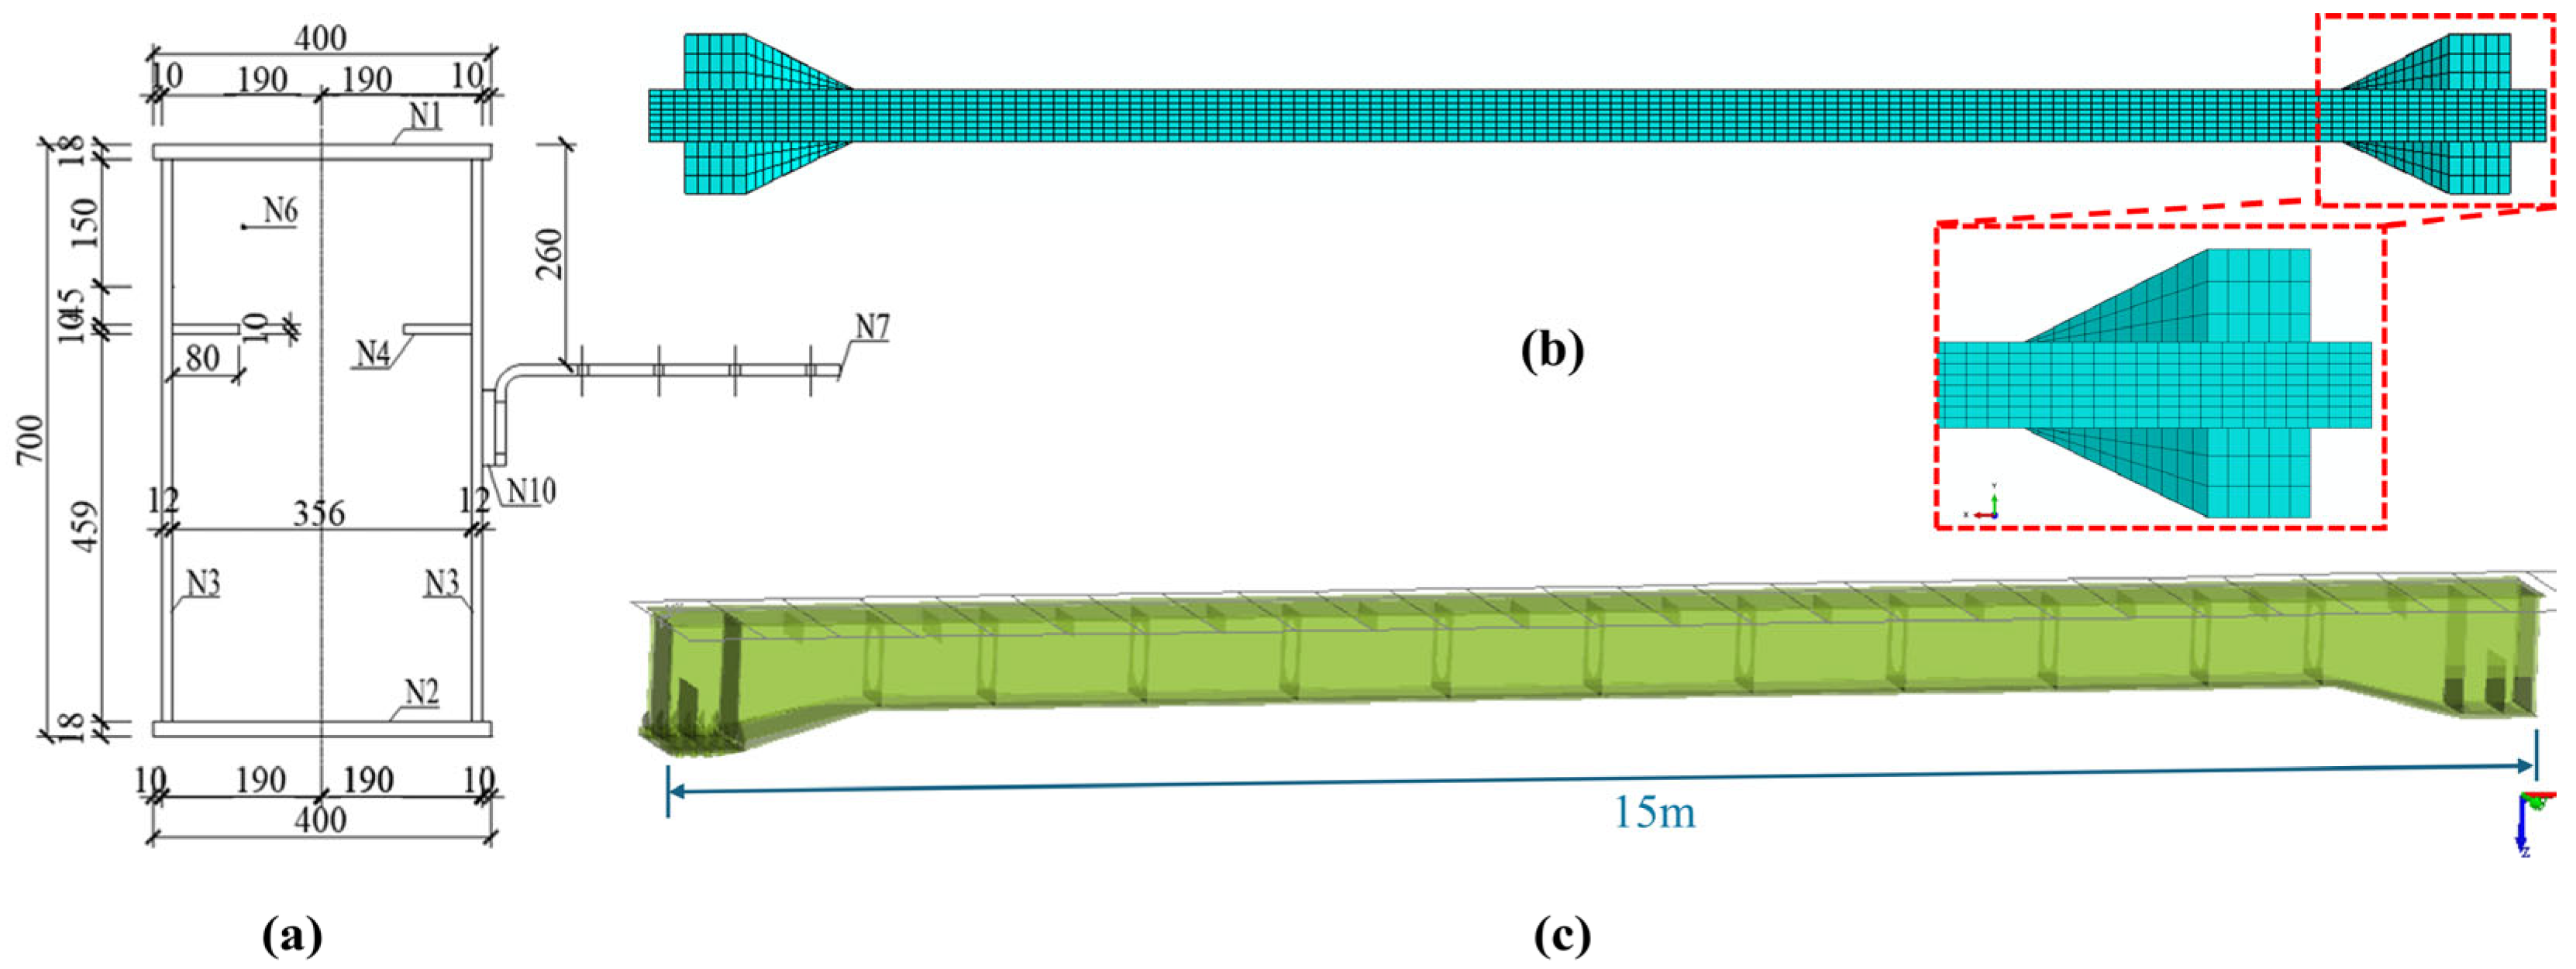
2.1.2. Modeling Track Beams
2.1.3. Joint Simulation Modeling
2.2. Vehicle–Bridge Coupling Field Trials of MTTS
2.3. Joint Simulation Model Validation
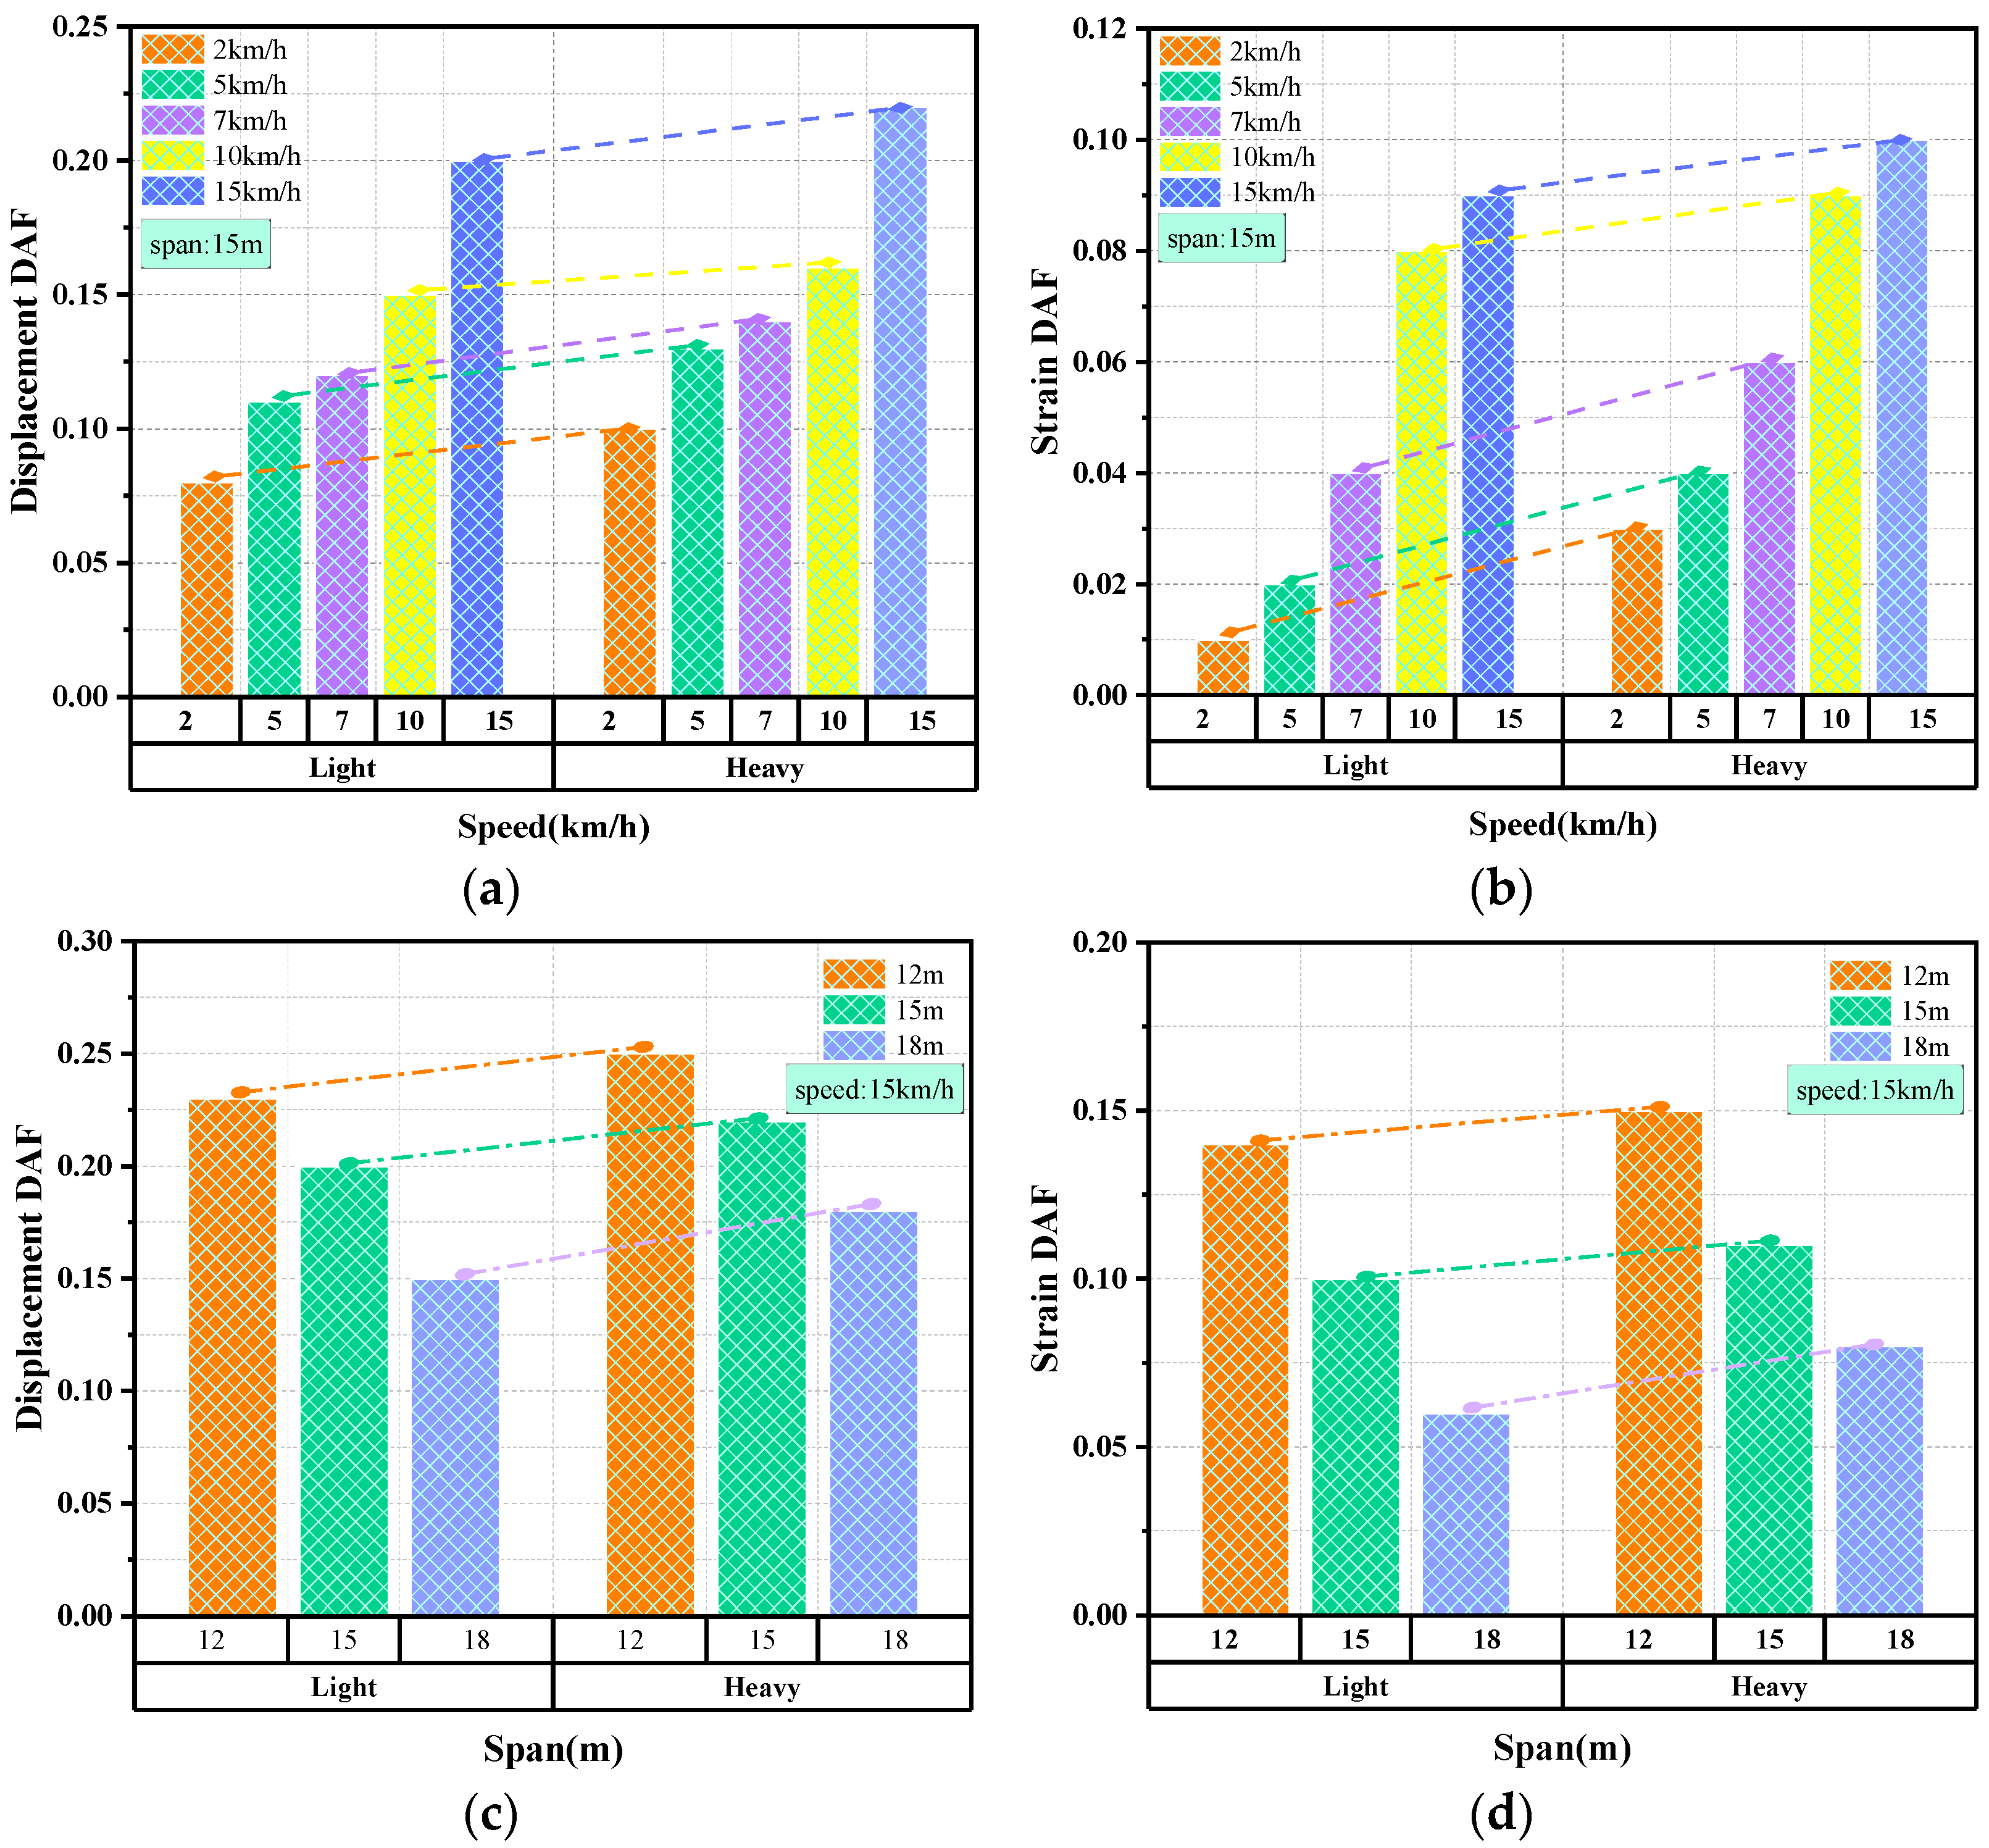
3. Analysis of Factors Influencing the DAFs
4. LASSO-Based Regression Analysis of DAFs for Multifactor Coupling Effects
4.1. Regression Parameter Screening
4.2. Multiple Regression Analysis of DAFs Based on LASSO Regression Theory
4.3. Regression Model Validation
4.4. Limitations and Future Work
- i.
- A field of theoretical research requires extensive on-site trials of the project to provide support. Currently, the on-site trials for MTTS project research are relatively insufficient, especially in areas such as bearing force states, cross-sectional changes in steel box beams, train bogie structures, and tire forces and wear. Future studies could focus on conducting more detailed field tests on these aspects to enhance and refine the research system.
- ii.
- There is still room for improvement in the research on the DAFs of MTTSs. Future studies could develop a probabilistic algorithmic prediction model for the DAFs and enhance prediction accuracy by comprehensively considering the uncertainty and complexity of influencing factors.
5. Conclusions
- i.
- Relying on the CRRC Zhuzhou test line project, a vehicle–bridge coupling field test of MTTS was conducted. The results show that the influence degrees of each test parameter on the DAFs are different, and the displacement DAFs are greater than the strain DAFs.
- ii.
- The joint simulation model established based on the vehicle–bridge coupling test parameters of the MTTS and the actual project parameters was demonstrated to be reasonable and reliable, and the simulation results of the structural dynamic response model were in good agreement with the test results.
- iii.
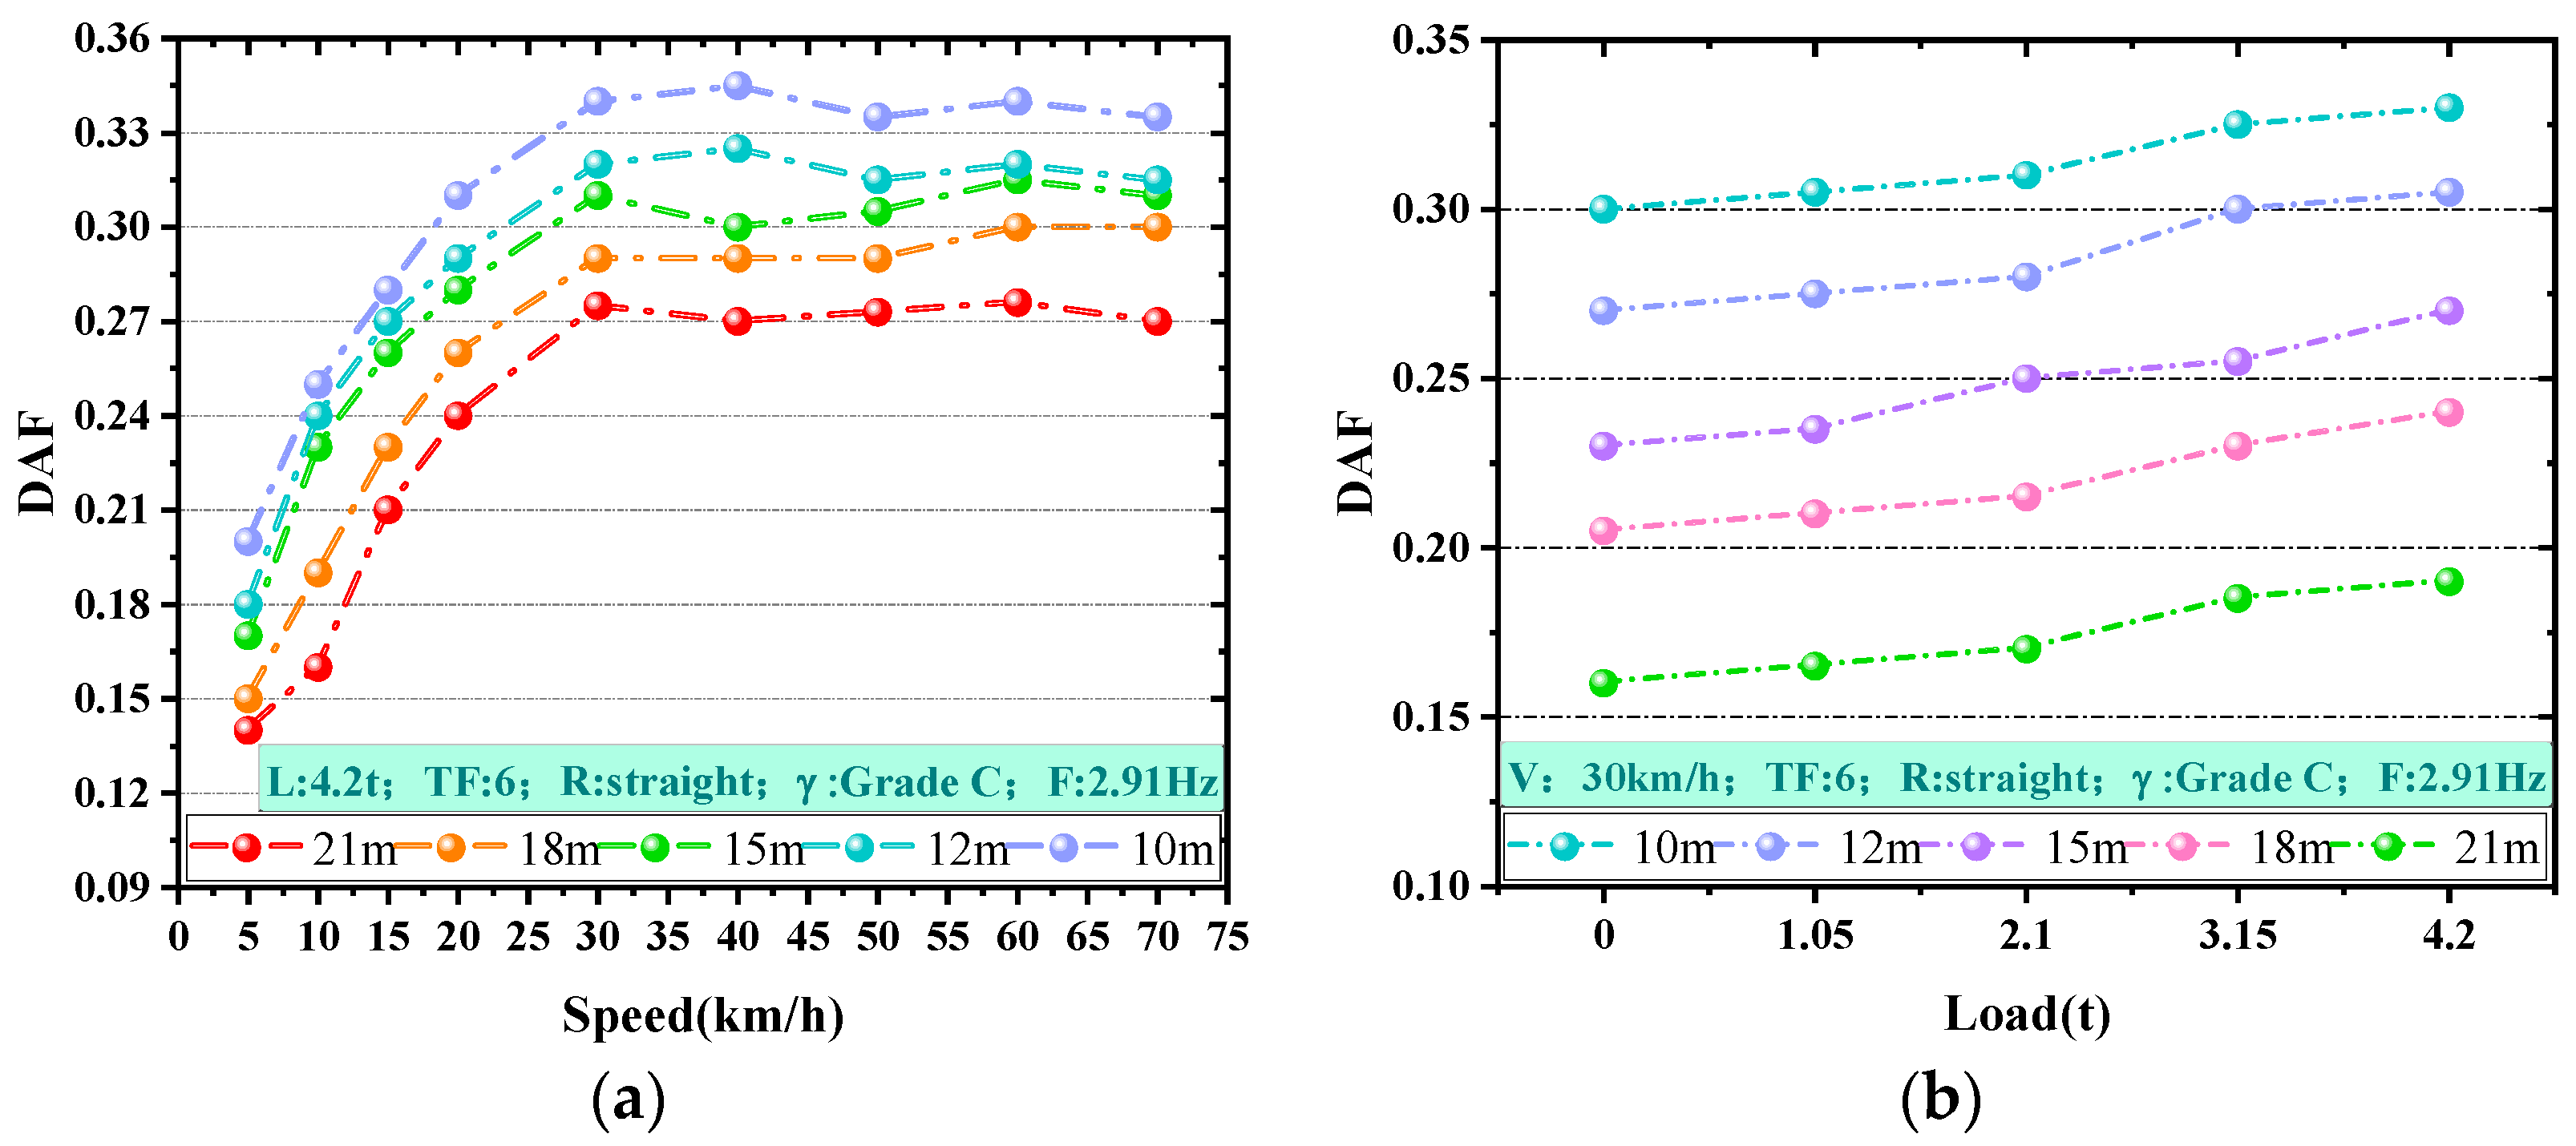
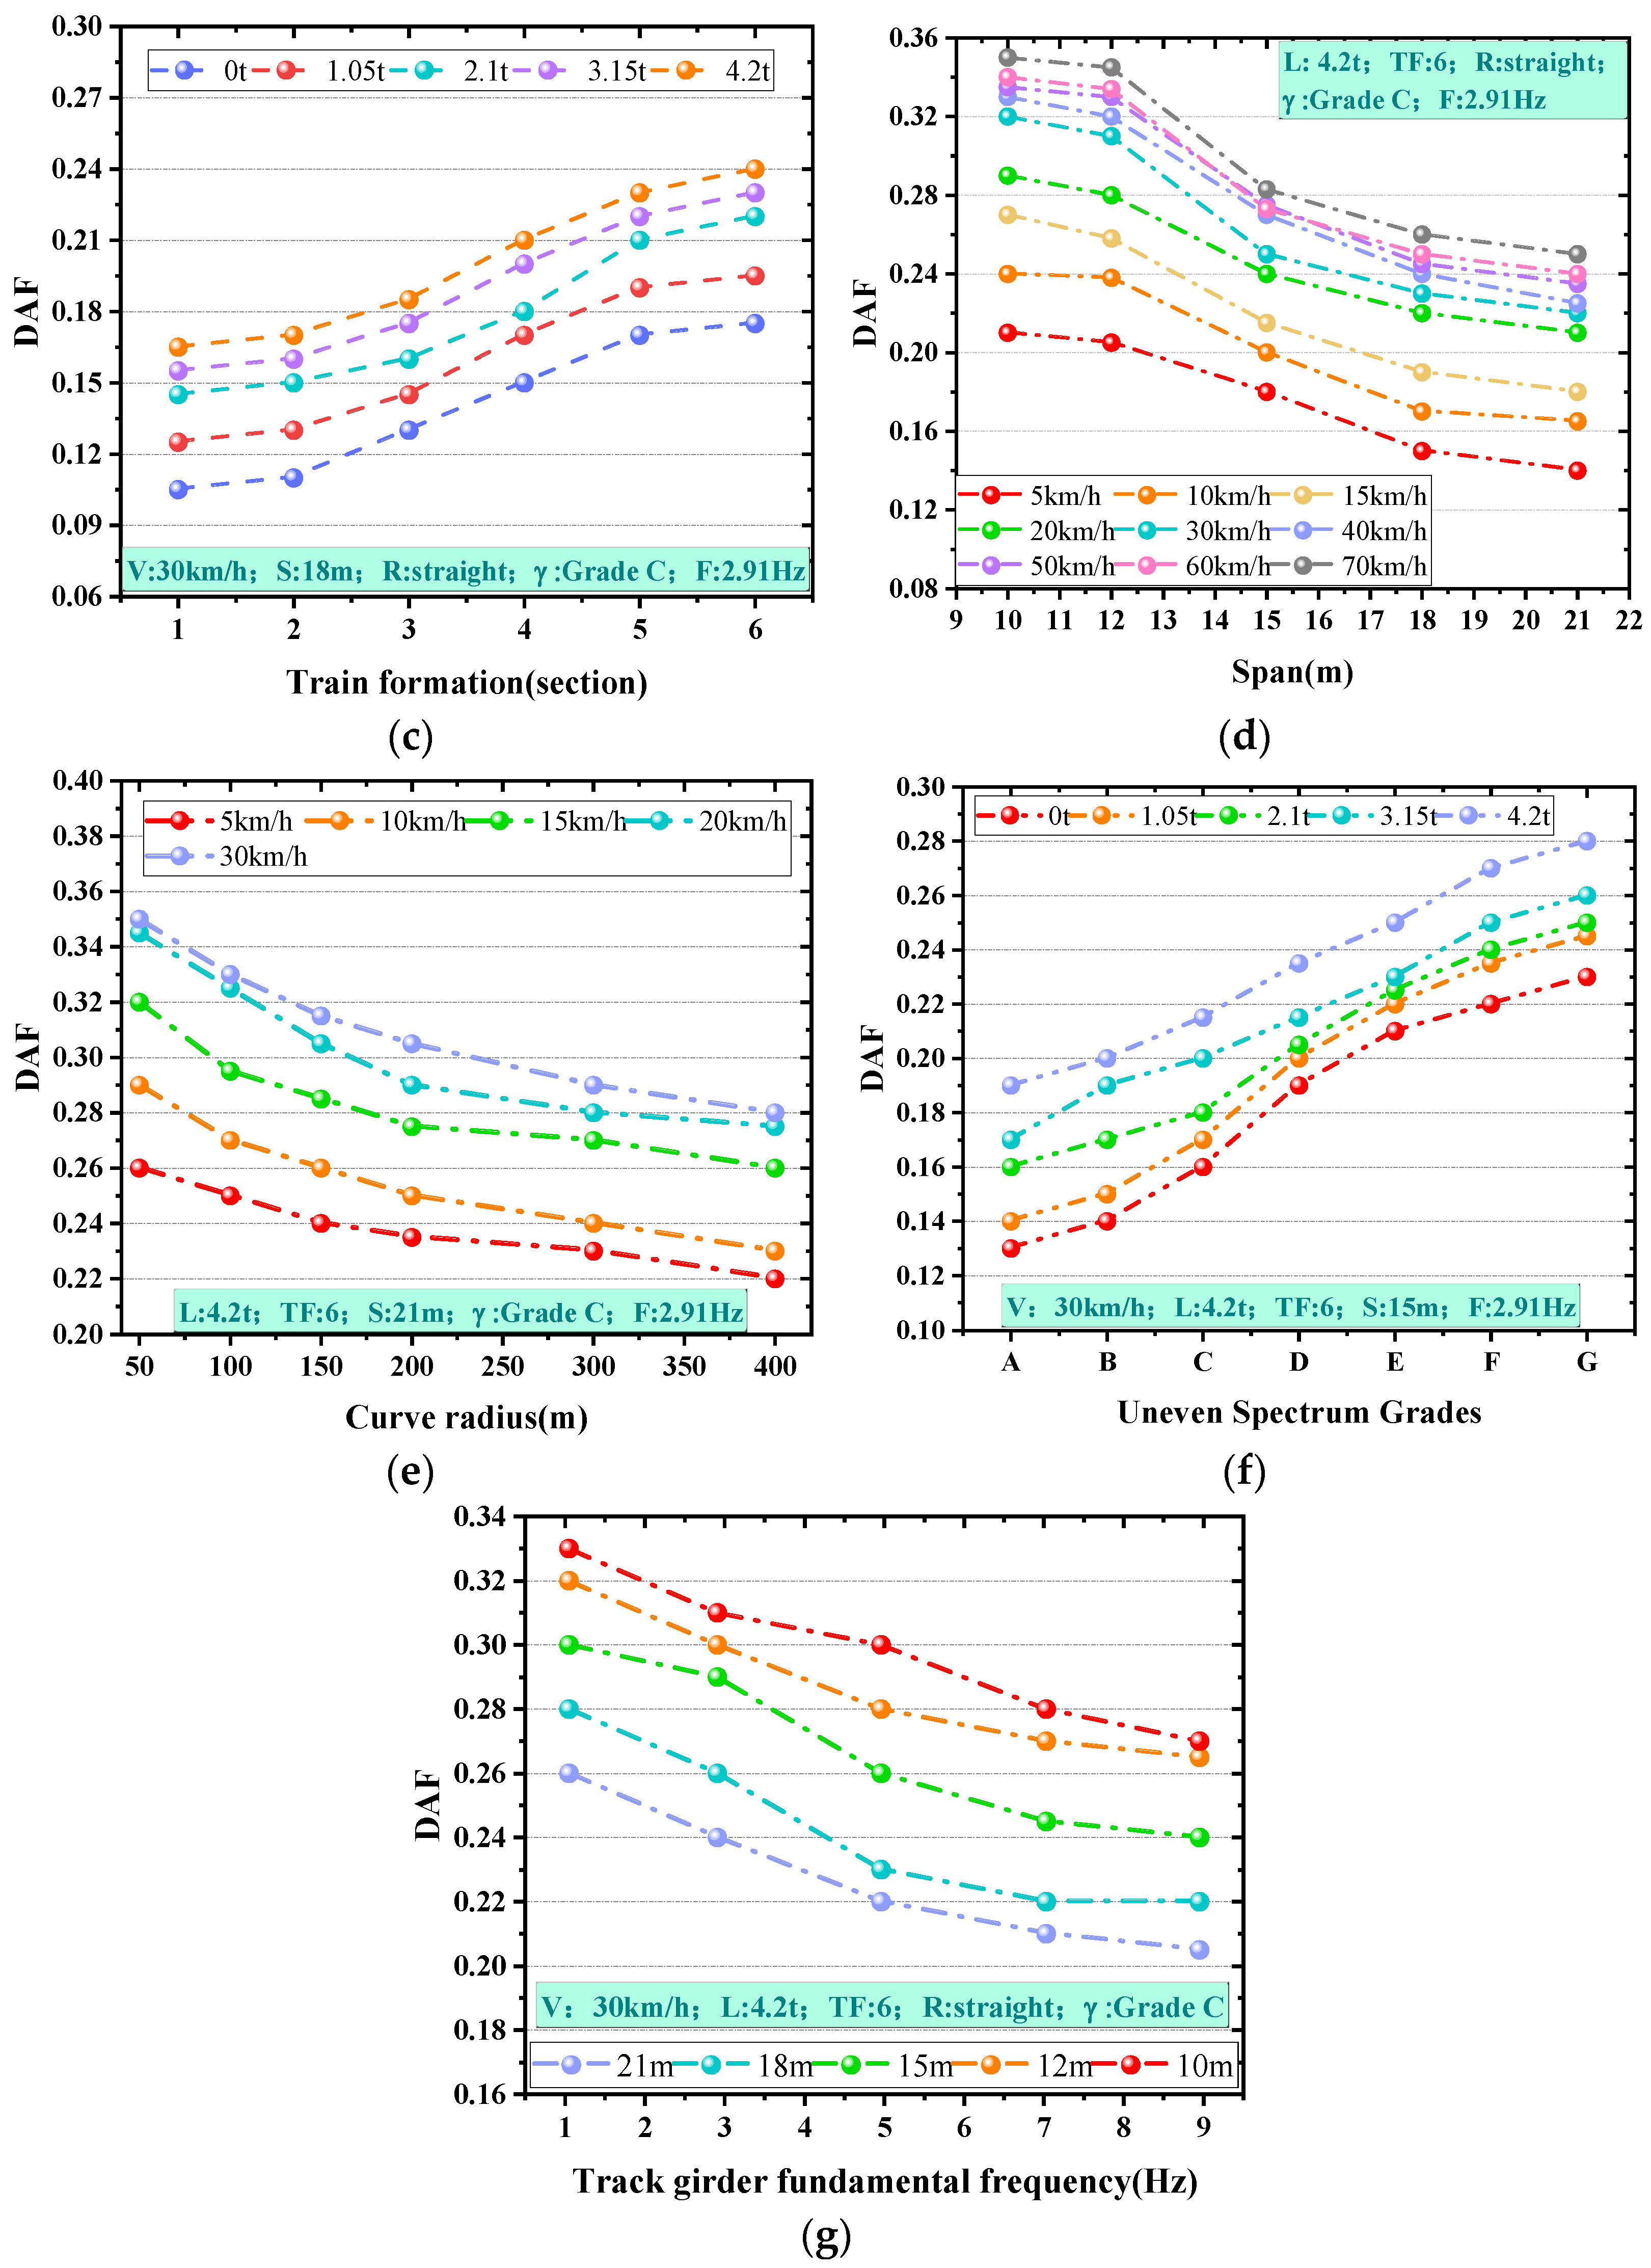
- Based on the joint simulation model for analyzing DAF impact parameters, the results showed that each impact parameter exhibited varying degrees of influence on the variability of the DAFs. Notably, the span and speed were identified as having the most significant impact.
- iv.
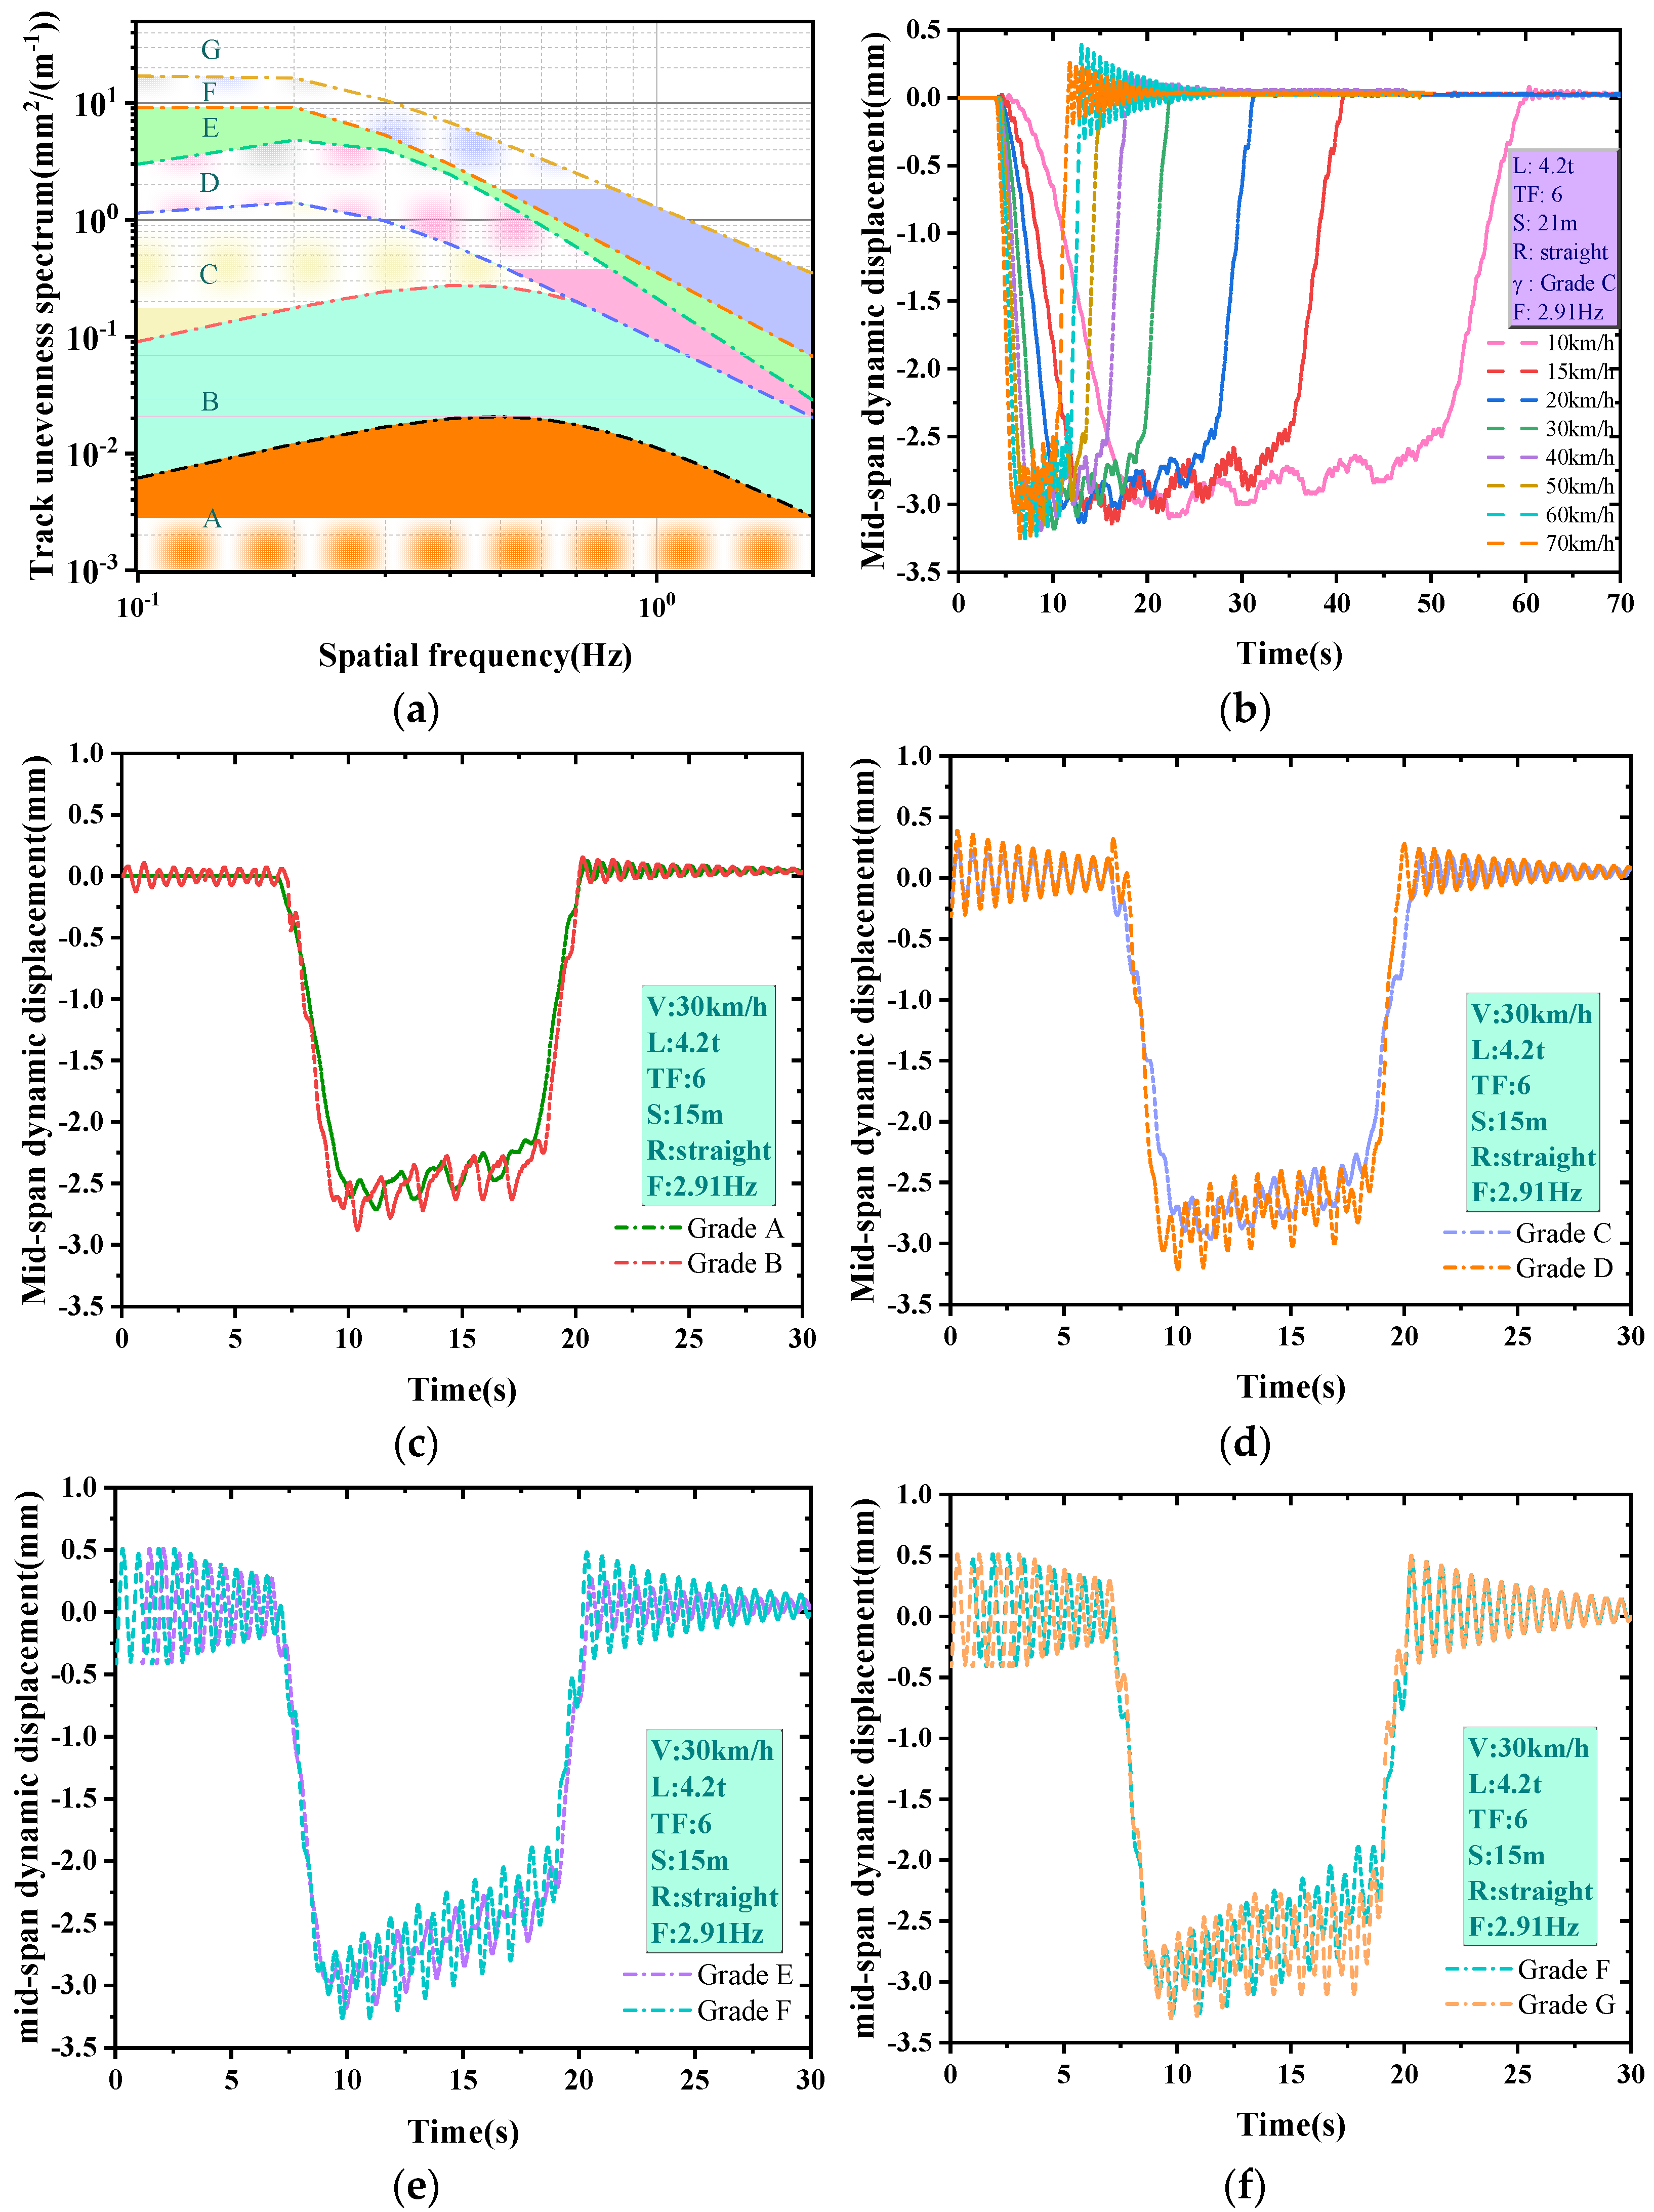
- Based on the Pearson correlation coefficient method and the random forest algorithm, the regression parameters of the DAFs were screened. The results show that there is a significant correlation between speed, span, unevenness, fundamental frequency and the DAFs, and the total contribution degree of these factors in the process of the DAFs under the coupling effect of multiple factors is 94.93%. Therefore, speed, span, unevenness, and fundamental frequency were selected as the regression parameters of the DAFs.
- v.
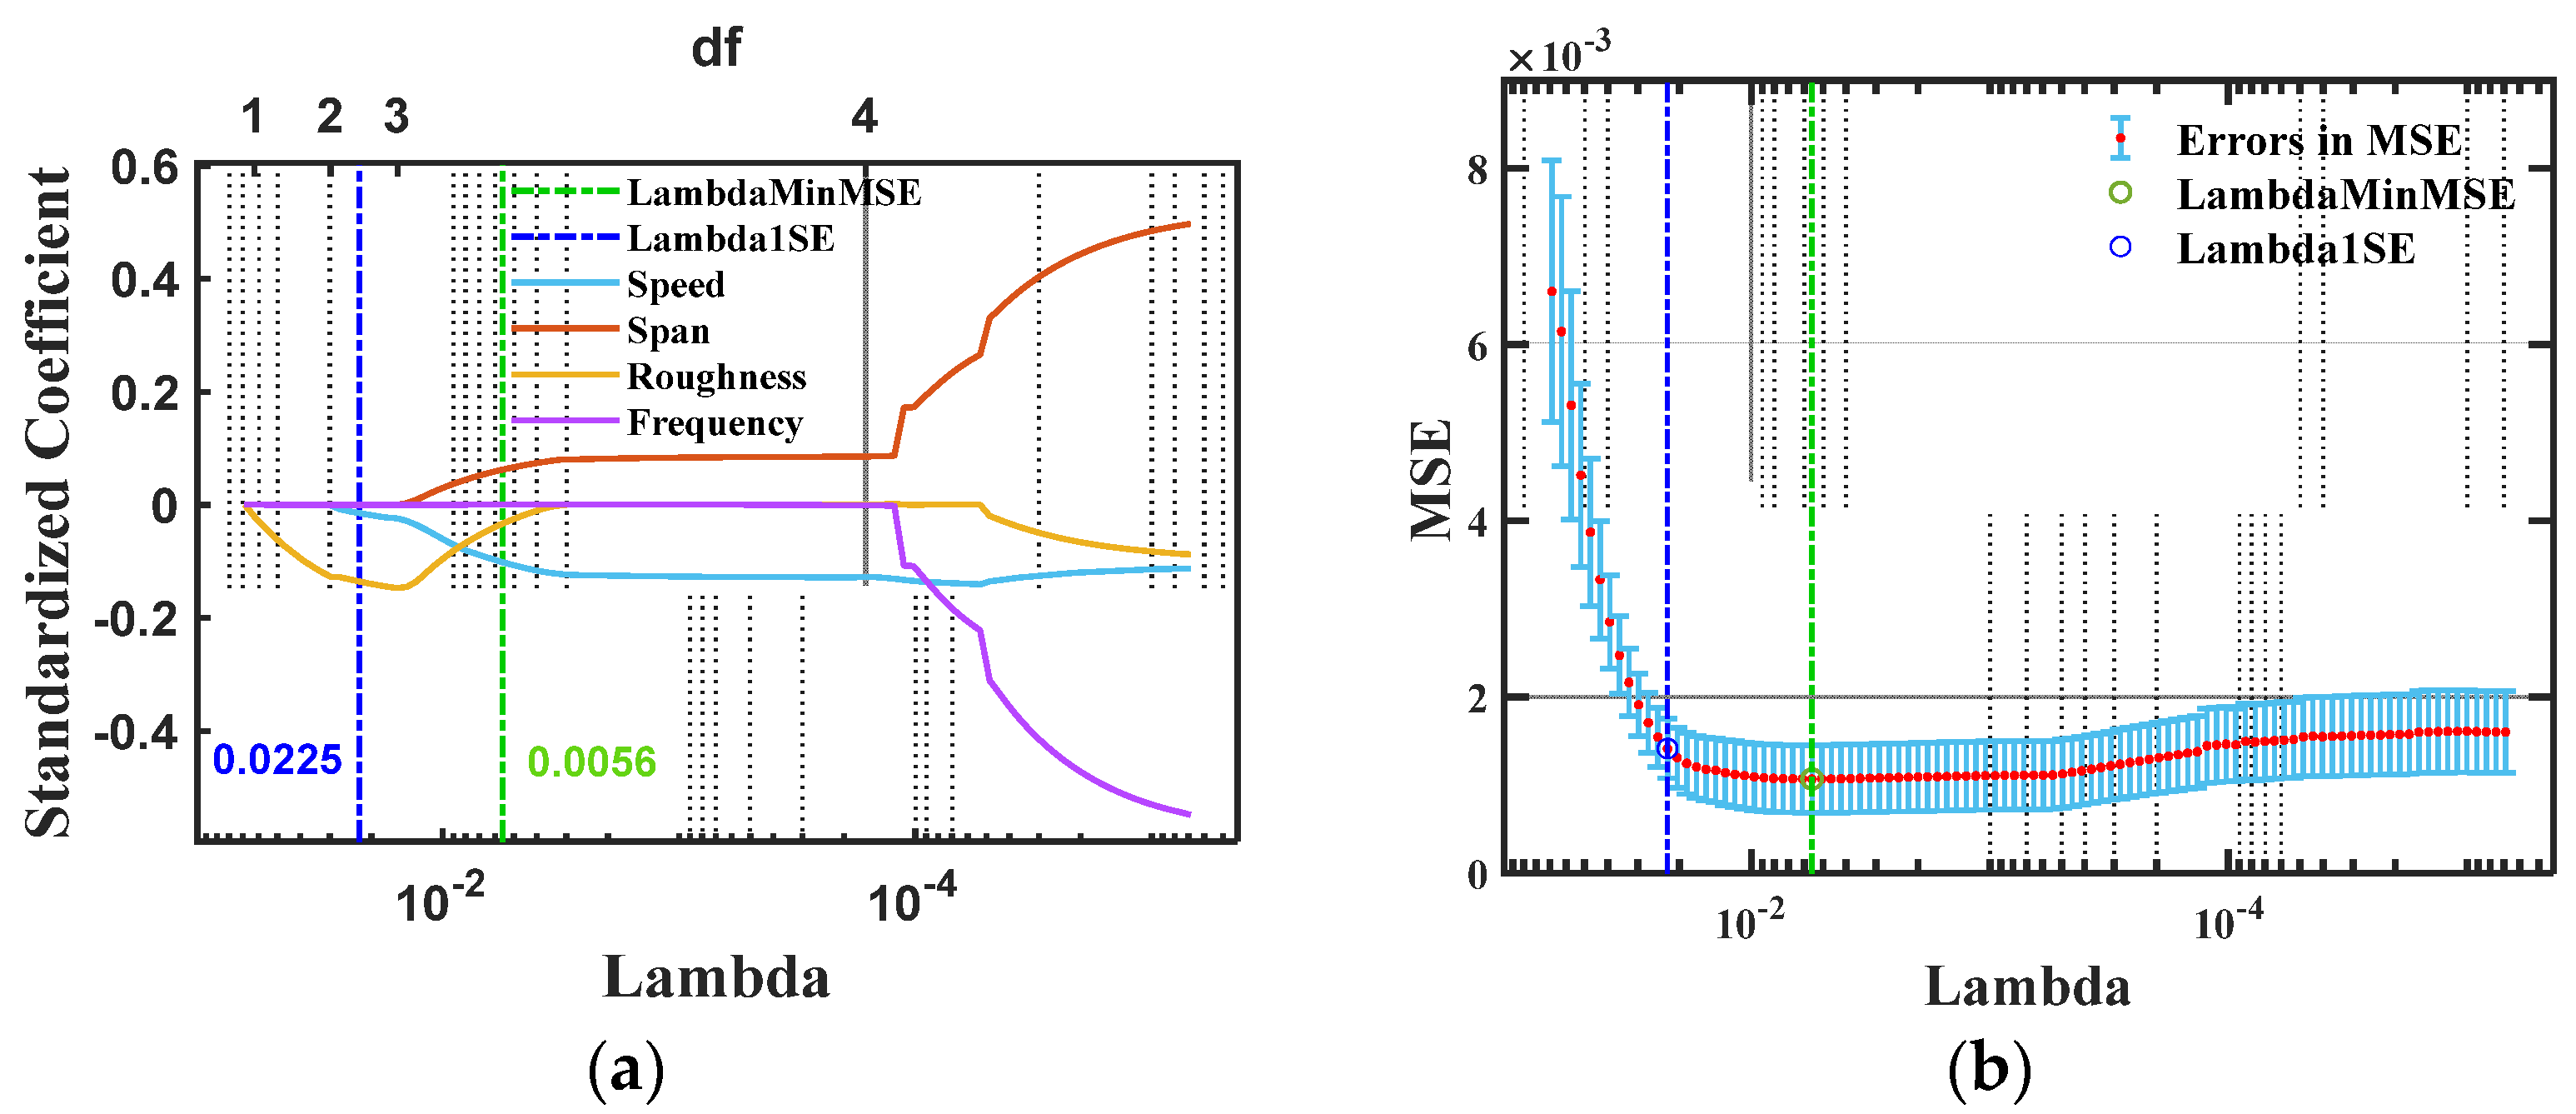
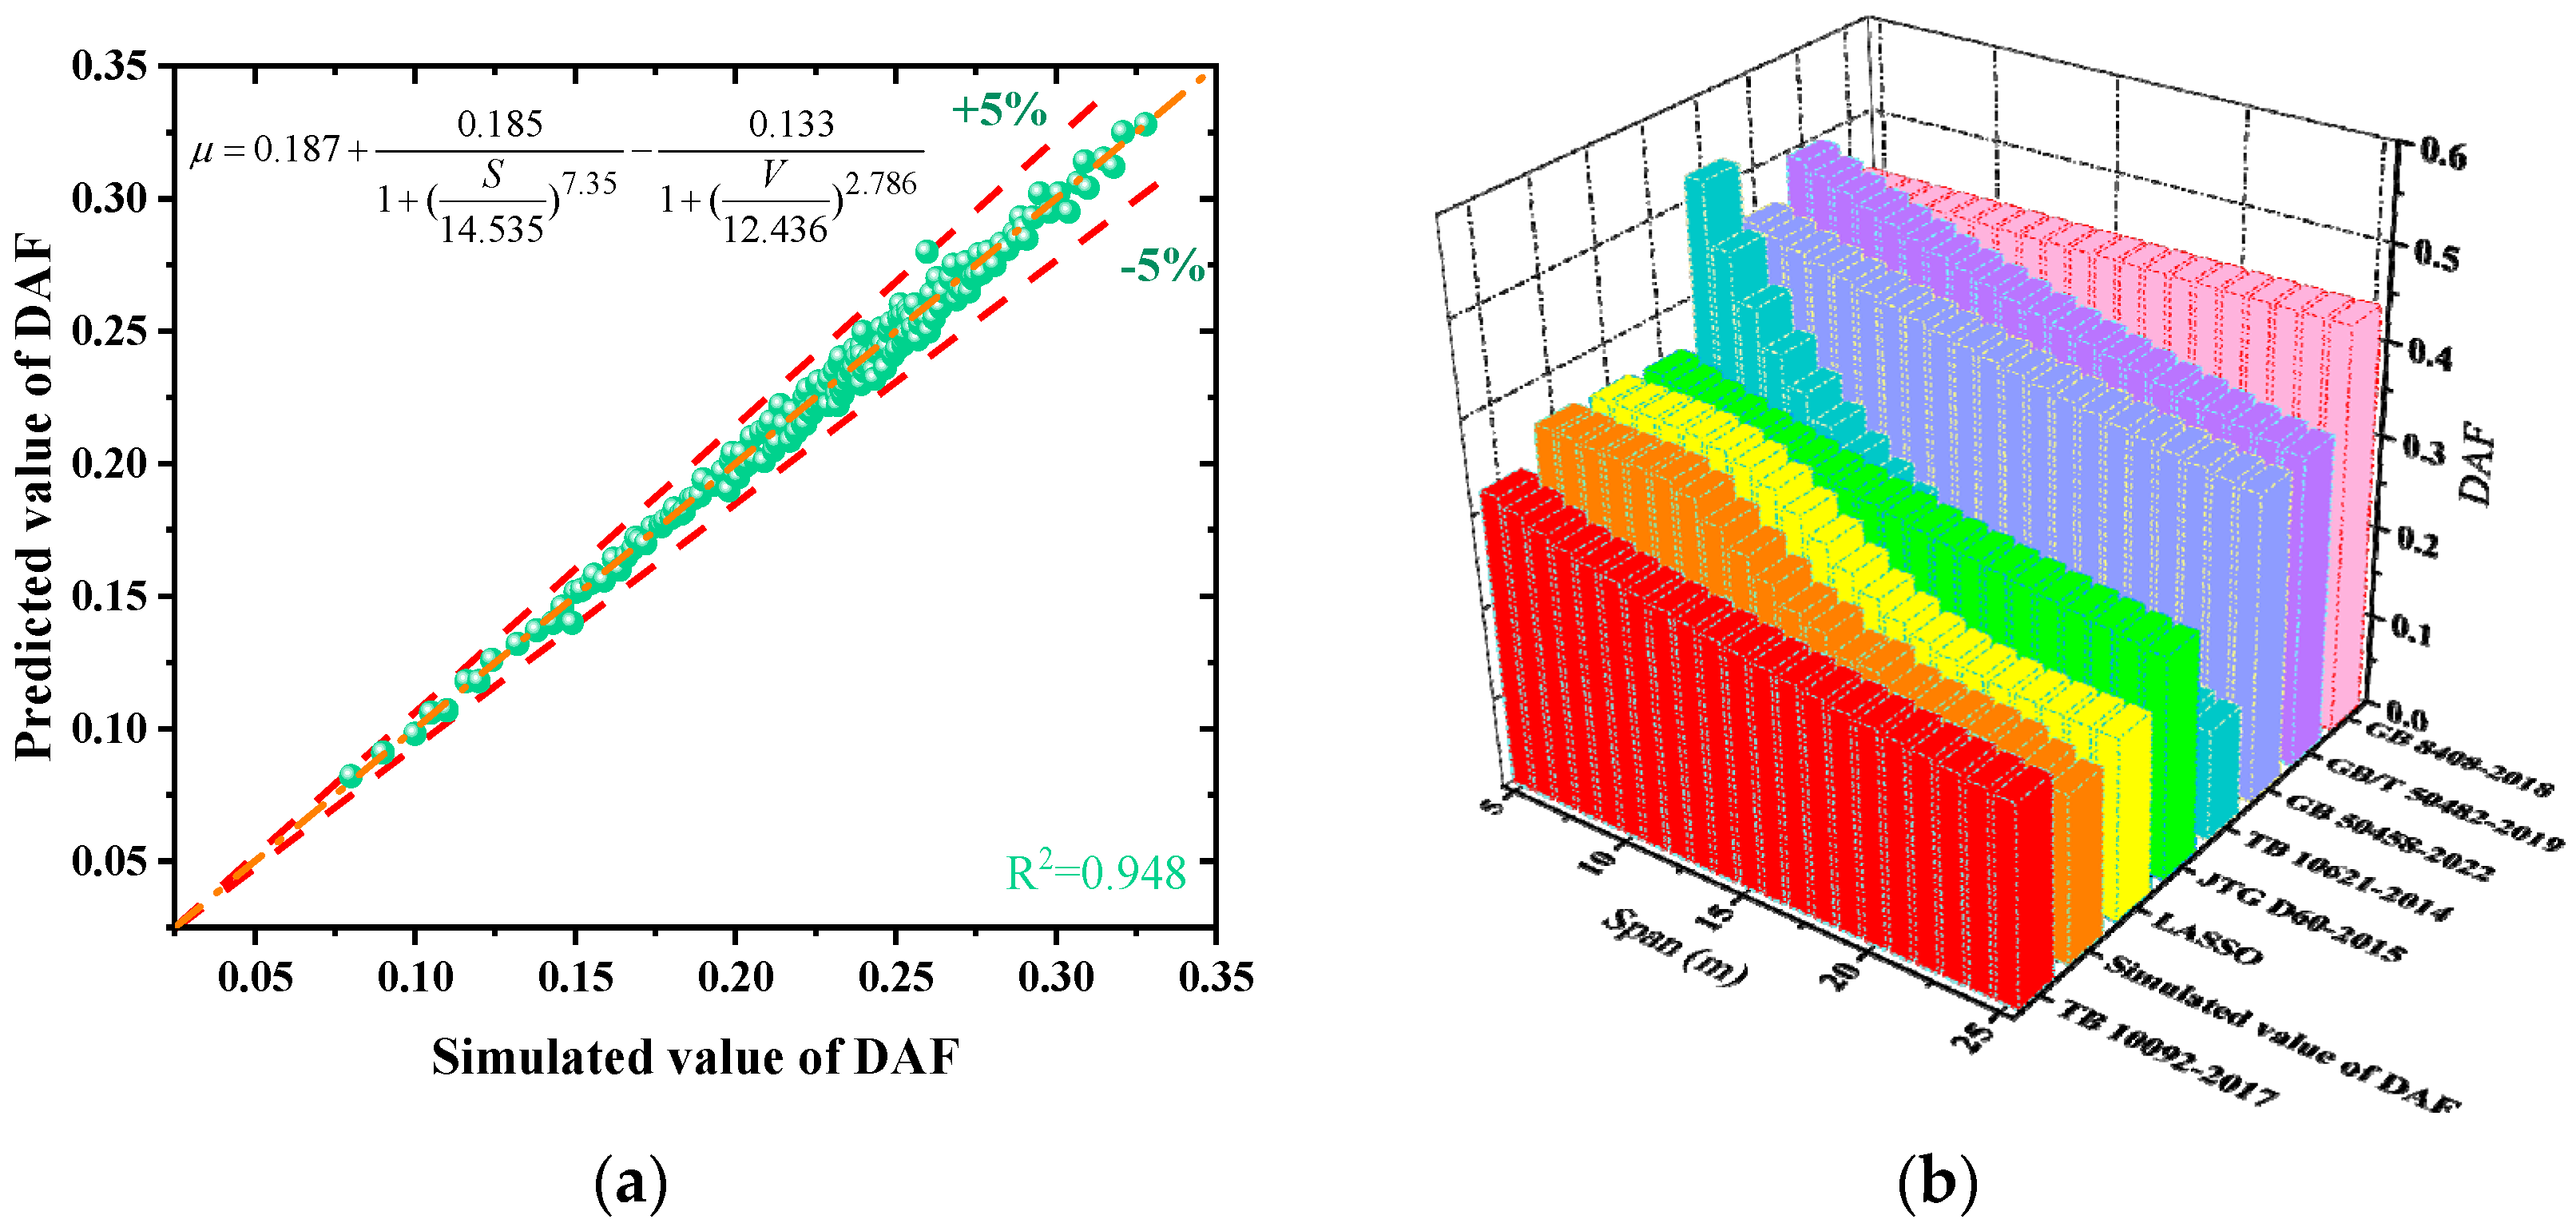
- Utilizing LASSO regression theory to establish the DAFs multivariate regression model, the calculation results of the regression model and the simulation model were compared with the specifications. The results indicated that the regression model was reasonable and effective, passing the 95% confidence level and 0.05 significance test while demonstrating high precision. Therefore, it is recommended as a calculation expression for the DAFs of MTTSs.
Author Contributions
Funding
Data Availability Statement
Conflicts of Interest
References
- Guo, F.; Chen, K.; Gu, F.; Wang, H.; Wen, T. Reviews on current situation and development of straddle-type monorail tour transit system in China. J. Cent. South Univ. Sci. Technol. 2021, 52, 4540–4551. [Google Scholar]
- GB 8408-2018; Large-Scale Amusement Device Safety Code. State Administration of Work Supervision: Beijing, China, 2018.
- Lee, J.; Kim, H.; Lee, K.; Kang, Y.J. Effect of load combinations on distortional behaviors of simple-span steel box girder bridges. Metals 2021, 11, 1238. [Google Scholar] [CrossRef]
- Cheng, J.; Yao, H. Simplified method for predicting the deflections of composite box girders. Eng. Struct. 2016, 128, 256–264. [Google Scholar] [CrossRef]
- Zhou, M.; Liu, Z.; Zhang, J.; An, L.; He, Z. Equivalent computational models and deflection calculation methods of box girders with corrugated steel webs. Eng. Struct. 2016, 127, 615–634. [Google Scholar] [CrossRef]
- Li, H.; Xia, H.; Soliman, M.; Frangopol, D.M. Bridge Stress Calculation Based on the Dynamic Response of Coupled Train–Bridge System. Eng. Struct. 2015, 99, 334–345. [Google Scholar] [CrossRef]
- Wang, H.; Zhu, E. Dynamic response analysis of monorail steel-concrete composite beam-train interaction system considering slip effect. Eng. Struct. 2018, 160, 257–269. [Google Scholar] [CrossRef]
- Li, X.; Ge, Y.; Jin, Z. Calculation and analysis of the straddle-type monorail vehicle-track beam coupling vibration. J. Railw. Eng. Soc. 2018, 035, 78–83. [Google Scholar]
- Zheng, K. Simulation Analysis and Optimization on Dynamics Performance of Straddle-Type Monorail Vehicle. Master’s Thesis, Chongqing Jiaotong University, Chongqing, China, 2010. [Google Scholar]
- Liu, G. Study on the influence of track-beam stiffness on straddle monorail transit ride comfort. J. Railw. Investig. Surv. 2016, 42, 85–88. [Google Scholar] [CrossRef]
- Gao, Q.; Cui, K.; Li, Z.; Li, Y. Numerical investigation of the dynamic performance and riding comfort of a straddle-type monorail subjected to moving trains. Appl. Sci 2020, 10, 5258. [Google Scholar] [CrossRef]
- Zhou, J.; Du, Z.; Yang, Z.; Xu, Z. Dynamic parameters optimization of straddle-type monorail vehicles based multi-objective collaborative optimization algorithm. J. Veh. Syst. Dyn. 2020, 58, 357–376. [Google Scholar] [CrossRef]
- Zhou, J.; Du, Z.; Yang, Z. Dynamic Response of the full-scale Straddle-type Monorail Vehicles with Single-axle Bogies. J. Mech. 2019, 25, 17–24. [Google Scholar] [CrossRef]
- Li, Y.; Bao, Y.; Dong, S.; Zeng, Y.; Xiang, H. Influencing factors of impact coefficient for long-span railway cable-stayed bridges. J. Vib. Shock. 2015, 34, 138–143. [Google Scholar] [CrossRef]
- Wang, P.; Guo, F.; Zhang, H.; Jin, J.; Liao, Q.; Yan, Y. Acquiring the High-Precision Spectrum of Track Irregularity by Integrating Inclination in Chord Methods: Mathematics, Simulation, and a Case Study. Mathematics 2024, 12, 2197. [Google Scholar] [CrossRef]
- Zhang, H.; Wang, P.; Chen, C.; Ji, Y.; Wei, S.; Guan, B.; Liu, Z.; Zhang, J. Numerical Study on the Sensitive Wavelength and Amplitude Management of Track Irregularities in Monorail Systems. Buildings 2024, 14, 4041. [Google Scholar] [CrossRef]
- Guo, F.; Ji, Y.; Liao, Q.; Liu, B.; Li, C.; Wei, S.; Xiang, P. The Limit of the Lateral Fundamental Frequency and Comfort Analysis of a Straddle-Type Monorail Tour Transit System. Appl. Sci 2022, 12, 10434. [Google Scholar] [CrossRef]
- Zhang, H.; Wang, P.; Li, Q.; Jin, J.; Wei, S.; Guo, F.; Feng, C.; Deng, Q. An Experimental and Numerical Study on the Lateral Stiffness Limits of Straddle-Type Monorail Tour-Transit Systems. Buildings 2024, 14, 3111. [Google Scholar] [CrossRef]
- Shervan, A.; Amin, M. Investigating dynamic amplification factor of railway masonry arch bridges through dynamic load tests. J. Constr. Build. Mater. 2018, 183, 693–705. [Google Scholar] [CrossRef]
- Babatope, O.; Emmanuel, O.A. Dynamic amplification factor and interactions of a beam under compressive axial force and load travelling at varying velocity. J. Forces Mech. 2023, 13, 100241. [Google Scholar] [CrossRef]
- Zhu, J.; Xu, Y. Research on the impact factor of the three-span continuous bean-arch combined bridge based on the vehicle-bridge coupled vibration. J. Railw. Eng. Soc. 2019, 16, 959–967. [Google Scholar] [CrossRef]
- Zhu, J.; Chen, X. Damage Detection Method of Suspension Bridge Based on Index of Strain Impact Factor. J. Vib. Meas. Diagn. 2023, 43, 450–458+617. [Google Scholar] [CrossRef]
- Zhou, Y.; Xue, Y.; Gao, X.; Li, R.; Wang, Y.; Zhao, Y. Research on dynamic amplification factor of highway simply supported girder bridge based on modal superposition method. J. Traffic Transp. Eng. 2023, 23, 146–155. [Google Scholar] [CrossRef]
- Li, Z.; Li, J.; Feng, D. Analysis of dynamic impact coefficients and affecting factors of stay cables in cable-stayed bridges based on vehicle-bridge interaction theory. J. Vib. Shock. 2024, 43, 67–74. [Google Scholar] [CrossRef]
- Deng, L.; Duan, L.; Zhou, Q. Comparison of dynamic amplification factors calculated from bridge strain and deflection. J. Eng. Mech. 2018, 35, 126–135. [Google Scholar] [CrossRef]
- Deng, L.; Duan, L.; He, W.; Ji, W. Study on Vehicle Model for Vehicle-bridge Coupling Vibration of Highway Bridge in China. J. China J. Highw. Transp. 2018, 31, 92–100. [Google Scholar]
- SIMPACK. Version 2021x. Dassault Systemes: Velizy-Villacoublay, France, 2021. Available online: https://blog.3ds.com/brands/simulia/simpack-r2021x-multibody-system-simulation-updates/ (accessed on 20 September 2024).
- ABAQUS. ABAQUS User’s Manual, Version 2016; Dassault Systemes: Velizy-Villacoublay, France, 2016. Available online: http://62.108.178.35:2080/v2016/index.html (accessed on 20 September 2024).
- Ji, Y. Study on the Unevenness of the Top Plate of Track Beams of Monorail Tour Transit System. Master’s Thesis, Central South University, Changsha, China, 2023. [Google Scholar]
- Zhang, Z.; Zhou, A.; Shi, Z.; Zhang, H.; He, X.; Wang, Y.; Bai, Z.; Xi, D. Explaining Relationships between Chemical Structure and Tar-Rich Coal Pyrolysis Products Yield Based on Pearson Correlation Coefficient. Fuel 2025, 395, 135029. [Google Scholar] [CrossRef]
- Liu, Y.; Ren, Q. Online Incremental Learning Approach of Heat Pump and Chiller Models Based on the Dynamic Random Forests in Queue Structure. Energy 2025, 323, 135840. [Google Scholar] [CrossRef]
- Lasheen, A.; Sindi, H.F.; Zeineldin, H.H.; Morgan, M.Y. Online Stability Assessment for Isolated Microgrid via LASSO Based Neural Network Algorithm. Energy Convers. Manag. X 2025, 25, 100849. [Google Scholar] [CrossRef]
- JTG D60-2015; General Specifications for Design of Highway Bridges and Culverts. Ministry of Transport of the People’s Republic of China: Beijing, China, 2015.
- GB 50458-2022; Standard for Design of Straddle Monorail Transit. Ministry of Housing and Urban-Rural Development of the People’s Republic of China: Beijing, China, 2022.
- GB/T 51234-2017; Code for Design of Urban Rail Transit Bridge. Ministry of Housing and Urban-Rural Development of the People’s Republic of China: Beijing, China, 2017.
- TB10092-2017; Code for Design on Railway Bridge and Culvert. China National Railroad Administration (CNRA): Beijing, China, 2017.


| Regression Parameters | Linearization Equation | Parameters | |
|---|---|---|---|
| m | n | ||
| Speed (V) | 14.535 | 2.786 | |
| Span (S) | 12.436 | 7.350 | |
| Frequency (F) | 3.774 | 2.338 | |
| Unevenness (γ) | 3.842 | 3.658 | |
Disclaimer/Publisher’s Note: The statements, opinions and data contained in all publications are solely those of the individual author(s) and contributor(s) and not of MDPI and/or the editor(s). MDPI and/or the editor(s) disclaim responsibility for any injury to people or property resulting from any ideas, methods, instructions or products referred to in the content. |
© 2025 by the authors. Licensee MDPI, Basel, Switzerland. This article is an open access article distributed under the terms and conditions of the Creative Commons Attribution (CC BY) license (https://creativecommons.org/licenses/by/4.0/).
Share and Cite
Zhang, H.; Wu, C.; Liu, W.; Wei, S.; Wang, Y. Multiple Regression-Based Dynamic Amplification Factor Investigation of Monorail Tourism Transit Systems. Buildings 2025, 15, 1881. https://doi.org/10.3390/buildings15111881
Zhang H, Wu C, Liu W, Wei S, Wang Y. Multiple Regression-Based Dynamic Amplification Factor Investigation of Monorail Tourism Transit Systems. Buildings. 2025; 15(11):1881. https://doi.org/10.3390/buildings15111881
Chicago/Turabian StyleZhang, Hong, Changxing Wu, Wenlong Liu, Shiqi Wei, and Yonggang Wang. 2025. "Multiple Regression-Based Dynamic Amplification Factor Investigation of Monorail Tourism Transit Systems" Buildings 15, no. 11: 1881. https://doi.org/10.3390/buildings15111881
APA StyleZhang, H., Wu, C., Liu, W., Wei, S., & Wang, Y. (2025). Multiple Regression-Based Dynamic Amplification Factor Investigation of Monorail Tourism Transit Systems. Buildings, 15(11), 1881. https://doi.org/10.3390/buildings15111881