Article

Research on Energy-Saving Optimization of Green Buildings Based on BIM and Ecotect

1
Zhangjiagang Campus, Jiangsu University of Science and Technology, Zhenjiang 215600, China
2
Yangtze River Delta Social Development Research Center, Jiangsu University of Science and Technology, Zhangjiagang 215600, China
3
School of Business, Southeast University, Nanjing 210018, China
*
Authors to whom correspondence should be addressed.
Buildings 2025, 15(11), 1819; https://doi.org/10.3390/buildings15111819
Submission received: 16 April 2025 / Revised: 14 May 2025 / Accepted: 20 May 2025 / Published: 26 May 2025

Abstract

Based on the resource conservation requirements of GB/T 50378-2019 “Green Building Evaluation Standard”, this study constructed a BIM–Ecotect collaborative analysis model and proposed a “four-dimensional integration” green performance optimization method. Taking a high-rise office building in Wuhan as an example, a LOD 300-level Revit building information model was established, and a multidisciplinary collaborative analysis was achieved through gbXML data interaction. The lighting simulation results show that the average natural lighting coefficient of the office area facing south is 2.4 (the standard 85%), while in the meeting room area, due to the optimized design of the curtain wall, the average natural lighting coefficient has increased to 2.6 (the standard 92%). In terms of energy-saving renovation, a three-dimensional collaborative design strategy was adopted. Through the optimization of the envelope structure, the cooling load of the air conditioning system was reduced by 25.3%, and the heat load was reduced by 23.6% (the u value of the exterior wall was reduced by 56.3%, the SHGC of the exterior windows was reduced by 42.9%, and the thermal resistance of the roof was increased by 150%). The ventilation optimization adopts the CFD flow field reverse design, adjusting the window opening rate of the exterior windows from 15% to 20% to form a turbulent diffusion effect. Therefore, the air change rate in the office area reached 2.5 times per hour, and the CO2 concentration decreased by up to 27.1% at most. The innovative adoption of the “composite sound insulation curtain wall” technology in acoustic environment control has increased the indoor noise compliance rate by 27 percentage points (from 65% to 92%). The above research data indicate that digital collaborative design can achieve an overall energy-saving rate of over 20% for buildings, providing a replicable technical path for enhancing the performance of green buildings.

1. Introduction

The dual crises of global climate change and resource shortage are accelerating the transformation of the construction industry towards a green and low-carbon model. The “Green Building Evaluation Standard” GB/T 50378-2019 of China takes “Four Conservations and One Environmental Protection” as the core and, for the first time, incorporates systematic indicators such as energy conservation, water conservation and material conservation into the evaluation framework of the entire life cycle. This marks a paradigm innovation of green buildings from technology accumulation to performance orientation [1]. However, the current design methods still face the predicament of fragmented analysis in multiple physical fields: key indicators such as lighting, energy consumption, ventilation and noise make it difficult to achieve collaborative optimization, thus resulting in a significant trade-off contradiction between resource conservation and spatial comfort [2]. Studies show that relying solely on empirical decision making may result in a loss of more than 30% of building energy efficiency potential, and digital tools are urgently needed to achieve precise quantification and cross-disciplinary coupled simulation.
Building information modeling (BIM) technology provides a new path to solve this difficult problem. BIM has connected the technical link from geometric information to performance simulation through parametric modeling and data integration [3,4]. For example, BIM models can be seamlessly integrated with platforms such as Ecotect and EnergyPlus, thereby generating multi-dimensional datasets in gbXML format to support dynamic coupling analysis of energy consumption, lighting and ventilation [5,6]. The existing studies have verified its technical advantages: Gourlis et al. [7] confirmed that BIM improves the efficiency of energy consumption simulation by about 60% compared with traditional CAD. When Ryan’s team [8] compared the accuracy of the three types of tools, they found that the error rate of Ecotect in the calculation of daylighting and noise attenuation was less than 8%. Cho et al. [9] demonstrated through cross-validation of EnergyPlus and IES (VE) that BIM-driven multi-objective optimization can increase the energy efficiency of HVAC systems by 22%. Ye et al. [10] analyzed through building information modeling (BIM) and combined with life cycle carbon emissions (LCA) and life cycle cost (LCC), reducing the LCA and LCC of rural prefabricated residences by approximately 30% and 20%, respectively, in terms of carbon reduction and cost optimization. Numan et al. [11] explored the influence of architectural design and urban layout in the bay area on the energy-saving effect of residential buildings; Wong et al. [12] focused on comparing the differences in building energy consumption in Singapore under different temperature conditions. The above-mentioned scholars’ research has all promoted the realization of sustainable development goals in architecture.
However, most of the existing studies at present have focused on a single performance indicator. For instance, Perez et al. [13] took certain buildings in Spanish urban planning as the carriers and achieved the collaborative optimization of lighting and ventilation through the data interaction of BIM–Ecotect but was limited to these two indicators only. Cheng [14] discussed the overall energy consumption by comparing BIM and RTLS technologies with traditional methods to assess energy loss. In terms of environmental performance simulation, Shen Xiaodong’s team completed the thermal performance sensitivity analysis of the envelope structure based on a certain project in Chongqing, while Li analyzed the influence mechanism of wind environment on the ecological microclimate through a certain project in Shanghai [15,16]. These studies all focus on a single performance index and have not established a methodological system for the collaborative optimization of “Light—Heat—Wind—Sound”, thus limiting the completeness of the comprehensive evaluation of green buildings.
In response to the above gaps, this study proposes an integrated analysis framework based on BIM–Ecotect collaborative work to simultaneously analyze the four major indicators of lighting, energy consumption, ventilation and noise: Firstly, a digital twin of the building is constructed in Revit, and geometric attributes, material thermal parameters and equipment system data are extracted; secondly, the energy consumption algorithm is calculated by coupling the EnergyPlus core through the Ecotect platform. Meanwhile, combined with the CFD ventilation model and the acoustic attenuation module, multi-physics field parallel simulation and interactive feedback are achieved. Finally, based on the hierarchical evaluation mechanism of the “Standards”, a quantitative index system covering the natural lighting compliance rate, energy consumption intensity per unit area, air age threshold and noise attenuation (dB) is constructed to provide theoretical guidance for construction.

2. Research Process and Greening Evaluation Indicators

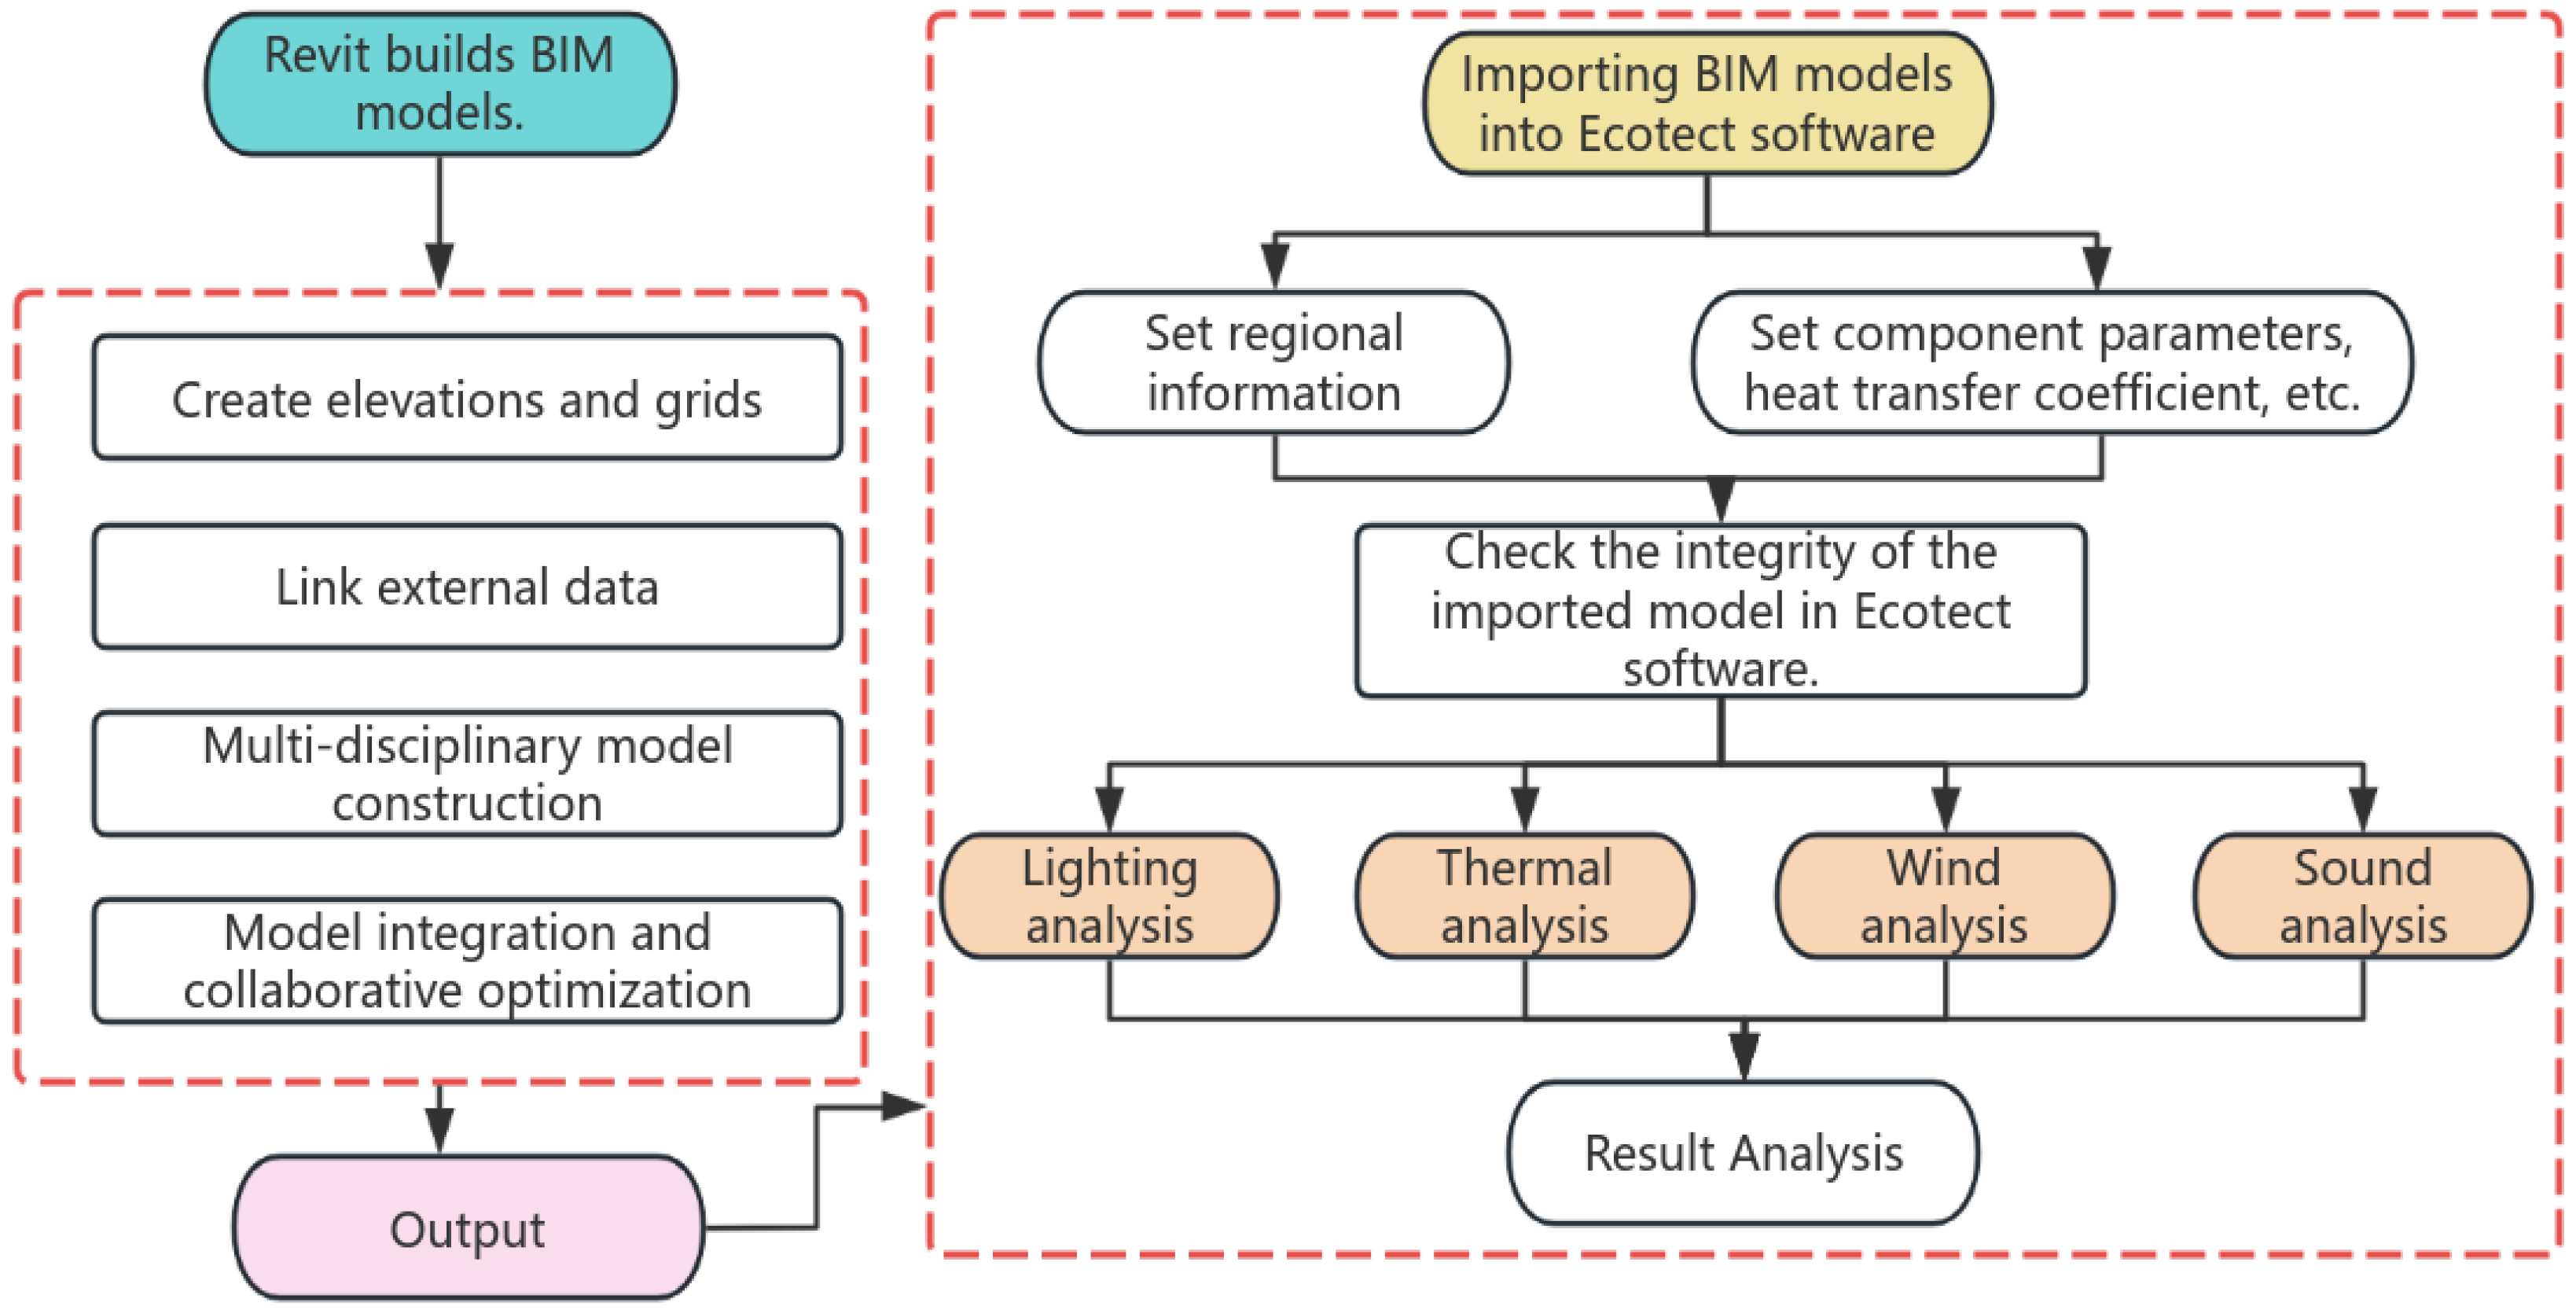
2.1. BIM Model and Ecotect Software

In the domain of building information modeling (BIM), Revit has shown substantial advantages due to its comprehensiveness, information interactivity and broad applicability, encompassing the entire lifecycle management from design through construction to operation and maintenance [17]. For green building analysis, Ecotect has emerged as one of the leading tools because of its precision. Its capabilities include light environment simulation, thermal performance evaluation, acoustic modeling, solar radiation calculation and visibility analysis. It also presents results via visual data network charts, thereby significantly enhancing the efficiency of the analysis [18,19]. This experiment employs a collaborative workflow between Revit 2021 and Ecotect Analysis 2011 on a Windows 10 (64-bit) operating system, leveraging a high-performance computing platform equipped with an Intel Xeon W-2295 processor (18 cores, 36 threads; Intel Corporation, Santa Clara, CA, USA), 128 GB DDR4 memory, and an NVIDIA Quadro RTX 6000 graphics card (24 GB VRAM; NVIDIA Corporation, Santa Clara, CA, USA). Through the gbXML format, it achieves seamless integration of BIM models with energy consumption, daylighting, ventilation and noise analysis, while utilizing measured data related to light, heat, wind and sound for the assessment of green buildings.
The experimental operation process is structured as follows. Initially, a BIM information model was constructed in Revit based on the design drawings. Components such as columns, walls, doors, windows and roofs are sequentially modeled, with their material properties (e.g., heat transfer coefficients, dimensions) accurately defined. Concurrently, rooms are partitioned across each floor and labeled with room numbers to establish foundational data for subsequent green building analysis. Upon completing the modeling phase, the BIM model undergoes optimization by disabling the visibility of elements not pertinent to the analysis (e.g., indoor fixtures, terrain, stairs), thereby reducing file size and enhancing data transfer efficiency. Specific sections of the building are analyzed using the section box feature to isolate and export targeted areas. Subsequently, the optimized BIM model is exported in gbXML format and imported into Ecotect Analysis 2011. Leveraging its advanced capabilities, precise simulations of the light environment, thermal performance, wind behavior and acoustic conditions are conducted. Finally, the building is comprehensively evaluated and analyzed according to the green degree evaluation index system (Figure 1).

2.2. Green Degree Evaluation Index System and Calculation

The green degree serves as a comprehensive evaluation index for assessing the impact of buildings on the ecological environment and resource consumption throughout their entire life cycle. It is designed to evaluate whether building projects meet national green building standards and sustainable development goals, thereby reflecting the practical effectiveness of implementing green concepts. The green degree evaluation system based on BIM technology adopts GB/T 50378-2019 “Green Building Evaluation Standard” as its core framework and integrates specialized regulations for civil buildings to construct a multi-level evaluation model across four dimensions: light environment, thermal environment, wind environment and acoustic environment. By utilizing the data integration capabilities of BIM technology and the simulation functions of green analysis software, the evaluation parameters are categorized into two primary groups: building environmental quality (Q) and load performance (L). The former emphasizes spatial comfort, health and environmental friendliness, while the latter focuses on energy consumption, carbon emissions and environmental load performance indicators [20]. The detailed evaluation framework is presented in Table 1.

2.3. Calculation of Green Degree and Grading Standards

The green degree is calculated through Ecotect Analysis 2011 green software, in combination with the various green building evaluation indicators in Table 1. The results are scored according to the national green building standards. The weights of each quality and load indicator are determined based on the group decision making of experts [21,22,23,24,25]. After obtaining the weights of each secondary indicator and the actual scores, the actual scores of the quality Q i 1 and load L j 1 of each primary indicator are obtained through the weighted average summation method by using Equations (1) and (2).
Q i 1 = Q ij 2 j ω Q ij 2
L i 1 = L ij 2 j ω L ij 2
In the formula, ω Q represents the quality weight corresponding to the first-level indicator; ω L represents the load weight corresponding to the first-level indicator; the actual scores Q i 1 and L j 1 of the first-level indicators obtained are then substituted into Formulas (3) and (4) to obtain the actual quality and load values of the building.
Q = Q i 2 i ω Q i 1
L = L j 1 j ω L j 1
By performing a ratio operation between Equation (3) (actual building mass) and Equation (4) (load), the greenness evaluation value α of the project can be constructed.
α = Q / L
According to the green degree value calculated using Formula (5), in conjunction with the classification thresholds specified in GB/T 50378-2019 “Green Building Evaluation Standard”, the green performance is categorized into five levels: poor (≤0.5), relatively poor (0.5–1.0), average (1.0–1.5), good (1.5–3.0) and excellent (≥3.0). This classification framework aims to quantitatively assess the overall performance of buildings in terms of energy conservation, environmental protection, health and other relevant aspects, thereby providing clear optimization directions for the design, construction and operation phases of green buildings [26,27,28,29]. The detailed scoring criteria are presented in Table 2. The “poor” level signifies significant deficiencies in areas such as energy consumption, resource utilization and environmental friendliness, necessitating systematic improvements. A building rated as “low” indicates that certain indicators have not yet reached the required standards, requiring targeted enhancements. The “average” level suggests that the building generally complies with environmental protection standards but still has potential for further improvement. The “good” level reflects a relatively high level of performance in energy conservation and environmental protection, approaching optimal conditions. Finally, the “excellent” level demonstrates exceptional green performance, fully satisfying the stringent requirements of sustainable development.

3. Experimental Verification
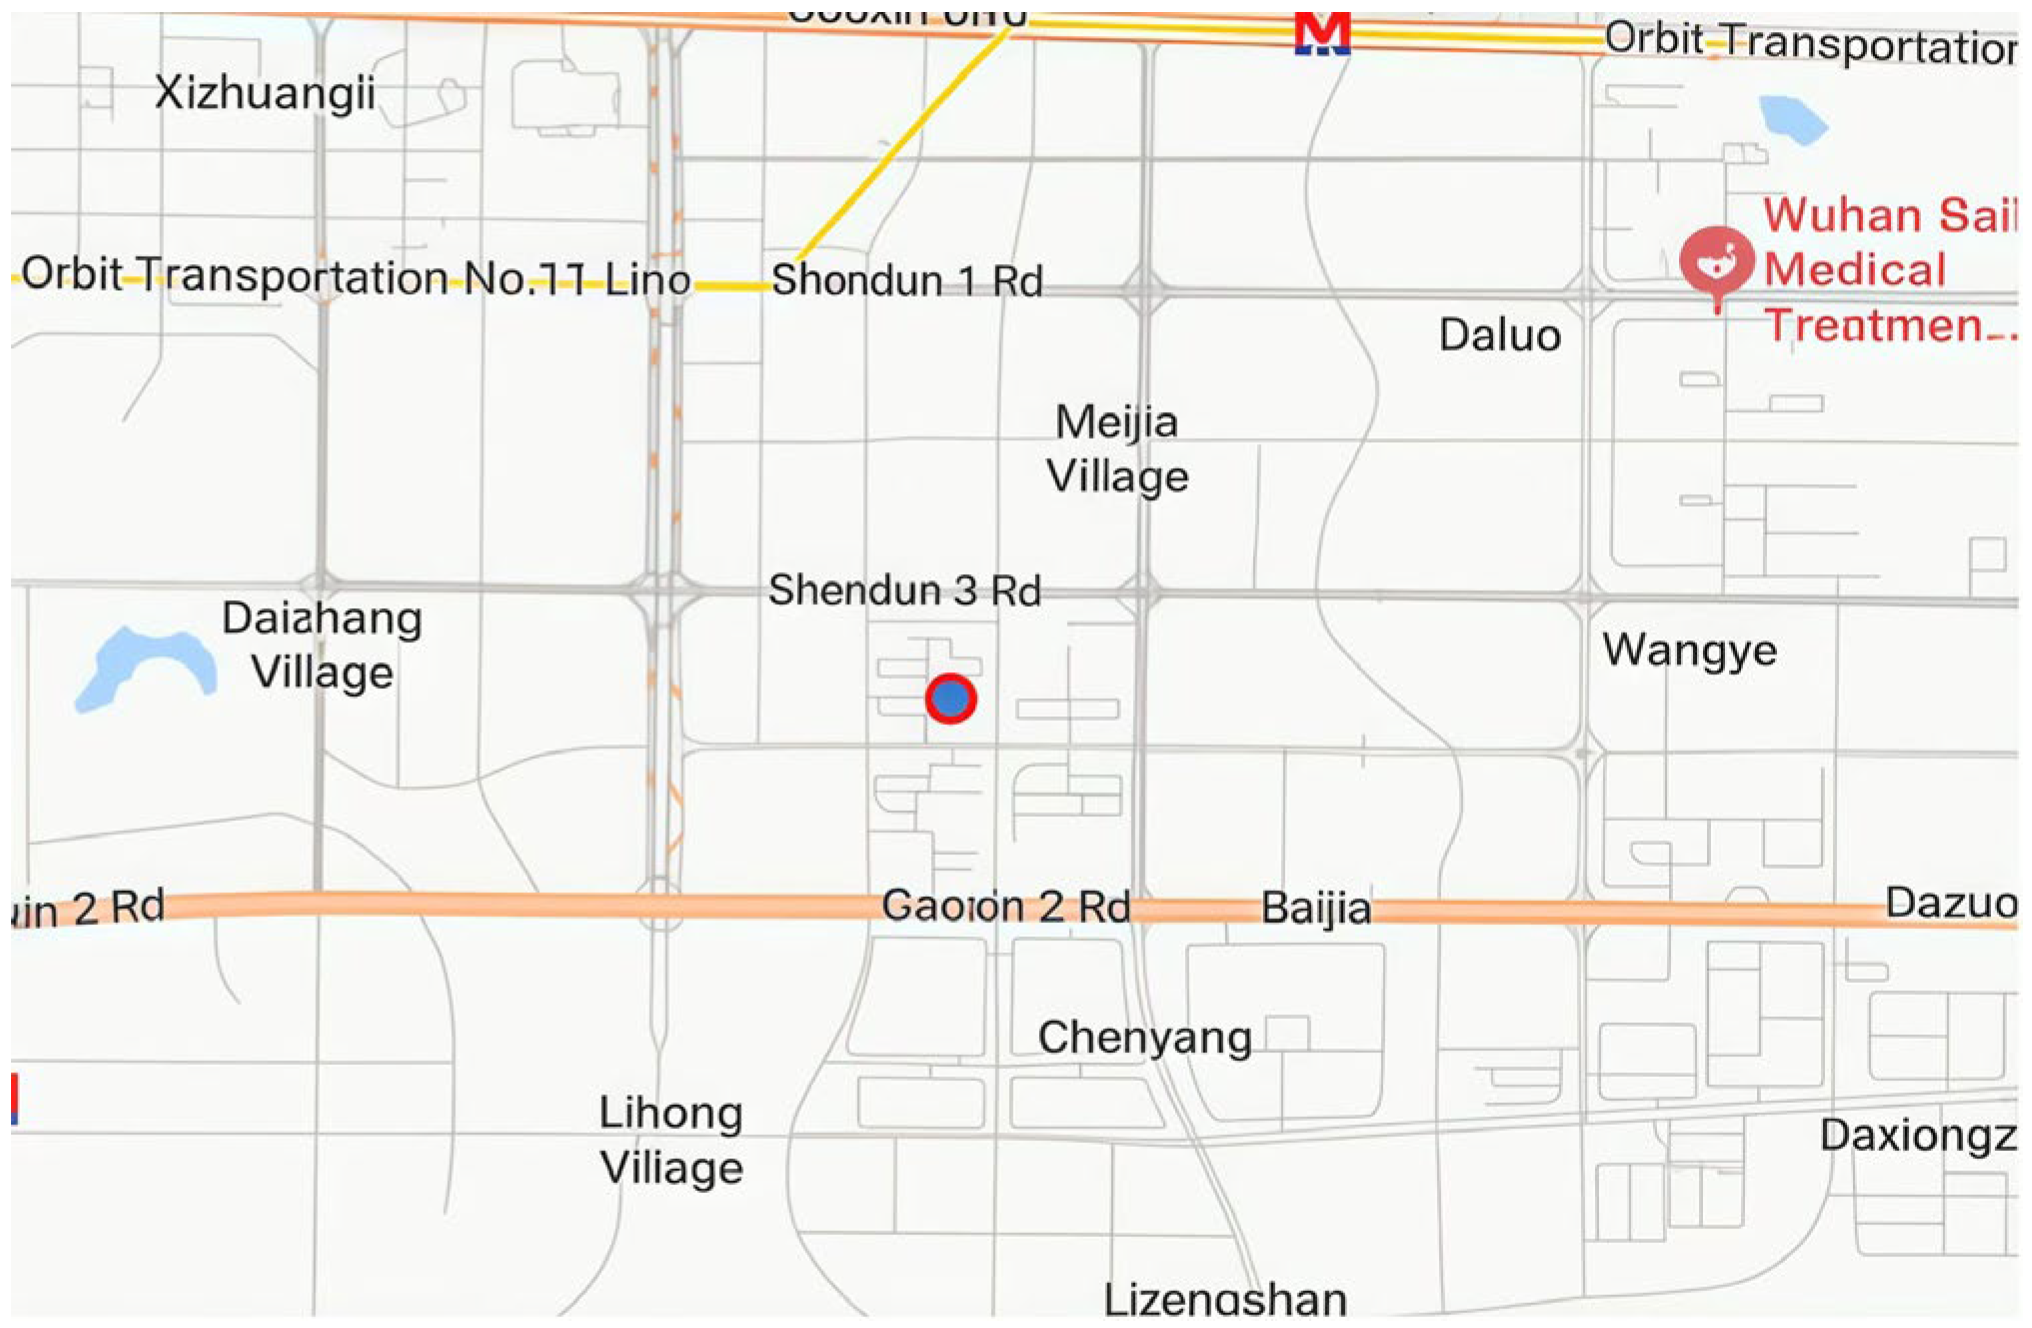
3.1. Background

This study takes an eight-story office building in Wuhan Development Zone as the research object. The building is located in Donghu District of Wuhan, close to the urban greenway, with convenient transportation around it (Figure 2). The building adopts the frame-shear wall structure system, with a total construction area of 48,000 square meters (120 m long × 50 m wide, the ceiling height on each floor is 4 m, and 32 m is the total height of the building). Its functional layout includes four main modules: office area (60%), corridor area (20%), meeting room (15%) and computer room (5%). The design capability can support up to 1800 people working together (Figure 3). This project integrates the Green GMV6 inverter multi-split air conditioning system, 600 × 600 LED panel lighting equipment and intelligent fire linkage devices, forming a modern electromechanical equipment system.

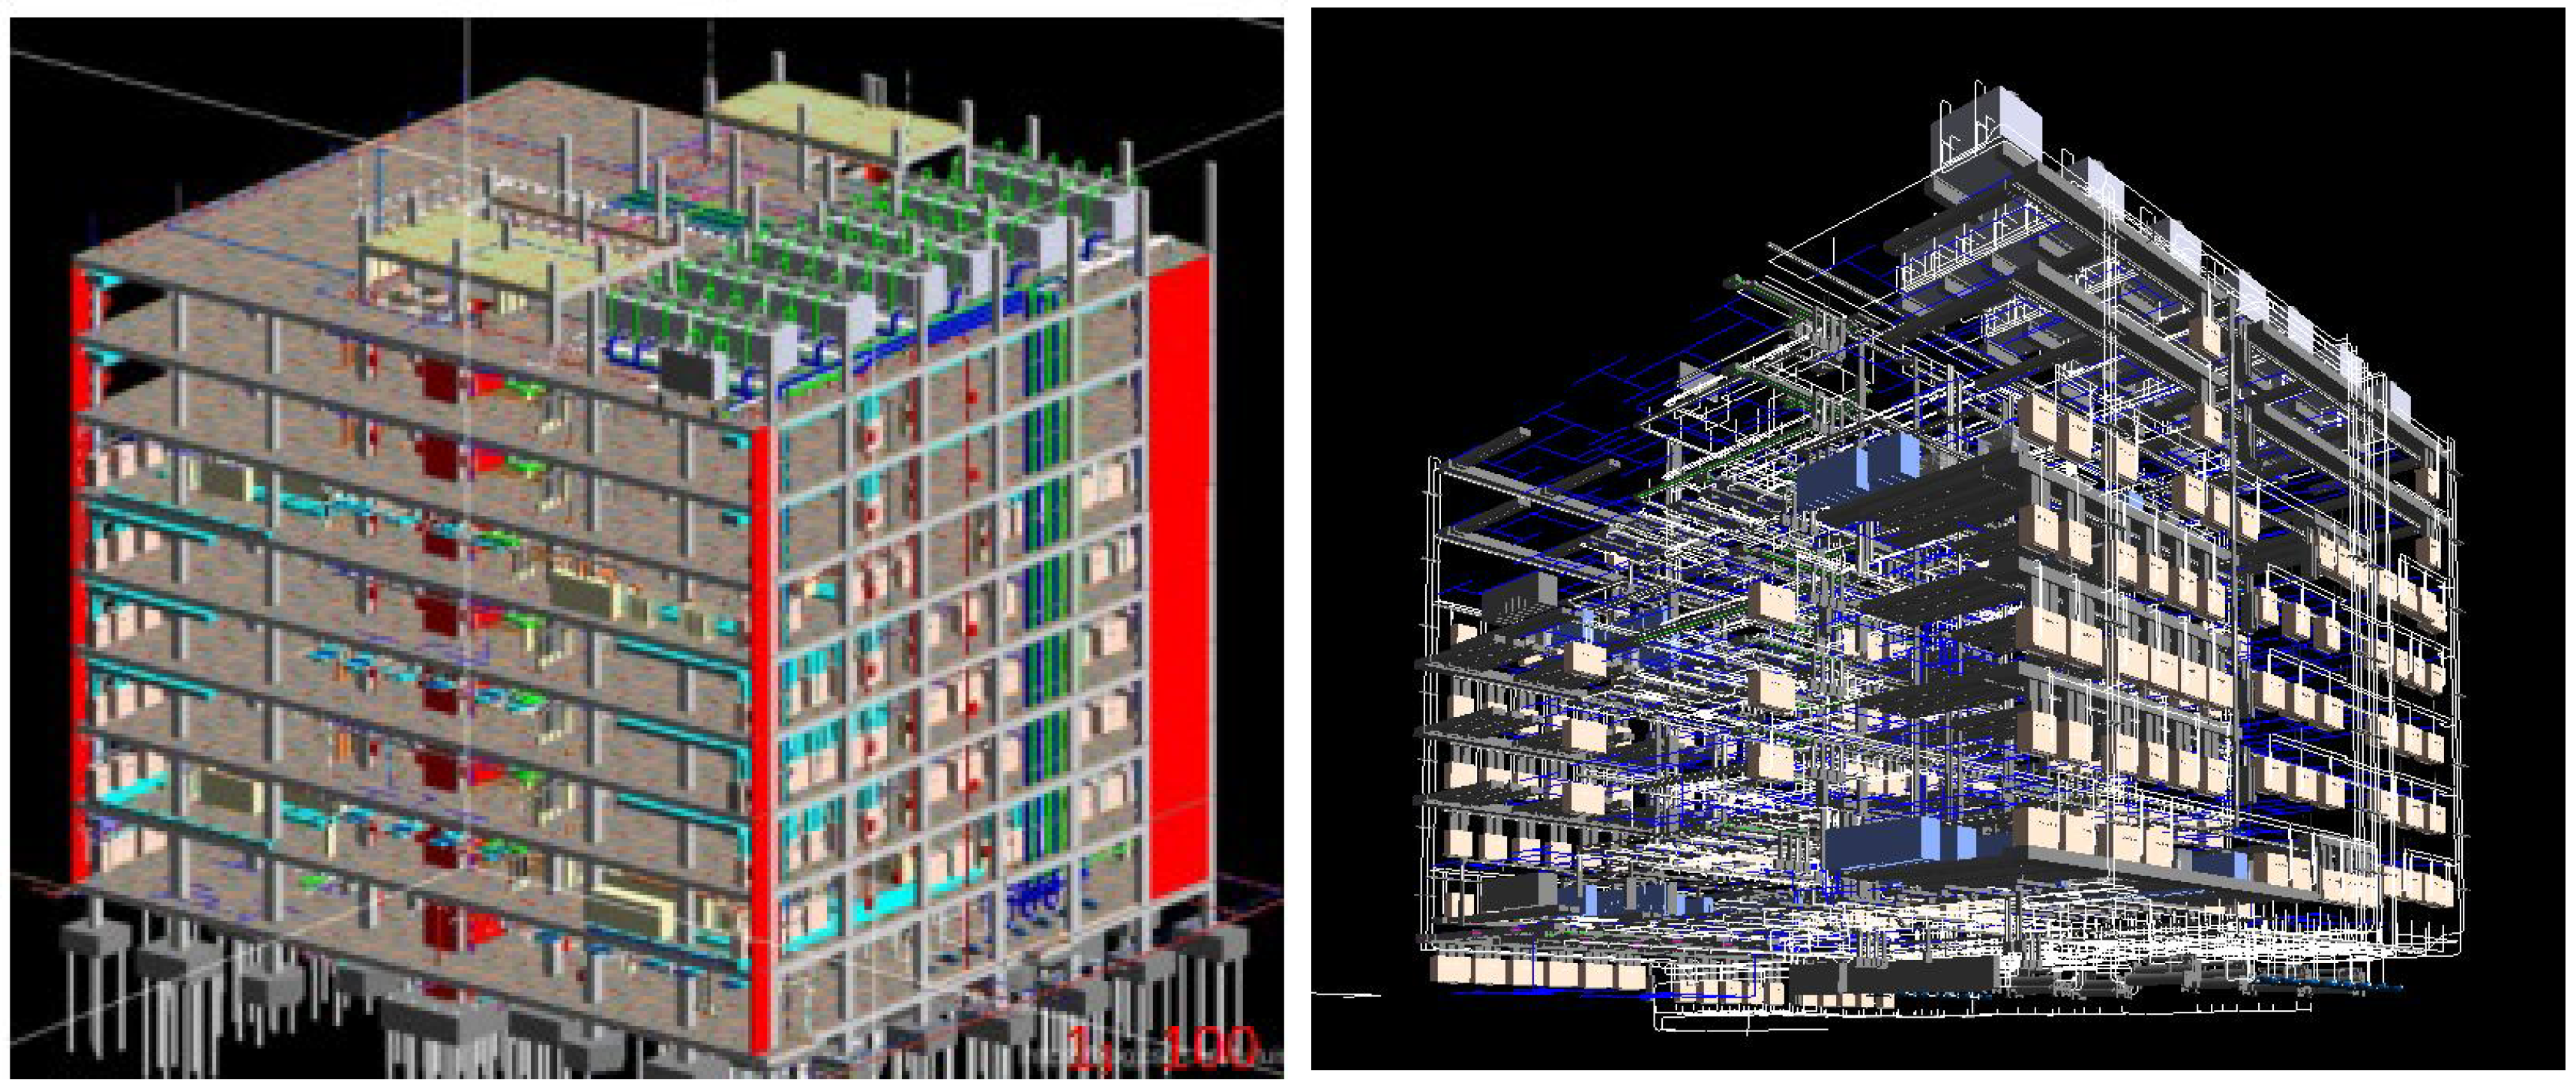
3.2. Model Establishment

A new project file was created using Revit software 2021, with the project location (geographical coordinates: 30°35′ N, 114°17′ E, Wuhan region) and basic project information (eight-story office building, China Construction Third Engineering Bureau, etc.) pre-configured. Based on the architectural drawings of the office building, elevations and axes were established within the software to ensure consistency with the design drawings. Subsequently, modeling was performed sequentially for columns, walls, doors and windows, floor slabs and roofs. All components’ dimensions, materials and structural information were strictly set according to the drawings. The column section size is 600 mm × 600 mm, walls are constructed using 200 mm thick aerated concrete blocks, door and window dimensions and materials are determined based on functional area requirements, and the floor slab thickness is 150 mm. The roof features a double-layer insulation and waterproof structure. Ultimately, a complete BIM information model was developed, as illustrated in Figure 3, providing precise data support for subsequent green building analysis.

4. Test Results

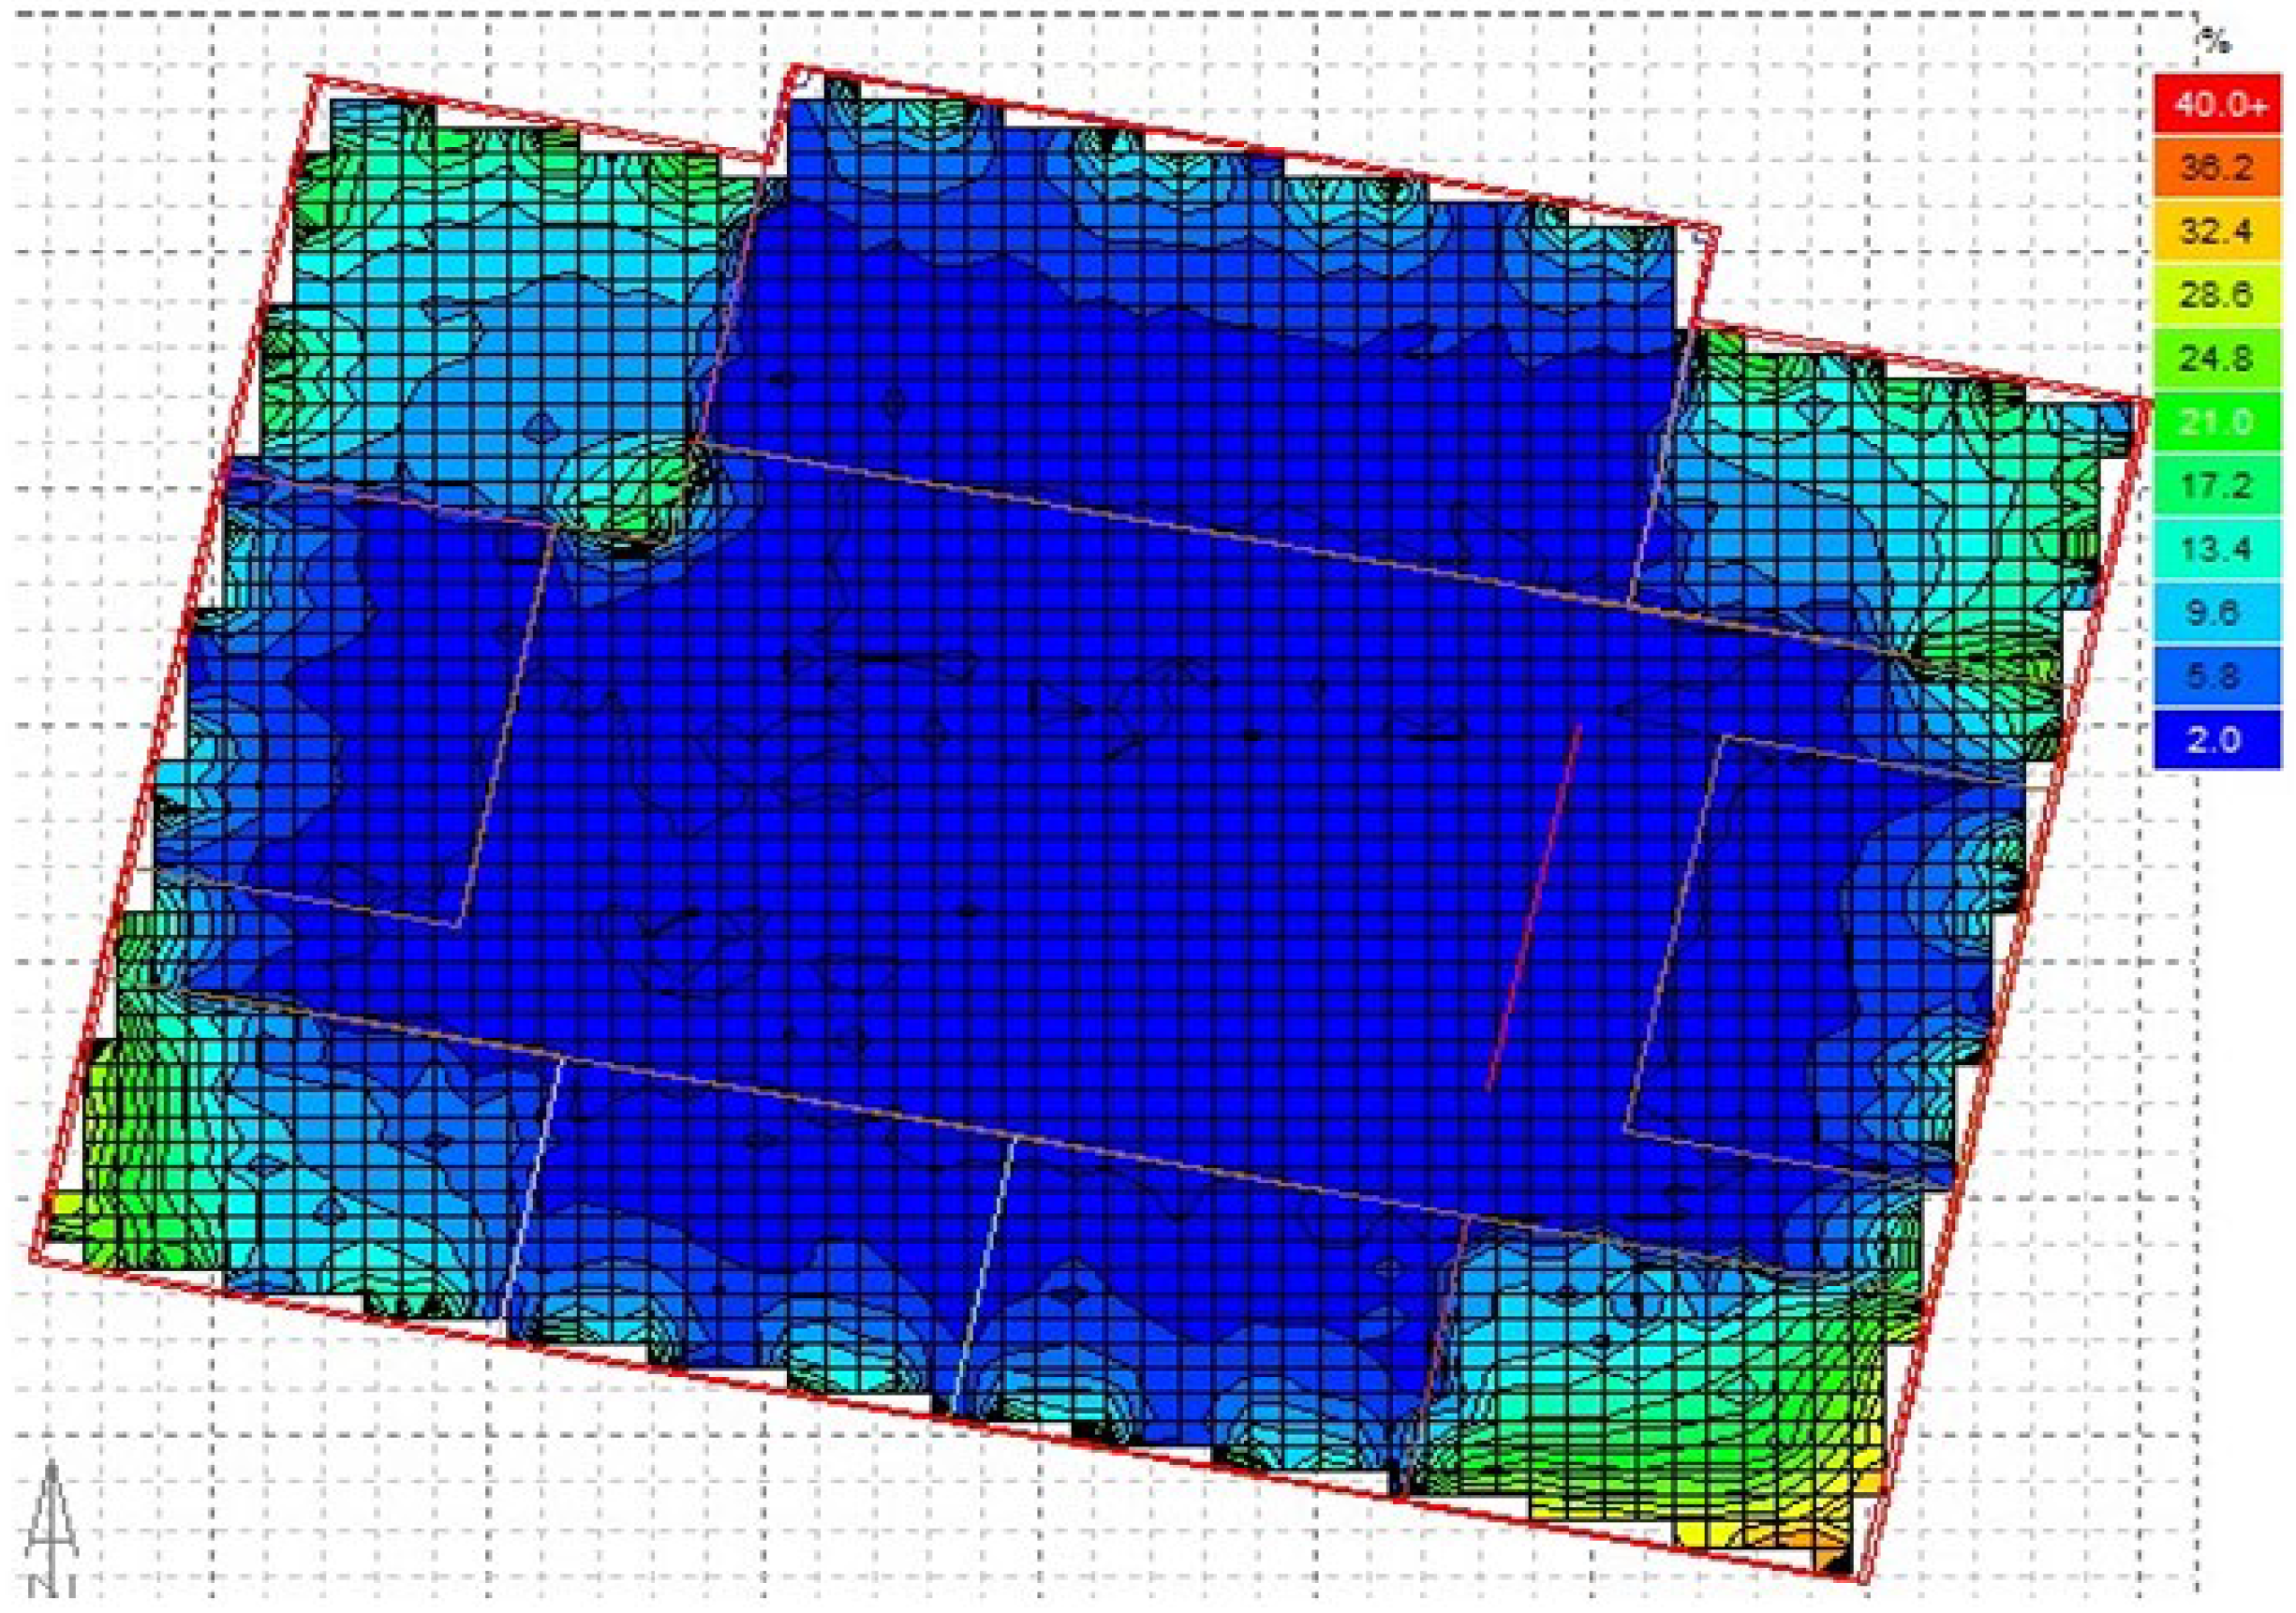
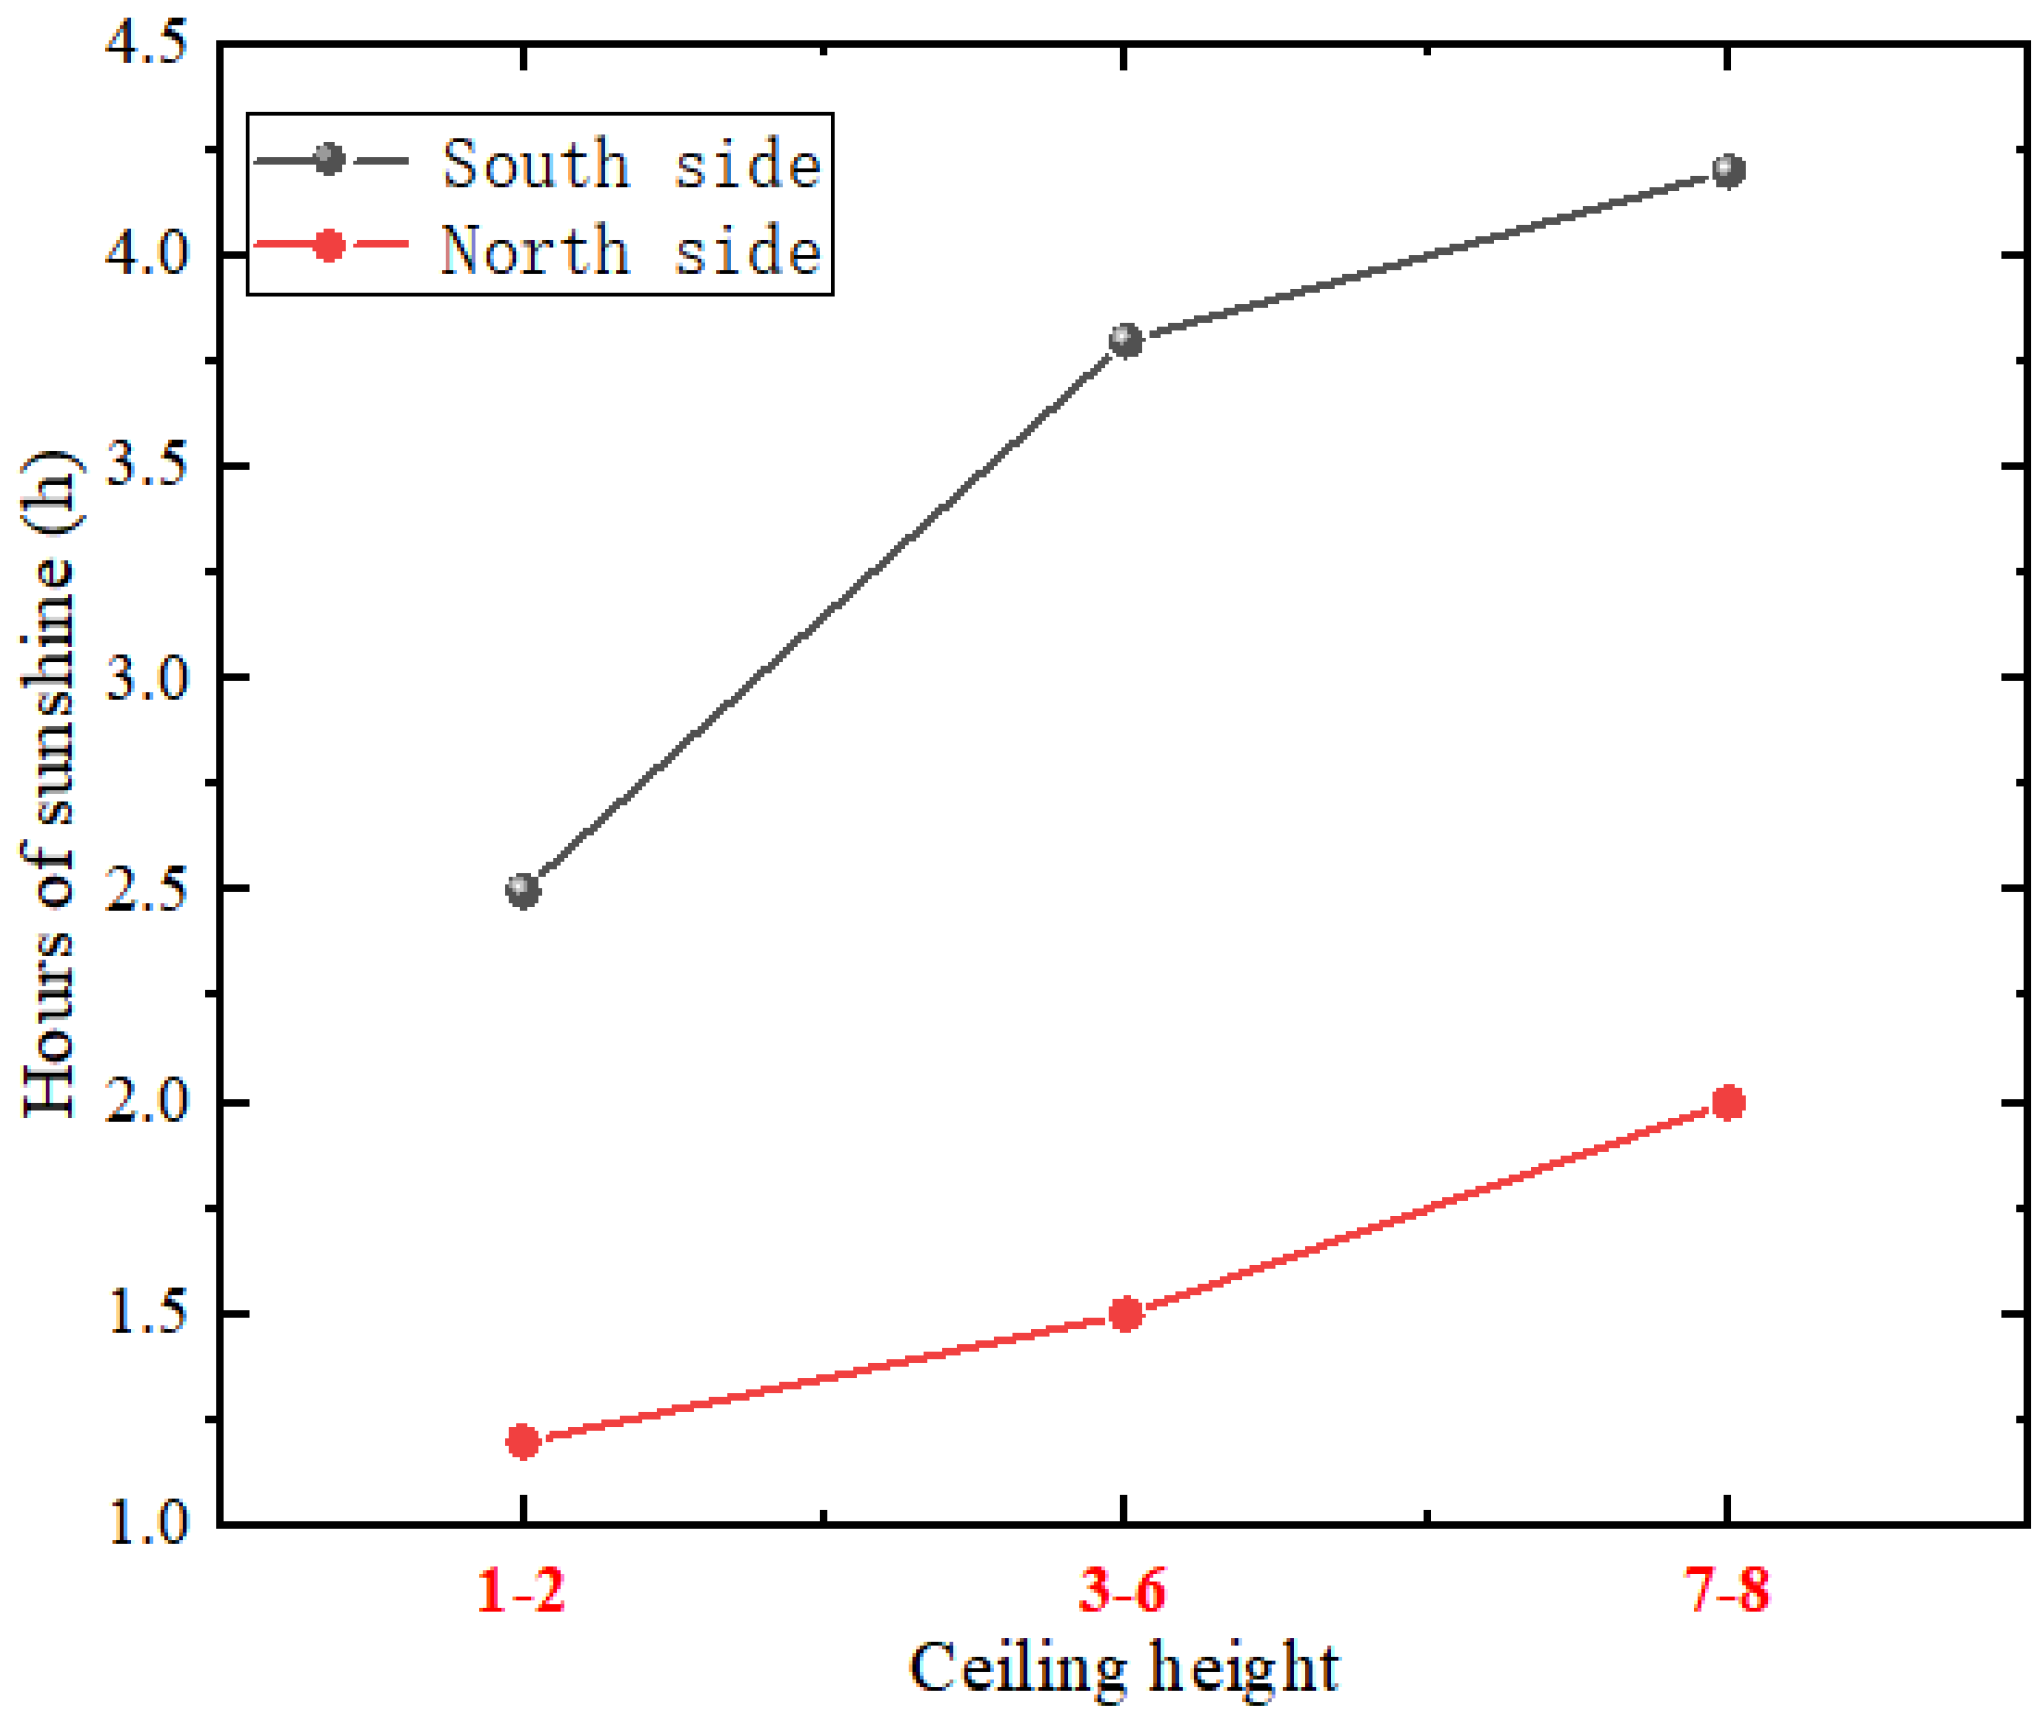
4.1. Daylighting and Solar Radiation Analysis Using Ecotect

In green building design, the use of BIM-based daylighting and solar radiation simulations allows for a quantitative evaluation of indoor and outdoor light environment performance, thereby providing a robust scientific foundation for energy-efficient design [30,31]. In this study, an eight-story office building (with a floor height of 4 m, total height of 32 m and a floor area of 800 m2 per level) was selected as a case example. Following the “Standard for Daylighting Design of Buildings”, a BIM model was developed using Revit software and subsequently imported into Ecotect for analysis. The light climate parameters specific to Wuhan (Class IV region, K = 1.1, outdoor critical illuminance of 4500 lx) were configured, along with key optical properties of the building envelope, including a south-facing window-to-floor ratio of 1:6, glass transmittance of 0.6, exterior wall reflectance of 0.65, roof reflectance of 0.50 and ground reflectance of 0.30. The simulation grid resolution was set at 0.5 m × 0.5 m to ensure high accuracy. By integrating the CIE overcast sky model with typical meteorological year (TMY) data, the annual dynamic daylight distribution across all 8760 h and the solar radiation duration on the winter solstice were successfully simulated. The detailed model parameters are summarized in Table 3.
The daylight factor is obtained by Equation (6):
C = E S / E T
In the formula, C represents the daylight factor, ES is the plane illuminance at a certain point inside the room generated by natural light (Unit: lx), and ET indicates the total illuminance of natural light on the unobstructed horizontal surface outdoors at the same time.
Based on the BIM model constructed above, Ecotect Analysis software was imported to conduct quantitative analysis for the lighting performance of each functional area of the office building (Figure 4), and the following key data were obtained as shown in Table 4.
This study employed a collaborative simulation approach using BIM and Ecotect to quantitatively evaluate the daylighting performance of various functional areas in an eight-story office building. The findings indicate that south-facing areas exhibit optimal daylighting performance, attributed to abundant natural light and well-designed shading strategies. Specifically, the daylight factor for south-facing offices is 2.4 (compliance rate 85%), while that for south-facing meeting rooms reaches 2.6 (compliance rate 92%). Both values meet the three-star requirements of the “Green Building Evaluation Standard” (≥80%). In contrast, north-facing offices, influenced by orientation and external shading, have a daylight factor of 2.1 (compliance rate 78%) and may benefit from supplementary lighting via reflectors or light pipes. The corridor area, lacking direct exterior windows, demonstrates a low daylight factor of 1.2 (compliance rate 40%) and requires optimization through artificial lighting integration or light wells. Regarding illuminance uniformity, south-facing meeting rooms achieved an improvement from 0.70 to 0.75 by optimizing the window-to-floor ratio (1:6) and utilizing diffuse reflection materials, effectively mitigating glare. Similarly, north-facing offices enhanced uniformity from 0.55 to 0.65 through the application of light-colored walls (reflectance ≥ 0.7) and high-transparency glass (VLT = 0.65).
Figure 5 illustrates the distribution of sunshine hours for south- and north-facing rooms across different floors of an eight-story office building on the winter solstice. Owing to their advantageous orientation and the trajectory of the sun, the sunshine hours for south-facing rooms increase markedly with floor elevation: from 2.5 h on the first to second floors, rising to 3.8 h on the third to sixth floors and reaching 4.2 h on the seventh to eighth floors. These values meet the basic daylighting requirements outlined in the “Green Building Evaluation Standard” (GB/T 50378-2019) (reference value ≥ 2 h). Conversely, north-facing rooms, constrained by their orientation and surrounding obstructions, exhibit significantly lower sunshine hours: only 1.2 h on the first to second floors, increasing to 2.0 h on the seventh to eighth floors, yet remaining below 50% of those for south-facing rooms. In the upper floors (seventh to eighth), reduced obstructions and optimized solar altitude angles narrow the daylighting disparity between south- and north-facing areas. However, the lower floors (first to second) require supplementary lighting via reflectors or light pipes to compensate for insufficient natural illumination. The data demonstrate that building height and orientation are critical factors influencing daylighting performance. Therefore, in design considerations, high daylighting demand areas should be prioritized for placement on south-facing middle and upper floors, while material and construction optimizations should enhance the light environment in lower areas to achieve a balance between energy efficiency and occupant comfort.
This study adopted a controlled experiment method to verify the reliability of the Ecotect analysis software in simulating the sunlight duration of buildings. Through the TES-1332A high-precision digital illuminance meter (with a range of 1–20,000 lux and a systematic error of ±3%), Data collection was carried out under typical clear sky conditions (cloud cover index ≤ 0.1) in accordance with the ISO/CIE 19776:2014 standard [32]. After the instrument was calibrated by the provincial metrology testing center, in the area where the geographical coordinates of the measurement point (30°35′ N, 114°17′ E) are located, six groups of horizontal plane solar intensity samples were continuously obtained at intervals of 2 h within the time range from 08:00 to 18:00. After arithmetic averaging processing, the benchmark data set was formed, and the TMY2 meteorological data parameters shown in Table 5 were simultaneously referred to. In the numerical simulation stage, a three-dimensional parametric model was constructed based on the Ecotect Analysis 2011 platform. The optical parameters of the building envelope structure were configured strictly in accordance with the “Building Daylighting Design Standard” (GB 50033-2021) [33], and the sunlight simulation data were generated through the spatial discretization algorithm. Finally, the UTC time axis calibration mechanism was adopted to compensate for the time-domain deviation and eliminate the outliers in the spatial dimension. The measured data and the simulation results were compared and analyzed in time (for details, see Table 6).
The data in Table 6 indicates that the sunshine duration calculated by Ecotect Analysis software is close to that measured by the TES-1332A high-precision digital illuminance meter, with the maximum error rate not exceeding 4.3%. This result further validates the reliability of the numerical values.

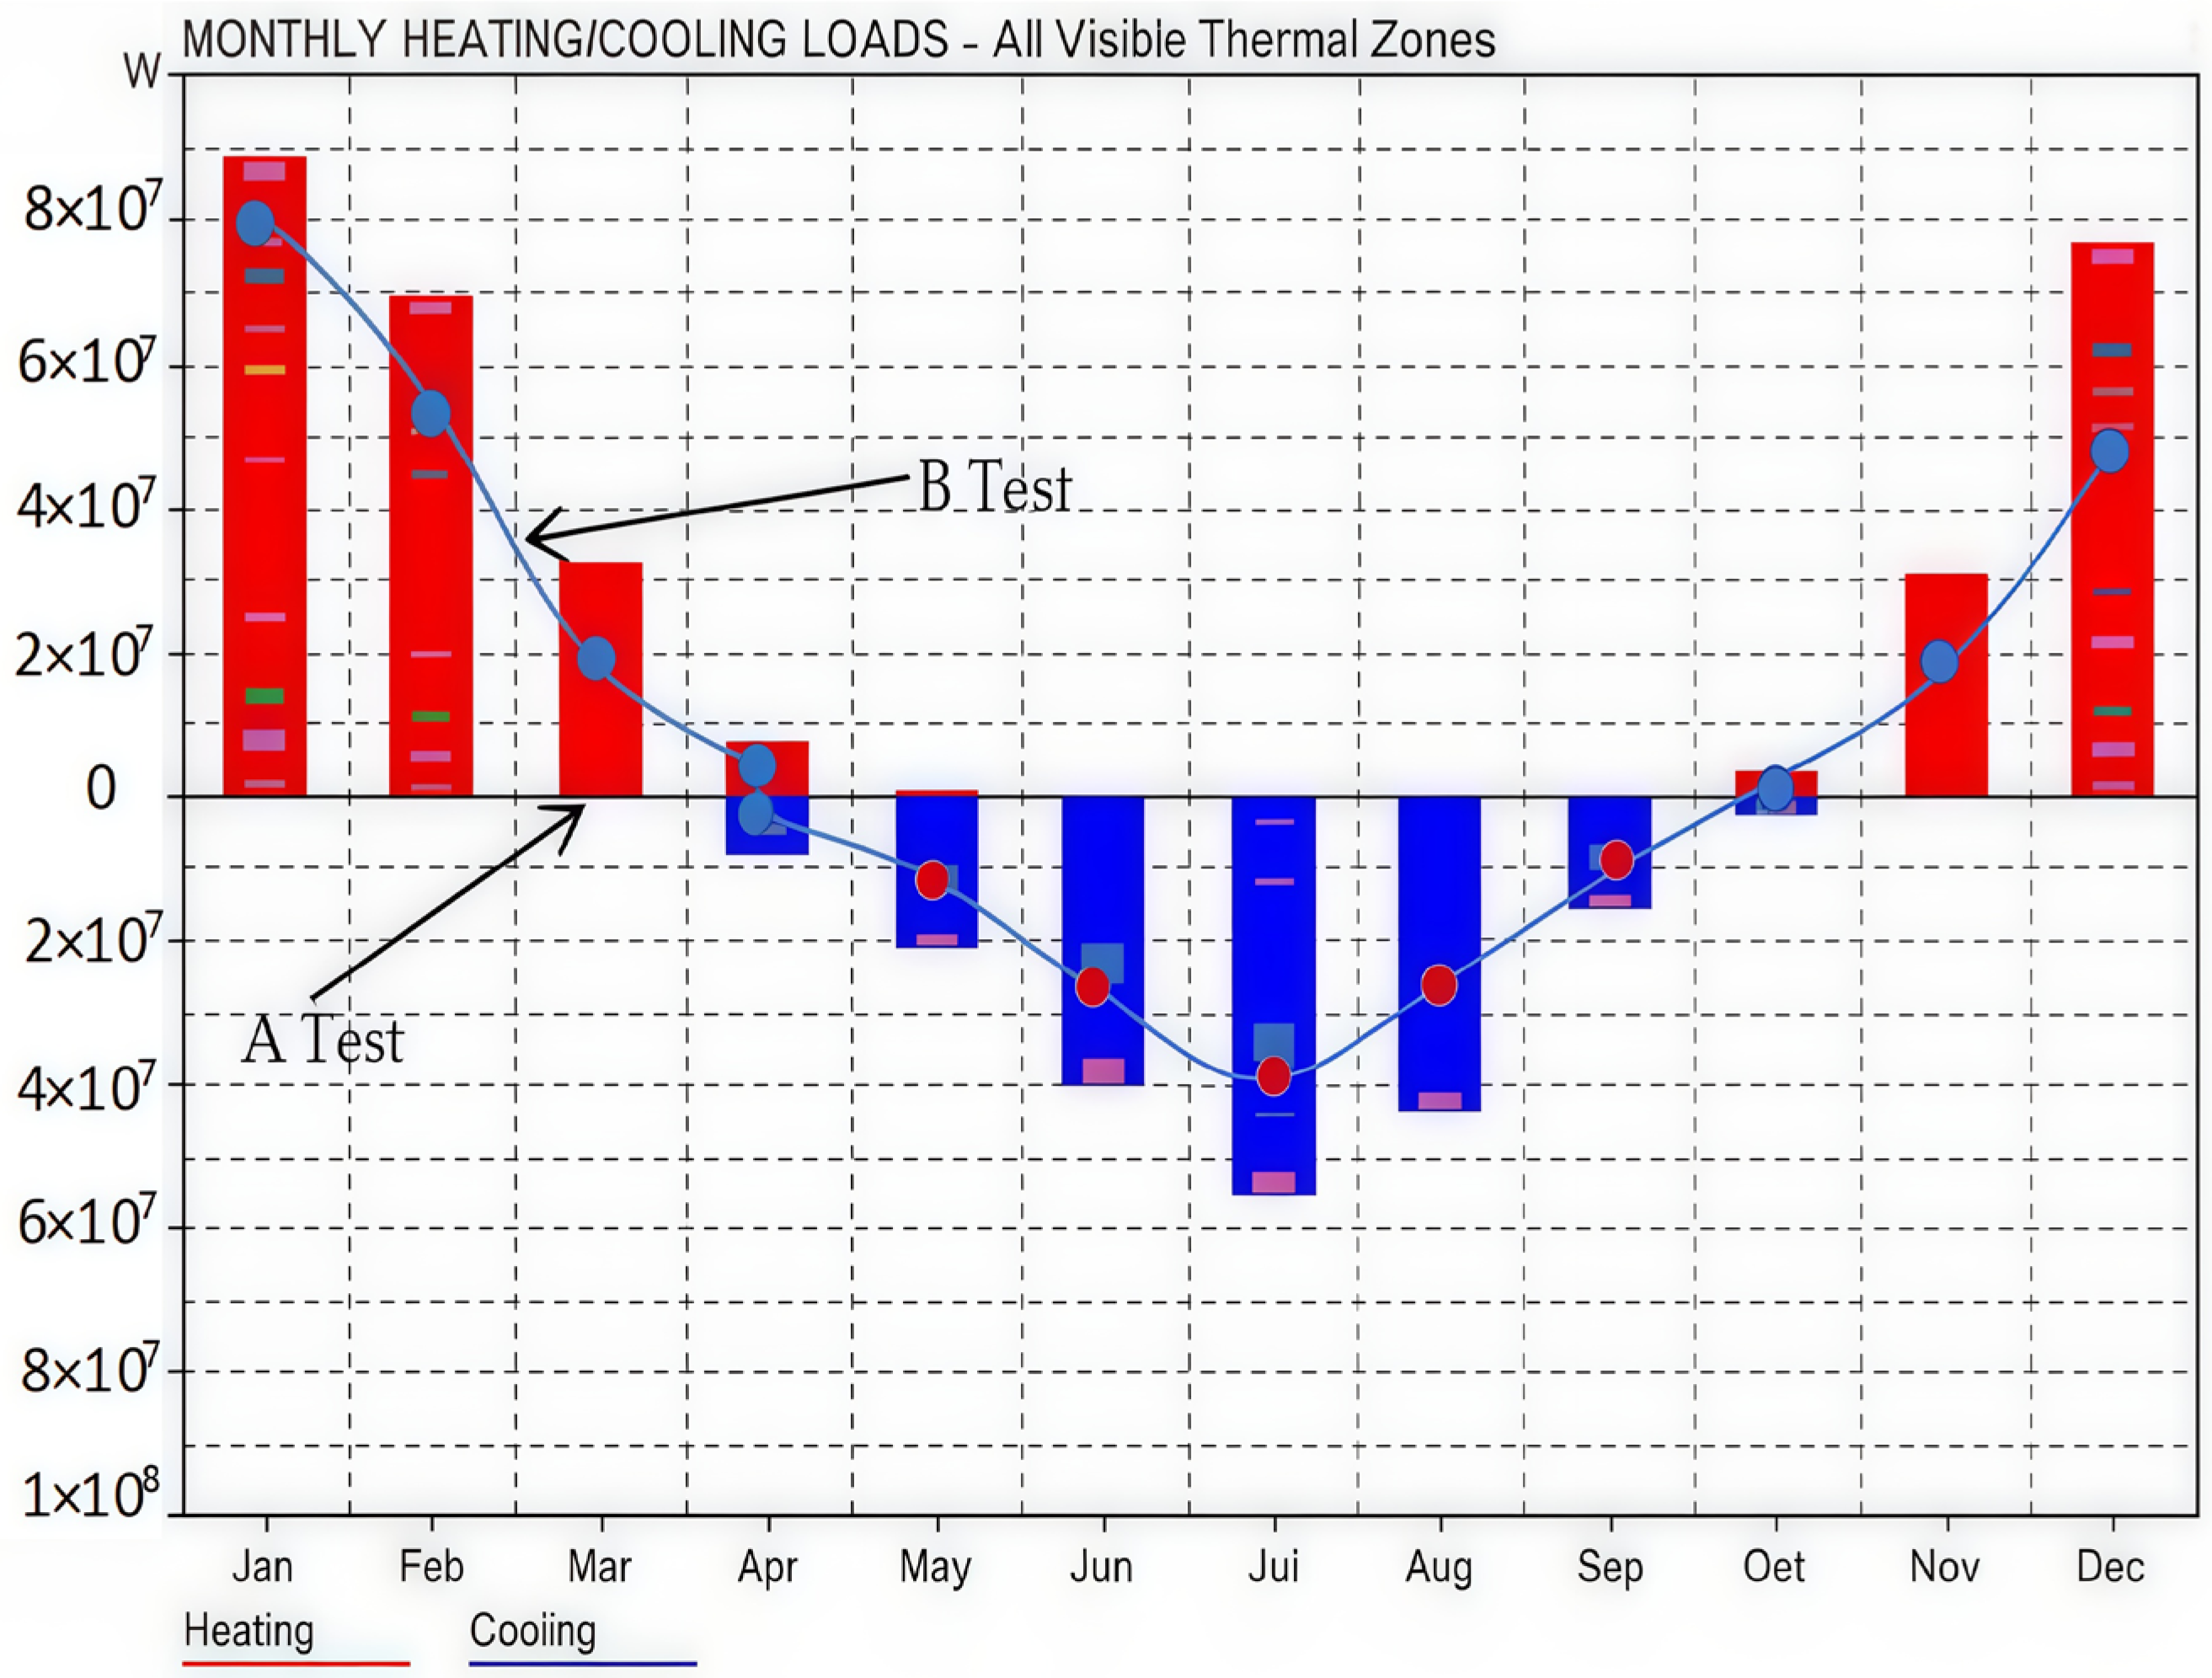
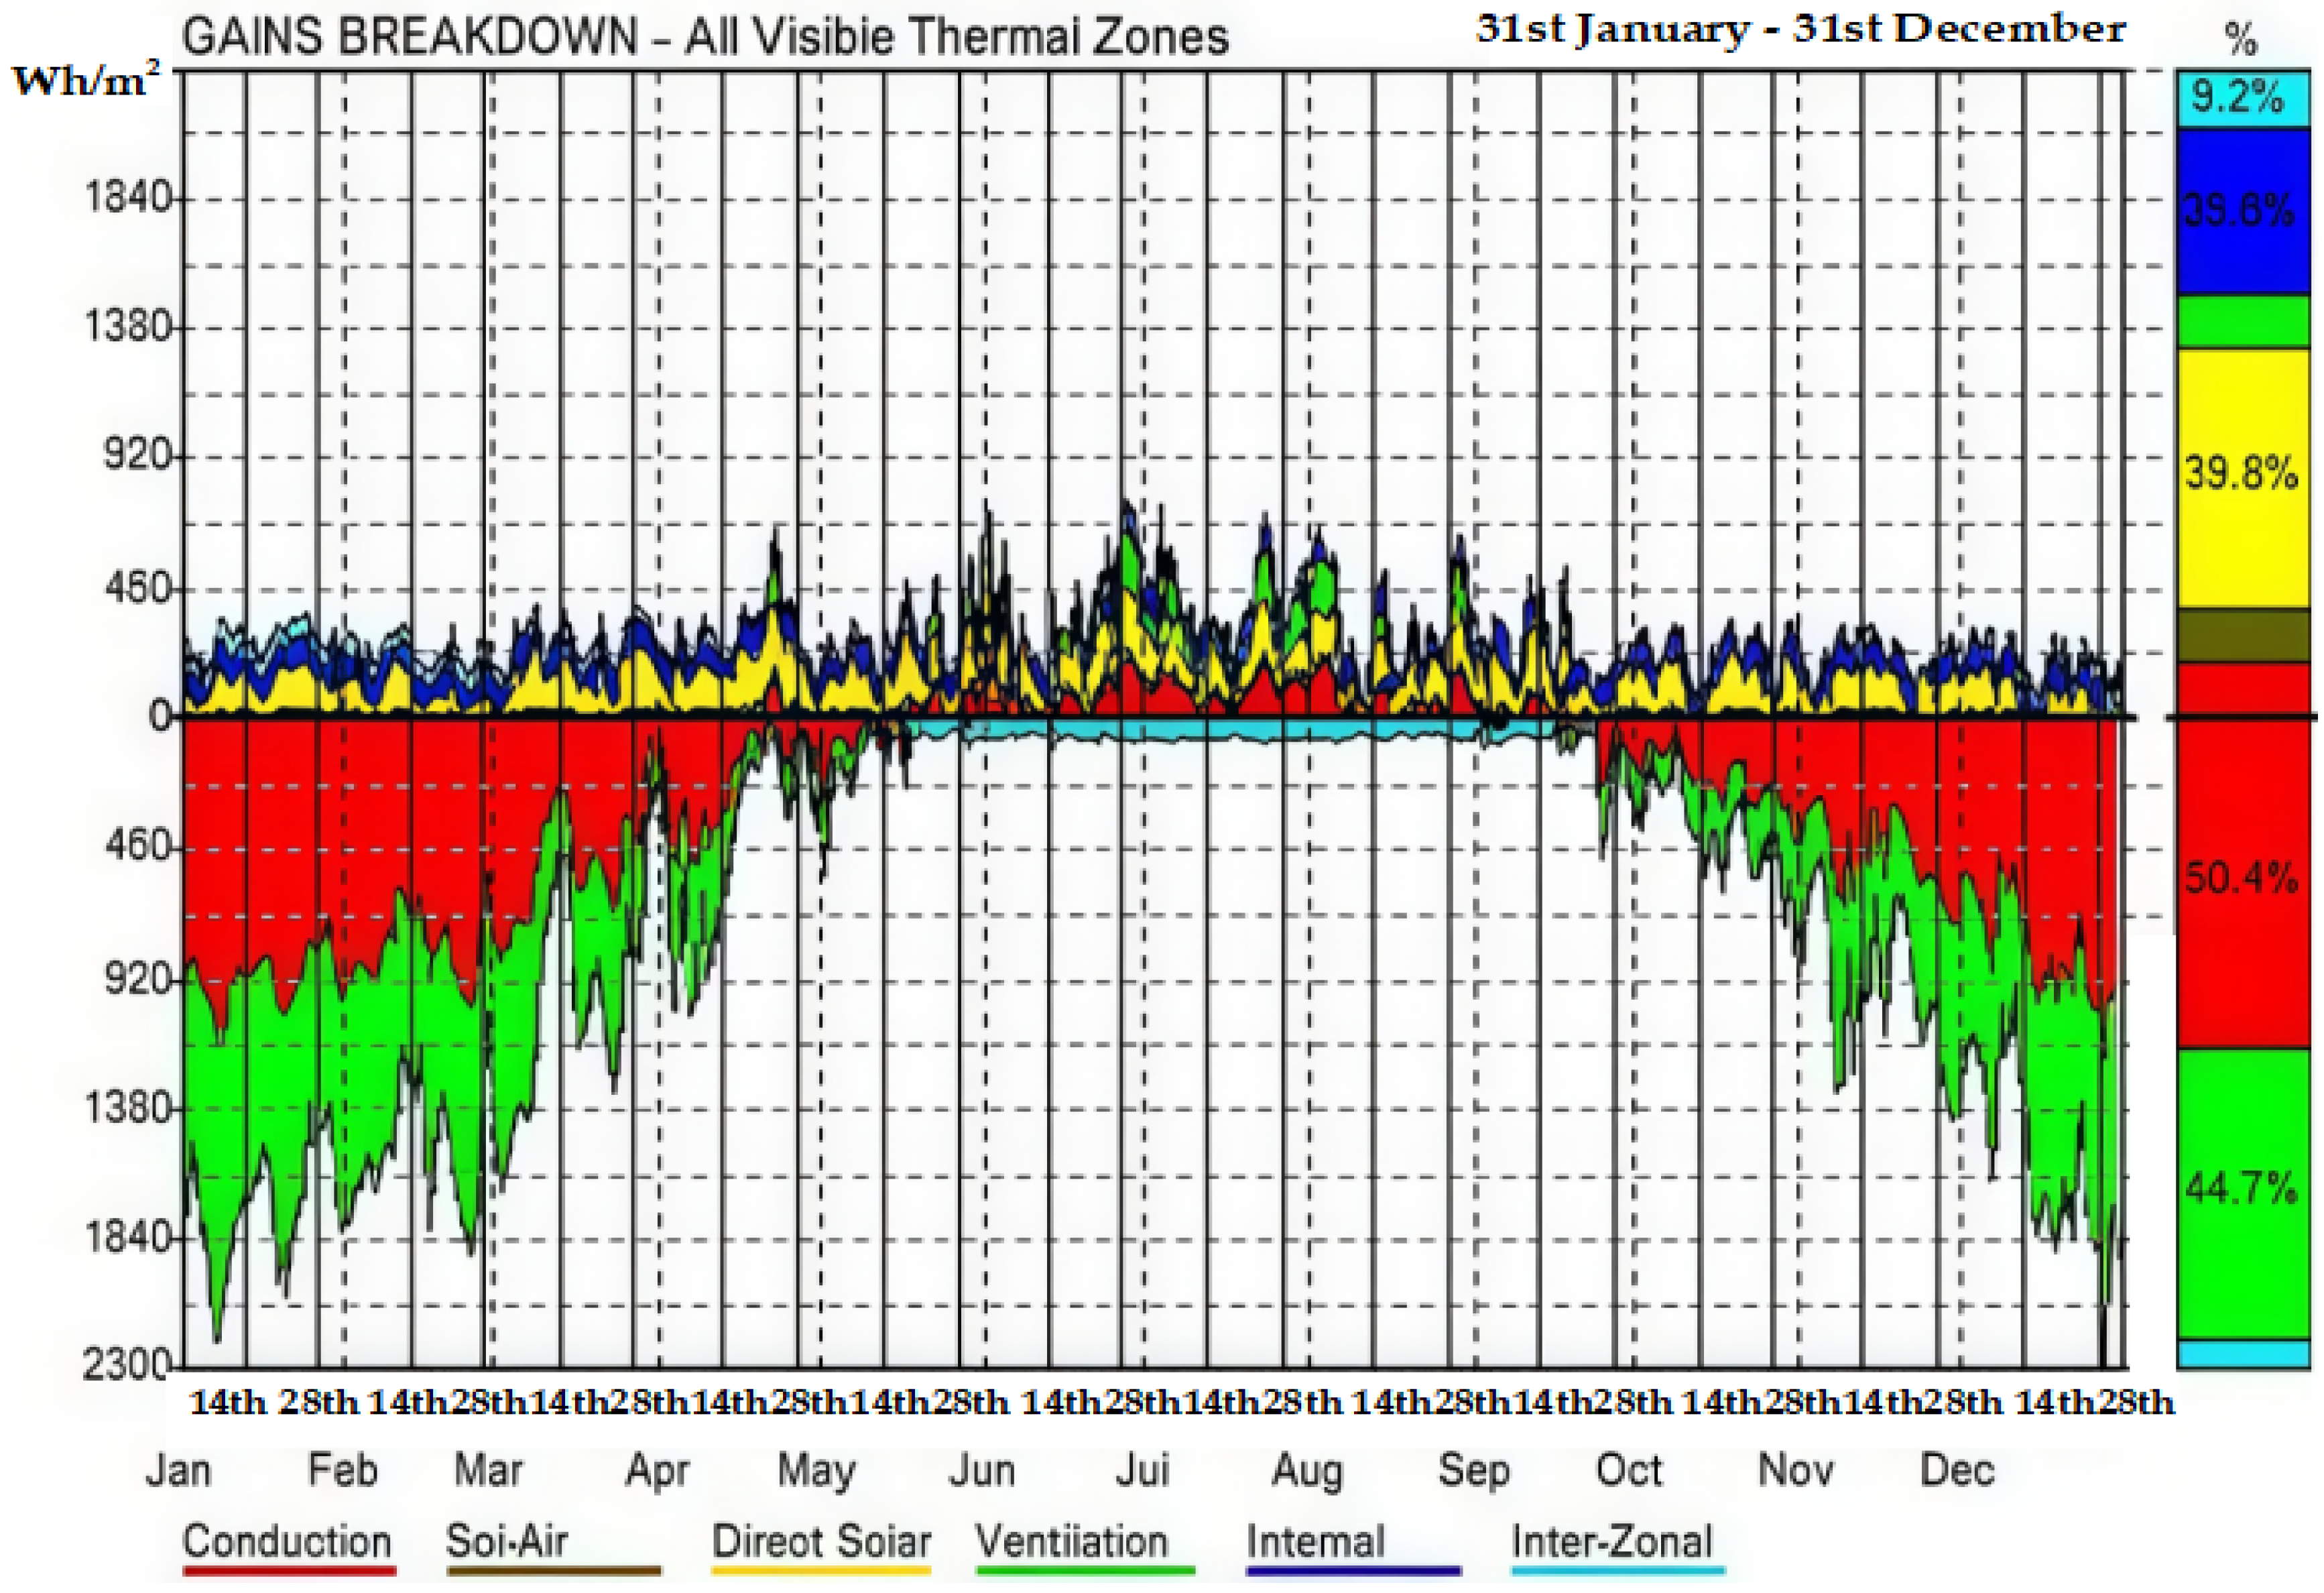
4.2. Heat and Energy Consumption Analysis

Based on the thermodynamic simulation advantages of Ecotect software, the study adopted a spatial zoning strategy to divide the building model into eight thermal sub-regions and successively defined the indoor environmental control parameters of each zone as the assessment benchmarks for thermal comfort and light environment [34,35,36]. By setting the heat transfer coefficients of the envelope structure in Experiment A (the U value of the exterior wall = 0.8 W/(m2·K), the U value of the exterior window = 3.0 W/(m2·K) and the U value of the roof = 1.2 W/(m2·K)) and the COP value of the variable frequency multi-split central air conditioning system (3.2 for cooling/2.8 for heating), it was compared with the heat transfer coefficients of the envelope structure set with different materials in Experiment B, U value of exterior wall = 0.35 W/(m2·K), U value of exterior window = 1.8 W/(m2·K) and U value of roof = 0.24 W/(m2·K). The COP value of the central air conditioning system is 3.2 for cooling and 2.8 for heating. This study explores the influence of different thermal parameters of the envelope structure on the annual energy consumption of the building. The comparison results of the experiments are detailed in Table 7.
By using Ecotect software, the thermal performance parameters of different envelope structures in the experiment were replaced, and the air conditioning energy consumption results of test A and B and the thermal analysis results of passive components were obtained as follows:
It can be seen from the data in Table 8 and Figure 6 and Figure 7 that optimizing the thermal performance of the building envelope can significantly improve the energy efficiency. Specifically, in a three-dimensional coordinated renovation scheme, this includes the addition of 100 mm rockwool insulation to the exterior wall (reducing the u value from 0.8 to 0.35 W/(m2·K)), upgrading the exterior window to Low-E double glazing (optimizing the u value to 1.8 W/(m2·K) and controlling the SHGC at 0.3), and installing 50 mm extruded polystyrene panels on the roof (increasing the u value to 0.4 W/(m2·K)). The energy-saving efficiency of the heating and cooling load on the air conditioning system is 25.3% and 23.6%, respectively. In addition, when combined with the 20.3% reduction in lighting energy consumption resulting from natural daylighting optimization, the total energy consumption ended up being reduced by 20.1%. This empirical study shows that the limitations of traditional energy saving techniques can be overcome through a comprehensive strategy of controlling the heat transfer coefficient of the envelope structure (U-value optimization rate of 39.7% to 40.6%) and managing solar heat gain (SHGC reduction to 60% of the baseline value). This method provides a quantifiable technical approach to improve the energy efficiency of green buildings, especially the low-carbon transformation of public buildings in hot summer and cold winter areas.

4.3. Noise Analysis

This study established a three-dimensional noise field model with 1 m × 1 m precision using the CadnaA acoustic modeling software(CadnaA 4.6), taking an eight-story public building (Total height of 32 m) as the research subject. A comparative acoustic experiment was conducted to analyze the combined sound environment consisting of 70 dB(A) traffic noise at 15 m from the main road and 55 dB(A) equipment noise from the outdoor air conditioning unit. Under the condition that the sound insulation performance of the walls, the NRC value of the gypsum board ceiling (NRC = 0.4) and other boundary conditions remained unchanged, two sound insulation schemes were designed for comparative analysis. In the C test, a single-layer glass window with Rw = 30 dB was used as the baseline condition; in the D test, the south-facing window system was upgraded to a double-layer argon-filled insulating glass window with Rw = 40 dB, and an additional sound insulation barrier for the outdoor air conditioning unit (noise reduction ≥ 10 dB) was installed to form the optimized condition (Table 9).
By utilizing the Ecotect software and performing replacement experiments with various sound insulation measures, the following monitoring results were obtained for the daytime period (from 7:00 to 22:00):
By analyzing the data in Table 9 and Table 10, it is evident that the D test, which utilized double-glazed insulating soundproof windows and installed sound barriers around the outdoor units of air conditioners, significantly outperformed the C test, which used single-layer glass. These measures effectively decreased the indoor noise levels. Specifically, the overall noise compliance rate in the C test was 65%, whereas after implementing these improvements, the compliance rate rose to 92%, demonstrating a marked enhancement.

4.4. Ventilation Analysis

This study employs the coupling analysis method of Ecotect environmental simulation and ANSYS Fluent CFD (2024 R2) to conduct an opening optimization comparison test for the “natural ventilation + mechanical assistance” composite ventilation mode in an eight-story public building during the transitional season. Under the condition of maintaining constant operating parameters of the all-air system (Air change rate of 2 times/hour, wind speed ≤ 0.3 m/s), two opening configuration scenarios are established. In the E test, a benchmark scheme with a 12% opening ratio on the south side is adopted (window height of 1.5 m without wind-guiding components); in the F test, an optimized scheme is developed by increasing the facade opening ratio to 20% (including 8% skylight area) and incorporating adjustable wind-guiding louvers, as well as an openable skylight in the atrium (Table 11).
By employing the Ecotect software and performing parametric substitution experiments with varying opening configurations, the following indoor ventilation results were obtained:
Based on the data analysis in Table 11 and Table 12, it is evident that compared to the E test’s benchmark scheme featuring a south-facing single-side opening ratio of 12% (window height of 1.5 m without wind-guiding components), the F test adopts an optimized design by increasing the facade opening ratio to 20% (including 8% skylight area) and incorporating adjustable wind-guiding louvers, as well as an openable atrium skylight. This approach significantly enhances indoor ventilation performance. Specifically, after optimization: the CO2 concentration in the south-facing offices decreases from 720 ppm to 550 ppm, representing a 23.61% increase in ventilation efficiency; the CO2 concentration in the central meeting room drops from 850 ppm to 620 ppm, corresponding to a 27.06% improvement in ventilation efficiency; and the CO2 concentration in the corridor falls from 680 ppm to 570 ppm, indicating a 16.17% enhancement in ventilation efficiency. These findings demonstrate that increasing the opening ratio and integrating skylights effectively reduces CO2 concentrations, providing valuable insights for green building design.

4.5. Green Degree Evaluation

Based on the “Green Building Evaluation Standard” GB/T 50378-2019 [39] and the BIM simulation analysis results of the project, this study developed an evaluation system comprising 4 first-level indicators and 19 s-level indicators through expert consensus-based decision making. Additionally, the importance and scoring criteria for each indicator were quantified (see Table 13) to provide a data-driven approach for assessing the green performance of the building. The core methodologies and data sources are outlined as follows:
In accordance with relevant national standards, such as GB50189-2015 “Energy Efficiency Design Standard for Public Buildings” and others [40], the benchmark values of each secondary indicator are clearly defined. The actual values of each secondary indicator are obtained through the assessment results of BIM software and green building analysis software. The calculation is carried out according to the formula: Score = 100 − (Benchmark Value − Actual Value)/Benchmark Value × 100. Finally, the data of the primary indicators in Table 14 are converted through the above method.
The hierarchical evaluation system results indicate that after adjusting the core indicators of building quality and environmental load with weight coefficients, their actual scores are derived through normalization using Formulas (3) and (4). Subsequently, Formula (5) is applied to calculate the comprehensive green performance index, yielding a score of 4.76. In accordance with the green degree classification standard outlined in Table 2 and corroborated by relevant scholarly research [41,42,43], this building achieves an excellent green rating. This demonstrates that the building satisfies the three-star certification requirements for green buildings across key dimensions such as resource conservation and environmental friendliness.

5. Conclusions

This study systematically verified the significant effect of data-driven strategies on the performance optimization of green buildings by integrating BIM and digital performance simulation tools and revealed three conclusions:
(1) The collaborative design of architectural form and envelope structure can break through the traditional energy efficiency bottleneck. By adopting external wall insulation (U = 0.35 W/(m2·K)), Low-E glass (SHGC = 0.3) and roof insulation technology, combined with the south-facing lighting layout (C ≥ 2.0 area accounting for 83%), a reduction of over 20% in air conditioning load and a decrease of 23.1% in total energy consumption is achieved.
(2) The refined control of the window opening rate (20%) and the proportion of skylights (8%) significantly improved the natural ventilation efficiency (air change rate ≥ 2 times/h), reduced the CO2 concentration in the south office area by 23.6–27.1% and resolved the contradiction between thermal comfort and air quality.
(3) The passive noise reduction system composed of double soundproof windows and sound barriers, in coordination with the mechanical system regulation, increased the noise qualification rate by 27 percentage points to 92%, confirming the crucial role of multi-objective coordinated control in indoor environmental health.
The research has established three major technical paths. The first one is that the interactive performance simulation based on BIM can accurately quantify the coupling effect of light, heat and wind. Secondly, the thermal parameters of the envelope structure need to be optimized in a directional manner in combination with the spatial functions (such as in the south-facing lighting sensitive area). Thirdly, the integration of ventilation and noise reduction technologies is a necessary means to achieve the standards of healthy buildings. This achievement provides clear technical guidance for the development of green buildings; by using digital tools to precisely control performance parameters, relying on spatial function-oriented envelope structure optimization strategies, and integrating multi-system collaborative control technologies, it can simultaneously achieve energy consumption control targets of over 23% energy savings and healthy building environment indicators. The research has confirmed that data-driven collaborative design methods can substantially promote the carbon neutrality process in the construction field. It is suggested that BIM performance simulation be incorporated into the green building standard system and the in-depth application of machine learning algorithms in parametric design and dynamic performance optimization be promoted.

Author Contributions

Conceptualization, M.Z.; methodology, M.Z. and Y.Y.; validation, M.Z.; formal analysis, M.Z.; investigation, M.Z. and S.D.; data curation, M.Z. and Y.Y.; writing—original draft preparation, M.Z.; writing—review and editing, M.Z. and S.D.; visualization, M.Z. and Y.Y.; supervision, Y.Y.; project administration, M.Z.; funding acquisition, M.Z. All authors have read and agreed to the published version of the manuscript.

Funding

This research received no external funding.

Data Availability Statement

The data used in this study can be obtained from the corresponding authors.

Acknowledgments

The authors want to thank the editor and anonymous reviewers for their valuable suggestions for improving this paper.

Conflicts of Interest

The authors declare no conflicts of interest.

References

  1. Zhao, W. Performance and Information Technology in Green Building Design. Urban Archit. 2015, 188–189, 257. [Google Scholar]
  2. Wang, C. Development Comparison and Optimization Suggestions of Green Building and Low-Carbon Building Evaluation Systems in China. Archit. Sci. 2023, 39, 235–244. [Google Scholar]
  3. Amirebrahimi, S.; Rajabifard, A.; Mendis, P.; Ngo, T. A framework for microscale flood damage assessment and visualization for a building using BIM-GIS integration. Int. J. Digit. Earth 2016, 9, 363–386. [Google Scholar] [CrossRef]
  4. Aizezi, G.; Yuan, X.; Lin, Y.; Zheng, A.; Pang, X.; Zhang, W. Research on the calculation method of the full life cycle carbon emissions of an office building based on BIM model. Intell. Build. Smart City 2025, 3, 103–106. [Google Scholar]
  5. Chen, Y.; Kang, H.; Fan, Y. Test and evaluation of interoperability between building information model and green building analysis software based on IFC and gbXML standards. J. Graph. 2018, 39, 530–537. [Google Scholar]
  6. Chen, Y.; Fan, Y. Research on data standards and applications of green building information model based on IFC and gbXML standards. Inf. Technol. Civ. Eng. Archit. 2018, 10, 9–15. [Google Scholar]
  7. Gourlis, G.; Kovacic, I. Building Information Modelling for analysis of energy efficient industrial buildings–A case study. Renew. Sustain. Energy Rev. 2017, 68, 953–963. [Google Scholar] [CrossRef]
  8. Ryan, M.E.; Sanquist, F.T. Validation of building energy modeling tools under idealized and realistic conditions. Energy Build. 2012, 47, 375–382. [Google Scholar] [CrossRef]
  9. Cho, C.S.; Chen, D.; Woo, S. Building information modeling (BIM)-Based design of energy efficient buildings. In Proceedings of the 28th International Symposium on Automation and Robotics in Construction, Seoul, Republic of Korea, 29 June–2 July 2011; pp. 1079–1084. [Google Scholar]
  10. Ye, J.L.; Chen, J.; Li, Y.Y. Research on BIM Design Method for Rural Houses Based on the Coupling of Life-cycle Carbon Emissions and Costs. J. Xi’an Univ. Archit. Technol. (Nat. Sci. Ed.) 2025, 57, 124–132. [Google Scholar]
  11. Numan, M.Y.; Almaziad, F.A.; AI-Khaja, W.A. Architectural and urban design potentials for residential building energy saving in the Gulf region. Appl. Energy 1999, 64, 401–410. [Google Scholar] [CrossRef]
  12. Wong, N.H.; Jusuf, S.K.; Syafii, N.I.; Chen, Y.; Hajadi, N.; Sathyanarayanan, H.; Manickavasagam, Y.V. Evaluation of the impact of the surrounding urban morphology on building energy consumption. Sol. Energy 2011, 85, 57–71. [Google Scholar] [CrossRef]
  13. Perez-Garcia, A.; Martin-Dorta, N.; Aranda, J.A. BIM requirements in the Spanish public tender—Analysis of adoption in construction contracts. Buildings 2021, 11, 594. [Google Scholar] [CrossRef]
  14. Cheng, Z.; Chen, J.; Sun, X.; Hammad, A. Lifecycle evaluation of building sustainability using BIM and RTLS. In Proceedings of the 2014 Winter Simulation Conference, Savannah, GA, USA, 7–10 December 2014; IEEE: New York, NY, USA; pp. 3236–3247. [Google Scholar]
  15. Shen, X.; Hu, W.; Xiao, Y.; Li, M.; Xue, M.; Wang, J. Energy consumption calculation and analysis of a green building simulation in Chongqing. Civ. Archit. Environ. Eng. 2013, 35, 177–180. [Google Scholar]
  16. Li, L.; Zhang, L.; Liu, G.; Liu, S.; Zheng, S. Numerical simulation analysis of wind environment of a green building. Civ. Archit. Environ. Eng. 2015, 37, 215–218. [Google Scholar]
  17. Yan, C. Secondary Development and Application of Building Model Information Based on Revit. Master’s Thesis, North University of China, Taiyuan, China, 2020. [Google Scholar]
  18. Amani, N. Building energy conservation in atrium spaces based on ECOTECT simulation software in hot summer and cold winter zone in Iran. Int. J. Energy Sect. Manag. 2018, 12, 298–313. [Google Scholar] [CrossRef]
  19. Fang, Z.; Wang, X.; Huang, Q.; Pang, Z. Simulation analysis of greenhouse environmental parameters based on Ecotect. J. Trop. Biol. 2016, 7, 99–103. [Google Scholar]
  20. Raja Muhammad Rooshdi, R.R.; Nazarrudin, N.A.; Ismail, N.A.A.; Sahamir, S.R.; Marhani, M.A. Challenges of implementing building information modeling (BIM) in green assessment tools. In Proceedings of the IConBEE 2022, Putrajaya, Malaysia, 18–19 October 2023. [Google Scholar]
  21. Qian, Q.Z.; Wang, Y.X. Application of Multi-level Extension Comprehensive Evaluation Method in Green Building Evaluation. J. Eng. Manag. 2014, 28, 11–16. [Google Scholar]
  22. He, Y.E.; Ding, Y. Comparison of Key Elements for Energy-saving Benefit Evaluation in International Typical Green Building Evaluation Systems. HVAC 2016, 46, 79–86. [Google Scholar]
  23. Yang, W.L. Energy Consumption Evaluation of Green Buildings Based on BIM Technology. Urban Dev. Res. 2016, 23, 14–17. [Google Scholar]
  24. Wang, Z.S.; Wang, L.G. Research on the Evaluation and Certification System of Green Degree of Building Materials under the Background of Green Buildings. Constr. Econ. 2015, 36, 108–112. [Google Scholar]
  25. Chen, H.Y.; Xu, G.; Wu, X.G.; Wang, X.Y.; Zhang, L.M. Research on Information-based Design and Green Degree Evaluation of Green Buildings Based on BIM. Build. Technol. 2019, 50, 996–1000. [Google Scholar]
  26. Zhang, C. Research on the Construction of Evaluation Standards for the Green Degree of Structural Systems and Qualitative Analysis. Master’s Thesis, Liaoning Technical University, Fuxin, China, 2012. [Google Scholar]
  27. Li, T.; Xu, G.; Chen, H.; Wu, X.; Wang, X. Evaluation and analysis of green degree of green buildings based on BIM technology. Constr. Technol. 2020, 49, 113–117. [Google Scholar]
  28. Zhan, C.; Xu, L.; Lin, L.; Song, W.; Qi, X.; Xu, W.; Yang, X. Pre-evaluation of performance of green hospital buildings based on BIM-lementary particle. J. Civ. Eng. Manag. 2022, 39, 80–87+107. [Google Scholar]
  29. Li, T.; Xu, G.; Chen, H.; Wu, X.; Wang, X. Green building green degree evaluation based on BIM technology analysis. J. Constr. Technol. 2020, 49, 113–117. [Google Scholar]
  30. Arranz, B.; Rodriguez-Ubinas, E.; Bedoya-Frutos, C.; Vega-Sánchez, S. Evaluation of three solar and daylighting control systems based on Calumen II, Ecotect and Radiance simulation programs. Energy Build. 2014, 83, 225–236. [Google Scholar] [CrossRef]
  31. Li, Z.; Wang, L.; Zhang, H. Research on the natural light environment of office spaces with photovoltaic glass: A case study of Tianjin. J. Light. Eng. 2015, 1, 23–28. [Google Scholar]
  32. ISO/CIE 19776:2014; Illuminance of Outdoor Work Places. International Organization for Standardization (ISO): Geneva, Switzerland, 2014.
  33. GB/T 50033-2021; Architectural Daylighting Design Standard. Ministry of Housing and Urban-Rural Development of the People’s Republic of China: Beijing, China, 2021.
  34. Chen, F.; Li, W.; Liao, S.; Gong, G. Simulation research on the thermal pipe air conditioning system of data centers: Based on thermodynamic simulation software CYCLPAD. Clean Air Cond. Technol. 2020, 4, 27–33. [Google Scholar]
  35. Wang, Z.; Xiong, W.; Liu, Y.; Jiang, C.; Zhu, C. Research on energy-saving application schemes of thermal pipe-cold storage air conditioning systems in data centers. Refrig. Air Cond. 2015, 35, 71–7480. [Google Scholar]
  36. Chen, F.; Gao, H. Thermodynamic study on waste heat recovery system of internal combustion engine based on Kalina cycle. J. Eng. Thermophys. 2020, 41, 271–276. [Google Scholar]
  37. GB/T 55038-2025; Introduction to the National Standard GB/T 55038-2025 (2025 Edition). Residential Project Specifications: Beijing, China, 2025.
  38. GB/T 18883-2022; Introduction to the National Standard GB/T 18883-2022 (2022 Edition). Indoor Air Quality Standards: Beijing, China, 2022.
  39. GB/T 50378-2019; Introduction to the National Standard GB/T 50378-2019 (2024 Edition). Green Building Evaluation Standard: Beijing, China, 2019.
  40. GB50189-2015; National Standard “Energy Efficiency Design Standard for Public Buildings”. China Architecture & Building Press: Beijing, China, 2018; pp. 39–45.
  41. Cheng, Y.; Shi, J.; Zhao, X.; Zhao, W.; Liu, Q.; Liu, H. Comprehensive assessment of green degree of building material using fuzzy AHP. In Frontiers of Green Building, Materials and Civil Engineering; Trans Tech Publications: Wollerau, Switzerland, 2011; pp. 765–773. [Google Scholar]
  42. Lv, Z.; Tang, J.; Zhang, J.; Lin, H. Space loop sunlight in a collection of residential in Dalian by the Autodesk Ecotect contrast group application. In Proceedings of the Dadt 2013, Beijing, China, 28 September 2013; pp. 158–168. [Google Scholar]
  43. Li, Y.; Lin, C. Green building design method based on BIM technology: A case study of Nanning Urban Planning Exhibition Hall. HVAC Refrig. 2012, 42, 50–53. [Google Scholar]
Figure 1. Framework of the technical route.
Buildings 15 01819 g001
Figure 2. Project construction location diagram.
Buildings 15 01819 g002
Figure 3. BIM Information Model Diagram.
Buildings 15 01819 g003
Figure 4. Analysis of indoor lighting.
Buildings 15 01819 g004
Figure 5. Sunlight Analysis Diagram.
Buildings 15 01819 g005
Figure 6. Changing trend in air conditioning energy consumption results.
Buildings 15 01819 g006
Figure 7. Thermal analysis of passive components.
Buildings 15 01819 g007
Table 1. Evaluation Index System for the Green Degree of Green Buildings.
Primary Indicators ( Weight   ω i ) Secondary Indicators
( Weight   ω i j )
Classification Number
Light environment (L1, Q1)The daylight factor complies with the national standard “Standard for Daylighting Design of Buildings”.Q11
The daylighting rate complies with the national standard “Standard for Daylighting Design of Buildings”.Q12
Sunshine durationQ13
The indoor illuminance complies with the national standard “Code for Lighting Design of Buildings”.L11
Sun shading measures for exterior windowsQ14
The surface reflectance of the main functional rooms indoors complies with the national standard.Q15
Thermal environment (L2, Q2)Direct solar radiation timeQ21
Diffuse solar radiation timeQ22
The heating facilities comply with the national standards.L21
The annual heat gain of the indoor spaceQ23
The thermal performance of the interior walls and floor slabs complies with the national energy-saving standards.L22
The energy efficiency of the cooling and heating source units of the air conditioning system is superior to the national standards.L23
Wind environment
(Q3)
Dominant wind directionQ31
The operable parts of exterior windows and glass curtain walls can provide good ventilation for the building.Q32
Building orientationQ33
Acoustic environment (Q4)The noise level of the main functional rooms complies with the national standards.
“Code for Sound Insulation Design of Civil Buildings”Q41
The noise level conforms to the national noise zoning standards.Q42
The sound insulation performance of interior walls, floor slabs and doors and windows complies with the national standards.
“Code for Sound Insulation Design of Civil Buildings”Q43
Sound insulation and noise reduction measures are adopted.Q44
Table 2. Greenness Grading Standards.
Rating Greenness   Value   ( α )
Excellent(≥3.0)
Good(1.5–3.0)
Average(1.0–1.5)
Relatively poor(0.5–1.0)
Poor(≤0.5)
Table 3. Parameters of the Basic Model.
Parameter NameParameter ValueNote
Number of
building floors
8th floorThe floor height is 4 m. Total height 32 m.
Functional areasOffice (60%), Corridor (20%), Conference room (15%), Equipment room (5%)The functional distribution of each floor is consistent. The area of each floor is 800 square meters.
Window-to-floor ratio1:6 (Southward), 1:8 (Northward)The VLT of the glass is 0.6.
Reflectivity of the envelope structureExternal walls 0.65, roof 0.50, floor 0.30Reflectivity of the envelope structure
Light climate parametersK = 1.1, outdoor critical illuminance 4500 lxWuhan belongs to the IVth light climate zone.
Simulation grid accuracy0.5 m × 0.5 mEcotect grid division
Sky modelCIE overcast sky modelDynamic correction based on TMY meteorological data
Table 4. Results of Daylighting Analysis.
Functional
Area
Lighting Coefficient
(C)
Achievement Rate
(C ≥ 2.0)
Illumination Uniformity (Emin/Emax)
Office (South)2.485%0.68 → 0.72
Office (North)2.178%0.55 → 0.65
Corridor1.240%0.30 → 0.35
Conference Room (South)2.692%0.70 → 0.75
(Note: Emin and Emax are the minimum and maximum illuminance values within the area, respectively).
Table 5. Meteorological Data Table of Wuhan on the Winter Solstice.
TimeDry Bulb Temperature (°C)Relative Humidity (%)The Amplitude of Direct Sunlight (W/m2)Solar Scattering Amplitude (W/m2)Wind Speed (m/s)
8:005702001004.0
10:008604501805.5
12:0010505502206.5
14:009484001755.3
16:00665150804.0
18:00280002.6
Table 6. Analysis Table of Sunlight Error.
ParameterAnalog ValueMeasured ValueError Rate
The daylight factor of the south-facing office2.42.34.3%
Sunshine duration on the Winter Solstice (1st floor)2.5 h2.4 h4.0%
Uniformity of illuminance (conference room)0.750.724.0%
Table 7. Parameter Settings of Energy Consumption Analysis Model.
Parameter NameParameter Value
(A Test)
Parameter Value
(B Test)
Note
Building floor count8th floor8th floorFloor height: 4 m
Total construction area: 12,800 m2
Thermal performance of building envelopeExternal wall U-value = 0.8 W/(m2·K)
Exterior windows U-value = 3.0 W/(m2·K)
Roof U-value = 1.2 W/(m2·K)
External wall U-value = 0.35 W/(m2·K)
Exterior windows U-value = 1.8 W/(m2·K)
Roof U-value = 0.4 W/(m2·K)
The exterior wall of Test A is made of concrete and cement mortar, while Test B features a 100 mm rock wool insulation layer. The SHGC for single-pane glass is 0.7 in Test A and 0.3 in Test B. Test A lacks roof insulation, while Test B features a 50 mm extruded polystyrene board.
(In Test B, the glass adopted the low-emissivity (Low-E) coating technology).
Air conditioning systemVariable frequency multi-split air conditioning system (COP = 3.2/2.8)Variable frequency multi-split air conditioning system (COP = 3.2/2.8)Design temperature: 26 °C in summer and 20 °C in winter.
Simulation grid accuracyZone-by-zone hourly load analysisZone-by-zone hourly load analysisEcotect + EnergyPlus
Table 8. Energy consumption simulation results table.
Energy Consumption
Type
Annual Energy Consumption
(A Test)
Annual Energy Consumption
(B Test)
Energy-
Saving Rate
Standard Limit Value
Air conditioning cooling load (kWh/m2)39.229.325.3%≤75 (Three-star)
Air conditioning heat load (kWh/m2)64.5849.3223.6%≤40 (Three-star)
Energy consumption for lighting (kWh/m2)18.214.520.3%≤15 (Three-star)
Total energy consumption (kWh/m2)121.9893.1223.1%≤130 (Three-star)
Table 9. Parameter settings of the noise analysis model.
Parameter NameParameter ValueNote
Building floors count8th floorFloor height: 4 m
The main
noise sources
Traffic noise (daytime equivalent sound level Leq = 70 dB(A)), equipment noise (air conditioning outdoor unit Leq = 55 dB(A))The main road is 15 m away from the building facade.
Sound insulation measures(C test)Single-pane glass window (weighted sound insulation Rw = 30 dB)The sound insulation of the wall
Rw = 45 dB.
Sound insulation measures(D test)Double-layer hollow soundproof window
(Rw = 40 dB)
The south-facing windows will be replaced with double-pane soundproof windows (Rw = 40 dB, filled with argon gas); sound insulation barriers will be added to the outdoor air conditioner units (Noise reduction ≥ 10 dB).
Sound-absorbing materialsOrdinary gypsum board ceiling
(NRC = 0.4)
____
Simulation grid accuracy1 m × 1 mCadna A acoustic model
Table 10. Results of daytime noise analysis.
Functional AreaNoise Level in the C Test Room Leq [dB(A)]Noise Level in the D Test Room Leq [dB(A)]Standard Limit Value
South-facing office (fronting the street)4838≤40 (GB 55038-2025) [37]
North-facing office (back street)4235≤40 (GB 55038-2025)
conference room4032≤35 (GB 55038-2025)
Corridor4537≤45 (GB 55038-2025)
Overall compliance rate65%92%
Table 11. Parameter settings for ventilation analysis model.
Parameter NameParameter ValueNote
Ventilation modeNatural ventilation + mechanical assistanceNatural ventilation is mainly used during the transitional seasons.
Open mouth design
(E test)
South-facing single-sided window opening (Area ratio: 12%)The window is 1.5 m high and has no wind deflector.
Open mouth design
(F test)
The opening rate has been
increased to 20%.
The skylight area accounts for 8%.
Add adjustable louvered vents to the south-facing side, and install operable skylights on the top of the atrium.
Air conditioning systemAll-air system (air change rate: 2 times per hour)Design wind speed ≤ 0.3 m/s
Simulation toolEcotect + ANSYS FluentCFD air flow organization analysis
Table 12. Ventilation analysis results.
Functional AreaAir Change Rate (Times per Hour)
E Test
Air Change Rate (Times per Hour)
F Test
The Concentration of CO2
(ppm)
Standard Limit Value
South-facing office1.21.2720 → 550≤800 (GB/T 18883-2022) [38]
Middle conference room0.80.8850 → 620≤800 (GB/T 18883-2022)
Corridor1.51.5680 → 570____
Table 13. Weights and scores of the green building index system.
Primary IndicatorsSecondary IndicatorsIndicator TypeIndicator Assignment
Methods
Weighting FactorScore
Light environment (L1, Q1)Q11Scoring itemsDaylighting and Sunlight Exposure0.1100
Q12Scoring itemsDaylighting and Sunlight Exposure0.2100
Q13Scoring itemsDaylighting and Sunlight Exposure0.2100
L11Control itemIllumination0.380
Q14Scoring itemsSpatial visualization0.140
Q15Control itemSet the wall material in the BIM model.0.1100
Thermal environment (L2, Q2)Q21Scoring itemsSolar radiation0.2100
Q22Scoring itemsSolar radiation0.293
L21Scoring itemsIndoor temperature0.2100
Q23Scoring itemsHeat environment loss0.183
L22Control itemSet the wall material in the BIM model.0.281
L23Control itemIndoor air conditioning distribution0.1100
Wind environment
(Q3)
Q31Scoring itemsAirflow simulation0.357
Q32Control itemwindow-to-wall ratio0.480
Q33Scoring itemsWeather tool software simulation0.395
Acoustic environment (Q4)Q41Scoring itemsTime simulation0.3100
Q42Scoring itemsTime simulation0.3100
Q43Control itemSet the wall material in the BIM model.0.225
Q44Scoring itemsMaterial usage, site greening0.280
Table 14. Weights and scores of first-level indicators for green buildings.
Primary IndicatorSecondary
Indicator
Weight
Coefficient
Score
Lighting analysis L 1 1 0.1524
Q 1 1 0.2064
Energy consumption analysis L 2 1 0.1546
Q 2 1 0.2047
Ventilation analysis Q 3 1 0.2078
Noise analysis Q 4 1 0.1081
Disclaimer/Publisher’s Note: The statements, opinions and data contained in all publications are solely those of the individual author(s) and contributor(s) and not of MDPI and/or the editor(s). MDPI and/or the editor(s) disclaim responsibility for any injury to people or property resulting from any ideas, methods, instructions or products referred to in the content.

