Abstract
While building the steel–concrete composite girder bridge by means of the incremental launching method, the steel box is directly in the sunlight, and the temperature impact should not be neglected. However, the existing specifications fail to offer the temperature gradient pattern applicable to the steel box featuring a significant height–width ratio and straight web. This paper, relying on the Fenshui River Bridge situated in the southwest region of China, carried out a temperature test. By analyzing the experimental data, the rules of temperature changes at the measuring points in various positions of the steel box were studied, and the temperature disparities of the steel box across different seasons were contrasted. Through the analysis of the test data, the rule governing temperature distribution across the height dimension of the cross-section and its change with time were studied, and a model designed to represent the temperature gradient within the steel box was put forward. By utilizing the numerical model, the effect of the temperature gradient on the force acting on the structure in the process of incremental launching was analyzed. The findings indicate that the temperature of the top plate of the steel box is the highest from 14:00 to 16:00. There is a lag phenomenon in the temperature rise in the bottom plate. The greatest temperature disparity between the upper and lower plates of the steel box is not always present in the season when the temperature is comparatively high. The curve of temperature gradient change exhibits nonlinear features, and the variation in temperature is considerable within the scope of 1 m. In this article, a double-broken line temperature gradient model is put forward, with the corresponding temperature gradient of 17.8 °C. The temperature gradient obviously affects the structural stress, changing the stress distribution, and it notably impacts the deformation. The deformation generated on the guide beam due to the temperature gradient makes up 39% of the total deformation. The temperature gradient is not a fixed value. When the steel box girder is under the jacking process, especially while the structure remains in its maximum cantilever condition and is about to cross the pier, the time should be avoided when the temperature gradient is at its highest.
1. Introduction
The composite bridge is such that the steel box or steel truss is linked to the concrete bridge deck via shear connectors. These two components bear the load together and exhibit excellent mechanical properties. The construction using the incremental launching technique is a frequently adopted approach for bridges [1]. In the process of jacking construction, the steel beam usually has no pavement layer or concrete slab covering it, and it is in a bare state. However, the steel structure has good thermal conductivity and is relatively sensitive to temperature changes. Thus, in the construction of the steel beam, because there is no pavement layer to cover it, the influence of solar illumination on the temperature effect of the steel beam is remarkably noticeable [2,3]. A relatively large temperature gradient is likely to generate a temperature gradient effect vertically in the structure, thus causing the structure to produce relatively large temperature internal forces and deformations, which affects the structural safety [4,5]. Assisting the construction technique of incremental launching of the steel beam with pylons and stay cables further expands the incremental launching span. Hence, over the course of the incremental launching, the thermal gradient effect of the steel girder should not be overlooked.
The thermal effect on bridges has attracted significant attention from numerous scholars. Zhang et al. [6] regarded the H-shaped concrete bridge tower as an object of study and probed into its temperature distribution in the plateau and extremely cold area, along with the impact of the thermal disparity on the force-bearing of the bridge tower. The outcomes drawn from the study convey that the actual thermal disparity of the structure is far greater than the value suggested by the specification. The temperature disparity surpasses 20 °C, and it leads to the deviation of the bridge tower exceeding 40 mm. Tong et al. [7] set up an emulation model of the thermal effect of solar radiation of the steel girder and deliberated on the impacts that diverse parameters have on the thermal distribution. Liu et al. [8] made experimental explorations on the thermal field of the I-shaped steel beam and analyzed how geometric parameters impact the temperature field exposed to sunlight. However, I-shaped cross-sections are hardly adopted for steel beams with a span exceeding 100 m. Huang et al. [9] carried out a test on the thermal field of the steel beam with wrinkled steel webs under solar radiation and derived the distribution rule of the uneven thermal field impacted by the sun’s radiation. The simulation model for the thermal field of the steel girder with corrugated steel webs under solar radiation was set up, and the precision of the model was validated by making use of the experimental data. Li et al. [10] studied the distribution pattern of the thermal field of the unpaved steel track girder. Through the temperature observation of the experimental model for three months, it was inferred that the maximum temperature gradient occurred between 12:00 and 16:00 and was located on the web plate shielded by the top plate. The curve of the temperature gradient was obtained by means of data fitting. Teng et al. [11] studied the thermal gradient of the steel box with a pavement layer and presented the on-site measurement results in the weather conditions with high temperatures and intense solar radiation. It was pointed out that the pavement thickness affects the steel box’s temperature, yet the impact values of varying thicknesses of the pavement layers on the thermal gradient have not been provided. Fan et al. [12] used a baking lamp, instead of the sun, indoors to examine the impact of thermal radiation on the thermal field of components and proposed a temperature model to reflect the changing rule of the thermal field of components. Xiang et al. [13] discussed the thermal field of the composite structure and proposed a calculation model. This model could effectively forecast the rules of temperature changes in the composite structure. Kim et al. [5] made an investigation into the uneven temperature distribution and temperature difference effect formed under solar radiation of the curved steel box girder bridge. They analyzed the pattern of temperature fluctuation of the cable-stayed bridge with the steel box girder during the construction process using the three-dimensional temperature distribution. Li et al. [14] studied the thermal fields at different positions of the composite beam, identified the key factors influencing the temperature field, and examined the effect of the temperature gradient on the deformation and stress of the main beam. Elshoura et al. [15] studied the thermal distribution pattern of concrete bridges and revealed that the thermal gradient can cause the redistribution of the support reactions, thus influencing the structural stress situation. Ngo et al. [16] investigated the temperature effect of concrete bridges with a relatively large cross-sectional width and indicated that the transverse temperature gradient exerts a remarkable effect on the stress condition of the box webs. Lawson et al. [17] examined the thermal field and temperature stress of the steel–concrete composite main girders. Nevertheless, the numerical analysis involves numerous influencing factors, and it is challenging to ascertain some of the parameters. The findings of the research require validation through an actual bridge. Ding et al. [18], relying on the long-term temperature data monitored for the flat steel box girder, carried out an analysis of the non-uniform thermal distribution of the steel box and put forward a thermal difference model of the cross-section. Liu et al. [19] conducted research on the temperature effect of concrete arch bridges. According to the test data, they put forward a multi-segment linear thermal gradient model and analyzed how the temperature effect affects the force-bearing of the arch structure. The scholars mentioned above have carried out numerous explorations of the temperature effects of different kinds of bridges. Nevertheless, the cross-sections of the steel beams in these studies all feature large widths and possess a considerable quantity of internal vertical webs. Moreover, the paving layer atop the steel box or the flange plate exerts a shielding influence on the web plate. There is relatively little research on the temperature of the straight web steel box without a flange plate. In addition, studies regarding the impact of temperature during the process of the incremental launching construction of bridges are also quite limited.
Only the following several scholars have conducted research on this issue. For example, Sun et al. [20] investigated the influence of the thermal gradient effect on the force-bearing capacity of the structure in the incremental launching construction of the steel beam, featuring multiple box chambers. Li et al. [21] studied the temperature effect of the steel girder with a relatively large cross-sectional width. Grounded in the measured data, they determined the thermal field of the steel girder under sunlight and analyzed the stress and vertical displacement of the steel box girder throughout the incremental launching procedure through a numerical model. Li et al. [22] investigated the changing rules of the steel beam’s temperature field in various weather states and different seasons and presented a formula for calculating the temperature variation with time throughout the day, which has amassed data for setting the thermal gradient’s value of the steel box during construction. The cross-sections of the steel beams studied by the above-mentioned scholars also have the characteristics of large width and a relatively large number of internal vertical webs. In addition, over the course of the bridge’s incremental launching, auxiliary piers were incorporated, which led to a decrease in the span of the incremental launching.
As the steel beam is incrementally launched with the assistance of the pylons and stay cables, the auxiliary piers are decreased, and the incremental launching span is enhanced. Nevertheless, this also raises construction risks. China’s specifications [23] provide the temperature gradient patterns for concrete beams and steel beams with bridge decks, but do not provide the thermal gradient pattern for steel box girders. Nevertheless, during the jacking construction process of the steel box girder, there is no cast-in-place concrete slab and pavement layer on the top of the steel box. The steel box is directly under the sunlight, thus the temperature gradient pattern of it varies from the one specified in the code. Thus, there is a need to conduct research on the temperature gradient model of the straight web steel box featuring a large height–width ratio and lacking a pavement layer, as well as its impact on the mechanical behavior of the steel box during the incremental launching construction operation.
The Fenshui River Bridge is located in the southwest region of China. It is a novel kind of steel–concrete composite girder bridge. The steel boxes adopt a separated double-box structure, which are linked with cross beams. The section of the steel box takes on the form of straight web which has a rather large height–width ratio. The steel box girder features a simple design, which facilitates its manufacturing and assembly construction. In addition, the construction of the bridge adopts the incremental launching technique in the absence of auxiliary piers, which is adaptable to the mountainous terrain and greatly shortens the construction time.
This paper, relying on the Fenshui River Bridge, carried out a temperature test on the straight web steel box without a pavement. By analyzing the experimental data, the rules of temperature alterations at the measuring points in various positions of the steel box were studied, and the temperature disparities of the steel box across different seasons were contrasted. The data during the time periods with large temperature differences were selected, the principle of temperature distribution along the cross-section height and its temporal variation were studied, and a temperature gradient model for the steel box was put forward. Finally, by utilizing the numerical model, the effect of the temperature gradient on the force acting on the structure in the process of incremental launching was analyzed.
The innovative points of this paper are as follows. Based on the current project, the temperature variation rule of the steel box with a large height–width ratio and straight web that has no pavement layer is investigated. A temperature gradient model is put forward, which makes up for the shortages of the specification. The achievements of this article can serve as a guide for obtaining the temperature gradient value of the steel box featuring a relatively large height–width ratio and straight webs. In the case of the large span steel box girder pushed without auxiliary piers, the impact of the temperature gradient on its stress in the construction process is analyzed, which offers instructions for the safety control in the construction process of the steel box girder.
2. Project Situation and Temperature Test
2.1. Project Situation and Construction Method
The bridge is situated in Chaoyang Town of Wuxi County, Chongqing City. It is exposed to abundant sunlight and a gentle climate, warm winters and sweltering summers. It falls within a subtropical warm and moist monsoon climate region. The highest annual temperature reaches 40 °C while the lowest annual temperature is 0 °C, and the mean annual temperature is 18 °C. The wind direction is indeterminate. However, the wind speed is low, and it does not surpass grade 1. The terrain in the region where the bridge is situated is of the low mountain and canyon landform type. There are significant variations in elevation and unevenness in the ground, and it is at an altitude of about 780 m. The overall orientation of the bridge is from east to west, and the bridge structure deviates approximately 15° towards the south from the east direction.
The Fenshui River Bridge is an innovative prefabricated assembled composite beam bridge, which stretches over a sharply incised “U”-shaped river valley. Refer to Figure 1. The length of the maximum span of the bridge measures 90 m. The steel box of the composite beam is in a separated form, made up of two steel boxes, and the I-beam cross members are applied to link the steel boxes together. The height from the upper edge of the cross-section to the upper edge of the bottom plate of the steel box is 3.4 m. The height from the upper edge of the top plate of the steel box to the upper edge of the bottom plate is 3 m. The top plate of the steel box has a width of 1.92 m, the bottom plate is 1.85 m wide, and the spacing between the webs amounts to 1.6 m. The ratio of height to width of the steel box is 1.6, falling into the category of a representative cross-section, featuring a big height–width ratio. The steel box has a concise structure, with its web plate being vertical, and stiffening ribs are installed internally. The space between the webs of the two steel boxes measures 5.072 m. The webs of the steel box have a thickness ranging from 14 mm to 20 mm. The thickness of the top and bottom plates lies in the range of 16 mm to 36 mm. The thickness of the concrete bridge slab is between 260 mm and 400 mm. The concrete slab and the steel box are connected by a steel plate with shear studs. The bridge was built via prefabricated construction. The steel boxes are fastened together with bolts. Once the construction of the steel boxes is finished, the bolted steel plates are mounted. Subsequently, the bridge deck concrete is directly cast on the steel plate equipped with bolts. The bridge is situated in an area ranging from 108°44′ to 109°58′ east longitude, and from 31°14′ to 31°44′ north latitude. During the daytime with sunlight, the top plate and one of the web plates of the steel box receive sufficient sunlight exposure.
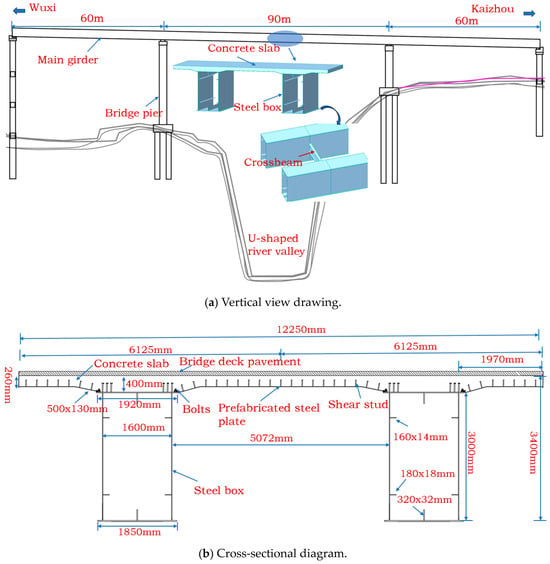
Figure 1.
Bridge information graph.
The bridge is situated in the mountain region. The available space at the construction site is small, and the U-shaped river valley makes it unfeasible to set up the supports, which brings about significant construction challenges. Meanwhile, with the aim of shortening the construction time, in the construction work of the steel box girder, the incremental launching approach without relying on auxiliary piers was adopted. Refer to Figure 2.
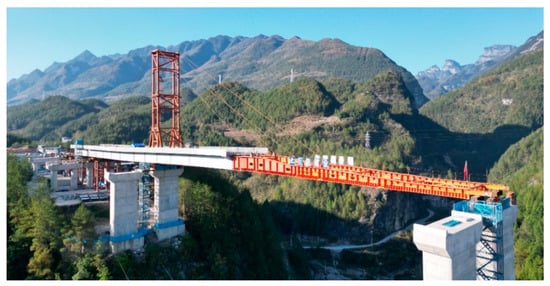
Figure 2.
Construction drawing.
The tower and cable stays were arranged on the steel box girder, and a leading beam was placed at the front of it. This was performed to help the steel box girder successfully span the U-shaped river valley and arrive at the bridge pier in the front. The tower framework is a frame structure constituted by four vertical steel tubes and cross bracings, with the cross bracings being set in three locations. The steel pipe has a diameter of 630 mm and a wall thickness of 10 mm. The tower stands at a height of 30 m. The distance between the steel pipes of the tower in the longitudinal direction of the bridge is 4 m, while the distance between the steel pipes in the transverse direction is 6.7 m. Refer to Figure 3. To strengthen the stability of the tower and decrease the bending moment at the bottom of the tower, tilted steel pipes are arranged at the base of the tower. The stay cables are arranged at four locations, namely C1 to C4. C1 and C2 are arranged on the guide beam, which can effectively increase the launching distance of the bridge. C3 and C4 are symmetrically arranged on the steel beam.
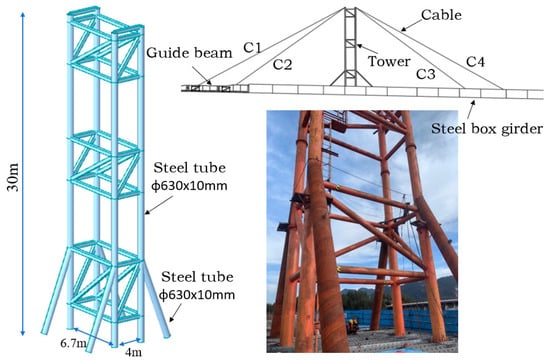
Figure 3.
Layout diagram of the tower and stay cables.
Figure 4 shows the diagram of the guide beam. To lighten the weight, the guide beam is designed with a variable cross-section in the shape of an I-beam. The isolated guide beams are linked through the horizontal connection of steel pipes, with the diameter of the steel pipes being 325 mm and the wall thickness being 8 mm, respectively.
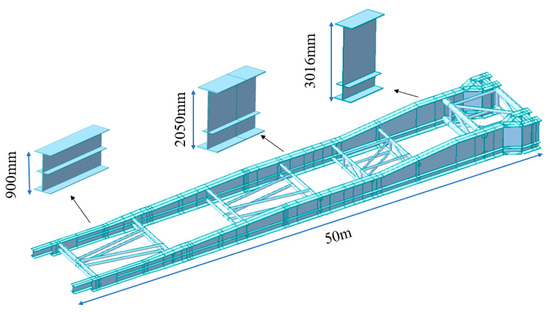
Figure 4.
Guide beam.
The steel box is partitioned into 23 segments. The length of the shortest segment measures 8.3 m, while the longest segment reaches 11.7 m, with the maximum hoisting load being 43.5t. A 10 mm wide splicing gap is left between the sections, and the amount of steel used for the bridge is 1252.8t. The construction of the bridge adopts the prefabricated assembling technique and the long-distance pushing method. The steel box girder undergoes six rounds of assembly and seven rounds of launching. The lengths of each launching operation are, in order, 36.7 m, 18.35 m, 34.95 m, 2.5 m, 34.2 m, 45 m, and 28.23 m. The essential stages in the construction operation are demonstrated in Figure 5.
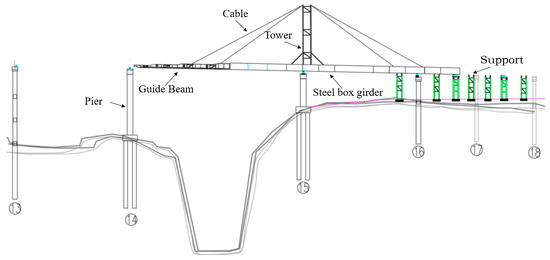
Figure 5.
Key Construction Stages.
Figure 6 shows the technical framework chart of this paper.
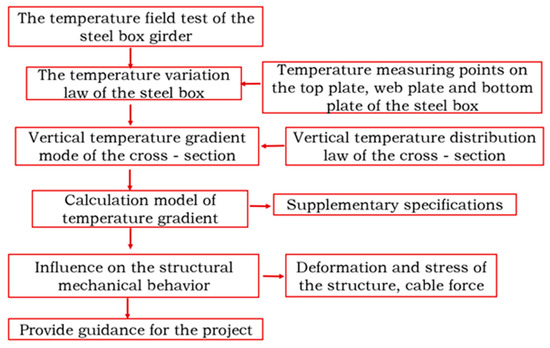
Figure 6.
The technical framework.
2.2. Temperature Test Arrangement
Considering the alignment features of the bridge and the sunlight exposure, the cross-sections at the locations of No. 5, No. 7, and No. 9 of the steel box were chosen to conduct the temperature experiment. The intervals between the test cross-sections are 20 m and 17 m, respectively. Figure 7 shows the positions of the test cross-sections.
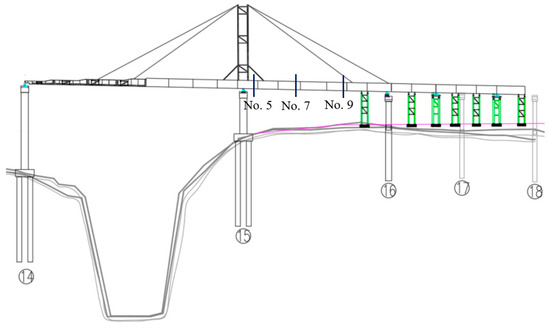
Figure 7.
Location of the cross-section for the temperature test.
Temperature sensors were installed on the web plate and top and bottom plate of the steel box. Refer to Figure 8 for details. Eight temperature sensors were set up at every cross-section. The sensors on the web plate are 1 m and 2 m away from the top plate. The sensors on the top plate and the bottom plate are 0.15 m away from the web plate, and they are 0.016 m and 3 m away from the top plate, respectively. Sensors are placed at various locations of the cross-section so as to fully show the temperature variation rule at diverse positions of the steel box and the vertical distribution of temperature within the steel box.
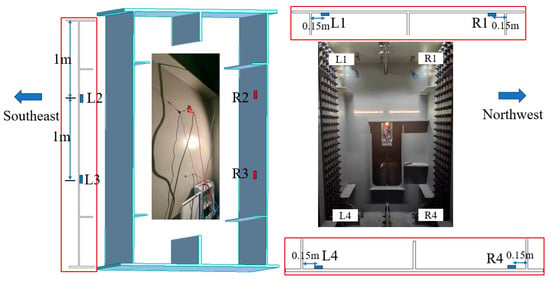
Figure 8.
Position of the temperature measuring points.
The temperature sensor is Model 99. The performance specifications of the temperature sensor are listed in Table 1.

Table 1.
Sensor performance specifications.
Once the temperature sensors were adhered to the test section, an MCUXX multi-point temperature monitoring instrument was employed to carry out the temperature monitoring. The monitoring instrument is capable of gathering the temperatures at various locations of the steel box girder simultaneously and transmitting the data to the monitoring system. Figure 9 depicts the arrangement of sensors at the construction site.
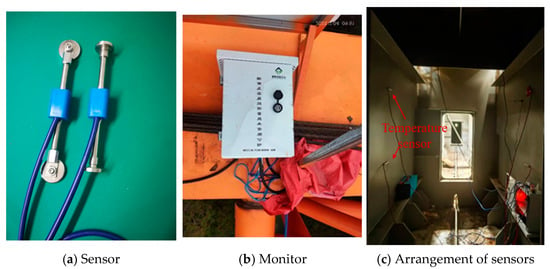
Figure 9.
Arrangement of temperature sensors on-site.
The steel box girder installation commenced in August 2023. The incremental launching operation kicked off on 8 October 2023, and the construction project was brought to an end in December 2023. Taking into account the impact of temperature disparity and the solar radiation on the steel box’s temperature, typical weather days featuring significant temperature differences and intense solar radiation in the construction period were chosen for conducting the experiment.
The temperature results were collected continuously throughout a 24 h period, commencing at 0:15 a.m. The collection interval was set at 15 min. The temperatures at the measuring points of each test cross-section were gathered at the same time and in synchronization, guaranteeing that there was no temporal discrepancy in the temperature data of every measuring point.
3. Analysis of Test Results
The test was conducted on 13 October 2023, on a clear and sunny day. The highest atmospheric temperature reached 30 °C, the lowest was 14 °C, and the wind was a level 1 southeast breeze. The variation rules of the temperatures of the top and bottom plates of steel boxes No. 5, No. 7, and No. 9 can be seen in Figure 10.
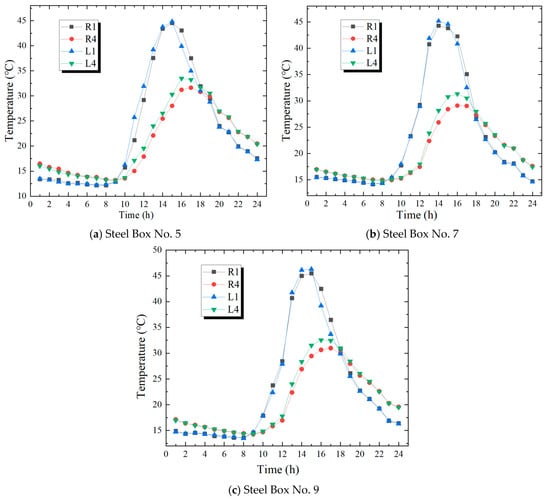
Figure 10.
Variations in the temperature of the top and bottom slabs of the steel box.
Referring to Figure 10, the temperatures of the top and bottom plates of the steel box vary periodically over time. Between 8:00 and 18:00, the temperature of the top plate is greater than that of the bottom plate, and the rate of temperature increase at the measuring points on the top plate is quicker than that at the measuring points on the bottom plate. In terms of the transverse direction of the cross-section, the temperatures on the left side of the top and bottom plates are greater than those on the right side. Also, a lagging situation exists in the temperatures of the left and right sides of the bottom plate. The cause of the aforementioned is that the sun primarily irradiates the top plate and the left side web plate.
In Figure 10a, the temperature of the measuring points on the top plate of the test section of Steel Box No. 5 rise rapidly starting from 9:00, peak in the time period between 14:00 and 16:00, and, after that, the temperature declines gradually. The highest temperatures at the measuring points L1 and R1 on the top plate are 44.8 °C and 44.5 °C, respectively. The time at which the temperature of the bottom plate of the steel box increases lags behind the time for the top plate’s temperature increase. It commences to increase in temperature at 10:00, attains the highest temperature within the time interval from 15:00 to 17:00; subsequently, the temperature starts to drop. The highest temperature values of L4 and R4 at the bottom plate are 33.5 °C and 31.6 °C, respectively.
In Figure 10b,c, the changing patterns of the temperatures of the top and bottom plates of Steel Box No. 7 and Steel Box No. 9 are analogous to that of Steel Box No. 5. For Steel Box No. 7, the highest temperatures of L1 and R1 on the top plate are 45.2 °C and 44.5 °C, respectively. And the highest values of L4 and R4 on the bottom plate are 31.3 °C and 29.1 °C, respectively. The highest temperatures of L1 and R1 on the top plate of Steel Box No. 9 are 46.3 °C and 45.5 °C, respectively. The highest values of L4 and R4 on the bottom plate are 32.5 °C and 30.6 °C, respectively.
Taking all aspects into consideration, the lateral temperature variations in the top plates in the test sections of Steel Box No. 5, No. 7, and No. 9 are all less than 1 °C. The transverse temperature variations in the bottom plates are all within the range from 1.9 °C to 2.2 °C. Hence, the transverse thermal difference in the bottom plate in the steel box section is a little greater than that of the top plate, yet the value is not large.
Meanwhile, the temperature changes in the test section of Steel Box No. 9 during winter were monitored, as illustrated in Figure 11. The test took place on 13 December 2023, on a clear and sunny day. The highest atmospheric temperature was 17 °C, the lowest temperature was 4 °C, and the wind was a south wind of level 1.
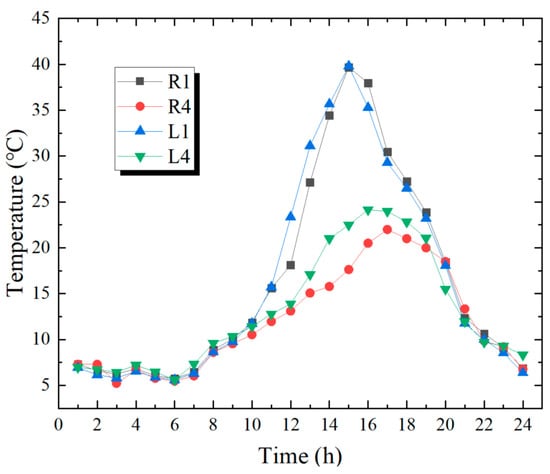
Figure 11.
Temperature changes at the temperature measuring points of Steel Box No. 9 in winter.
When comparing Figure 10c and Figure 11, the highest temperature of the bottom plate at the R4 position of the test section of Steel Box No. 9 was 30.6 °C in October, and it dropped to 22 °C in December, showing a temperature reduction of 8.6 °C. However, the highest temperature of the top plate at the R1 position was 45.5 °C, and it became 39.7 °C in December, with just a temperature drop of 5.8 °C. Thus, it can be concluded that the greatest temperature disparity between the top and bottom plates of the steel box girder does not always happen in the hot weather season but it is associated with the strength of solar radiation.
4. The Temperature Distribution in the Vertical Direction of the Cross-Section
On the 13th of October, 2023, the laws of temperature distribution for the two side webs of the test sections of Steel Box No. 5, Steel Box No. 7 and Steel Box No. 9 in the high-temperature period can be seen in Figure 12.
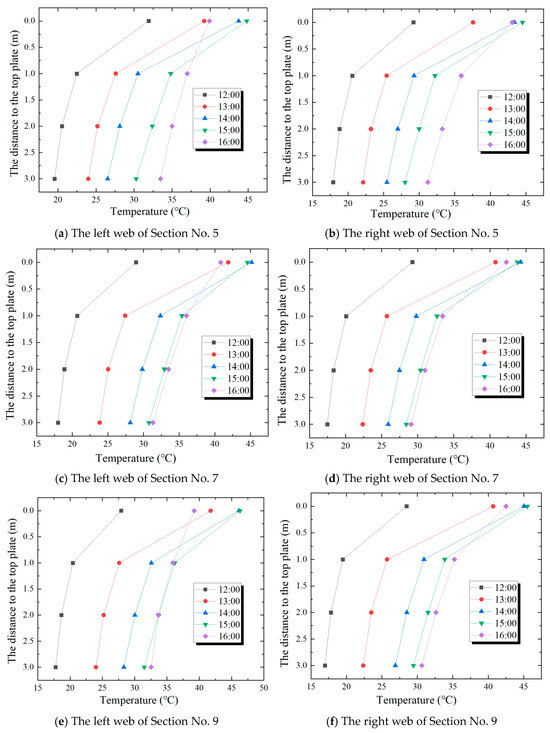
Figure 12.
The temperature distribution in the vertical direction of the cross-section.
In Figure 12, the temperature measuring points in the test sections of every steel box show the feature of non-linear distribution along the vertical orientation of the section. In the range of 1 m from the top plate, there is a significant difference in temperature values. In the range between 1 m and 3 m from the top plate, the variation in temperature is slight, and the curve has a distinct inflection point at the 1 m mark. Furthermore, the thermal gradient of the steel box girder resulting from solar irradiation is not a constant value, and it is at its peak at 14:00.
In Figure 12a,b, regarding the left web of the No. 5 steel box, during the time from 12:00 to 16:00, the variation in temperature of the cross-section is between 6.5 °C and 17.2 °C, and the largest temperature difference, which is 17.2 °C, appears at 14:00. Regarding the right web, during the time from 12:00 to 16:00, the variation in temperature of the cross-section varies between 11.3 °C and 17.9 °C, and the largest temperature difference, being 17.9 °C, appears at 14:00. The thermal disparity of the right web is greater than that of the left web, and this is associated with the sunlight exposure. In Figure 12c,d, regarding the left web plate of the No. 7 steel box, during the time from 12:00 to 16:00, the variation in temperature of the cross-section is between 9.5 °C and 17.1 °C, with the largest temperature difference being 17.1 °C at 14:00. Regarding the right web plate, within the time period from 12:00 to 16:00, the thermal disparity of the cross-section varies between 11.8 °C and 18.4 °C, and the largest temperature difference, which is 18.3 °C, occurs at 14:00. In Figure 12e,f, concerning the left web plate of the No. 9 steel box, during the time from 12:00 to 16:00, the temperature difference in the cross-section varies between 6.7 °C and 17.8 °C, with the largest temperature difference being 17.8 °C at 14:00. For the right web plate, within the time period from 12 o’clock to 16 o’clock, the cross-sectional thermal disparity ranges from 11.5 °C to 18.1 °C, and the largest temperature difference is 18.1 °C at 14:00. At 14:00, the average values of the temperature differences between the two side webs of the steel boxes at three distinct positions are 17.6 °C, 17.7 °C, and 17.9 °C, respectively. Despite the different locations, the vertical temperature differences in the cross-sections show little variation.
The distribution of temperature along the height of the steel box cross-section is shown in Figure 13. Among them, the average values of the measuring point temperatures on the two side web plates of the test cross-sections of the steel boxes at three different positions are selected. Moreover, the temperature gradient pattern in the form of a double-fold line for the steel box is put forward. Refer to Figure 14.
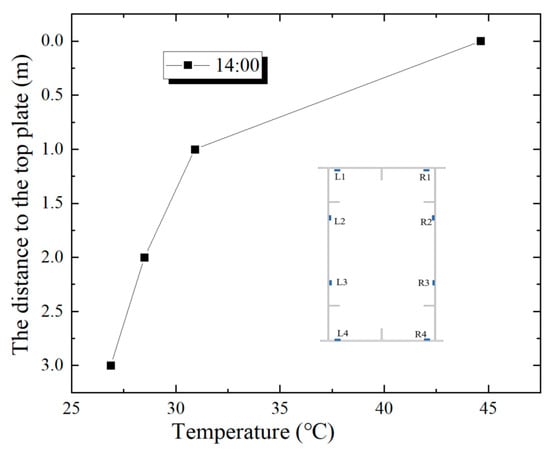
Figure 13.
Vertical average temperature distribution of the steel box cross-section.
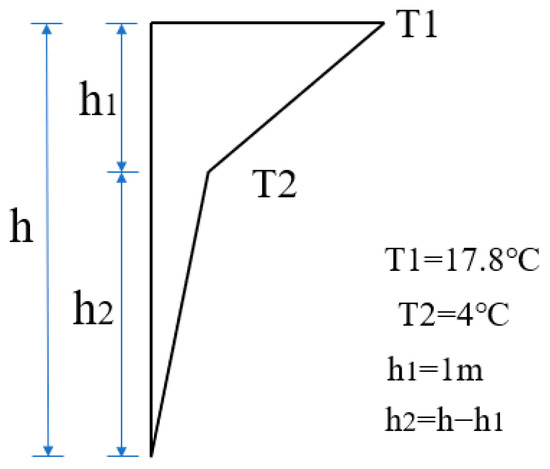
Figure 14.
Temperature gradient pattern.
In Figure 13, the temperature exhibits a non-linear distribution in the vertical direction of the cross-section. The highest temperature reaches 44.6 °C while the lowest is 26.8 °C. Within the scope of 1 m from the top plate, there is a temperature difference of 13.7 °C. Within the range of 1 m and 3 m from the top plate, the temperature difference is merely 4 °C, indicating that the temperature variation is slight. The vertical distribution of the temperature in the cross-section approximately shows a double-segment linear pattern. The temperature difference in the upper part of the steel box is significant, while that of the lower part of the steel box is relatively small. On the basis of this, the thermal gradient model presented in this article is in the form of a double-fold line, and the greatest temperature disparity of the cross-section amounts to 17.8 °C. The temperature characteristic points are T1 = 17.8 °C, T2 = 4 °C, and h1 = 1 m. Refer to Figure 14. In contrast to the curve and multi-segment linear models, the double-segment linear temperature model presented in this paper simplifies the nonlinear issues of the temperature distribution, and meanwhile, it can efficiently mimic the crucial features of the actual temperature distribution.
5. Study on the Impact of Temperature Difference on the Force of the Structure
The force-bearing behavior of the structure merits attention [24]. In Figure 5, the guide beam is on the verge of spanning the pier. At this point, the structure is in the greatest cantilever condition, and the stress situation is the most disadvantageous. The FEM is utilized to study the effect of the thermal disparity model put forward in this paper on the structural force. The simulation model for the structure was set up with Midas Civil [25]. Refer to Figure 15. In the model, there are 512 beam elements and 436 nodes. The steel box girder, the guide beam and the tower structure are modeled with beam elements, while the cables are modeled with cable elements. The brackets and bridge piers are at the bottom of the steel box. The weight of the steel box is conveyed to the ground via the brackets and bridge piers. The effect of the interaction between the bottom of the bridge piers and the soil has an impact on the force borne by the structure [26]. But because the bridge is situated in a mountainous region and the pile foundations at the bottom of the bridge piers are directly embedded in the rock, the interaction between the structure and the soil is not taken into account. Thus, the brackets and bridge piers at the bottom of the steel beam are modeled with supports that can only withstand compression, and the bottoms of these supports are made fixed. A rigid connection is adopted to model the connection between the cables and the steel beam. The structural weight, namely the dead load, serves as the primary load action. The weight of the model is adjusted in accordance with the weight specified in the design document. In light of the stress state of the structure, a comparative analysis was conducted on the impacts of the thermal disparity and the structural dead load on the structural stress, deformation, and the force of the cables. The selected cross-sectional positions are marked in Figure 16.
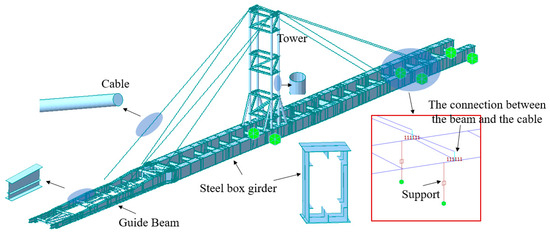
Figure 15.
Simulation Model.

Figure 16.
Position of the cross-section.
Figure 17 illustrates the vertical deformation of the guide beam and the steel girder. Figure 18 depicts the horizontal deformation of the tower structure.
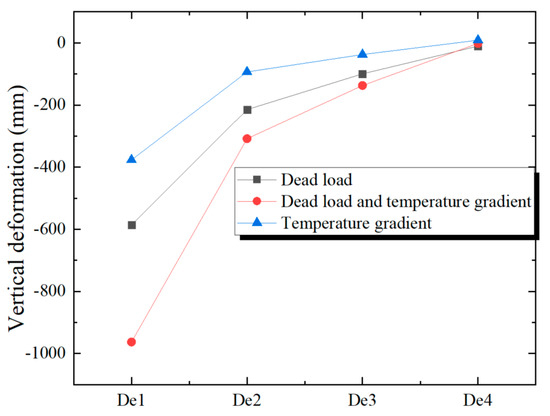
Figure 17.
Vertical deformation of the steel box girder and the guide beam.
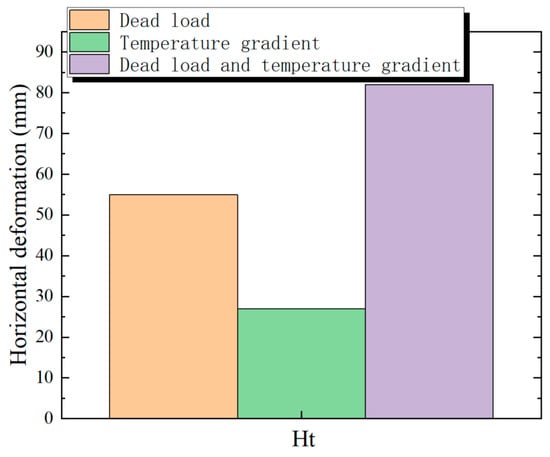
Figure 18.
Horizontal deformation at the top of the tower.
In Figure 17, the temperature gradient exerts the most significant impact on the deformation of the guide beam at the cantilever end of the structure. The deformation under the dead load is −586 mm, while the deformation induced by the temperature gradient is −376 mm. The deformation of the guide beam due to the temperature gradient makes up 39% of the total deformation. In Figure 18, the horizontal deformation of the tower structure under the effect of the dead load is 55 mm, and the deformation induced by the thermal disparity is 27 mm. The horizontal deformation at the top of the tower resulting from the temperature gradient makes up 33% of the total deformation.
Figure 19 illustrates the relationship of the influence of the temperature gradient and the cantilever length of the guide beam on the deformation at the front end of the guide beam.
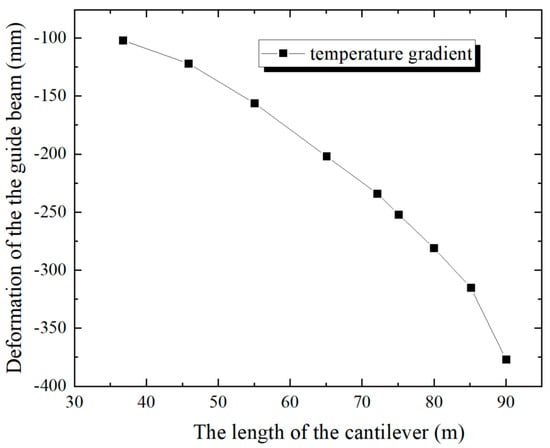
Figure 19.
The influence of temperature on the deformation of the guide beam.
In Figure 19, with the increase in the cantilever length of the guide beam, the impact of the temperature gradient on the deformation of the guide beam is more significant, presenting a non-linear changing pattern. If the length of the guide beam’s cantilever is shorter than 35 m, the deformation of the front part of the guide beam is shorter than 10 cm. Once the cantilever length of the guide beam is longer than 75 m, the deformation rate of the front end of the guide beam speeds up, and the deformation value is over 25 cm. Thus, it is evident that the impact of the thermal gradient of the steel box girder on the structural deformation should not be overlooked. An overly large vertical deformation of the guide beam will lead to the bridge failing to pass the pier smoothly.
In a steel bridge where the tower structure and the cable stays assist in the jacking operation, apart from the guide beam and the steel box girder, the tower structure and the cable stays also exist. To guarantee structural safety and ensure the guide beam successfully traverses the pier, the impact of the vertical temperature gradient should be taken into account. First of all, the deformation value of the structure in the maximum cantilever condition under the effect of the vertical temperature gradient can be computed beforehand using the simulation model. By adjusting the force of the cable stays, an adequate deformation reserve can be ensured at the front end of the guide beam. Secondly, in the case where the structure is under an unfavorable stress condition, exposure to sunlight should be avoided, particularly between 13:00 and 16:00.
To minimize the impact of the temperature gradient on the structural deformation, the Fenshui River Bridge avoids the high-temperature hours between 13:00 and 16:00 prior to spanning the bridge piers and conducts the construction when the temperature gradient is small. Also, considering of the impact of the temperature gradient on the deformation at the front end of the guide beam, the tension of the cable is adjusted in advance.
Figure 20 illustrates the contrast of the stresses at the key cross-sections of the guide beam and the steel box girder. In Figure 20, the temperature gradient alters the distribution pattern of the structural stress, and the extent of its impact on the stresses at the uppermost and lowermost margins of the cross-section vary. For instance, at the location of St3, under the action of the structural dead load, the stresses on the top and bottom margins of the steel beam are −33.8 MPa and 17.6 MPa. The stresses induced by the temperature gradient are −22.4 MPa and 20.8 MPa. The stresses brought about by the temperature gradient are nearly equal to those generated by the structural dead load.
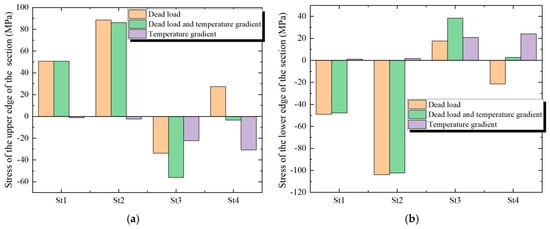
Figure 20.
Stresses of the steel box and the guide beam. (a) The stress on the upper edge of the cross-section. (b) The stress on the lower edge of the cross-section.
Figure 21 illustrates the contrast of the stresses at the base of the tower structure. Figure 22 depicts the impact of thermal disparity on the force of the stay cables.
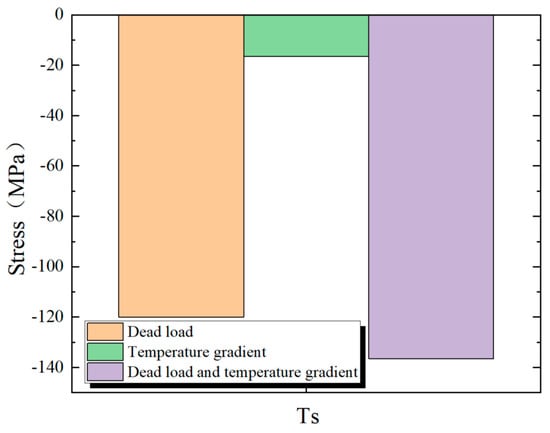
Figure 21.
Stress at the bottom of the tower.
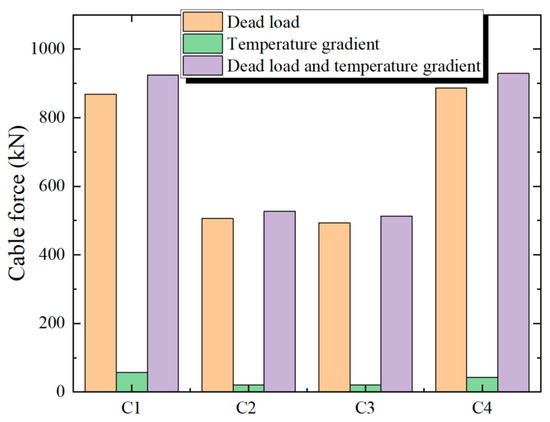
Figure 22.
Comparison of the influence on the cable force.
In Figure 21, the temperature gradient makes the stress at the bottom of the tower increase. The stress at the bottom of the tower under the action of the dead load is −120 MPa, and the stress generated by the thermal disparity is −16.5 MPa. The stress generated by the thermal disparity accounts for 12% of the total stress. In Figure 22, the temperature gradient leads to an increase in the force of the stay cable, and it exerts the most significant influence on the cable force at the cantilever end C1. When under the effect of the dead load, the force of the stay cable at C1 is 868.5 kN, the cable force resulting from the temperature gradient is 56.5 kN, and the cable force due to the temperature gradient makes up 6.1% of the total cable force. The temperature gradient has a rather slight influence on the cable forces of the stay cables from C2 to C4.
6. Conclusions
- (1)
- According to the temperature test, the temperature of the top plate of the steel box reaches its peak between 14:00 and 16:00. In contrast to the temperature of the top plate, the temperature increase in the bottom plate shows a lagging effect. The transverse temperature disparity of the steel box top plate is less than 1 °C. The temperature difference in the bottom plate is a bit larger, ranging from 1.9 °C to 2.2 °C. The greatest temperature difference between the top and bottom plates of the steel box girder does not always happen in the season with higher temperatures; instead, it is associated with solar radiation.
- (2)
- During the high-temperature period, the distribution curve of the vertical thermal gradient of the cross-section shows non-linear features, and a significant temperature difference exists within the scope of 1 m. According to the test outcomes, a temperature gradient model for the steel box cross-section featuring a large height–width ratio, straight web plates and no pavement was put forward. The temperature gradient model is in the form of a double broken line. The respective values of the corresponding temperature base points are T1 = 17.8 °C and T2 = 4 °C, respectively, with the distance between the base points being 1 m. The temperature model put forward in this article can provide suggestions for adding the regulations of the vertical temperature gradient to the code provisions.
- (3)
- The temperature gradient exerts a significant impact on the structural deformation. The deformation of the guide beam resulting from the temperature gradient makes up 39% of the total deformation, while the horizontal deformation at the top of the pylon caused by the temperature gradient constitutes 33% of the total deformation. Moreover, the temperature gradient has altered the distribution pattern of the internal forces within the structure. The temperature gradient does not remain constant. During the construction of the steel box girder, particularly when the structure is in the maximum cantilever condition and on the verge of spanning over the pier, it is imperative to evade the impact of the thermal gradient, especially between 13:00 and 16:00.
Author Contributions
Conceptualization, Z.L.; methodology, Z.L.; software, Z.L.; validation, Z.L., S.L. and M.J.; formal analysis, Z.L.; investigation, Z.L., S.L. and M.J.; resources, Z.L., S.L. and M.J.; data curation, Z.L. and M.J.; writing—original draft preparation, Z.L. and S.L.; writing—review and editing, Z.L.; supervision, S.L. and M.J.; funding acquisition, Z.L. All authors have read and agreed to the published version of the manuscript.
Funding
This paper was supported by the Science and Technology Project of Shandong Communications Department (2024B110-03), Doctoral Start-up Foundation of Shandong Jiaotong University (BS2023047, BS2023060), and Shandong Jiaotong University Research Fund Project (Z202311).
Data Availability Statement
The original contributions presented in this study are included in the article. Further inquiries can be directed to the corresponding author.
Conflicts of Interest
This paper was completed with the cooperation of all authors, and there are no conflicts of interest.
References
- Liu, Z.; Zhao, K.; Xiong, Y.; Wang, B. Calculation method of temporary cable force in incremental launching construction of large span steel box girder without auxiliary pier. Sci. Rep. 2024, 14, 20635. [Google Scholar] [CrossRef] [PubMed]
- Liu, Y.; Liu, J.; Zhang, N. A review of research on the effect of sunlight temperature on bridge structures. J. Civ. Eng. 2019, 52, 59–78. (In Chinese) [Google Scholar] [CrossRef]
- Liu, G. Research on Temperature Effects during the Construction Phase of Long span Continuous Steel Truss Bridges. Railw. Build. Technol. 2021, 10, 6. [Google Scholar] [CrossRef]
- Zhou, Y.; Beecher, J.; Guzda, M.; Cunningham, D. Investigation and retrofit of distortion-induced fatigue cracks in a double-deck cantilever-suspended steel truss bridge. J. Struct. Eng. 2015, 141, D4014011. [Google Scholar] [CrossRef]
- Kim, S.; Park, S.; Wu, J.; Won, J. Temperature variation in steel box girders of cable-stayed bridges during construction. J. Constr. Steel Res. 2015, 112, 80–92. [Google Scholar] [CrossRef]
- Zhang, N.; Liu, Y.; Liu, J.; Ji, D.; Fang, J.; Stiemer, S. Sunshine temperature effect on H-shaped concrete bridge towers in high-altitude and cold regions. J. Transp. Eng. 2017, 17, 66–77. (In Chinese) [Google Scholar]
- Tong, M.; Tham, L.; Au, F. Extreme thermal loading on steel bridges in tropical region. J. Bridge Eng. 2002, 7, 357–366. [Google Scholar] [CrossRef]
- Liu, H.; Chen, Z.; Zhou, T. Theoretical and experimental study on the temperature distribution of H-shaped steel members under solar radiation. Appl. Therm. Eng. 2012, 37, 329–335. [Google Scholar] [CrossRef]
- Huang, S.; Cai, C.; Zou, Y.; Zou, Y.; He, X.; Yang, G.; Su, C. Experimental study and numerical simulation of non-uniform temperature field of corrugated steel belly plate steel beam under sunlight. J. Railw. Sci. Eng. 2023, 20, 2913–2922. (In Chinese) [Google Scholar] [CrossRef]
- Li, T. Research on Sunshine Temperature Field of Unplanned Steel Track Beams. Railw. Build. Technol. 2022, 19–22+32. (In Chinese) [Google Scholar]
- Teng, H.; Zhu, Z.; Li, J. Research on vertical temperature gradient of steel box girder on steel bridge deck based on on-site measurements. J. Railw. Sci. Eng. 2021, 18, 3267–3277. (In Chinese) [Google Scholar] [CrossRef]
- Fan, J.; Liu, Y.; Liu, C. Experiment study and refined modeling of temperature field of steel-concrete composite beam bridges. Eng. Struct. 2021, 240, 112350. [Google Scholar] [CrossRef]
- Xiang, S.; Wang, D.; Yang, L.; Tan, B. Study on the life cycle simulation method of the temperature field and temperature effect of a steel-concrete composite bridge deck system. Meas. Control 2021, 54, 1068–1081. [Google Scholar] [CrossRef]
- Li, H.; Zhang, Z.; Deng, N. Temperature Field and Gradient Effect of a Steel-Concrete Composite Box Girder Bridge. Adv. Mater. Sci. Eng. 2021, 10, 1–16. [Google Scholar] [CrossRef]
- Elshoura, A.; Okeil, A. Simplified method for estimating restraint moment induced by vertical temperature gradient in continuous prestressed concrete bridges and verification using AASHTO BDS. Struct. Infrastruct. Eng. 2022, 20, 944–956. [Google Scholar] [CrossRef]
- Ngo, D.; Nguyen, H. Monitoring and analysis of temperature distribution in reinforced concrete bridge box girders in Vietnam. Case Stud. Constr. Mater. 2024, 20, e02857. [Google Scholar] [CrossRef]
- Lawson, L.; Keri, L.; Ryan, A.; Ian, G.; Buckle, M. Bridge temperature profiles revisited: Thermal analyses based on recent meteorological data from Nevada. J. Bridge Eng. 2020, 25, 04019124. [Google Scholar] [CrossRef]
- Ding, Y.; Wang, G.; Zhou, G.; Li, A. Temperature distribution characteristics of the flat steel box girder of Runyang Bridge based on long-term monitoring data. Chin. J. Highw. 2013, 26, 94–101. (In Chinese) [Google Scholar]
- Liu, Z.; Yao, M.; Wang, Q.; Ren, Y. Research on the Vertical Temperature Gradient Model of Long-Span Concrete Box Arch Without Flange Plate Based on Measured Data. Coatings 2025, 15, 288. [Google Scholar] [CrossRef]
- Sun, X.; Liu, W.; Zhu, J.; Cheng, X. Analysis of the Influence of Temperature Gradient Effect on Top Pushing Construction of Steel Box Beams. Mod. Transp. Technol. 2021, 18, 28–31. (In Chinese) [Google Scholar]
- Li, X. Analysis of temperature effect in launching construction of unpaved steel box girder. Railw. Constr. Technol. 2023, 10. (In Chinese) [Google Scholar] [CrossRef]
- Li, C.; Yang, N.; Zhang, Y.; Dong, C. Sunshine temperature gradient and deformation of the final section of the steel box girder of Hangzhou Jiangdong Bridge during top pushing process. J. Transp. Sci. Eng. 2009, 25, 39–44. (In Chinese) [Google Scholar] [CrossRef]
- JTG D60-2015; General Code for Design of Highway Bridges and Culverts (JTG D60-2015). Ministry of Transport of the people’s Republic of China: Beijing, China, 2015. (In Chinese)
- Najam, F.; Qureshi, M.; Warnitchai, P.; Mehmood, T. Prediction of nonlinear seismic demands of high-rise rocking wall structures using a simplified modal pushover analysis procedure. Struct Des. Tall Spec Build 2018, 27, e1506. [Google Scholar] [CrossRef]
- Wang, C.; Ansari, F.; Wu, B.; Li, S.; Morgese, M.; Zhou, J. LSTM approach for condition assessment of suspension bridges based on time-series deflection and temperature data. Adv. Struct. Eng. 2022, 25, 3450–3463. [Google Scholar] [CrossRef]
- Asgarkhani, N.; Kazemi, F.; Jankowski, R. Machine learning-based prediction of residual drift and seismic risk assessment of steel moment-resisting frames considering soil-structure interaction. Comput. Struct. 2023, 289, 107181. [Google Scholar] [CrossRef]
Disclaimer/Publisher’s Note: The statements, opinions and data contained in all publications are solely those of the individual author(s) and contributor(s) and not of MDPI and/or the editor(s). MDPI and/or the editor(s) disclaim responsibility for any injury to people or property resulting from any ideas, methods, instructions or products referred to in the content. |
© 2025 by the authors. Licensee MDPI, Basel, Switzerland. This article is an open access article distributed under the terms and conditions of the Creative Commons Attribution (CC BY) license (https://creativecommons.org/licenses/by/4.0/).