Article

Durability Test and Service Life Prediction Methods for Silicone Structural Glazing Sealant

1
China Academy of Building Research, Beijing 100013, China
2
Department of Civil Engineering, Tongji University, Shanghai 200092, China
*
Author to whom correspondence should be addressed.
Buildings 2025, 15(10), 1664; https://doi.org/10.3390/buildings15101664
Submission received: 8 March 2025 / Revised: 2 April 2025 / Accepted: 6 April 2025 / Published: 15 May 2025
(This article belongs to the Section Building Materials, and Repair & Renovation)

Abstract

Silicone structural glazing (SSG) sealants are crucial sealing materials in modern building curtain walls, whose performance degradation may lead to functional and safety issues, posing significant challenges to building safety maintenance. This study comprehensively investigated the effects of temperature, humidity, stress, and ultraviolet (UV) irradiance on the durability of SSG sealants through multi-gradient matrix aging tests, revealing the influence patterns of these four aging factors on tensile bond strength (TBS). Based on aging test data and degradation patterns, a novel degradation model for TBS aging was established by incorporating all four aging factors as variables, enabling the model to reflect their combined effects on TBS degradation. The unknown parameters in the model were calculated using the Markov chain Monte Carlo (MCMC) algorithm and validated against experimental data. A recursive algorithm was developed to predict TBS degradation under actual service conditions based on the degradation model and environmental records, with verification through outdoor aging tests. This study established a service life prediction methodology that combines the degradation model with environmental data through recursive computation and standard-specified strength limits. The results demonstrate that increasing temperature, humidity, stress, and UV irradiation accelerates TBS changes, with influence intensity ranking as UV irradiation > temperature > humidity > stress. Synergistic effects exist among all four factors, where UV irradiation shows the most significant coupling effect by amplifying other factors’ combined impacts, while UV’s primary influence manifests through such synergies rather than independent action. Among temperature, humidity, and stress combined effects, temperature contributes approximately 50%, temperature–humidity interaction about 35%, with temperature-related terms collectively accounting for 90%. The degradation model calculation results show excellent agreement with experimental data (R2 > 0.9, MAE = 0.019 MPa, RMSE = 0.0245 MPa). The characteristic TBS minimum value considering material discreteness and strength assurance rate serves as a reliable criterion for service life evaluation. The proposed prediction method provides essential theoretical and methodological foundations for ensuring long-term safety and maintenance strategies for glass curtain walls.

1. Introduction

Silicone structural glazing (SSG) sealant, as an important structural bonding and sealing material, serves as a critical load transfer path for glass panels and is widely used in various types of glass curtain walls [1,2]. The schematic diagram of SSG sealant application in a typical hidden-frame glass curtain wall is shown in Figure 1. The durability of SSG sealant represents a vulnerable point in glass curtain walls, making it the most crucial factor determining the durability of glass curtain walls. As the service life of glass curtain walls increases, frequent issues, such as leakage, cavity failure, and component detachment caused by the deterioration of SSG sealant performance, pose severe challenges to building safety and maintenance.
Current research has demonstrated that temperature, humidity, mechanical stress, and UV irradiation constitute critical environmental factors influencing the durability of SSG sealants [1,2,3]. During photoaging processes, UV radiation initiates multiple chemical reactions including molecular chain scission and cross-linked network reorganization [4,5,6,7]. Studies have confirmed that sealants with distinct chemical compositions exhibit differentiated reaction tendencies [8]. Water molecules exert dualistic effects on sealant degradation: Liquid water or vapor permeates into the polymeric matrix through diffusion, not only inducing hydrolytic degradation of Si-O-Si backbone chains but also catalyzing silanol condensation cross-linking reactions [9,10]. The cyclic loading accelerates material failure, and repetitive deformation induces stress accumulation at the interface bonding layer [11,12]. Concurrently, mechanical stress disrupts molecular structures of SSG sealants through chain scission [13]. The Arrhenius equation reveals temperature’s exponential influence on chemical reaction rates, where elevated temperatures significantly lower activation energies for various chemical processes in sealants [14].
There exists a significant synergistic effect among the four environmental factors [15]. Ultraviolet (UV) irradiation-induced surface embrittlement and micro-crack formation substantially accelerate moisture penetration and diffusion, while water molecule infiltration-triggered plasticization effects further promote the migration of photodegradation byproducts [16]. Elevated temperatures intensify hydrolysis reaction rates, while enhanced thermal motion of water molecules exacerbates swelling deformation in polymer networks [17]. This synergistic mechanism underscores the limitations of single-factor aging evaluation systems, necessitating the development of multifactorial synergistic accelerated aging protocols [18].
Miyauchi [19], based on the RILEM TC 139-DBS [20], conducted a systematic study on the durability of various building sealants, demonstrating that the proposed method effectively distinguishes durability variations among different sealant products. Notably, the combined effects of xenon lamp irradiance and cyclic mechanical stress were found to significantly accelerate material degradation. Yan [21] performed four-factor synergistic aging tests on SSG sealants, validating the synergistic degradation mechanism of polymer materials under the influence of combined environmental factors. White [22] developed the Simulated Photodegradation via the High Energy Radiant Exposure (SPHERE) system, a multi-environmental factor coupled accelerated aging test platform. This system integrates light radiation, temperature–humidity control, and mechanical stress loading. Additionally, a multi-axis mechanical loading device applies cyclic tensile–compressive strains. Based on this platform, Adam [23] investigated the aging behavior of styrene–butadiene–styrene (SBS) sealants under the combined effects of UV radiation, temperature, humidity, and mechanical strain. Using a multi-factor combined condition experimental design, they investigated the synergistic effects of various temperature gradients.
Ding [13] acquired thermal degradation data of sealants via thermogravimetric (TG) analysis, analyzed their thermo-oxidative aging kinetic parameters using thermal analysis kinetics, and, subsequently, developed a temperature–life correlation model based on the Arrhenius Equation [24]. Lee [25] demonstrated, through statistical analysis of aging experimental data, that SSG sealants exhibit distinct linear degradation characteristics in performance curves. By employing multivariate regression methods, they constructed an environmental stress model incorporating temperature, humidity, and other influencing factors. White [26] designed an accelerated aging experiment under combined multifactor conditions, used the Markov chain Monte Carlo (MCMC) algorithm to compute the model parameters and establish a degradation model, and proposed a natural aging prediction method based on a recursive algorithm. Adam [27] proposed substituting time with cumulative solar radiation and developed a quantitative model relating radiation dose to performance degradation, successfully circumventing the uncertainty of acceleration factors inherent in traditional methods.
This study thoroughly examines the synergistic effects of various environmental factors. Aging tests under combined multi-factor conditions were designed to evaluate the durability of the sealants. A degradation model was developed based on the test data, with parameters estimated using the MCMC algorithm grounded in Bayesian principles. Expanding on the degradation model, a recursive method was employed to project the trend of tensile bond strength changes over time for SSG sealants under real-world conditions, thus facilitating service life prediction.
This study aims to reveal the influence patterns of various aging factors on the durability of SSG sealants and to develop a service life prediction method for SSG sealants that accurately reflects the effects of actual service environments. The main contributions and innovations of this study are as follows: (1) Unlike previous studies, this study sets different levels for all four aging factors in the aging tests, enabling a comprehensive analysis to fully determine the impact patterns of all four aging factors on the durability of SSG sealants. (2) Most degradation models in previous studies only incorporate one or two aging factors, limiting their applicability. Based on the aging patterns obtained from experiments, this study establishes a novel degradation model for the aging of tensile bond strength in SSG sealants, which includes all four aging factors and can predict tensile bond strength (TBS)–time curves under various test conditions. (3) Previous service life prediction methods faced two issues: considering only one or two aging factors and being developed for other materials with different aging mechanisms, rendering them unsuitable for SSG sealants. The service life prediction method established in this study is based on the aging mechanisms and test data of SSG sealants, accurately reflecting the changes in TBS under actual service conditions and predicting service life according to specification limits. This study provides an accurate and effective method for predicting the service life of SSG sealants, offering an important theoretical and methodological foundation for ensuring the long-term safety and maintenance strategies of glass curtain walls.

2. Experimental

2.1. Materials and Specimen Preparation

The two types of SSG sealant selected in this study were produced by two dominant sealant manufacturers in China and extensively applied in engineering. The SSG sealants were formulated by mixing two components at specified mass ratios. Component 1, serving as the base material, consists of polydimethylsiloxane (PDMS) and calcium carbonate (CaCO3) fillers, while Component 2, functioning as the additive package, contains methyltrimethoxysilane (MTMS) as a cross-linking agent, γ-aminopropyltriethoxysilane (APS) as a coupling agent, and dibutyltin dilaurate (DBTL) as a catalyst. Although both sealants share identical base materials, they differ in the compositional formulations and mass ratios of fillers and additives. The two SSG sealants were designated as sealant A and sealant B, respectively, with distinct initial mechanical properties as shown in Table 1. The sealant A is produced by Zhengzhou Zhongyuan Silande High-tech Co., Ltd., Zhengzhou, China and sealant B is produced by Guangzhou Baiyun Technology Co., Ltd., Guangzhou, China.
In glass curtain walls, the focus is primarily on the tensile adhesion properties of SSG sealants. Therefore, the specimen type in this study follows ASTM C1135-19 [28] and the Chinese standard JG/T 475-2015 [29], which test the tensile adhesion properties of sealants using H-shaped specimens. The specimen dimensions and structure are shown in Figure 2. The lower substrate of the specimen consists of a 3 mm thick aluminum plate (50 mm by 50 mm), treated with anodized surface treatment, while the middle portion is filled with SSG sealant (12 mm by 12 mm by 50 mm), and the upper part is a 5 mm thick glass panel (50 mm by 50 mm).
After the specimens were injection molded, they were placed in a standard curing room for conditioning at a temperature of (23 ± 2) °C and a relative humidity of (50 ± 5)%. The curing time was 21 days.

2.2. Aging Test Conditions

2.2.1. Laboratory Aging Test

The specimens for the laboratory aging tests were placed in a xenon arc lamp aging chamber. The temperature, humidity, and UV irradiance intensity inside the chamber were controlled and kept constant, as shown in Figure 3. The spectral range of the xenon lamp source, from 300 to 800 nm, closely resembles the solar spectrum, thereby simulating the environmental conditions during actual use more accurately, as shown in Figure 4. The UV radiation range is set between 300 and 400 nm, and the total irradiance within this range is used as the control index for UV light, with two levels: 0 W/m2 and 40 W/m2, where 0 W/m2 indicates that the xenon lamp is turned off. Due to constraints in experimental equipment and time limitations, the UV irradiance was only evaluated at two levels, and further investigations into the intermediate level were not feasible in this study. The xenon arc lamp aging chamber was equipped with three evenly distributed xenon arc lamps, ensuring uniform UV irradiance across most areas of the chamber. However, the UV irradiance was slightly lower in the corners. To guarantee consistent UV exposure for all test specimens, their positions within the chamber were rearranged each time the stress conditions were adjusted, with a frequency of three times per week.
The experiment set up six different combinations of temperature and humidity: I. 65 °C and 70%, II. 65 °C and 10%, III. 65 °C and 40%, IV. 15 °C and 40%, V. 40 °C and 40%, and VI. 15 °C and 10%. The temperature for conditions I, II, and III is the same, while the humidity differs, allowing for the analysis of the impact of humidity on the durability of SSG sealants. Conditions III, IV, and V have the same humidity but different temperatures, allowing for the analysis of the effect of temperature on the sealant’s durability. The aging chamber was equipped with temperature and humidity sensors, along with a control system that regulates these parameters. Temperature was adjusted via heating and cooling systems, while humidity was controlled by a humidification system. Additionally, an air circulation system ensures uniform distribution of temperature and humidity throughout the chamber.
Three levels of mechanical stress were set: 0 MPa, 0.07 MPa, and 0.14 MPa. The 0.14 MPa stress level represents the maximum tensile-compressive stress that SSG sealants are allowed to endure according to the design specifications of glass curtain walls ASTM C1401-14 [30] and JGJ102-2013 [31]. This corresponds to the maximum tensile-compressive stress that silicone sealants would experience in practical use. To more thoroughly investigate the influence of stress, an intermediate level of 0.07 MPa was introduced between the 0 MPa and 0.14 MPa stress levels.
The laboratory aging test lasted for 5000 h, with specimens periodically taken out to test their tensile adhesion properties. Sealant A is the primary subject of this study, while sealant B serves as the control group and is the secondary focus of the research. Therefore, the observation frequency for sealant A was increased, with samples taken every 500 h [32,33]. The 500 h interval enables the acquisition of more accurate experimental data, which significantly enhances the accuracy of subsequent degradation modeling. For each sampling, five specimens were selected, and the average of their test data was used as the observation value. Since the group without UV exposure showed slower performance changes, the sampling interval was set to 1000 h. Sealant B samples were taken every 1000 h, with five specimens selected per sampling, and the average of their test data was used as the observation value. A total of 1350 specimens of sealant A and 600 specimens of sealant B were used, resulting in a total of 1950 specimens. All test conditions are listed in Table 2, with 60 conditions in total, 36 for sealant A and 24 for sealant B.
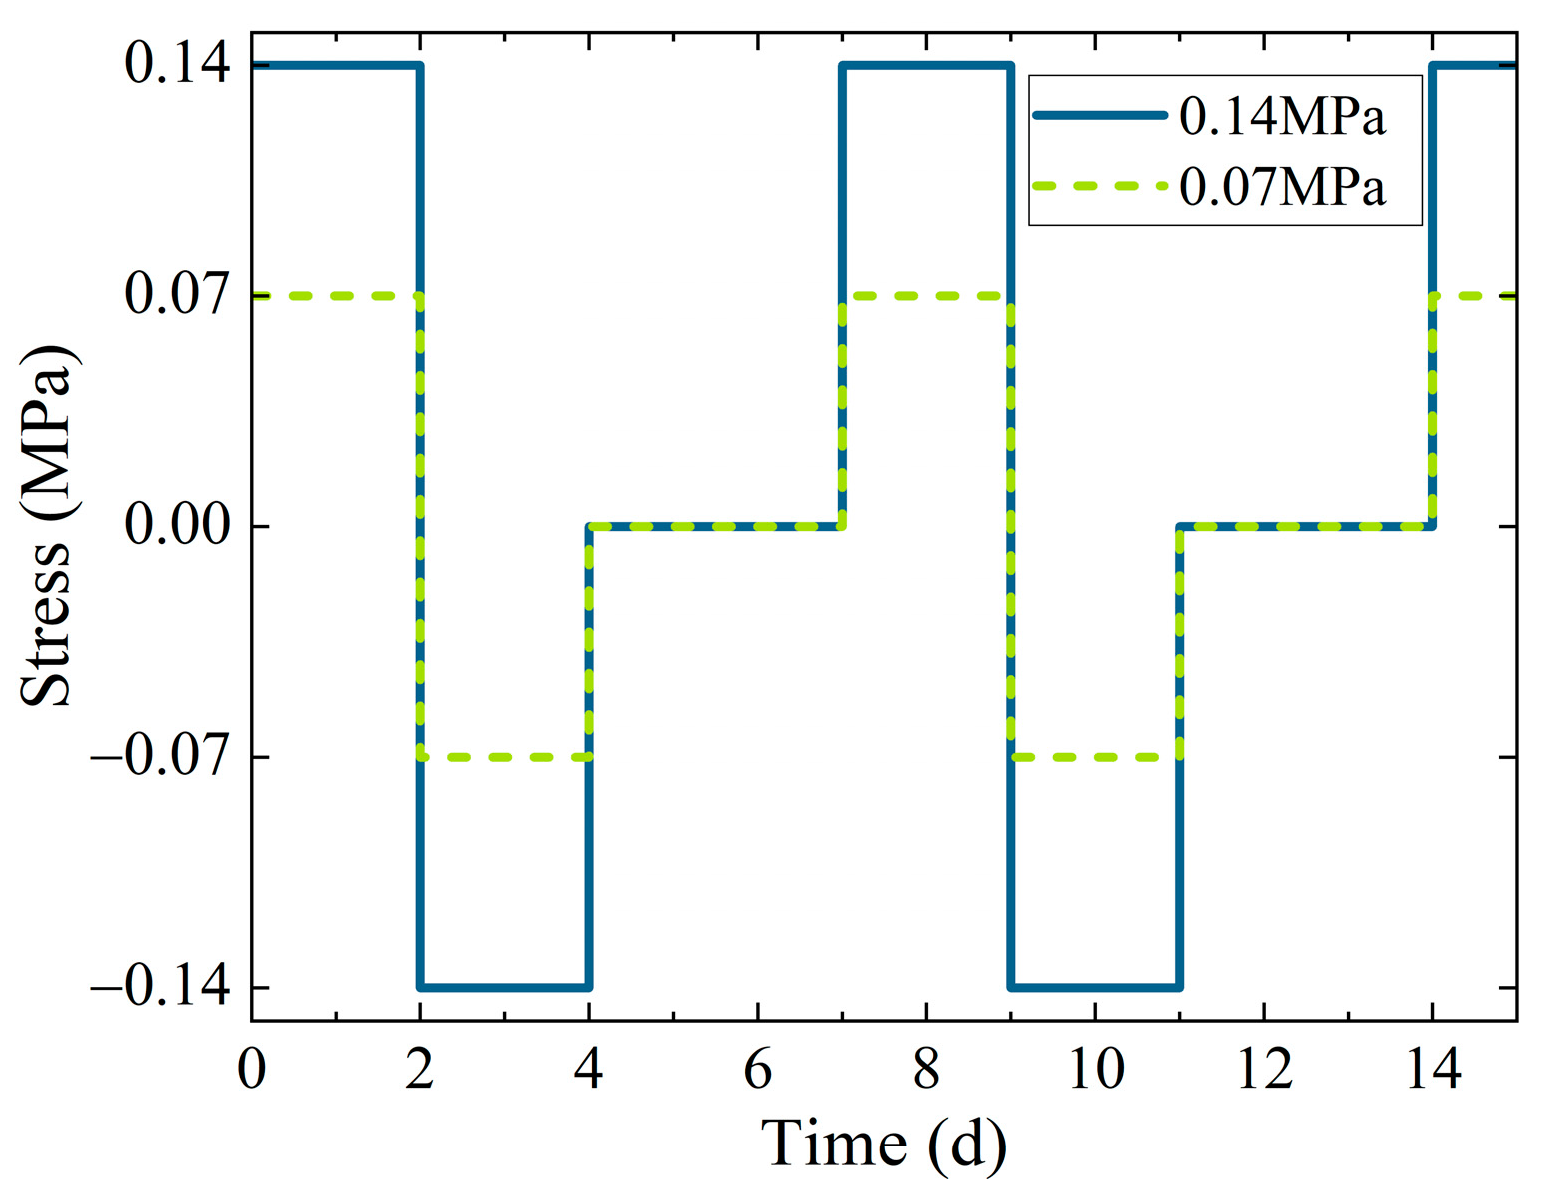
The specimen stress was applied by inducing a certain tensile–compressive deformation in the specimen. The applied deformation value corresponded to the displacement value at the stress level in the specimen’s tensile stress–displacement curve. Since the stress–displacement curve of the specimen dynamically changed during the test, the applied deformation value was updated after each tensile adhesion performance test. The loading approach followed a tensile–compressive cyclic loading pattern. The loading cycle was based on the guidelines in RILEM TC 190-SBJ [34], employing a tensile–compression-load-free cycle. The cycle period was 7 days, with tensile stress loading applied for 2 days, compressive stress loading for 2 days, and the load-free period lasting 3 days. The loading mechanism is shown in Figure 5. RILEM TC 190-SBJ was specifically developed for the durability assessment of building and construction sealants, including structural silicone glazing sealants. Experimental research has demonstrated that the load cycling approach specified in RILEM TC 190-SBJ effectively replicates actual aging phenomena [35].
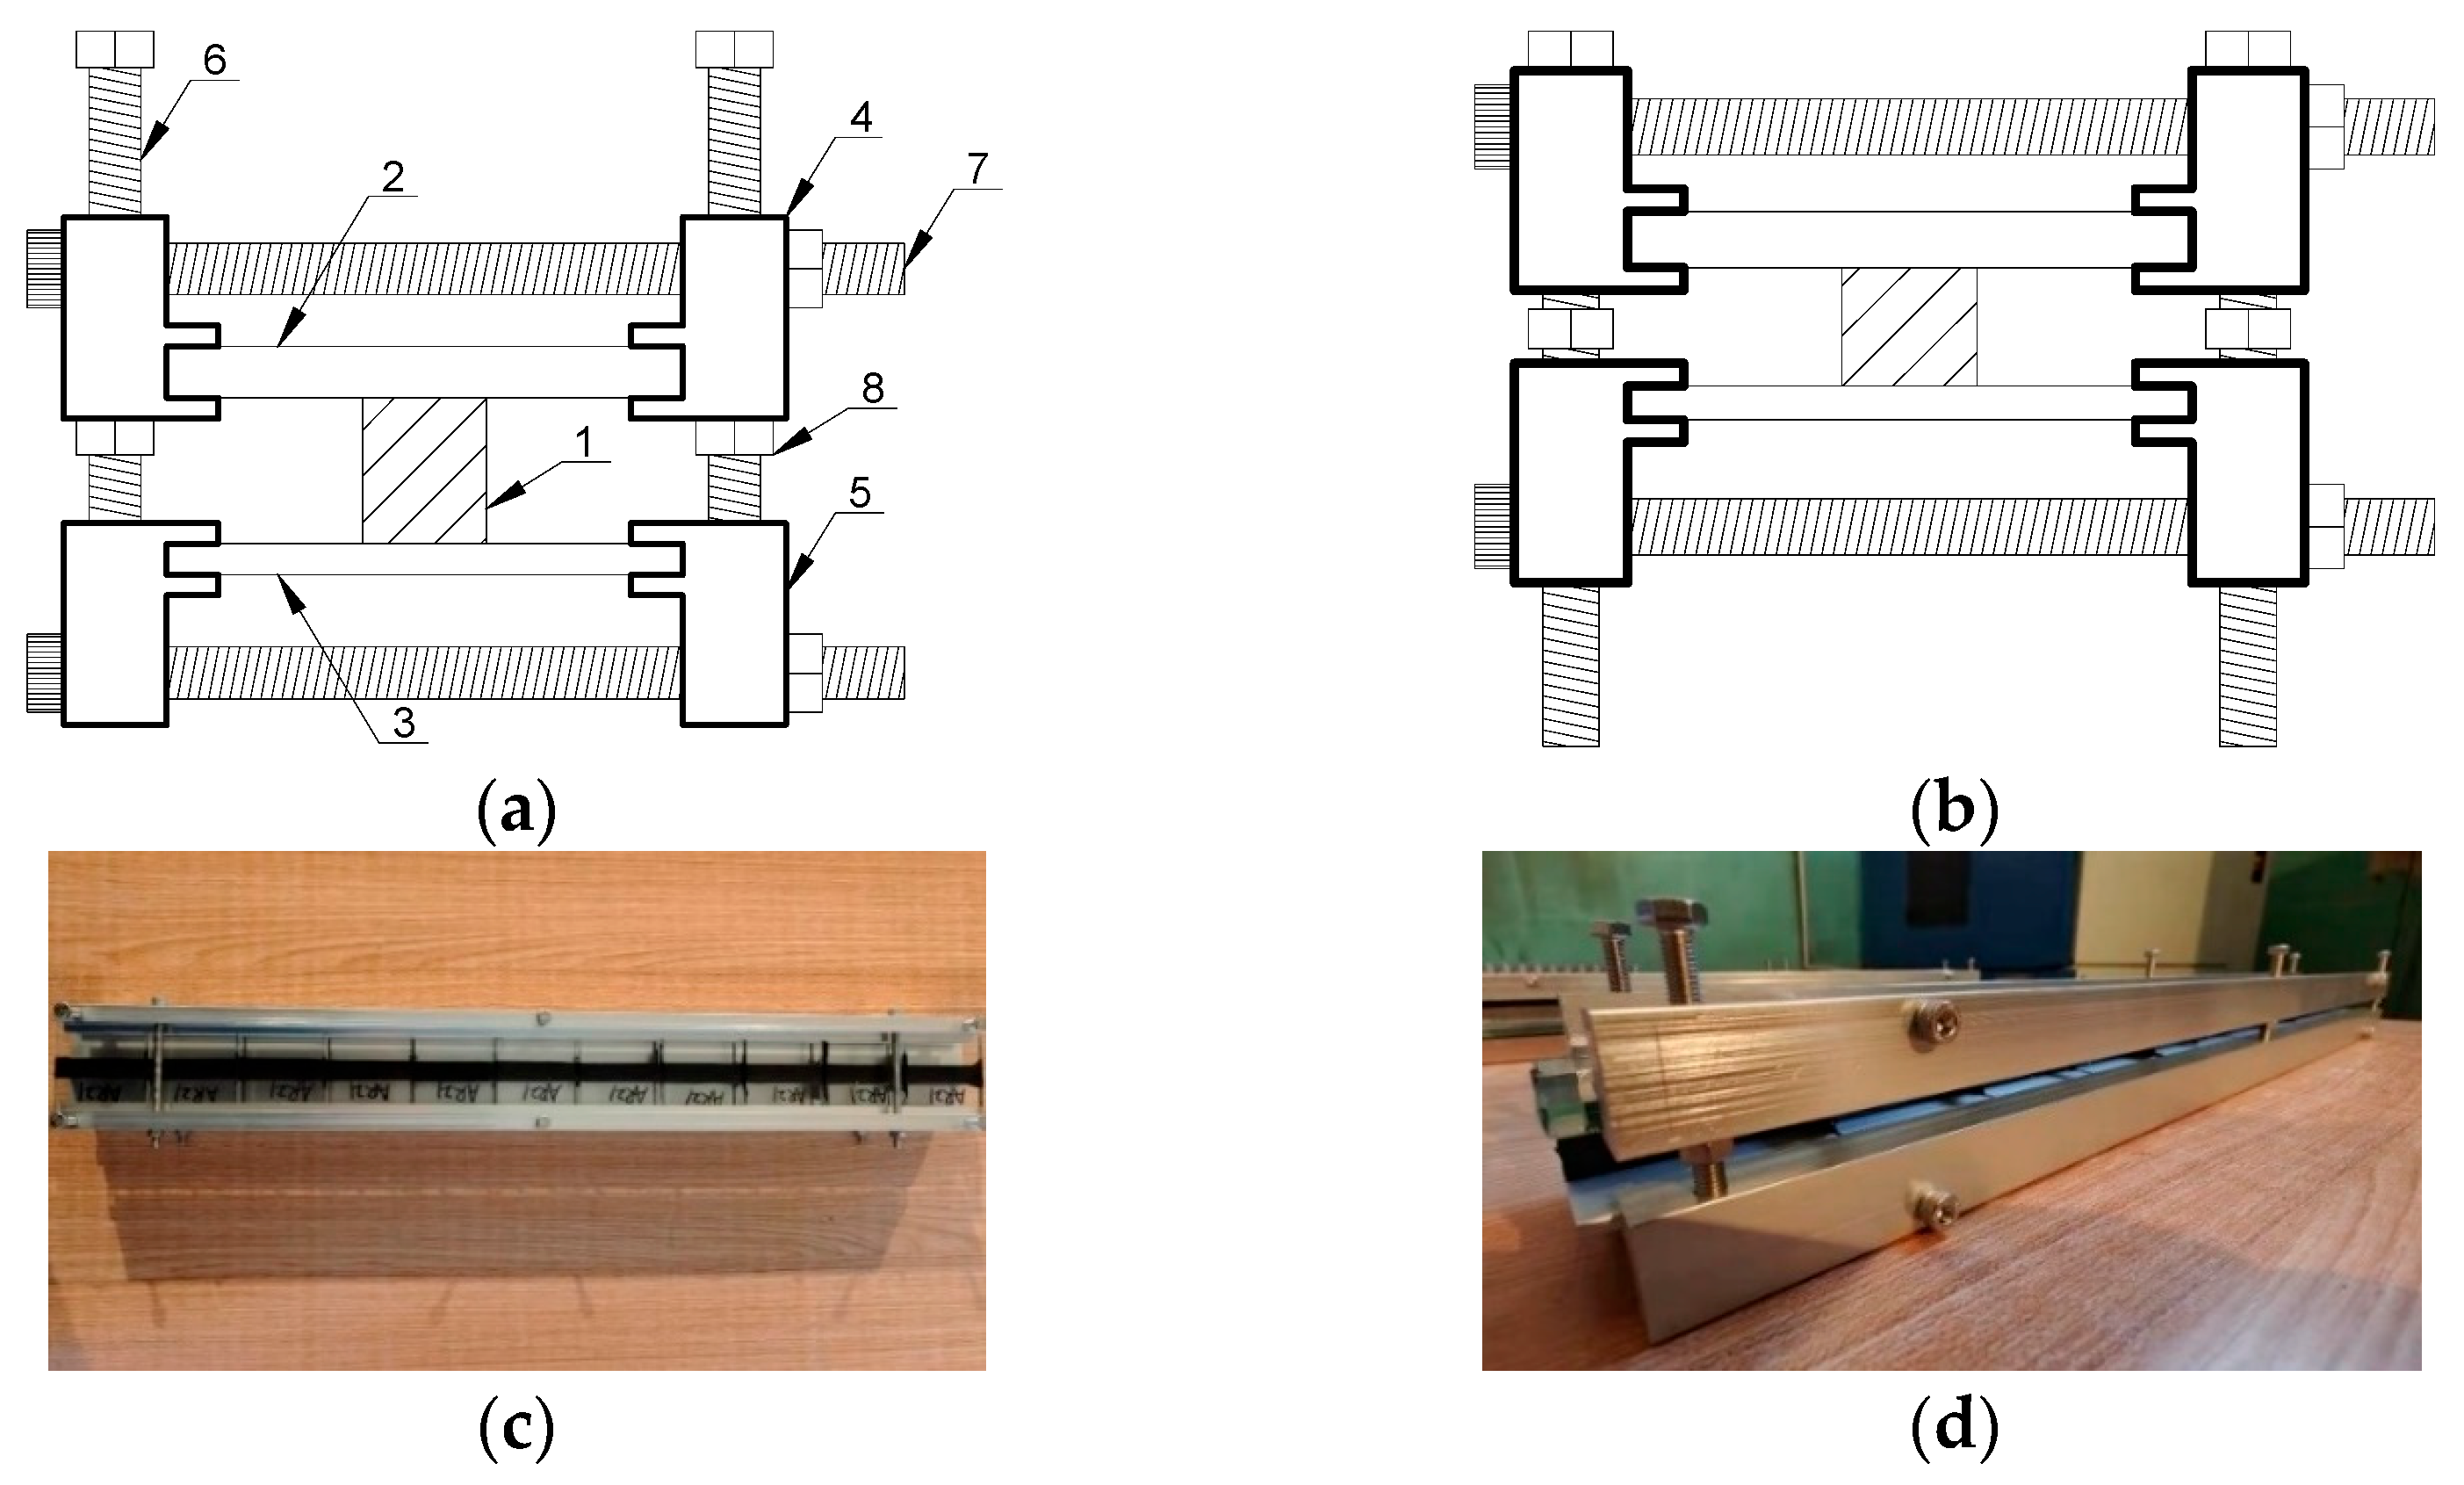
The stress-loading device consists of two clamps, one at the top and one at the bottom. The clamps fix the specimen’s substrate, and the distance between the upper and lower substrates, which corresponds to the thickness of the sealant, was adjusted by the vertical limit screw and nut between the clamps. This setup controls the sealant deformation and applies the predetermined stress value to the sealant [36]. The horizontal limit screw and nut were only used to fix and clamp the specimen, without any role in displacement adjustment. The stress-loading device is shown in Figure 6.

2.2.2. Outdoor Aging Test

The specimens for outdoor aging were placed in Chaoyang District, Beijing, China, where they were exposed to the local environmental conditions, including temperature, humidity, and sunlight, without any applied stress. The specimens were placed on a sample rack at a 45-degree angle to the ground, with the sealant’s length direction perpendicular to the ground to prevent water accumulation. The specimens were positioned to receive direct sunlight exposure, as shown in Figure 7.
The outdoor aging duration was 3 years, with specimens periodically taken out to test their tensile adhesion properties. For sealant A, samples were taken every month during the first year, every two months during the second year, and every three months during the third year. Five specimens were selected each time, and the average of their test data was used as the observation value. For sealant B, samples were taken every two months during the first year, every four months during the second year, and every six months during the third year. Similarly, five specimens were selected each time, and the average of their test data was used as the observation value. A total of 110 specimens of sealant A and 55 specimens of sealant B were used, resulting in 165 specimens in total.

2.3. Test Measurements

Tensile adhesion tests were conducted on the specimens according to ASTM C1184-14 [37] and ASTM C1135-19. The tensile test was performed at a speed of 12 ± 0.7 mm/min, with the test room maintained at a temperature of 23 ± 2 °C and a relative humidity of 50 ± 5%.
The tensile bond strength (TBS) of the specimens was calculated using Equation (1), and the arithmetic mean of five specimens’ data was taken as the observation value.
T s = P S
where Ts denotes the tensile bond strength, P is the maximum tensile force, and S is the initial cross-sectional area of the specimen.

3. Results and Discussion

The abbreviations included in this section: UV—ultraviolet; TBS—tensile bond strength; SSG—silicone structural glazing.

3.1. Failure Mode

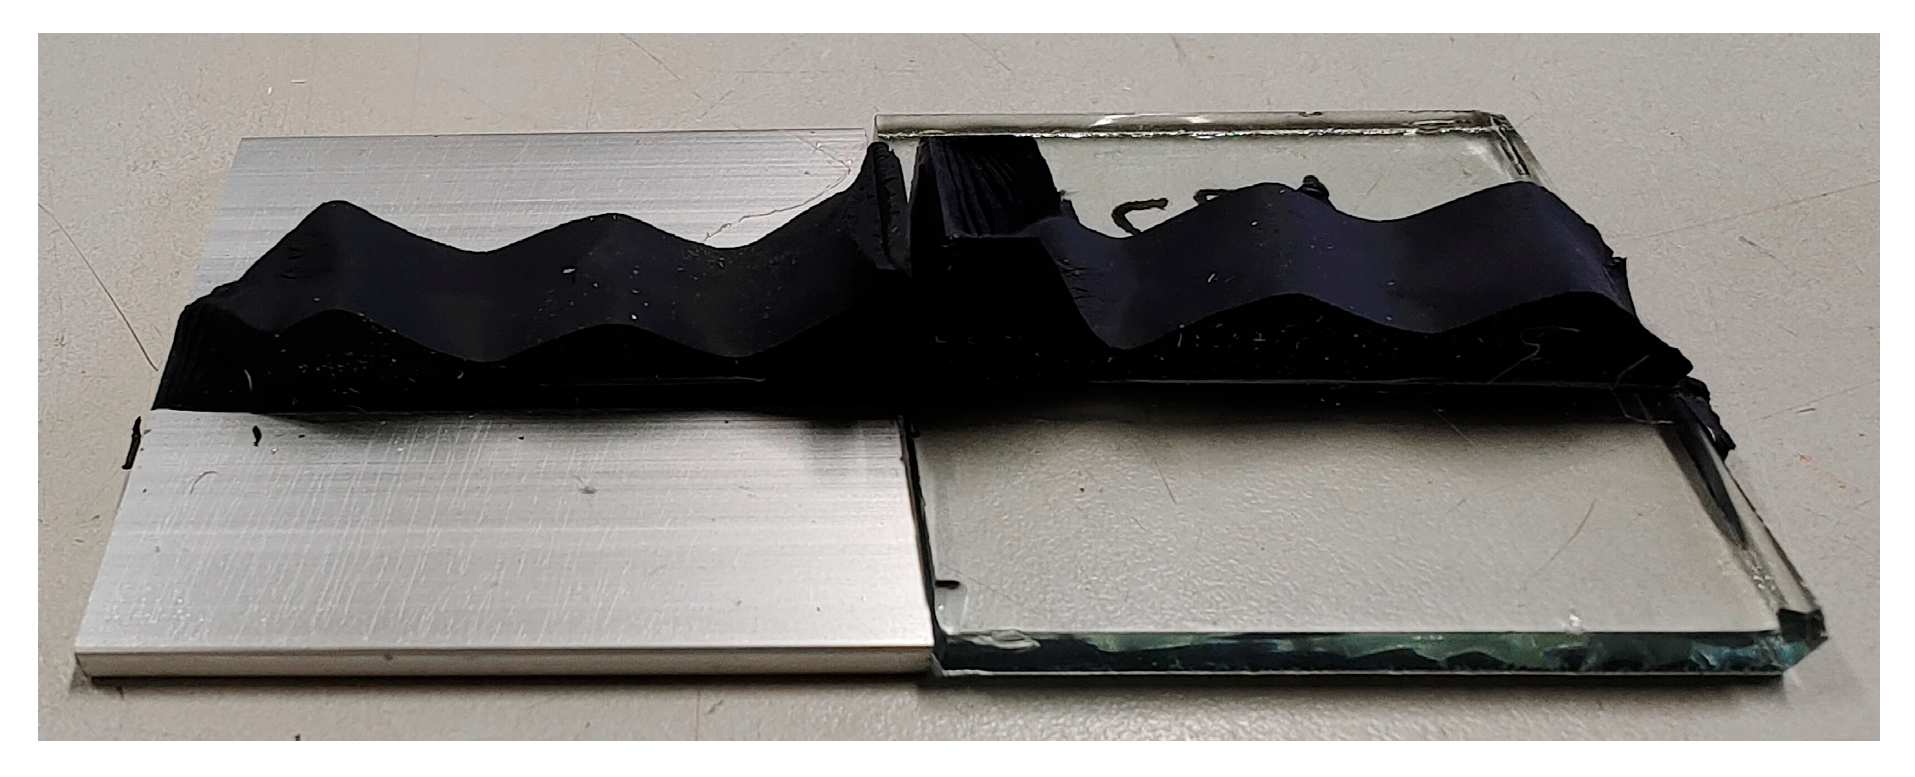
The tensile failure mode of the test specimens is shown in Figure 8. The overall failure characteristic was characterized by a fracture occurring at the mid-section of the sealant, presenting a serrated fracture surface. The failure was initiated at both ends of the sealant, with fracture planes forming angles of approximately from 40° to 60° relative to the horizontal plane. As the sealant underwent further elongation, a secondary fracture surface gradually developed, followed by rapid crack propagation until complete specimen fracture.
The tensile load–displacement curve of the specimen is shown in Figure 9. After the formation of the first fracture surface, the tensile load exhibited a fluctuating decline trend, indicating that the maximum tensile load occurred prior to the initiation of the first fracture surface.

3.2. Laboratory Aging Test Results

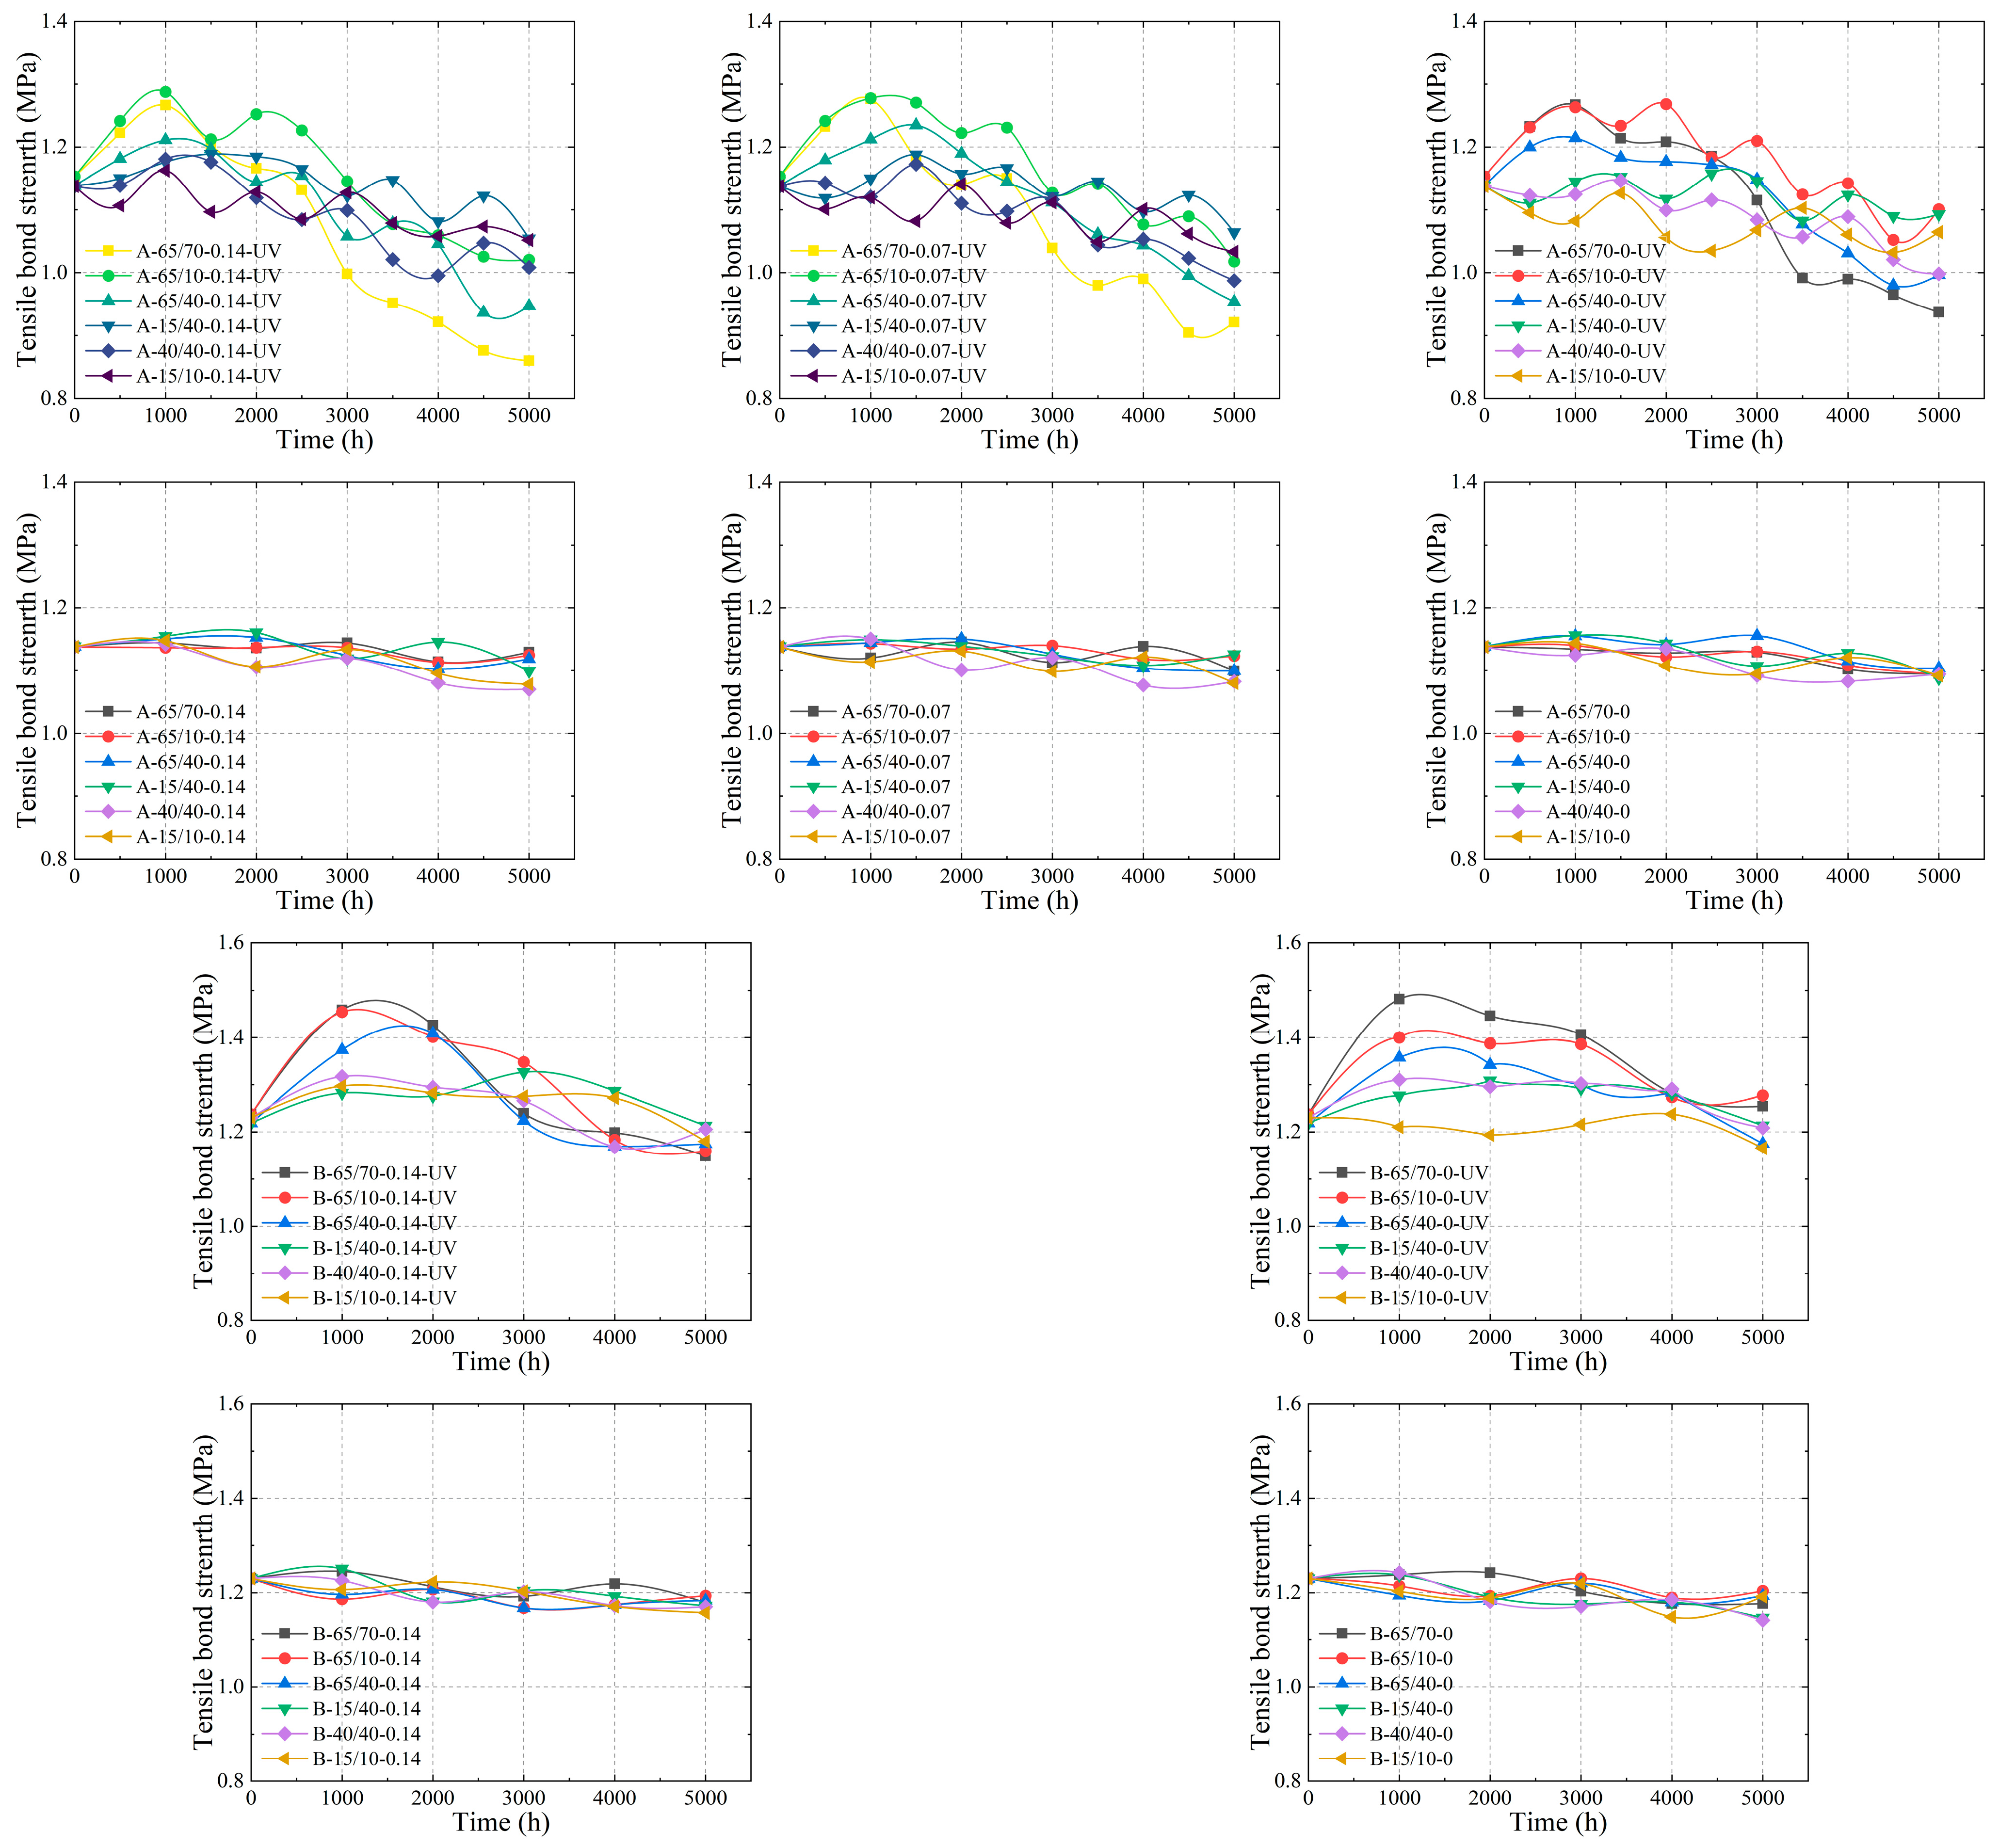
Figure 10 illustrates the TBS evolution of all specimens during laboratory aging tests. Under UV irradiance at 40 W/m2, sealants A and B demonstrated a marked upward TBS trend during the early testing phase (0–1500 h), followed by a gradual decline in the middle testing phase (1500–5000 h). Notably, the TBS degradation rate during the mid-phase exceeded that observed in the late testing phase (3500–5000 h). Under 0 W/m2 UV irradiance, both sealants exhibited progressive TBS reduction throughout testing, without initial strength enhancement.
The minimum TBS values for all specimen groups occurred at 5000 h. In Condition I, sealant A-65/70-0.14-UV and B-65/70-0.14-UV specimen groups registered the lowest TBS among all tested specimen groups, measuring 0.86 MPa and 1.15 MPa, respectively. Compared to the initial TBS values, sealant A showed a 24.6% reduction while sealant B exhibited a 6.5% decrease. The TBS enhancement under elevated temperature and humidity conditions partially mitigated overall TBS degradation relative to initial values. When compared to the maximum achieved TBS during aging, the reductions increased to 32.1% for sealant A and 21.2% for sealant B.
The TBS–time curves exhibited significant fluctuations, primarily attributable to two factors: 1. measurement deviations caused by material heterogeneity and localized specimen defects; 2. ongoing cross-linking reactions within the SSG sealants following initial curing enhance TBS but generate fluctuations due to variable reaction rates.
As the presented data represent arithmetic averages from five specimens with approximately ±10% deviations, the inherent material variability and defect-induced errors were partially mitigated. This confirms that cross-linking reactions constitute the predominant source of TBS fluctuations. Furthermore, the reduced fluctuation amplitude observed during the later testing phase correlates with the progressive completion of cross-linking reactions, thereby diminishing their influence on TBS variations.

3.2.1. Effect of Temperature

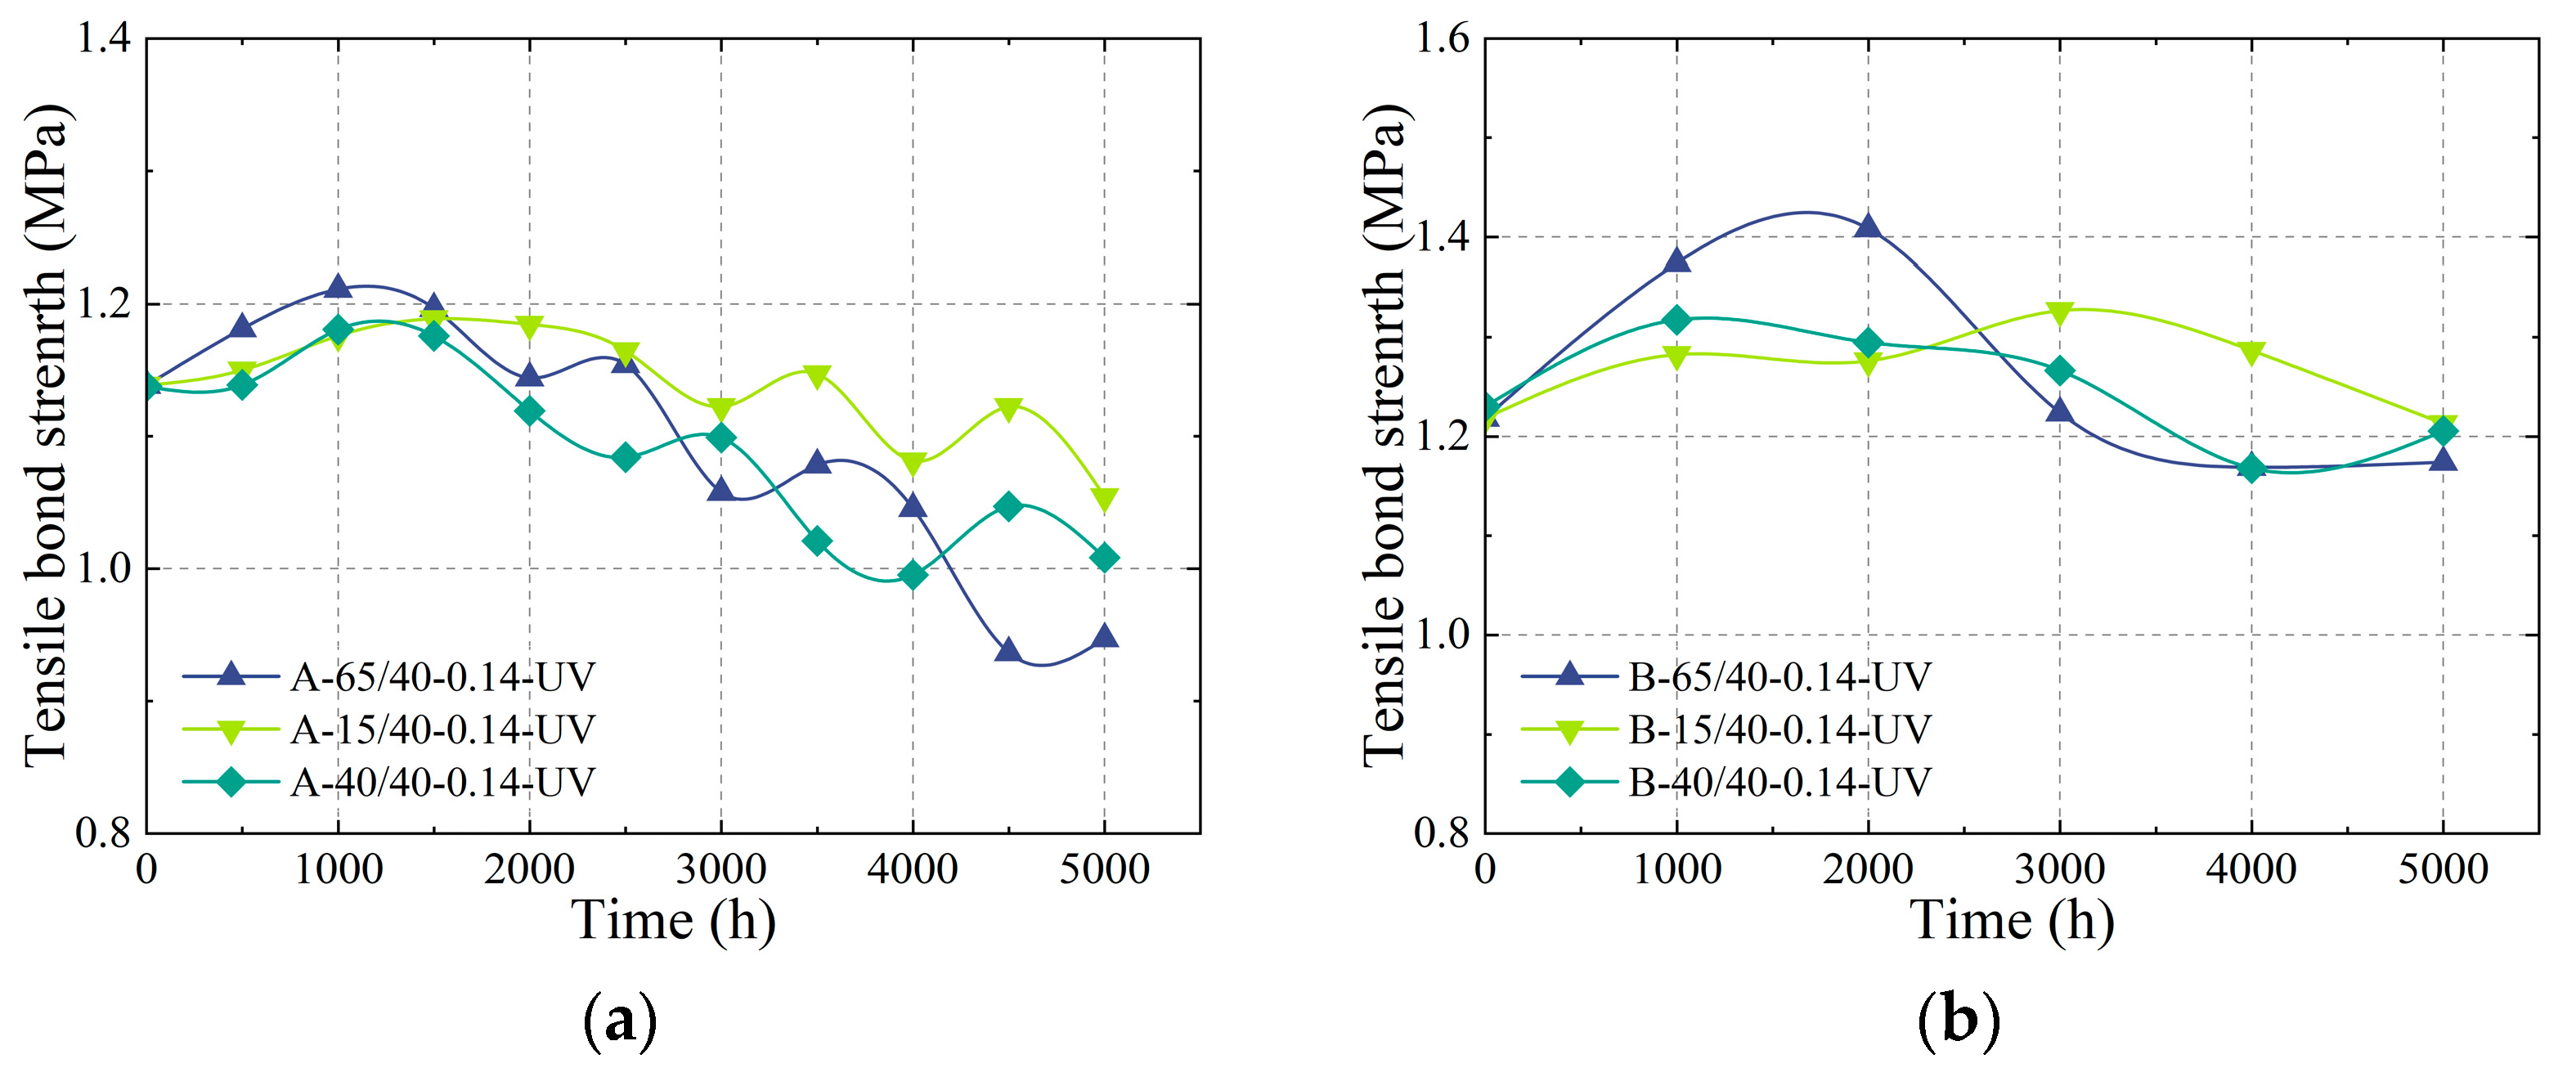
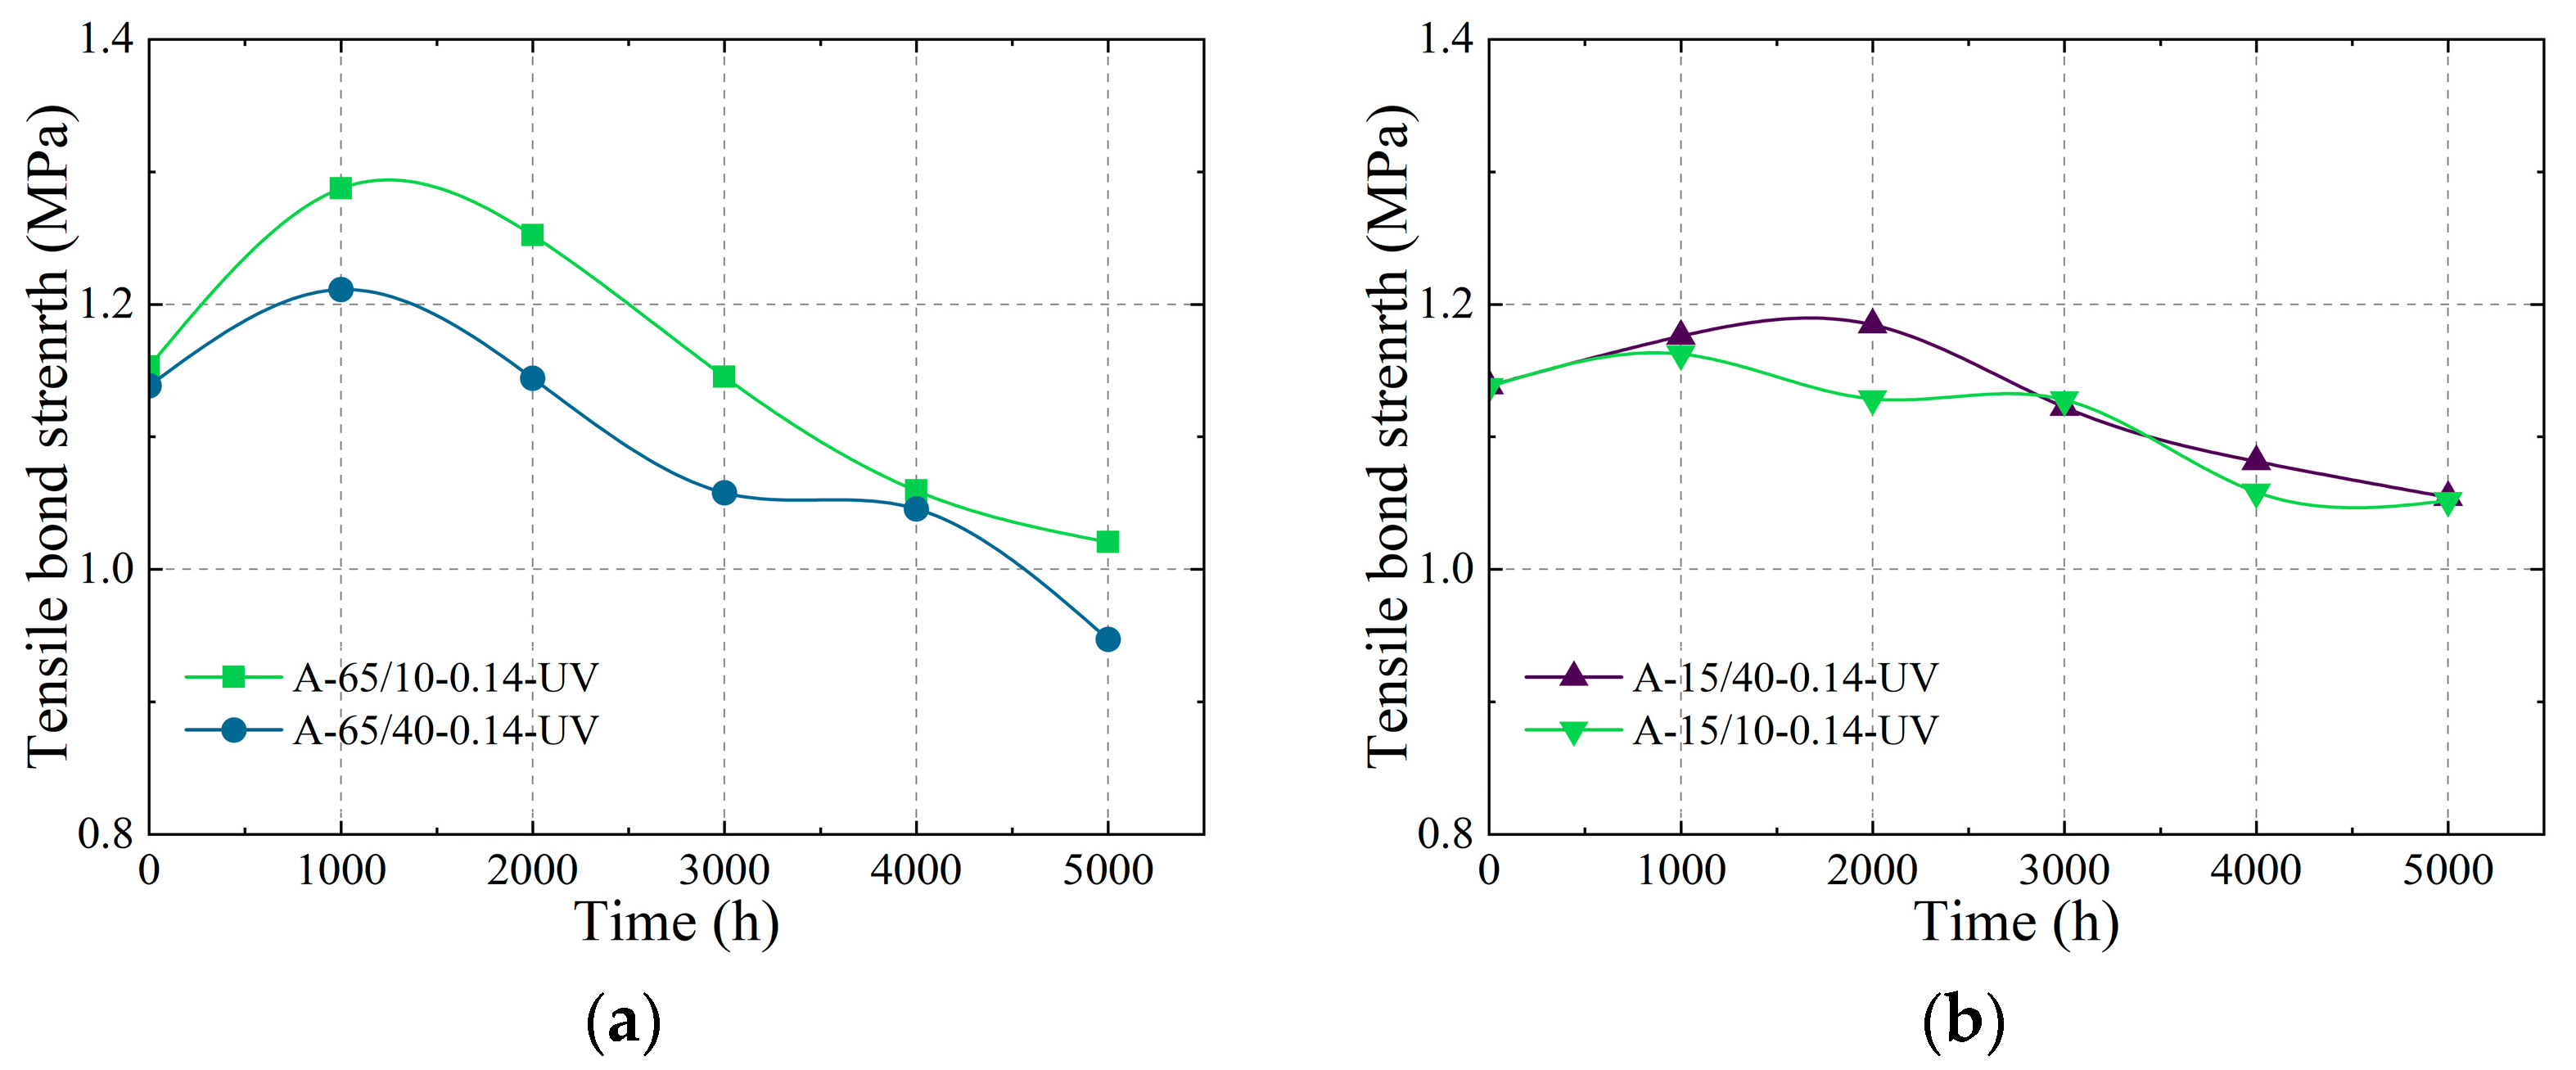
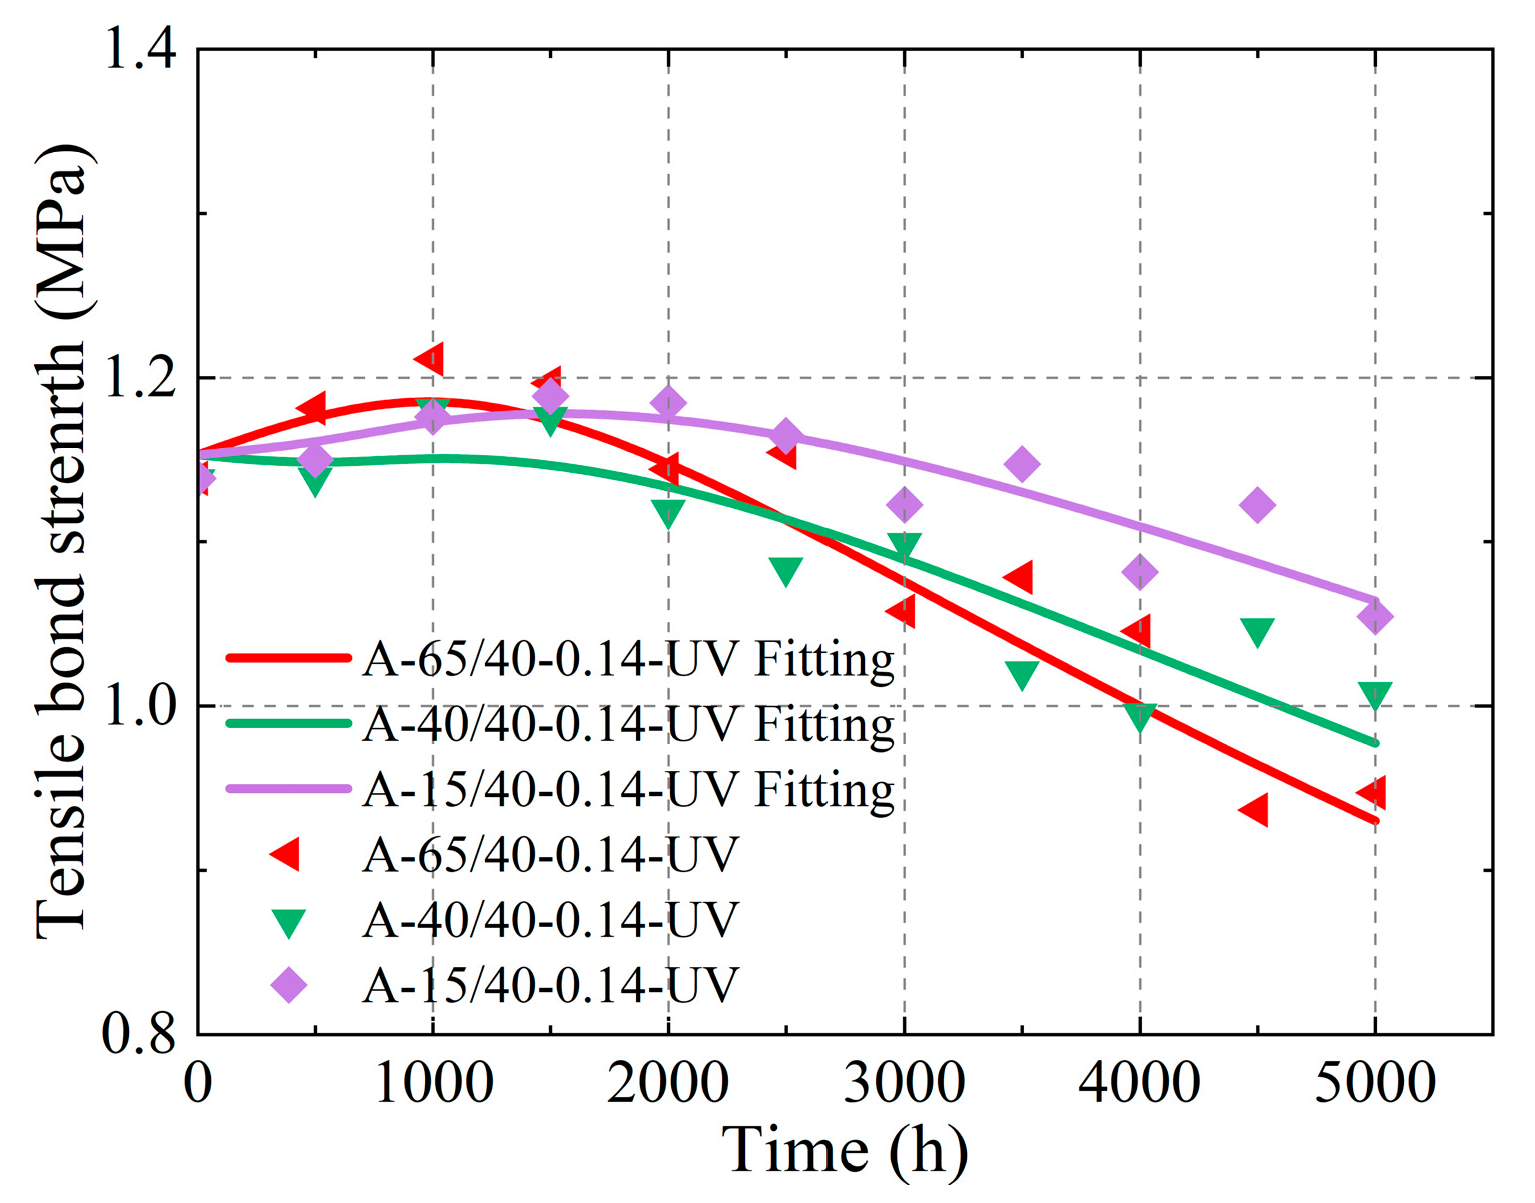
Conditions III, V, and IV maintained humidity of 40% with temperatures of 65 °C, 40 °C, and 15 °C respectively. The TBS evolution of specimen groups subjected to 40 W/m2 UV irradiance and 0.14 MPa stress across these three conditions were compared in Figure 11. During the early testing phase, both the rate and magnitude of TBS enhancement increased with elevated temperatures, accompanied by earlier occurrence of TBS peaks at higher thermal levels. In the middle and late testing phase, the TBS degradation rate accelerated proportionally with temperature increases. At 5000 h, final TBS values demonstrated an inverse temperature dependency, decreasing systematically with rising thermal conditions.
Two concurrent chemical reactions—cross-linking and degradation—were identified during SSG sealant aging, both processes progressing simultaneously. Cross-linking reactions were observed to enhance TBS, while degradation reactions reduced it, with net TBS variations governed by their superimposed effects. During the early aging phase, if the increase caused by the crosslinking reaction is greater than the decrease caused by degradation, the TBS exhibits an increasing trend, otherwise, it shows a decreasing trend. As the crosslinking reaction gradually completes, the degradation reaction becomes dominant, leading to a decrease in TBS. Distinct cross-linking efficiencies were recorded between sealants A and B, with sealant B demonstrating greater TBS enhancement magnitudes. Under Condition III, the A-65/40-0.14-UV specimen group showed a 6.37% TBS increase, whereas the B-65/40-0.14-UV group achieved a 15.58% increase.
According to the Arrhenius equation, chemical reaction rates are temperature-dependent, with higher temperatures accelerating reaction kinetics. The energy carried by heat in the air acts on the chemical structure of SSG sealant, making its molecular activity more active and unstable. This not only promotes the formation of more crosslinking chemical bonds but also leads to the breakage of Si-C bonds and C-H bonds. Within the temperature range of the sealant’s service environment, it will not cause oxidative decomposition of the calcium carbonate filler nor break the main chain Si-O bonds of polysiloxane. Therefore, within the service temperature range, the aging mechanism of SSG sealant remains consistent [32]. Consequently, temperature elevation enhances both the cross-linking and degradation reaction rates during aging processes. Cross-linking reactions predominantly occurred during the early aging phase. Therefore, in the early testing phase, elevated temperature enhanced both the increased rate and magnitude of TBS, with an earlier emergence of the maximum TBS values. During the middle and late testing phase, when cross-linking reactions diminished and degradation became dominant, temperature elevation accelerated the TBS decrease rate. This mechanism led to reduced TBS at 5000 h under elevated temperature conditions.

3.2.2. Effect of Humidity

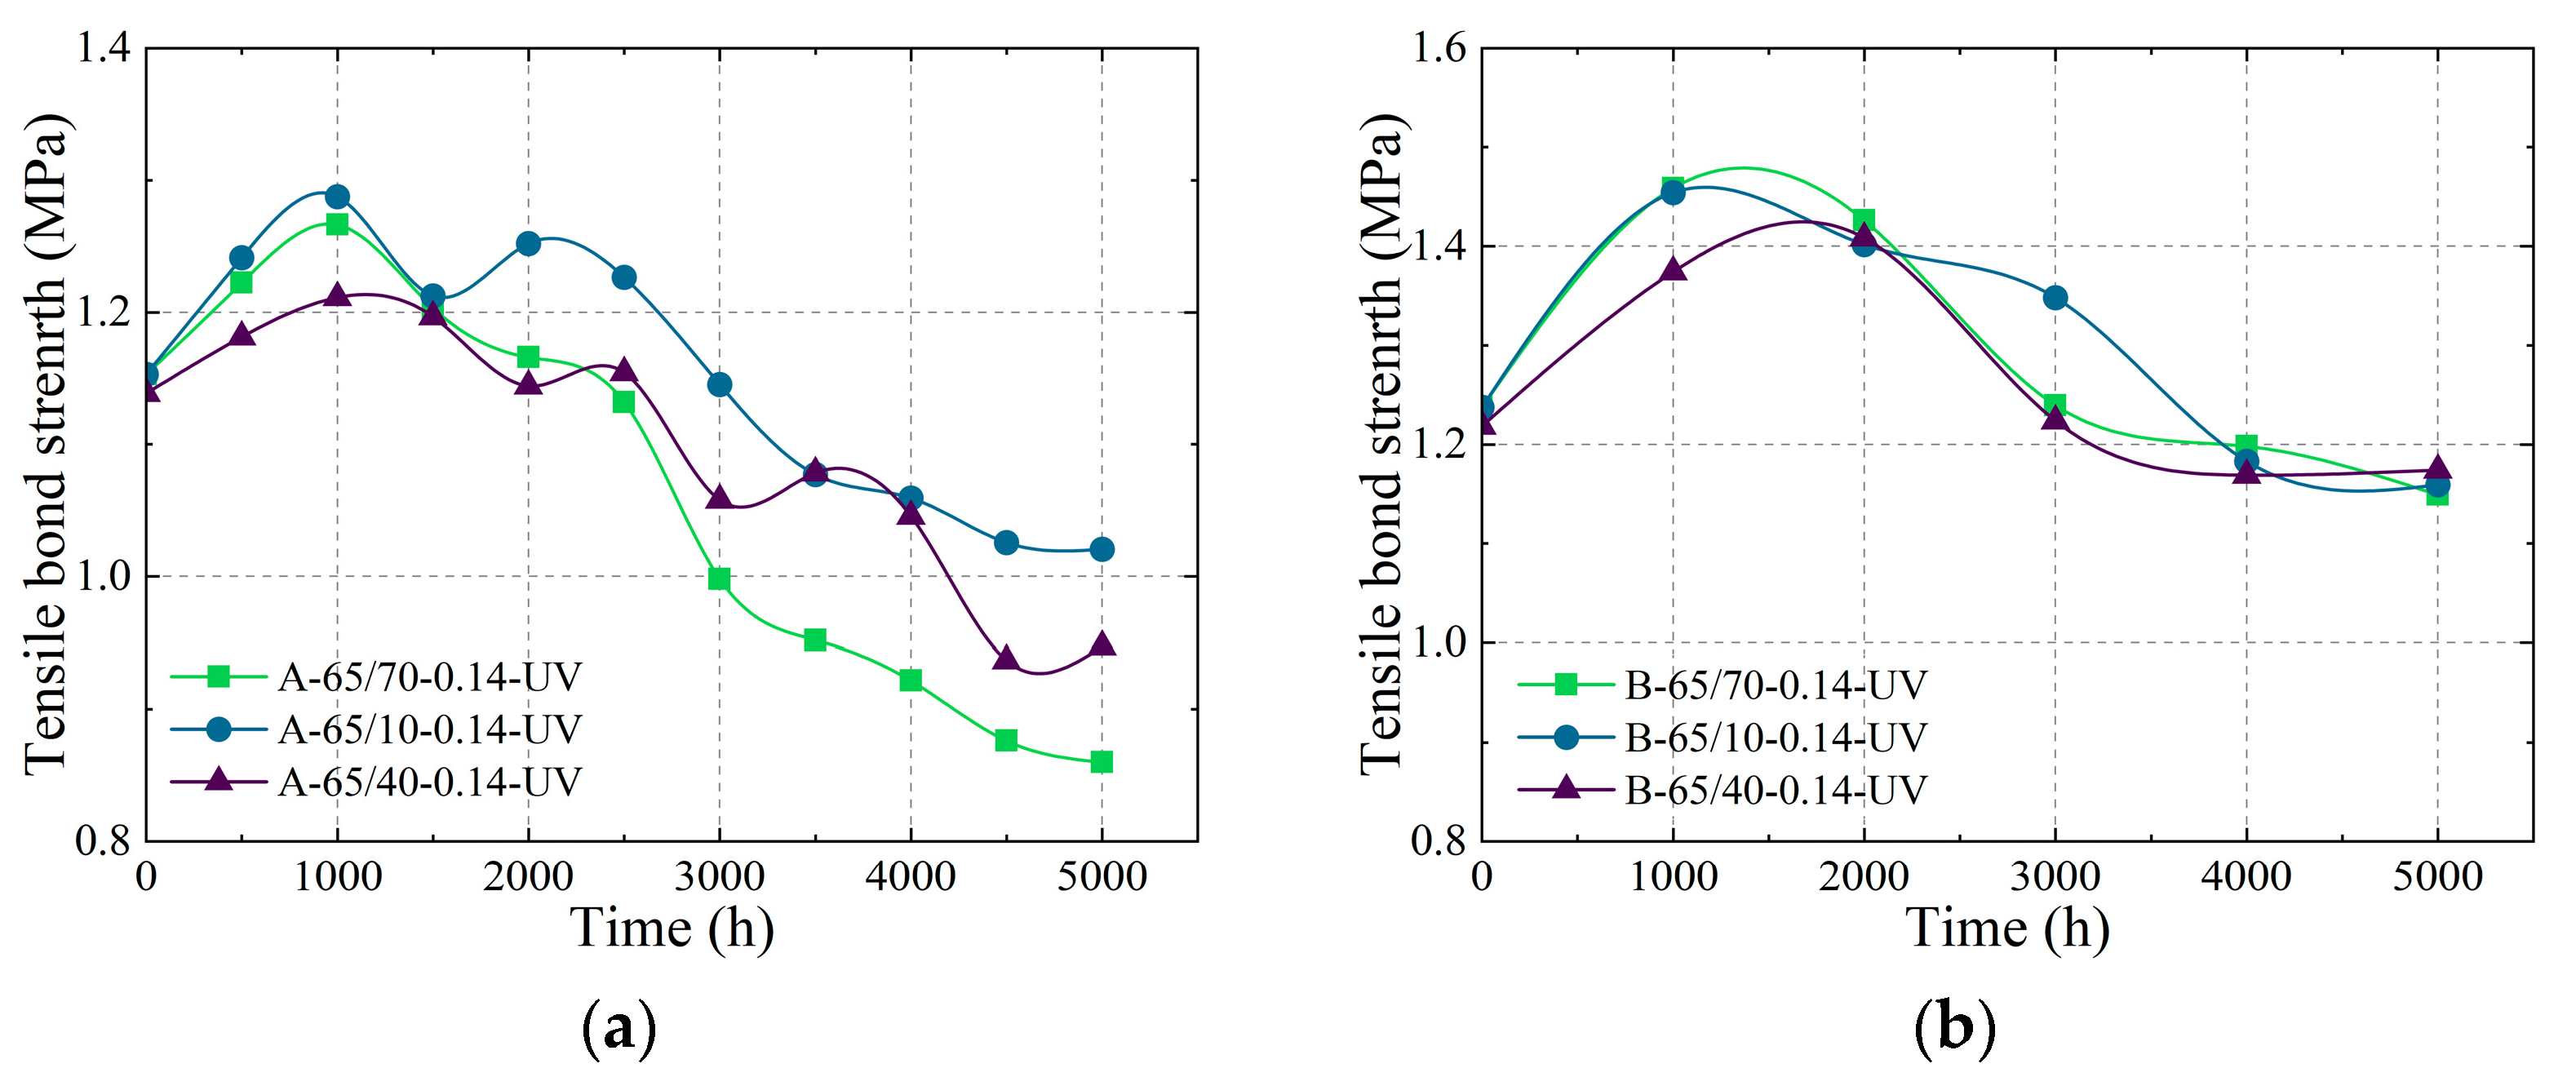
Conditions I, III, and II maintained a temperature of 65 °C with humidity of 70%, 40%, and 10%, respectively. The TBS evolution of specimen groups subjected to 40 W/m2 UV irradiance and 0.14 MPa stress across these three conditions were compared in Figure 12. During the early testing phase, both the increased rate and magnitude of TBS enhanced with elevated humidity, with an earlier emergence of the maximum TBS values under higher humidity conditions. In the middle and late testing phases, the TBS decrease rate accelerated progressively with humidity elevation, ultimately leading to reduced TBS values at 5000 h under high-humidity exposure. The humidity-induced TBS variation mechanism demonstrated consistency with temperature-related patterns, confirming that elevated humidity accelerates both cross-linking and degradation reaction rates.

3.2.3. Effect of Stress

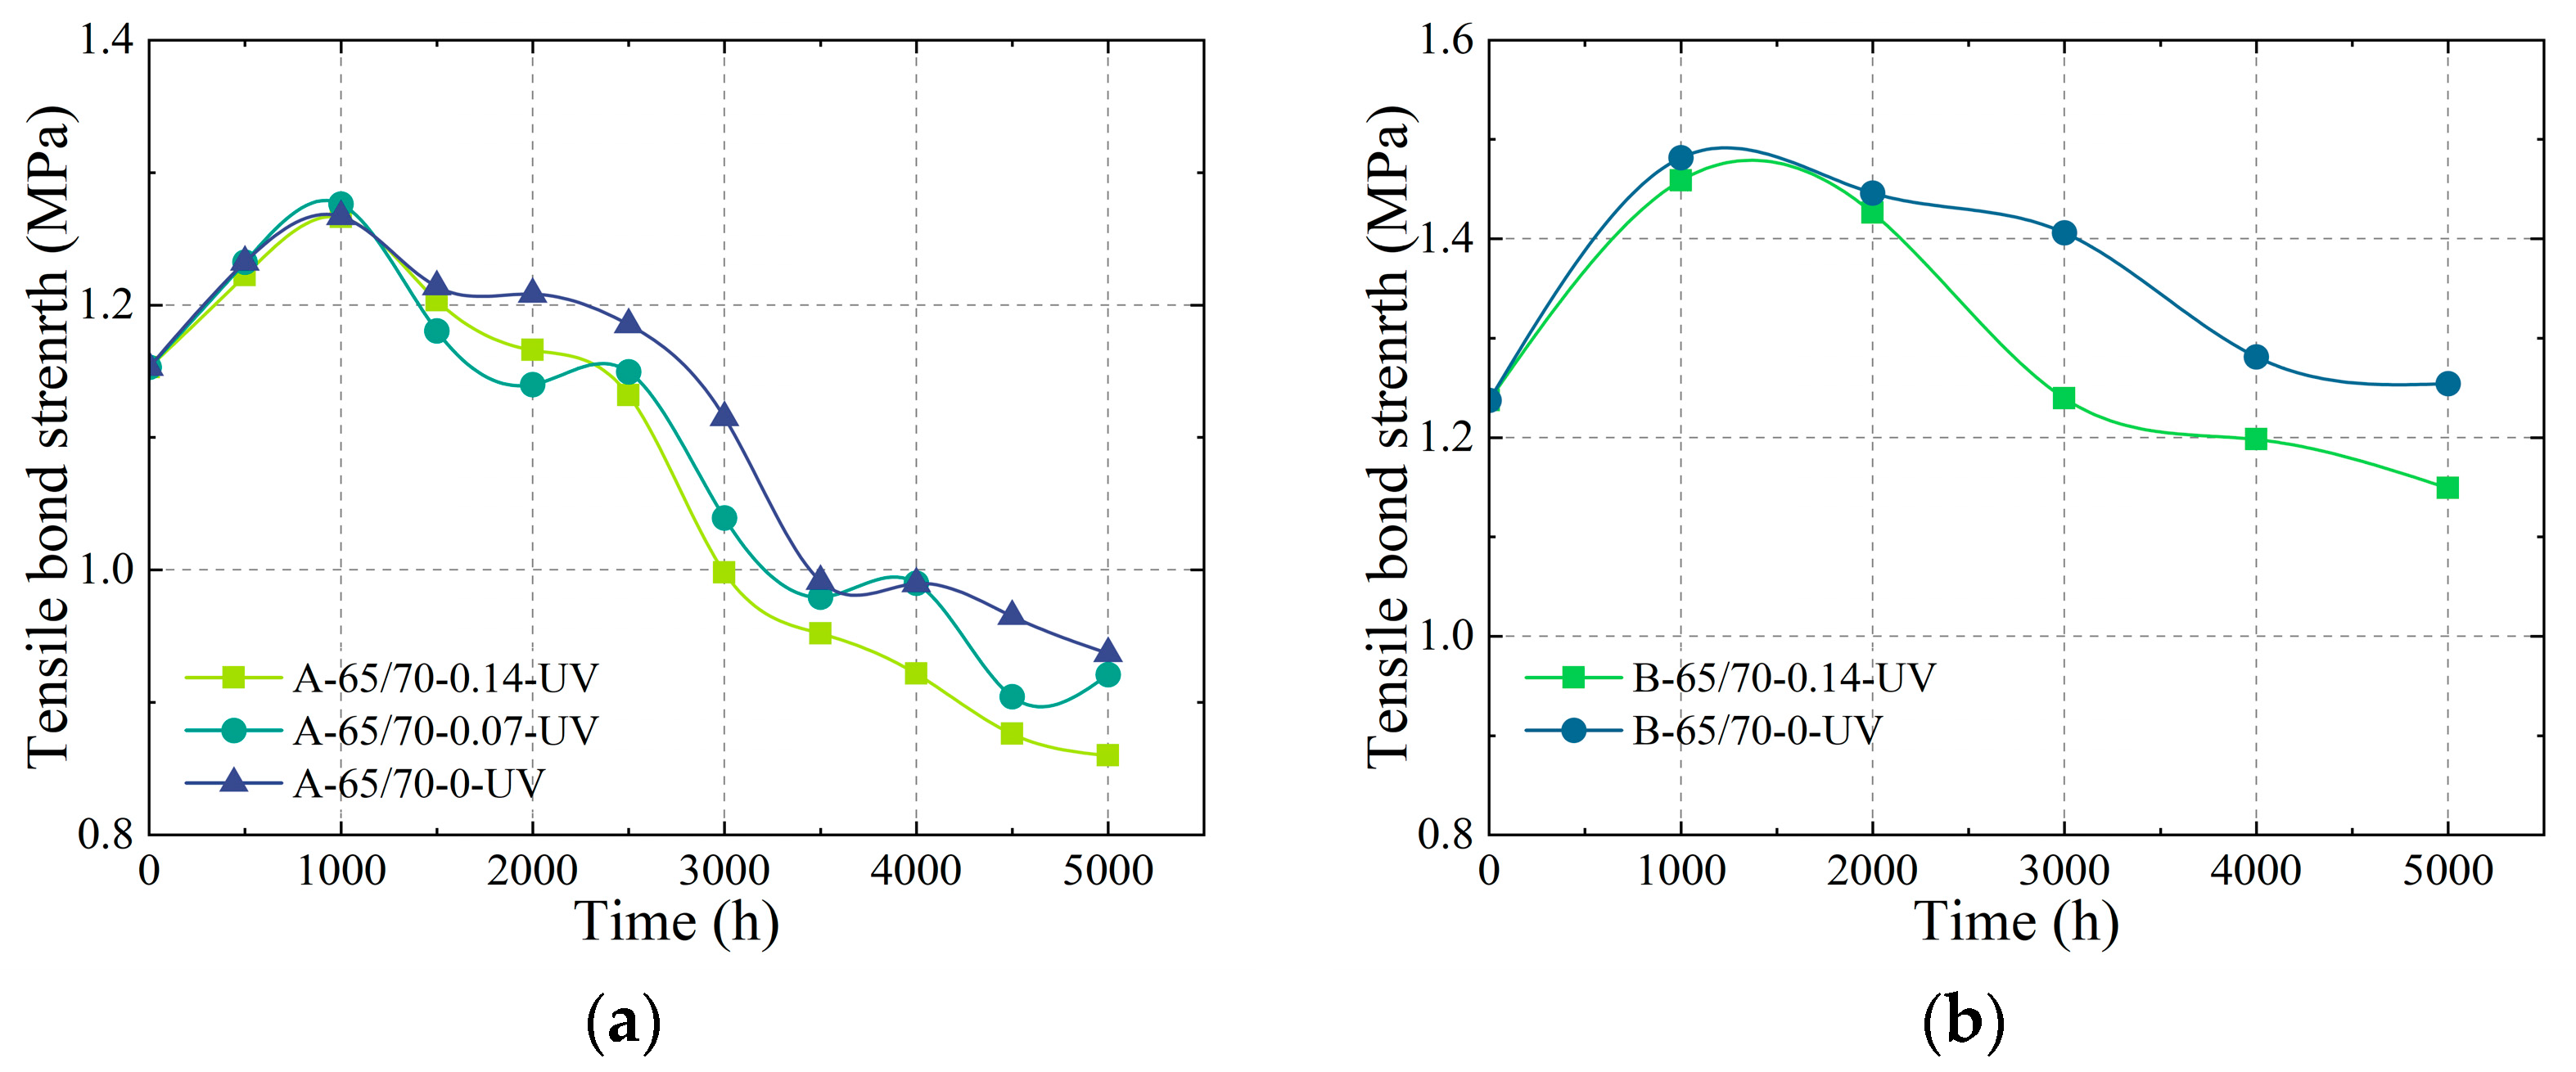
In each test condition, sealant A specimens were subjected to three distinct stress levels of 0.14 MPa, 0.07 MPa, and 0 MPa, while sealant B specimens had two stress levels of 0.14 MPa and 0 MPa. The TBS comparison of specimen groups under condition I with UV irradiance of 40 W/m2 is presented in Figure 13. During the early testing phase, both the increased rate and magnitude of TBS enhanced with elevated stress levels, though with minimal differences in both TBS evolution characteristics and maximum TBS values emergence timing. In the middle and late testing phases, the TBS decrease rate accelerated proportionally with increasing stress levels, ultimately resulting in reduced TBS values at 5000 h under higher stress conditions. The stress-induced TBS variation patterns demonstrated fundamental consistency with temperature- and humidity-related mechanisms, confirming that stress elevation accelerates both cross-linking and degradation reaction rates. However, the degree of influence exerted by stress is smaller than that of temperature and humidity, attributable to the relatively low applied stress levels.

3.2.4. Effect of UV Irradiance

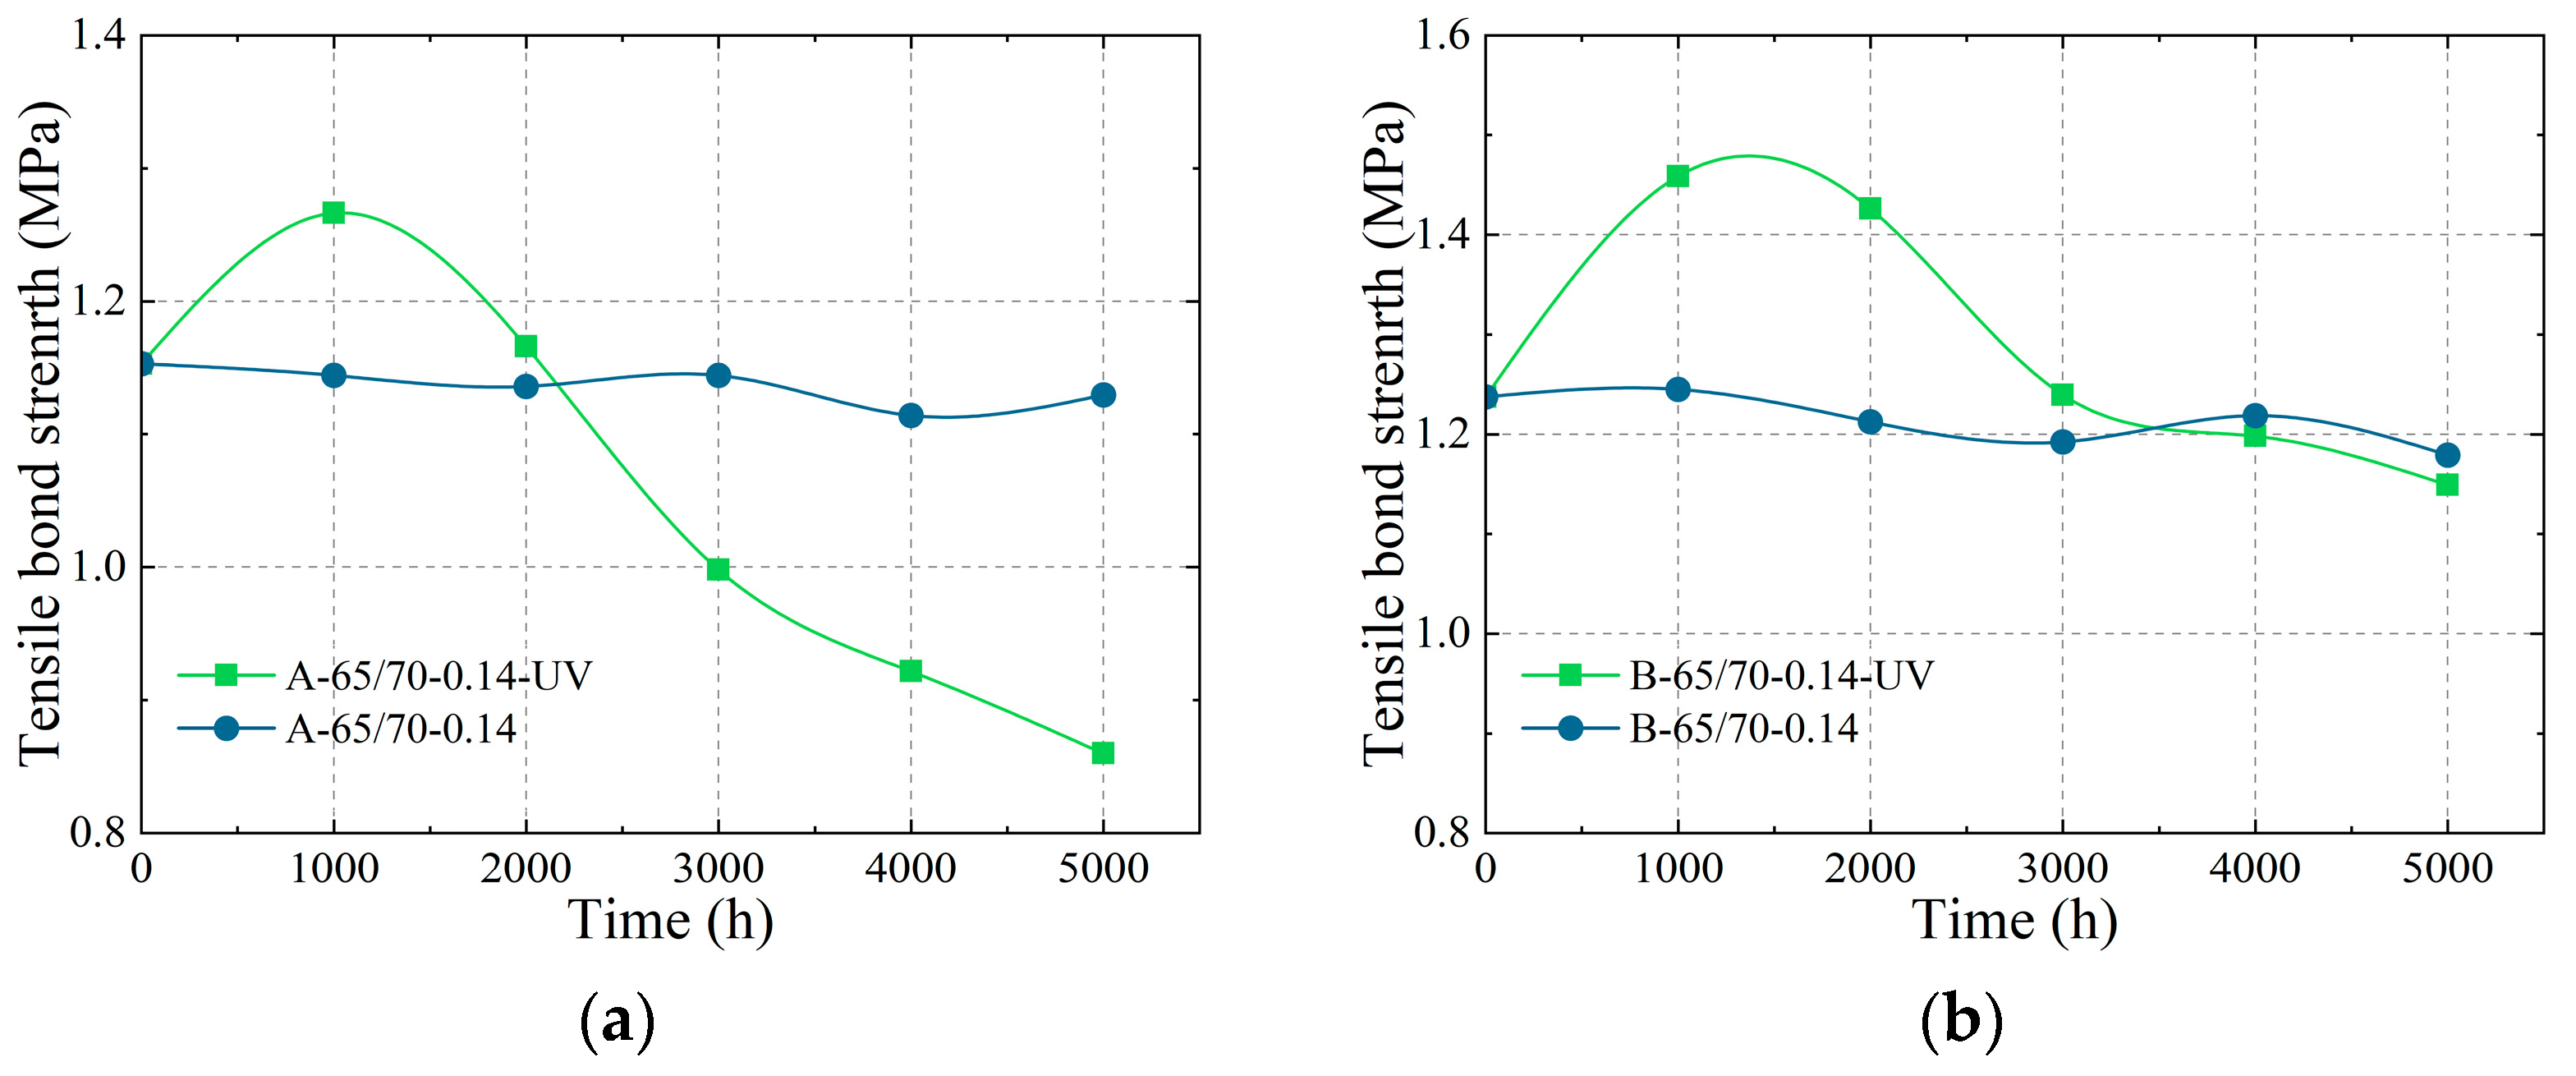
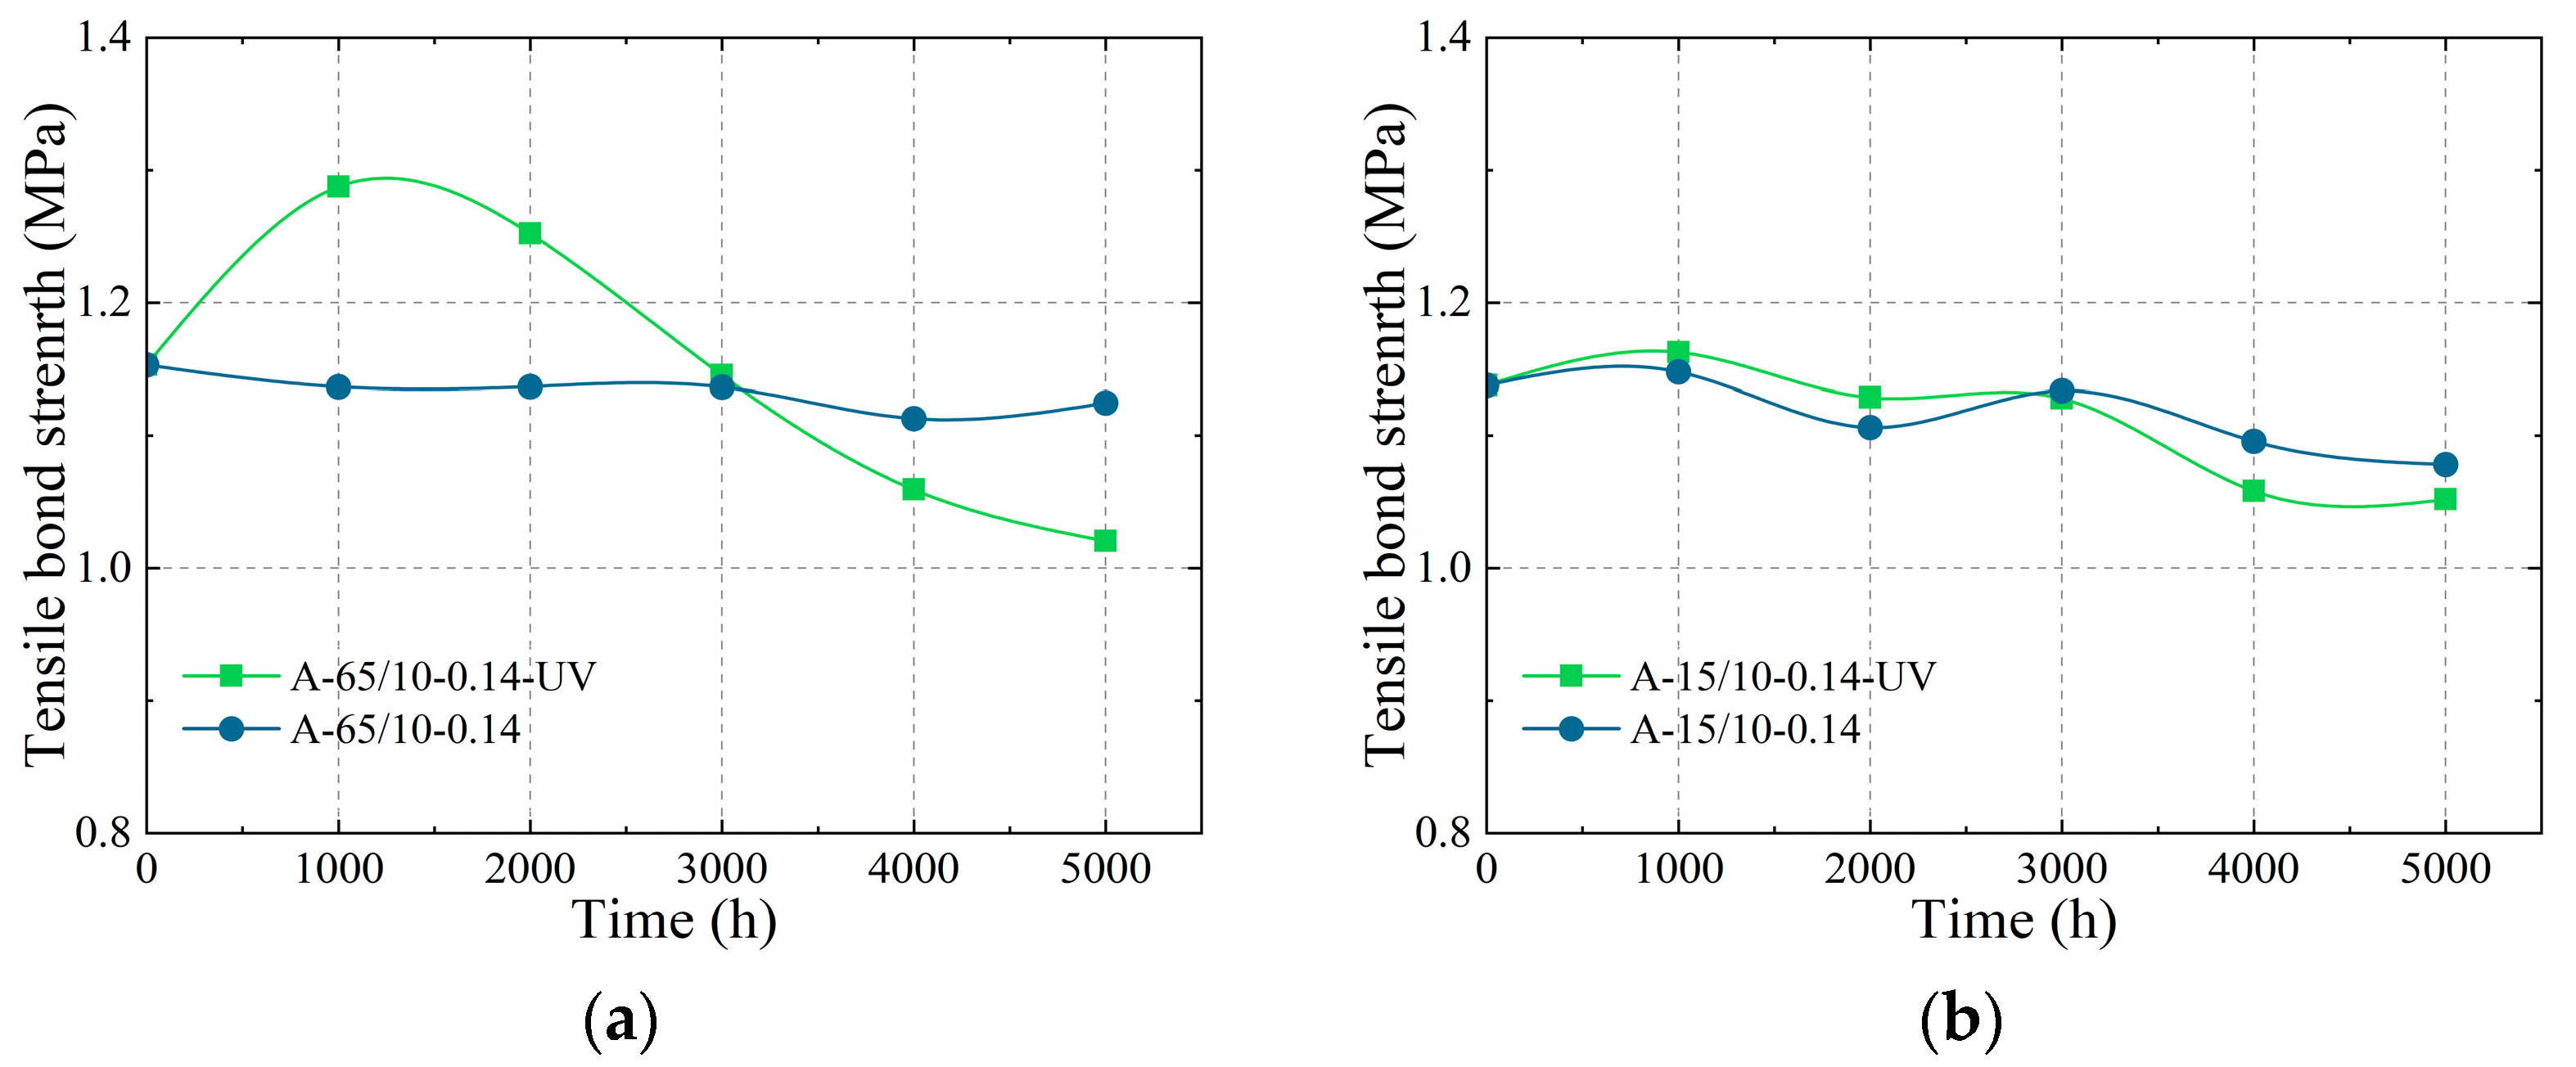
In each test condition, both sealant A and sealant B specimens were exposed to two UV irradiance levels of 40 W/m2 and 0 W/m2. The TBS comparison of specimen groups under condition I with applied stress of 0.14 MPa is shown in Figure 14. During the early testing phase, the increased rate and magnitude of TBS enhanced with elevated UV irradiance. In the middle and late testing phases, the TBS decrease rate accelerated proportionally with higher UV irradiance, ultimately leading to reduced TBS values at 5000 h under intensified UV exposure. Ultraviolet light has higher energy than visible light. Its energy is greater than the bond energy of Si-C and C-H bonds, but less than that of Si-O bonds. Therefore, ultraviolet light can break Si-C and C-H bonds but cannot break Si-O bonds. In the aging progress of the SSG sealant, ultraviolet light broke the side-chain methyl groups of polysiloxane, causing oxidation reactions and crosslinking bonds, leading to reduced crosslinking density. Meanwhile, some of the chemical bonds broken by ultraviolet radiation undergo re-crosslinking, forming new crosslinked structures [33]. The UV irradiance-induced TBS variation mechanism demonstrates consistency with the effects of temperature, humidity, and stress, confirming that increased UV irradiance accelerates both cross-linking and degradation reaction rates.
Significant differences in TBS decrease rates were observed between UV-exposed and non-UV-exposed specimen groups throughout the testing. Under condition I, sealant A UV-exposed specimen group exhibited a 25.4% TBS reduction at 5000 h compared to the initial TBS, whereas the non-UV-exposed specimen group showed only a 2.1% reduction. For sealant B, although the final TBS difference between UV-exposed and non-UV-exposed groups was minimal, UV-exposed specimens exhibited a marked TBS increase during the early testing phase. Compared to the maximum TBS values, the sealant B UV-exposed specimen group experienced a 21.2% TBS reduction at 5000 h, compared with a 5.3% reduction in the non-UV-exposed specimen group. The TBS variation induced by a single environmental factor is significantly greater under UV irradiation compared to the other three environmental factors. Therefore, UV irradiation is the primary environmental factor responsible for the TBS degradation of SSG sealants.

3.2.5. Synergistic Effects of Environmental Factors

Under conditions II and VI with identical humidity of 10% but distinct temperatures of 65 °C and 15 °C, respectively, the TBS of sealant A specimen groups under applied stress of 0.14 MPa was compared in Figure 15. The TBS divergence between UV-exposed and non-UV-exposed specimens under condition II substantially exceeded that observed in condition VI, demonstrating that temperature elevation amplifies UV-induced TBS differentiation. This observation confirms the existence of synergistic effects between temperature and UV irradiance on TBS aging of SSG sealants. Additionally, minimal TBS variations were observed between UV-exposed and non-UV-exposed groups under low-temperature and low-humidity conditions, indicating that isolated UV irradiance exerts limited influence on cross-linking and degradation reaction rates. The acceleration effect of UV irradiance predominantly manifests through cooperative interactions with other environmental factors rather than through standalone action.
Under conditions II and III at 65 °C with humidity levels of 10% and 40%, respectively, and conditions IV and VI at 15 °C with corresponding humidity levels of 10% and 40%, the TBS of sealant A specimen groups subjected to UV irradiance of 40 W/m2 and applied stress of 0.14 MPa was comparatively analyzed as shown in Figure 16. The TBS divergence between 10% and 40% humidity groups exhibited significant enhancement under elevated temperature conditions compared with lower temperature exposure, demonstrating that thermal activation amplifies moisture-induced TBS differentiation. This experimental evidence confirms temperature–humidity synergistic effects on TBS aging acceleration in SSG sealants.
When the TBS variation induced by a specific environmental factor’s alteration is modulated by concurrent changes in other factors, this phenomenon conclusively indicates synergistic interactions between those environmental factors in driving TBS degradation. Quantified by the TBS reduction value at 5000 h relative to initial TBS, the pairwise synergistic effects among temperature, humidity, stress, and UV radiation intensity are calculated using Equation (2):
Δ T S A B = ( δ T S A max B max δ T S A min B max ) ( δ T S A max B min δ T S A min B min )
where A and B denote two arbitrary environmental factors; δTS represents the TBS reduction at 5000 h relative to the initial TBS value; Amax and Amin correspond to the maximum and minimum values of environmental factor A within the experimental design, while Bmax and Bmin define the respective extremes for environmental factor B. The term δTSAmaxBmax specifically quantifies the TBS reduction under concurrent maximum-level exposure to both factors A and B, while all other environmental parameters maintain their maximum values.
Since the test did not include the condition of T = 15 °C and RH = 70%, the temperature range is taken as from 15 °C to 65 °C, the humidity range as from 10% to 40%, the stress range as from 0 to 0.14 MPa, and the UV irradiance range as from 0 to 40 W/m2. Calculations of the ΔTSAB for various environmental factors for sealant A are summarized in Table 3. The ΔTSAB between temperature and UV irradiation is the highest at 0.138 MPa; those for temperature and humidity, humidity and UV irradiation, and UV irradiation and stress are approximately 0.07 MPa, while the ΔTSAB for temperature and stress is the smallest at only 0.01 MPa. Since all ΔTSAB values are greater than 0, it indicates that a synergistic effect exists among the environmental factors. Moreover, the three ΔTSAB values involving UV irradiation are relatively high, suggesting a strong synergistic interaction between UV irradiation and the other three environmental factors.

3.3. Outdoor Aging Test Results

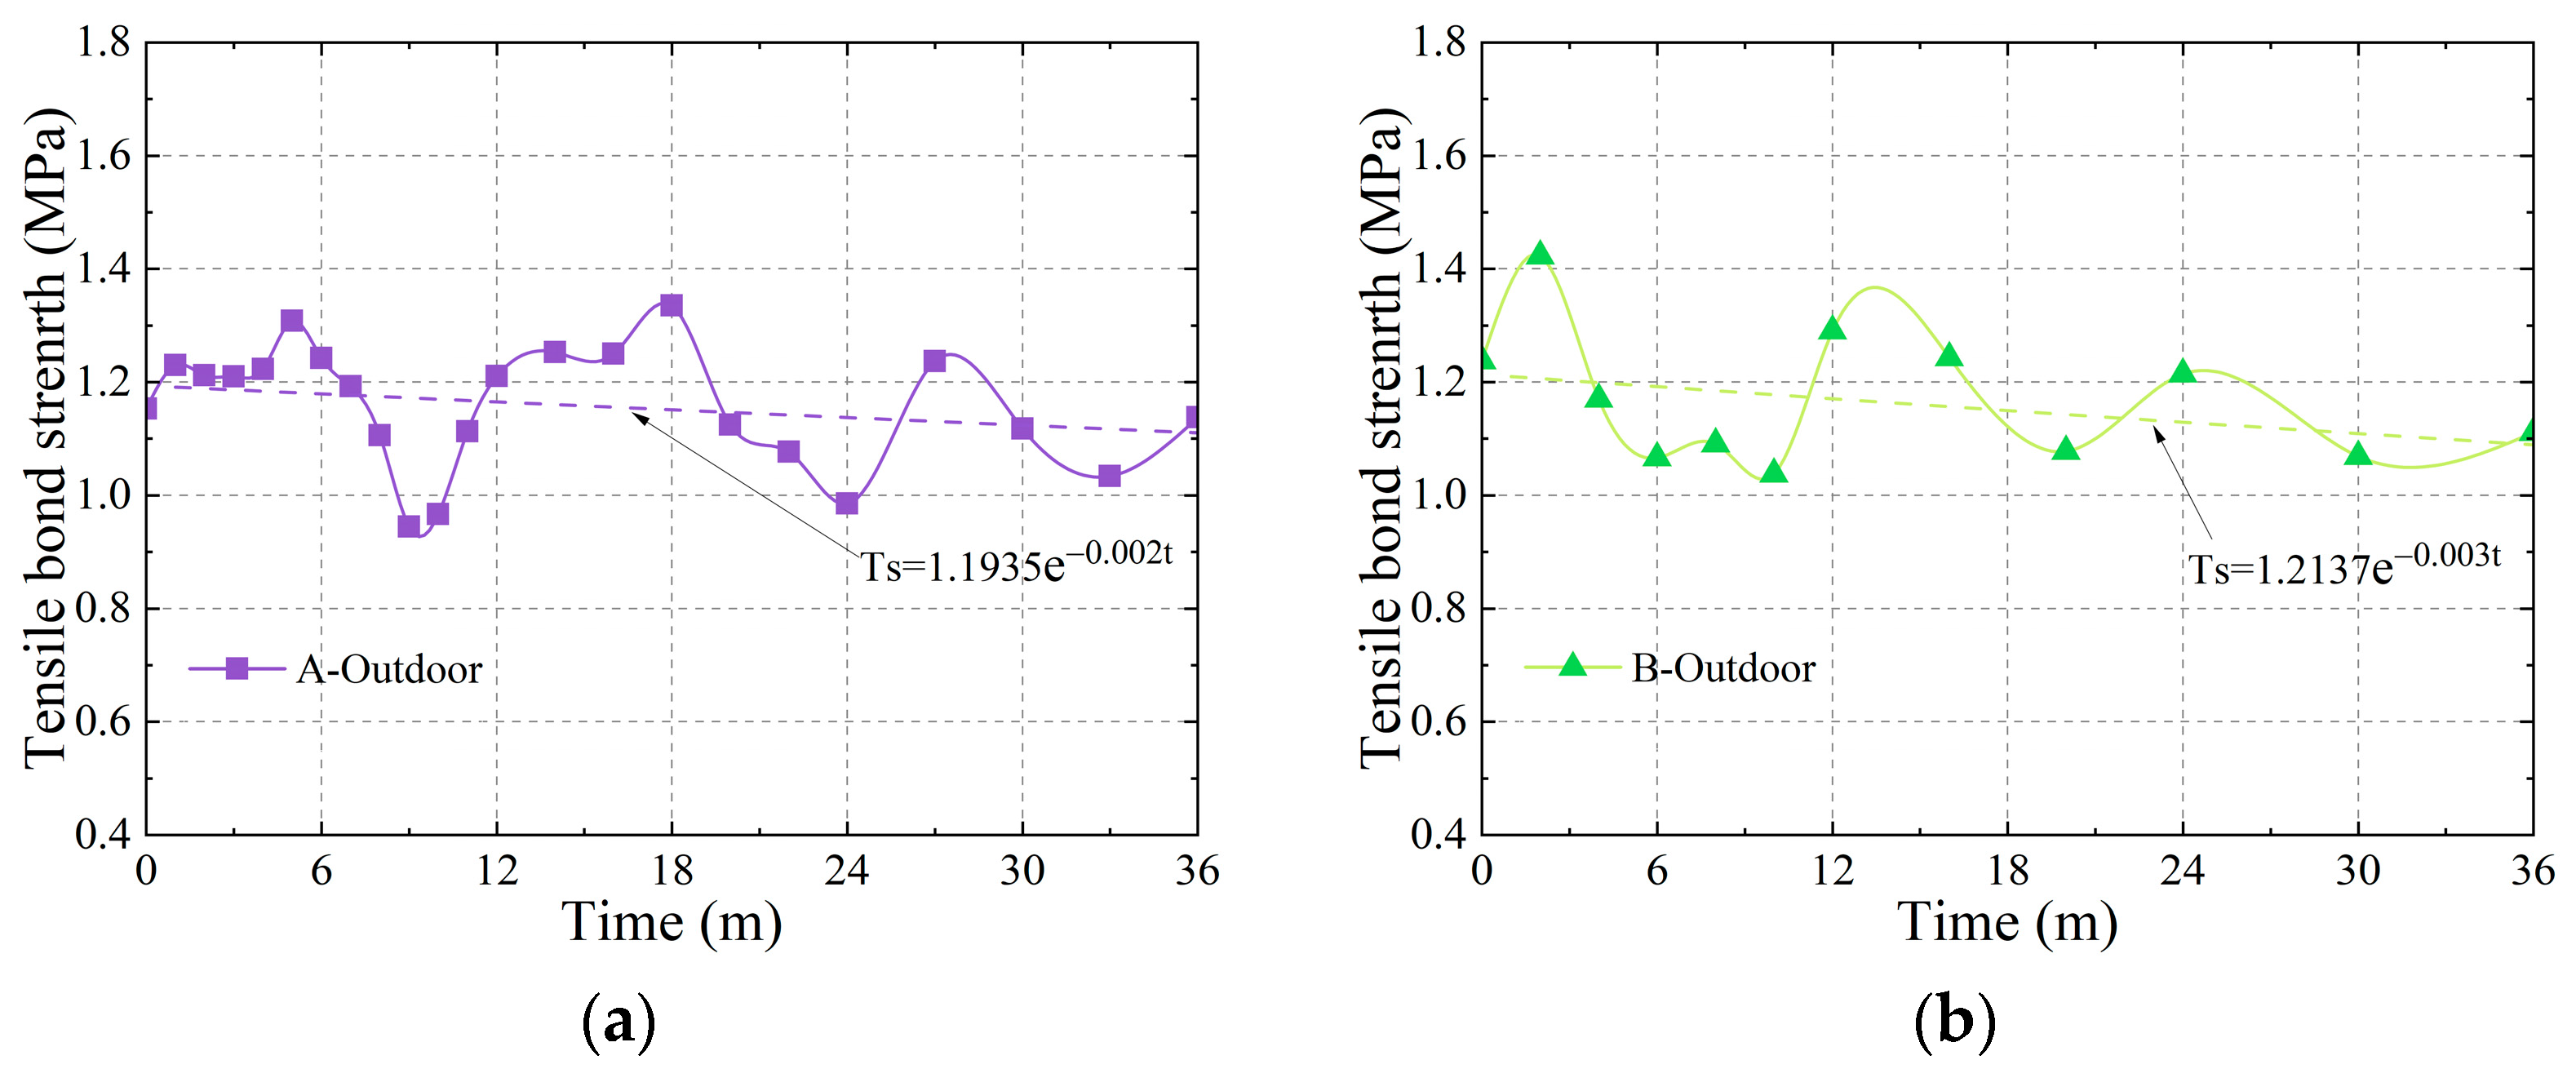
The TBS variation curve over the outdoor aging test period is presented in Figure 17. Both sealant A and sealant B exhibit a slowly fluctuating decrease trend in TBS, with the fluctuation amplitude gradually decreasing. Compared to the initial TBS, there is a slight increase at the 36th month, with an increase of 2.1% for sealant A and 4.3% for sealant B. In comparison with the peak TBS during the test, the reduction at the 36th month is 11.8% for sealant A and 19.4% for sealant B. Due to the significant fluctuation in TBS during the test, the variation at a single time point does not accurately reflect the overall trend, necessitating regression analysis. Laboratory aging test results demonstrate that the aging rate of SSG sealants gradually decreases with prolonged aging time. Therefore, an exponential regression analysis was performed to assess the TBS change trend. The regression analysis results for sealant A and sealant B are shown in Figure 17. The TBS degradation rate of sealant B is higher than that of sealant A. It should be noted that the results of the regression analysis only represent the trend during the test period and cannot be extrapolated to future times.

4. Degradation Model

The abbreviations included in this section: TBS—tensile bond strength; SSG—silicone structural glazing; UV—ultraviolet; MCMC—Markov chain Monte Marlo; MAE—mean absolute error; RMSE—root mean square error.

4.1. Establishment of TBS Degradation Model

Due to the numerous chemical components in polymer-based composites, the mechanisms governing the formation and aging of TBS are very complex, making it difficult to establish a degradation model based on the underlying mechanisms. For such materials, a phenomenological mathematical model is generally used to describe their aging behavior, with the form and key parameters determined based on durability test data.
During service, SSG sealants simultaneously undergo crosslinking and degradation reactions, and the TBS of SSG sealants is influenced by the combined effects of these two processes. For polymer-based composites with such characteristics, Guniyev [38] proposed that the variation of TBS with time can be described by Equation (3):
S = S 0 + η ( 1 e λ t ) β l n ( 1 + θ t )
where t represents the service time, S is the TBS at time t, S0 is the initial TBS, η is the material curing parameter, β is the material aging parameter, and λ and θ are parameters that reflect the influence of material properties and environmental conditions.
It can be known from the form of Equation (3) that the TBS is determined by the initial strength plus an increasing term and a decreasing term, which is consistent with the aging mechanism and behavior of SSG sealants. For a specific SSG sealant, S0, η, and β are constants, whereas λ and θ vary with environmental conditions. To incorporate the effects of environmental factors into Equation (3), λ and θ must be formulated as functions of these factors.
Based on the previous analysis of the degradation behavior of TBS, it is evident that temperature, humidity, stress, and UV irradiation all influence the change in TBS. Therefore, the mathematical models for λ and θ should incorporate all four environmental factors as variables, including terms for temperature, humidity, stress, and UV irradiance. Moreover, since there is a synergistic effect among these four environmental factors, the models for λ and θ should include interaction terms for these variables.
The temperature term in λ and θ, which reflects their variation with temperature, should follow the Arrhenius Equation [32], as shown in Equation (4):
k = A e ( E a R T )
where k represents the chemical reaction rate, T is the temperature, A is the pre-exponential factor, Ea is the activation energy, and R is the molar gas constant.
To determine whether the experimental results conform to the form of Equation (4), A-65/40-0.14-UV, A-40/40-0.14-UV, and A-15/40-0.14-UV specimen groups with different temperatures but identical other conditions were selected. Test results were fitted using Equation (3) by the least squares method, and the fitted curves are shown in Figure 18. The fitting results for λ and θ are listed in Table 4.
As the temperature increases, both λ and θ gradually increase, which is consistent with the fact that temperature can accelerate both the crosslinking and degradation reaction rates. The difference in θ between the specimen groups at 15 °C and 40 °C, and between 40 °C and 65 °C, are 2.84 × 10⁻4 and 2.08 × 10⁻4, respectively, indicating that, as temperature increases, the rate of increase of θ gradually diminishes. This behavior conforms to the trend described by Equation (4). Therefore, the temperature term of θ, denoted as θT, is established as Equation (5):
θ T = α 3 e ( α 4 T )
where T is the temperature and α3 and α4 are the parameters reflecting the temperature influence on θ.
For the specimen groups at 15 °C and 40 °C, and at 40 °C and 65 °C, the difference in λ is 1.18 × 10⁻⁴ and 2.97 × 10⁻⁴, respectively, indicating that λ increases at an accelerating rate with temperature. This trend does not conform to the Arrhenius Equationbut rather follows an exponential function. Therefore, the temperature term of λ, denoted as λT, is modeled as Equation (6):
λ T = α 1 e α 2 T
where α1 and α2 are the parameters reflecting the temperature influence on λ.
For different humidity conditions, with all other conditions identical, the fitted values of λ and θ for the three specimen groups A-65/70-0.14-UV, A-65/40-0.14-UV, and A-65/10-0.14-UV are listed in Table 4. The variation trends of λ and θ with humidity are similar to those with temperature. Therefore, the humidity term of λ, denoted as λH, is established as Equation (7), and the humidity term of θ, denoted as θH, as Equation (8):
λ H = α 5 e α 6 H
θ H = α 7 e ( α 8 H )
where H is the humidity, α5 and α6 are the parameters reflecting the humidity influence on λ, and α7 and α8 are the parameters reflecting the humidity influence on θ.
For different stress conditions, with all other conditions identical, the fitted values of λ and θ for the three specimen groups A-65/40-0.14-UV, A-65/40-0.07-UV, and A-65/40-0-UV are provided in Table 4. The differences in λ between the 0 MPa and 0.07 MPa specimen groups and between the 0.07 MPa and 0.14 MPa specimen groups are 1.37 × 10⁻⁴ and 1.38 × 10⁻⁴, respectively; the corresponding differences in θ are 1.39 × 10⁻⁴ and 1.38 × 10⁻⁴. This indicates that both λ and θ increase linearly with stress. Therefore, the stress term of λ, denoted as λσ, is established as Equation (9), and the stress term of θ, denoted as θσ, as Equation (10):
λ σ = α 9 σ
θ σ = α 10 σ
where σ represents the stress, α9 is the parameter reflecting the stress influence on λ, and α10 is the parameter reflecting the stress influence on θ.
For different UV irradiance, with all other conditions identical, the fitted values of λ and θ for the two specimen groups A-65/40-0.14-UV and A-65/40-0.14 are provided in Table 4. The differences between the 0 W/m2 and 40 W/m2 specimen groups are significant: the value of λ differs by a factor of 30, and that of θ by a factor of 17, with both λ and θ for the 40 W/m2 specimen group being much higher than those for the 0 W/m2 specimen group. This behavior conforms to an exponential function; therefore, the UV irradiance terms for λ and θ, denoted as λU and θU, respectively, are modeled as Equations (11) and (12):
λ U = e α 11 U
θ U = e α 12 U
where U represents the UV irradiance, α11 is the parameter reflecting the influence of UV irradiance on λ, and α12 is the parameter reflecting its influence on θ.
The synergistic effects among temperature, humidity, and stress are achieved by adding interaction terms. Since the influence of UV irradiance on the reaction rate is mainly manifested through its synergistic effects with other environmental factors—and this synergy is particularly pronounced—the UV irradiance term should interact with the sum of the other three environmental factor terms and their interaction terms. The complete mathematical models for λ and θ are established as Equations (13) and (14):
λ = ( α 1 e α 2 T + α 5 e α 6 H + α 9 σ + α 13 T H + α 15 T σ + α 17 H σ ) × e α 11 U
θ = ( α 3 e ( α 4 T ) + α 7 e ( α 8 H ) + α 10 σ + α 14 T H + α 16 T σ + α 18 H σ ) × e α 12 U
where α13 and α14 are the parameters for the synergistic effect between temperature and humidity, α15 and α16 are the parameters for the synergistic effect between temperature and stress, and α17 and α18 are the parameters for the synergistic effect between humidity and stress.

4.2. Parameters Calculation

The unknown parameters in the degradation model for TBS include η and β in Equation (3), as well as α1 to α18 in Equations (13) and (14), totaling 20 parameters. The values of these parameters need to be determined based on aging test data. Due to the large number of parameters, conventional parameter estimation methods are not suitable. Instead, this study adopts the Markov Chain Monte Carlo (MCMC) method based on the Bayesian theory for statistical inference to obtain parameter estimates [39]. The prior distributions of the parameters are specified as normal distributions. By computing the likelihood function using the test data and the mathematical model, the posterior distributions of the parameters are obtained. The estimated values are then calculated using the MCMC method.
Since λ and θ do not have physical significance, the environmental factor variables in Equations (13) and (14) are dimensionless and normalized to values between 0 and 1, as shown in Equation (15):
E n = E m E min E max E min
where E represents the environmental factor variables corresponding to T, H, σ, and U in Equations (13) and (14). Em and En represent the original and normalized values of E, respectively. Emin and Emax are the lower and upper limits of the applicable range of E, determined based on actual service and test conditions. Specifically, T corresponds to from −25 °C to 85 °C, H corresponds to from 0% to 100%, σ corresponds to from 0 MPa to 0.14 MPa, and U corresponds to from 0 W/m2 to 40 W/m2.
The calculated parameter results for sealant A and sealant B are presented in Table 5 and Table 6. The results exhibit certain differences, reflecting the variation in TBS degradation behavior between the two sealants. Among the parameters, η and α11 have the most significant influence on the TBS increase amplitude and rate during the early testing phase. The values of η and α11 for sealant B are higher than those for sealant A, which is consistent with the experimental observation that sealant B exhibits a greater TBS increase than sealant A during the early testing phase.
Using the calculated parameters, the values of the λ and θ components were determined. Taking specimen groups A-65/70-0.14-UV, A-65/70-0.14, A-65/70-0.07-UV, and A-15/10-0.14-UV as examples, the results are listed in Table 7. At a UV irradiance of 40 W/m2, the values of λU and θU for sealant A are 36.18 and 22.32, respectively, while, for sealant B, they are 72.52 and 24.81, respectively. These values indicate the multiplicative effect of UV irradiance on λ and θ when comparing from 40 W/m2 to 0 W/m2. The substantial difference suggests that UV irradiance plays a decisive role in the TBS degradation of SSG sealants.
Among the three other environmental factors and their synergy terms in λ and θ, the temperature term has the largest proportion, exceeding 40% across all conditions. The combined proportion of the three temperature-related terms can reach 90%. In contrast, the proportions of the humidity term, stress term, and synergy term are relatively small, each not exceeding 10%. However, as humidity and stress decrease, the temperature term’s proportion increases. Although the individual humidity and stress terms have relatively small contributions, they should not be overlooked, as their synergy effects with temperature can be significant under high humidity and stress conditions. For example, in the A-65/70-0.07-UV specimen group, the temperature-humidity synergy term accounts for 38.98%, while, in the A-65/70-0.14-UV specimen group, the temperature–stress synergy term accounts for 13.32%. Among the three environmental factors, their impact on TBS degradation follows the descending order being temperature, humidity, and stress.

4.3. Error Analysis

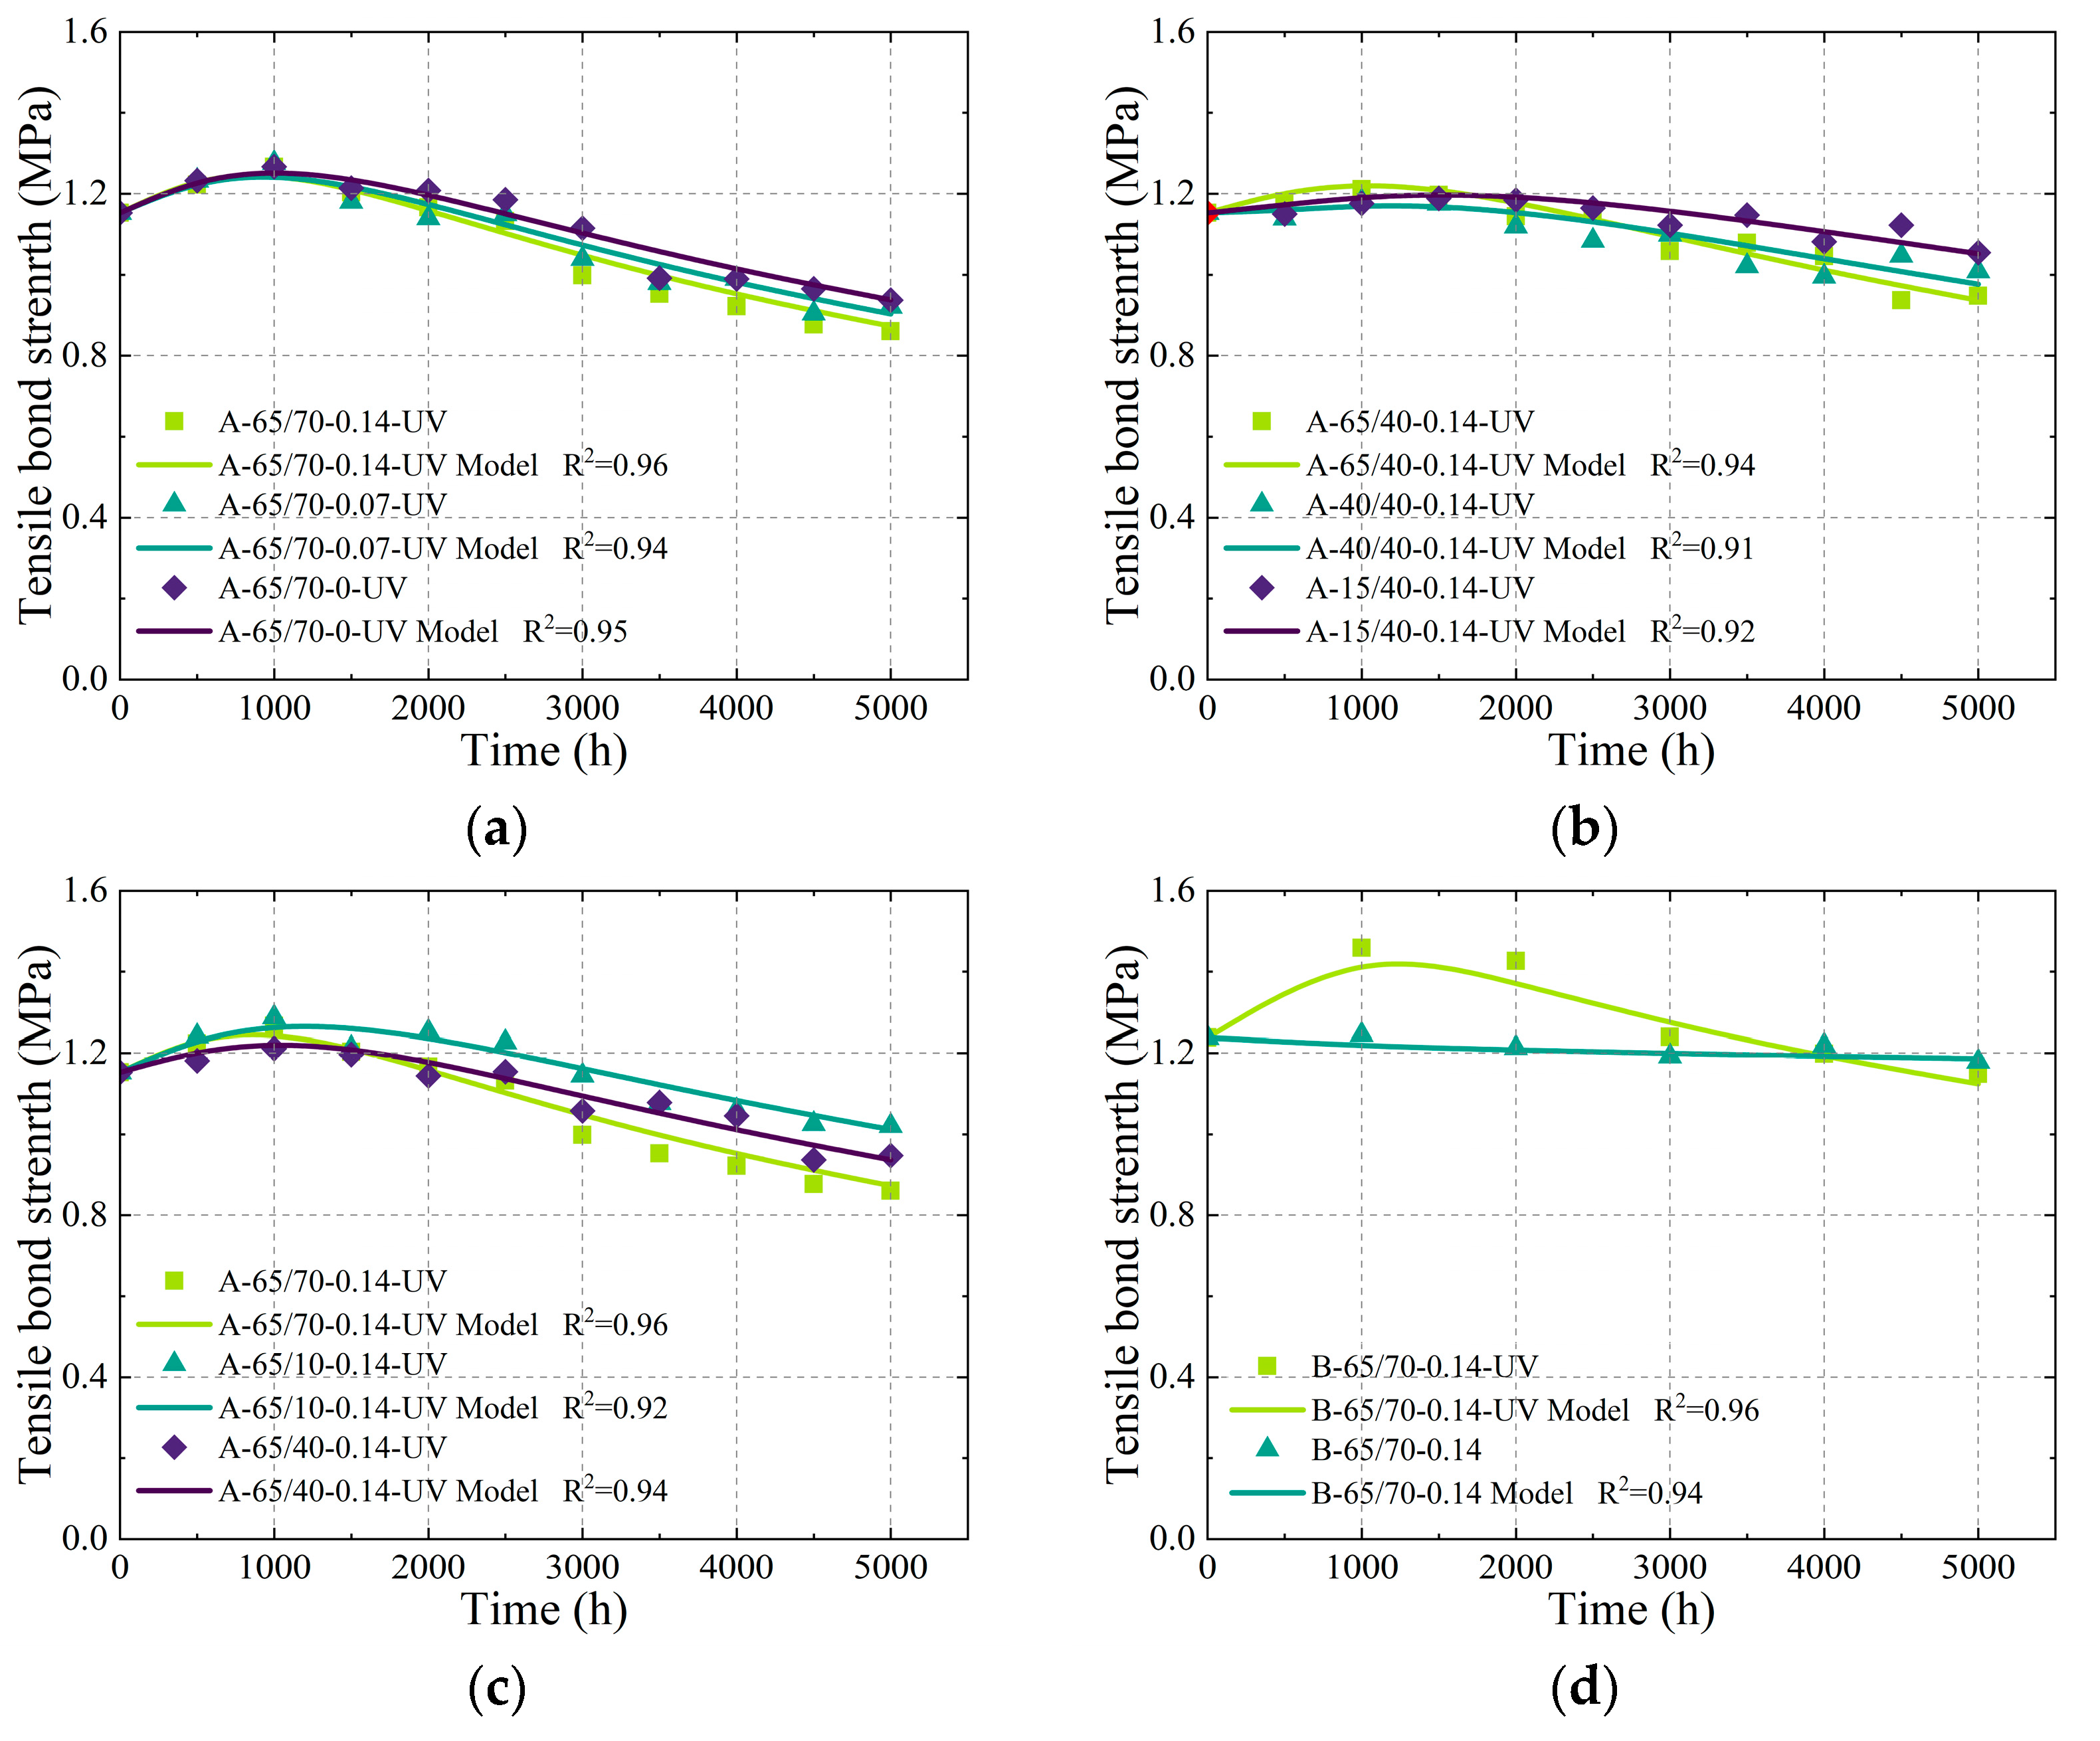
To validate the accuracy of the degradation model for TBS and the correctness of the parameter estimation, TBS–time curves were plotted under selected conditions using the mathematical model and compared with the experimental results, as shown in Figure 19. The model curves fit well with the experimental data, with all R2 values exceeding 0.9, effectively capturing the degradation trends observed in the experiments. Specifically, Figure 19a illustrates the effect of stress and Figure 19b illustrates the effect of temperature.
Figure 19c illustrates the effect of humidity, and Figure 19d illustrates the effect of UV irradiance.
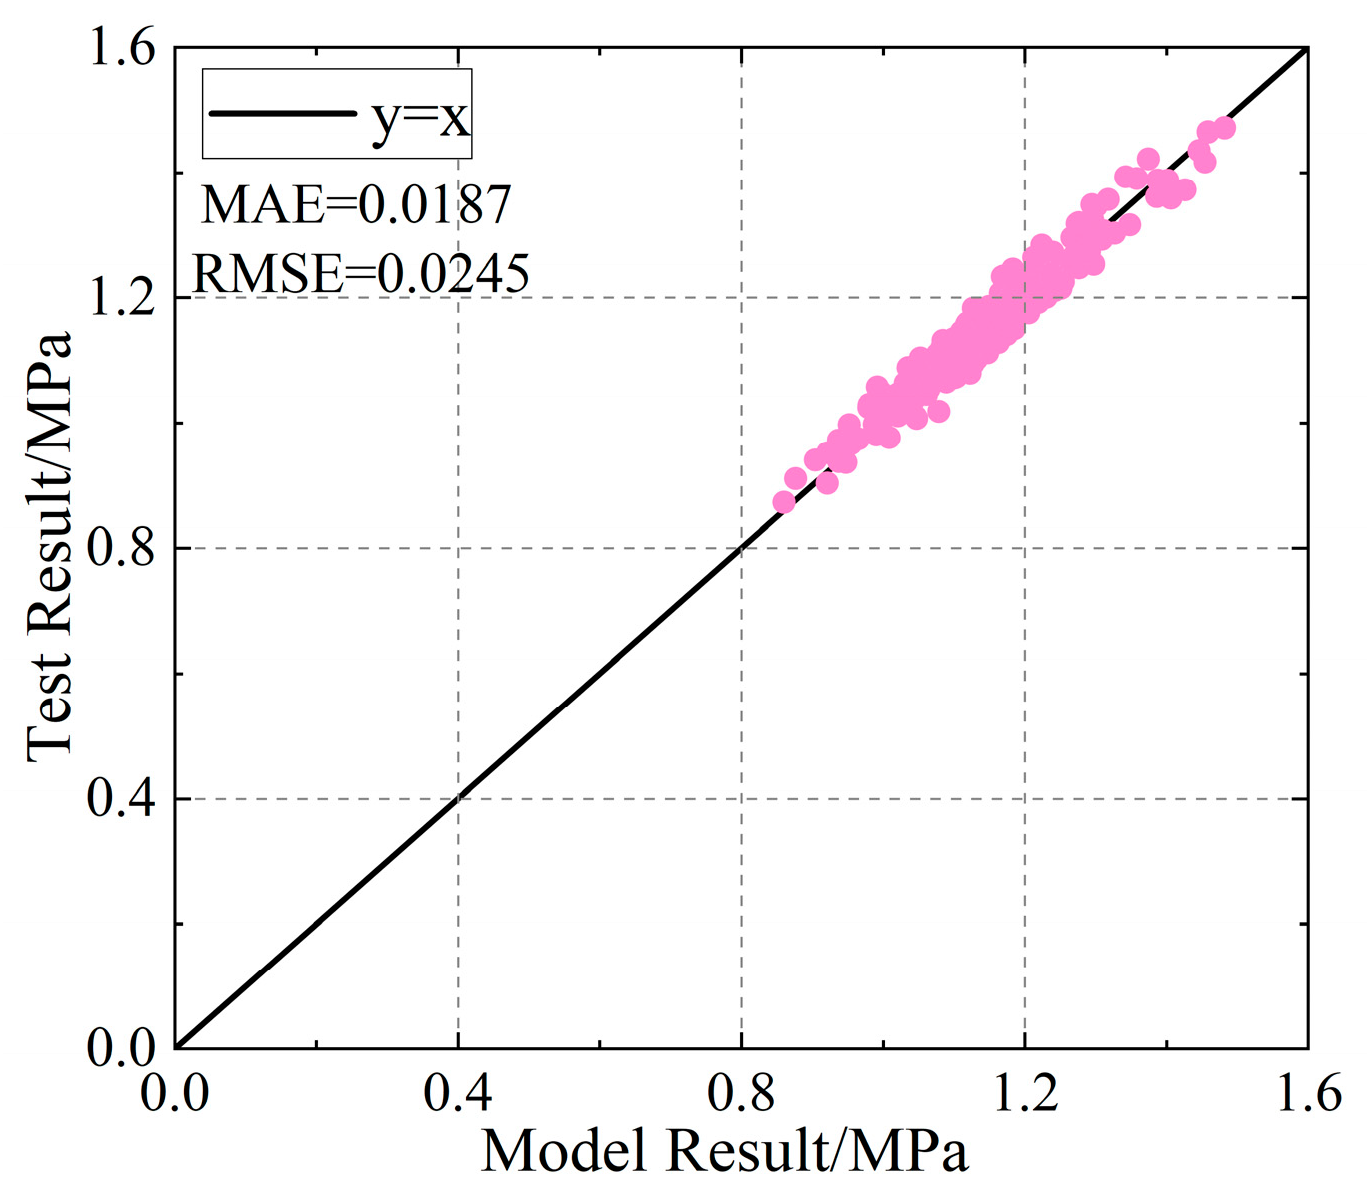
A comparison between all experimental test values and the model-calculated values is shown in Figure 20. The closer the data points are to the diagonal line, the smaller the difference between the calculated and measured values. As shown in Figure 20, all data points are closely aligned with the diagonal, with a mean absolute error (MAE) of 0.0187 MPa and a root mean square error (RMSE) of 0.0245 MPa. The strong agreement between the calculated and experimental values confirms that the proposed degradation model for TBS in SSG sealants accurately reflects the aging behavior. Furthermore, the MCMC-based parameter estimation demonstrates high accuracy.

5. Service Life Prediction Method

The abbreviations included in this section: TBS—tensile bond strength; SSG—silicone structural glazing; UV—ultraviolet; MCMC—Markov chain Monte Marlo; MAE—mean absolute error; RMSE—root mean square error; T—temperature; RH—relative humidity.

5.1. Recursive Method

The proposed degradation model allows for the calculation of TBS at any given time under specific constant environmental conditions. However, in practical applications, the environmental conditions of SSG sealants are continuously changing. Therefore, a method is needed to calculate TBS under dynamic environmental conditions.
Although the environmental conditions in which the SSG sealant is used constantly change, the rate of change is relatively slow [40]. Over a short time, the environmental conditions can be approximated as constant. Therefore, the degradation model can be applied within each short time provided that the initial state of TBS at the beginning of the period is determined. By taking the initial strength of the SSG sealant as the starting point, the TBS for the first period can be calculated. The state at the end of the first period then serves as the initial state for the second period, and the calculation continues for the subsequent periods. By repeating this process, the TBS variation curve of the SSG sealant under continuously changing environmental conditions can be obtained.
There are two approaches to linking TBS between consecutive periods. One approach is to directly link TBS, while the other is to separately link the increasing and decreasing terms in the degradation model. The first approach essentially merges the increasing and decreasing terms without distinguishing them. This approach remains feasible for cases where TBS monotonically decreases. However, under certain environmental conditions, where TBS first increases and then decreases, a single TBS value may correspond to two different time points, one before the peak strength and another after the peak strength, leading to ambiguity in time determination. In contrast, the increasing and decreasing terms are monotonic functions, ensuring that no single TBS value corresponds to two time points. Additionally, since TBS is derived from the sum of the increasing and decreasing terms, it does not accurately reflect the individual states of these components. Given that the parameters η, β, λ, and θ vary significantly under different environmental conditions, the changes in the increasing and decreasing terms are not synchronized. Therefore, it is necessary to separate these terms and link them individually.
The environmental conditions of the SSG sealant are divided into multiple periods based on a fixed interval Δt. Starting from the first period, the degradation model is used to calculate the TBS at the end of the period based on the given environmental conditions. In the second period, using the increasing term Cro1 and the decreasing term Deg1 from the first period, the initial time values for the increasing term tcro2 and the decreasing term tdeg2 in the second period are back-calculated. The degradation model is then applied to compute the TBS at the end of the second period. This process is repeated for the third, fourth, and subsequent periods, generating the TBS variation curve over time. This approach is referred to as the recursive method for calculating the TBS of SSG sealants under continuously changing environmental conditions.
The specific calculation process of the recursive method is as follows:
1. Calculate the material and environmental state influence parameters λi and θi for the i-th stage, as shown in Equations (16) and (17):
λ i = ( α 1 e α 2 T i + α 5 e α 6 H i + α 9 σ i + α 13 T i H i + α 15 T i σ i + α 17 H i σ i ) × e α 11 U i
θ i = ( α 3 e ( α 4 T i ) + α 7 e ( α 8 H i ) + α 10 σ i + α 14 T i H i + α 16 T i σ i + α 18 H i σ i ) × e α 12 U i
where Ti, Hi, σi, and Ui represent the temperature, humidity, stress, and ultraviolet radiation intensity in the i-th stage, respectively.
2. Calculate the initial time of the increasing term, tcroi, and the initial time of the decreasing term, tdegi, for the i-th stage, as shown in Equations (18) and (19):
t c r o i = ln ( 1 C r o i 1 η ) λ i
t deg i = e D e g i 1 β 1 θ i
where Croi-1 and Degi-1 are given by Equations (20) and (21):
C r o i 1 = η [ 1 e λ i 1 ( t c r o i 1 + Δ t ) ]
D e g i 1 = β l n [ 1 + θ i 1 ( t deg i 1 + Δ t ) ]
3. Calculate the TBS at the end of the i-th stage, Si, as shown in Equation (22):
S i = S 0 + η [ 1 e λ i ( t c r o i + Δ t ) ] β l n [ 1 + θ i ( t deg i + Δ t ) ]

5.2. Two-Stage Test for Sealant B

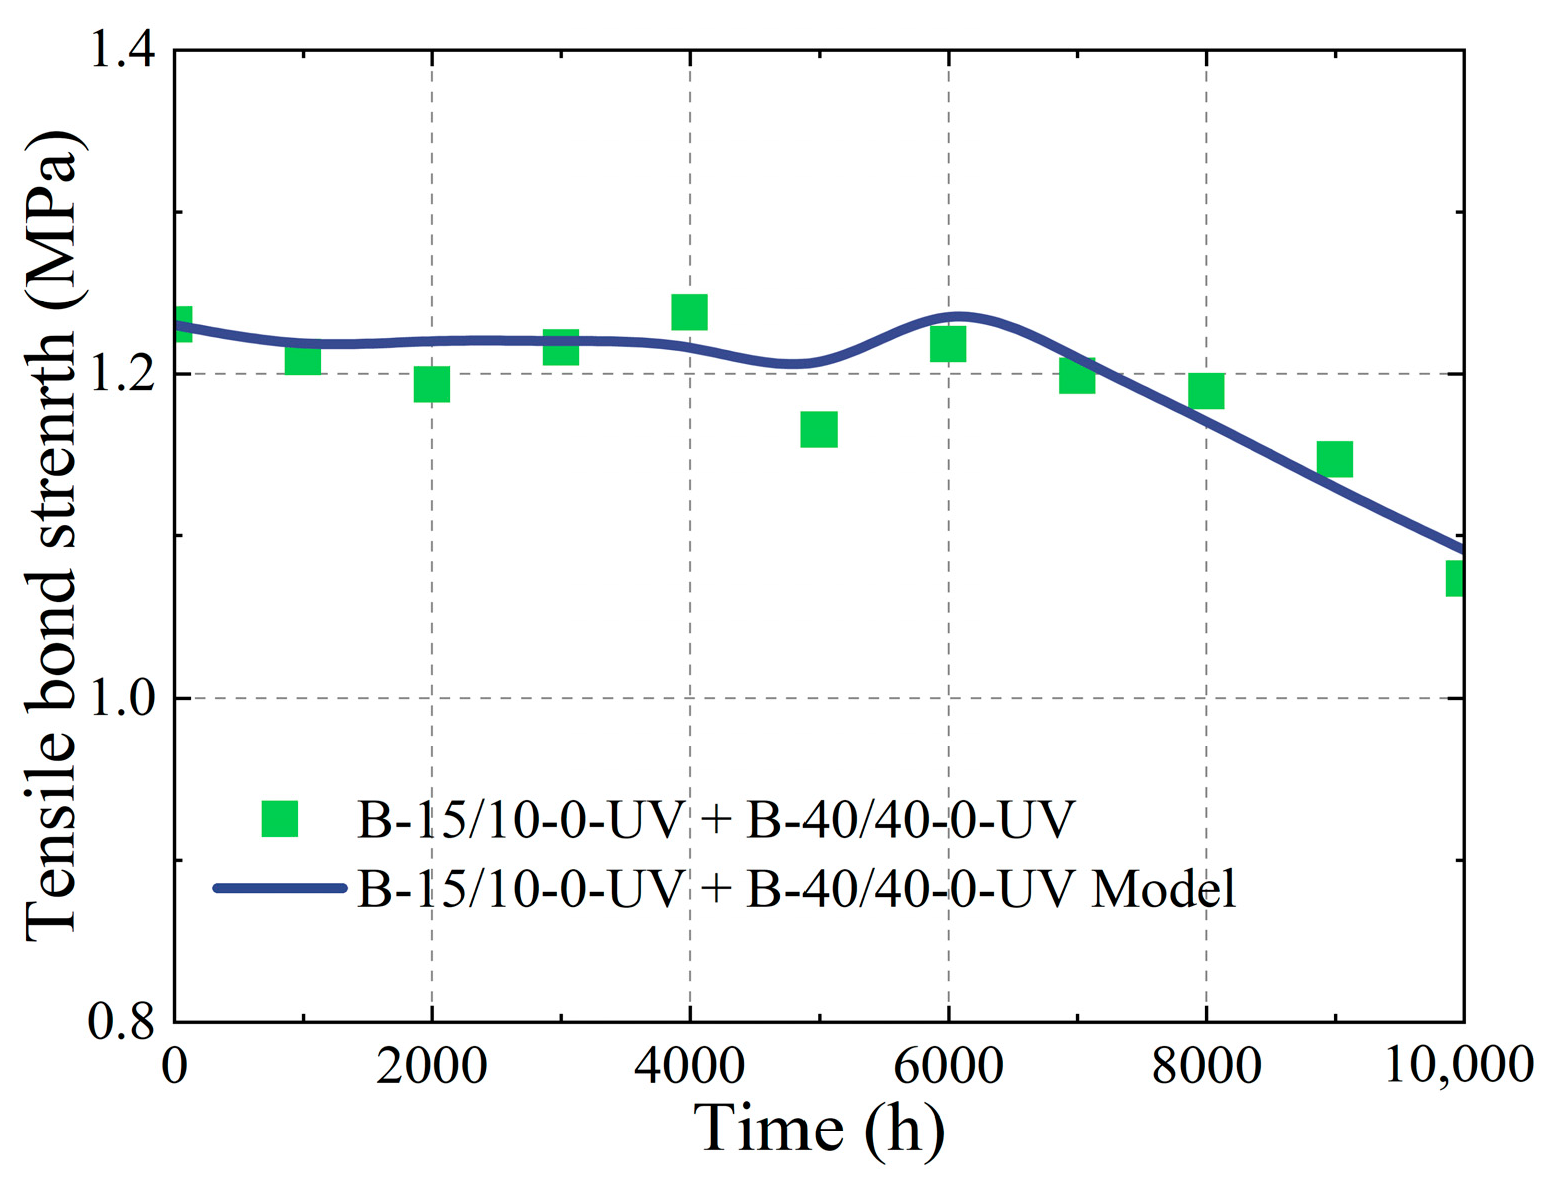
To verify the feasibility of the recursive method, an additional specimen group of sealant B was included in the laboratory aging test. This specimen group was first aged for 5000 h under condition VI (T = 15 °C, RH = 10%, σ = 0.14 MPa, U = 40 W/m2) and then continued aging for another 5000 h under condition V (T = 40 °C, RH = 40%, σ = 0.14 MPa, U = 40 W/m2), resulting in a total aging duration of 10,000 h. The experimental TBS results are shown in Figure 21. The TBS–time curve is clearly divided into two stages: during the first stage (0–5000 h), under 15 °C and 10% RH, TBS exhibited minimal change, with only a slight decrease. In the second stage (5000–10,000 h), under 40 °C and 40% RH, TBS showed a noticeable change, initially increasing slightly before decreasing.
Using the degradation model, the TBS for both stages was calculated. The initial time for the first stage was set to 0, with the initial strength equal to the initial strength of sealant B. The values of λ and θ were calculated based on the environmental conditions of T = 15 °C, RH = 10%, σ = 0.14 MPa, and U = 40 W/m2, and substituted into Equation (3) to obtain the TBS–time curve for the first stage, as shown in Figure 21. The values of the increasing and decreasing terms at the end of the first stage were then used to inversely calculate the initial time of the increasing and decreasing terms for the second stage. The values of λ and θ were recalculated based on the environmental conditions of T = 40 °C, RH = 40%, σ = 0.14 MPa, and U = 40 W/m2 and substituted into Equation (3) to obtain the TBS–time curve for the second stage, also shown in Figure 21. The calculated results for both stages align with the trends observed in the experimental data, with an R2 value of 0.93, indicating that this method can be used to compute TBS under continuously changing environmental conditions with high accuracy.

5.3. Environmental Conditions Record of Outdoor Aging Test

Sensors were placed at the fixture location of the outdoor aging specimens to measure the environmental conditions, including temperature, humidity, and UV irradiance in real time. The UV irradiance was measured within the wavelength range of from 300 to 400 nm, with the unit of measurement being W/m2. The sensors were programmed to record the environmental condition data periodically, with the recording time interval set by the user.
The calculations for the recursive method assume that the environmental conditions remain constant over a specific time interval. However, environmental conditions change continuously in reality, and this assumption can introduce errors between the calculated and actual results. The smaller the recording time interval for environmental conditions, the closer the captured data aligns with actual variations in environmental conditions, thereby reducing the discrepancy between calculated and actual results.
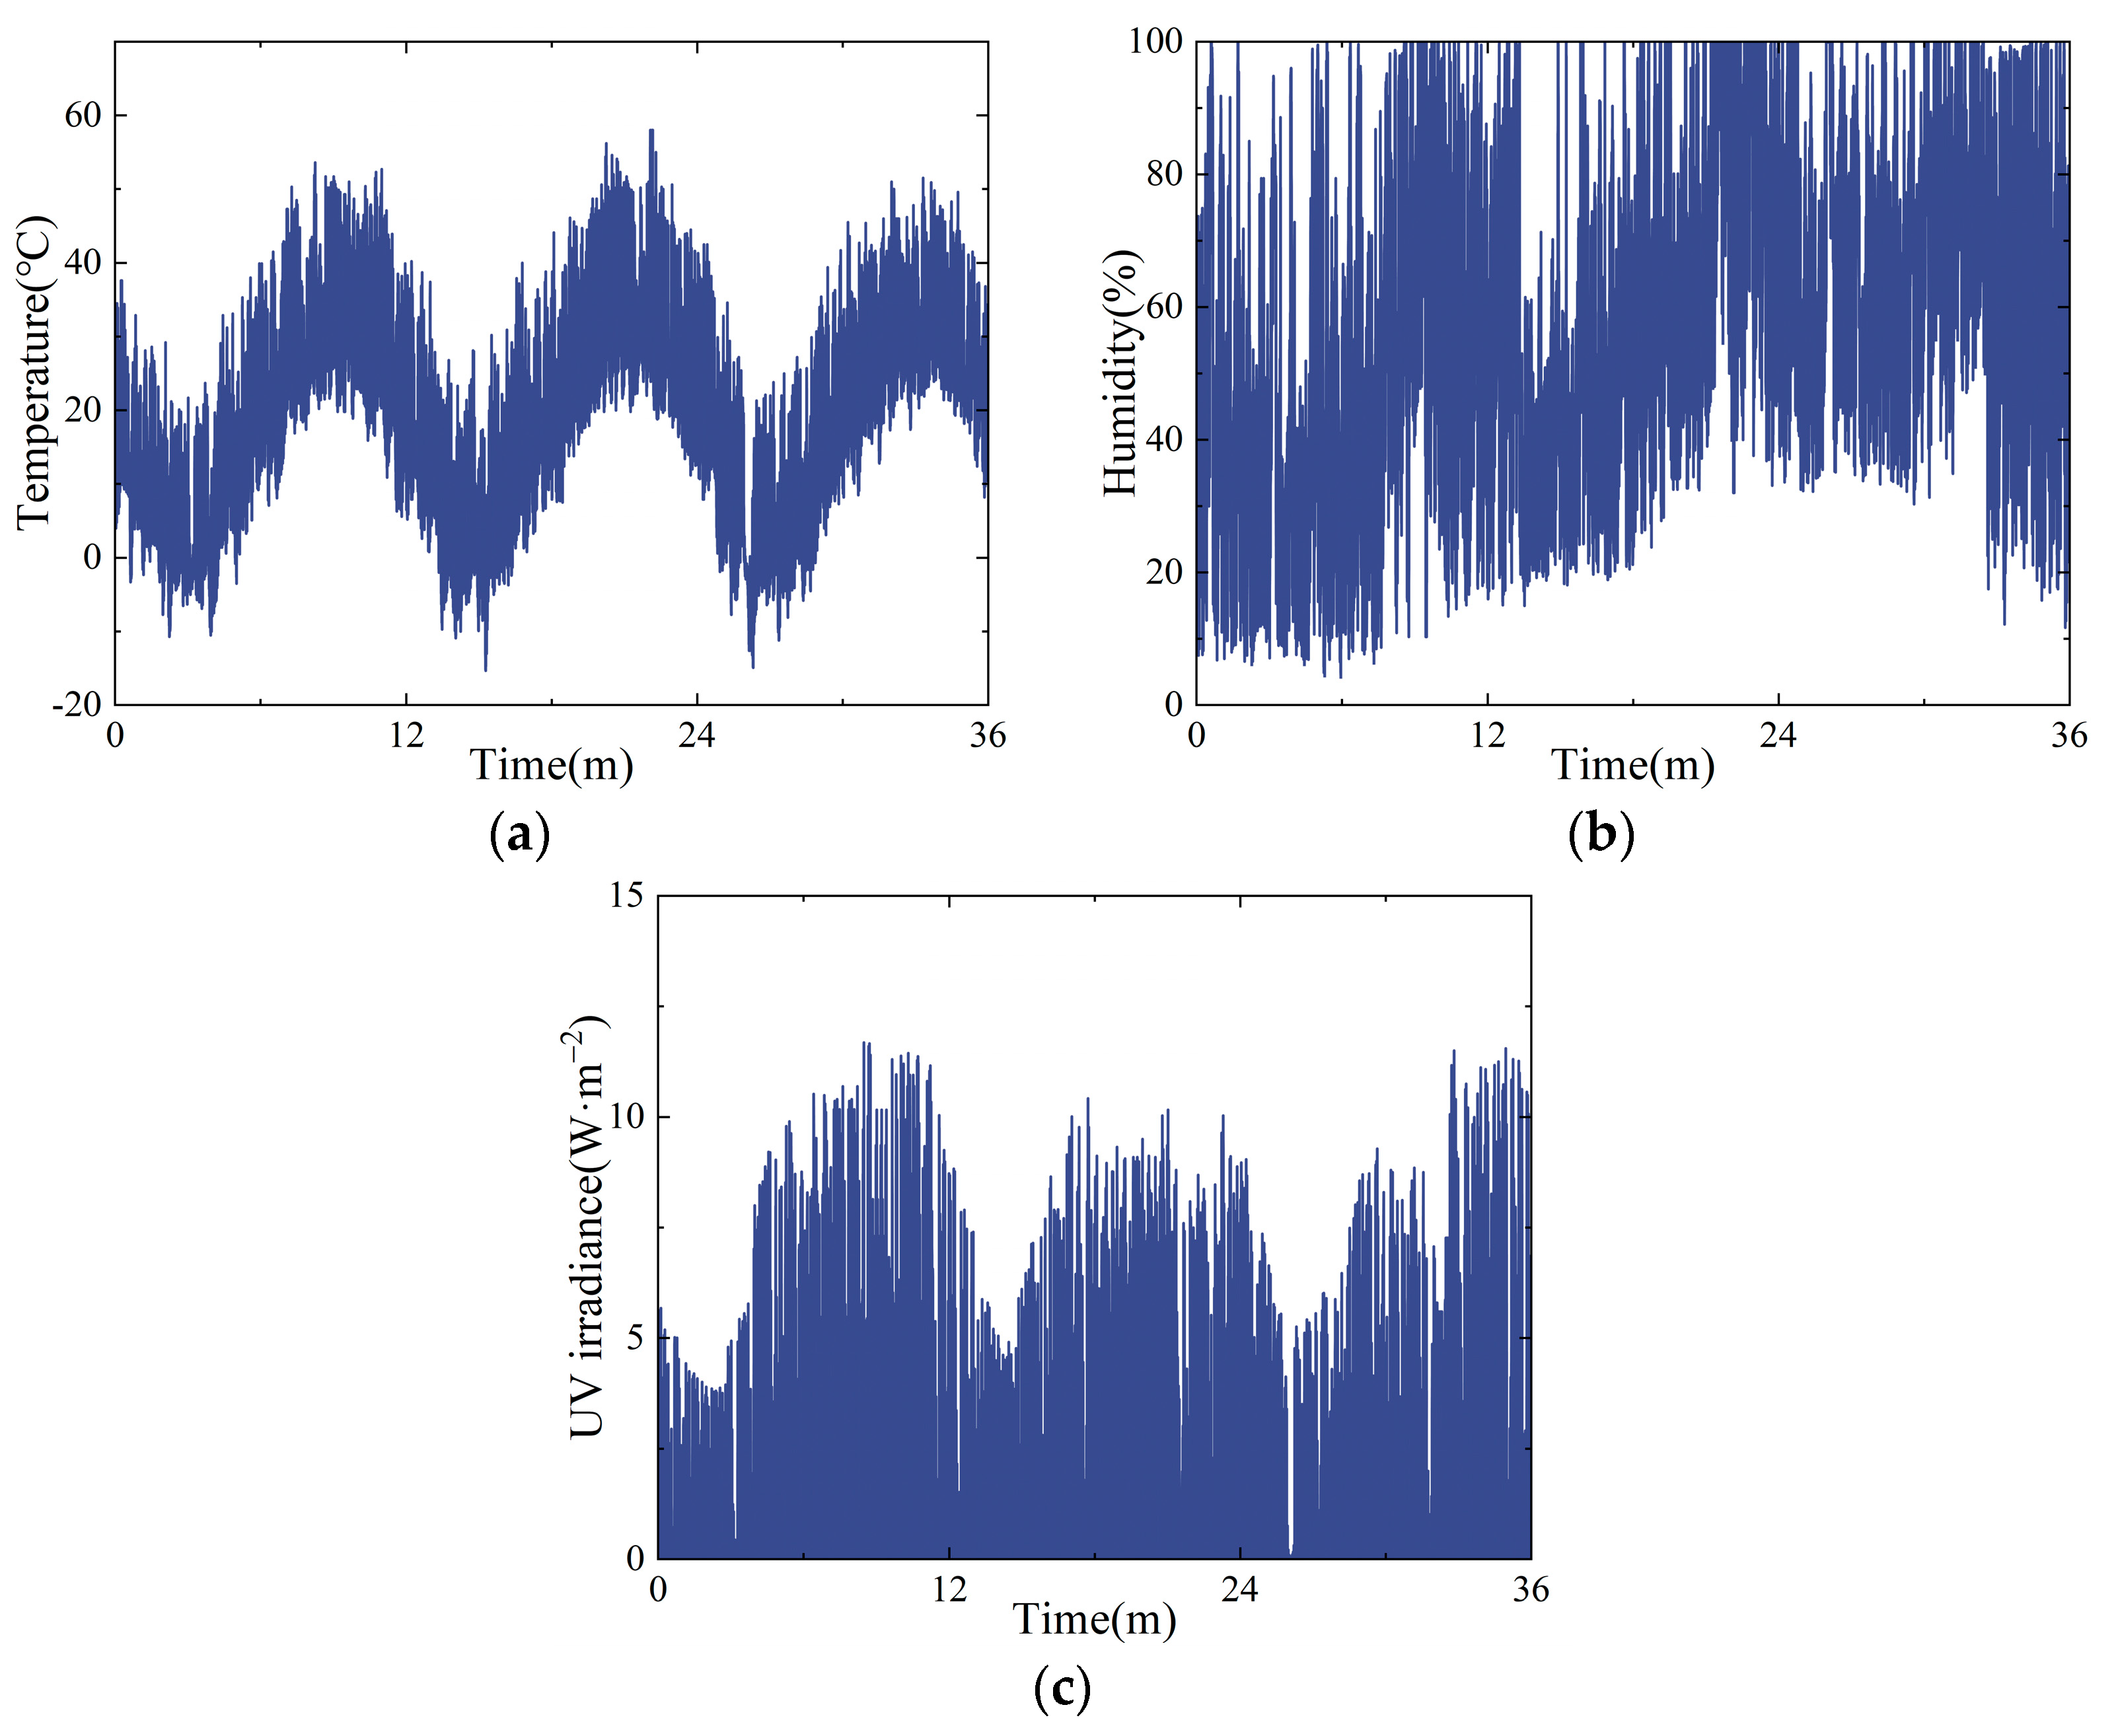
However, the outdoor aging test duration is three years, and the typical service life of SSG sealants can reach over 25 years. If the recording time interval is too small, it would generate an enormous amount of data, making calculations more difficult. Considering both computational capabilities and error tolerance, the environmental condition recording time interval was set to 0.5 h. The test began in October 2021 and ended in October 2024. The recorded temperature, humidity, and UV radiation intensity during the outdoor aging test are shown in Figure 22.
Temperature, humidity, and UV irradiance exhibit significant seasonal fluctuations. During winter, the average temperature, humidity, and UV irradiance are the lowest of the year, while they are highest during summer, with a periodic variation. In different years, the environmental conditions during the same season also show some variation. For example, during the third winter after the experiment started, from November 2023 to January 2024, the average humidity was significantly higher than in other winters. This was due to a notably higher snowfall during this winter compared to the others.
Temperature, humidity, and UV irradiance fluctuate throughout the day in response to lighting conditions. During the night, when there is no sunlight, the temperature decreases, the humidity increases, and the UV irradiance is zero. During the day, as sunlight increases, the temperature rises, the humidity decreases, and the UV irradiance increases. The sunlight striking the specimen and its support structure significantly raises the local temperature of the specimen, which becomes higher than the surrounding ambient temperature, and reduces the humidity, which becomes lower than the surrounding environment. Throughout the day, the temperature of the specimen fluctuates within a range of approximately 30 °C, while the humidity can fluctuate by up to 70%. On days with clear skies during the day and rainfall at night, the fluctuation range can even reach 90%.

5.4. Outdoor Aging Test Verification

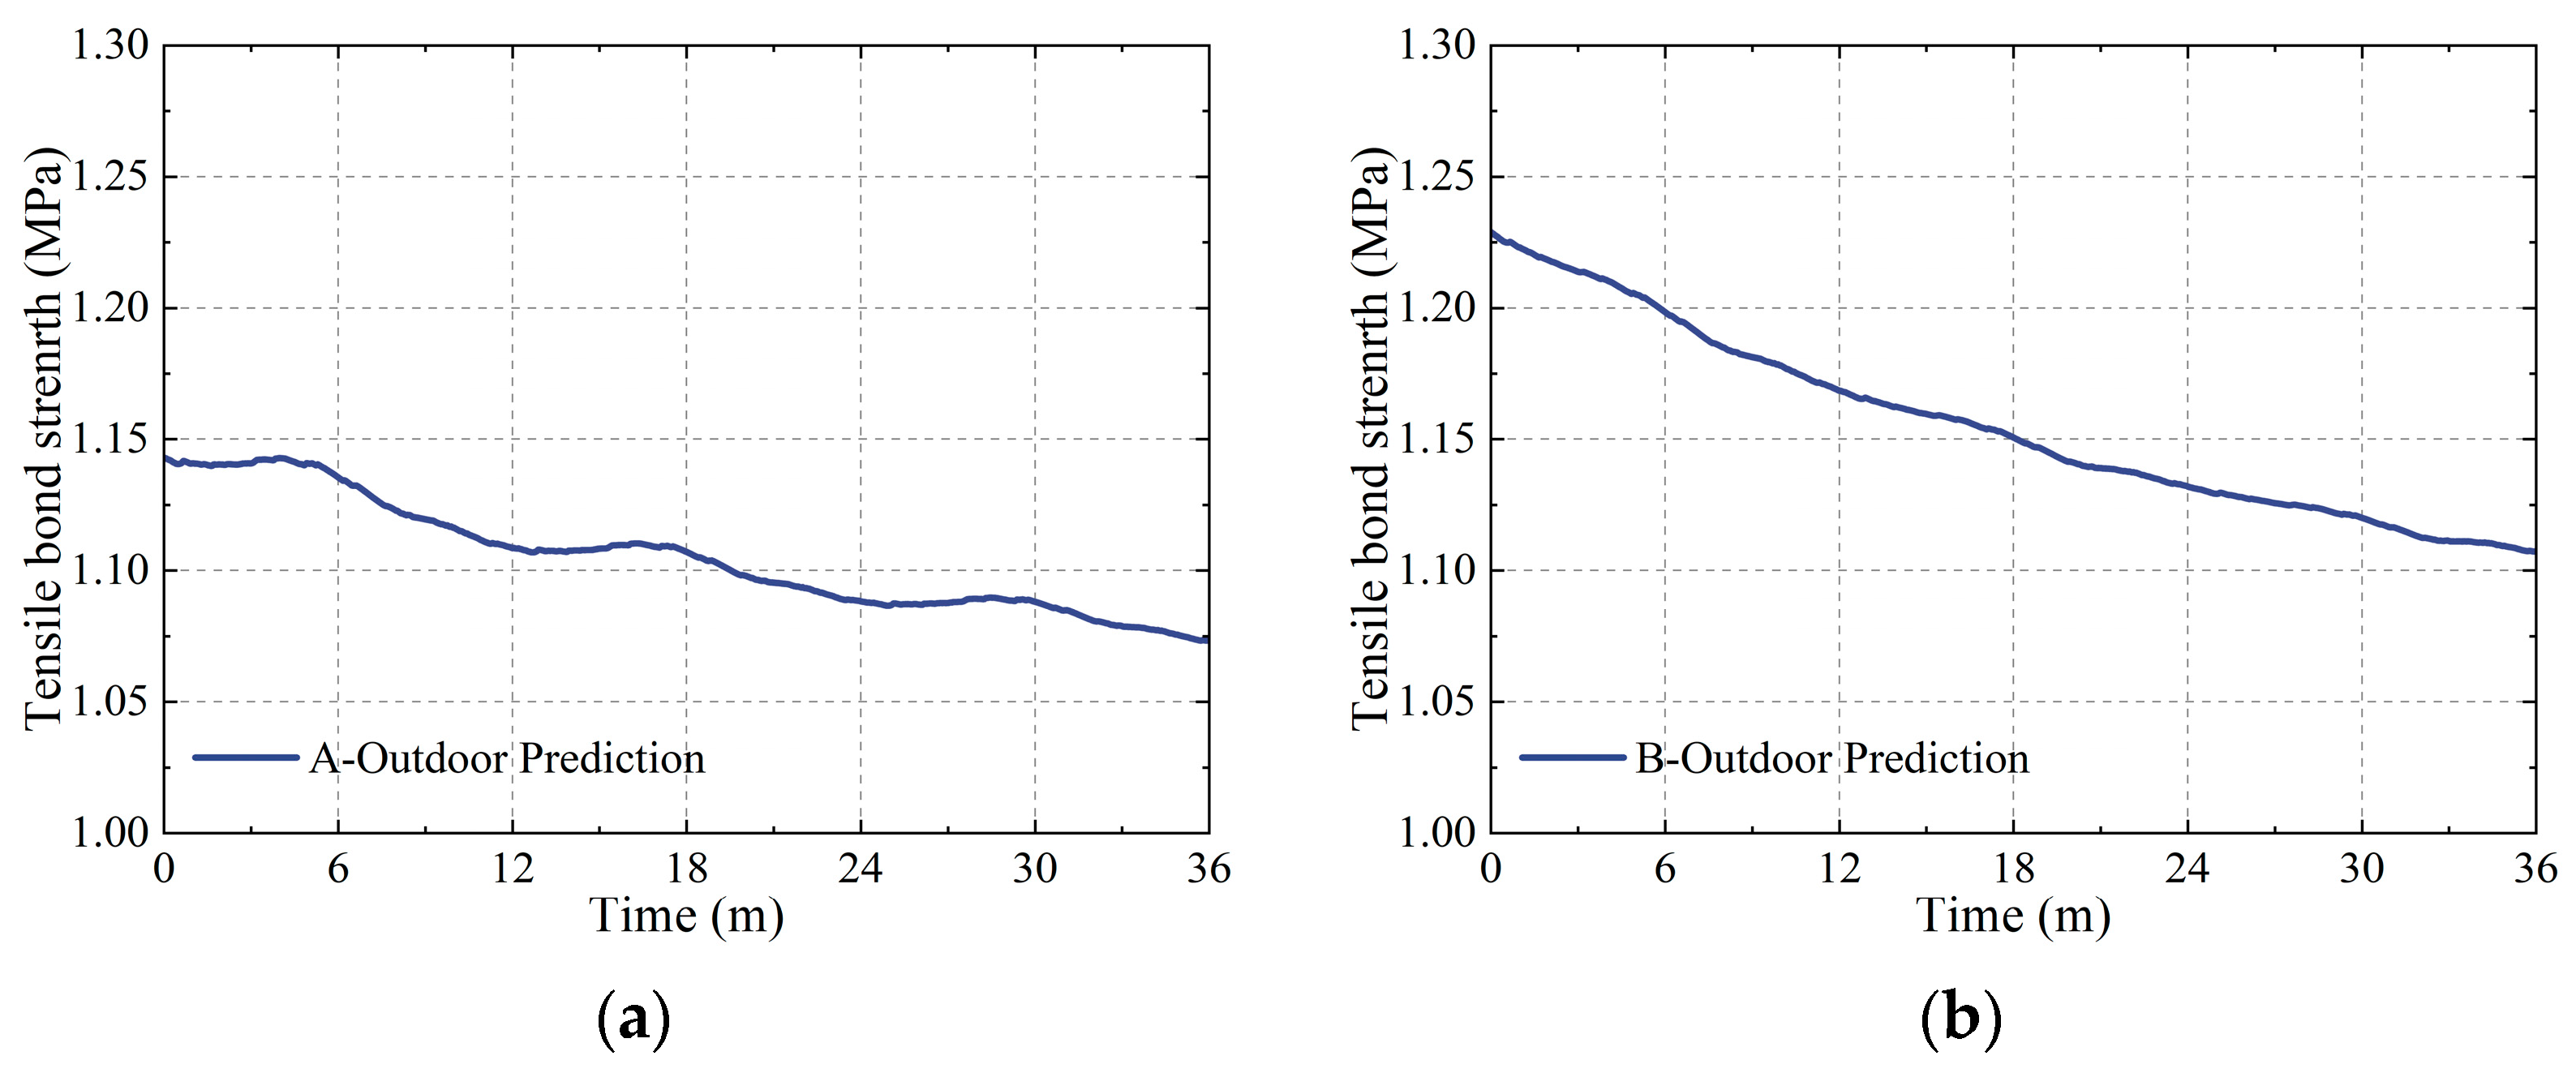
Based on the environmental condition data recorded during the outdoor aging test, the TBS of sealant A and sealant B during the outdoor aging test period were calculated using the recursive method, as shown in Figure 23. The TBS showed a fluctuating downward trend with aging time, with both sealants exhibiting small fluctuation amplitudes. Sealant A had slightly larger fluctuations compared to sealant B, with the amplitude of fluctuations for sealant B being very small. The strength of sealant A fluctuated cyclically with the seasons, with a small decrease in strength during winter, even slightly increasing in some cases, and a greater decrease in strength during summer. Compared to the initial strength, the strength decrease at the end of the outdoor aging test was 6.1% for sealant A and 9.9% for sealant B.
The calculation results for sealant A and sealant B were compared with the outdoor aging test results, as shown in Figure 24. The recursive method calculation results generally matched the trend of the outdoor aging test results, with the main difference being that the test results showed larger fluctuation amplitudes and more dispersion. The dispersion of the outdoor aging test results for sealant B was slightly smaller than for sealant A, as the sampling interval for sealant B was longer, being twice that of sealant A, resulting in half the number of data points. By appropriately increasing the sampling interval, the fluctuation amplitude and dispersion of the TBS data can be reduced, making it easier to assess the consistency between the recursive calculation results and the test results. The comparison between the calculation results and test results after increasing the sampling interval is shown in Figure 25. After increasing the sampling interval and reducing some of the test data points, the fluctuation amplitude of the test results significantly decreased, and the deviation between the recursive calculation results and the test results was reduced. The long-term variation trend of the test results after increased sampling intervals shows good consistency with the predicted results. With a prolonged testing time, the test results became increasingly consistent with the predicted results.
The MAE and RMSE between the recursive calculation results and the test results were calculated as follows: for sealant A, MAE = 0.063 MPa and RMSE = 0.077 MPa, and, for sealant B, MAE = 0.060 MPa and RMSE = 0.072 MPa. Although the MAE and RMSE for the outdoor aging test were higher compared to the laboratory aging test, the error in relation to the average strength in the outdoor aging test was only from 5% to 6%. Additionally, compared to the test results at the end of the outdoor aging test, the errors in the recursive calculation results were 5.64% for sealant A and 0.38% for sealant B. The recursive calculation results are not fit for the outdoor aging test results but are predictive results calculated based on the actual environmental conditions of the outdoor aging test. A 5% prediction error demonstrates acceptable accuracy that meets practical requirements, while already achieving a high level of precision in such predictive modeling.
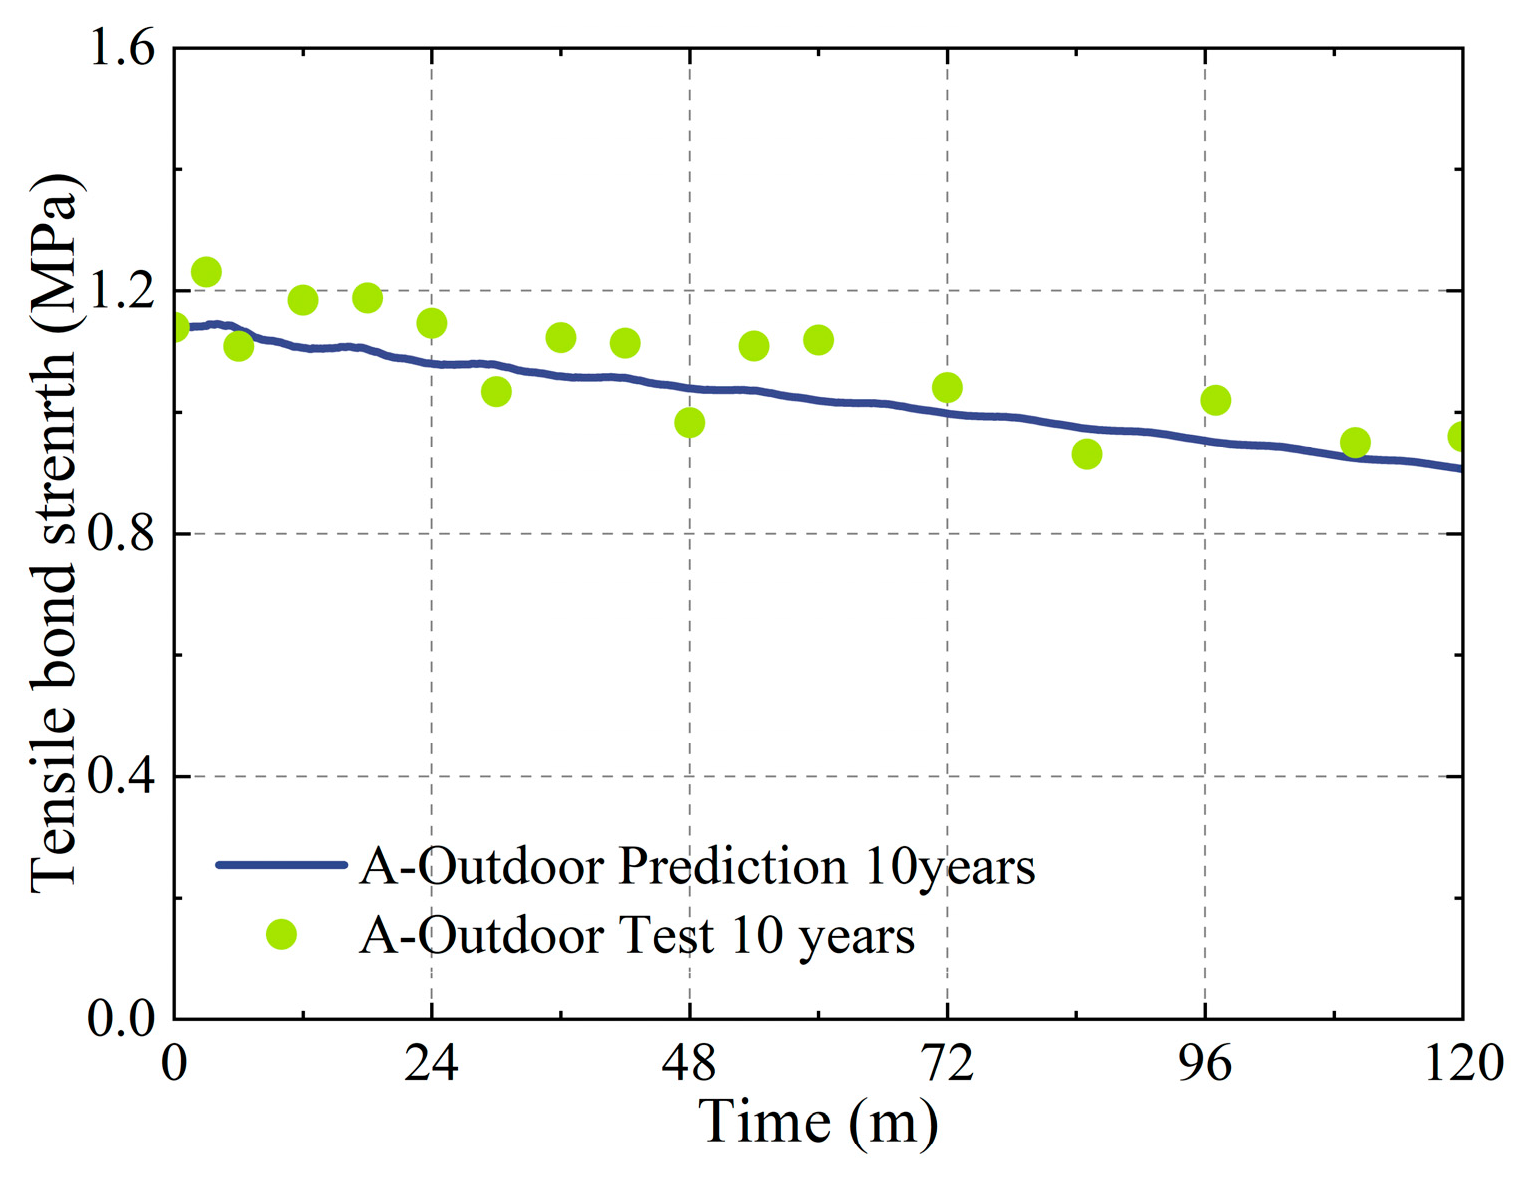
The manufacturer of sealant A also initiated outdoor aging tests on sealant A started from an earlier time, and the aging duration has now reached 10 years. The test location was Zhengzhou in China, where the climatic conditions are similar to those in Beijing. Since the manufacturer did not record the environmental conditions, the environmental data from the outdoor aging tests in this study were still adopted. A comparison between the predicted and test results is shown in Figure 26. The aging test results of sealant A from the manufacturer also exhibited a fluctuating downward trend, and the predicted results showed good consistency with the test results in terms of the variation trend. The MAE between the predicted and experimental results was 0.056 MPa, the RMSE was 0.062 MPa, and the prediction error at 120 months was 5.57%. Therefore, the recursive algorithm for TBS still maintains high prediction accuracy over longer aging periods.

5.5. Service Life Prediction

The service life of SSG sealants in glass curtain walls depends on whether the TBS can meet the required performance standards over time. Therefore, it is necessary to calculate the TBS of SSG sealants after long-term use. In practical glass curtain wall applications, the service life of SSG sealants has exceeded 40 years, hence an initial calculation period of 40 years was selected. The available environmental condition data cover only three years. However, considering that inter-annual environmental variations are minimal and that this study primarily focuses on the feasibility of the calculation method, the impact of data-induced errors on the conclusions is negligible. Consequently, the environmental condition data from the first three years were repeatedly applied to the remaining 37 years.
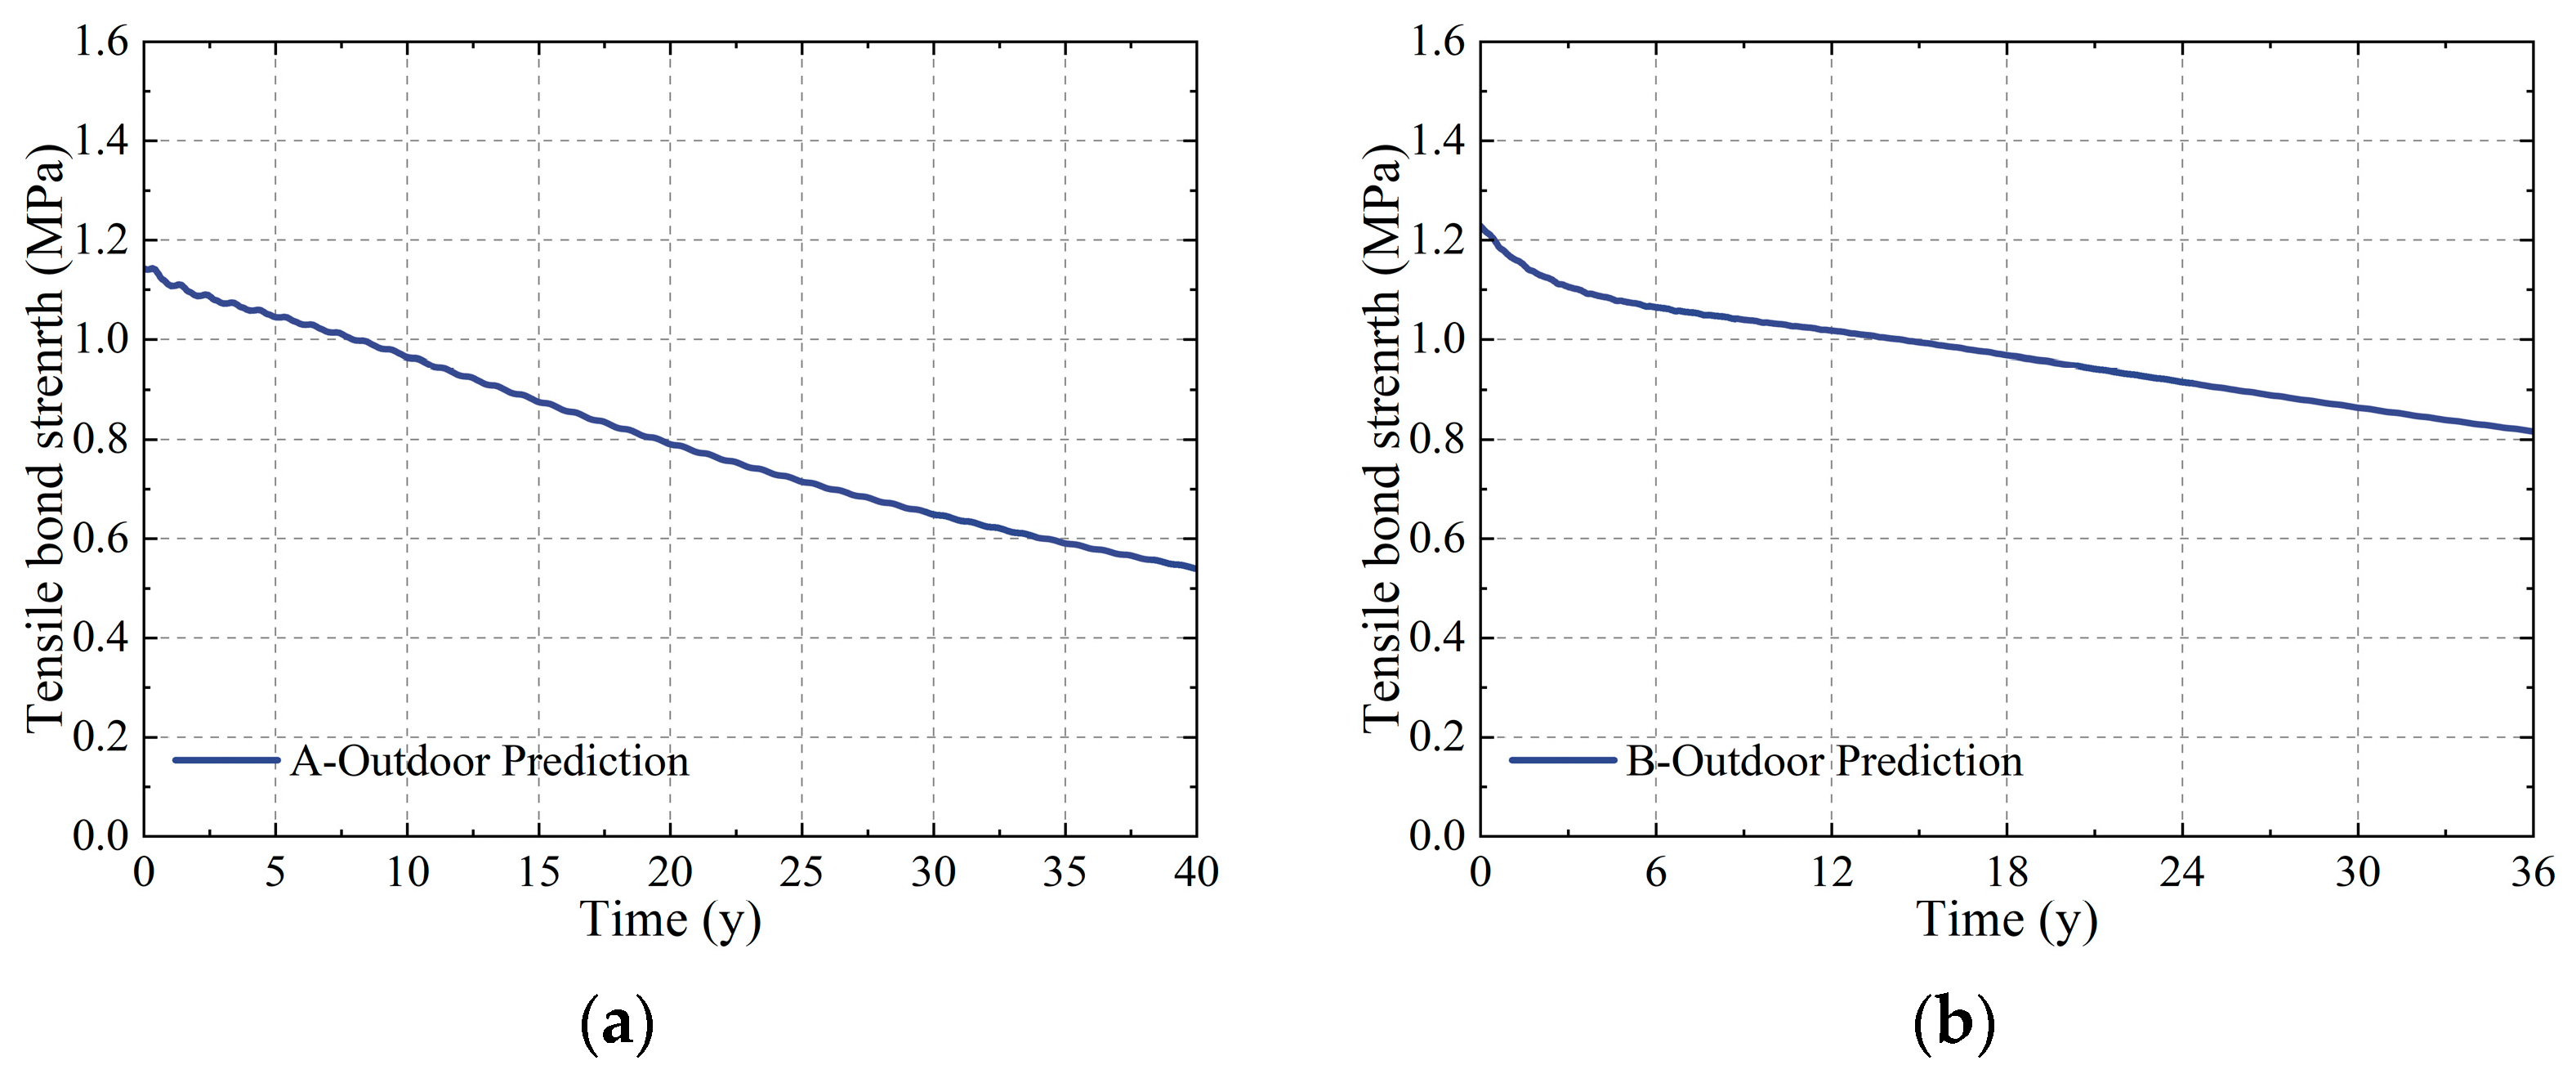
The calculated TBS of sealant A and sealant B under outdoor aging conditions over 40 years is shown in Figure 27. Both sealants exhibit an overall decreasing trend in TBS, with the rate of decrease gradually diminishing over time. The reduction in rate is more pronounced in the early aging stages. After 40 years of aging, the TBS of sealant A is 0.54 MPa, and that of sealant B is 0.78 MPa, representing reductions of 52.8% and 36.5% from their initial strengths, respectively.
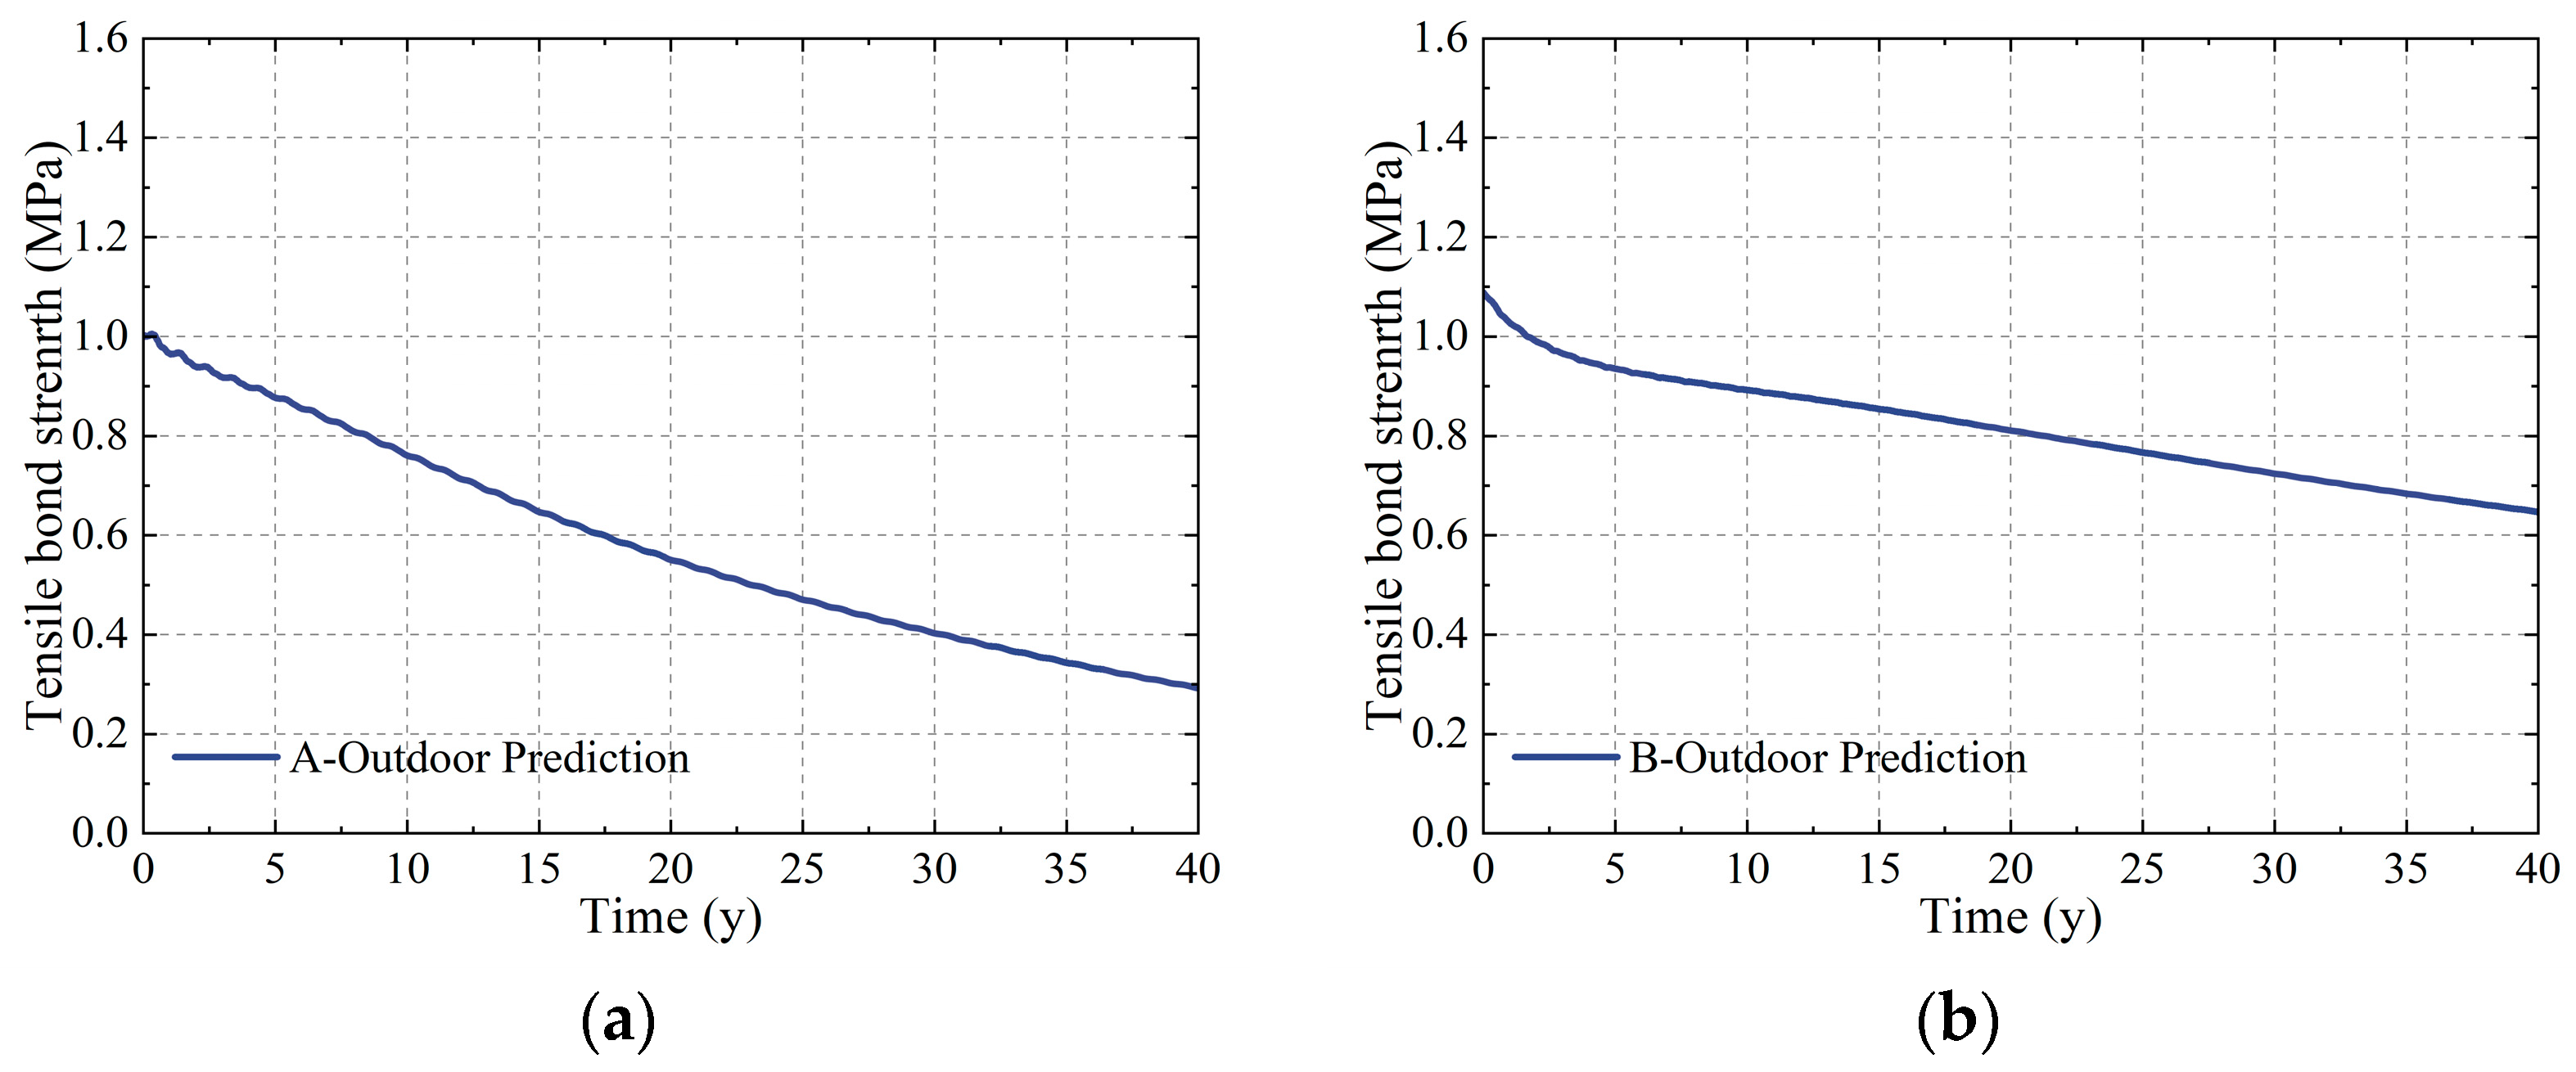
The degradation model is based on the average value of the test results, so the predicted results calculated by the degradation model are also average values. However, due to the material inhomogeneity of SSG sealants and unavoidable manufacturing defects, the TBS exhibits dispersion. Using the average value for service life prediction tends to be on the unsafe side. The European Technical Guidelines for SSG Sealants, ETAG 002 [41], stipulate that the TBS should be determined based on a characteristic strength value, ensuring a 95% probability of exceedance at a 75% confidence level. Use the standard deviation from 15 initial performance test specimens to calculate the characteristic TBS values after 40 years of aging, as shown in Figure 28.
The prediction of SSG sealant service life is based on TBS as the controlling parameter. A minimum TBS threshold must be established, below which the sealant is deemed unsuitable for further use. The service life of the sealant is defined as the time required to reach this threshold.
According to ASTM C1184, the TBS of SSG sealants before and after aging should be greater than 0.345 MPa. The TBS of sealant B remains well above 0.345 MPa even after 40 years of aging. As this study focuses solely on service life prediction methodology rather than determining exact service lives, the TBS beyond 40 years is only estimated. Using 0.345 MPa as the lower characteristic TBS threshold specified in ASTM C1184, the predicted service life of sealant A is 34 years, and that of sealant B is 65 years.
It is important to emphasize that service life predictions based on regulatory minimum post-aging characteristic TBS thresholds represent compliance-based estimations. These do not indicate that SSG sealants will completely lose their functionality after reaching the predicted service time but rather that structural reliability will gradually decrease. Over time, the safety margin may become insufficient to withstand extreme conditions, such as typhoons, potentially leading to structural failure.
Furthermore, the predicted service lives of sealant A and sealant B apply only to these specific sealant types under the studied environmental conditions and do not represent all sealants or environmental scenarios. Numerous sealant formulations have been used in construction over previous decades, with varying performance levels. Sealants with lower initial TBS and inferior durability will likely have significantly shorter service lives. Additionally, environmental factors such as temperature, humidity, and UV exposure significantly impact TBS degradation rates. The environmental conditions used in this study were based on data from Beijing, where climatic factors are relatively moderate. In regions with higher temperatures, humidity, or UV exposure, service lives will be shorter than those predicted for sealants A and B.

6. Conclusions

In this study, a series of laboratory aging tests under various combinations of temperature, humidity, stress, and UV irradiance were conducted to analyze the influence of these environmental factors on the degradation process of TBS, and a degradation model for TBS was established. Based on experimental data, the unknown parameters in the degradation model were calculated using an MCMC method grounded in Bayesian theory. A service life prediction method for SSG sealants was then proposed, which uses TBS as the evaluation index and employs a recursive method based on actual service environmental conditions. The main conclusions are summarized as follows:
  • By setting multiple levels for temperature, humidity, stress, and UV irradiance, a multi-level matrix test condition was formed. Comparing the test results under different conditions, the influence patterns of temperature, humidity, stress, and UV irradiance on the TBS of SSG sealants were obtained: The TBS is affected by the combined effects of crosslinking and degradation reactions, where crosslinking increases the TBS while degradation decreases it. An increase in temperature, humidity, stress, and UV irradiance accelerates the chemical reaction rates of both crosslinking and degradation, with their influence ranked from strongest to weakest as UV irradiance, temperature, humidity, and stress. The rates of crosslinking and degradation reactions determine the changes in TBS—in the early aging stage, the crosslinking rate exceeds degradation, leading to an increase in TBS, while, in the later aging stage, degradation surpasses crosslinking, resulting in a decrease in TBS. Different types of sealants exhibit variations in TBS changes because their crosslinking and degradation reaction rates are influenced differently by temperature, humidity, stress, and UV irradiance;
  • There exist synergistic effects among temperature, humidity, stress, and UV irradiance, with the coupling effect of UV irradiance being the most significant, amplifying the combined effects of other aging factors. However, UV irradiation alone cannot significantly accelerate the decline in TBS of SSG sealants; its effect is primarily manifested through synergistic interactions with other aging factors. In the combined effects of temperature, humidity, and stress, the temperature term accounts for approximately 50%, the temperature–humidity coupling term accounts for about 35%, and the total proportion of temperature-related terms reaches approximately 90%;
  • Based on the aging patterns and experimental data obtained from laboratory aging tests, a new degradation model for the aging of TBS in SSG sealants was established. This model incorporates temperature, humidity, stress, and UV irradiance as variables to reflect their influence on the aging of TBS. Using the aging test data, the unknown parameters in the degradation model were calculated using the MCMC algorithm based on Bayesian theory. The calculated results showed excellent agreement with the experimental data (R2 > 0.9, MAE = 0.019 MPa, RMSE = 0.0245 MPa), demonstrating high accuracy for both the degradation model and the computational method;
  • Natural aging tests were conducted simultaneously with laboratory aging tests, during which temperature, humidity, and UV irradiance were recorded. A recursive algorithm was proposed to calculate the TBS degradation under actual service conditions based on the degradation model and environmental condition records. Using the recorded environmental conditions from natural aging tests, the degradation model and recursive algorithm were applied to obtain predicted TBS results for natural aging. These predictions showed good agreement with the natural aging test data, demonstrating the validity and accuracy of this method;
  • The long-term aged TBS prediction results of SSG sealants were calculated using the degradation model combined with environmental condition records through a recursive algorithm. By incorporating the TBS limit requirements specified in different national standards, the predicted service life of SSG sealants was determined. The minimum limit value of characteristic TBS, which considers material discreteness and strength assurance rate, serves as a reliable evaluation criterion for assessing the service life of SSG sealants. The service life prediction method proposed in this study provides an important theoretical and methodological foundation for ensuring the long-term safety and maintenance strategies of glass curtain walls.

Author Contributions

Conceptualization, B.Y. and J.L. (Junjin Liu); methodology, B.Y.; software, B.Y.; validation, B.Y., J.L. (Jianhui Li) and Z.W.; formal analysis, B.Y.; investigation, B.Y.; resources, C.W.; data curation, B.Y.; writing—original draft preparation, B.Y.; writing—review and editing, J.L. (Junjin Liu) and Z.W.; visualization, B.Y. and Z.W.; supervision, J.L. (Junjin Liu); project administration, J.L. (Jianhui Li); funding acquisition, J.L. (Jianhui Li) and C.W. All authors have read and agreed to the published version of the manuscript.

Funding

This research was funded by the Youth Scientific Research Fund of China Academy of Building Research, grant number 20220118331030020, and the Key Research and Development Program of Shaanxi, grant number 2024SF-ZDCYL-05-11.

Data Availability Statement

The original contributions presented in this study are included in the article material. Further inquiries can be directed to the corresponding author.

Acknowledgments

SSG sealants used for experiments were provided by Zhengzhou Zhongyuan Silande High-tech Co., Ltd. and Guangzhou Baiyun Technology Co., Ltd.

Conflicts of Interest

Authors Bo Yang, Junjin Liu, Jianhui Li and Chao Wang were employed by the company China Academy of Building Research. The remaining authors declare that the research was conducted in the absence of any commercial or financial relationships that could be construed as a potential conflict of interest.

Abbreviations

The following abbreviations are used in this manuscript:
SSGSilicone structural glazing
UVUltraviolet
SPHERESimulated photodegradation via high energy radiant exposure
SBSStyrene–butadiene–styrene
TGThermogravimetric
PDMSPolydimethylsiloxane
MTMSMethyltrimethoxysilane
APSAminopropyltriethoxysilane
DBTLDibutyltin dilaurate
TBSTensile bond strength
MCMCMarkov chain Monte Carlo
MAEMean absolute error
RMSERoot mean square error
TTemperature
RHRelative humidity

References

  1. Wolf, A.T. Studies of the aging behavior of gun-grade building joint sealants—The state of the art. Mater. Struct. 1990, 23, 142–157. [Google Scholar] [CrossRef]
  2. Wang, Z.Y.; Liu, J.J.; Li, D.; Yang, K.X.; Chen, M.H.; Wang, C. Experimental and numerical study on load-bearing performance in triple-glazed insulating glass units. Constr. Build. Mater. 2024, 418, 135385. [Google Scholar] [CrossRef]
  3. Jones, T.G.B.; Hutchinson, A.R.; Wolf, A.T. Experimental Results Obtained with Proposed RILEM Durability Test Method for Curtain Wall Sealants. Mater. Struct. 2001, 34, 332–341. [Google Scholar] [CrossRef]
  4. Wolf, A.T. RILEM TC190-SBJ: Development of recommendations on novel durability test methods for wet applied curtain-wall sealants. Mater. Struct. 2008, 41, 1473–1486. [Google Scholar] [CrossRef]
  5. Wang, Q.; Li, S.; Wu, X.; Wang, S.; Ouyang, C. Weather aging resistance of different rubber modified asphalts. Constr. Build. Mater. 2016, 106, 443–448. [Google Scholar] [CrossRef]
  6. Celina, M.; Clough, R.L.; Jones, G.D. Initiation of polymer degradation via transfer of infectious species. Polym. Degrad. Stab. 2006, 91, 1036–1044. [Google Scholar] [CrossRef]
  7. Jin, J.; Chen, S.; Zhang, J. UV aging behavior of ethylene-vinyl acetate copolymers (EVA) with different vinyl acetate contents. Polym. Degrad. Stab. 2010, 95, 725–732. [Google Scholar] [CrossRef]
  8. Wilma, W.; Christoph, R.; Glen, J.S. Structural silicone sealants after exposure to laboratory test for durability assessment. J. Appl. Polym. Sci. 2021, 138, 50881. [Google Scholar] [CrossRef]
  9. Kaneko, T.; Ito, S.; Minakawa, T.; Hirai, N.; Ohki, Y. Degradation mechanisms of silicone rubber under different aging conditions. Polym. Degrad. Stab. 2019, 168, 108936. [Google Scholar] [CrossRef]
  10. Yazdan, M.; Hajipour, P.; Karampoor, M.R. Effects of humidity, ionic contaminations and temperature on the degradation of silicone-based sealing materials used in microelectronics. Microelectron. Reliab. 2024, 164, 115554. [Google Scholar] [CrossRef]
  11. Miyauchi, H.; Tanaka, K. Estimation of the fatigue resistance of sealants to movement at intersections of sealed joints and improvements in the joint design method. J. ASTM Int. 2004, 1, 13. [Google Scholar] [CrossRef]
  12. Takeshi, I.; Arild, G.; Bjørn, P.J. Fatigue resistance of double sealant composed of polyisobutylene sealant adjacent to silicone sealant. Constr. Build. Mater. 2014, 66, 467–475. [Google Scholar] [CrossRef]
  13. Ding, S.H.; Liu, D.Z. Durability evaluation of building sealants by accelerated weathering and thermal analysis. Constr. Build. Mater. 2006, 20, 878–881. [Google Scholar] [CrossRef]
  14. Wu, F.; Chen, B.; Yan, Y.; Chen, Y. Degradation of Silicone Rubbers as Sealing Materials for Proton Exchange Membrane Fuel Cells under Temperature Cycling. Polymers 2018, 10, 522. [Google Scholar] [CrossRef]
  15. Tan, K.T.; White, C.C.; Benatti, D.J.; Hunston, D.L. Effects of ultraviolet radiation, temperature and moisture on aging of coatings and sealants—A chemical and rheological study. Polym. Degrad. Stab. 2010, 95, 1551–1556. [Google Scholar] [CrossRef]
  16. Mojdeh, M.K.; Allan, M.; Thiru, A. Synergistic effects of hygrothermal conditions and solar ultraviolet radiation on the properties of structural particulate-filled epoxy polymer coatings. Constr. Build. Mater. 2021, 277, 122336. [Google Scholar] [CrossRef]
  17. Kychkin, A.K.; Startsev, O.V.; Lebedev, M.P.; Polyakov, V.V. Effect of solar radiation and synergism of the effect of UV radiation, temperature and moisture on the distraction of polymer composite materials in a cold climate. Procedia Struct. Integr. 2020, 30, 71–75. [Google Scholar] [CrossRef]
  18. Wang, Z.Y.; Liu, J.J.; Li, D.; Li, J.H.; Wang, C.; Yang, B.; Liu, Y. Experimental and numerical study on temperature-deformation behavior of insulating glass units. J. Build. Eng. 2025, 99, 111629. [Google Scholar] [CrossRef]
  19. Miyauchi, H.; Enomoto, N. Artificial weathering and cyclic movement test results based on the RILEM TC139DBS durability test method for construction sealants. J. ASTM Int. 2004, 1, 1–7. [Google Scholar] [CrossRef]
  20. RILEM Technical Committees. RILEM Technical Recommendation TC 139-DBS: Durability of building sealants, Durability test method-determination of changes in adhesion, Cohesion and appearance of elastic weatherproofing sealants for high movement facade joints after exposure to artificial weathering. Mater. Struct. 2001, 34, 579–588. [Google Scholar] [CrossRef]
  21. Yan, F. Long-Term Performance Evolution of the Material and Component of Hidden Frame Supported Glass Curtain Wall. Ph.D. Thesis, Zhejiang University, Hangzhou, China, 2019. [Google Scholar]
  22. White, C.; Hunston, D.; Tan, K.T. An accelerated exposure and testing apparatus for building joint sealants. Rev. Sci. Instrum. 2013, 84, 095113. [Google Scholar] [CrossRef] [PubMed]
  23. Adam, L.P.; White, C.C. Predicting Field Degradation of Sealants Using Accelerated Tests from the NIST Solar SRHERE. In Service Life Prediction of Polymers and Plastics Exposed to Outdoor Weathering, 1st ed.; Elsevier: Amsterdam, The Netherlands, 2018; pp. 135–159. [Google Scholar] [CrossRef]
  24. Wang, Z.Y.; Liu, J.J.; Li, D.; Li, J.H.; Wang, C.; Liu, Y. Thermal-deformation behaviors of the primary sealants in double, triple, and multi-glazed insulating glass units. Constr. Build. Mater. 2024, 450, 138631. [Google Scholar] [CrossRef]
  25. Lee, S.K.; Hirouki, M.; Jeong, J.Y. Reliability assessment of structural sealant durability. In Durability of Building and Construction Sealants and Adhesives: 5th Volume; ASTM International: West Conshohocken, PA, USA, 2015; pp. 65–84. [Google Scholar] [CrossRef]
  26. White, C.C.; Donald, L.H.; Adam, P. Designing of an accelerated test method to determine the design life of building joint sealant using the ASTM C1850 procedure. In Durability of Building and Construction Sealants and Adhesives: 6th Volume; ASTM International: West Conshohocken, PA, USA, 2018; pp. 74–93. [Google Scholar] [CrossRef]
  27. Adam, L.P.; White, C.C.; Sung, L.P. Bayesian hierarchical models for service-life prediction of polymers. In Service Life Prediction of Polymers and Coatings; Elsevier: Amsterdam, The Netherlands, 2020; pp. 209–231. [Google Scholar] [CrossRef]
  28. ASTM C1135-19; Standard Test Method for Determining Tensile Adhesion Properties of Structural Sealants. ASTM Committee E06: West Conshohocken, PA, USA, 2019.
  29. JG/T 475-2015; SSG Sealant for Building Curtain Wall. Department of Construction of the PRC, China Standards Press: Beijing, China, 2015.
  30. ASTM C1401-14; Standard Guide for Structural Sealant Glazing. ASTM Committee E06: West Conshohocken, PA, USA, 2014.
  31. JGJ 102-2013; Technical Code for Glass Curtain Wall Engineering. Department of Construction of the PRC, China Standards Press: Beijing, China, 2013.
  32. Ding, S.H. Studies on Weathering and Durability of Building Sealants. Ph.D. Thesis, Zhengzhou University, Zhengzhou, China, 2006. [Google Scholar]
  33. Li, J.J.; Zhang, H.H.; Li, G.F. Infrared spectral analysis and aging mechanism of UV-irradiated high-temperature vulcanized silicone rubber. Spectrosc. Spectr. Anal. 2020, 40, 1063–1070. [Google Scholar]
  34. Wolf, A.T. RILEM Technical Recommendation TC 190-SBJ: Service-life prediction of sealed building and construction joints, Durability test method: Determination of changes in adhesion, cohesion and appearance of elastic weatherproofing sealants after exposure of statically cured specimens to artificial weathering and mechanical cycling. Mater. Struct. 2008, 41, 1497–1508. [Google Scholar] [CrossRef]
  35. Wolf, A.T. Recommendation of RILEM TC 190-SBJ: Service-life prediction of sealed building and construction joints. Mater. Struct. 2008, 41, 1487–1495. [Google Scholar] [CrossRef]
  36. Liu, J.J.; Liu, R.C.; Yan, F. Study on loading sensitivity of structural adhesive of glass curtain walls. China Build. Waterpr. 2019, 7, 33–36. [Google Scholar]
  37. ASTM C1184-14; Standard Specification for Structural Silicone Sealants. ASTM Committee E06: West Conshohocken, PA, USA, 2014.
  38. Guniyev, T. Life prediction of polymer-based composite materials. J. Mater. Eng. 1994, 2, 53–56. [Google Scholar]
  39. Gelman, A. Prior distributions for variance parameters in hierarchical models. Bayesian Anal. 2006, 1, 515–533. [Google Scholar] [CrossRef]
  40. Wang, Z.Y.; Liu, J.J.; Li, J.H.; Chen, S.W. Whole-life wind-induced deflection of insulating glass units. Wind Struct. 2023, 37, 289–302. [Google Scholar] [CrossRef]
  41. ETAG 002-2012; Guideline for European Technical Approval for Structural Sealant Glazing Kits: Part 1 Supported and Unsupported Systems. European Organisation for Technical Approvals: Brussels, Belgium, 2012.
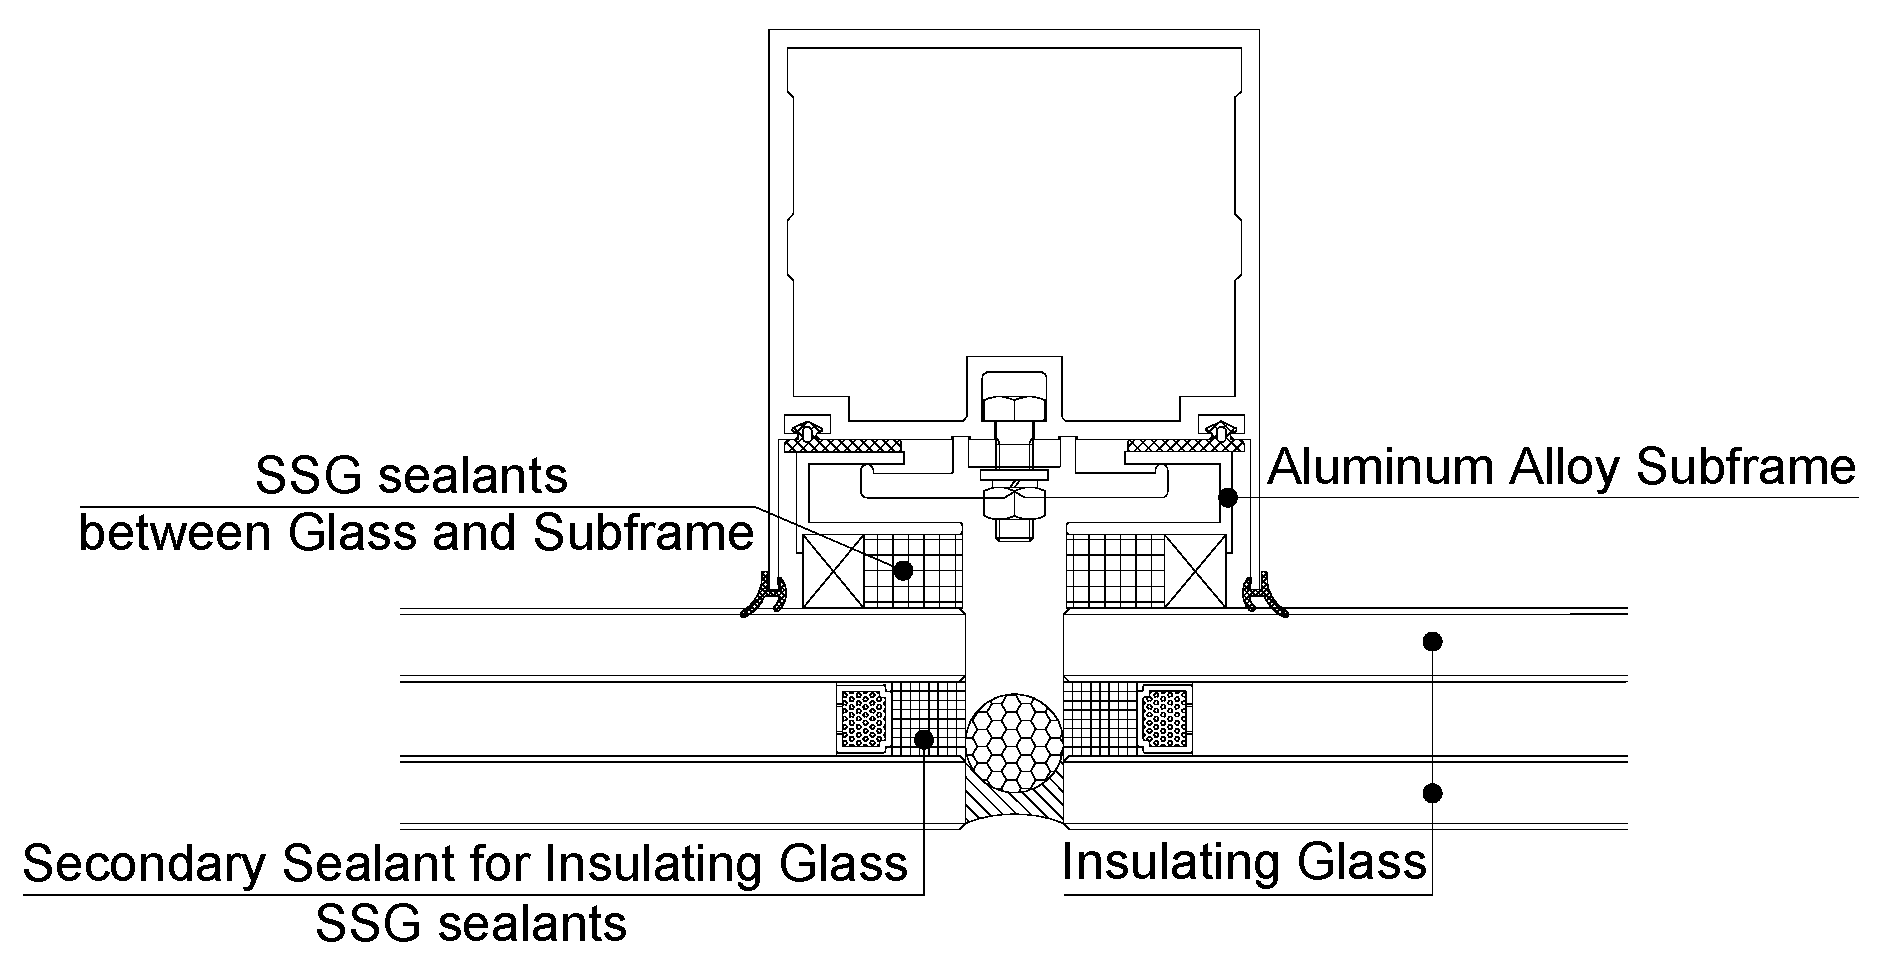
Figure 1. Application diagram of SSG sealant in hidden-frame glass curtain wall.
Buildings 15 01664 g001
Figure 2. Dimensions and details of specimen.
Buildings 15 01664 g002
Figure 3. Xenon arc aging chamber.
Buildings 15 01664 g003
Figure 4. Xenon arc lamp spectrum.
Buildings 15 01664 g004
Figure 5. Loading mechanism.
Buildings 15 01664 g005
Figure 6. Stress-loading apparatus: (a) tensile schematic diagram; (b) compression schematic diagram; (c) top view of the specimen; (d) side view of the specimen. Note: 1—sealant; 2—glass panel; 3—aluminum plate; 4—upper clamp; 5—lower clamp; 6—vertical limit screw; 7—horizontal limit screw; 8—limit nut.
Buildings 15 01664 g006
Figure 7. Outdoor aging rack.
Buildings 15 01664 g007
Figure 8. Failure mode of test specimens.
Buildings 15 01664 g008
Figure 9. Tension load–displacement curve.
Buildings 15 01664 g009
Figure 10. TBS–time curve of laboratory aging tests.
Buildings 15 01664 g010
Figure 11. TBS–time curve of specimen groups under different temperatures: (a) sealant A; (b) sealant B.
Buildings 15 01664 g011
Figure 12. TBS–time curve of specimen groups under different humidity: (a) sealant A; (b) sealant B.
Buildings 15 01664 g012
Figure 13. TBS–time curve of specimen groups under different stress: (a) sealant A; (b) sealant B.
Buildings 15 01664 g013
Figure 14. TBS–time curve of specimen groups under different UV irradiance: (a) sealant A; (b) sealant B.
Buildings 15 01664 g014
Figure 15. TBS–time curve of synergistic effect among temperature and UV irradiation: (a) condition II; (b) condition VI.
Buildings 15 01664 g015
Figure 16. TBS–time curve of synergistic effect among temperature and humidity: (a) condition II and III; (b) condition IV and VI.
Buildings 15 01664 g016
Figure 17. TBS–time curve of outdoor aging tests: (a) sealant A; (b) sealant B.
Buildings 15 01664 g017
Figure 18. TBS fitting curve of different temperature specimen groups.
Buildings 15 01664 g018
Figure 19. TBS–time curve of degradation model: (a) Effect of stress; (b) effect of temperature; (c) effect of humidity; (d) effect of UV irradiance.
Buildings 15 01664 g019
Figure 20. Comparison of test and model results.
Buildings 15 01664 g020
Figure 21. Comparison of two-stage test and model results.
Buildings 15 01664 g021
Figure 22. Environmental conditions record of outdoor aging test: (a) temperature record; (b) humidity record; (c) UV irradiance record.
Buildings 15 01664 g022
Figure 23. TBS prediction results of outdoor aging tests: (a) sealant A; (b) sealant B.
Buildings 15 01664 g023
Figure 24. Comparison of outdoor aging test and prediction results: (a) sealant A; (b) sealant B.
Buildings 15 01664 g024
Figure 25. Comparison of outdoor aging test and prediction results (reduced data): (a) sealant A; (b) sealant B.
Buildings 15 01664 g025
Figure 26. Comparison of outdoor aging test and prediction results for sealant A (10 years).
Buildings 15 01664 g026
Figure 27. Outdoor aging prediction results: (a) sealant A; (b) sealant B.
Buildings 15 01664 g027
Figure 28. Outdoor aging prediction results ensure a strength assurance rate of over 95% at a confidence level of 75%: (a) sealant A; (b) sealant B.
Buildings 15 01664 g028
Table 1. Initial mechanical properties of SSG sealants.
Sealant TypeTensile Bond Strength (MPa)Maximum
Elongation Rate (%)
Modulus at 20%
Elongation (MPa)
Shore Hardness (HA)
A1.142051.6937
B1.231541.9143
Note: The values in the table represent the average of 15 specimens.
Table 2. Test specimen groups ID and test conditions.
Condition IDSpecimen Group IDSealant TypeTemperature (°C)Humidity (%)Stress
(MPa)
UV Irradiance (W/m2)Test
Interval (h)
IA-65/70-0.14-UVA65700.1440500
A-65/70-0.07-UVA65700.0740500
A-65/70-0-UVA6570040500
A-65/70-0.14A65700.1401000
A-65/70-0.07A65700.0701000
A-65/70-0A6570001000
B-65/70-0.14-UVB65700.14401000
B-65/70-0-UVB65700401000
B-65/70-0.14B65700.1401000
B-65/70-0B6570001000
II*-65/10-*-*In the same condition I6510In the same condition IIn the same condition IIn the same condition I
III*-65/40-*-*In the same condition I6540In the same condition IIn the same condition IIn the same condition I
IV*-15/40-*-*In the same condition I1540In the same condition IIn the same condition IIn the same condition I
V*-40/40-*-*In the same condition I4040In the same condition IIn the same condition IIn the same condition I
VI*-15/10-*-*In the same condition I1510In the same condition IIn the same condition IIn the same condition I
Note: In Conditions II–VI, the specimen grouping methodology and testing condition were maintained identical to Condition I, with variations solely introduced in temperature and humidity levels. In the specimen group ID, the notation “-65/10-*-*” for Condition II indicates that the second part of the specimen group ID was “65/10”, while the remaining parts were identical to those in Condition I. Representative examples include A-65/10-0.14-UV and B-65/10-0, with analogous nomenclature conventions applied to subsequent conditions.
Table 3. ΔTSAB of sealant A.
Temp-HumTemp-StrHum-StrTemp-UVHum-UVUV-Str
ΔTSAB (MPa)0.0760.0110.0310.1380.0670.064
Table 4. TBS fitting parameter results.
Specimen Group IDFitting Parameter ResultsR2
ηβλ/×10−4θ/×10−4
A-65/40-0.14-UV0.60.410.1712.950.94
A-40/40-0.14-UV0.60.47.2010.870.85
A-15/40-0.14-UV0.60.46.028.030.85
A-65/70-0.14-UV0.60.414.5916.150.90
A-65/10-0.14-UV0.60.47.649.110.89
A-65/40-0.07-UV0.60.48.7911.570.91
A-65/40-0-UV0.60.47.4210.180.92
A-65/40-0.140.60.40.340.760.90
Table 5. Parameter calculation results 1.
Sealant IDηβα1/10−4α2/10−4α3/10−4α4/10−4α5/10−4α6/10−4α7/10−4α8/10−4
A0.70520.39540.07549571.880.63582047.020.00554965.900.09136980.18
B0.75720.32800.04539585.890.42943024.160.00435779.880.12474185.66
Table 6. Parameter calculation results 2.
Sealant IDα9/10−4α10/10−4α11α12α13/10−4α14/10−4α15/10−4α16/10−4α17/10−4α18/10−4
A0.00740.03623.58843.10550.23500.49150.06230.07360.02430.0670
B0.00760.05164.28343.21240.10060.29450.03790.09210.01110.0839
Table 7. Parameter λ and θ calculation results.
Specimen Group ID λθ
λTλHλσλTHλλλU/10−4θTθHθσθTHθθθU/10−4
A-65/70-0.14-UV 2.24860.10690.10141.83330.69480.231336.180.92720.06310.06780.52720.11280.087822.32
PCT43.11%2.05%1.94%35.15%13.32%4.43% 51.92%3.53%3.80%29.52%6.32%4.92%
A-65/70-0.14 2.24860.10690.10141.83330.69480.231310.92720.06310.06780.52720.11280.08781
PCT43.11%2.05%1.94%35.15%13.32%4.43% 51.92%3.53%3.80%29.52%6.32%4.92%
A-65/70-0.07-UV 2.24860.10690.05071.83330.34740.115636.180.92720.06310.03390.52720.05640.043922.32
PCT47.82%2.27%1.08%38.98%7.39%2.46% 56.14%3.82%2.05%31.92%3.41%2.66%
A-15/10-0.14-UV 1.45530.07940.10140.11640.30880.033036.180.67820.00020.06780.03350.05010.012522.32
PCT69.49%3.79%4.84%5.56%14.74%1.58% 80.52%0.02%8.05%3.97%5.95%1.49%
Disclaimer/Publisher’s Note: The statements, opinions and data contained in all publications are solely those of the individual author(s) and contributor(s) and not of MDPI and/or the editor(s). MDPI and/or the editor(s) disclaim responsibility for any injury to people or property resulting from any ideas, methods, instructions or products referred to in the content.