
The Impact of Housing Prices on Chinese Migrants’ Return Intention: A Moderation Analysis of Public Services


Abstract
1. Introduction
2. Literature Review
2.1. Return Migration
2.2. Factors Influencing Return Intentions
2.3. Housing Prices, Public Services, and Return Intentions
3. Data and Methods
3.1. Data Source
3.2. Variables
3.2.1. Dependent Variable
3.2.2. Independent Variables
3.2.3. Moderator Variables
3.2.4. Instrumental Variables (IVs)
3.2.5. Control Variables
3.3. Model
3.3.1. Entropy Method
3.3.2. Probit Model
3.3.3. Moderating Model
3.3.4. IV Strategy
4. Result
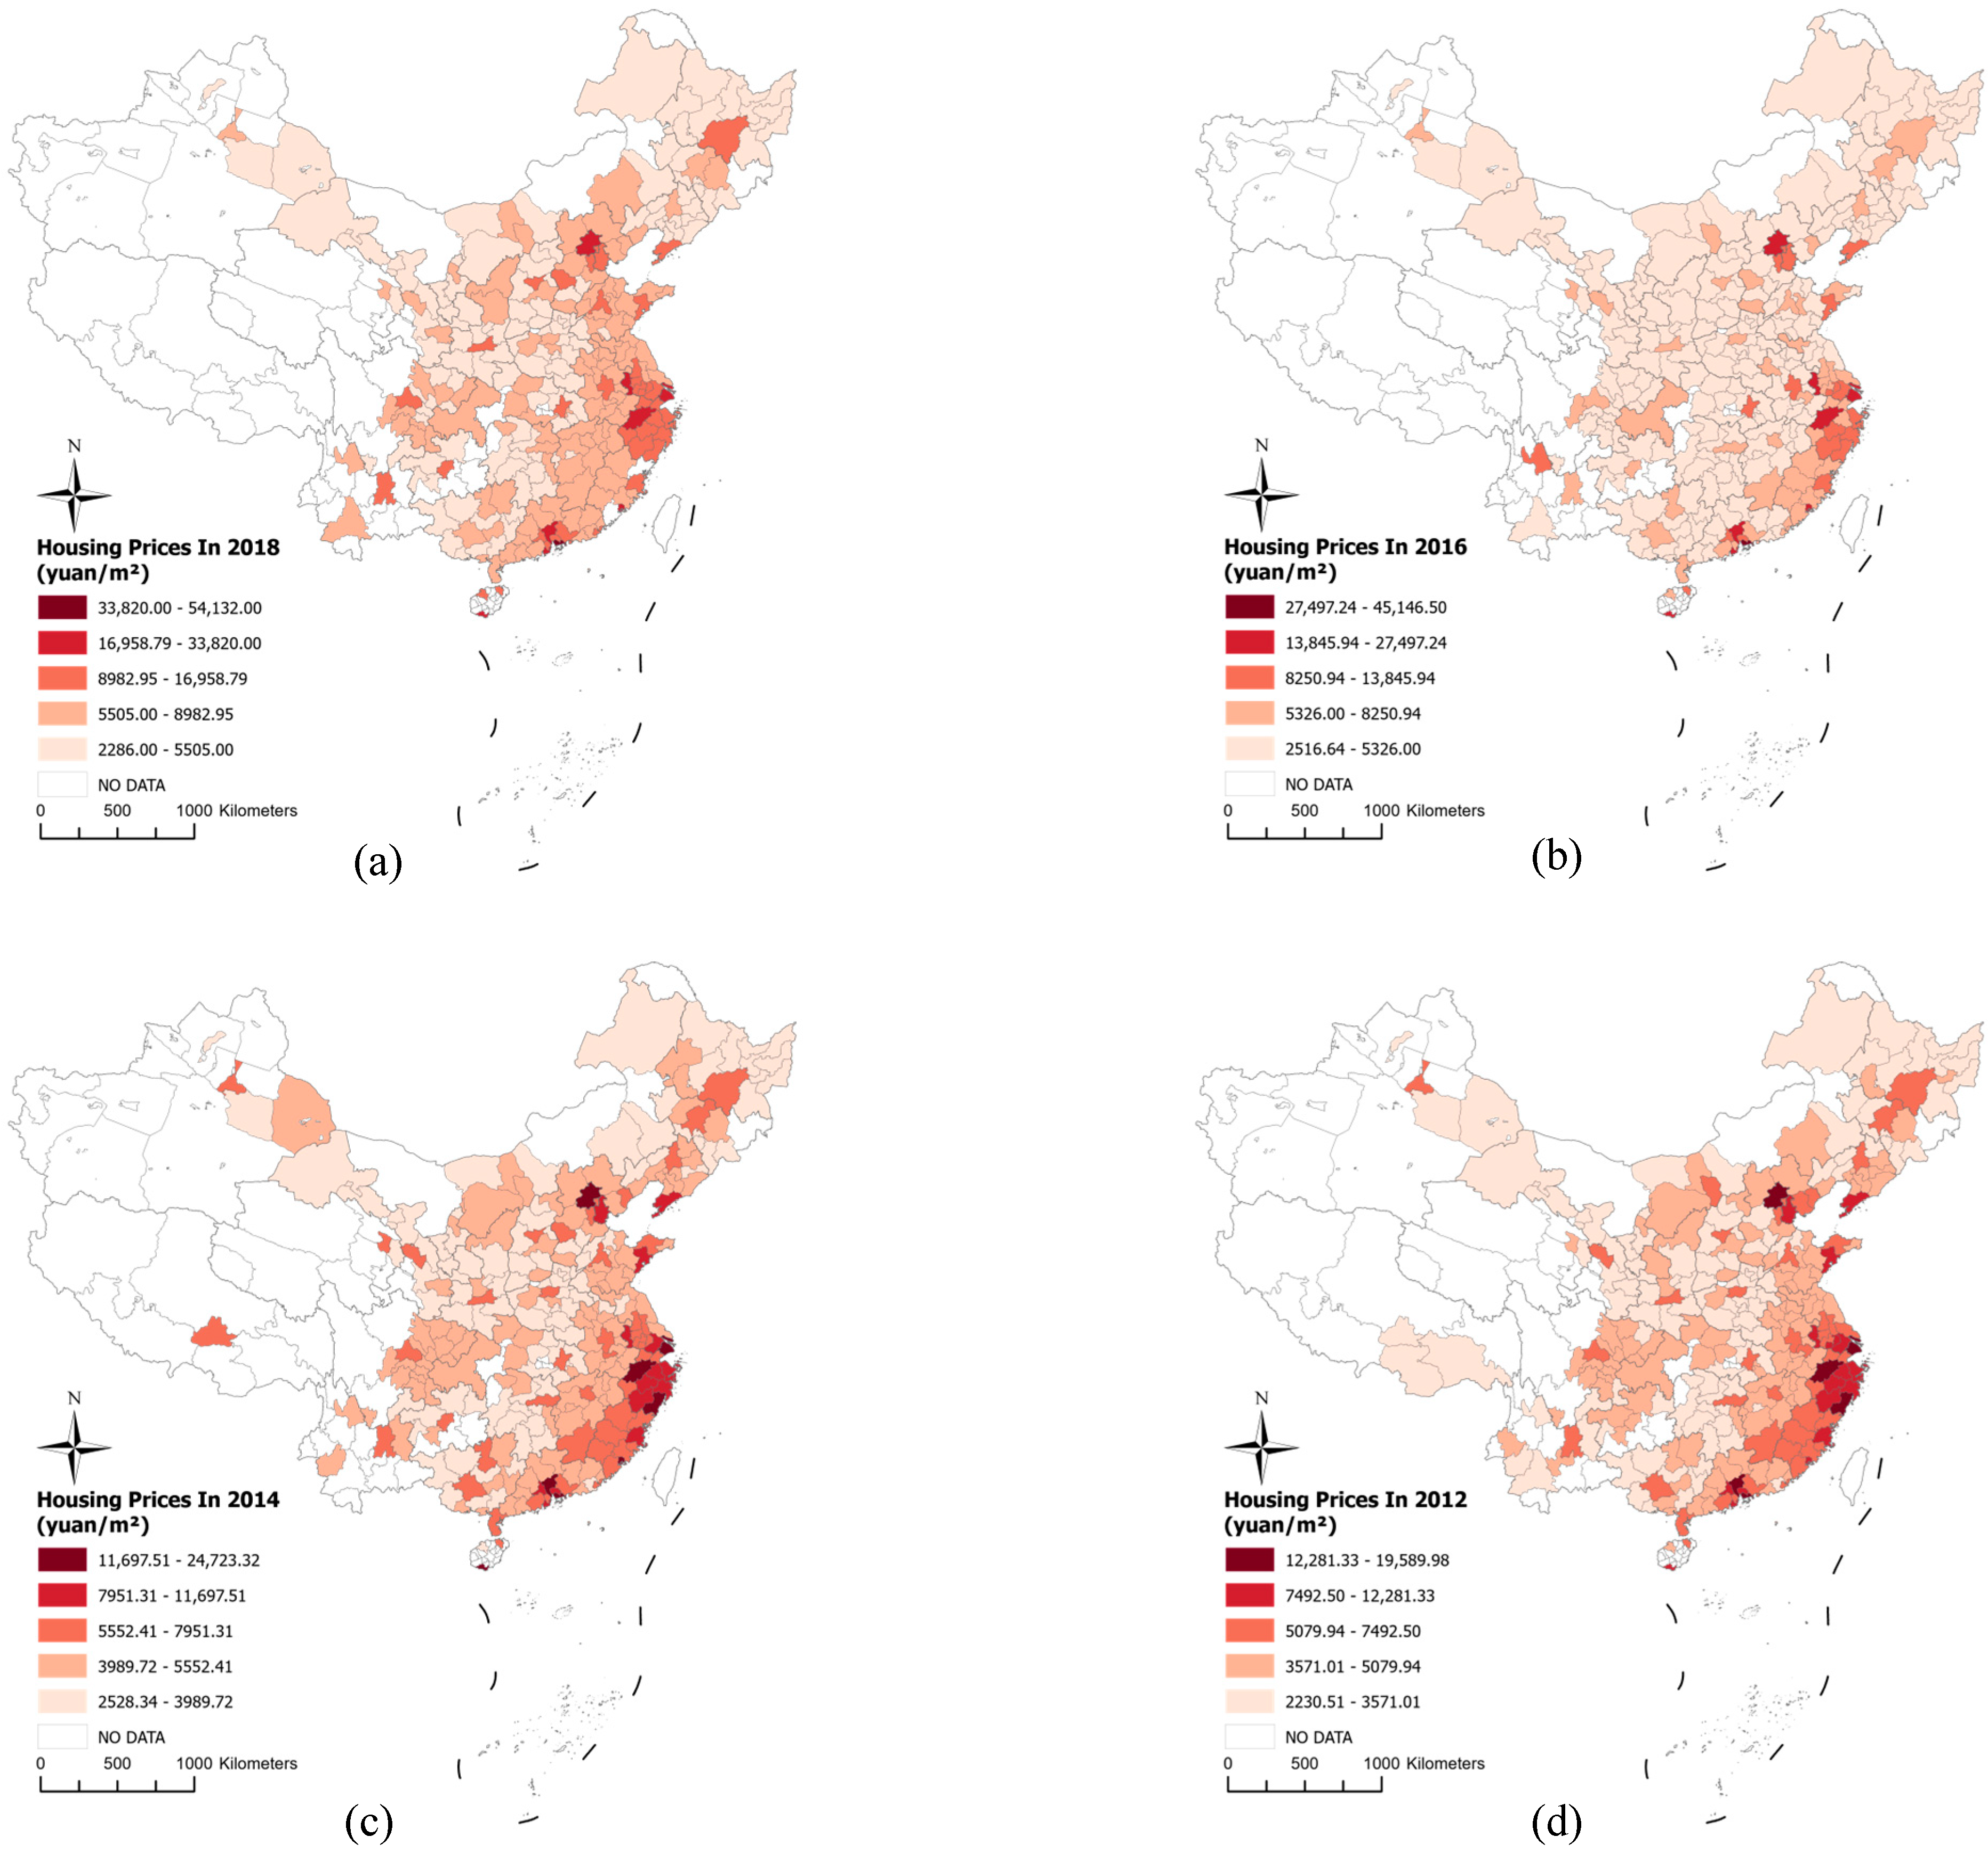
4.1. The Spatial Distribution of Housing Prices
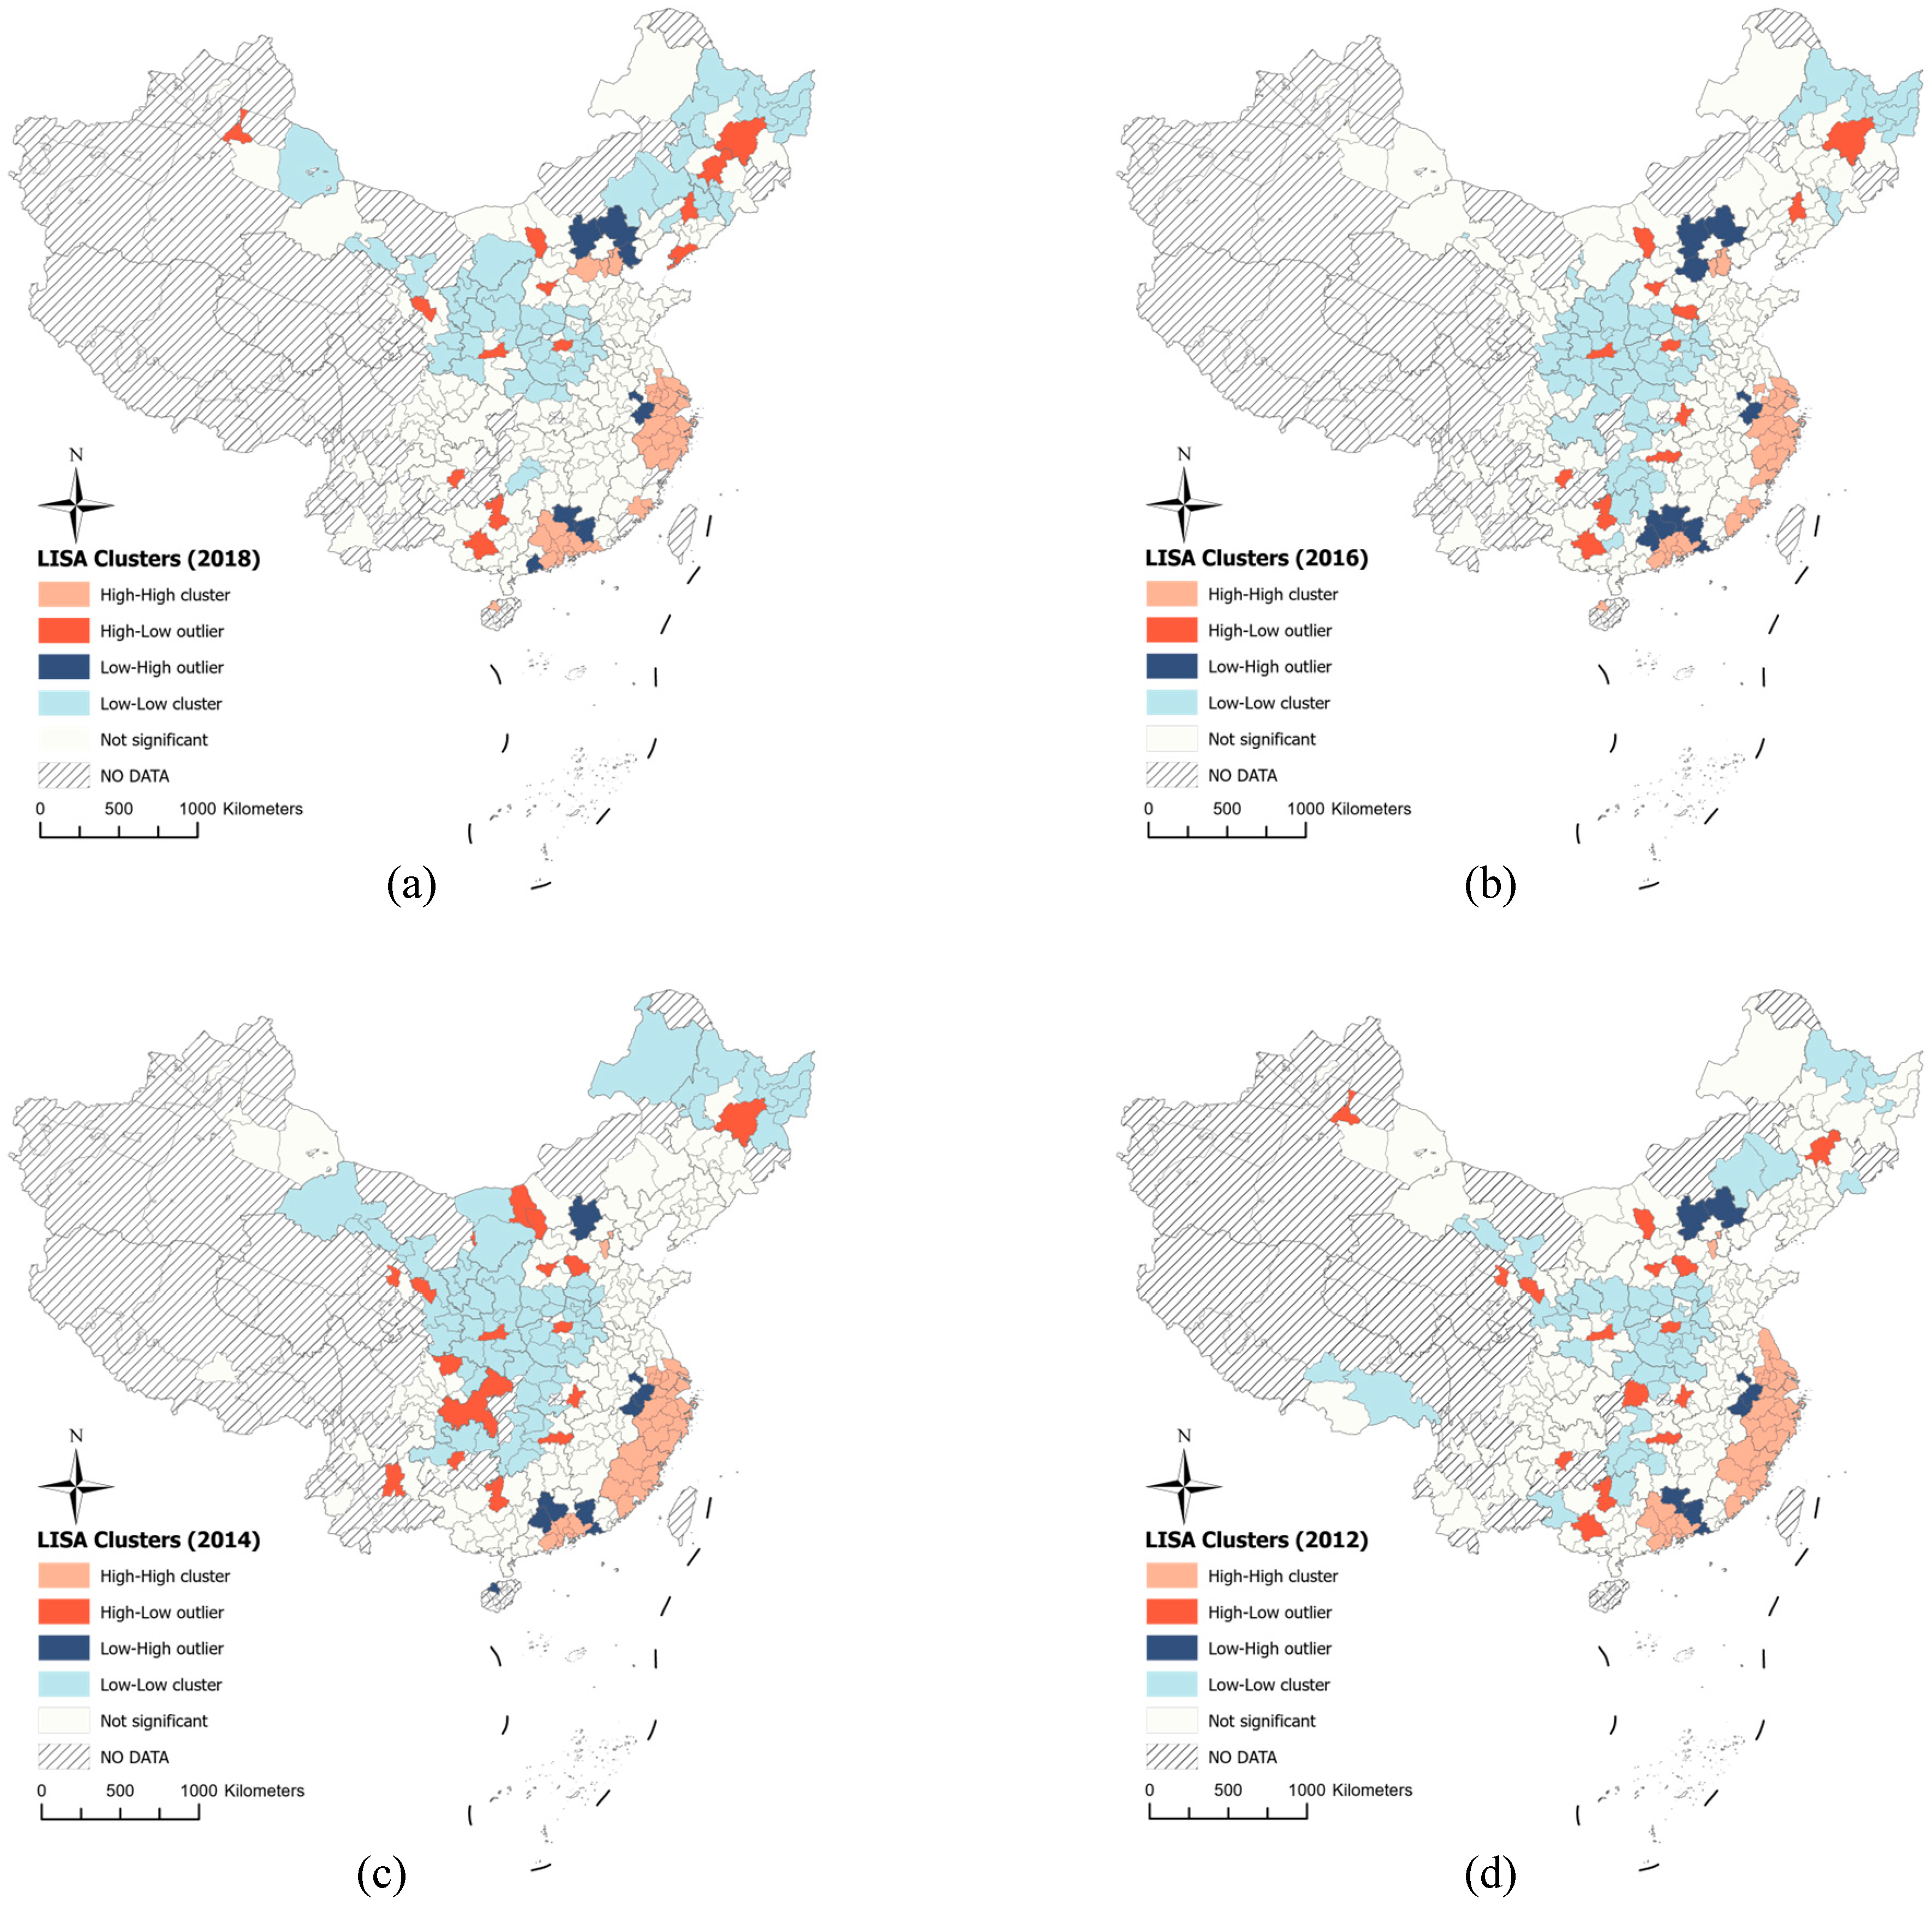
4.2. Descriptive LISA Clusters of Housing Prices
4.3. Descriptive Statistics
4.4. The Effect of Housing Prices and Public Services on Migrants’ Return Intentions
4.5. Instrumental Variable Results
4.6. Heterogeneity Differences
4.7. Robustness Test
5. Discussion and Conclusions
5.1. Discussion
5.2. Conclusions
- (1)
- Housing prices positively affect migrants’ intentions to return to their hometowns. If housing prices in destination cities increase by 1%, the return intentions of migrants increase by 0.196%. Increasing housing prices have a crowding-out effect on the migrants in the destination city and push migrants to return to original cities. The results show that marriage, age, male gender, agricultural hukou, and tier-1 cities are significantly positively correlated with the return intentions of migrants.
- (2)
- Public services levels negatively moderate the housing prices–return intention relationship. A 1-point increase in the level of public services causes a decrease of 4.342 in the score of the impact of housing prices on return intentions for migrants. The high level of public services has a crowding-in and “pull” effect on the migrants in destination cities.
- (3)
- Heterogeneity exists in the impact of housing prices on migrants’ return intentions. From the perspective of individual factors, the positive impact of housing prices is mainly concentrated among single urban migrants without housing. It is hard for single rural migrants without housing with low human capital to settle down in a destination and they have to return to their hometowns. The findings reveal that levels of public services negatively moderate the positive impact of housing prices on the return intentions of single rural migrants without housing. Destination cities that offer better public services alleviate their intention to return to their hometowns.
Author Contributions
Funding
Institutional Review Board Statement
Data Availability Statement
Acknowledgments
Conflicts of Interest
Appendix A

| Variables | Definition | N | Mean | S.D. | Min | Max |
|---|---|---|---|---|---|---|
| Dependent variables | ||||||
| Return intentions | Dummy variable: Return = 1 (base); Non-return = 0 | 6016 | 0.536 | 0.499 | 0 | 1 |
| Independent variables | ||||||
| Housing prices | Continuous variables: The logarithm of the average price of commercial housing in each city (yuan/m2) | 6016 | 8.594 | 0.408 | 7.759 | 10.12 |
| Instrumental variables | ||||||
| Land supply elasticity | Continuous variables: Elastic land supply (%) | 5988 | 0.0510 | 0.121 | 0 | 0.572 |
| Land supply elasticity × Public services | The interaction term between elastic land supply and public services | 5988 | 0.003 | 0.010 | 0.000 | 0.109 |
| Fiscal decentralization | Continuous variables: Fiscal revenue within the budget of prefecture-level cities/fiscal revenue within the central budget (%) | 6016 | 0.015 | 0.012 | 0.001 | 0.088 |
| Moderator variables | ||||||
| Public services | Calculated by the entropy weight method based on the indicator system | 6016 | 0.0530 | 0.0380 | 0.00200 | 0.219 |
| Individual-level variables | ||||||
| Age | Continuous variables: Subtract the year of birth from the statistical year | 6016 | 39.70 | 12.75 | 16 | 66 |
| Gender | Dummy variable: Male = 1 (base); Female = 0 | 6016 | 0.554 | 0.497 | 0 | 1 |
| Marriage | Dummy variable: Married = 1 (base); Single = 0 | 6016 | 0.826 | 0.379 | 0 | 1 |
| Education | Categorical variables: No schooling/primary school/private tutoring/junior high school = 1; General high school/vocational high school/technical school/secondary technical school = 2; Junior college/undergraduate/master’s degree/doctorate = 3 | 6016 | 1.479 | 0.730 | 1 | 3 |
| Annual household income | Categorical variables: 0–25,000 = 1; 25,000–50,000 = 2; 50,000–100,000 = 3; 100,000–200,000 = 4; 200,000 and above = 5 (yuan) | 6016 | 2.128 | 1.085 | 1 | 5 |
| Hukou status | Dummy variable: Agricultural household registration = 1 (base); Non-agricultural household registration = 0 | 6016 | 0.820 | 0.384 | 0 | 1 |
| Housing provident fund | Dummy variable: Having housing provident fund = 1 (base); Without housing provident fund = 0 | 6016 | 0.099 | 0.299 | 0 | 1 |
| Self-rated health | Continuous variables: Excellent health = 5; Good health = 4; Fair health = 3; Relatively poor health = 2; Very poor health = 1 | 6016 | 3.766 | 0.952 | 1 | 5 |
| Subjective social status | Continuous variables: The highest score of “10” represents the top-most level; the lowest score of “1” represents the bottom-most level | 6016 | 4.303 | 1.784 | 1 | 10 |
| Homeownership | Dummy variable: Having homeownership = 1(base); Without homeownership = 0 | 6016 | 0.730 | 0.444 | 0 | 1 |
| City-level variables | ||||||
| Provincial capital city | Dummy variable: Being a provincial capital city = 1 (base); Not being a provincial capital city = 0 | 6016 | 0.130 | 0.337 | 0 | 1 |
| City tiers classification | Categorical variables: Fifth-tier cities = 1; Fourth-tier cities = 2; Third-tier cities = 3; Second-tier cities = 4; First-tier cities = 5; New first-tier cities = 6 | 6016 | 2.741 | 1.381 | 1 | 6 |
| Ratio of the output value in the second industry | Continuous variables: The proportion of the added value of the secondary industry in GDP (%) | 6016 | 48.87 | 9.707 | 24.27 | 73.19 |
| Ratio of the output value in the third industry | Continuous variables: The proportion of the added value of the tertiary industry in GDP (%) | 6016 | 41.24 | 8.912 | 16.79 | 72.13 |
| Per capita GDP | Continuous variables: The logarithm of per capita regional GDP (yuan) | 6016 | 10.89 | 0.503 | 9.770 | 11.89 |
| Registered population | Continuous variables: The logarithm of the registered population (in ten thousand people) | 6016 | 5.818 | 0.763 | 3.045 | 7.099 |
| Wages of active employees | Continuous variables: The logarithm of the total wages bill of active employees (in ten thousand yuan) | 6016 | 14.63 | 0.974 | 12.64 | 16.95 |
| Year | Statistical year | 6016 | 2015 | 1.790 | 2012 | 2018 |
References
- Carling, J.; Pettersen, S.V. Return Migration Intentions in the Integration–Transnationalism Matrix. Int. Migr. 2014, 52, 13–30. [Google Scholar] [CrossRef]
- Liu, Z.; Gu, H. Evolution Characteristics of Spatial Concentration Patterns of Interprovincial Population Migration in China from 1985 to 2015. Appl. Spat. Anal. 2020, 13, 375–391. [Google Scholar] [CrossRef]
- National Bureau of Statistics of China. Statistical Communiqué of the People’s Republic of China on the 2019 National Economic and Social Development. 2020. Available online: https://www.stats.gov.cn/english/PressRelease/202002/t20200228_1728917.html (accessed on 4 October 2024).
- Yu, L.; Li, Z.; Liu, D. Return-Migrant Urbanisation in Inland China: The Case of Hubei Province. Land 2024, 13, 190. [Google Scholar] [CrossRef]
- Gu, H.; Liu, Z.; Shen, T. Spatial pattern and determinants of migrant workers’ interprovincial hukou transfer intention in China: Evidence from a National M9igrant Population Dynamic Monitoring Survey in 2016. Popul. Space Place 2020, 26, e2250. [Google Scholar] [CrossRef]
- Duan, J.; Yin, J.; Xu, Y.; Wu, D. Should I stay or should I go? Job demands’ push and entrepreneurial resources’ pull in Chinese migrant workers’ return-home entrepreneurial intention. Entrep. Reg. Dev. 2020, 32, 429–448. [Google Scholar] [CrossRef]
- Hao, L. Impact of Relaxing the Hukou Constraints on Return Migration Intentions: Evidence from China. Popul. Res. Policy Rev. 2022, 41, 583–607. [Google Scholar] [CrossRef]
- Yin, J.; Huang, X.; Li, J.; Jin, L.; Chen, L. Reurbanisation in My Hometown? Effect of Return Migration on Migrants’ Urban Settlement Intention. Popul. Space Place 2021, 27, e2397. [Google Scholar] [CrossRef]
- Tang, S.; Hao, P. The Return Intentions of China’s Rural Migrants: A Study of Nanjing and Suzhou. J. Urban Aff. 2019, 41, 354–371. [Google Scholar] [CrossRef]
- Hare, D. ‘Push’ versus ‘pull’ factors in migration outflows and returns: Determinants of migration status and spell duration among China’s rural population. J. Dev. Stud. 1999, 35, 45–72. [Google Scholar] [CrossRef]
- Liu, R.; Li, T.; Greene, R. Migration and inequality in rental housing: Affordability stress in the Chinese cities. Appl. Geogr. 2020, 115, 102138. [Google Scholar] [CrossRef]
- Zhou, J.; Chi-Man Hui, E. Housing Prices, Migration, and Self-Selection of Migrants in China. Habitat Int. 2022, 119, 102479. [Google Scholar] [CrossRef]
- Zang, B.; Lv, P.; Warren, C.M.J. Housing Prices, Rural–Urban Migrants’ Settlement Decisions and Their Regional Differences in China. Habitat Int. 2015, 50, 149–159. [Google Scholar] [CrossRef]
- Tiebout, C.M. A Pure Theory of Local Expenditures. J. Political Econ. 1956, 64, 416–424. [Google Scholar] [CrossRef]
- Gu, H.; Ling, Y.; Shen, T. Return or not return: Examining the determinants of return intentions among migrant workers in Chinese cities. Asian Popul. Stud. 2021, 17, 51–70. [Google Scholar] [CrossRef]
- Xie, S.; Chen, J. Beyond homeownership: Housing conditions, housing support and rural migrant urban settlement intentions in China. Cities 2018, 78, 76–86. [Google Scholar] [CrossRef]
- Liu, Z.; Wang, Y.; Chen, S. Does formal housing encourage settlement intention of rural migrants in Chinese cities? A structural equation model analysis. Urban Stud. 2017, 54, 1834–1850. [Google Scholar] [CrossRef]
- Andreasen, M.H.; Agergaard, J. Residential mobility and homeownership in Dar es Salaam. Popul. Dev. Rev. 2016, 42, 95–110. [Google Scholar] [CrossRef]
- Bown, N.R. Housing experiences of recent immigrants to Canada’s small cities: The case of North Bay, Ontario. J. Int. Migrat. Integrat. 2016, 18, 129. [Google Scholar]
- Lopez, S.A.; Teixeira, C. Settlement and housing experiences of recent Mexican immigrants in Vancouver suburbs. Geojournal 2022, 87, 377–402. [Google Scholar] [CrossRef]
- Michaelides, M. The effect of local ties, wages, and housing costs on migration decisions. J. Socio-Econ. 2011, 40, 132–140. [Google Scholar] [CrossRef]
- Bayoh, I.; Irwin, E.G.; Haab, T. Determinants of residential location choice: How important are local public goods in attracting homeowners to central city locations? J. Reg. Sci. 2006, 46, 97–120. [Google Scholar] [CrossRef]
- Gmelch, G. Return migration. Annu. Rev. Anthropol. 1980, 9, 135–159. [Google Scholar] [CrossRef] [PubMed]
- Lee, E.S. A theory of migration. Demography 1966, 3, 47–57. [Google Scholar] [CrossRef]
- Harris, J.R.; Todaro, M.P. Migration, unemployment and development: A two-sector analysis. Am. Econ. Rev. 1970, 60, 126–142. [Google Scholar]
- Borjas, G.J. Self-Selection and the Earnings of Immigrants; No. w2248; National Bureau of Economic Research of The United States of America: Cambridge, MA, USA, 1987. [Google Scholar]
- Kunuroglu, F.; Van De Vijver, F.; Yagmur, K. Return Migration. Online Read. Psychol. Cult. 2016, 8, 1. [Google Scholar] [CrossRef]
- Diehl, C.; Liebau, E. Turning back to Turkey–or turning the back on Germany? Z. Soziol. 2015, 44, 22–41. [Google Scholar] [CrossRef]
- Massey, D.S.; Arango, J.; Hugo, G.; Kouaouci, A.; Pellegrino, A.; Taylor, J.E. Theories of international migration: A review and appraisal. Popul. Dev. Rev. 1993, 19, 431–466. [Google Scholar] [CrossRef]
- Todaro, M.P. A model of labor migration and urban unemployment in less developed countries. Am. Econ. Rev. 1969, 59, 138–148. [Google Scholar]
- Becker, G.S. Human capital, A theoretical and empirical analysis with special reference to education. Rev. Écon. 1967, 18, 132–133. [Google Scholar]
- Stark, O.; Bloom, D.E. The new economics of labor migration. Am. Econ. Rev. 1985, 75, 173–178. [Google Scholar]
- de Haas, H.; Fokkema, T. The effects of integration and transnational ties on international return migration intentions. Demogr. Res. 2011, 25, 755–782. [Google Scholar] [CrossRef]
- Tezcan, T. Return Home? Determinants of Return Migration Intention amongst Turkish Immigrants in Germany. Geoforum 2019, 98, 189–201. [Google Scholar] [CrossRef]
- Yue, Z.; Li, S.; Feldman, M.W.; Du, H. Floating choices: A generational perspective on intentions of rural–urban migrants in China. Environ. Plan. A 2010, 42, 545–562. [Google Scholar] [CrossRef] [PubMed]
- Li, J.; Wu, M.; Zhao, C. High Housing Prices and Low Social Integration of China’s New Generation Migrants in Cities. J. Asian Econ. 2025, 97, 101873. [Google Scholar] [CrossRef]
- Zhao, Y. Causes and consequences of return migration: Recent evidence from China. J. Comp. Econ. 2002, 30, 376–394. [Google Scholar] [CrossRef]
- Erol, I.; Unal, U. Local house price effects of internal migration in queensland: Australia’s interstate migration capital. Aust. Econ. Rev. 2023, 56, 308–327. [Google Scholar] [CrossRef]
- Chan, K.W.; Buckingham, W. Is China abolishing the hukou system? China Q. 2008, 195, 582–606. [Google Scholar] [CrossRef]
- Afridi, F.; Li, S.X.; Ren, Y. Social identity and inequality: The impact of China’s hukou system. J. Public Econ. 2015, 123, 17–29. [Google Scholar] [CrossRef]
- Tiemoko, R. Migration, return and socio-economic change in West Africa: The role of family. Popul. Space Place 2004, 10, 155–174. [Google Scholar] [CrossRef]
- Liu, T.; Wang, J. Bringing city size in understanding the permanent settlement intention of rural–urban migrants in China. Popul. Space Place 2019, 26, e2295. [Google Scholar] [CrossRef]
- Gherghina, S.; Plopeanu, A.-P.; Necula, C.-V. The Impact of Socio-Cultural Integration on Return Intentions: Evidence from a Survey on Romanian Migrants. J. Immigr. Refug. Stud. 2020, 18, 515–528. [Google Scholar] [CrossRef]
- Xu, Y.; Wang, F. The health consequence of rising housing prices in China. J. Econ. Behav. Organ. 2022, 200, 114–137. [Google Scholar] [CrossRef]
- Roback, J. Wages, rents, and the quality of life. J. Political Econ. 1982, 90, 1257–1278. [Google Scholar] [CrossRef]
- Plantinga, A.J.; D’etang-Dessendre, C.; Hunt, G.L.; Piguet, V. Housing prices and inter-urban migration. Reg. Sci. Urban Econ. 2013, 43, 296–306. [Google Scholar] [CrossRef]
- Rabe, B.; Taylor, M.P. Differences in opportunities? Wage, employment and house-price effects on migration. Oxf. Bull. Econ. Stat. 2012, 74, 831–855. [Google Scholar] [CrossRef]
- Dohmen, T.J. Housing, mobility and unemployment. Reg. Sci. Urban Econ. 2005, 35, 305–325. [Google Scholar] [CrossRef]
- Chamon, M.D.; Prasad, E.S. Why are saving rates of urban households in China rising? Am. Econ. J. Macroecon. 2010, 2, 93–130. [Google Scholar] [CrossRef]
- Meng, L.; Xiao, X.; Zhou, Y. Housing boom and household migration decision: New evidence from China. J. Real Estate Financ. Econ. 2023, 67, 453–479. [Google Scholar] [CrossRef]
- Shen, C.; Wang, Y.; Zuo, J.; Rameezdeen, R. Leave or Stay? Antecedents of high-level talent migration in the Pearl River Delta Megalopolis of China: From a perspective of regional differentials in housing prices. Chin. Geogr. Sci. 2023, 33, 1068–1081. [Google Scholar] [CrossRef]
- Krivo, L.J. Immigrant characteristics and Hispanic-Anglo housing inequality. Demography 1995, 32, 599–615. [Google Scholar]
- Haas, H.D. Morocco’s migration experience: A transitional perspective. Int. Migrat. 2007, 45, 39–70. [Google Scholar] [CrossRef]
- Matallah, S. Public service delivery, corruption and inequality: Key factors driving migration from North Africa to the developed world. J. Soc. Econ. Dev. 2020, 22, 328–354. [Google Scholar] [CrossRef]
- Li, X.; Yin, K.; Ahmed, Z.; Ahmed, O.; Jobe, M.C.; Hiramoni, F.A. How urban public service affects the well being of migrant workers: An empirical analysis based on the theoretical perspective of social comparison theory. Int. J. Ment. Health Promot. 2022, 24, 347–359. [Google Scholar] [CrossRef]
- Foote, A. The effects of negative house price changes on migration: Evidence across US housing downturns. Reg. Sci. Urban Econ. 2016, 60, 292–299. [Google Scholar] [CrossRef]
- Costa, D.L.; Kahn, M.E. Power couples: Changes in the locational choice of the college educated, 1940–1990. Q. J. Econ. 2000, 115, 1287–1315. [Google Scholar]
- Diamond, R. The determinants and welfare implications of US workers’ diverging location choices by skill: 1980–2000. Am. Econ. Rev. 2016, 106, 479–524. [Google Scholar] [CrossRef]
- Ouyang, W.; Wang, B.; Tian, L.; Niu, X. Spatial deprivation of urban public services in migrant enclaves under the context of a rapidly urbanizing China: An evaluation based on suburban Shanghai. Cities 2017, 60, 436–445. [Google Scholar] [CrossRef]
- Saiz, A. The geographic determinants of housing supply. Q. J. Econ. 2010, 125, 1253–1296. [Google Scholar] [CrossRef]
- Howard, G. The migration accelerator: Labor mobility, housing, and demand. Am. Econ. J. Macroecon. 2020, 12, 147–179. [Google Scholar] [CrossRef]
- Mullan, K.; Grosjean, P.; Kontoleon, A. Land tenure arrangements and rural–urban migration in China. World Dev. 2011, 39, 123–133. [Google Scholar] [CrossRef]
- Zou, Z.; Yun, Y.; Sun, J. Entropy Method for Determination of Weight of Evaluating Indicators in Fuzzy Synthetic Evaluation for Water Quality Assessment. J. Environ. Sci. 2006, 18, 1020–1023. [Google Scholar] [CrossRef]
- Lu, H.; Kandilov, I.T. Does Mobile Internet Use Affect the Subjective Well-being of Older Chinese Adults? An Instrumental Variable Quantile Analysis. J. Happiness Stud. 2021, 22, 3137–3156. [Google Scholar] [CrossRef]
- Lin, S.; Wu, F.; Wang, Y.; Li, Z. Migrants’ Perceived Social Integration in Different Housing Tenures in Urban China. Geoforum 2023, 139, 103693. [Google Scholar] [CrossRef]
- Huang, X.; Chen, M. Understanding the Role of Housing in Rural Migrants’ Intention to Settle in Cities: Evidence from China. Habitat Int. 2022, 128, 102650. [Google Scholar] [CrossRef]
- Ren, Y.; Wang, X. Impact of Comparative Advantages in Origin and Destination Cities on Return Migrant Workers’ Entrepreneurship: An Induced Network Analysis. Cities 2025, 156, 105525. [Google Scholar] [CrossRef]

| Influencing Elements | Indicators | Weight |
|---|---|---|
| Healthcare resources | Hospitals per 10,000 inhabitants (unit) | 0.061 |
| Hospital beds per 10,000 population (bed) | 0.055 | |
| Doctors per 10,000 population (persons) | 0.065 | |
| Educational resources | Elementary school per 10,000 population (unit) | 0.064 |
| Elementary school teachers per 10,000 population (person) | 0.044 | |
| Secondary schools per 10,000 population (unit) | 0.038 | |
| Secondary school teachers per 10,000 population (person) | 0.042 | |
| Transportation resources | Road density of prefecture-level cities (km/km2) | 0.025 |
| Buses per 10,000 population (coach) | 0.130 | |
| Highway freight transport volume (10,000 tons) | 0.088 | |
| Urban environment | Greening coverage rate of built-up areas (%) | 0.010 |
| Comprehensive utilization rate of industrial solid waste (%) | 0.026 | |
| Centralized industrial wastewater treatment rate (%) | 0.017 | |
| Innocuous treatment rate of municipal solid waste (%) | 0.015 | |
| Green space area in municipal districts (hectares) | 0.153 | |
| Cultural resources | Total book collection of public libraries (thousand volumes) | 0.160 |
| Variables | N | Mean | S.D. | Min | Max |
|---|---|---|---|---|---|
| Dependent variables | |||||
| Return intentions | 6016 | 0.536 | 0.499 | 0 | 1 |
| Independent variables | |||||
| Housing prices | 6016 | 8.594 | 0.408 | 7.759 | 10.12 |
| Instrumental variables | |||||
| Land supply elasticity | 5988 | 0.0510 | 0.121 | 0 | 0.572 |
| Land supply elasticity × Public services | 5988 | 0.003 | 0.010 | 0.000 | 0.109 |
| Fiscal decentralization | 6016 | 0.015 | 0.012 | 0.001 | 0.088 |
| Moderator variables | |||||
| Public services | 6016 | 0.0530 | 0.0380 | 0.00200 | 0.219 |
| Individual-level variables | |||||
| Age | 6016 | 39.70 | 12.75 | 16 | 66 |
| Gender | 6016 | 0.554 | 0.497 | 0 | 1 |
| Marriage | 6016 | 0.826 | 0.379 | 0 | 1 |
| Education | 6016 | 1.479 | 0.730 | 1 | 3 |
| Annual household income | 6016 | 2.128 | 1.085 | 1 | 5 |
| Hukou status | 6016 | 0.820 | 0.384 | 0 | 1 |
| Housing provident fund | 6016 | 0.099 | 0.299 | 0 | 1 |
| Self-rated health | 6016 | 3.766 | 0.952 | 1 | 5 |
| Subjective social status | 6016 | 4.303 | 1.784 | 1 | 10 |
| Homeownership | 6016 | 0.730 | 0.444 | 0 | 1 |
| City-level variables | |||||
| Provincial capital city | 6016 | 0.130 | 0.337 | 0 | 1 |
| City tiers classification | 6016 | 2.741 | 1.381 | 1 | 6 |
| Ratio of the output value in the second industry | 6016 | 48.87 | 9.707 | 24.27 | 73.19 |
| Ratio of the output value in the third industry | 6016 | 41.24 | 8.912 | 16.79 | 72.13 |
| Per capita GDP | 6016 | 10.89 | 0.503 | 9.770 | 11.89 |
| Registered population | 6016 | 5.818 | 0.763 | 3.045 | 7.099 |
| Wages of active employees | 6016 | 14.63 | 0.974 | 12.64 | 16.95 |
| Year | 6016 | 2015 | 1.790 | 2012 | 2018 |
| Model 1 | Model 2 | |||
|---|---|---|---|---|
| Estimate | S.E. | Estimate | S.E. | |
| Housing prices | 0.196 ** | (0.091) | 0.400 *** | (0.115) |
| Public services | 39.64 *** | (13.37) | ||
| Housing prices × Public services | −4.342 *** | (1.541) | ||
| Individual-levelvariables | ||||
| Age | 0.012 *** | (0.001) | 0.0122 *** | (0.0017) |
| Gender (reference group: Female) | ||||
| Male | 0.127 *** | (0.036) | 0.126 *** | (0.036) |
| Education level (reference group: Junior high school and below) | ||||
| Senior high school and technical secondary school | −0.091 ** | (0.046) | −0.099 ** | (0.046) |
| Junior college and above | −0.421 *** | (0.067) | −0.421 *** | (0.067) |
| Marriage (reference group: Unmarried/divorced/widowed/cohabitation) | ||||
| Married | 0.417 *** | (0.056) | 0.411 *** | (0.056) |
| Hukou status (reference group: Non-agricultural hukou) | ||||
| Agricultural hukou | 1.051 *** | (0.059) | 1.052 *** | (0.059) |
| Annual household income (reference group: Annual household income (RMB 25,000 and below)) | ||||
| Annual household income (RMB 25,000–50,000) | −0.064 | (0.049) | −0.067 | (0.049) |
| Annual household income (RMB 50,000–100,000) | −0.042 | (0.051) | −0.045 | (0.051) |
| Annual household income (RMB 100,000–200,000) | −0.109 | (0.079) | −0.107 | (0.079) |
| Annual household income (RMB 200,000 and above) | −0.455 *** | (0.113) | −0.458 *** | (0.114) |
| Self-rated health | −0.062 *** | (0.020) | −0.062 *** | (0.020) |
| Subjective social status | −0.019 * | (0.010) | −0.020 * | (0.010) |
| Housing provident fund (reference group: None) | ||||
| Yes | −0.156 ** | (0.070) | −0.152 ** | (0.071) |
| Homeownership (reference group: None) | ||||
| Yes | 0.008 | (0.044) | 0.008 | (0.044) |
| City-level variables | ||||
| Provincial capital city (reference group: None) | ||||
| Yes | −0.175 ** | (0.068) | −0.149 ** | (0.071) |
| City tier classification (reference group: Tier-5 cities) | ||||
| Tier-4 cities | 0.128 ** | (0.063) | 0.110 * | (0.065) |
| Tier-3 cities | 0.087 | (0.073) | 0.0541 | (0.075) |
| Tier-2 cities | 0.306 ** | (0.123) | 0.255 ** | (0.124) |
| Tier-1 cities | 0.984 *** | (0.257) | 1.384 *** | (0.363) |
| New tier-1 cities | 0.286 * | (0.158) | 0.267 | (0.169) |
| Ratio of the output value in the second industry | −0.003 | (0.004) | −0.004 | (0.004) |
| Ratio of the output value in the third industry | −0.012 ** | (0.005) | −0.014 *** | (0.005) |
| Per capita GDP | −0.010 | (0.078) | −0.061 | (0.079) |
| Registered population | −0.053 | (0.055) | −0.127 ** | (0.064) |
| Wages of active employees | 0.025 | (0.064) | 0.031 | (0.065) |
| Year (reference group: 2012) | ||||
| 2014 | 0.005 | (0.066) | 0.004 | (0.007) |
| 2016 | 0.010 | (0.078) | 0.107 | (0.078) |
| 2018 | 0.048 | (0.089) | 0.0699 | (0.090) |
| _cons | −1.391 | (0.911) | −3.159 *** | (1.158) |
| N | 6016 | 6016 | ||
| (1) First Stage | (2) First Stage | (3) Second Stage | |
|---|---|---|---|
| DV. = Housing Prices | DV. = Housing Prices × Public Services | DV. = Return Intention | |
| Land supply elasticity | 0.979 *** (0.036) | −0.023 *** (0.0027) | |
| Land supply elasticity × Public services | −3.163 *** (0.620) | 0.760 *** (0.047) | |
| Fiscal decentralization | 1.515 ** (0.793) | 0.846 *** (0.060) | |
| Housing prices | 0.980 *** (0.036) | 0.452 ** (0.229) | |
| Housing prices × Public services | −0.023 *** (0.0027) | −15.24 *** (5.114) | |
| Control | Yes | Yes | Yes |
| Constant | 5.242 *** (0.114) | −0.153 *** (0.009) | −5.524 *** (1.727) |
| N | 5982 | 5982 | 5982 |
| R-squared | 0.804 | 0.998 | |
| F-statistic | 334.62 | 88.42 | |
| Wald x2 | 6.16 ** (p = 0.046) |
| Variables | Married | Single | Agricultural Hukou | Non-Agricultural Hukou | Homeownership | Non-Homeownership |
|---|---|---|---|---|---|---|
| Model3 | ||||||
| Housing prices | 0.132 | 0.464 ** | 0.061 | 0.546 ** | 0.035 | 0.579 *** |
| (0.099) | (0.227) | (0.096) | (0.273) | (0.110) | (0.176) | |
| Control | Yes | Yes | Yes | Yes | Yes | Yes |
| FP test | 0.333 * | 0.485 ** | 0.544 *** | |||
| p-value | (p = 0.090) | (p = 0.028) | (p = 0.006) | |||
| Constant | −1.076 | −2.227 | −1.224 | 1.652 | −1.562 | −3.096 * |
| (0.999) | (2.366) | (0.990) | (2.837) | (1.069) | (1.846) | |
| Model4 | ||||||
| Housing prices | 0.314 ** | 0.872 *** | 0.293 ** | 0.613 * | 0.176 | 0.876 *** |
| (0.126) | (0.279) | (0.122) | (0.337) | (0.144) | (0.216) | |
| Housing prices × Public services | −3.665 ** | −11.071 *** | −4.963 *** | −1.657 | −2.632 | −8.080 *** |
| (1.707) | (4.304) | (1.642) | (5.156) | (1.890) | (0.300) | |
| Control | Yes | Yes | Yes | Yes | Yes | Yes |
| FP test | 0.558 * | 0.320 | 0.701 *** | |||
| p-value | (p = 0.062) | (p = 0.169) | (p = 0.008) | |||
| Constant | −2.560 ** | −6.578 ** | −3.146 *** | 1.143 | −2.707 * | −5.321 ** |
| (1.281) | (2.878) | (1.221) | (3.531) | (1.401) | (2.273) | |
| Variables | Entire Sample | Subsample from 2012 to 2014 |
|---|---|---|
| Housing prices | 0.196 ** | 0.246 ** |
| (0.0905) | (0.122) | |
| Controls | Yes | Yes |
| Constant | −1.391 | −1.791 |
| (0.911) | (1.131) | |
| N | 6016 | 3799 |
| Variables | Probit Model | Logit Model | ||
|---|---|---|---|---|
| Coef. | Marginal Effect | Coef. | Marginal Effect | |
| Housing prices | 0.196 ** | 0.065 ** | 0.311 ** | 0.062 ** |
| (0.0905) | (0.0299) | (0.152) | (0.0302) | |
Disclaimer/Publisher’s Note: The statements, opinions and data contained in all publications are solely those of the individual author(s) and contributor(s) and not of MDPI and/or the editor(s). MDPI and/or the editor(s) disclaim responsibility for any injury to people or property resulting from any ideas, methods, instructions or products referred to in the content. |
© 2025 by the authors. Licensee MDPI, Basel, Switzerland. This article is an open access article distributed under the terms and conditions of the Creative Commons Attribution (CC BY) license (https://creativecommons.org/licenses/by/4.0/).
Share and Cite
Liao, Y.; Song, J.; Zuo, W.; Luo, R.; Zhuang, X.; Wu, R. The Impact of Housing Prices on Chinese Migrants’ Return Intention: A Moderation Analysis of Public Services. Buildings 2025, 15, 1666. https://doi.org/10.3390/buildings15101666
Liao Y, Song J, Zuo W, Luo R, Zhuang X, Wu R. The Impact of Housing Prices on Chinese Migrants’ Return Intention: A Moderation Analysis of Public Services. Buildings. 2025; 15(10):1666. https://doi.org/10.3390/buildings15101666
Chicago/Turabian StyleLiao, Yuxin, Jinhui Song, Wen Zuo, Rui Luo, Xuefang Zhuang, and Rong Wu. 2025. "The Impact of Housing Prices on Chinese Migrants’ Return Intention: A Moderation Analysis of Public Services" Buildings 15, no. 10: 1666. https://doi.org/10.3390/buildings15101666
APA StyleLiao, Y., Song, J., Zuo, W., Luo, R., Zhuang, X., & Wu, R. (2025). The Impact of Housing Prices on Chinese Migrants’ Return Intention: A Moderation Analysis of Public Services. Buildings, 15(10), 1666. https://doi.org/10.3390/buildings15101666