Abstract
This study argues that medical data should be better utilized and attention should be paid to the patient’s visual experience during their journey to the emergency department (ED). Wayfinding in medical settings remains a challenge for patients. One reason is that decision makers do not adequately understand what the patients have seen and been through during their journey in the ED built environment, which leads to inaccurate selection and misplacement of signage. This study claims that there is still room to optimize existing wayfinding design methods. This study selected a representative large-scale general hospital in China, collected the annual healthcare information system (HIS) data of ED patients in 2021, and reproduced the clinical process of ED patients in the form of a probability treemap through categorical analysis. Furthermore, Massmotion was used to simulate the patient’s journey and obtain their vision focus area (VFA). With the VFA and field observation record, the research targeted 17 wall surfaces in the ED built environment. On the basis of the comparative analysis, we found the misplacement of the current signage system and the direction of future optimization. This method can provide a reference for designers during their decision-making process to aim for an efficient wayfinding system.
1. Introduction
With the increasing development of medicine, the disease types and treatment methods are becoming more and more detailed, and the space of medical buildings is becoming increasingly complex [1]. Various factors increase the difficulty of wayfinding tasks for patients. While COVID-19 still exists, wayfinding difficulties may lead to a disorderly patient flow, increasing the risk of cross-infection in the hospital space [2]. Wayfinding may be considered an annoying step, and a maze of corridors may increase the emotional intensity of the patient or even lead to headaches, elevated blood pressure, and fatigue [3]. Therefore, it is necessary to construct a user-centered wayfinding system of medical spaces for patients and visitors [4,5].
Ensuring the successful wayfinding experience of users of ED built environments should be the fundamental goal of both users and designers. The ideal wayfinding system for hospital stakeholders can alleviate the triage pressure and reduce the hidden cost of management [6]. Therefore, wayfinding is an essential aspect of healthcare facility design and becomes one of the critical parameters affecting spatial quality [7]. However, it is common for designers to only consider such factors after the building is completed [8]. Hospital buildings usually change and develop with time, decreasing the users’ level of familiarity with the space [3], with the patient clinical process remaining the same. Rismanchian’s work [9] proved that healthcare information system (HIS) data analysis can reproduce the patient’s journey in ED space through data mining. Understanding a patient’s journey in ED space is knowing where they need to go, how to go, and what they see in the traffic space.
This study attempted to reproduce the patients’ journey in a nighttime ED on the basis of medical data analysis. Moreover, a 3D simulation was performed using Massmotion to obtain patients’ vision focus area (VFA) during their journey to the ED, which provides a reference for optimization. Lastly, the optimized direction was developed by comparing the analysis results with the current signage system.
1.1. Literature Review
1.1.1. Wayfinding and Visual Experience
In the 1960s, the term “wayfinding” was proposed for the first time in Kevin Lynch’s book [10]. Lynch used “wayfinding” to explain the cognition and ability to analyze the urban environment. Downs and Stea [11] pointed out that wayfinding behavior is a process where people use ways to understand the external environment and make path choices accordingly. Evans et al. [12] defined wayfinding behavior as “cognitive and response behavior to a complex spatial environment and a guiding identification system”. Research on wayfinding systems in healthcare began with works of Carpman et al. [3]. They pointed out that the location and visibility of wayfinding guidance elements are themes of constant attention. Potter [13] pointed out that if the conditions such as visual access between key locations, architectural differentiation, and layout complexity are fixed, it is essential to learn about patients’ visual experiences during their wayfinding activities to improve the existing wayfinding system. When one tries to understand the spatial environment, one uses its significant environmental cues as a reference [14]. The research of many scholars has focused on the correlation between vision and wayfinding behavior. Chen [1] suggested that, when a person receives various stimuli based on environmental information, including visual identification of the complex structure of the spatial environment and the graphics of guiding sign systems, their decision-making process interacts at a psychological level. Complex buildings need to be incorporated into effective mechanisms to assist wayfinding and general circulation [15]. Patid et al. [16] suggested that certain elements can provide a clue to wayfinding. However, how clues are searched, selected, and used remains unknown [17]. Environmental cues such as landmarks, signs, colors, and furniture are generally believed to influence people’s wayfinding behavior in complex built environments [18]. Triandriani [17] pointed out that cue searching is the primary activity during wayfinding for people unfamiliar with their surroundings and mainly depends on their visual senses. That is why visual ergonomics is significant in spatial design. As Gibson [19] suggested, visual perception acts as a guide to move from one place to another to reach its destination, which involves identification visibility discussions. Filippidis et al. [15] noted the need to ensure clear visibility of the signage system, which improves wayfinding and access to destination information in public spaces. They first introduced the visual catchment area (VCA) concept [20]. Xie et al. [21] studied the relationship between the maximum observed distance and the observed angle according to the VCA concept. Wayfinding behavior is constantly receiving and processing information. The visual acceptance of the information is the premise for all psychological levels to interact and make decisions. From the visual perspective of the user, we can study the effectiveness of the signage system.
1.1.2. HIS Data and Patient Journey
Given the limitation of a lack of data, the study of patient flow is a persistent and refractory problem in most surveys. However, HIS data in most hospitals may offer a possibility to fix this problem [13]. HIS was first built in the 1960s [22]. Applications of HIS in China began to develop in the early 1980s and now basically exist in every hospital, carrying the responsibility of recording information daily [23]. The HIS in each hospital has accumulated huge quantities of data. These big data come from a byproduct of medical activities and can help us better understand diseases, service quality, and mobility characteristics of patients, provide better medical services, and reduce costs [24]. Unlike standard processes in business and industrial settings, clinical processes are highly dynamic, up-and-down connectivity-sensitive, event-driven, and knowledge-intensive [25]. The generality of HIS data can provide us with advantages in clarifying the clinical procedure of ED patients [26]. The past studies have proven that we can build the patient clinical procedures by understanding the workflow, departments of execution, time nodes of medical activities, and other information hidden in HIS data. The question is how to spatialize each procedure node and connect the patient’s journey in ED environments and their wayfinding experience.
Understanding the patient journey in a healthcare-built environment can help stakeholders better understand how patients interact with the hospital or healthcare system during medical procedures. Healthcare facility users always have a straightforward process and purpose [27]. Borgianni [28] claimed that a pathway is made up of flows of people, procedure flows, and sequences of spaces. In order to reproduce a patient’s journey, it is vital to determine the visit process of the patient and the order of their destination [29]. The typical research method for representing the patients’ journey is the path tracking method, also known as the spatial annotation method. This method explicitly streamlines different medical activities and records locations of various wayfinding behaviors during the treatment process. Studies with the same methods usually collect data from field observations and verbal descriptions of participants [6,16,17,18,20,29,30,31,32]. The number of samples is limited, making it challenging to reflect the actual status of the patient journey [33]. The challenge of using such data is that it is difficult to understand the detailed movement experience of patients, and the data collecting procedure is time-consuming [17]. Blascovich [34] also pointed out that the hospital environment is highly complex, and the cognitive map and questionnaire method may not be sufficient to assess wayfinding performance. The massive volume of medical data may provide an opportunity to solve this problem. Using clinical records in the HIS, one can objectively prioritize the patient visit destination [29]. Rismanchian [9] used emergency log data to reproduce the patient visit process and built a multi-objective model to optimize the ED’s spatial layout. Nazarian [35] focused on how the ward nurses flow. His research aimed to reduce the walking distance of nurses by optimizing the ward layout to improve work efficiency. Patient activity within the healthcare built environment is highly procedural. The patients’ journey representation based on the HIS data may result in more objective results than manual observation. Signage acts as a visual stimulus during patients’ movement in the ED. The interaction between moving behavior and obtaining wayfinding information is the only way to achieve a successful and efficient wayfinding experience. Therefore, representing patient journeys by developing a greater understanding of patients’ moving patterns allows us to create and build more efficient signage systems.
1.1.3. Signage Positioning in Healthcare Built Environment
Carpman [3] noted that signage naming, layout density, location, and visibility are essential in the wayfinding system. Moreover, Potter summarized the work of various scholars and the corresponding methodologies, in which he pointed out that there are four main contributing factors related to wayfinding different practices: (a) spatial structure, (b) technology, (c) signage, and (d) symbols [13]. However, the dense wayfinding information in the healthcare space makes the environment chaotic, and the hospital becomes an easily disoriented building [1,3]. Research on hospital wayfinding systems should focus on where some behaviors occur and explore what information should be provided at those specific locations [1,17]. When designing an efficient and safe wayfinding system, a key challenge is to place signs in the “best” location [33]. Manually positioning signage is tedious and time-consuming, especially for spaces with multiple hallways and intersections such as healthcare facilities. Dubey [33] proposed a multi-criteria optimization design tool to improve the signage layouts in complex buildings. Carpman [3] indicated that the empirical approach is to identify their placement at decision points. Chen [1] used spatial syntax to analyze a large-scale hospital’s outpatient area and optimize signage position according to isovist visibility analysis. From the ergonomics angle, Basri [36,37] tried to find the easy reading height to ensure that the signage meets the directional purpose by studying people’s preferences toward the present signage. Greenroyd [38] used an algorithm to analyze the ideal path of pedestrian flow in the building and combined the decision point location to provide stakeholders with signage system layout strategies. However, the connection between the positioning of wayfinding signage and patients’ visual experience during their clinical journey has not been investigated in depth so far.
1.1.4. Simulation by Massmotion
There are many models built for pedestrian flow simulation. The social force model can better describe the interaction between pedestrians while considering psychological and physical forces between them [39]. Massmotion is a simulation software for crowd analysis and pedestrian simulation. It has been used in transportation buildings, commercial complexes, healthcare spaces, and urban planning [40]. Massmotion was originally designed to allow planners, architects, and engineers to test their design from people’s perspectives before the project is entirely constructed [41]. Its goals include optimizing the efficiency of space utilization and observing the interaction process between pedestrians and the built environment by simulating people in different situations. Morrow [41] collected traffic information from Toronto Union Station. Through simulation, he found that the path selection of commuters had a certain degree of randomness, and this study provided a reference for increasing vehicle shifts and optimizing the station layout in the future. The same logic was applied to Shalaby’s [42] study, and she found that changing the train arrival mode improved the congestion and increased the commuting efficiency. Riversa’s study [43] targeted evacuation entrances and exits in tower buildings, arguing that the Massmotion-based simulation models could test evacuation scenarios and develop practical improvements. Danielle Robyn Aucoin [44] used Massmotion to simulate the user evacuation behavior when a fire occurred in a gymnasium and proposed the corresponding exit design suggestions according to the simulation results. Ma [40] used Massmotion to analyze what pedestrians paid attention to in an international airport terminal and assessed the vitality of commercial space through the Vision Time Maps module. Instead of using observation data in the study of the airport terminal, the simulation in this research is driven by medical data, which provides relevant parameters for Massmotion to visualize patients’ journeys in the ED built environment and obtain their VFA as reference for optimization of signage positioning.
2. Research Vision
The first step was to extract medical data from the HIS of different apartments (including admission, laboratory, and medical technology). Field data (including field observation records such as photos and interview records) were integrated into datasets. Secondly, this study represented the patients’ clinical processes through the HIS data using categorical analysis. Synchronously, a 3D model was constructed and imported into the Massmotion. In the third step, the patient flow was simulated by Massmotion, identifying the patients’ VFA during their journey in ED. Lastly, a comparative analysis between the simulation result and the field record data was constructed to develop references for the optimization (Figure 1).
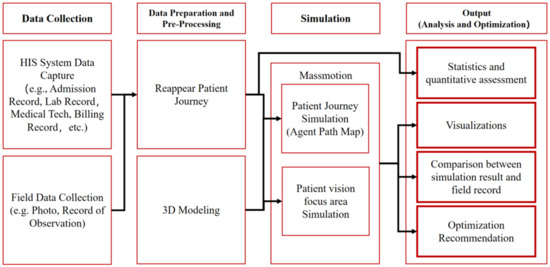
Figure 1.
Research vision.
3. Methodology
3.1. Research Field
This study took the ED built environment of a large-scale general hospital—Hospital A in Guangzhou, China, as a research subject. This study defined nighttime as 5:30 p.m.–7:30 a.m. The spatial characteristics of the study scope are described below (Figure 2).
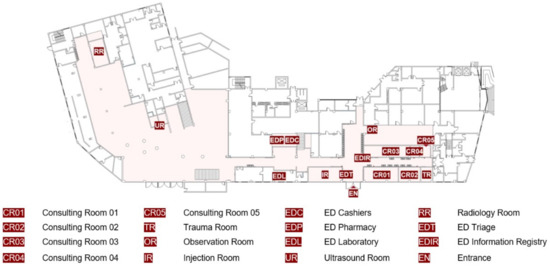
Figure 2.
First-floor plan of hospital A.
The main entrance of ED, which also functions as an ambulance entrance, is accessed via a one-way double lane municipal road. The main spatial structure is centered on the entrance reception hall; the ED hall functions as a triage area, waiting space, and a place for essential examination. After entering the hall, the consulting rooms are on the right, including the departments of ED medicine, ED surgery, ED pediatrics, ED obstetrics, and ED gynecology, as well as the trauma treatment room. The laboratory, pharmacy, cashier, first aid room, and most medical tech action places are located on the ED hall’s left. Because the ultrasound examination is located on the fifth floor of the outpatient building, the field research record showed that the only way to reach the ultrasound room (UR) during a nighttime emergency was by elevator after on-site observation. This study focused on the first floor of ED; thus, the UR location node was set in the elevator entrance on the first floor. Each location node is described on the ED plan in Figure 2.
3.2. Data Resource
This study extracted the annual data for 2021 from the HIS of the ED, including 486,753 datasets of admission, medical technology, laboratory, and billing (127,726 admission data, 167,218 medical tech data, 90,284 laboratory data, and 101,525 billing data). In order to be more objective and reliable, as well as eliminate the interference of daytime outpatient flow, the research scope was limited to patients with nighttime emergencies (5:30 p.m.–7:30 a.m.), which contained 56,629 admission data, 69,154 medical tech data, 36,541 laboratory data, and 90,782 billing data, amounting to 265,633. As shown in Table 1, information such as patient ID, name of ED department, admission time, medical tech execution time, and location are included according to the research scope.

Table 1.
List of extracted data.
3.3. Data Processing
The sensitive information was removed from the dataset to ensure patient anonymity. This study focused on the wayfinding behavior of pedestrians in the ED built environment. Therefore, information sets of 719 patients entering the ED by ambulance were excluded to reduce the interference items. The final data involved 55,910 patient samples, accounting for 98.73% of the total sample size.
Figure 3 shows the clinical process, determined through field observation and interviews with ED staff. This study used categorical analysis to decompose medical service executive departments’ datasets and reorganize them into multiple streams of location nodes with corresponding probability, which could describe the patient’s journey in the form of a probability tree. To begin, the field observation showed that patient flow diverted at several location nodes, which could be used to perform three layers of categorization. After the information registry in EDIR, the patient flow started to split into different consulting rooms according to the triage category results. Figure 3 shows that the first categorizing node was located in the consulting room. With the probability calculated during the data analysis process, the first layer of categorization was translated into a form of probability tree with service execution location nodes (Figure 4).
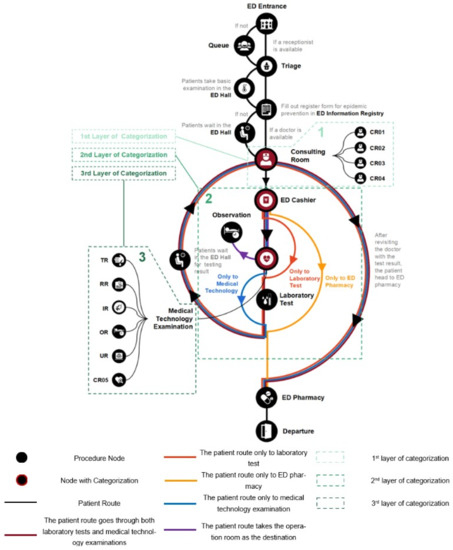
Figure 3.
ED patient journey with corresponding nodes.
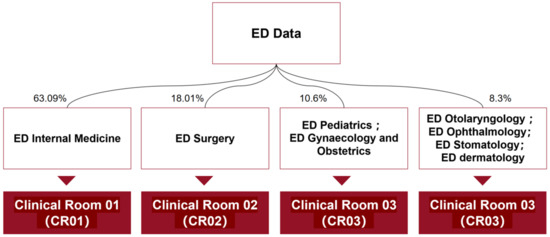
Figure 4.
The first layer of categorization.
The field record and clinical procedure showed that the next distributary of patient flow happened at the second categorizing node—the ED cashier. Their direction depended on whether they needed to take laboratory tests or medical technology examinations. A second categorization based on whether the patient passed through the medical technology or laboratory testing departments was constructed (Figure 5).
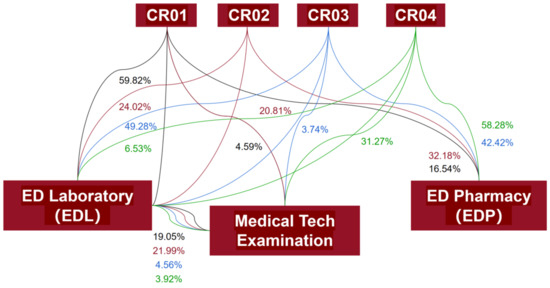
Figure 5.
The second layer of categorization.
The third categorizing node was located at the medical technology examination, which contained items executed at multiple locations, including the trauma treatment room (TR), radiology room (RR), ED injection room (IR), ultrasound room (UR), and consulting room 05 (CR05). The patient flow was also split into two directions toward the observation room (OR) and ED pharmacy. With less than a 1% sample size, the study removed data from the first-aid room and gastroscopy center. The doctor in the consulting room decided whether patients should undergo medical examinations and what kind of examination they should take. The third layer of categorization was performed as the connections between consulting rooms and different location nodes. The probability treemap of the third layer of categorization is illustrated in Figure 6.
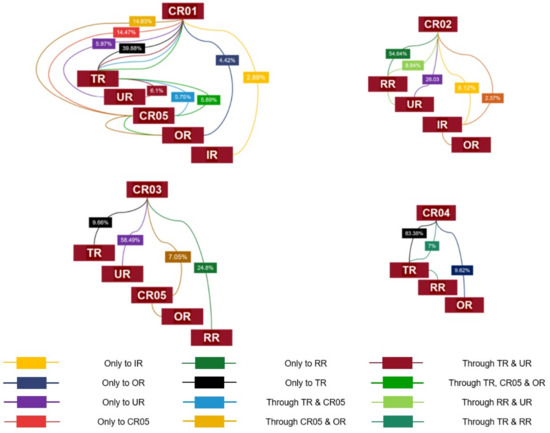
Figure 6.
The third layer of categorization.
The three layers of categorization represent the patient’s clinical process and the corresponding location nodes. Simultaneously, the patient journey in the ED built environment is illustrated in the form of a probability tree in Figure 4, Figure 5 and Figure 6. The categorical data analyses in this section provide the data basis for the next step—simulation analysis.
3.4. Patient Journey Simulation
3.4.1. Simulation Modeling
In this study, the 3D model was established using Sketch Up and imported into Massmotion. The model of the simulated area (ED traffic area) and the location nodes are shown in Figure 7.
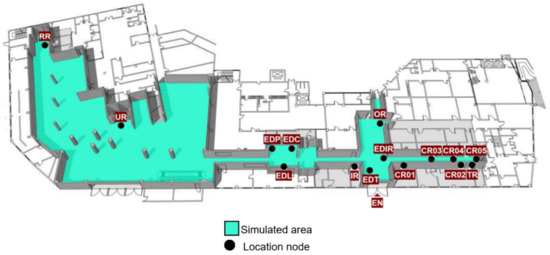
Figure 7.
The 3D model of the Hospital A ED built environment.
There were four forms of signage in the ED built environment: up-hanging (UH), wall-mounted (WM), protruding (PD), and floor graphic (FG). This study located all the signage in the ED space through field research. In order to compare simulation results with field situations in the subsequent study, we modeled and color-coded the four forms of signage. Objects unrelated to wayfinding but occupying the wall area, such as furniture, electronic screens, medical equipment, and fire-fighting equipment, were colored gray in the model (Figure 8).
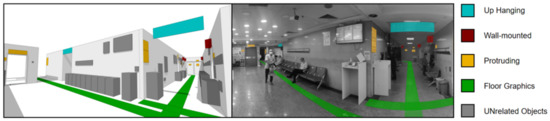
Figure 8.
The 3D model of ED interior.
3.4.2. Assumptions
The following assumptions were made for analysis: (1) the patient wayfinding process is ideal, meaning there is no return to the triage desk for direction guidance during their journey; (2) this study focused only on patient wayfinding behavior in the traffic space, and the patient’s time spent in each location node was not in the research scope; (3) except for the patients whose destination was the OR, this research assumed that all other patients needed to go to the EDP for billing before leaving; (4) it was assumed that the patient remained active in the traffic space, and that there was no stop and observe behavior during their journey.
3.4.3. Setting of Related Parameters
Patients’ journey in the ED built environment involves the flows of people, procedure flows, and sequences of spaces [28]. The flow of people could be obtained from the result of medical data categorization analysis. The procedure flows were constructed with the data from field observation and interviews with hospital staff. Different medical activities with corresponding nodes were identified to represent patients’ flow between different nodes in ED spaces. These three flows were imported as different parameters into Massmotion to visually represent the patients’ journey in the ED built environment.
This study selected the busiest day (1 November) of 2021 for simulation to maintain the objectivity and representativeness. The number of nighttime emergency visits was 226. Therefore, the total number of Massmotion simulation agents was 226, the arrival time was set to random intervals, and the simulation duration was 14 h (5:30 p.m.–7:30 a.m.).
In Alfonso’s visual reconstruction work [45], the preferred field of vision was 30° so that the actual situation of the observed object could be presented. This model followed this conclusion, setting the field of vision to 30°. The visual distance was 30 m, which Dubey [33] set in her study in 2020. This research arranged a 3 day field survey of Hospital A in early 2022. By tracking the 60 patients in the nighttime ED, we found that the patients were generally weak, with 89% of patients accompanied, and that companions were typically responsible for the wayfinding task. Combined with the field survey record, this study set the agent movement speed to 1.45–1.9 m/s. The field research record showed that the height of patients ranged from 1.52 m to 1.85 m, with a mean height of 1.73 m. According to Basri’s study [36], the stature height affects the standing eye level, and the difference between stature height and standing eye level is commonly between 9 and 14 cm. Therefore, this study set the eye height to 1.62 m in the simulation, within the normal range.
4. Results and Discussion
4.1. Patient Journey Simulation Results
As shown in Figure 9, the Massmotion time occupied map analysis showed that patients stayed in area A (ED hall), area B (waiting area outside CR01), and area C (area outside EDC window). Patient time-consuming areas in the ED space had prominent partitioning characteristics because the subsequent analysis of the patient’s VFA was based on the cumulative time agents spent viewing an object during their journey. Therefore, to ensure objectivity and comprehensiveness, this study divided the ED space into Q1 and Q2, two research regions (Figure 10), and simulated them with different time range settings (Table 2).
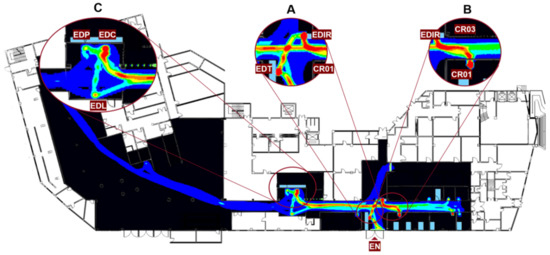
Figure 9.
Massmotion time occupied map analysis (Area A–C: three high patient time-consuming areas).
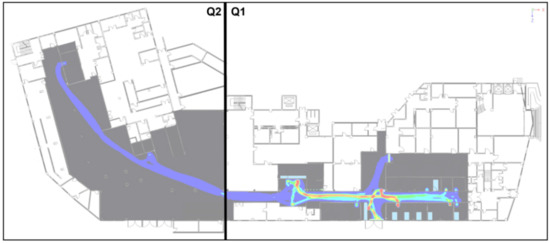
Figure 10.
Schematic diagram of the partition analysis (Q1,Q2) Two areas with different time range settings for simulation).
Table 2.
The time range setting corresponding to colors.
4.2. Simulation Result and Suggestions for Optimization
After setting the relevant parameters, the patients’ VFAs within the ED built environment are shown in Table 3 and Table 4.
Table 3.
Vision time map analysis in Q1.
Table 4.
Vision time map analysis in Q2.
According to the site observation records, simulation results, and interviews with hospital staff, this study identified 17 interior elevations (Figure 11) for comparison with the simulation results.
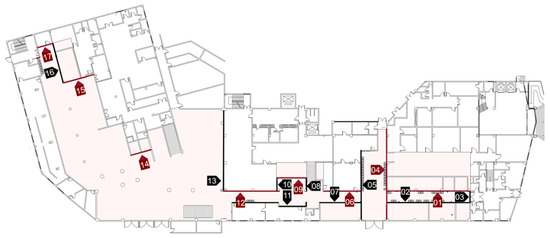
Figure 11.
ED floor plan with interior elevation mark (Interior elevation marks range from 01 to 17).
This study analyzed the current signage positioning and the patient’s VFA by overlapping the simulation results with the interior elevation. The results are shown in Table 5, Table 6, Table 7, Table 8, Table 9, Table 10, Table 11, Table 12, Table 13, Table 14, Table 15, Table 16, Table 17, Table 18, Table 19, Table 20 and Table 21. The VFA analysis is presented as heatmaps. However, different color gradients were formed because of different cumulative degrees of fixation time. In order to make the analysis more accurate and objective, this study divided each heatmap into high, medium, and low scales according to the color. To accurately describe the location of the various elements on the interior facade, reference grids were drawn with 500 mm as the unit.
Table 5.
01 Elevation comparative analysis.
Table 6.
02 Elevation comparative analysis.
Table 7.
03 Elevation comparative analysis.
Table 8.
04 Elevation comparative analysis.
Table 9.
05 Elevation comparative analysis.
Table 10.
06 Elevation comparative analysis.
Table 11.
07 Elevation comparative analysis.
Table 12.
08 Elevation comparative analysis.
Table 13.
09 Elevation comparative analysis.
Table 14.
10 Elevation comparative analysis.
Table 15.
11 Elevation comparative analysis.
Table 16.
12 Elevation comparative analysis.
Table 17.
13 Elevation comparative analysis.
Table 18.
14 Elevation comparative analysis.
Table 19.
15 Elevation comparative analysis.
Table 20.
16 Elevation comparative analysis.
Table 21.
17 Elevation comparative analysis.
There was no guidance signage on the wall surface described in Table 5, which is in an area with a high density of pedestrian flow. Designers may consider placing signage in the high VFA to provide guidance information for patients after consulting with doctors ((a) in Table 5). For visibility of signage, the identification signage in the c22 region should be moved to the medium VFA c19 region, and the wall-mounted signage in region b21 should be changed to the protruding form. The field observation record showed that there was still confusion about information gathering created by element layout problems such as excessive visual elements, which required systematic rearrangement ((b) and (c) in Table 5).
Considering that the elements on the wall surface analyzed in Table 6 are mainly medical equipment, and the signs of the 01 wall can meet the guiding demand of this area, there is no need to arrange other signage on this wall.
Table 7 shows that signage in this area indicates that both entrances are channels for hospital staff and have no patient access; therefore, there is no need to add additional signage.
According to the analysis in (a) in Table 8, the recommendation for optimization is fitting the guidance signage at a suitable height in region 16–17 and cooperating with the up-hanging signage to provide guidance to the OR and other programs on the hospital’s western side. The a30–d30 area is in a high VFA, and the suggestion is to add identification signage of EDIR to guide patients to register their personal information here.
The accumulation of patients’ eye fixation time on the wall surface formed by the patient flow from the consulting room to other location nodes shaped the high VFA in region 15–17 ((a) in Table 9). Therefore, the suggestion is to arrange guidance signage at an appropriate height in region 15–18 to provide guidance for patient flow heading to EDP, EDC, and location nodes in that direction.
The field observation record showed that there is still confusion about information gathering created by signage layout problems such as blur classification and font size ((b) in Table 10). The field research found that the electronic screen blocks the protruding signage of the first-aid room. According to the analysis in Table 10, the suggestion is to move the b17 region signage to the b14 region and integrate the original b13–c13 and d14 region signage into single identification signage introducing the first-aid room function and location. Since the electronic screen provides patients’ first aid information to their companions waiting in the ED hall waiting area, the recommendation is to change its location to the wall surface shown in Elevation 05 ((a) in Table 10) to solve the problem of blocking and confusion. At the same time, we recommend placing guidance signage at appropriate heights in 1–7 regions to guide the patients’ flow from consulting rooms to the medical technology location node. This can a specific guiding role for the people who need to go to EDC and EDP located in blind areas ((d) in Table 10).
According to the analysis in Table 11 and the patient flow characteristics observed during field observation, the suggestion is to arrange guidance signage guidance in the 6–13 regions with high VFA for patients who need to visit the location nodes of EDP, EDC, and EDL.
Table 12 (b) shows that EDP and EDC are in the blind spot of patient flow in the direction from Q1 to Q2. The suggestion is to set guidance signage about EDP and EDC at the appropriate height at 9–10 high VFA. Meanwhile, as region 1–3 is near the washroom entrance, correlative identification signage can be set at the appropriate height in region 3 ((a) in Table 12).
Table 13 (b) shows that all the signage is positioned on the windows of EDC and EDP. The suggestion is to move the EDC identification signage in region b10–12 down to region c10–12 to ensure its visibility to patients. Field research records showed that patients needed the EDC staff to guide them to the next location node after billing according to the on-site observation record. This situation reduces the efficiency of EDC on some level. The recommendation to solve this problem is to set a map of the ED floor plan on the EDC window to guide patients who need to go to the medical tech departments for examination. Moreover, this study proposes increasing the size of EDP identification signage equal to the signage of EDC to improve the visibility of EDP location in space.
The recommendation is to set guidance signage at the appropriate height in region 1 ((a) in Table 14) to guide patients heading to the Q2 location node after billing according to the field observation record.
Table 15 (a) shows that the EDL window occupies most of the wall surface, which contains too much guidance information about the clinical process that confuses patients. The recommendation is to rearrange the information to make the testing process guidance clearer. Moreover, the wall does not have any location-related signage. The up-hanging signage provides the location information of the EDL in the space, which is within the field of view. However, the EDL consists of two testing windows, and we suggest adding identification signage in region c10–11 and region c18–19 to help the patient find the required testing window. The size of signage can refer to the identification signage of the EDP window.
Field observation records showed that most patients passing through this area need to go to the UR and RR. On the basis of the analysis in Table 16, this study suggests setting the guidance signage with the direction of UR and RR at the appropriate height of the VFA in this area. Table 16 (b) shows a giant promotional poster in region 23–27; to arrange the guidance signage properly, the suggestion is to change the poster position.
Field observation records showed that most patients passing through this area are returning from UR and RR to Q1 departments, indicating that they are about to complete their ED journey. Therefore, on the basis of the analysis in Table 17, no additional wayfinding signage is needed.
On the basis of the analysis in Table 18, the suggestion is to arrange the guidance signage about the RR location node in the region 1–2 high VFA.
Table 19 (b) shows that the wall is located close to RR. The suggestion is to place guidance signage at the appropriate height of region 1–2 to guide patient flow heading to RR.
The field observation records showed no queue in the RR location node during the night, which explains why VFA did not exist in the simulation results ((a) in Table 20). Future studies can use eye-tracking technology or VCA concepts to determine the rationality of the current signage positioning.
As for VFA, the signage location on this wall surface is reasonable ((a) in Table 21). However, there is room for further optimization, such as the font size and color of the signage.
Table 22 (a) shows that the floor graphic signage system in Q1 was within the range of high VFA and medium VFA. Although the location is reasonable, there are still problems such as excessive color-coding and disharmony with the existing signage system. Table 22 (b) shows that the signage system as a special element in the ED hall cross-traffic area (A3 area) confuses users. This study proposes rearranging the floor graphic signage and redesigning the floor graphic signage system for a clear and coherent purpose. The direction of optimization can be determined in future studies on the basis of the requirements and expectations of hospital stakeholders.
Table 22.
Q1 floor graphic analysis.
The central space of Q2 is the outpatient hall, and the existing floor graphic signage is positioned for outpatients. Signs 4 and 5 near the entrance of the outpatient hall mainly provide the direction information to the ED ((d) in Table 23). Signs 2 and 3 are used to maintain order for the elevator queue ((c) in Table 23). Only sign 1 is used to guide patients to the RR ((b) in Table 23). Interviews with hospital stakeholders indicated that the lower amount of floor signage in Q2 was to keep the space clean and simple and reduce the interference of patients’ wayfinding journey. The suggestion is to arrange floor graphic signage in region A4, where the VFA is high, to guide patients to the RR location node.
Table 23.
Q2 floor graphic analysis.
Table 24 shows the signage system optimizing approaches for each wall surface. This study identified that 11 walls (01, 04–08, 10–12, 14–15) need to add signage for a better wayfinding experience, and the corresponding layout position is put forward. The signage locations on the four wall surfaces (1, 6, 9, 12) need to change their existing position. Information on three wall surfaces (1, 6, 11) has a confusing situation, which can be improved by reorganizing the layout of different elements. At the same time, the field observation record showed that the clarity of the signage system on four wall surfaces (1, 9, 11, 17) can be improved by changing the form of the signage and unifying the font size. Table 25 shows that most optimizing approaches for floor graphic signage occur in the Q1 area because the current situation has unclear guidance and chaotic identification. The optimization effect can be achieved by changing the layout of the ground signs and coherence in terms of color selection.
Table 24.
Approaches for optimizing signage system on wall surfaces.
Table 25.
Approaches for optimizing floor graphic signage.
As a simulation and optimization example, this research studied the vision focus area of patients during their clinical journey in the ED space. This method can yield targeted and practical suggestions to optimize the positioning or amount of signage, increase the efficiency of the wayfinding system, and smooth the patient’s wayfinding task.
5. Conclusions and Future Work
This study proposed a method to reproduce the patient journey through medical data and use the pedestrian flow simulation to identify the vision focus area of patients in the ED traffic space, analyze the rationality of the existing signage system, and finally propose the optimization according to the comparative analysis between the current situation and simulation results.
This method allows planners, architects, and hospital stakeholders to effectively utilize medical data. In this way, one can better understand the visual experience and wayfinding behavior of ED patients, which can be used to achieve an efficient layout of the signage system. The same logic can be easily applied to analyze information on other visual elements within the healthcare built environment, such as plants, advertisements, and evacuation signs.
Several challenges remain in this study. The present analysis only considered the positional factors, whereas the signage definition and properties were not considered in depth. Future studies could combine the relevant regulatory requirements to optimize the selection mechanism of signage. The simulations in this research assumed an equal field of vision for every agent, lacking consideration of people’s characteristics such as age, vision, and physical condition. Future studies could overcome this challenge with detailed population information. Lastly, the research scope was limited to the ED space on the first floor. Future studies should extend the research field to other floors or inpatient areas.
However, we achieved the purpose of this paper, yielding results which can help designers and hospital stakeholders to optimize the hospital wayfinding system and improve its operational efficiency. The results of this study can also be used for reference for future replanning or expansion.
Author Contributions
Conceptualization, W.G. and Y.H.; methodology, W.G. and Y.H.; software, W.G. and Y.H.; formal analysis, Y.H.; writing—original draft preparation, Y.H.; writing—review and editing, W.G. and Y.H.; supervision, W.G. All authors have read and agreed to the published version of the manuscript.
Funding
This research received no external funding.
Institutional Review Board Statement
Not applicable.
Informed Consent Statement
Not applicable.
Data Availability Statement
Not applicable.
Conflicts of Interest
The authors declare no conflict of interest.
References
- Chen, M.-S.; Ko, Y.-T.; Hsieh, W.-C. Exploring the Planning and Configuration of the Hospital Wayfinding System by Space Syntax: A Case Study of Cheng Ching Hospital, Chung Kang Branch in Taiwan. ISPRS Int. J. Geo-Inf. 2021, 10, 570. [Google Scholar] [CrossRef]
- Hao, X.; Lin, Z. Research and Design of Way finding System in Hospital. Contemp. Archit. 2021, 17, 42–47. [Google Scholar]
- Carpman, J.R.; Grant, M.A. Design That Cares: Planning Health Facilities for Patients and Visitors, 3rd ed.; Jossey-Bass: San Francisco, CA, USA, 2016; p. 469. ISBN 978-0-7879-8811-1. [Google Scholar]
- Water, T.; Wrapson, J.; Reay, S.; Ford, K. Making Space Work: Staff Socio-Spatial Practices in a Paediatric Outpatient Department. Health Place 2018, 50, 146–153. [Google Scholar] [CrossRef] [PubMed]
- Zijlstra, E.; Hagedoorn, M.; Krijnen, W.P.; van der Schans, C.P.; Mobach, M.P. Route Complexity and Simulated Physical Ageing Negatively Influence Wayfinding. Appl. Ergon. 2016, 56, 62–67. [Google Scholar] [CrossRef] [PubMed]
- Anagnostopoulos, G.G.; Deriaz, M.; Gaspoz, J.-M.; Konstantas, D.; Guessous, I. Navigational Needs and Requirements of Hospital Staff: Geneva University Hospitals Case Study. In Proceedings of the 2017 International Conference on Indoor Positioning and Indoor Navigation (IPIN), Sapporo, Japan, 18–21 September 2017; pp. 1–8. [Google Scholar]
- Samah, Z.A.; Ibrahim, N.; Amir, J.S. Translating Quality Care Factors to Quality Space: Design Criteria for Outpatient Facility. Procedia-Soc. Behav. Sci. 2013, 105, 265–272. [Google Scholar] [CrossRef]
- Devlin, A.S. Wayfinding in Healthcare Facilities: Contributions from Environmental Psychology. Behav. Sci. 2014, 4, 423–436. [Google Scholar] [CrossRef] [PubMed]
- Rismanchian, F.; Lee, Y.H. Process Mining-Based Method of Designing and Optimizing the Layouts of Emergency Departments in Hospitals. HERD Health Environ. Res. Des. J. 2017, 10, 105–120. [Google Scholar] [CrossRef]
- Lynch, K. The Image of the City; Publication of the Joint Center for Urban studies; 33. print.; M.I.T. Press: Cambridge, MA, USA, 2008; ISBN 978-0-262-12004-3. [Google Scholar]
- Downs, R.M.; Stea, D. Image and Environment: Cognitive Mapping and Spatial Behavior; Transaction Publishers: Piscataway, NJ, USA, 1973; ISBN 978-0-202-36672-2. [Google Scholar]
- Evans, G.W.; Fellows, J.; Zorn, M.; Doty, K. Cognitive Mapping and Architecture. J. Appl. Psychol. 1980, 65, 474–478. [Google Scholar] [CrossRef]
- Potter, J.S. Best Practices for Wayfinding in a Hospital Setting; University of Oregon: Eugene, OR, USA, 2017. [Google Scholar]
- Hölscher, C.; Meilinger, T.; Vrachliotis, G.; Brösamle, M.; Knauff, M. Up the down Staircase: Wayfinding Strategies in Multi-Level Buildings. J. Environ. Psychol. 2006, 26, 284–299. [Google Scholar] [CrossRef]
- Filippidis, L.; Galea, E.R.; Gwynne, S.; Lawrence, P. Representing the Influence of Signage on Evacuation Behavior within an Evacuation Model. J. Fire Prot. Eng. 2006, 16, 37–73. [Google Scholar] [CrossRef]
- Pati, D.; Harvey, T.E.; Willis, D.A.; Pati, S. Identifying Elements of the Health Care Environment That Contribute to Wayfinding. HERD 2015, 8, 44–67. [Google Scholar] [CrossRef]
- Mustikawati, T.; Yatmo, Y.A.; Atmodiwirjo, P. Reading the Visual Environment: Wayfinding in Healthcare Facilities. Environ. -Behav. Proc. J. 2017, 2, 169–175. [Google Scholar] [CrossRef]
- Jiang, S.; Allison, D.; Duchowski, A.T. Hospital Greenspaces and the Impacts on Wayfinding and Spatial Experience: An Explorative Experiment Through Immersive Virtual Environment (IVE) Techniques. HERD Health Environ. Res. Des. J. 2022, 15, 206–228. [Google Scholar] [CrossRef]
- Gibson, J.J. The Ecological Approach to Visual Perception; Psychology Press: New York, NY, USA, 2014; ISBN 978-1-315-74021-8. [Google Scholar]
- Motamedi, A.; Wang, Z.; Yabuki, N.; Fukuda, T.; Michikawa, T. Signage Visibility Analysis and Optimization System Using BIM-Enabled Virtual Reality (VR) Environments. Adv. Eng. Inform. 2017, 32, 248–262. [Google Scholar] [CrossRef]
- Xie, H.; Filippidis, L.; Galea, E.R.; Gwynne, S.; BlackShields, D.; Lawrence, P.J. Experimental Study and Theoretical Analysis of Signage Legibility Distances as a Function of Observation Angle. In Pedestrian and Evacuation Dynamics 2005; Waldau, N., Gattermann, P., Knoflacher, H., Schreckenberg, M., Eds.; Springer: Berlin/Heidelberg, Germany, 2007; pp. 131–143. [Google Scholar]
- Wang, X.S.; Guo, Q.; Li, S.S.; Cao, R.F. Design and Implementation of School Hospital Information Analysis and Mining System. Appl. Mech. Mater. 2014, 513–517, 498–501. [Google Scholar] [CrossRef]
- Shen, J. Data Analysis and Modeling based on Hospital Outpatient and Emergency Records. Master’s Thesis, Zhejiang University, Hangzhou, China, 2016. [Google Scholar]
- Bettencourt-Silva, J.H.; Clark, J.; Cooper, C.S.; Mills, R.; Rayward-Smith, V.J.; de la Iglesia, B. Building Data-Driven Pathways From Routinely Collected Hospital Data: A Case Study on Prostate Cancer. JMIR Med. Inform. 2015, 3, e4221. [Google Scholar] [CrossRef]
- Huang, Z.; Dong, W.; Bath, P.; Ji, L.; Duan, H. On Mining Latent Treatment Patterns from Electronic Medical Records. Data Min. Knowl. Disc. 2015, 29, 914–949. [Google Scholar] [CrossRef]
- Konrad, R.; Tulu, B.; Lawley, M. Monitoring Adherence to Evidence-Based Practices. Appl. Clin. Inform. 2013, 4, 126–143. [Google Scholar] [CrossRef]
- Zhang, W. Research on Public Space Design of Large General Hospital from the Perspective of Way Finding: Take Beijing Municipal Hospital as Example. Master’s Thesis, Beijing University of Civil Engineering and Architecture, Beijing, China, 2019. [Google Scholar]
- Setola, N.; Borgianni, S. Designing Public Spaces in Hospitals; Routledge: New York, NY, USA, 2016; ISBN 978-1-315-71884-2. [Google Scholar]
- Bubric, K.; Harvey, G.; Pitamber, T. A User-Centered Approach to Evaluating Wayfinding Systems in Healthcare. HERD Health Environ. Res. Des. J. 2021, 14, 19–30. [Google Scholar] [CrossRef]
- Ghamari, H.; Golshany, N. Wandering Eyes: Using Gaze-Tracking Method to Capture Eye Fixations in Unfamiliar Healthcare Environments. HERD Health Environ. Res. Des. J. 2022, 15, 115–130. [Google Scholar] [CrossRef]
- Tzeng, S.-Y.; Huang, J.-S. Spatial Forms and Signage in Wayfinding Decision Points for Hospital Outpatient Services. J. Asian Archit. Build. Eng. 2009, 8, 453–460. [Google Scholar] [CrossRef]
- Ghamari, H. Examining Eye Fixations during Wayfinding in Unfamiliar Environments. Ph.D Thesis, Texas Tech University, Lubbock, TX, USA, 2014. [Google Scholar]
- Dubey, R.K.; Khoo, W.P.; Morad, M.G.; Hölscher, C.; Kapadia, M. AUTOSIGN: A Multi-Criteria Optimization Approach to Computer Aided Design of Signage Layouts in Complex Buildings. Comput. Graph. 2020, 88, 13–23. [Google Scholar] [CrossRef]
- Blascovich, J.; Loomis, J.; Beall, A.C.; Swinth, K.R.; Hoyt, C.L.; Bailenson, J.N. Immersive Virtual Environment Technology as a Methodological Tool for Social Psychology. Psychol. Inq. 2002, 13, 103–124. [Google Scholar] [CrossRef]
- Nazarian, M.; Price, A.; Demian, P.; Malekzadeh, M. Design Lessons From the Analysis of Nurse Journeys in a Hospital Ward. HERD Health Environ. Res. Des. J. 2018, 11, 116–129. [Google Scholar] [CrossRef] [PubMed]
- Basri, A.Q.; Sulaiman, R. Ergonomics Study of Public Hospital Signage. AEF Adv. Eng. Forum 2013, 10, 263–271. [Google Scholar] [CrossRef]
- Basri @ Boseri, A.Q.; Sulaiman, R. Use of Eye Level Height to Determine Signage Height in Public Hospital. ALAM CIPTA Int. J. Sustain. Trop. Des. Res. Pract. 2017, 10, 31–45. [Google Scholar]
- Greenroyd, F.L.; Hayward, R.; Price, A.; Demian, P.; Sharma, S. A Tool for Signage Placement Recommendation in Hospitals Based on Wayfinding Metrics. Indoor Built Environ. 2017, 27, 925–937. [Google Scholar] [CrossRef]
- Xu, Y. Research on Multi-Directional Pedestrian Simulation in Hospital Outpatient Hall Based on Social Force Model. Master’s Thesis, Beijing University of Civil Engineering and Architecture, Beijing, China, 2020. [Google Scholar]
- Ma, Z.; Xiao, Y.; Chen, X. Research on Commercial Space Vitality of Airport Terminal Based on 3D Vision Field Simulation of Pedestrian Flows-Taking Guangzhou Baiyun International Airport Terminal 2 as a Study Case. In RE: Anthropocene, Design in the Age of Humans, Proceedings of the 25th CAADRIA Conference, Bangkok, Thailand, 5–6 August 2020; Holzer, D., Nakapan, W., Globa, A., Koh, I., Eds.; Chulalongkorn University: Bangkok, Thailand, 2020; Volume 1, pp. 589–598. [Google Scholar]
- Morrow, E. MassMotion: Simulating Human Behaviour to Inform Design for Optimal Performance. Arup J. 2010, 1, 38–41. [Google Scholar]
- King, D.; Srikukenthiran, S.; Shalaby, A. Using Simulation to Analyze Crowd Congestion and Mitigation at Canadian Subway Interchanges: Case of Bloor-Yonge Station, Toronto, Ontario. Transp. Res. Rec. 2014, 2417, 27–36. [Google Scholar] [CrossRef]
- Rivers, E.; Jaynes, C.; Kimball, A.; Morrow, E. Using Case Study Data to Validate 3D Agent-Based Pedestrian Simulation Tool for Building Egress Modeling. Transp. Res. Procedia 2014, 2, 123–131. [Google Scholar] [CrossRef][Green Version]
- Aucoin, D.R. The Use of Human Behaviour to Inform Egress Modeling in Stadiums. Master’s Thesis, York University, Toronto, ON, Canada, 2019. [Google Scholar]
- Torrejon, P.A.V.; Callaghan, P.; Hani, H. Panoramic Audio and Video: Towards an Immersive Learning Experience. In Proceedings of the 3rd European Immersive Education Summit, London, UK, 28–29 November 2013. [Google Scholar]


Publisher’s Note: MDPI stays neutral with regard to jurisdictional claims in published maps and institutional affiliations. |
© 2022 by the authors. Licensee MDPI, Basel, Switzerland. This article is an open access article distributed under the terms and conditions of the Creative Commons Attribution (CC BY) license (https://creativecommons.org/licenses/by/4.0/).