Article

Assessing Accessibility and Social Equity of Tertiary Hospitals for Older Adults: A City-Wide Study of Tianjin, China

1
College of Management and Economics, Tianjin University, 92 Weijin Road, Tianjin 300072, China
2
School of Mechanical Engineering, Tianjin University, 92 Weijin Road, Tianjin 300072, China
3
School of Economics and Business Administration, Chongqing University, 174 Shazhengjie, Chongqing 400044, China
*
Author to whom correspondence should be addressed.
Buildings 2022, 12(12), 2107; https://doi.org/10.3390/buildings12122107
Submission received: 21 October 2022 / Revised: 17 November 2022 / Accepted: 25 November 2022 / Published: 1 December 2022

Abstract

:
Building age-friendly cities with good accessibility and social equity can help improve older adults’ well-being and quality of life. However, current accessibility analysis of service facilities tends to target most general users, while few studies have been conducted regarding hospitals from an age-friendly perspective. This study aims to measure accessibility to tertiary hospitals and conduct its equity analysis for older adults aged 65 years or over. First, the gravity-based model and geographic information system are utilized to measure accessibility to tertiary hospitals within regions and across regions, and the overall accessibility of a region. Second, coefficient of variation and global Moran’s I are adopted to investigate differences in accessibility to tertiary hospitals by type among regions. Third, Lorenz curves and Gini coefficients are employed to analyze social equity of access to medical services for the elderly. Taking Tianjin, China as the case study, the results show that there exist spatial clusters in terms of accessibility to tertiary hospitals within districts, across districts, and of the whole district. Most districts in the city center have better access to these hospitals than the peripheral and suburban districts. The social equity of accessibility to tertiary hospitals is slightly better in the senior population than in the total population. This study can help the governments improve the spatial distribution and allocation of urban health care resources in a more equitable manner and promote the development of age-friendly cities in future.

1. Introduction

Population aging is one of the megatrends that the global population is currently experiencing in addition to population growth, population urbanization, and international migration, which will have a significant and lasting influence on sustainable development in the coming decades. As of 2019, the percentage of people aged 65 years or over worldwide rose to 9%, reaching 703 million; the senior population is expected to double to 1.5 billion by 2050, accounting for 16% of the total population [1]. Almost every country in the world is experiencing an increase in the number and percentage of old adults. Take China as an example. According to population development projections proposed by the Organization for Economic Cooperation and Development, China will become the country with the highest degree of population aging by 2030. China Development Report 2020: Development Trends and Policies of Population Aging also predicts that the years from 2035 to 2050 will be the peak period of population aging in China, with the senior population reaching 380 million by 2050, accounting for nearly 30% of the total population. Numerous data have shown that population aging of China is showing an accelerated development.
In general, differences in residents’ health status and quality of life are strongly related to the unbalanced distribution of health care resources [2]. In China, health care facilities often have some problems with health care delivery, such as long waiting lines and over-utilization of beds. How to receive better medical services is a commonly perceived social problem [3]. As people age, their body form, physiological function, and physical quality will gradually decline, and their mobility efficiency will be greatly reduced. Especially for older adults, it is significantly important to prevent diseases and seek timely medical treatment, which determines the importance of medical resources for this kind of group. The Chinese Ministry of Health has divided the health care system into three levels according to different tasks and functions, that is, primary medical institutions, secondary hospitals, and tertiary hospitals [4]. Primary medical institutions mainly provide basic medical services or primary care to all communities, while secondary and tertiary hospitals provide more comprehensive and complex medical services. By contrast, tertiary hospitals providing services across districts of a city are more robust in department setting and have stricter requirements for related personnel, followed by secondary hospitals and primary medical institutions [5]. As such, tertiary hospitals with the most advanced services capacity tend to be more authoritative and more trustworthy. In this case, patients prefer to queue up in tertiary hospitals instead of receiving health care services from the nearby lower-level medical institutions [3]. Furthermore, National Development and Reform Commission has issued an Implementation Plan for Establishing the Efficient and High-Quality Medical and Health Service System, which emphasized that older adults should be guaranteed to receive high-level medical services with good accessibility in China [6]. Some scholars have conducted a questionnaire survey among the elderly to analyze their selection rules for tertiary hospitals since this kind of hospital is significantly important to these participants [7]. Therefore, this paper will explore how older adults have the access to tertiary hospitals considering the diversity and complexity of diseases among the elderly, their special demand for health care facilities, and the comprehensiveness of medical services provided by tertiary hospitals, especially in the diagnosis and treatment of intractable diseases.
Accessibility can be used to describe the ease with which people can reach a destination from an origin using a specified transport mode [8] and is also widely adopted to evaluate resource allocation and service facility distribution at present [9]. Early studies regarding accessibility were conducted by means of field research and questionnaires, but with the help of GPS (global position system) and GIS (geographic information system), accessibility measurements have become more accurate [10]. Several research studies have explored the accessibility to different types of service facilities from the perspective of the elderly, such as health services [11], community-based services [12], public transport [13,14], parks [15], and housing [16], etc. In addition, there are many studies dedicated to the accessibility to various health care resources, such as primary health care [17], delivery care [18], tertiary hospitals [19], public and private hospitals [20], ICU beds [21], etc. It can be found that the existing studies targeting older adults primarily selected parks and public transport in terms of the accessibility analysis, while few studies have been conducted to investigate the access of the elderly to services provided by facilities such as hospitals, let alone tertiary hospitals. Furthermore, most of the studies regarding accessibility to medical resources focused on the general population, while lacking enough attention to some socially disadvantaged groups including the elderly.
In addition, health equity is an explicit goal of health care reform that countries worldwide endeavor to achieve [22]. To enhance social equity in the spatial distribution of health care resources, it is not only required that all residents have equal access to these services, but also some special groups such as older adults, who need this kind of service more, should be guaranteed easier access to these resources. Currently, there are some commonly used methods for the social equity analysis, including Lorenz curves [23], the Theil index [24], and the entropy method [25], etc. Lorenz curves were initially developed in the field of economics to present the cumulative distribution functions of wealth across a population [23]. In addition to income, this approach can also be used to any quantity that can be cumulated across a population [26]. Gini coefficients can reveal the degree of inequality mathematically. Some research has adopted these two methods to depict social equity in service accessibility of public transport [13], transport service supply and service effectiveness [26,27,28], and health resource allocation for the observed groups [22,29], such as the total and elderly populations. The Theil index can be used to analyze the inter-group and intra-group differences, but it is prone to errors in the process of performing decomposition. The entropy method as an objective approach can avoid the bias brought by human factors to the analysis results, but there may be a mismatch between the weight values and the real situation. Based on this, this study will select Lorenz curves and Gini coefficients to analyze the social equity of accessibility to tertiary hospitals from both graphical and mathematical perspectives.
In response to the status quo of population aging, the objectives of this study are: (a) to measure the accessibility to tertiary hospitals from three perspectives (i.e., within regions, across regions, and the overall region); (b) to analyze the differences of accessibility between all observed regions; and (c) to investigate the distribution of tertiary hospitals among the elderly population aged 65 years or over in consideration of social equity. This study can enrich the theoretical research into the accessibility of different groups to the same type of service facility, help improve the spatial distribution and allocation of urban health care resources in a more equitable manner, and promote the development of age-friendly cities in future.
The structure of the remainder of this paper is as follows. Section 2 introduces the methods used to achieve the above objectives. A case study of Tianjin, China is conducted using these methods in Section 3. Section 4 presents a discussion and some policy considerations are put forward. The final section summarizes the conclusion based on the findings of the research.

2. Methods

2.1. Measuring Accessibility to Tertiary Hospitals

For accessibility measurement, the cumulative opportunity measure and the gravity-based measure are two widely used methods. The former has some shortcomings including the equal treatment of all destinations and ignorance of travelers’ perception of time [30]. By contrast, the gravity-based model draws on Newton’s law of gravity, based on which the accessibility from an origin to a destination is directly proportional to cumulative opportunities and inversely proportional to the travel impedance (e.g., travel distance or travel time) based on the street networks between the two locations [31]. Since the gravity-based model can reflect the decay effect of accessibility with increasing travel impedance and the influence of destination attraction on accessibility, this study will adopt the gravity-based model to measure the accessibility to tertiary hospitals in a city. To be noted, the accessibility to tertiary hospitals defined in the present research is used to objectively reflect the ease with which the observed group could have the access to this kind of health care service within and (or) outside the district they live in, depending on the availability of tertiary hospitals in this region. As such, the choice preference for tertiary hospitals is not considered among older adults, especially when they are faced with multiple choices. Based on this, a city is divided into M districts (regions) and each district is composed of K neighborhoods. As for district m ( m { 1 , 2 , , M } ), the accessibility from each neighborhood to tertiary hospitals within this district can be measured as follows:
( A m _ i ) i n s i d e = 1 J 1 j O m _ j T m _ i , m _ j β
where ( A m _ i ) i n s i d e is the accessibility of neighborhood i in district m to all tertiary hospitals within this district; J 1 is the total number of tertiary hospitals in district m ; O m _ j is the service capacity of tertiary hospital j that is represented by the number of beds in district m as previous studies [17,32]; T m _ i , m _ j β is the travel time between neighborhood i and tertiary hospital j in district m ; and β is the travel friction coefficient.
Accordingly, the accessibility to tertiary hospitals across districts is defined as Equation (2).
( A m _ i ) o u t s i d e = 1 J 2 n , j m n O n _ j T m _ i , n _ j β
where ( A m _ i ) o u t s i d e is the accessibility of neighborhood i in district m to tertiary hospitals outside this district; J 2 is the total number of tertiary hospitals outside district m ; O n _ j is the service capacity of tertiary hospital j in district n ; and T m _ i , n _ j β is the travel time between neighborhood i in district m and tertiary hospital j in district n .
The travel friction coefficient β is an important parameter when measuring accessibility to tertiary hospitals through Equations (1) and (2), which can be influenced by some factors such as regional features, the type of service facility, and characteristics of people served. Peeters and Thomas [33] stated the value of β was generally located between 0.9 and 2.29, and the value ranging from 1.5 to 2 would have less impact on the study results. Tertiary hospitals as a type of service facility should meet more urgent needs and are used more frequently, due to the most advanced services capacity provided and patients’ choice preferences for medical service facilities [3,7]. From this point, the accessibility to tertiary hospitals is more significantly affected by distance or time than general service facilities such as post offices and gas stations. Therefore, the value of β in the above equations is defined as 2 in this study.
If averaging the accessibility of all neighborhoods in a certain district, the accessibility to tertiary hospitals within or across regions is denoted by ( A m ) i n s i d e and ( A m ) o u t s i d e , respectively.
( A m ) i n s i d e = i ( A m _ i ) i n s i d e K
( A m ) o u t s i d e = i ( A m _ i ) o u t s i d e K
In fact, residents in a district can select any hospital for medical services within or outside this district, and thus, the overall accessibility of the district needs to be analyzed. In this study, the overall accessibility to tertiary hospitals is defined as the sum of accessibility within and across regions.
A m = ( A m ) i n s i d e + ( A m ) o u t s i d e
where A m is the overall accessibility of district m to all tertiary hospitals.
To better compare the accessibility between different regions, the values of accessibility derived from Equations (3)–(5) need to be normalized by linear transformation. The larger the value of normalized accessibility, the better the access to tertiary hospitals.
( A m ) i n s i d e * = ( A m ) i n s i d e ( A m ) i n s i d e min ( A m ) i n s i d e max ( A m ) i n s i d e min
( A m ) o u t s i d e * = ( A m ) o u t s i d e ( A m ) o u t s i d e min ( A m ) o u t s i d e max ( A m ) o u t s i d e min
( A m ) * = A m ( A m ) min ( A m ) max ( A m ) min
where ( A m ) i n s i d e * , ( A m ) o u t s i d e * and ( A m ) * are the normalized accessibility within regions, across regions, and the overall accessibility, separately; ( A m ) i n s i d e max ( ( A m ) i n s i d e min ) , ( A m ) o u t s i d e max ( ( A m ) o u t s i d e min ) , and ( A m ) max ( ( A m ) min ) are the maximum (minimum) values of the corresponding accessibility by type.

2.2. Assessing Disparities of Accessibility

To analyze disparities of accessibility to tertiary hospitals among various regions, coefficient of variance (CV) is used, which is generally defined as the standard deviation of an indicator divided by its mean [34].
CV = 1 x ¯ ( 1 n i = 1 n ( x i x ¯ ) 2 ) 1 / 2
where x ¯ is the mean value of accessibility; n is the number of districts; and x i is the accessibility value of district i . The larger the value of CV , the greater the difference in accessibility to tertiary hospitals.
CV reflects the degree of dispersion between data only from a planar perspective and does not consider the relationship in spatial geographic locations [35]. This study further analyzes the imbalance and global spatial autocorrelation of tertiary hospital accessibility by using global Moran’s I, which can determine whether accessibility is spatially clustered, discrete, or random patterns [36].
I = n i = 1 n j = 1 n w i , j i = 1 n j = 1 n w i , j ( x i x ¯ ) ( x j x ¯ ) i = 1 n ( x i x ¯ ) 2
where I is the global Moran’s I; x ¯ and n have the same meaning as Equation (9); x i and x j are the accessibility values of districts i and j ; w i , j is the spatial weight, which is often determined by spatial adjacency and spatial distance. In this study, Queen’s Case is used to generate the spatial weight matrix [37]: if districts i and j share a boundary or node, then w i , j = 1 ; otherwise, w i , j = 0 . In addition, w i , i = 0 is provided.
The range of I values are between −1 and 1. If 0 < I 1 , it indicates positive spatial correlation, i.e., districts with higher (or lower) values of tertiary hospital accessibility tend to be spatially significantly clustered; if 1 I < 0 , it indicates negative spatial correlation, i.e., tertiary hospital accessibility of the district is spatially different from that of the surrounding districts; and if I = 0 , it indicates spatial irrelevance, i.e., the values of tertiary hospital accessibility of each district are spatially randomly distributed.

2.3. Assessing Social Equity

Based on accessibility measures, social equity of tertiary hospital accessibility will be analyzed using Lorenz curves and Gini coefficients. First, all districts are sorted in ascending order according to the corresponding accessibility values. Then, the Lorenz curve is drawn with the cumulative percentage of population by group as the horizontal axis and the cumulative percentage of accessibility as the vertical axis. Obviously, the Lorenz curve is plotted diagonally if tertiary hospital accessibility is evenly distributed in the population group observed; otherwise, the Lorenz curve is under the diagonal, indicating tertiary hospital accessibility is treated inequitably for group members. In addition, if the Lorenz curve is farther from the diagonal, it indicates that accessibility to tertiary hospitals is more inequitably distributed for that population group.
Unlike Lorenz curves, which graphically represent service inequity, the Gini coefficient mathematically describes the degree of inequity among social groups. The Gini coefficient is a relative indicator that is the ratio of the area between the diagonal and the Lorenz curve to the total area under the diagonal, as shown in Equation (11) [27].
G = S A S A + S B
where S A is the area between the diagonal and the Lorenz curve; S B is the area under the Lorenz curve; and S A + S B = 0.5 .
The range of G values is between 0 and 1. G = 0 ( G = 1 ) implies that the distribution of tertiary hospital accessibility in the studied population group is absolutely equitable (inequitable); 0 < G < 1 with G closer to 0 (1) implies that the distribution of tertiary hospital accessibility tends to be uniform (varies significantly in the studied population group).

3. Case Study

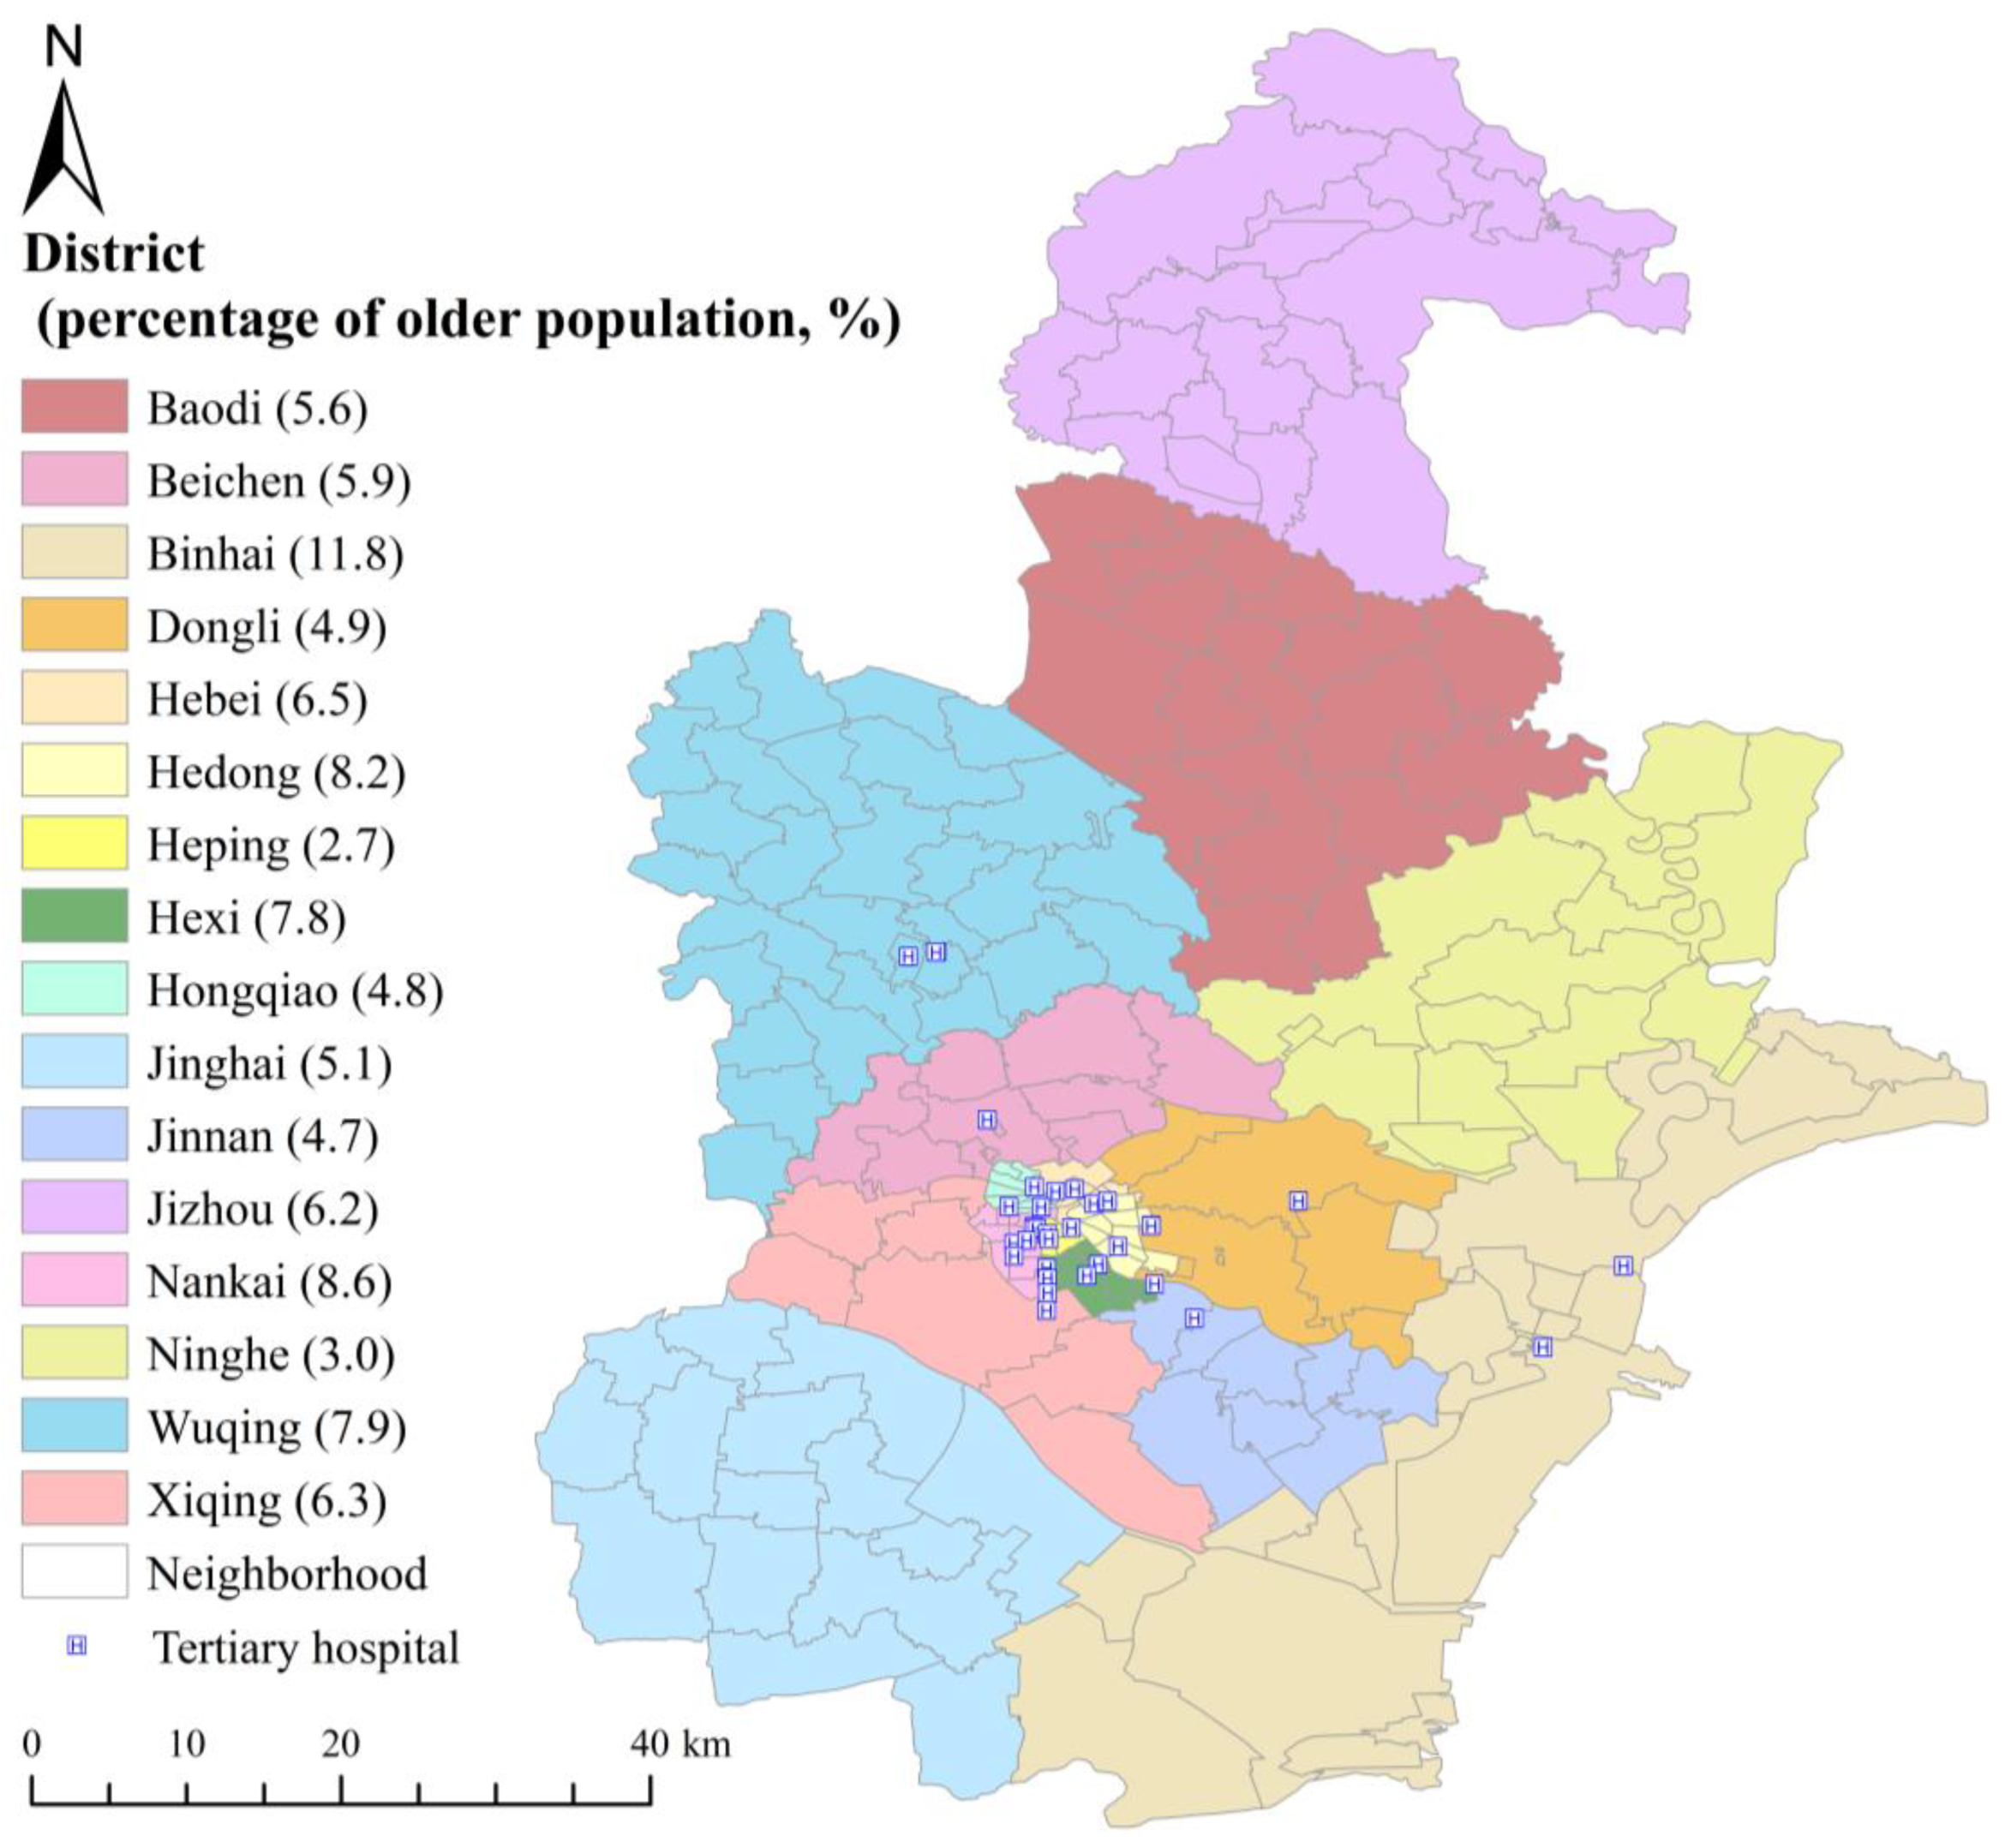
3.1. Study Area and Data Source

Tianjin located in the east of China is one of the four municipalities directly under the management of the central government. There are 16 municipal districts in Tianjin, including six central districts (Heping, Nankai, Hexi, Hebei, Hedong, and Hongqiao), four peripheral districts (Xiqing, Dongli, Beichen, and Jinan), and six suburban districts (Binhai, Baodi, Wuqing, Ninghe, Jinghai, and Jizhou) (see Figure 1). By 2020, the total population of Tianjin reached 13.87 million, of which the elderly population exceeded 2.05 million and accounted for 14.75%. It can be seen that Tianjin is facing a serious aging problem and some measures should be taken to help build an age-friendly city and provide seniors with a resilient lifestyle. This study selects neighborhoods in the 16 municipal districts of Tianjin as the studied spatial units and treats the geometric center of each neighborhood as the origins for accessibility measures. Currently, the medical service level of Tianjin is ranked at the forefront of the whole country, with 35 tertiary hospitals in total and each equipped with advanced medical resources. However, most of these tertiary hospitals are concentrated in the central area of this city, while there are no tertiary hospitals in the four districts (i.e., Baodi, Ninghe, Jinghai, and Jizhou).
This study uses multiple data sources in the case study: neighborhood division and the locations of tertiary hospitals in Tianjin are obtained from the national platform for common geospatial information public services (https://www.tianditu.gov.cn/, accessed on 1 September 2021); the road network information is acquired from the national fundamental geographic information system of China (http://www.ngcc.cn/, accessed on 1 September 2021); the number of open beds that represents the service capacity of tertiary hospitals in this study is obtained from the official websites of each tertiary hospital; according to the Design Specifications for Highway Speed Limit Signs of China, the travel speed of roads at all grades is assigned; and the data of the total and elderly populations in each district of Tianjin are obtained from the 7th national census in 2020. Here, seniors are defined as the segment of the population aged 65 or over. In addition, the walking speed range for elderly people is 0.9–1.3 m/s [38], so 1.0 m/s is assigned to sidewalks and internal roads in residential areas. Based on the above data, GIS is utilized to calculate travel time from a certain origin to any destination when measuring accessibility to tertiary hospitals.

3.2. Results

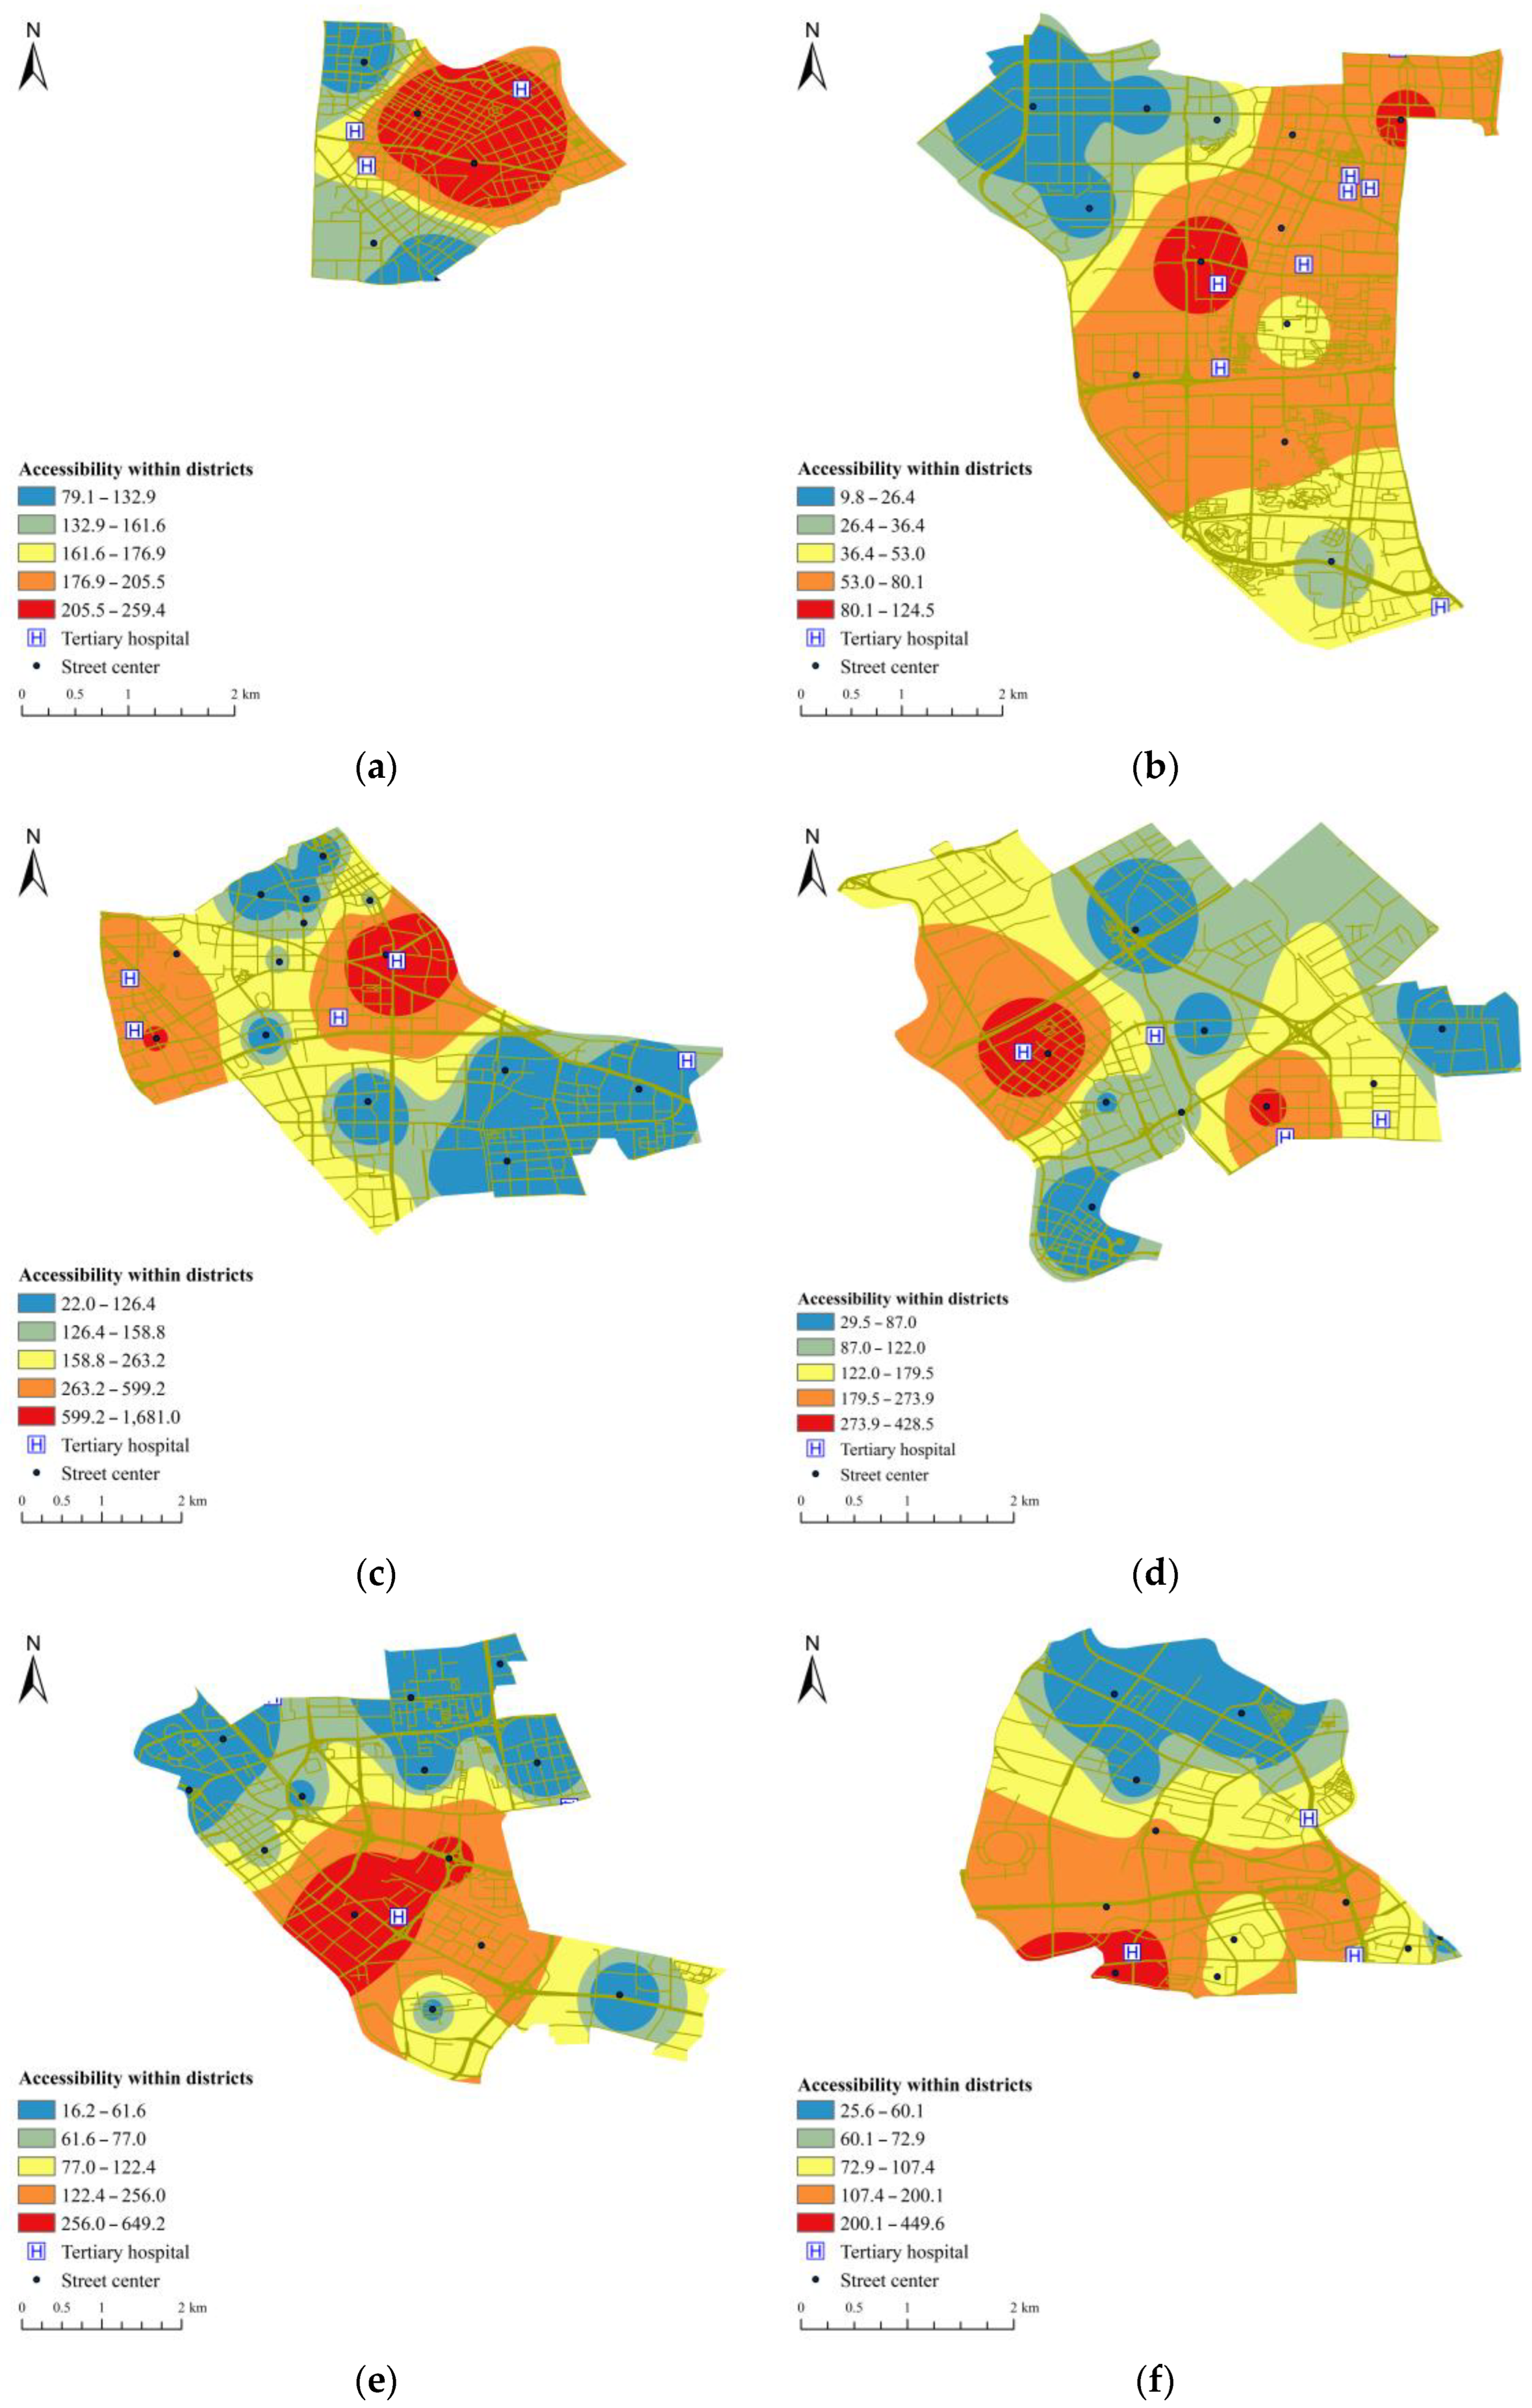
3.2.1. Accessibility to Tertiary Hospitals within Regions

By means of Equation (1), the accessibility to tertiary hospitals within each district can be calculated with the support of GIS. Taking six districts in the central area of this city as an example, the results of tertiary hospital accessibility are shown in Figure 2. If there is only one tertiary hospital in the district such as Hedong (Figure 2e) and Beichen, a high accessibility area is centered on the neighborhoods where the residents take the shortest time to reach the tertiary hospital. Furthermore, the accessibility surrounding this area gradually decreases in all directions based on the street network. When the travel time that the residents from two neighborhoods spend reaching the tertiary hospital is close, the area with high accessibility is centered on the midpoint of the line connecting the two neighborhoods or two areas with high accessibility centered on each of the two neighborhoods will be formed. When two or more tertiary hospitals are relatively concentrated in the district, an area with high accessibility will appear, which is roughly a convex polygon formed by connecting all tertiary hospitals in this district. The accessibility of neighborhoods near this area is larger than the remaining neighborhoods, such as districts of Heping (Figure 2a), Nankai (Figure 2b), Hongqiao (Figure 2f), Dongli, Binhai, and Wuqing. Furthermore, when two or more tertiary hospitals are distributed more scattered in the district, there will be multiple areas with high accessibility, such as Hexi district (Figure 2c) and Hebei district (Figure 2d).
Using Equations (3) and (6), the results of the normalized accessibility within regions ( A m ) i n s i d e * are shown in Table 1. All the six districts belonging to the central area are ranked in the top 7 of all observed districts. Although Nankai district has the largest number of tertiary hospitals, its accessibility within regions is the lowest compared with other districts in the central area. The reason is that the distribution of tertiary hospitals in Nankai district is extremely concentrated and further leads to more travel time for residents in neighborhoods far from these tertiary hospitals, thus affecting the accessibility level within this district. In addition, there are several or no tertiary hospitals in some peripheral and suburban areas, such as districts of Baodi, Ninghe, Jinghai, and Jizhou. Coupled with the vast territory of peripheral and suburban areas, this means that this kind of hospital bears intense pressure to provide health care services. In this case, accessibility to tertiary hospitals within regions is not satisfactory.

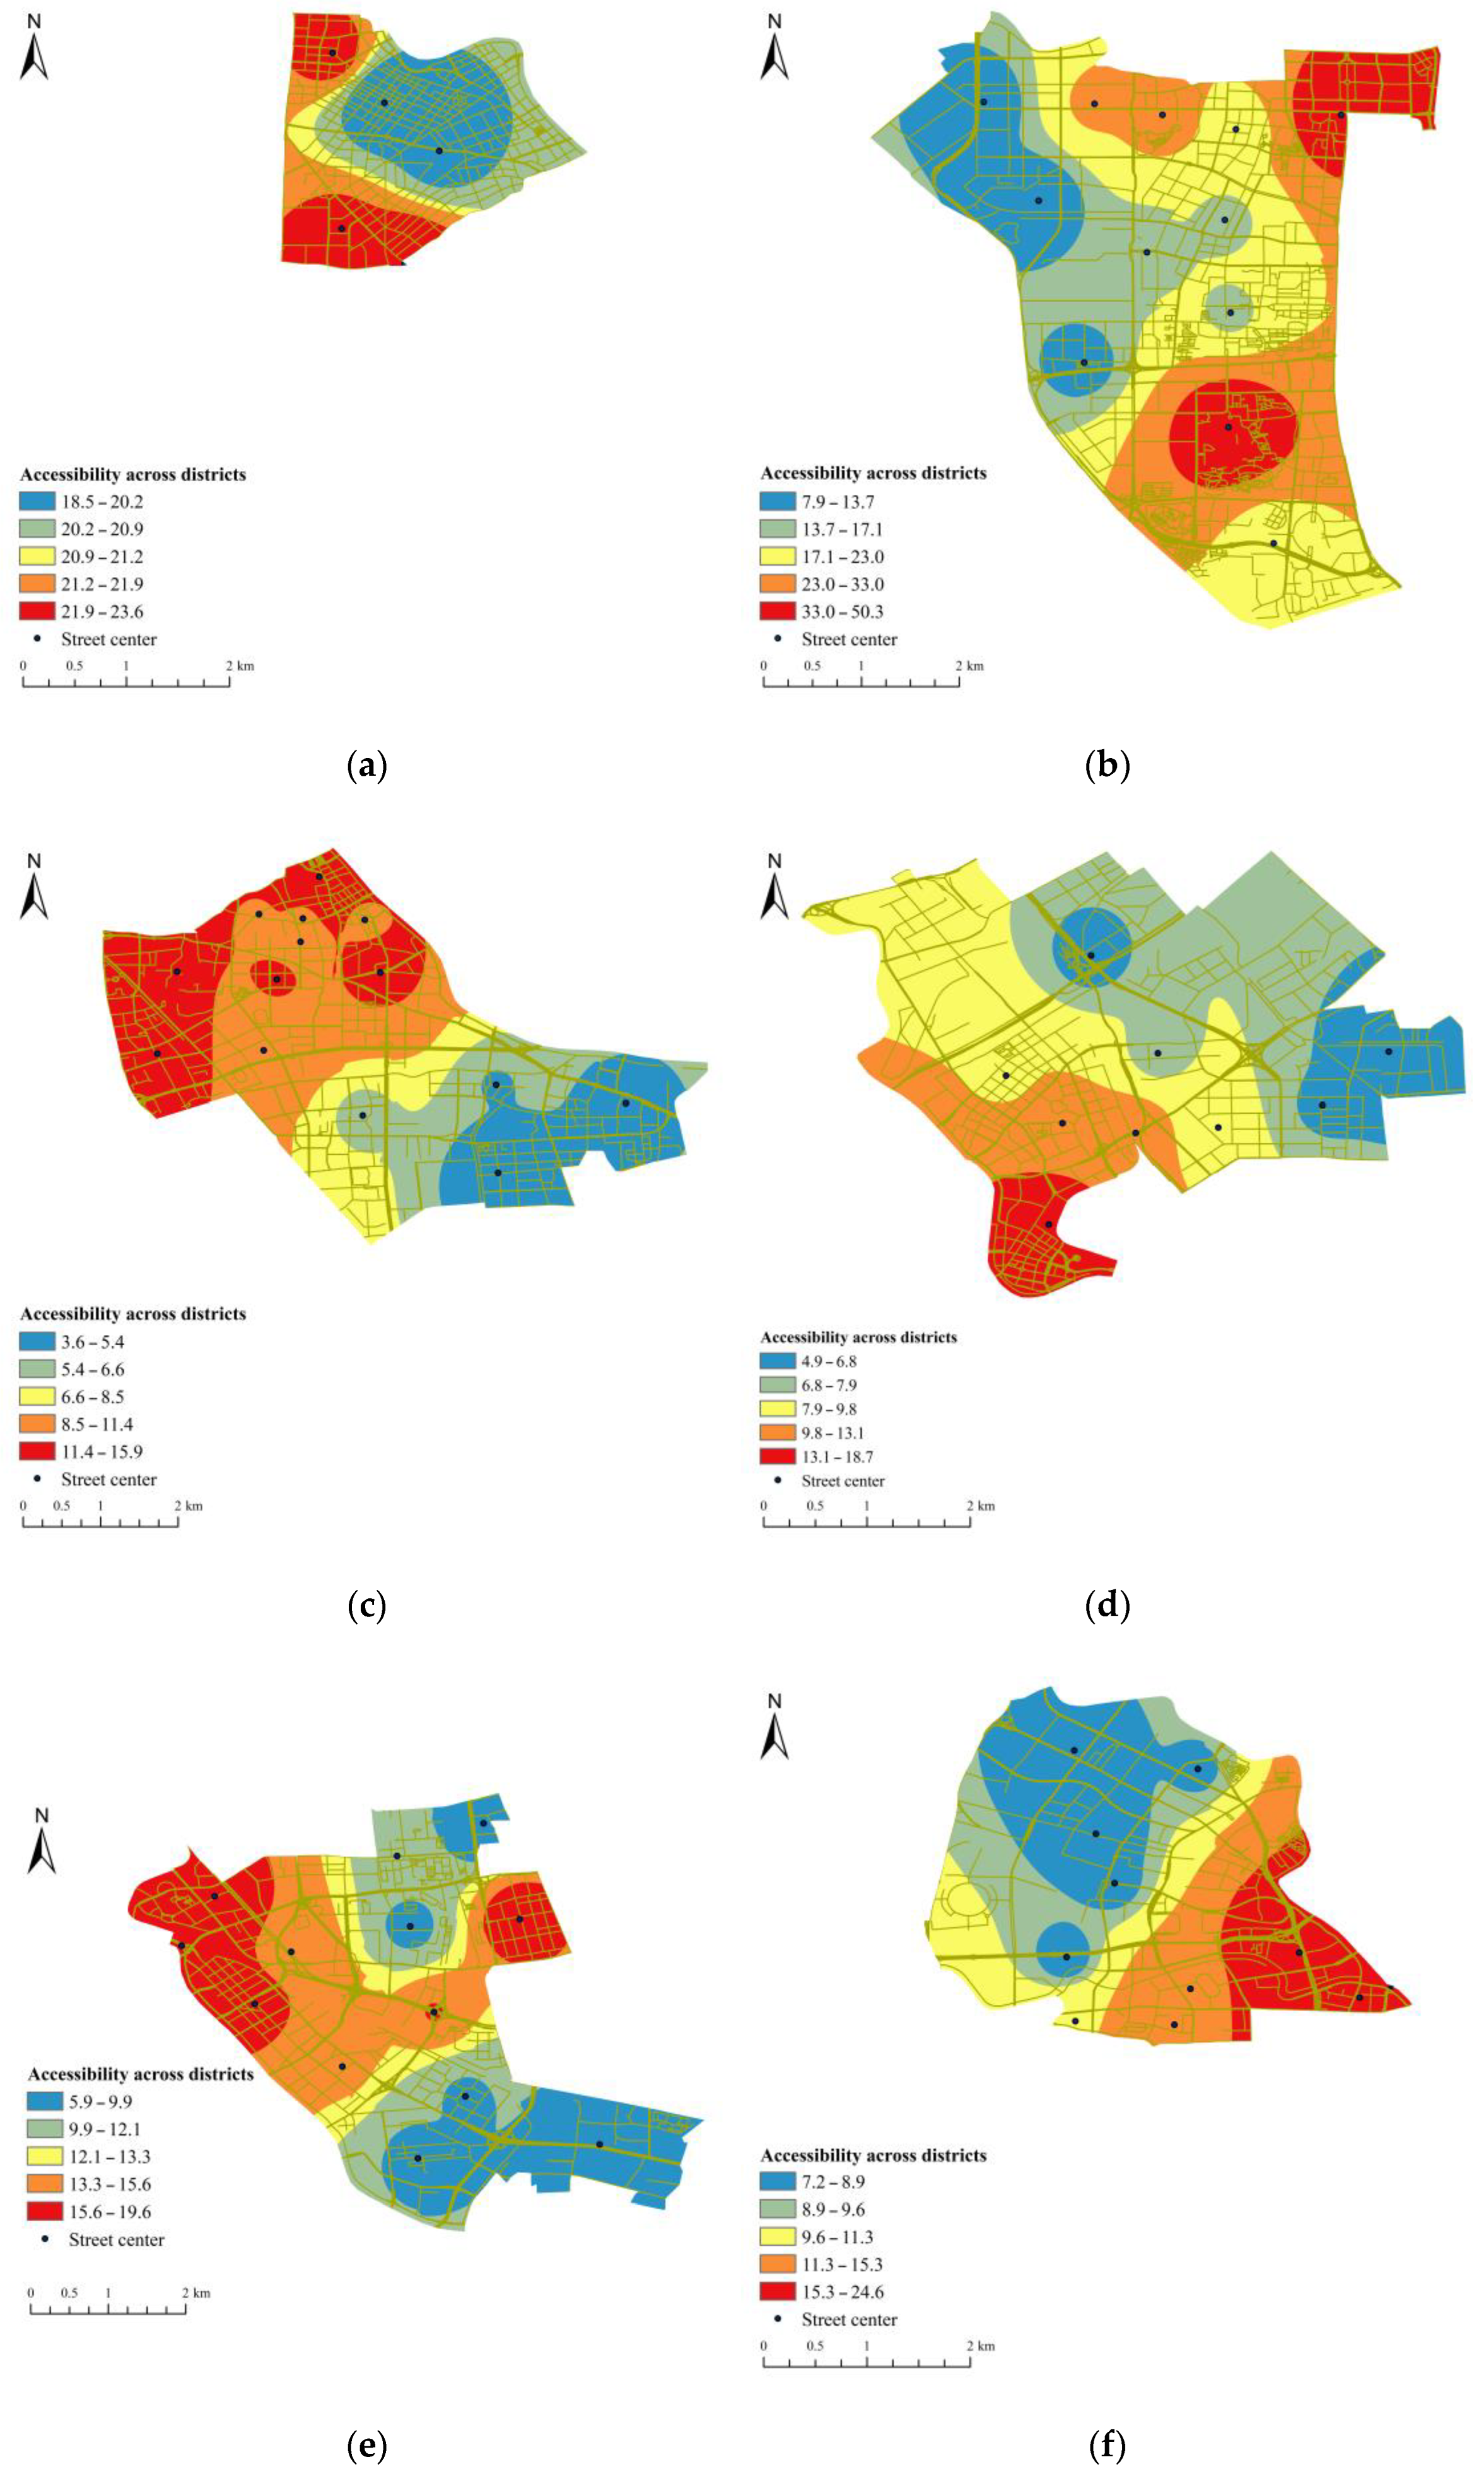
3.2.2. Accessibility to Tertiary Hospitals across Regions

In support of GIS, the accessibility to tertiary hospitals across each district is calculated according to Equation (2). Taking six districts in the central area as an example, the results of tertiary hospital accessibility are shown in Figure 3. Combining Figure 3 with Figure 1, the districts located in the north of Tianjin, such as Jizhou, Wuqing, and Ninghe, are equipped with high and low accessibility in the south and north of these districts, respectively. By contrast, the districts located in the south of Tianjin, such as Jinghai, Xiqing, and Jinan, have opposite distribution of accessibility to tertiary hospitals across regions (i.e., high accessibility in the north and low accessibility in the south). Overall, the accessibility of neighborhoods near the central area is higher than that of other neighborhoods. For instance, Nankai district has the largest number of tertiary hospitals and Heping district is located in the center of the central area, so the neighborhoods near the junction of Nankai or Heping district have higher accessibility to tertiary hospitals across regions. Furthermore, the central area of this city has the best access to medicine services provided by tertiary hospitals across regions, followed by the peripheral area and the suburban area, separately.
Using Equations (4) and (7), the results of the normalized accessibility across regions ( A m ) o u t s i d e * are shown in Table 1. Nearly 70% of tertiary hospitals in Tianjin are concentrated in the central area. Obviously, the closer to the city center, the shorter time it takes for residents to reach a tertiary hospital outside their districts. As such, the six districts belonging to the central area have better access to tertiary hospitals across regions and are ranked in the top six of all observed districts.

3.2.3. Overall Accessibility to Tertiary Hospitals

Using Equations (5) and (8), the results of the normalized overall accessibility ( A m ) * among all districts are shown in Table 1, from which the districts of Tianjin with poor access to tertiary hospitals can be identified. Four districts of Jizhou, Baodi, Ninghe, and Jinghai have a shortage of medical services due to the lack of tertiary hospitals in the district. Meanwhile, the four districts of Binhai, Jinan, Dongli, and Xiqing also have poor accessibility due to the small number and size of the tertiary hospitals within the district and its large territory. The accessibility of Wuqing and Beichen districts, which belong to the suburban area and the peripheral area, respectively, is acceptable, and the accessibility of six districts in the central area is relatively high. It can also reveal that there are obvious differences in the number and geographical distribution of tertiary hospitals in Tianjin.

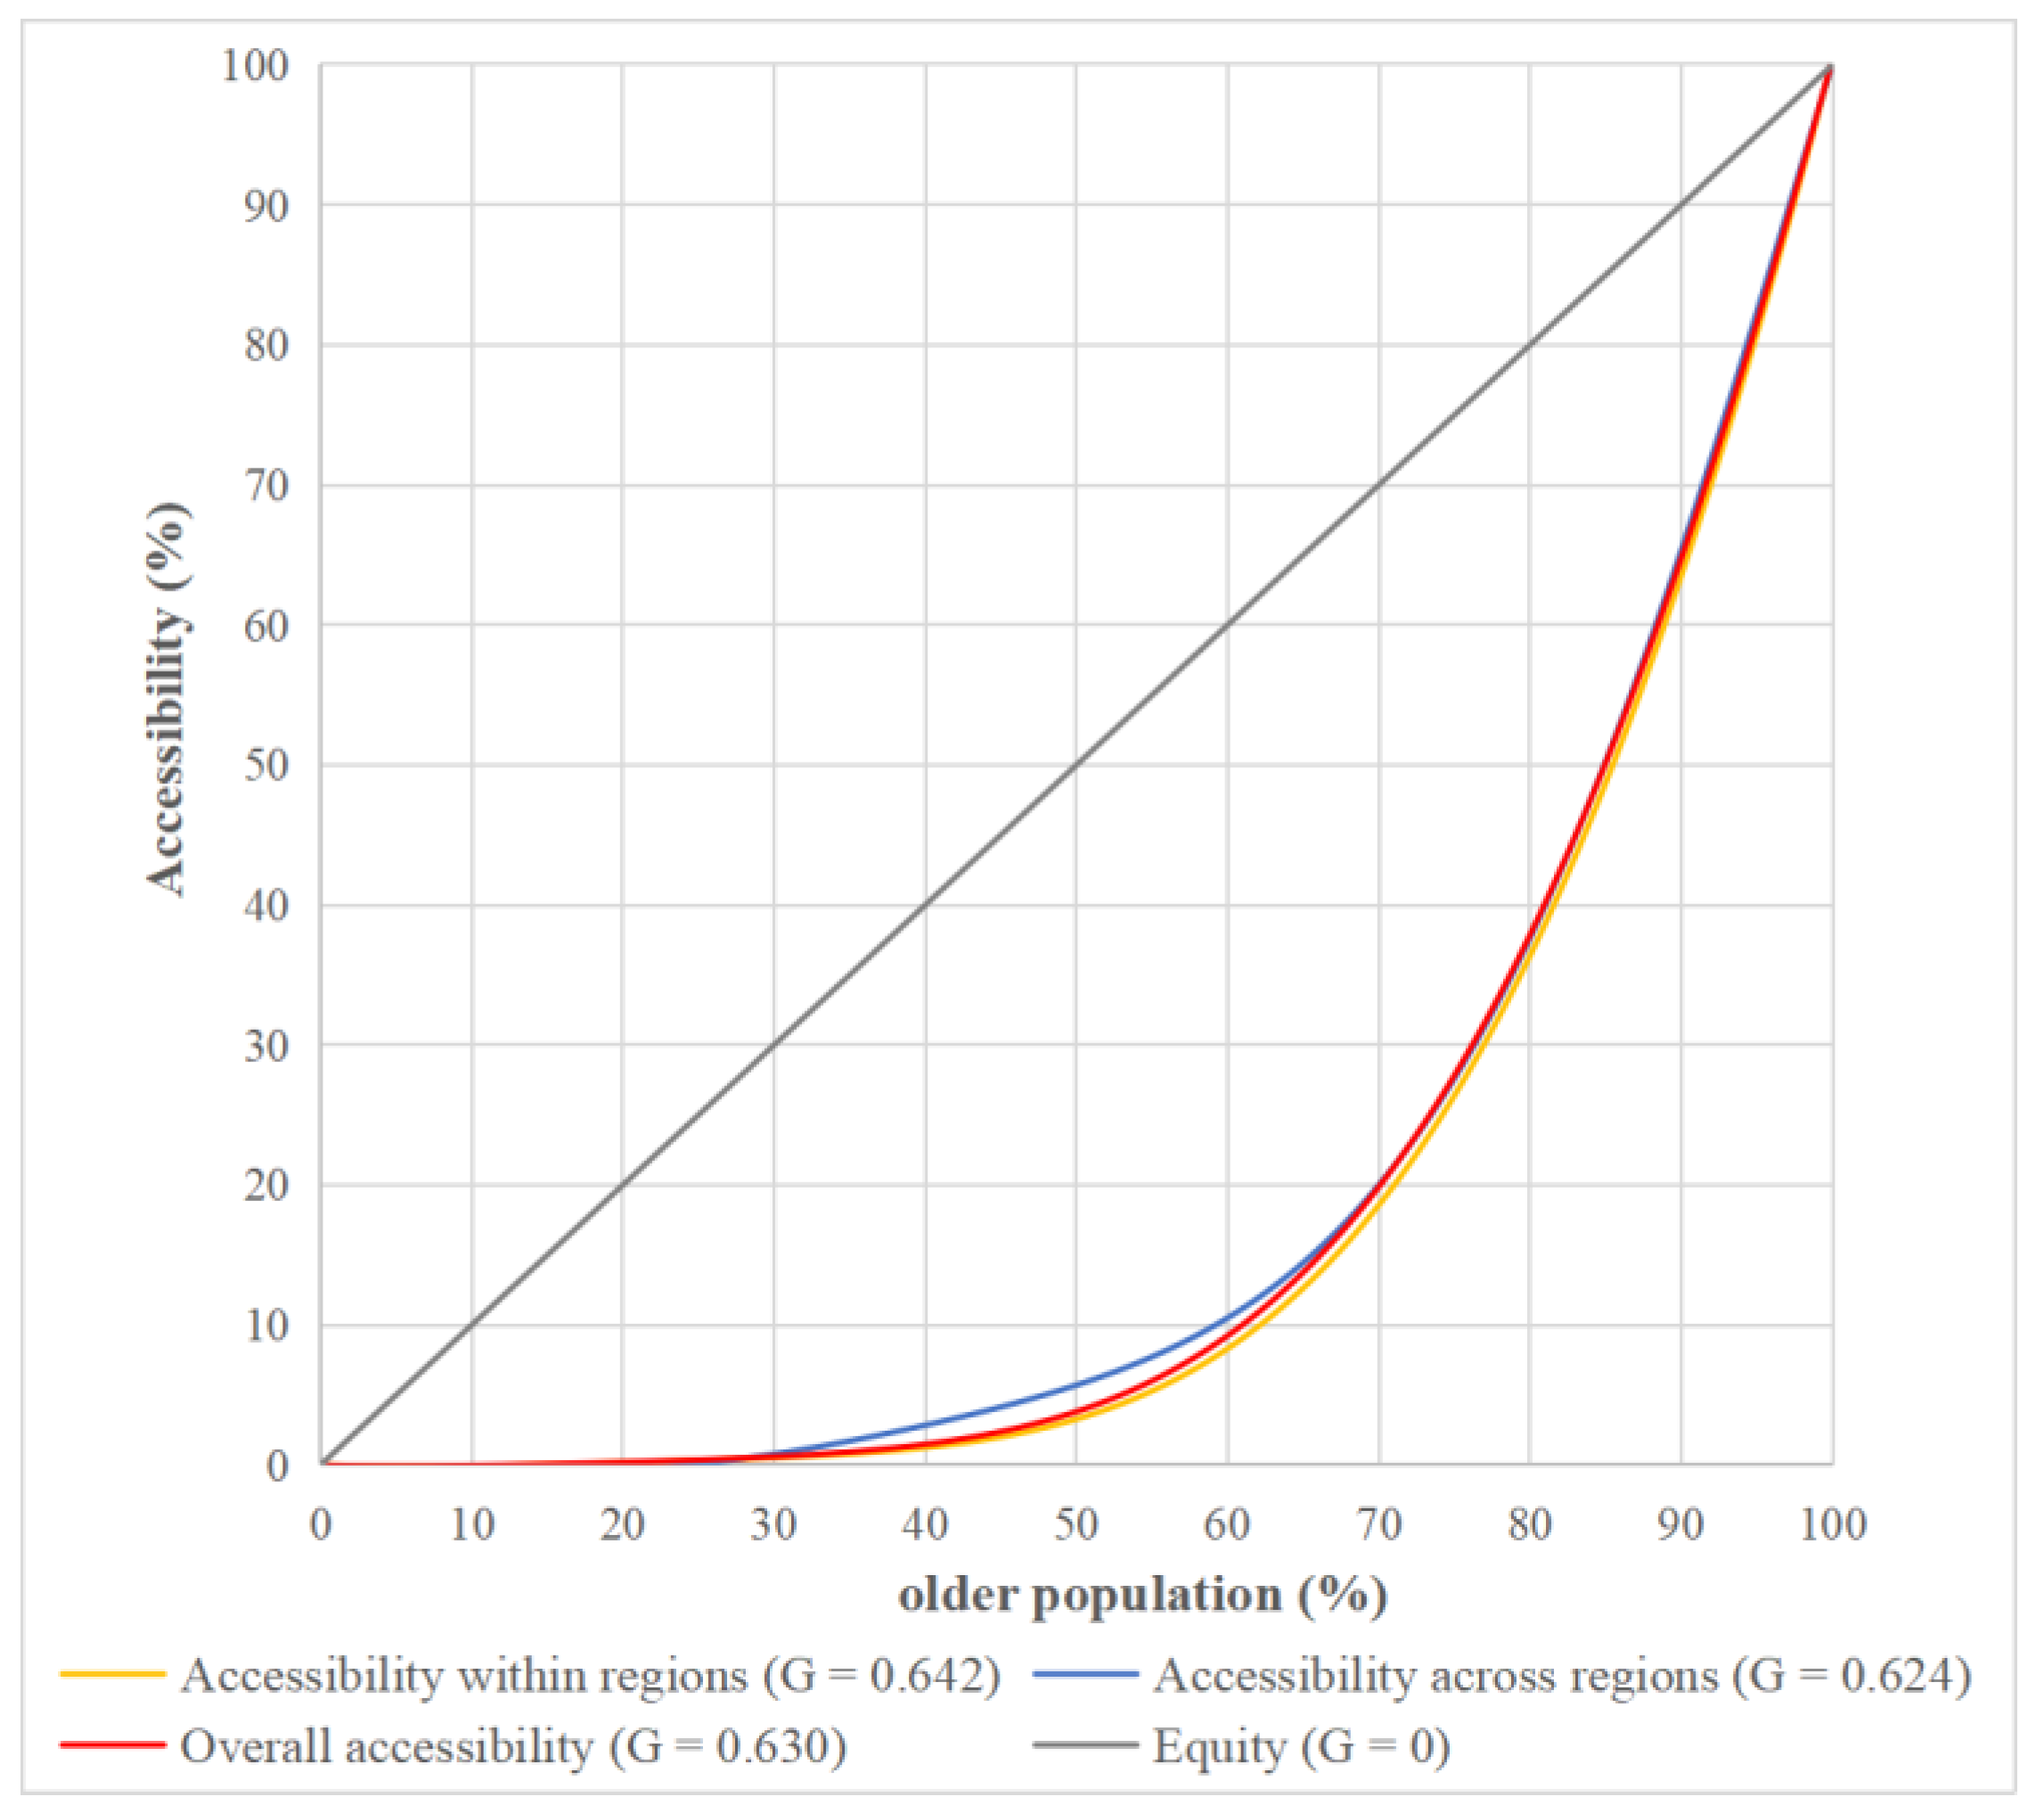
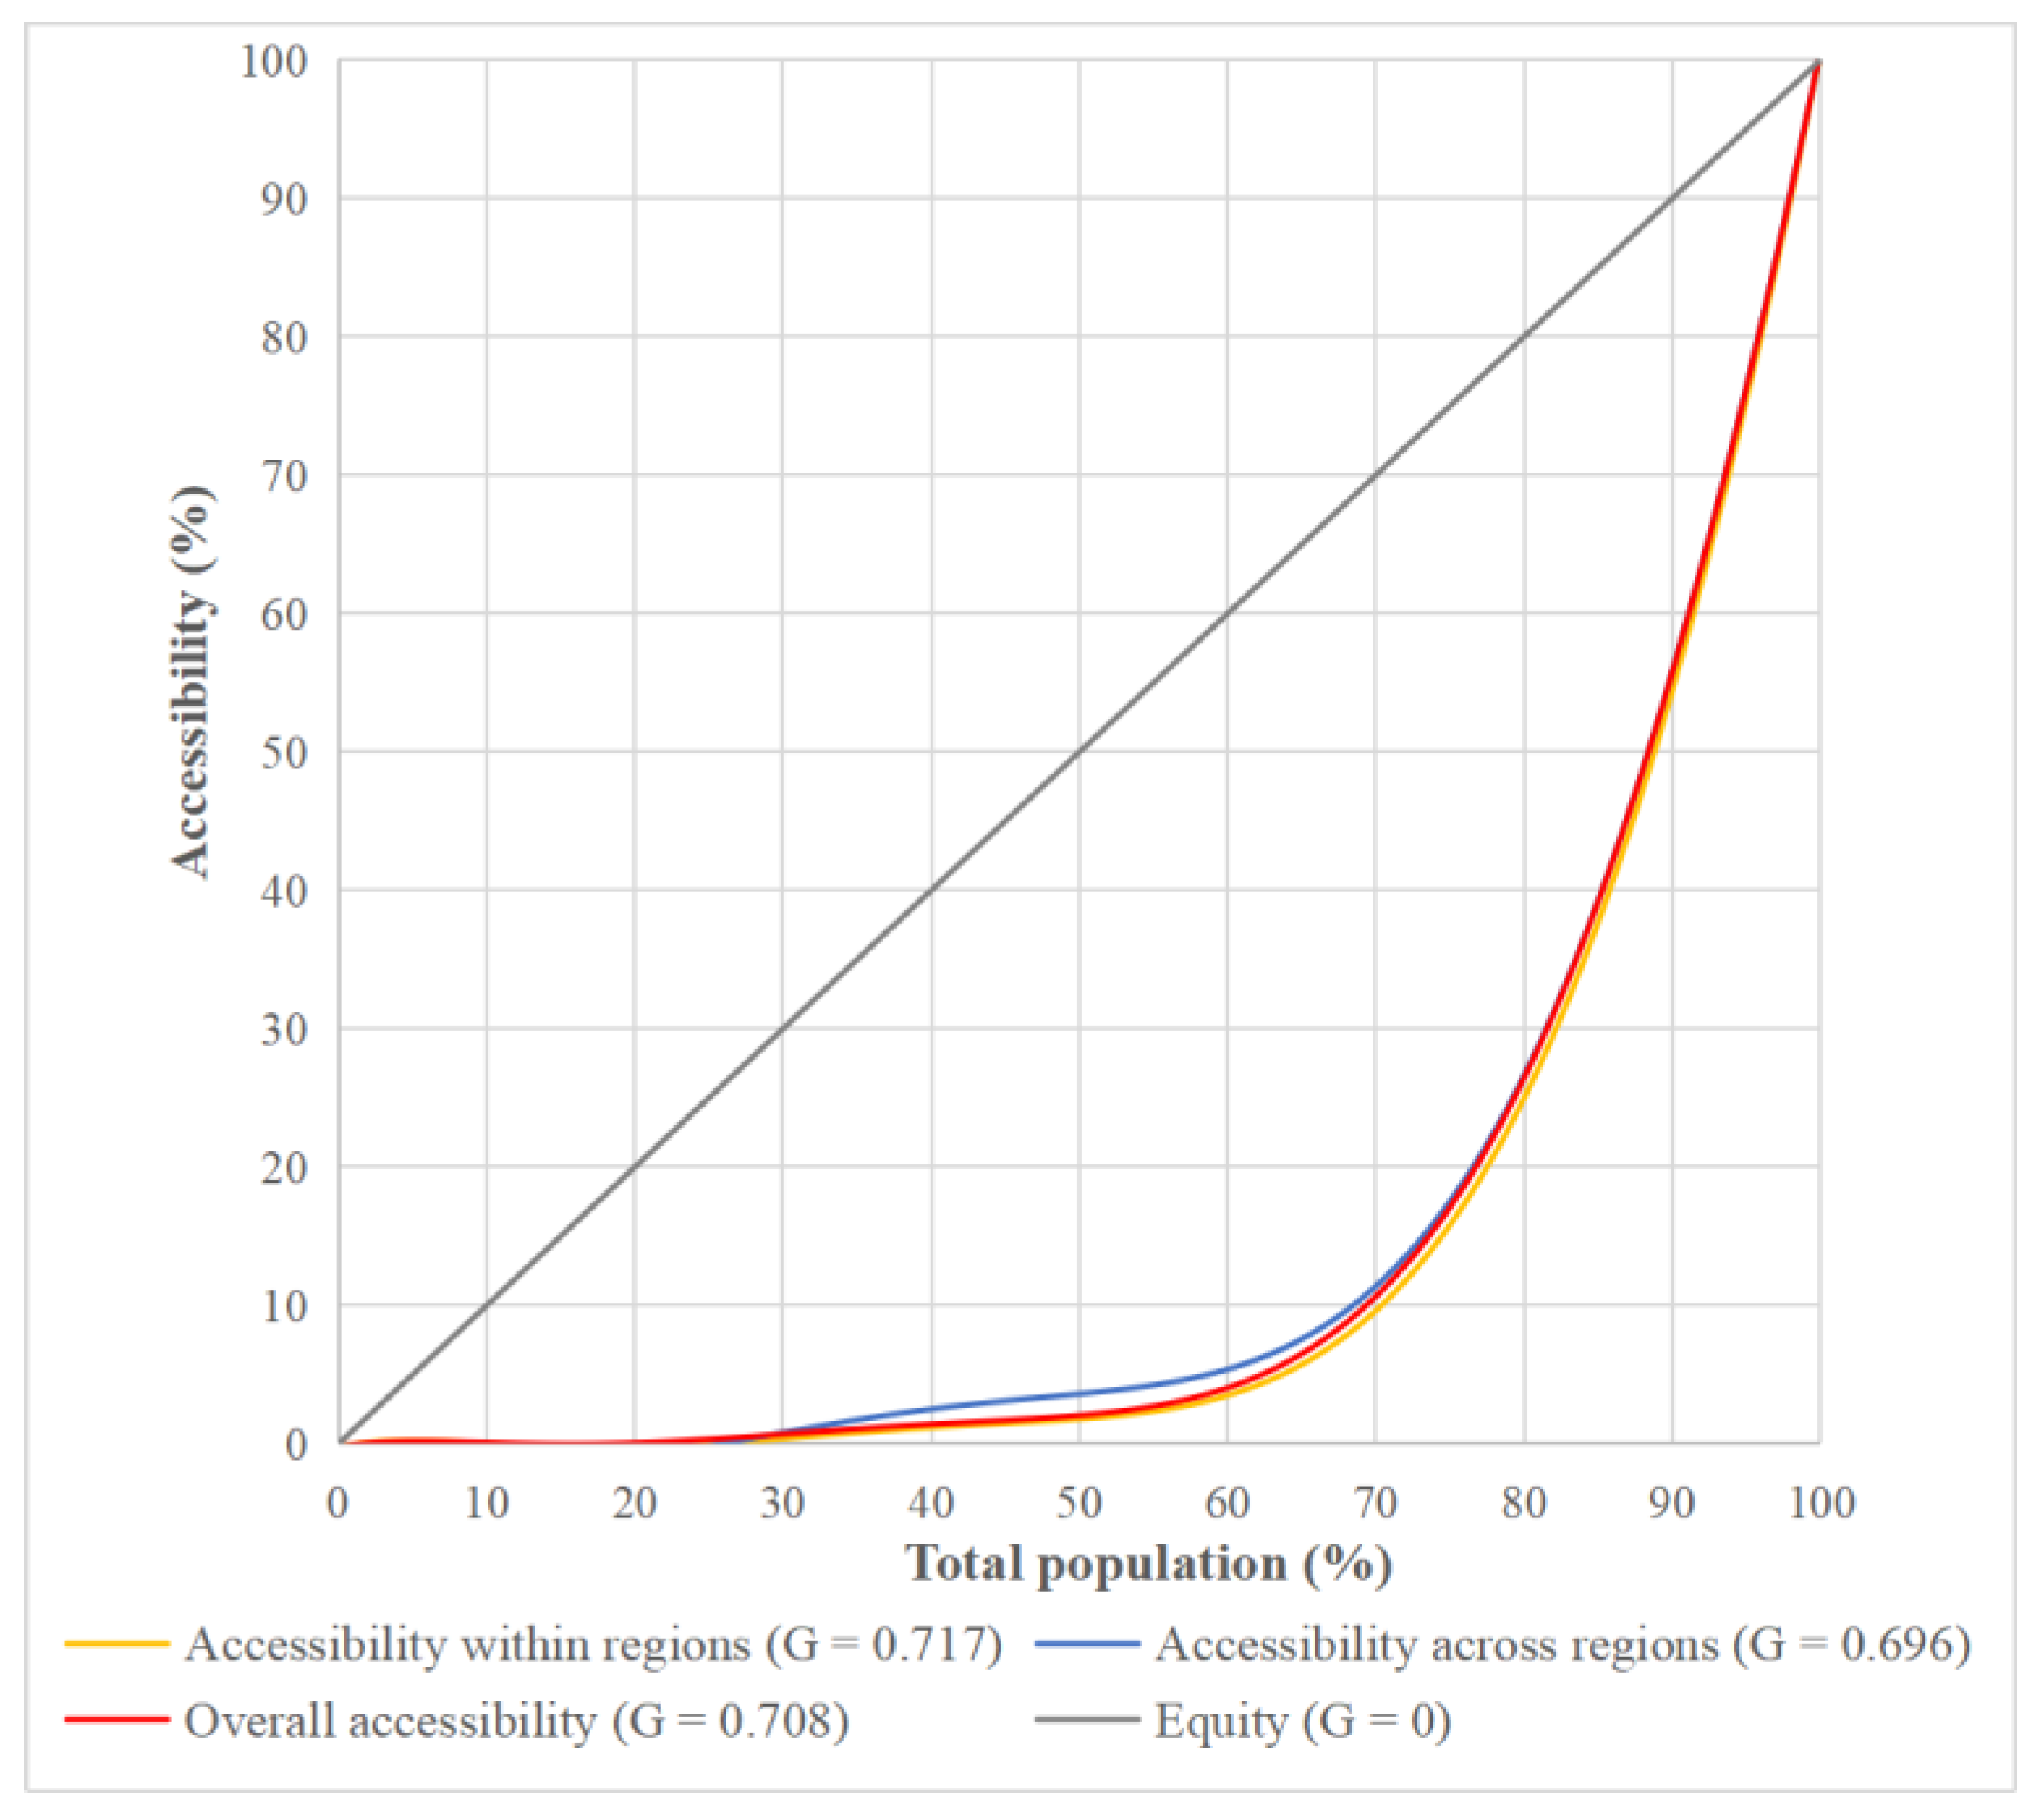
3.2.4. Social Equity of Tertiary Hospitals

The results of tertiary hospital accessibility in each district of Tianjin only reveal the medical service supply, while ignoring the demand from service users. Therefore, the Lorenz curve and Gini coefficient are used to show how services provided by tertiary hospitals are distributed for the elderly population (see Figure 4).
The Gini coefficients of tertiary hospital accessibility within regions, across regions, and overall accessibility are all greater than 0.5, indicating that the service distribution has a higher degree of inequity for the elderly population. Of them, the Gini coefficient of accessibility within regions is the largest because some districts lack tertiary hospital services, and the regional distribution of tertiary hospitals fits poorly with the elderly population. The Gini coefficient of accessibility across regions is the smallest, which may be attributed to the better street network and more convenient transportation system in Tianjin. By contrast, the Gini coefficient of overall accessibility lies at the middle level. Specifically, when the cumulative percentage of the elderly population is less than 30% or more than 80%, the gap between these three Lorenz curves is relatively small. This point indicates that the accessibility to tertiary hospitals within regions, across regions and the overall accessibility have similar distributions in districts with smaller and larger elderly populations. The largest difference in the three types of accessibility occurs when the cumulative percentage of the elderly population is approximately 50%, from which the distribution of accessibility across regions is more socially equitable for older adults.

4. Discussion

4.1. Regional Comparison

From Table 1, it can be found the ranking of the overall accessibility is similar to that of the accessibility within regions, except that the last four positions are re-ranked according to the overall accessibility and only Jinan and Dongli districts are swapped in the adjacent positions. This shows that the overall accessibility in each district of Tianjin is mainly determined by the accessibility within regions. Based on Equation (5), the overall accessibility can be expressed as the sum of accessibility within regions and across regions, which also indicates accessibility within regions accounts for a larger proportion of the overall accessibility. In addition, combining Table 1 with Figure 1, it is found that the three types of accessibility have a common feature, that is, tertiary hospital accessibility of the central area is higher than that of the peripheral area and suburban area in general. Geographically, low accessibility is displayed in the northeastern and southwestern areas of Tianjin and the accessibility level is improved from the surrounding areas to the central area.
Since there exists significant regional imbalance in accessibility to tertiary hospitals, CV and global Moran’s I are used to measure the disparities and spatial autocorrelation of accessibility (see Table 2). The CV values of all types of accessibility are similar and large, indicating that these accessibility values are all highly discrete and disparities of accessibility by type are obvious. All the values of Moran’s I are greater than 0, so the distribution of all districts tends to be significantly spatially clustered. The districts with higher accessibility to tertiary hospitals in Tianjin are concentrated in the central area, while the peripheral and suburban areas have the districts with lower accessibility. Obviously, there exists polarization of accessibility to tertiary hospitals in Tianjin. Moreover, the proximity effect of accessibility across regions is more significant than accessibility within regions and the overall accessibility since tertiary hospital accessibility across regions in a certain district primarily depends on the accessibility of neighboring districts.

4.2. Social Equity Comparison

This study plots the Lorenz curves of tertiary hospital accessibility for the total population in Figure 5. Compared with Figure 4, the Lorenz curves for both the elderly and total populations are below the diagonal and deviate significantly. This indicates the accessibility of each district in Tianjin is not identical and varies greatly within the two population groups. Additionally, the point where the three types of accessibility differ most in the total population is also located around 50% of the cumulative percentage of the population. From this point, the equity advantage of accessibility across regions over the other two types of accessibility is more significant for the elderly group. In addition, the Gini coefficient of the elderly population is slightly smaller than the total population. This reveals that the distribution of the tertiary hospitals in Tianjin is more concerned about the needs of the elderly, which could lay a foundation for building an age-friendly city of Tianjin. However, the Gini coefficients are all greater than 0.5, which also demonstrates the problems of unbalanced resource allocation of tertiary hospitals in this city. The above results are inconsistent with the equity of access to other services (e.g., public transport) for the elderly and total populations compared with previous studies [27].

4.3. Policy Considerations

Tertiary hospitals are equipped with the most advanced services capacity, such as department setting, medical staff, hospital beds, and medical equipment. This could guarantee that older adults receive high-level health care services more efficiently, when suffering from intractable diseases, particular for aging societies. The findings show that there are differences in tertiary hospital accessibility by type among all the districts of Tianjin. The factors affecting the accessibility and social equity of tertiary hospitals mainly include the geographic location and attraction of hospitals, population distribution among regions, street networks, and road grades. To improve accessibility to tertiary hospitals, some policy considerations are put forward to help deliver medicine services in a more equitable manner and facilitate the development of age-friendly cities.
First, optimize the existing tertiary hospital resources. The clustered distribution of accessibility to tertiary hospitals provides reliable evidence for the government to identify spatial differences in accessibility of each district in Tianjin. Accordingly, the government should formulate specific policies for different districts and especially pay more attention to the districts with low accessibility. Combining medicine services provided by each hospital, hospitals with complementary resources should be merged to make full use of their strength. Furthermore, several tertiary hospitals that are too concentrated in a district (e.g., the central area of Nankai district) can possibly be relocated partly to the northwest and southeast of this city, where there is a lack of tertiary hospitals or the distribution of tertiary hospitals is scattered.
Second, tertiary hospital resources could be supplemented in some special districts to make up for the shortage of medical services. It is suggested to improve the level of medical services in neighborhoods with low accessibility and increase the investment in medical equipment and health technicians. For example, new tertiary hospitals may be built in four districts (Baodi, Ninghe, Jinghai, and Jizhou) that lack this kind of medical service. In addition, since central areas are densely populated and cover a wide geographic area, the supply capacity of tertiary hospitals in these areas should be enhanced. For instance, increasing the number of beds and expanding the scale and service level of tertiary hospitals can make their supply capacity match the population density and spatial characteristics of the district where these hospitals are located [39].
Third, the road network system could be optimized and road connectivity effectively improved. For the existing tertiary hospitals, their accessibility can be enhanced by reducing travel impedance from the origins. Combining traffic planning with the location of tertiary hospitals, road connectivity should be optimized in densely populated areas, the construction of roads of different grades should be improved, and the grade of some key roads should be appropriately increased [40]. For instance, it is suggested to optimize the road network between the areas with low accessibility across regions (e.g., districts of Jizhou and Baodi) and the surrounding areas. For larger districts such as Binhai, the density of the road network can be increased internally so that residents have more path choices to reach tertiary hospitals. Furthermore, considering public transport has road priority and older adults prefer to use this kind of transport mode, if services are easily accessible, the public transport system surrounding tertiary hospitals can be strengthened [41].
The above three primary measures for improving accessibility to tertiary hospitals need to be accomplished over the long term. Alternatively, policy makers can provide some short-term solutions to allow older adults in these neighborhoods or districts to easily access health care services provided by tertiary hospitals, for instance, the use of tele-visit with the help of their family members, picking up the elderly at their residence to hospitals by means of paratransit, and extending medical insurance coverage for older adults.

5. Conclusions

This study proposes a series of methods to evaluate accessibility to tertiary hospitals within regions, accessibility across regions, and the overall accessibility; analyze the regional differences in accessibility; and compare the social equity of tertiary hospital accessibility between the elderly and total population. This study can contribute to enriching the literature in (tertiary) hospital accessibility in consideration of socially disadvantaged groups including older adults. First, a quantitative approach based on the gravity-based model and GIS were proposed to investigate tertiary hospital accessibility at different regional scales from the age-friendly perspective. Second, the normalized method and the weighted sum model were developed to achieve accessibility comparison of tertiary hospitals for various assessment purposes (e.g., within or across regions) and the accessibility disparities were analyzed by using Moran’s I among regions. Third, the distribution of tertiary hospital accessibility by type were analyzed among various population groups using Lorenz curves and Gini coefficients, which provide helpful tools by which to explore social equity in health care resources. Last, understanding the accessibility levels to tertiary hospitals by means of the proposed methodology can help improve status quo of medicine services, formulate measures to optimize the rational spatial distribution of health care resources, and develop neighborhoods and cities that are more age friendly. Taking Tianjin as an example, tertiary hospital accessibility within regions, across regions, and the overall accessibility showed significant differences among the observed districts. The elderly population has less inequity in accessibility to tertiary hospitals compared with the total population. Based on the findings, some policy considerations were put forward to help develop the spatial distribution and resource allocation of tertiary hospitals more equitably.
There are also some limitations in this study. First, the travel impedance in accessibility measures is not refined in consideration of different types of transport modes (e.g., public transport or private cars). Future studies can consider integrating travel behavior of socially disadvantaged groups including older adults in measuring accessibility to hospitals. Second, the city-wide level is selected to assess tertiary hospital accessibility, so future work can be conducted from different regional scales such as cities to make a horizontal comparison by using the proposed methods. Additionally, optimization of tertiary hospital resources and medicine service supply can be conducted based on the results of accessibility assessment, considering some factors such as service demand of the elderly, individual characteristics, and relevant strategies in future study.

Author Contributions

Conceptualization, Funding acquisition, methodology, writing—original draft, writing—review and editing, Y.C.; methodology, data curation, writing—original draft, Q.D.; funding acquisition, formal analysis, project administration, writing—review and editing, Y.S. All authors have read and agreed to the published version of the manuscript.

Funding

This research was funded by the National Natural Science Foundation of China, grant Number 72002152 and 72001032.

Institutional Review Board Statement

Not applicable.

Informed Consent Statement

Not applicable.

Data Availability Statement

Not applicable.

Conflicts of Interest

The authors declare no conflict of interest.

References

  1. United Nations. World Population Ageing 2019; United Nations: New York, NY, USA, 2019. [Google Scholar]
  2. Starfield, B.; Shi, L.; Macinko, J. Contribution of primary care to health systems and health. Milbank Q. 2015, 83, 457–502. [Google Scholar] [CrossRef] [PubMed]
  3. Yang, N.; Shen, L.; Shu, T.; Liao, S.; Peng, Y.; Wang, J. An integrative method for analyzing spatial accessibility in the hierarchical diagnosis and treatment system in China. Soc. Sci. Med. 2021, 270, 113656. [Google Scholar] [CrossRef]
  4. Chinese State Council. Guiding Opinions of the General Office of the State Council on Promoting the Construction of a Hierarchical Diagnosis and Treatment System. Available online: http://www.gov.cn/zhengce/content/2015-09/11/content_10158.htm (accessed on 19 September 2015).
  5. Lu, C.; Zhang, Z.; Lan, X. Impact of China’s referral reform on the equity and spatial accessibility of healthcare resources: A case study of Beijing. Soc. Sci. Med. 2019, 235, 112386. [Google Scholar] [CrossRef] [PubMed]
  6. National Development and Reform Commission. Implementation Plan for Establishing the Efficient and High-Quality Medical and Health Service System during the 14th Five-Year Plan. 2021. Available online: https://www.ndrc.gov.cn/xxgk/zcfb/tz/202107/t20210701_1285212.html?code=&state=123 (accessed on 25 May 2022).
  7. Li, Z.; Gao, Y.; Yu, L.; Choguill, C.L.; Cui, W. Analysis of the elderly’s preferences for choosing medical service facilities from the perspective of accessibility: A case study of tertiary general hospitals in Hefei, China. Int. J. Environ. Res. Public Health 2021, 19, 9432. [Google Scholar] [CrossRef]
  8. Koenig, J.G. Indicators of urban accessibility: Theory and application. Transportation 1980, 9, 145–172. [Google Scholar] [CrossRef]
  9. Van Herzele, A.; Wiedemann, T. A monitoring tool for the provision of accessible and attractive urban green spaces. Landsc. Urban Plan. 2003, 63, 109–126. [Google Scholar] [CrossRef]
  10. Nykiforuk, C.I.J.; Glenn, N.M.; Hosler, I.; Craig, H.; Reynard, D.; Molner, B.; Candlish, J.; Lowe, S. Understanding urban accessibility: A community-engaged pilot study of entrance features. Soc. Sci. Med. 2021, 273, 113775. [Google Scholar] [CrossRef]
  11. Cheng, L.; Yang, M.; De Vos, J.; Witlox, F. Examining geographical accessibility to multi-tier hospital care services for the elderly: A focus on spatial equity. J. Transp. Health 2020, 19, 100926. [Google Scholar] [CrossRef]
  12. Zhang, F.; Li, D.; Ahrentzen, S.; Zhang, J. Assessing spatial disparities of accessibility to community-based service resources for Chinese older adults based on travel behavior: A city-wide study of Nanjing, China. Habitat Int. 2019, 88, 101984. [Google Scholar] [CrossRef]
  13. Chen, Y.; Bouferguene, A.; Li, H.X.; Liu, H.; Shen, Y.; Al-Hussein, M. Spatial gaps in urban public transport supply and demand from the perspective of sustainability. J. Clean. Prod. 2018, 195, 1237–1248. [Google Scholar] [CrossRef]
  14. Li, S.; Duan, H.; Smith, T.E.; Hu, H. Time-varying accessibility to senior centers by public transit in Philadelphia. Transp. Res. Part A Policy Pract. 2021, 151, 245–258. [Google Scholar] [CrossRef]
  15. Guo, S.; Song, C.; Pei, T.; Liu, Y.; Ma, T.; Du, Y.; Chen, J.; Fan, Z.; Tang, X.; Peng, Y.; et al. Accessibility to urban parks for elderly residents: Perspectives from mobile phone data. Landsc. Urban Plan. 2019, 191, 103642. [Google Scholar] [CrossRef]
  16. Pettersson, C.; Slaug, B.; Granbom, M.; Kylberg, M.; Iwarsson, S. Housing accessibility for senior citizens in Sweden: Estimation of the effects of targeted elimination of environmental barriers. Scand. J. Occup. Ther. 2018, 25, 407–418. [Google Scholar] [CrossRef] [PubMed] [Green Version]
  17. Wang, X.; Yang, H.; Duan, Z.; Pan, J. Spatial accessibility of primary health care in China: A case study in Sichuan Province. Soc. Sci. Med. 2018, 209, 14–24. [Google Scholar] [CrossRef] [PubMed]
  18. Tao, Z.; Cheng, Y.; Du, S.; Feng, L.; Wang, S. Accessibility to delivery care in Hubei Province, China. Soc. Sci. Med. 2020, 260, 113186. [Google Scholar] [CrossRef]
  19. Huotari, T.; Antikainen, H.; Keistinen, T.; Rusanen, J. Accessibility of tertiary hospitals in Finland: A comparison of administrative and normative catchment areas. Soc. Sci. Med. 2017, 182, 60–67. [Google Scholar] [CrossRef] [Green Version]
  20. Cheng, G.; Zeng, X.; Duan, L.; Lu, X.; Sun, H.; Jiang, T.; Li, Y. Spatial difference analysis for accessibility to high level hospitals based on travel time in Shenzhen, China. Habitat Int. 2016, 53, 485–494. [Google Scholar] [CrossRef] [Green Version]
  21. Kim, K.; Ghorbanzadeh, M.; Horner, M.W.; Ozguven, E.E. Identifying areas of potential critical healthcare shortages: A case study of spatial accessibility to ICU beds during the COVID-19 pandemic in Florida. Transp. Policy 2021, 110, 478–486. [Google Scholar] [CrossRef]
  22. Zhang, T.; Xu, Y.; Ren, J.; Sun, L.; Liu, C. Inequality in the distribution of health resources and health services in China: Hospitals versus primary care institutions. Int. J. Equity Health 2017, 16, 42. [Google Scholar] [CrossRef] [Green Version]
  23. Lorenz, M.O. Methods of measuring the concentration of wealth. Publ. Am. Stat. Assoc. 1905, 9, 209–219. [Google Scholar] [CrossRef]
  24. Huang, Y.; Todd, D. The energy implications of Chinese regional disparities. Energy Policy 2010, 38, 7531–7538. [Google Scholar] [CrossRef]
  25. Liu, B.; Shen, Y.; Chen, Y.; Chen, X.; Wang, Y. A two-layer weight determination method for complex multi-attribute large-group decision-making experts in a linguistic environment. Inf. Fusion 2015, 23, 156–165. [Google Scholar] [CrossRef]
  26. Delbosc, A.; Gurrie, G. Using Lorenz curves to assess public transport equity. J. Transp. Geogr. 2011, 19, 1252–1259. [Google Scholar] [CrossRef]
  27. Chen, Y.; Bouferguene, A.; Shen, Y.; Al-Hussein, M. Assessing accessibility-based service effectiveness (ABSEV) and social equity for urban bus transit: A sustainability perspective. Sustain. Cities Soc. 2019, 44, 499–510. [Google Scholar] [CrossRef]
  28. Ricciardi, A.M.; Xia, J.C.; Currie, G. Exploring public transport equity between separate disadvantaged cohorts: A case study in Perth, Australia. J. Transp. Geogr. 2015, 43, 111–122. [Google Scholar] [CrossRef]
  29. Tao, Y.; Henry, K.; Zou, Q.; Zhong, X. Methods for measuring horizontal equity in health resource allocation: A comparative study. Health Econ. Rev. 2014, 4, 10. [Google Scholar] [CrossRef] [Green Version]
  30. Ben-Akiva, M.; Lerman, S. Disaggregate travel and mobility choice models and measure of accessibility. In Behavioural Travel Modeling; Routledge: London, UK, 2021; pp. 654–679. [Google Scholar]
  31. Guagliardo, M.F. Spatial accessibility of primary care: Concepts, methods and challenges. Int. J. Health Geogr. 2004, 3, 3. [Google Scholar] [CrossRef] [Green Version]
  32. Boisjoly, G.; Deboosere, R.; Wasfi, R.; Orpana, H.; Manaugh, K.; Buliung, R.; El-Geneidy, A. Measuring accessibility to hospitals by public transport: An assessment of eight Canadian metropolitan regions. J. Transp. Health 2020, 18, 100916. [Google Scholar] [CrossRef]
  33. Peeters, D.; Thomas, I. Distance predicting functions and applied location-allocation models. J. Geogr. Syst. 2000, 2, 167–184. [Google Scholar] [CrossRef]
  34. Chen, Y.; Liu, B.; Shen, Y.; Wang, X. Spatial analysis of change trend and influencing factors of total factor productivity in China’s regional construction industry. Appl. Econ. 2018, 50, 2824–2843. [Google Scholar] [CrossRef]
  35. Rey, S.J.; Montouri, B.D. US regional income convergence: A spatial econometric perspective. Reg. Stud. 1999, 33, 143–156. [Google Scholar] [CrossRef]
  36. Moran, P.A.P. The interpretation of statistical maps. J. R. Stat. Soc. Ser. B 1948, 10, 243–251. [Google Scholar] [CrossRef]
  37. Dewan, A.; Abdullah, A.Y.M.; Shogib, M.R.I.; Karim, R.; Rahman, M.M. Exploring spatial and temporal patterns of visceral leishmaniasis in endemic areas of Bangladesh. Trop. Med. Health 2017, 45, 29. [Google Scholar] [CrossRef] [PubMed] [Green Version]
  38. Graham, J.E.; Fisher, S.R.; Bergés, I.M.; Kuo, Y.F.; Ostir, G.V. Walking speed threshold for classifying walking independence in hospitalized older adults. Phys. Ther. 2010, 90, 1591–1597. [Google Scholar] [CrossRef] [PubMed] [Green Version]
  39. Jin, C.; Cheng, J.; Lu, Y.; Huang, Z.; Cao, F. Spatial inequity in access to healthcare facilities at a county level in a developing country: A case study of Deqing County, Zhejiang, China. Int. J. Equity Health 2015, 14, 67. [Google Scholar] [CrossRef] [PubMed] [Green Version]
  40. Rosero-Bixby, L. Spatial access to health care in Costa Rica and its equity: A GIS-based study. Soc. Sci. Med. 2004, 58, 1271–1284. [Google Scholar] [CrossRef] [PubMed]
  41. Martin, D.J.; Jordan, H.; Roderick, P. Taking the bus: Incorporating public transport timetable data into health care accessibility modelling. Environ. Plan. A 2008, 40, 2510–2525. [Google Scholar] [CrossRef]
Figure 1. Distribution of tertiary hospitals and the percentage of the older population in all districts of Tianjin.
Buildings 12 02107 g001
Figure 2. Example of accessibility to tertiary hospitals within regions of Tianjin: (a) Heping district, (b) Nankai district, (c) Hexi district, (d) Hebei district, (e) Hedong district, and (f) Hongqiao district.
Buildings 12 02107 g002
Figure 3. Example of accessibility to tertiary hospitals across regions of Tianjin. (a) Heping district, (b) Nankai district, (c) Hexi district, (d) Hebei district, (e) Hedong district, and (f) Hongqiao district.
Buildings 12 02107 g003
Figure 4. Social equity of accessibility to tertiary hospitals for older adults.
Buildings 12 02107 g004
Figure 5. Social equity of accessibility to tertiary hospitals for the total population.
Buildings 12 02107 g005
Table 1. Accessibility to tertiary hospitals in Tianjin.
District ( A m ) i n s i d e * Rank ( A m ) o u t s i d e * Rank ( A m ) * Rank
Hexi110.4410511
Heping0.658120.971020.71542
Hebei0.557430.416560.57183
Hongqiao0.452440.623530.48814
Hedong0.446850.583640.47935
Beichen0.404760.128970.40066
Nankai0.20287110.27957
Wuqing0.104880.0185110.10258
Xiqing0.027490.110880.03579
Jinnan0.0240100.0613100.028311
Dongli0.0266110.096390.030610
Binhai0.0218120.0111130.021912
Jinghai0130.0148120.001213
Ninghe0130.0106140.000914
Baodi0130.0069150.000615
Jizhou013016016
Table 2. CV and Moran’s I of the accessibility to tertiary hospitals.
CVMoran’s I
Accessibility within regions1.2060.314 ***
Accessibility across regions1.2000.550 ***
Overall accessibility1.1710.370 ***
Note: *** significant at 1%.
Publisher’s Note: MDPI stays neutral with regard to jurisdictional claims in published maps and institutional affiliations.

