Article

Investigation of Edge Computing in Computer Vision-Based Construction Resource Detection

1
School of Civil Engineering and Architecture, Zhejiang University of Science and Technology, Hangzhou 310023, China
2
Department of Building and Real Estate, The Hong Kong Polytechnic University, Hong Kong, China
*
Author to whom correspondence should be addressed.
Buildings 2022, 12(12), 2167; https://doi.org/10.3390/buildings12122167
Submission received: 1 November 2022 / Revised: 4 December 2022 / Accepted: 5 December 2022 / Published: 8 December 2022

Abstract

:
The Internet of Things (IoT), including sensors, computer vision (CV), robotics, and visual reality technologies, is widely used in the construction industry to facilitate construction management in productivity and safety control. The application of such technologies in real construction projects requires high-quality computing resources, the network for data transferring, a near real-time response, geographical closeness to the smart environments, etc. Most existing research has focused on the first step of method development and has neglected the further deployment step. For example, when using CV-based methods for construction site monitoring, internet-connected cameras must transmit large quantities of high-quality data to the central office, which may be located thousands of miles away. Not only the quality may suffer due to latency, but the wideband cost can be astronomical. Edge computing devices and systems help solve this problem by providing a local source to process the data. The goal of this study is to embed the CV-based method into devices and thus to develop a practical edge computing system for vision-based construction resource detection, which can provide automatic construction with high-quality and more applicable service. Specifically, this study first developed a CV-based hardhat color detection model to manage workers in different tasks. Then, the model was embedded into a Raspberry Pi microcomputer mainboard for video data processing, and the performance was compared with the local computer to validate the feasibility of the proposed method.

1. Introduction

Construction engineering is commonly known as a complex process, which requires a huge amount of manual labor for monitoring and management. Human maintenance is costly, time-consuming, and error-prone, which is inefficient. Therefore, it is important to speed up the processes, improve the productivity, and reduce the safety risks for construction [1]. In order to increase the efficiency of the construction management, the Internet of Things (IoT) has been developed in the past years to increase the automation of construction management. For instance, sensor-based methods have been used for construction object positioning, proximity calculation, and pose estimation [2,3]; computer-vision-based methods have been used for construction object detection, tracking, and activity recognition [4,5,6]; robotic methods have been used for automatic structure and site environment inspections [7]. Among the current IoT methods, computer-vision (CV)-based methods have been widely adopted with the advantages of a low cost and simple integration in construction automation fields [1].
Vision-based data, such as images and videos, can provide the construction manager with useful information for project management and control. By observing continuously recorded site surveillance videos, construction managers can identify safety issues, productivity of the workers, and equipment during the construction processes (e.g., workers’ hardhats, equipment productivity, etc.) [4,5,8,9]. CV-based methods have been developed by researchers to facilitate construction management procedures by providing automatic productivity and safety control methods for construction managers. Due to their easy deployment in the dynamic, complex construction environment and ability to adapt to monitoring a variety of construction objects, CV-based methods have been used to monitor construction problems in numerous areas of construction engineering. Among them, some researchers have used CV-based methods to detect personal protective equipment (PPE) to ensure the safety protection of workers. For example, Wu et al. [10] developed a one-stage convolutional neural network (CNN) model for hardhat-wearing detection, and an 83.89% precision was achieved on the proposed test dataset. Nath et al. [11] improved the “You Look Only Once” (YOLO-v3) [12] model to detect hardhat and vest compliance to prevent injuries and fatalities for workers, and a 72.3% mean average precision was achieved through testing on real-world scenarios. Ding et al. [13] combined Long Short-Term Memory (LSTM) [14] with CNNs to recognize unsafe behavior (e.g., climbing, backward-facing, and reaching far) of workers with 92% accuracy, tested on 50 video clips. Xiao et al. [4] proposed a CV-based image augmentation method to track construction equipment in nighttime environments, which can help to avoid equipment-related accidents when working in poor light conditions. Some studies [15,16,17,18] have applied CV-based methods for productivity monitoring. In order to monitor workers’ working processes, Luo [15,16] used CNNs to recognize 16 classes of worker activities. The worker’s activity recognition achieved 80.5% accuracy. Kim and Chi [17] combined LSTM with CNNs to recognize the digging, loading, and swinging activities of excavators, which achieved 90.9% accuracy. Similarly, Chen et al. [18] applied a spatial–temporal CNN model to recognize activities of excavators, and accordingly calculated the earthmoving productivity of the excavator.
Unfortunately, CV-based methods using artificial intelligence algorithms, which require high-quality computation performance [15,16,17,18]. Therefore, CV-based automatic construction methods require extensive hardware and software development efforts, which is a major obstacle for the wide application of such advanced methods in real construction project management. For example, in order to process visual data collected from cameras and to provide feedback to the construction manager, significant network, processing, and memory resources are required. Especially when there are multiple cameras transmitting live videos, the quality of the video may suffer from time delay [19]. Moreover, the computation capacity of the server or local computer in the management office may not be sufficient to deal with a large volume of video data [20,21]. Traditional servers and local computing are no longer sufficient for the diverse needs of today’s automated construction methods, so edge computing methods have emerged.
Edge computing is a new computing paradigm, which performs computations close to the metadata resource (e.g., mobile devices or sensors) and at the edge of the network [22]. The main difference between edge computing and cloud computing were summarized by Cao et al., as shown in Table 1 [20]. Compared with cloud computing, edge computing is closer to the data source; thus, data processing and storage tasks can be carried out at the edge of the network, which reduces the data transmission time and local computing pressure. It provides users with fast response services in a variety of application scenarios, such as intelligent manufacturing, automatic driving, video monitoring, and location answering [20]. Typically, the character of rapid feedback in edge computing is important for safety control in construction site monitoring, which requires information updates in real time. Beyond the data transmitting and computing efficiency, edge computing can also avoid security and privacy issues. Since data do not have to be totally uploaded to the cloud, the risk from the transmitting process can be avoided [19,21]. Moreover, the privacy of construction companies with specific construction technology and trade may also be protected.
With the development of the IoT and urgency of the application of smart construction and considering the data processing and transmitting efficiency, security, and privacy protection, edge computing models are urgently needed. Existing CV-based methods [15,16,17,18] for construction monitoring have mainly used traditional local computing, which requires extensive development efforts and high-performance computing resources. Such requirements limited the application of CV-based methods in real construction projects because of the high costs and intensive human maintenance. To address these limitations, this research aimed to propose an edge-computing-based method to apply CV-based methods for workers’ hardhat detection.
The objective of this research was to investigate the feasibility of edge computing in CV-based construction resource management. First, a YOLO-v5 [12] model was trained and tested to detect if workers were wearing hardhats or not and to classify four colors (yellow, red, blue, and white) of the hardhat. Then, the proposed YOLO-v5 [12] hardhat color detection model was embedded on the edge computing device, a Raspberry Pi (R. Pi) [23], to detect the different hardhat colors of workers. At last, the detection performances of the R. Pi and local computer were compared to validate the feasibility of embedding the hardhat color model on a single-board computer board for edge computing use.

2. Materials and Methods

Based on the aforementioned objectives, the framework of this research was as follows: first, a hardhat color detection dataset was annotated. Then, a YOLO-v5 [12] model was trained and tested on a local computer to detect workers’ hardhats. Accordingly, the YOLO-v5 detection model was transferred and embedded on an R. Pi 4B single-board computer to perform the edge computing task. Finally, the performance of the YOLO-v5 model on both the computer and R. Pi 4B were compared and discussed in detail to verify the possibility of using edge computing for CV-based automatic construction management.

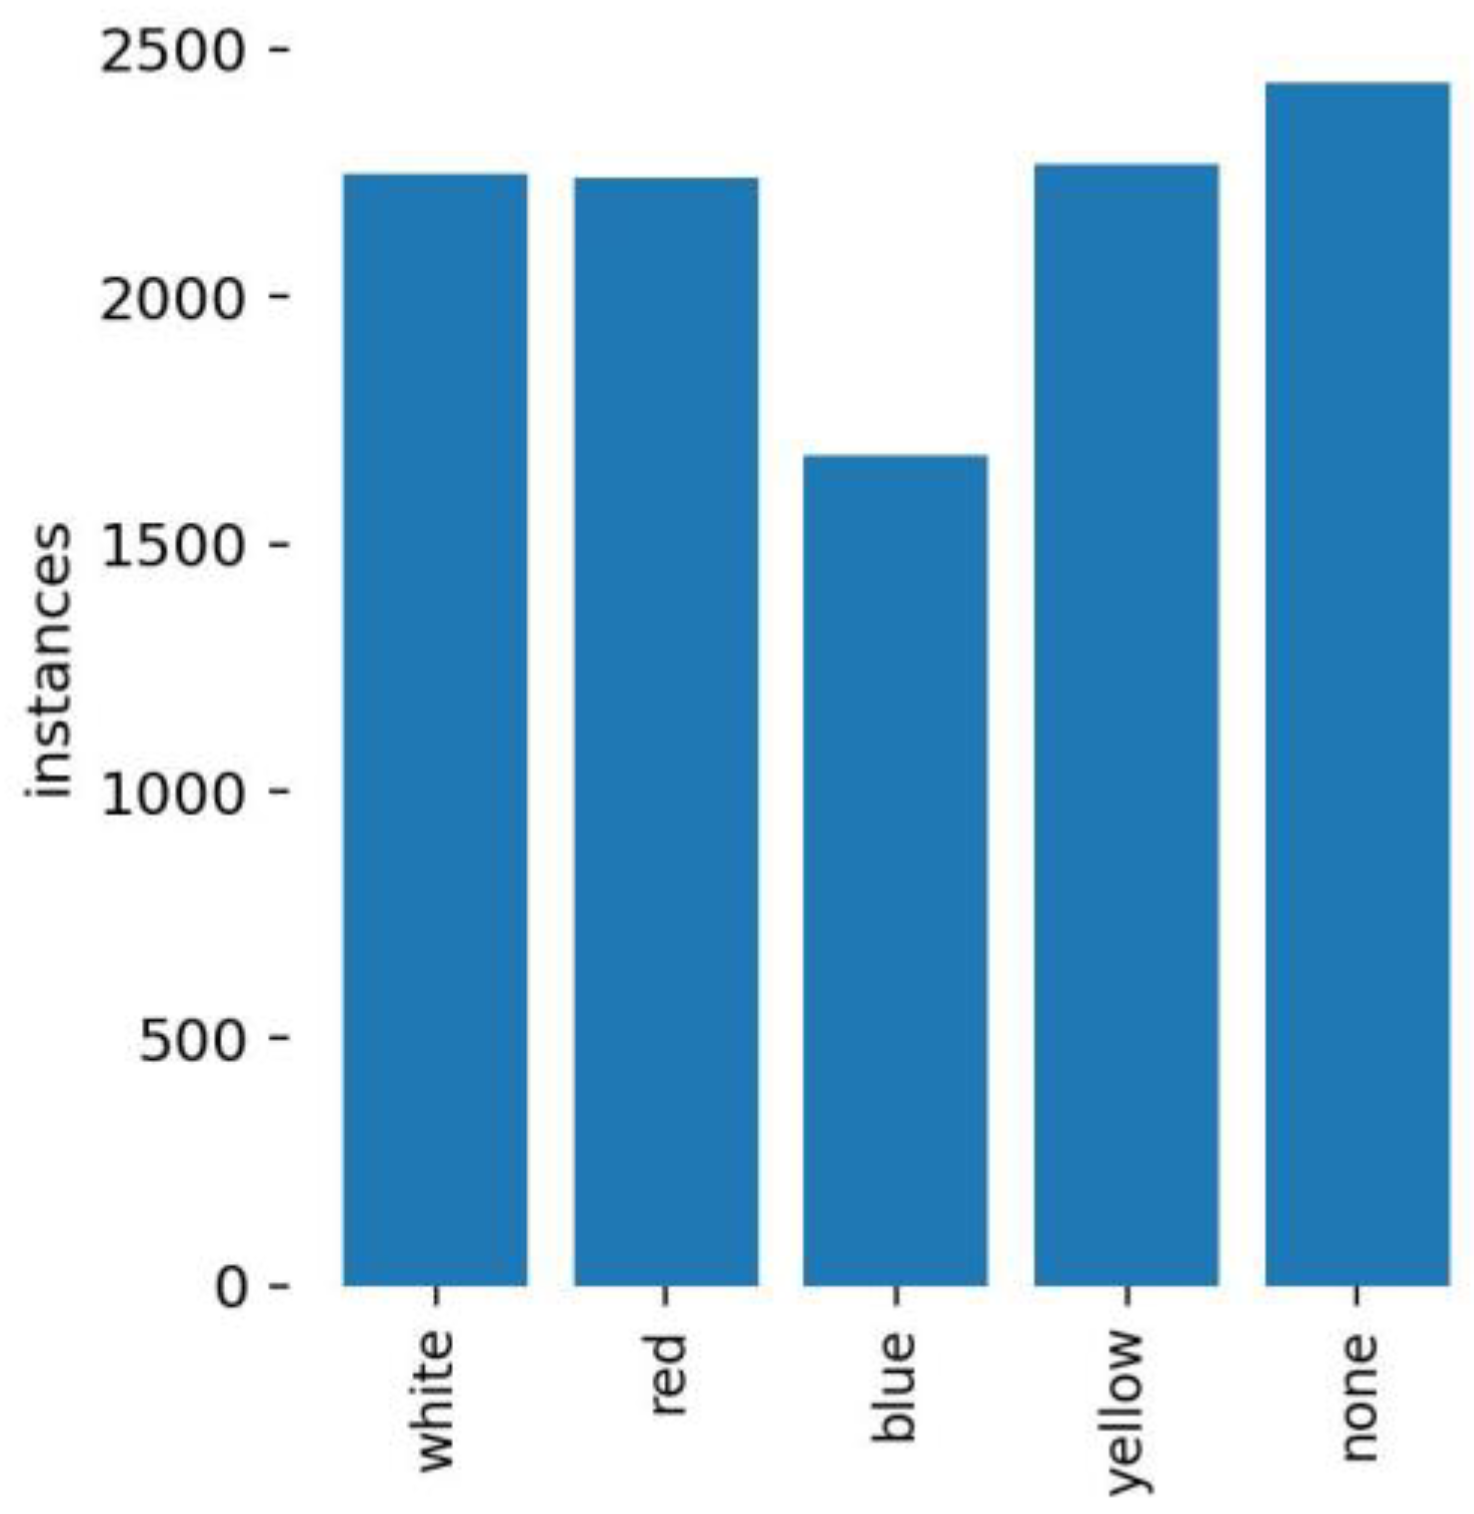
2.1. Hardhat Detection

The purpose of this section was to train a hardhat color detection model, which could both identify if a worker wore a hardhat and what the color of the hardhat was. In construction projects, workers with different tasks usually wear hardhats of different colors. By detecting the color of the hardhat, the project manager can easily check whether the workers are working within their scope of responsibility. The YOLO model was selected to train the hardhat color detection model due to its extraordinary performances in variable construction object detection tasks [1,6,12,24]. YOLO-v5 holds the best performance among current YOLO models [12,25,26]. The architecture of the YOLO-v5 [12] model is shown in Figure 1, which consists of three components: (i) backbone: cross stage partial network (CSPDarknet); (ii) neck: path aggregation network (PANet); and (iii) head: YOLO layer. The images were initially put into CSPDarknet for feature extraction. Accordingly, the features were fed into PANet, which adopted a feature pyramid network with an enhanced bottom–up path to improve the detection performance of dealing with small-scale objects. Then, the YOLO layer generated 3 types of feature maps ( 18 × 18 ,   36 × 36 ,   72 × 72 ) for multiple-scale detection and the outputs of the object detection results [23].
To train and evaluate the YOLO-v5 object detector, an annotated dataset that contained RGB (red, green, and blue) images were collected and manually annotated using LabelImg [27]. We used 3174 images from a dataset published by Wu et al. [9], and all the raw images were reannotated with five labels which were non-, yellow, blue, red, and white hardhat. The distribution of each label in the dataset is shown in Figure 2. In the training step, the dataset was separated into training and testing data, which contained 70% of the dataset (2204 images) used for training data and 30% (970 images) for testing.

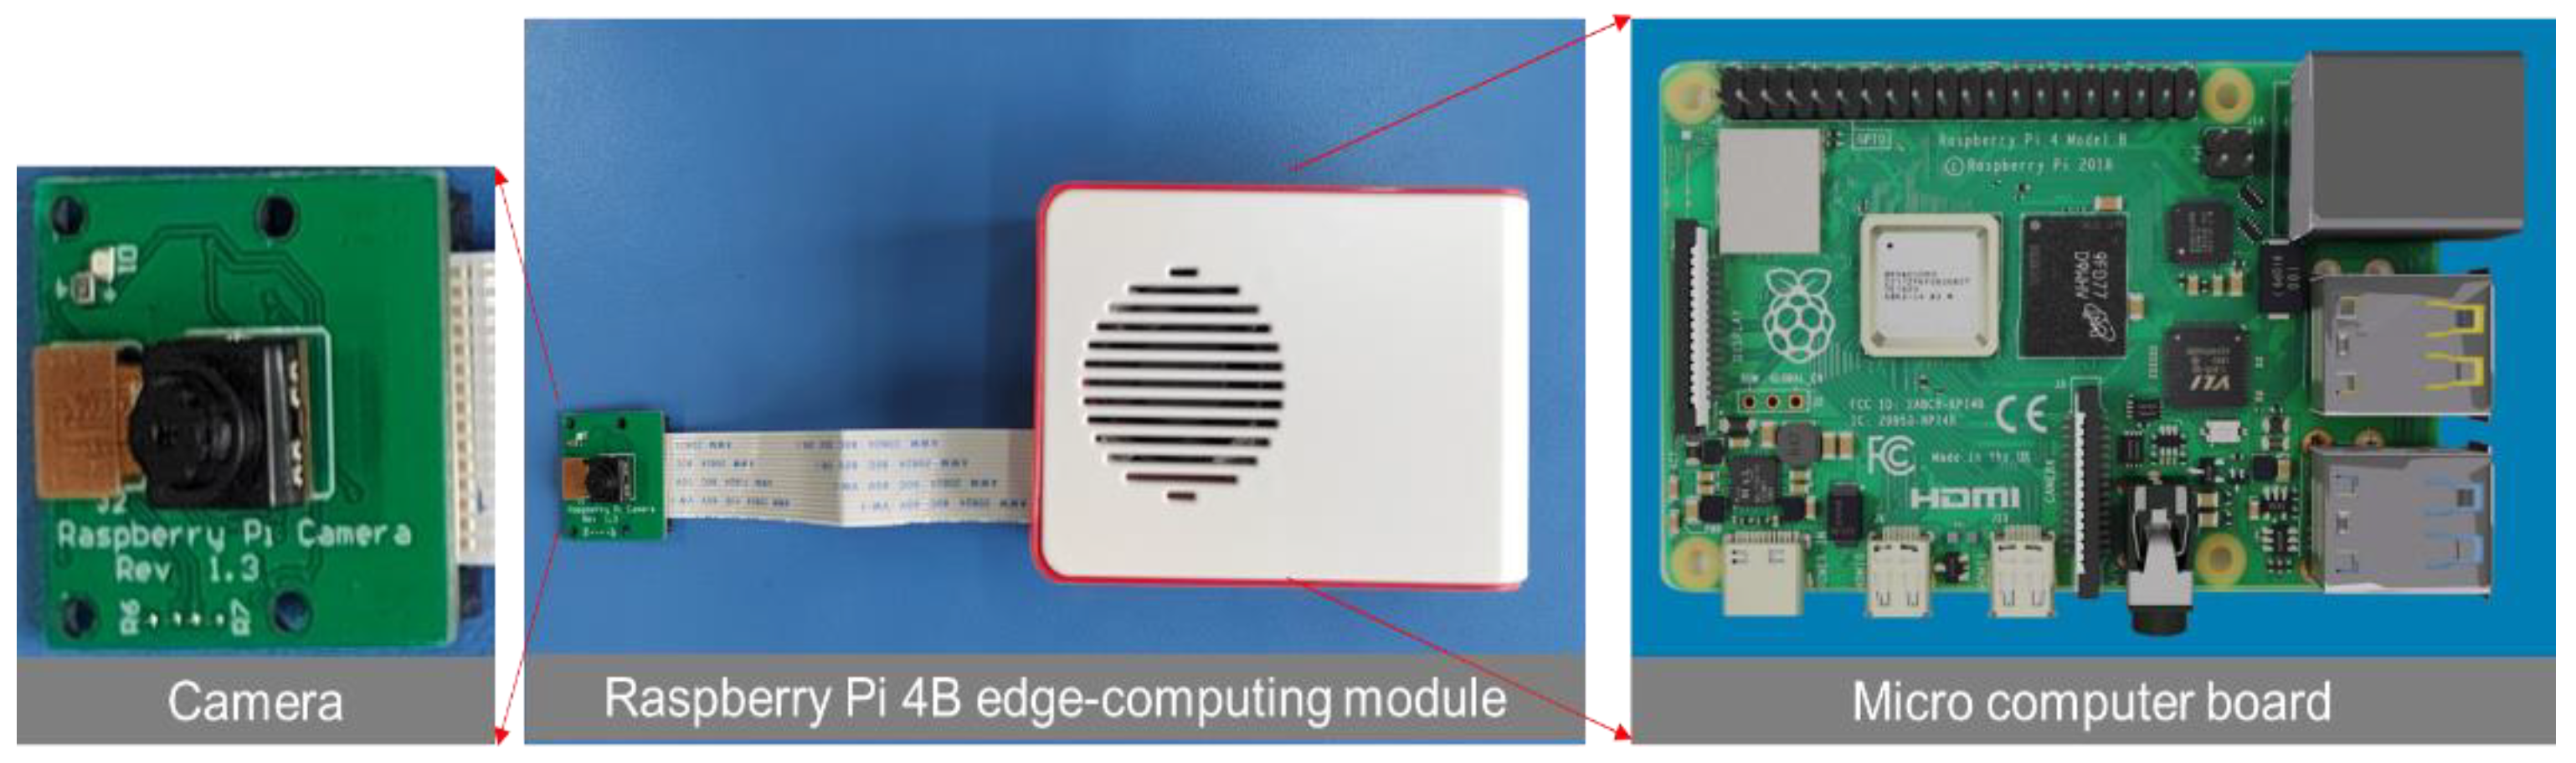
2.2. Edge Computing Device Selection

An R. Pi is a series of small single-board computers, which can perform computing tasks as a standard high-performance computer [28]. It is ideal as an embedded device of edge computing because of its tiny size, low cost, modularity, and open design. In this study, the latest R. Pi 4B [23] version was selected for testing the performance of edge computing. Table 2 summarizes the main technical specifications of an R. Pi 4B together with the local computer that was used in this study. The size of an R. Pi 4B [23] is 85 × 56 mm and is equipped with a 1.5 GHZ 64-bit quad core ARM Cortex-A72 CPU [29] and a Broadcom VideoCore VI@500 MHz GPU [30]. The local computer had a NVIDIA GeForce GTX 1660 graphics card [31]. In order to capture the video with the edge computing device, a camera was attached to the R. Pi 4B [23]. The R. Pi 4B device used for edge computing is shown in Figure 3.

2.3. Detection Model Embedding

Even though an R. Pi can process basic computer tasks, it is still difficult for it to handle computationally intensive tasks like the local computer. To accelerate the processing time, the proposed YOLO-v5 [12] hardhat color detection model was optimized with OpenVINO [33]. OpenVINO is an open-source toolkit for optimizing and developing AI inferences, which can boost deep learning performance and reduce resource demands from the edge to the cloud [33]. In this study, first, the YOLO-v5 [12] hardhat color detection model was trained on a local computer. Second, the model was transferred to the YOLO-V5 [12] model with OpenVINO [33], then deployed to the R. Pi 4B device [23].

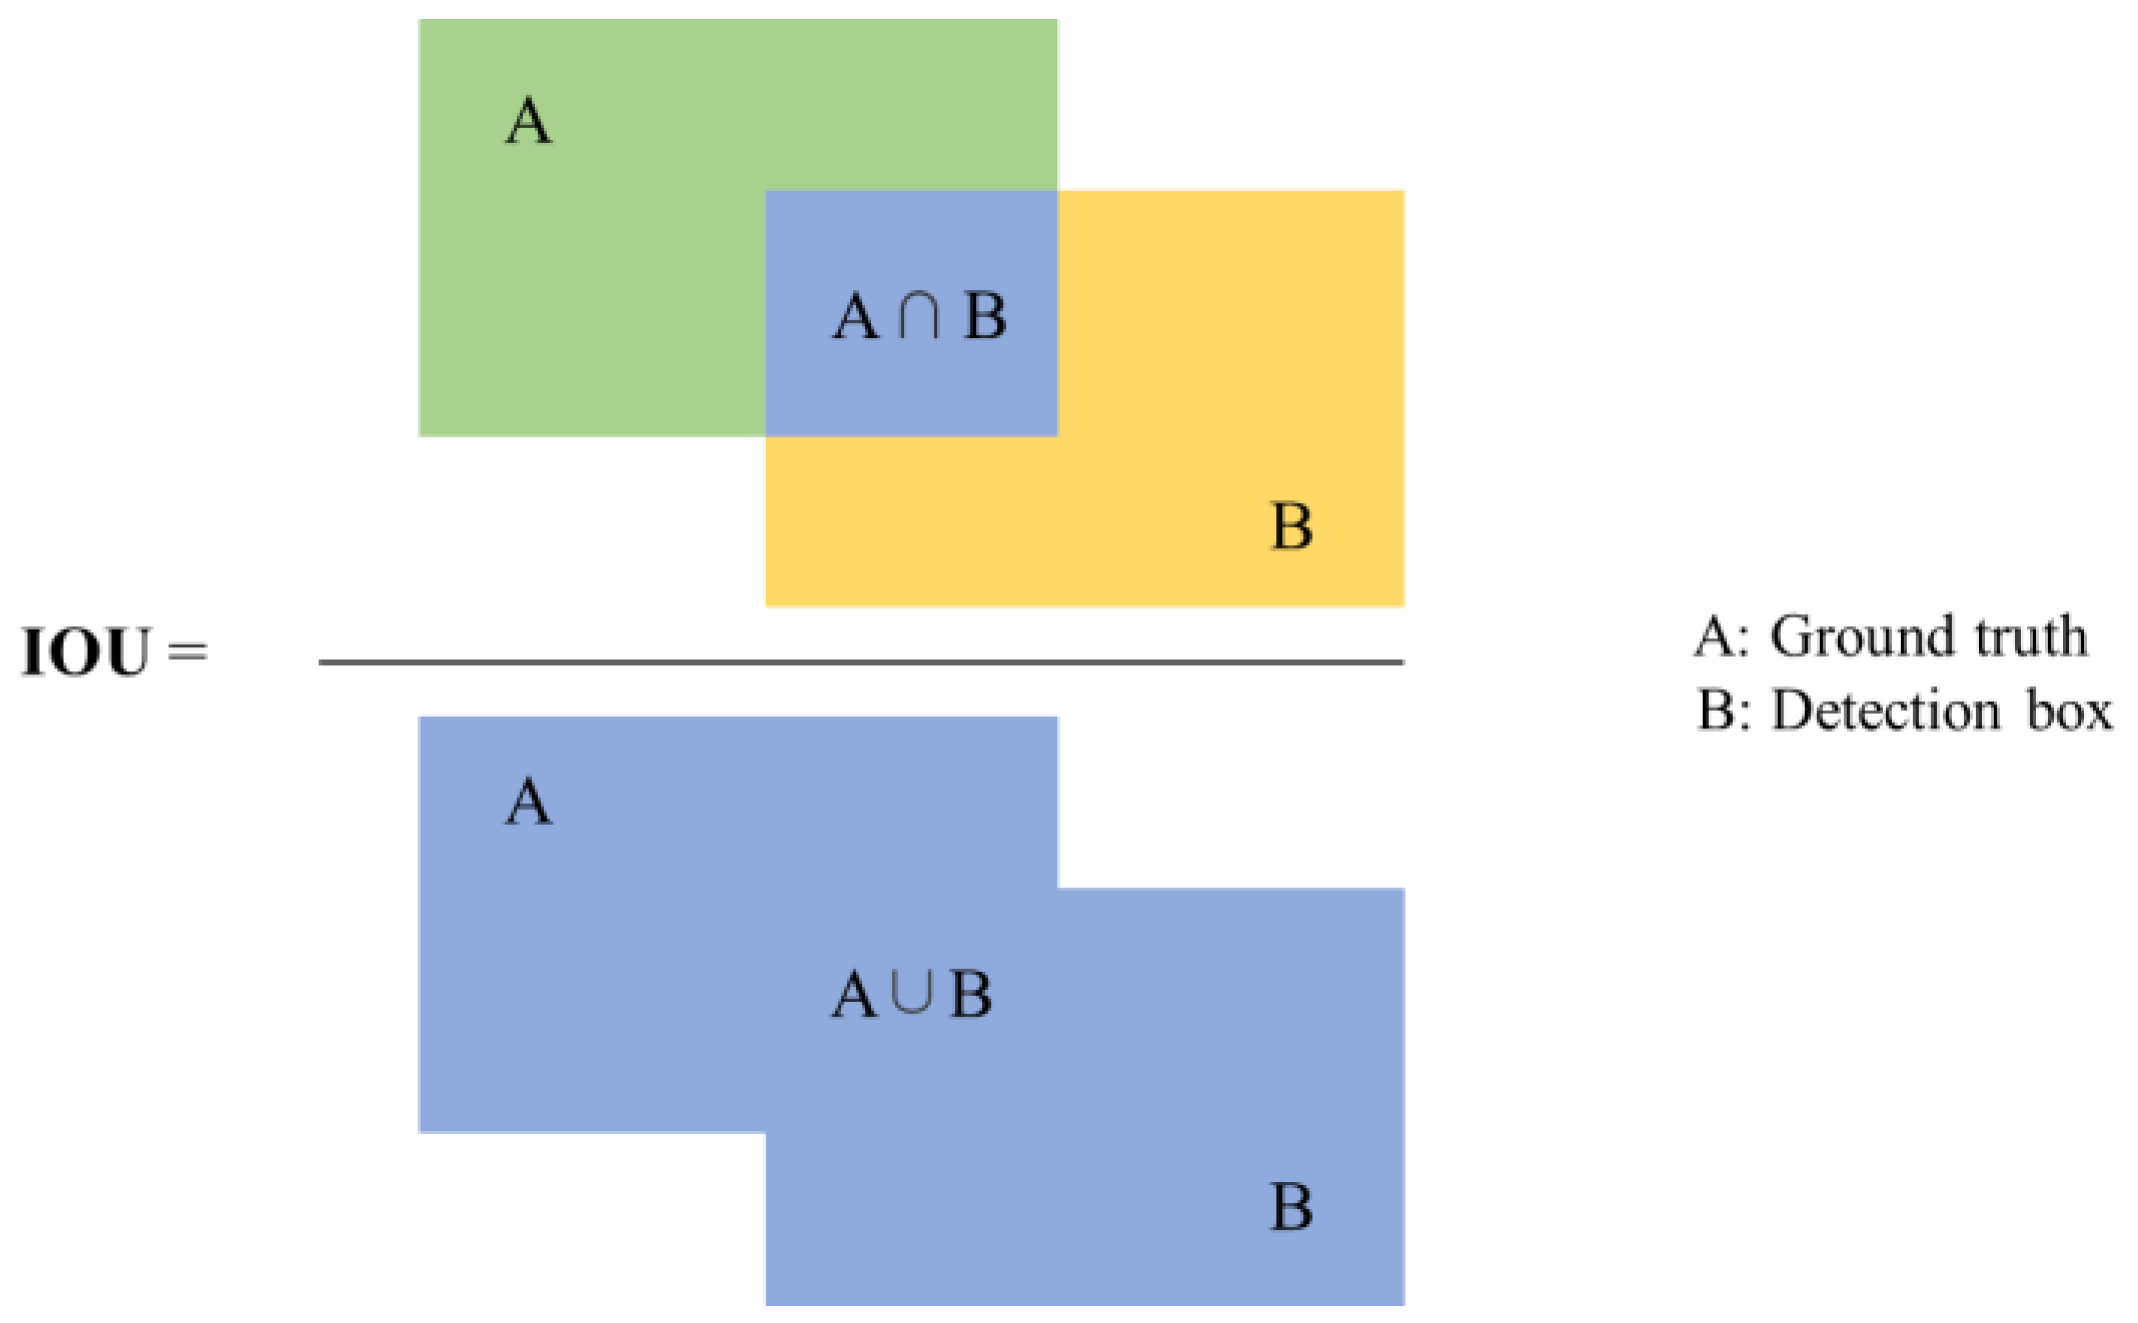
2.4. Evaluation Criteria and Strategies

The mean average precision metric (mAP) was used to validate the performance of the hardhat detection model in this study. The mAP is a standard indicator that is commonly used to measure the performance of object detection models [34,35]. Before calculating the mAP value [1], intersection-over-union (IoU) [1] should be calculated. IoU is a common criterion for evaluating the coincidence degree between predicting the bounding box and the ground truth bounding box. The calculation process of the IoU value is shown in Figure 4, where A is the area of the ground truth, and B is the area of the detection box. Only if the IoU [1] value is larger than 0.5 will the object be regarded as correctly detected. To measure the classification task, the common criteria, precision and recall values, were calculated with Equations (1) and (2) [18], respectively. Specifically, TP is true positive, which represents that the predicted bounding box is valid (IoU > 0.5), and the category of the object is the same as the ground truth [18]. If at least one of these two indicators are wrongly predicted, the detection result is considered as FP, which is a false positive [18]. FN is false negative, which represents that the predicted bounding box is not sufficiently overlapping with ground truth box [18]:
P r e c i s i o n = T P T P + F P
R e c a l l = T P T P + F N
After obtaining the precision and recall values, a precision–recall (PR) curve can be drawn with precision as the vertical axis and recall as the horizontal axis [1]. Then, the area under the curve (AUC) can be calculated with the 11-point interpolation method, which divides the recall value into 11 parts. By separately calculating the area of each part, the AP value can be obtained, as shown in Equation (3) [1]. Accordingly, the mAP value was calculated with Equation (4) based on the average values of all the types of detection objects [1]:
A P = 1 11 R e c a l l i P r e c i s i o n ( R e c a l l i )
m A P = 1 N k = 1 N A P k
where,   A P k is the AP of class k, and N is the number of the objects’ class [1].

3. Results

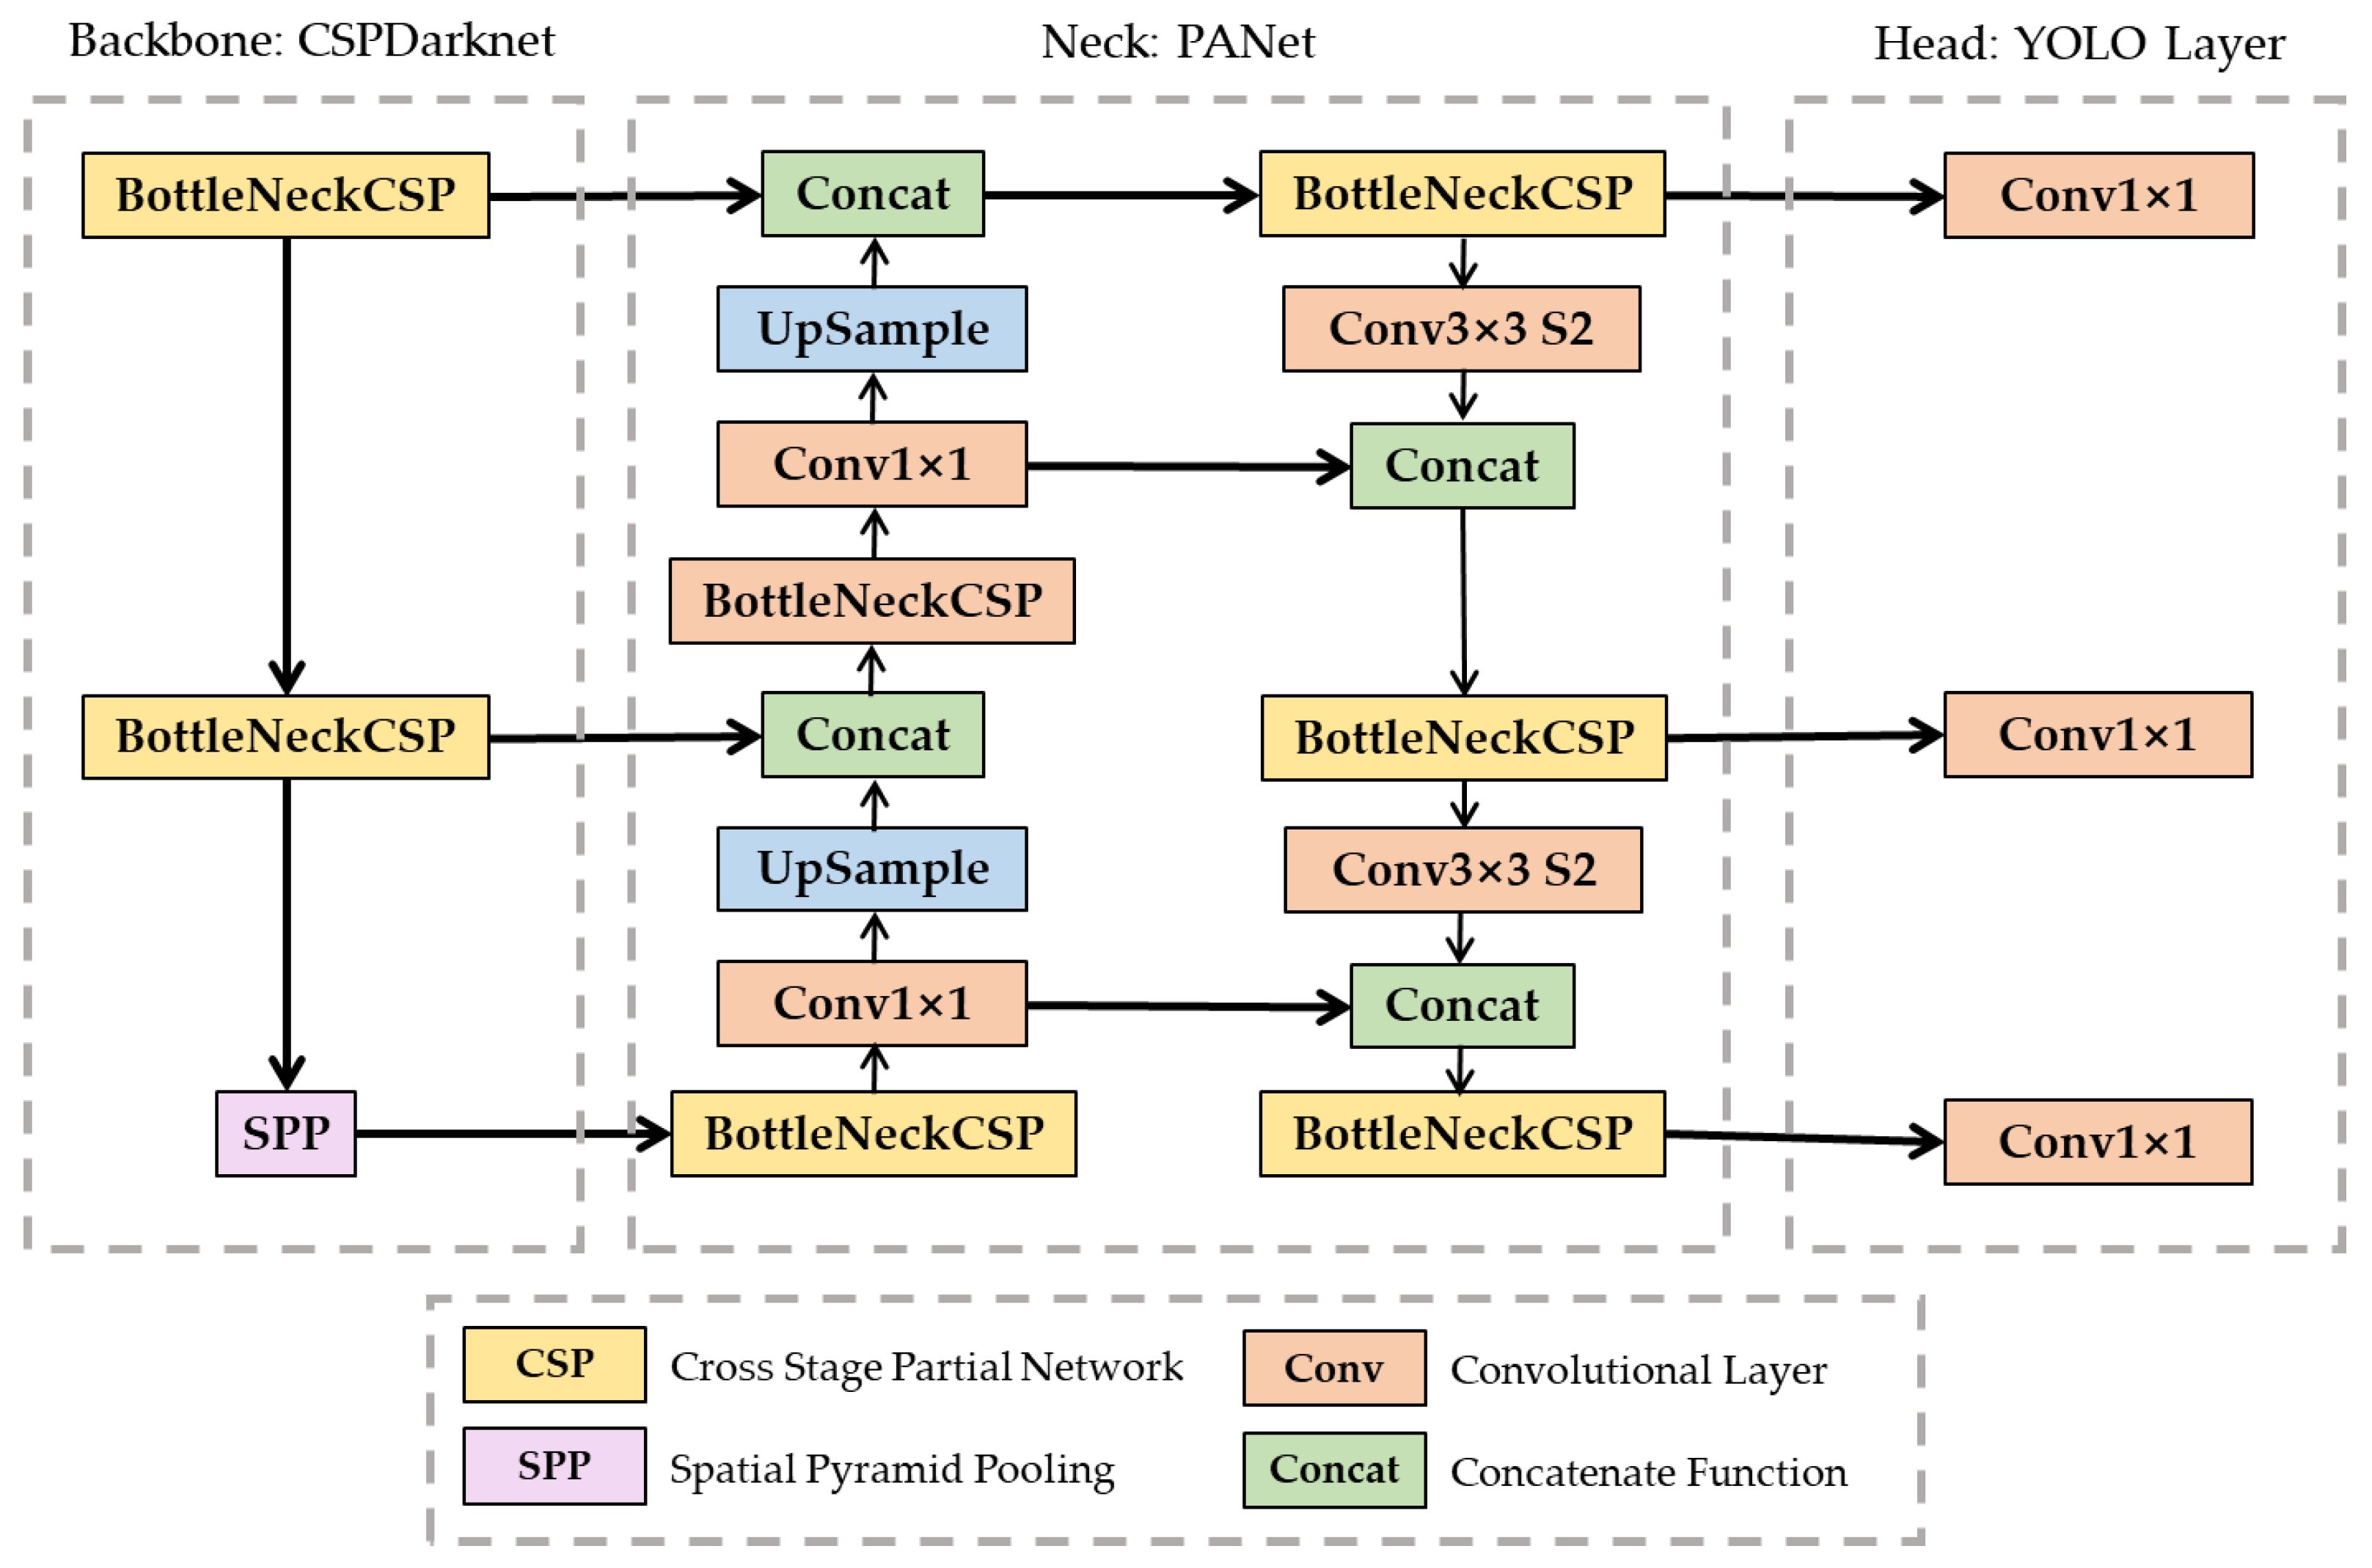
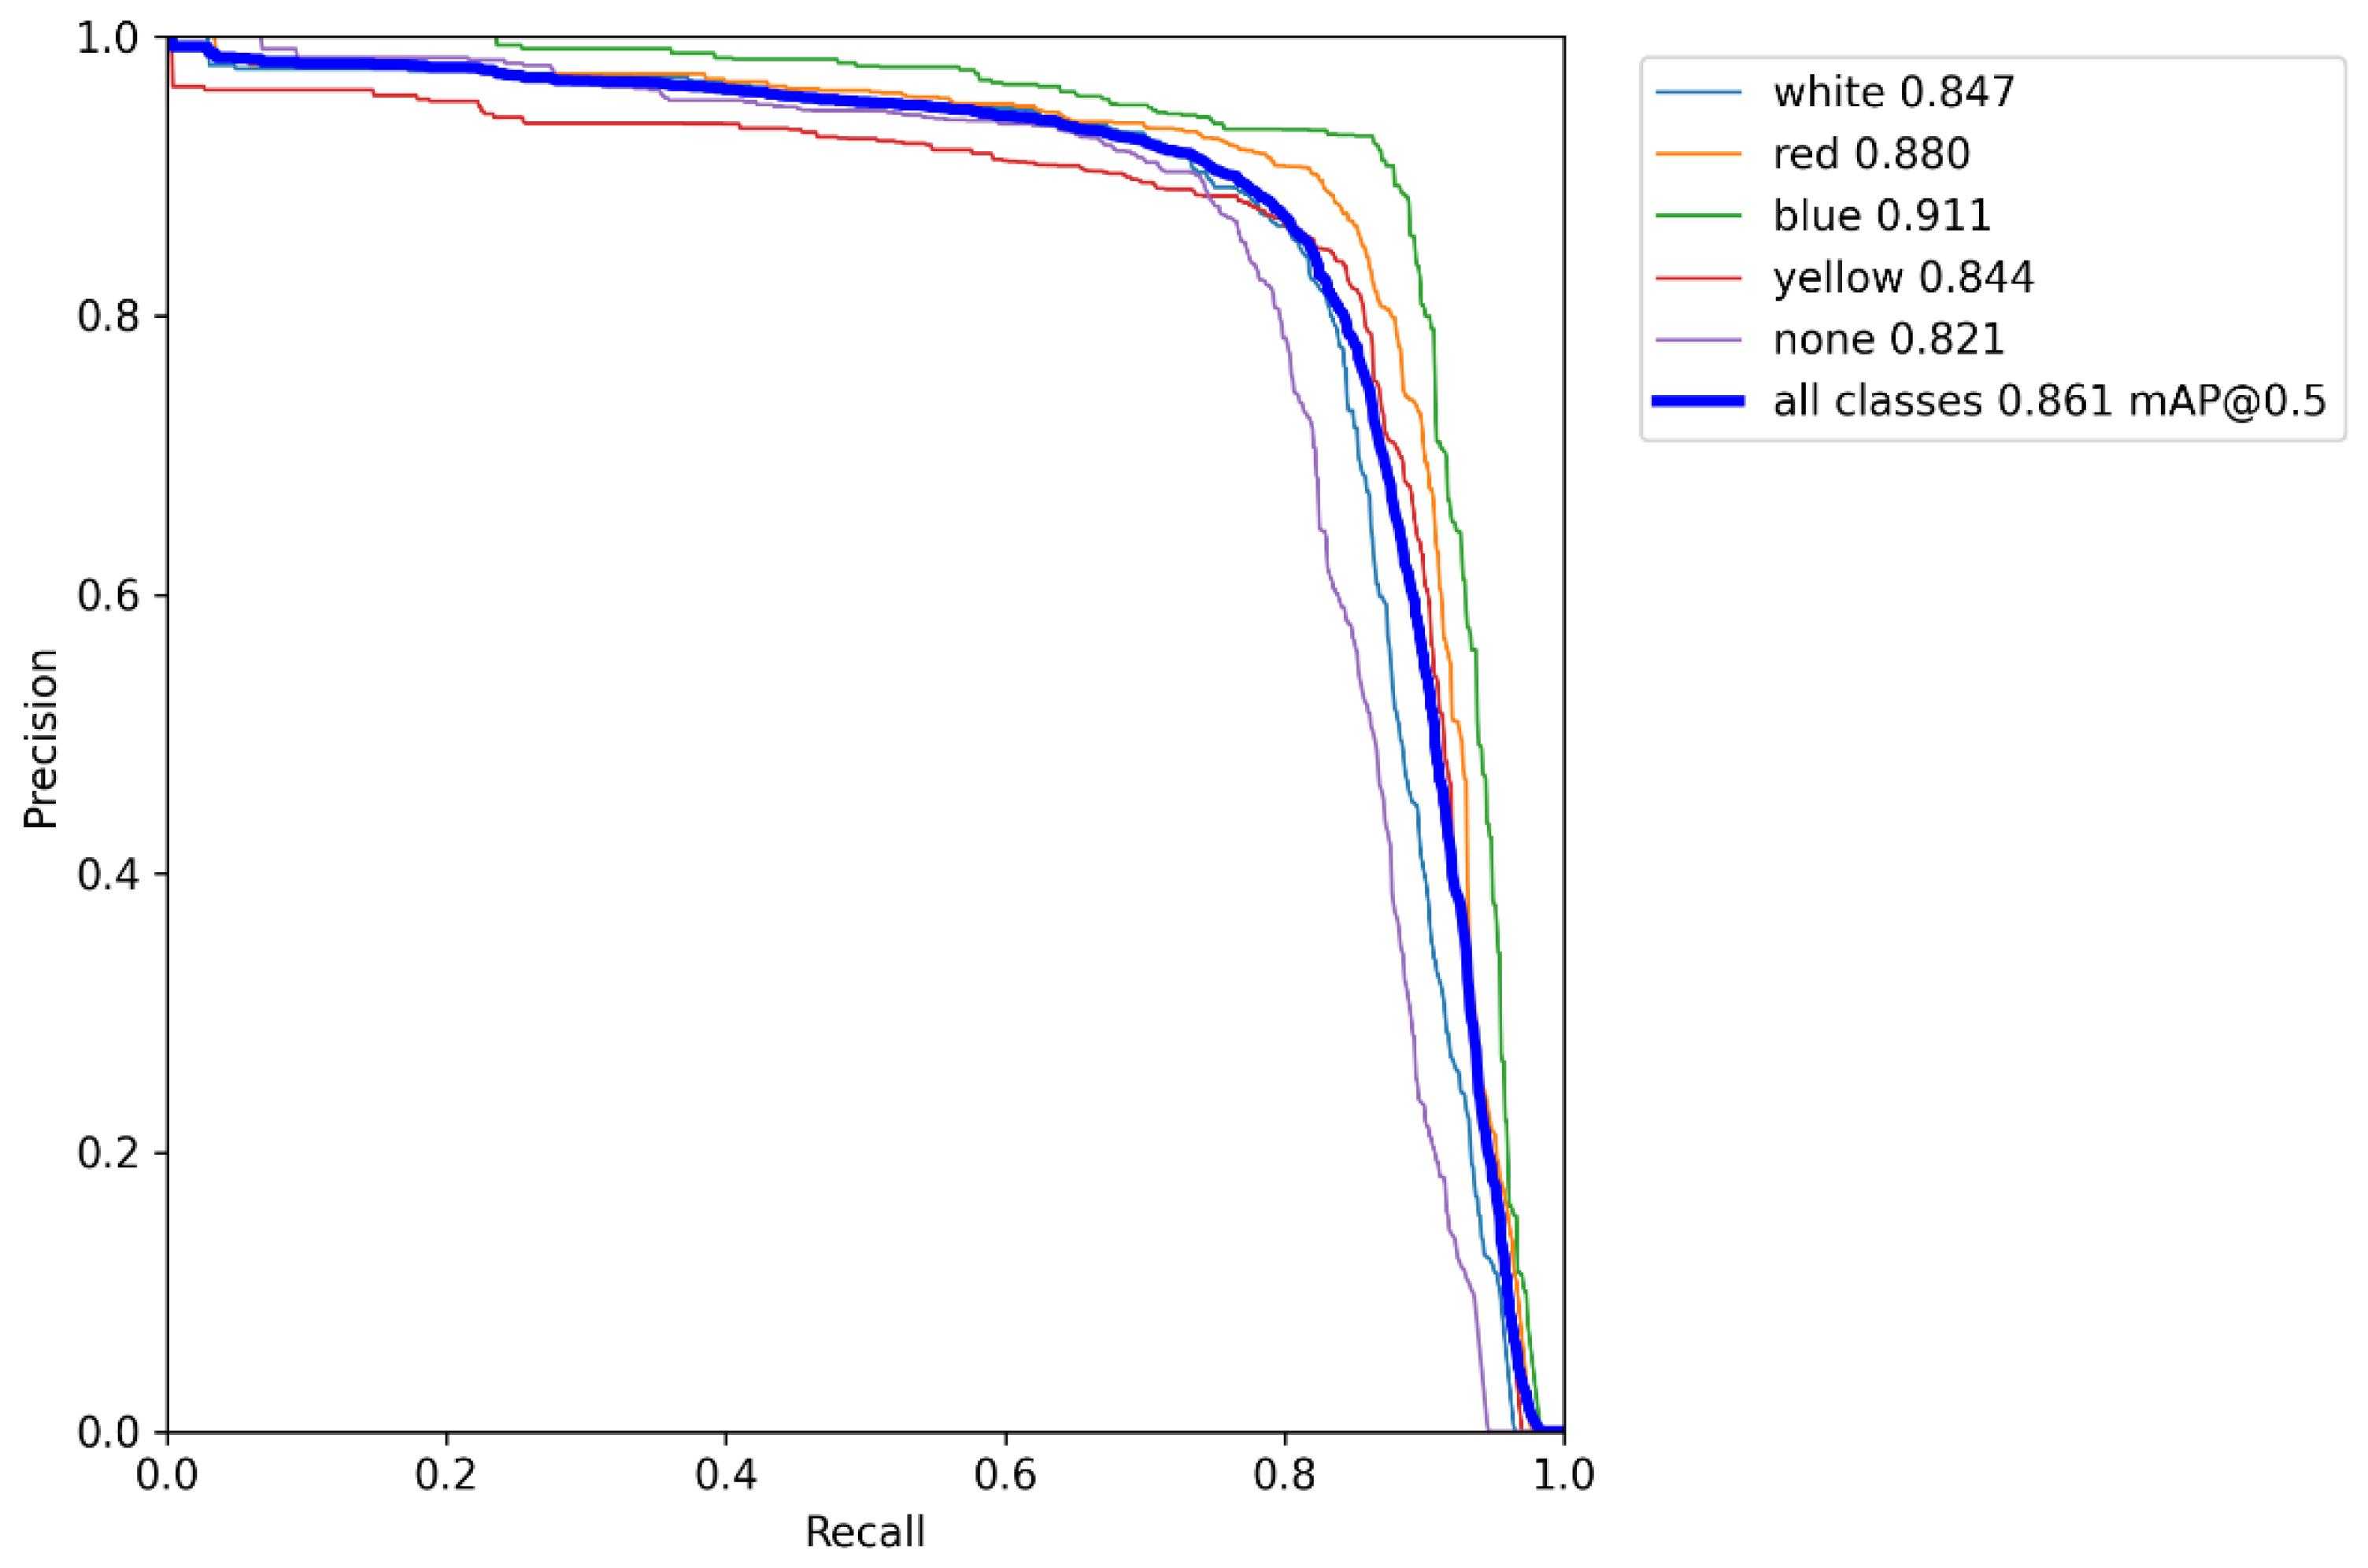
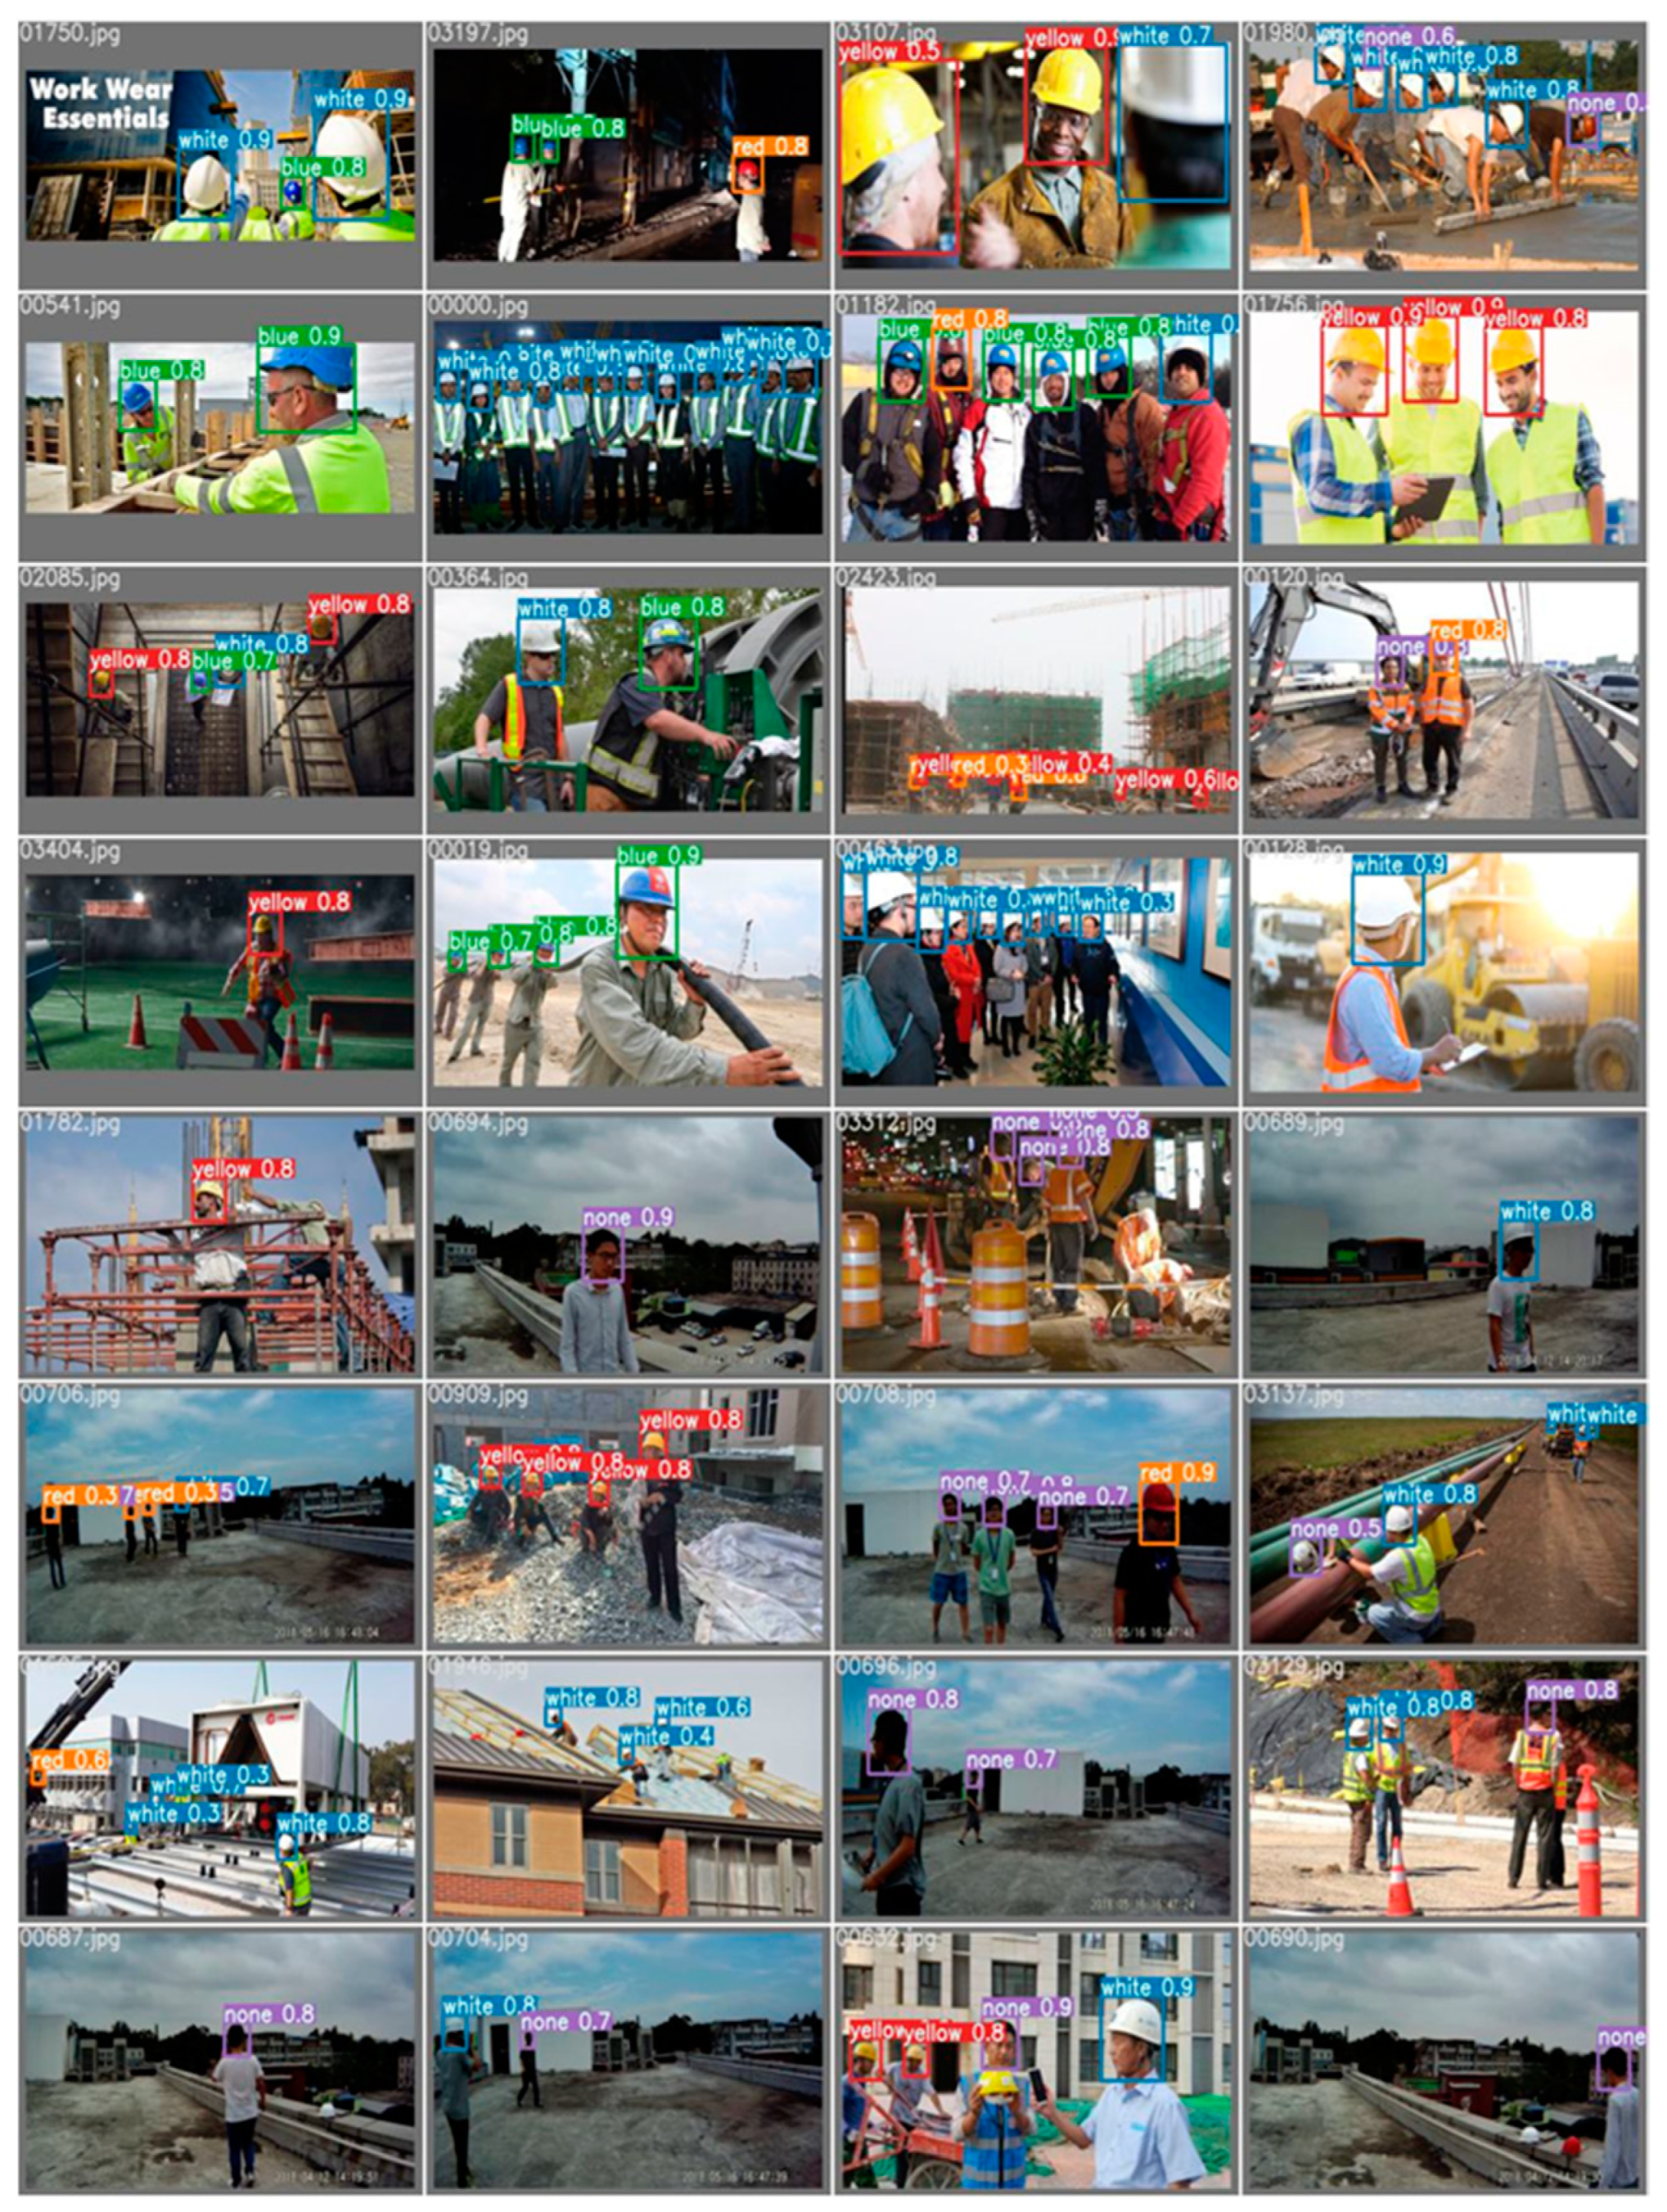
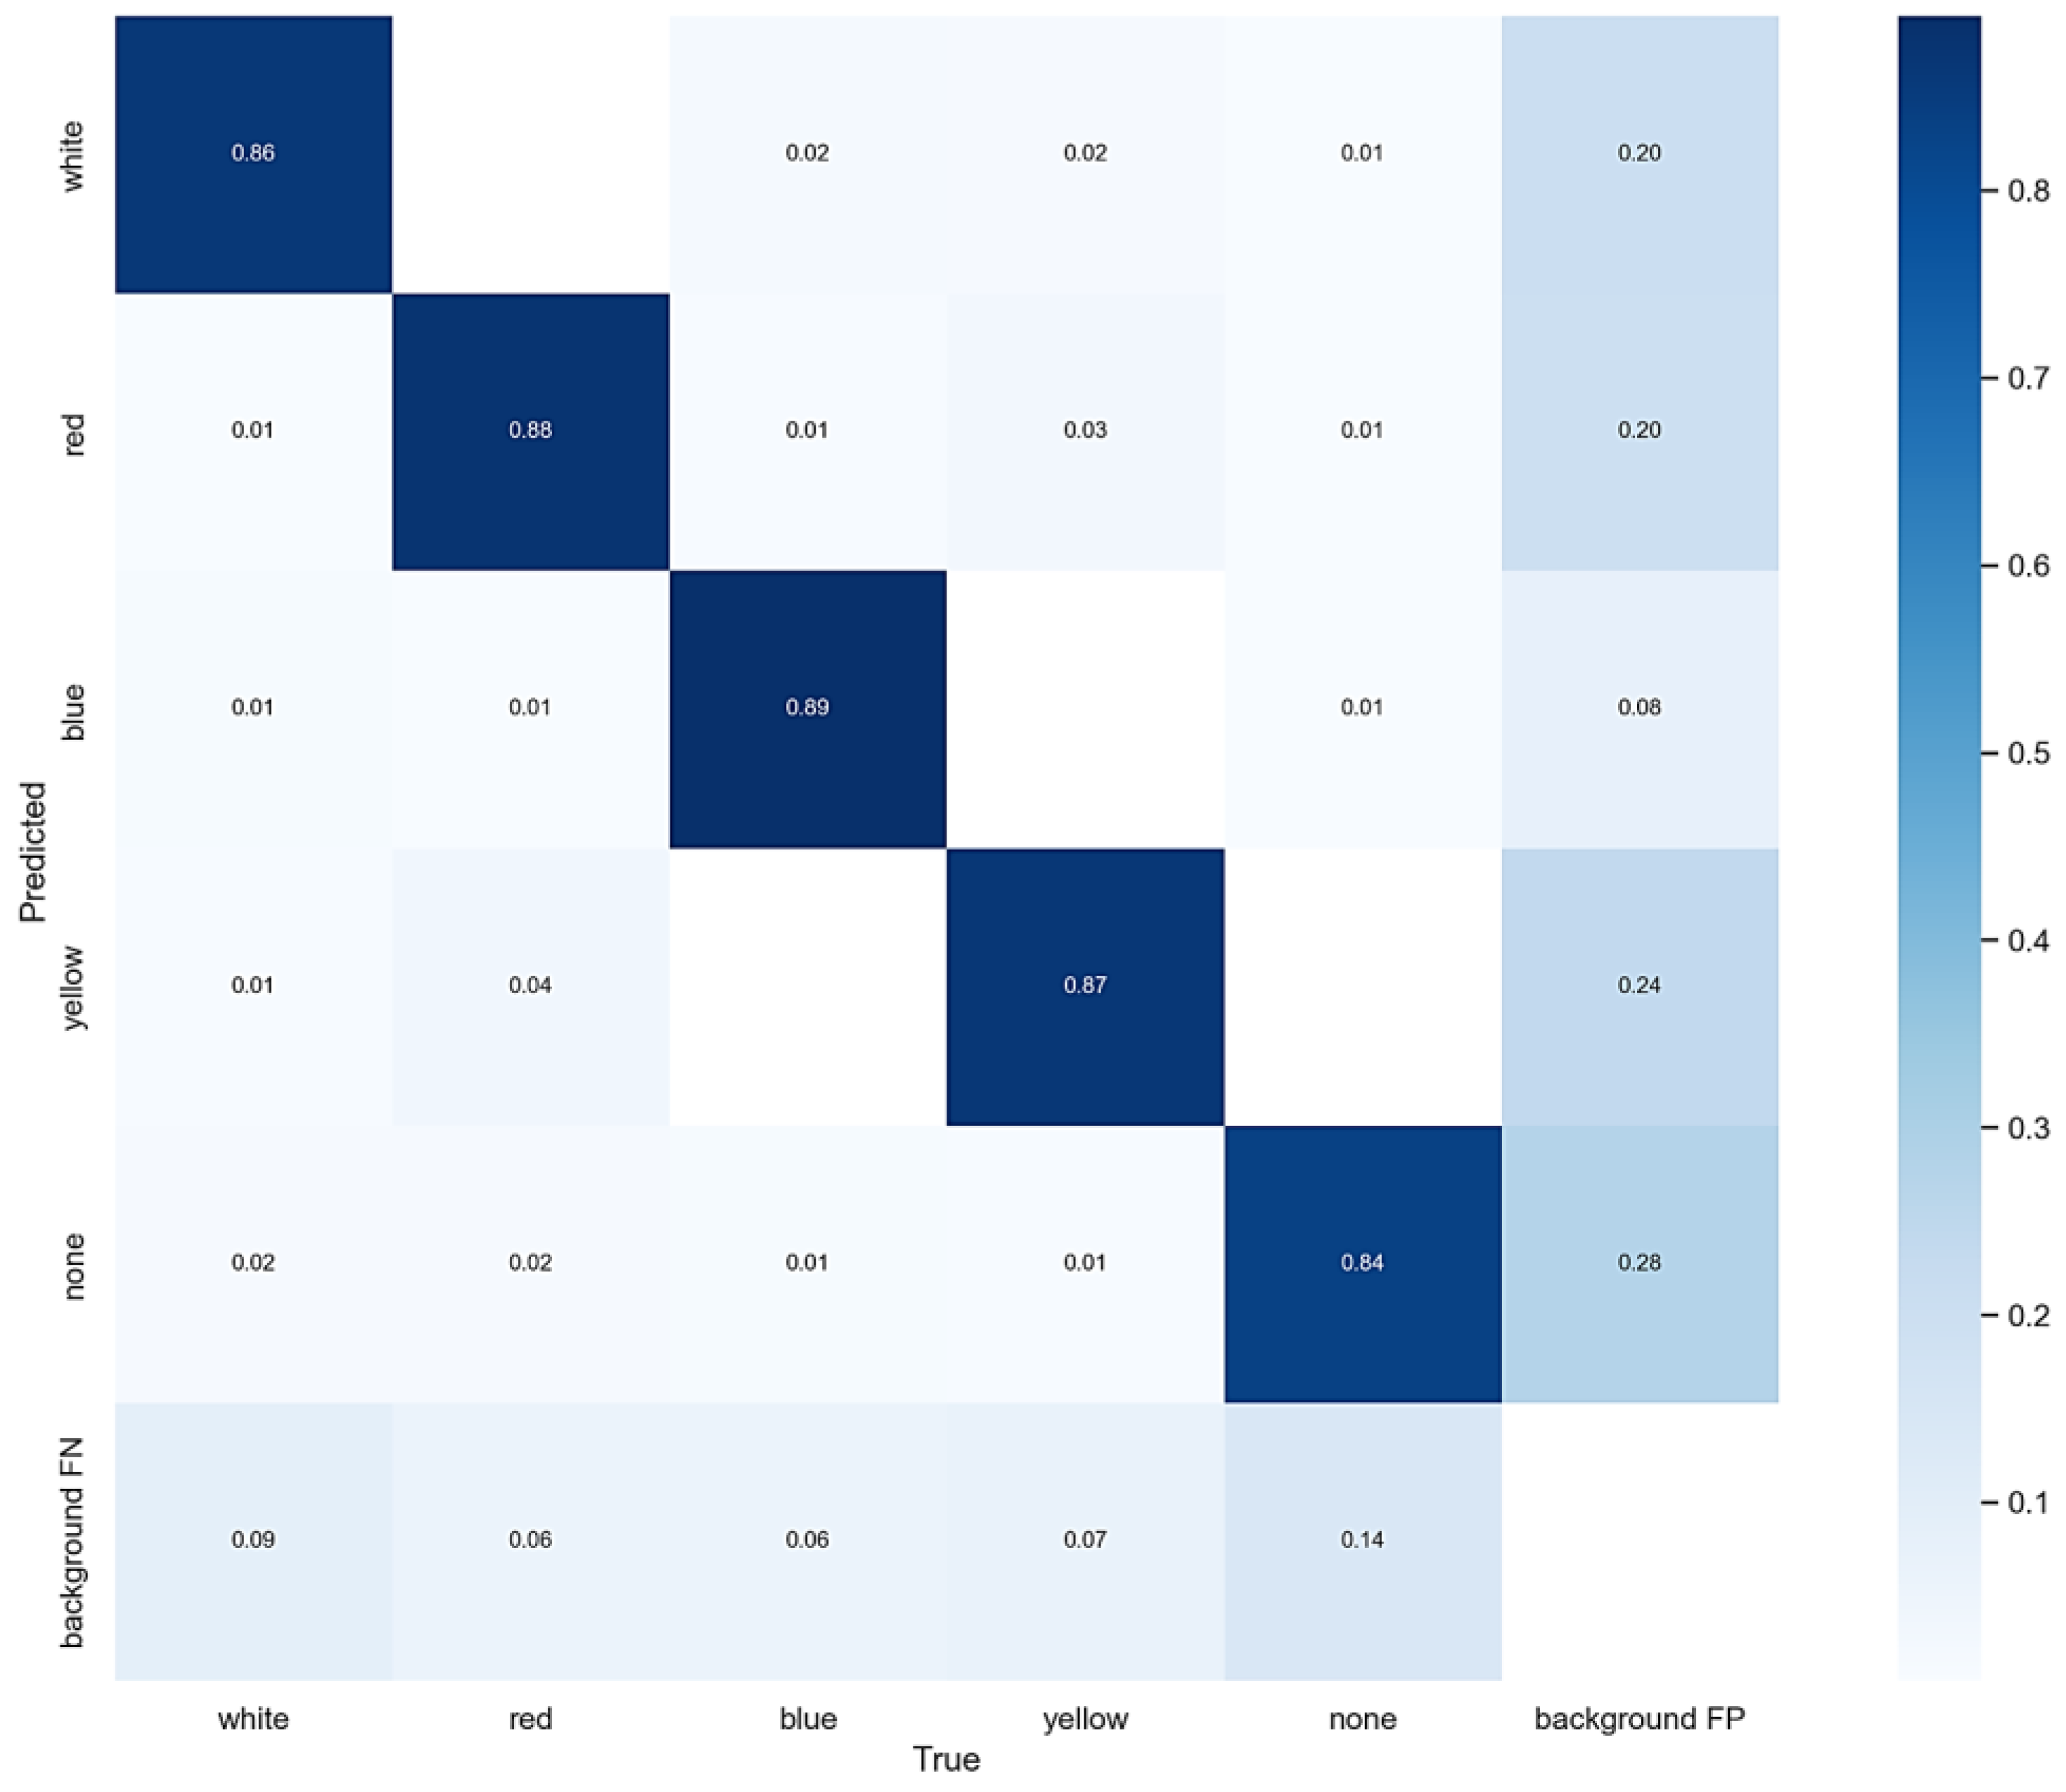
3.1. Training and Validation of the YOLO-v5 Model

Training was performed on a computer equipped with an NVIDIA GTX 1660 graphics card (6 GB RAM), 16 GB RAM, and an Intel Core i5-9300H CPU. The proposed method was implemented in Python language programming under the Windows 10 operating system. The YOLO-v5 model was operated using the PyTorch framework. The training configuration was batch size = 16, number of training iterations = 50, and learning rate = 0.01. It took 2.62 h to train the model. The precision and recall curves are shown in Figure 5. The area under the curve was the mAP value, which was 0.861. Accordingly, the performance of the YOLO-V5 model was validated on 970 test images to detect the hardhats. Images with different views and light conditions were included to show the generalization of the model. Examples of the validation results are shown in Figure 6. The confusion matrix is shown in Figure 7, from which it can be noticed that the classification accuracies of the non-, white, red, blue, and yellow hardhats were 84%, 86%, 88%, 89%, and 87%, respectively. Instead of these 970 images, several high-resolution images and a long video collected from construction sites were used to test the detection model in the following section.

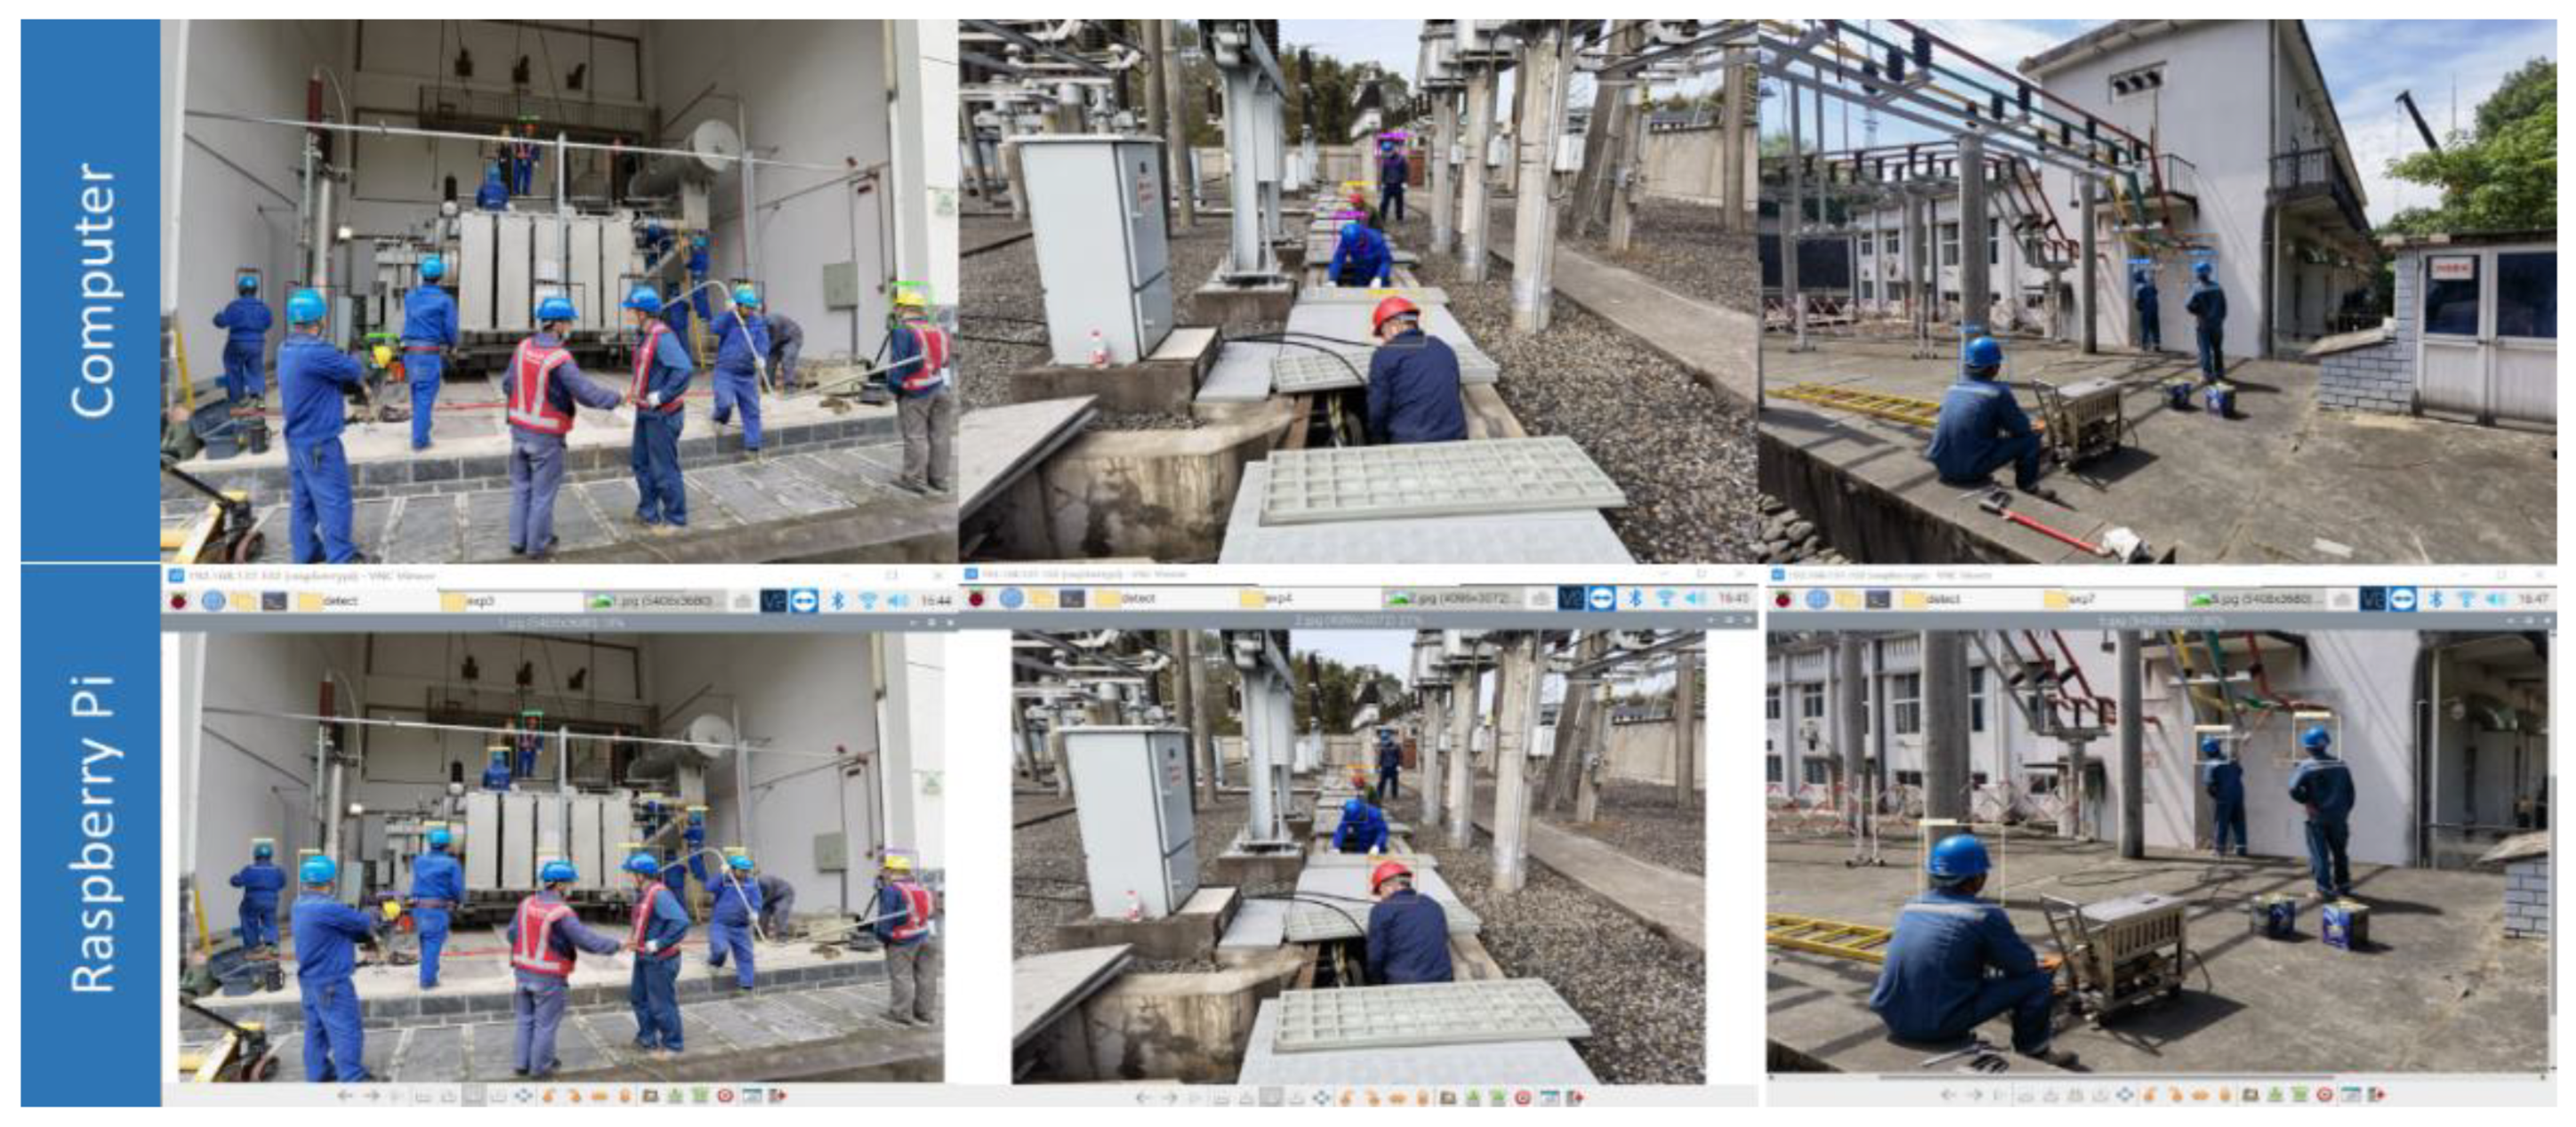
3.2. Comparison of Results

The performance of the YOLO-v5 hardhat color detection model was compared on both the local computer and edge computing device. Specifically, images captured from a real construction site and the video collected from a modular construction factory in China were used for testing. The images were tested to show the performance of the proposed method on high-resolution images, especially the difference in computing speed between the local computer and an R. Pi 4B. The comparison of the test results of the images is shown in Table 3. As shown in the table, the detection accuracy on the local computer and R. Pi 4B device were the same. However, the processing time on the R. Pi 4B was about five times longer than that on the local computer. The average detection accuracy was 73.07% on both devices, and the average time for detection on the R. Pi 4B was 6.11 s. Examples of the image test results are shown in Figure 8.
The example image frames of the test video are shown in Figure 9, and the comparison results are shown in Table 4. The accuracy of hardhat color detection for the video was 78.06%. The total time of testing on the local computer was 33 min and 12 s, and 3 h and 14 min on the R. Pi 4B device. The operation time of the R. Pi 4B device was 5.6 times longer than that on the local computer.

4. Discussion

This study contributed to the research community in terms of providing a comparison test to show the feasibility of using edge computing for CV-based construction monitoring tasks. The research findings and the areas for future improvement are discussed as follows: an R. Pi 4B is feasible as an embedded edge computing device because of its low demand, open design feature, and acceptable detecting performance. In this study, an R. Pi 4B device was selected as the edge computing device and embedded with a YOLO-v5 model to perform hardhat color detection. The detection performance on 970 images and a long video were 86.8% and 78.6%, respectively. The test results verified the feasibility of using an R. Pi 4B as an edge computing device for CV-based construction monitoring. In this study, an R. Pi 4B was selected for its small size, low cost, and easy setup. A pretrained YOLO-v5 model can be easily embedded to the device with the help of an OpenVINO [33] toolkit. In order to select the best performing device, other edge computing devices with higher computing power should be tested in future work.
One of the main challenges with respect to adopting an R. Pi 4B as an edge computing device is its computing speed. Compared with the local computer, which was equipped with a graphics card, the detection speed of an R. Pi 4B was much slower. As shown in Table 3 and Table 4, even though the detection accuracies were the same, the computing speed of the R. Pi 4B were 4.6 and 5.2 times lower than that on the local computer for the images and videos, respectively. In this study, only the original YOLO-v5 detection model, which was designed for a local computer, was applied for testing. An improved model for edge computing devices can achieve faster computing speed and better detection performance. Therefore, developing a model that is suitable for edge computing devices will be another important work in the future.

5. Conclusions

In this research, a CV-based solution for automated workers’ hardhat color detection was transferred to an edge computing device. Then, a comparative study was proposed to analyze the performance of the hardhat color detection on both local computer and Raspberry Pi 4B edge computing devices. Current CV-based automated construction methods have collected visual data with cameras installed on site and transferred the data to local computers or to the cloud for data processing and analyzing. Such data transfer processes may cause security issues and time delays. This research provides an edge-computing-based solution to apply CV-based deep learning methods to automatic construction management, which can solve the problems of security, time delay, and computing source during data transmissions.
The contributions of this research were as follows: (1) to solve the data transfer and security problems, an edge computing solution was proposed for construction CV-based automatic management, which used an R. Pi computer board as an edge computing device. (2) A YOLO-v5 hardhat detection model was trained and tested on both local computer and edge computing devices. The performances of the two devices were compared to validate the feasibility of using an R. Pi 4B as an embedded edge computing device.
Several limitations of this study should be mentioned. First, this work only tested the performance of the YOLO-v5 model on two kinds of devices. It is recommended to test more deep learning algorithms to select the most suitable one. Second, this work only took an R. Pi 4B as an edge computing device, which is not enough. More edge computing devices are needed to be added to the comparison. Third, the original YOLO-v5 model was used for testing. However, it was designed for local computer use. A new deep learning model for a lightweight edge computing device may have a better performance on edge computing devices. Finally, the light condition and quality of the images may affect the detection results, which is a main limitation of the CV-based method.
Based on the limitations, different commonly used deep learning algorithms in construction should be tested and compared in future studies. In addition, more edge computing devices (e.g., such as an NVIDIA board) and factors (e.g., size, processing time, and the cost of the devices) should also be tested and compared in future studies. Finally, an edge computing structure should also be designed and tested in real construction scenarios.

Author Contributions

Conceptualization, C.C. and B.X.; methodology, H.G.; validation, Y.Z. and S.L.; formal analysis, H.G.; writing—original draft preparation, C.C.; writing—review and editing, C.C. and B.X.; visualization, C.C.; supervision, C.C. and B.X.; project administration, C.C. and B.X.; funding acquisition, C.C. and B.X. All authors have read and agreed to the published version of the manuscript.

Funding

This research was supported by The Hong Kong Polytechnic University (Project ID: P0040522).

Institutional Review Board Statement

Not applicable.

Informed Consent Statement

Not applicable.

Data Availability Statement

Not applicable.

Conflicts of Interest

The authors declare no conflict of interest.

References

  1. Xiao, B.; Kang, S.-C. Development of an Image Data Set of Construction Machines for Deep Learning Object Detection. J. Comput. Civ. Eng. 2021, 35, 05020005. [Google Scholar] [CrossRef]
  2. Huang, Y.; Hammad, A.; Zhu, Z. Providing Proximity Alerts to Workers on Construction Sites Using Bluetooth Low Energy RTLS. Autom. Constr. 2021, 132, 103928. [Google Scholar] [CrossRef]
  3. Sherafat, B.; Rashidi, A.; Lee, Y.-C.; Ahn, C.R. A Hybrid Kinematic-Acoustic System for Automated Activity Detection of Construction Equipment. Sensors 2019, 19, 4286. [Google Scholar] [CrossRef] [PubMed] [Green Version]
  4. Xiao, B.; Lin, Q.; Chen, Y. A Vision-Based Method for Automatic Tracking of Construction Machines at Nighttime Based on Deep Learning Illumination Enhancement. Autom. Constr. 2021, 127, 103721. [Google Scholar] [CrossRef]
  5. Kim, J. Visual Analytics for Operation-Level Construction Monitoring and Documentation: State-of-the-Art Technologies, Research Challenges, and Future Directions. Front. Built Environ. 2020, 6, 575738. [Google Scholar] [CrossRef]
  6. Chen, C.; Zhu, Z.; Hammad, A.M. Akbarzadeh, Automatic Identification of Idling Reasons in Excavation Operations Based on Excavator–Truck Relationships. J. Comput. Civ. Eng. 2021, 35, 04021015. [Google Scholar] [CrossRef]
  7. Xiao, B.; Chen, C.; Yin, X. Recent Advancements of Robotics in Construction. Autom. Constr. 2022, 144, 104591. [Google Scholar] [CrossRef]
  8. Park, M.-W.; Elsafty, N.; Zhu, Z. Hardhat-Wearing Detection for Enhancing On-Site Safety of Construction Workers. J. Constr. Eng. Manag. 2015, 141, 04015024. [Google Scholar] [CrossRef]
  9. Mneymneh, B.E.; Abbas, M.; Khoury, H. Automated Hardhat Detection for Construction Safety Applications. Procedia Eng. 2017, 196, 895–902. [Google Scholar] [CrossRef]
  10. Wu, J.; Cai, N.; Chen, W.; Wang, H.; Wang, G. Automatic Detection of Hardhats Worn by Construction Personnel: A Deep Learning Approach and Benchmark Dataset. Autom. Constr. 2019, 106, 102894. [Google Scholar] [CrossRef]
  11. Nath, N.D.; Behzadan, A.H.; Paal, S.G. Deep Learning for Site Safety: Real-Time Detection of Personal Protective Equipment. Autom. Constr. 2020, 112, 103085. [Google Scholar] [CrossRef]
  12. Jocher, G.; Chaurasia, A.; Stoken, A.; Borovec, J.; Kwon, Y.; Fang, J.; Michael, K.; Lorna; Abhiram, A.; Nadar, J.; et al. Ultralytics/yolov5: v6.1–TensorRT, TensorFlow Edge TPU and OpenVINO Export and Inference. 2022. Available online: https://zenodo.org/record/6222936#.Y5FoK31BxPY (accessed on 31 October 2022).
  13. Ding, L.; Fang, W.; Luo, H.; Love, P.E.D.; Zhong, B.; Ouyang, X. A Deep Hybrid Learning Model to Detect Unsafe Behavior: Integrating Convolution Neural Networks and Long Short-Term Memory. Autom. Constr. 2018, 86, 118–124. [Google Scholar] [CrossRef]
  14. Long Short-Term Memory | Neural Computation | MIT Press, (n.d.). Available online: https://direct.mit.edu/neco/article-abstract/9/8/1735/6109/Long-Short-Term-Memory?redirectedFrom=fulltext (accessed on 20 September 2022).
  15. Luo, X.; Li, H.; Cao, D.; Yu, Y.; Yang, X.; Huang, T. Towards Efficient and Objective Work Sampling: Recognizing Workers’ Activities in Site Surveillance Videos with Two-Stream Convolutional Networks. Autom. Constr. 2018, 94, 360–370. [Google Scholar] [CrossRef]
  16. Luo, X. Capturing and Understanding Workers’ Activities in Far-Field Surveillance Videos with Deep Action Recognition and Bayesian Nonparametric Learning. Comput.-Aided Civ. Infrastruct. Eng.-Wiley Online Libr. 2019, 34, 333–351. [Google Scholar] [CrossRef]
  17. Kim, J.; Chi, S. Action Recognition of Earthmoving Excavators Based on Sequential Pattern Analysis of Visual Features and Operation Cycles. Autom. Constr. 2019, 104, 255–264. [Google Scholar] [CrossRef]
  18. Chen, C.; Zhu, Z.; Hammad, A.M. Automated Excavators Activity Recognition and Productivity Analysis From Construction Site Surveillance Videos. Autom. Constr. 2020, 110, 103045. [Google Scholar] [CrossRef]
  19. Wang, T.; Zhang, G.; Liu, A.; Bhuiyan, M.Z.A.; Jin, Q. A Secure IoT Service Architecture With an Efficient Balance Dynamics Based on Cloud and Edge Computing. IEEE Internet Things J. 2019, 6, 4831–4843. [Google Scholar] [CrossRef]
  20. Cao, K.; Liu, Y.; Meng, G.; Sun, Q. An Overview on Edge Computing Research. IEEE Access. 2020, 8, 85714–85728. [Google Scholar] [CrossRef]
  21. Hossain, M.S.; Muhammad, G. Emotion Recognition Using Secure Edge and Cloud Computing. Inf. Sci. 2019, 504, 589–601. [Google Scholar] [CrossRef]
  22. Satyanarayanan, M. The Emergence of Edge Computing. Computer 2017, 50, 30–39. [Google Scholar] [CrossRef]
  23. Projects | Computer coding for kids and teens | Raspberry Pi, (n.d.). Available online: https://projects.raspberrypi.org/en/projects/raspberry-pi-setting-up/1 (accessed on 28 November 2022).
  24. Katsamenis, I.; Karolou, E.E.; Davradou, A.; Protopapadakis, E.; Doulamis, A.; Doulamis, N.; Kalogeras, D. TraCon: A Novel Dataset for Real-Time Traffic Cones Detection Using Deep Learning. arXiv 2022, arXiv:2205.11830v1. [Google Scholar]
  25. Bochkovskiy, A.; Wang, C.-Y.; Liao, H.-Y.M. YOLOv4: Optimal Speed and Accuracy of Object Detection. arXiv 2004, arXiv:2004.10934. [Google Scholar]
  26. Redmon, J.; Farhadi, A. YOLOv3: An Incremental Improvement. arXiv 2018, arXiv:1804.02767. [Google Scholar]
  27. Heartexlabs/labelImg. 2022. Available online: https://github.com/heartexlabs/labelImg (accessed on 9 October 2022).
  28. Arabi, S.; Haghighat, A.; Sharma, A. A Deep-Learning-Based Computer Vision Solution For Construction Vehicle Detection. Comput.-Aided Civ. Infrastruct. Eng. 2020, 35, 753–767. [Google Scholar] [CrossRef]
  29. Cortex-A72, (n.d.). Available online: https://developer.arm.com/Processors/Cortex-A72 (accessed on 28 November 2022).
  30. Broadcom VideoCore VI, (n.d.). Available online: https://www.cpu-monkey.com/en/igpu-broadcom_videocore_vi-221 (accessed on 28 November 2022).
  31. GeForce GTX 16 Series Graphics Card | NVIDIA, (n.d.). Available online: https://www.nvidia.com/en-us/geforce/graphics-cards/16-series/ (accessed on 28 November 2022).
  32. Intel Core i59300H Processor 8 M Cache up to 4.10 GHz Product Specifications, (n.d.). Available online: https://ark.intel.com/content/www/us/en/ark/products/191075/intel-core-i59300h-processor-8m-cache-up-to-4-10-ghz.html (accessed on 28 November 2022).
  33. Openvinotoolkit/Openvino. 2022. Available online: https://github.com/openvinotoolkit/openvino (accessed on 13 October 2022).
  34. Xuehui, A.; Li, Z.; Zuguang, L.; Chengzhi, W.; Pengfei, L.; Zhiwei, L. Dataset and Benchmark for Detecting Moving Objects In Construction Sites. Autom. Constr. 2021, 122, 103482. [Google Scholar] [CrossRef]
  35. Duan, R.; Deng, H.; Tian, M.; Deng, Y.; Lin, J. SODA: A Large-Scale Open Site Object Detection Dataset for Deep Learning in Construction. Autom. Constr. 2022, 142, 104499. [Google Scholar] [CrossRef]
Figure 1. Neural network architecture of YOLO-v5.
Buildings 12 02167 g001
Figure 2. Distribution of labels in dataset.
Buildings 12 02167 g002
Figure 3. Image of the Raspberry Pi 4B device used for edge computing.
Buildings 12 02167 g003
Figure 4. Calculation process of the IOU.
Buildings 12 02167 g004
Figure 5. Precision and recall curve of Yolo-v5 model.
Buildings 12 02167 g005
Figure 6. Example of test results.
Buildings 12 02167 g006
Figure 7. Confusion matrix of YOLO-v5 model.
Buildings 12 02167 g007
Figure 8. Examples of test results on images.
Buildings 12 02167 g008
Figure 9. Examples of test results on video.
Buildings 12 02167 g009
Table 1. Main differences between cloud computing and edge computing.
MethodApplicable
Situation
Network Bandwidth PressureReal TimeCalculation Mode
Cloud computingGlobalMoreHighLarge-scale centralization processing
Edge computingLocalLessLowSmall-scale intelligent analysis
Table 2. Detailed specifications of local computer and Raspberry Pi 4B.
OMEN by HP Laptop 15-dc1xxxRaspberry Pi 4B
CPUIntel(R) Core (TM) i5-9300H CPU @ 2.40 GHz [32]1.5 GHZ 64-bit quad core ARM Cortex-A72 [29]
GPUNVIDIA GeForce GTX 1660Ti [31]Broadcom VideoCore VI@500 MHz [30]
Memory16 G4 G
Wi-Fi network5 GHz double5 GHz double
Size36 × 26.3 × 2.5 cm85 × 56 mm
Table 3. Comparison of testing results on images.
Image NumberImage SizeLocal ComputerRaspberry Pi
Time (s)AccuracyTime (s)Accuracy
15408 × 36801.46512/136.5712/13
24096 × 30721.2714/46.474/4
34096 × 30721.5245/105.395/10
45408 × 36801.4979/136.129/13
55408 × 36801.6193/36.403/3
65408 × 36801.6064/86.404/8
75408 × 36801.5515/106.415/10
84096 × 30721.3041/25.131/2
Average 1.50573.07%6.1173.07%
Table 4. Comparison of testing results on video.
Video FramesVideo
Length
Local ComputerRaspberry Pi
Time (s)Accuracy (%)Time (s)Accuracy (%)
34,80223 min and 12 s33 min and 12 s78.063 h and 14 min78.06
Publisher’s Note: MDPI stays neutral with regard to jurisdictional claims in published maps and institutional affiliations.

