Article

Monotonic and Cyclic Behavior of DIN 34CrNiMo6 Tempered Alloy Steel

by
Ricardo Branco
1,2,*,
José D. M. Costa
2,
Fernando V. Antunes
2 and
Sandra Perdigão
1
1
Department of Mechanical Engineering, ISEC, Polytechnic Institute of Coimbra, Rua Pedro Nunes, Quinta da Nora, 3030-199 Coimbra, Portugal
2
CEMUC, Department of Mechanical Engineering, University of Coimbra, Rua Luís Reis Santos, Pinhal de Marrocos, 3030-788 Coimbra, Portugal
*
Author to whom correspondence should be addressed.
Metals 2016, 6(5), 98; https://doi.org/10.3390/met6050098
Submission received: 29 March 2016 / Revised: 18 April 2016 / Accepted: 21 April 2016 / Published: 26 April 2016
(This article belongs to the Special Issue Microalloyed Steel)

Abstract

:
This paper aims at studying the monotonic and cyclic plastic deformation behavior of DIN 34CrNiMo6 high strength steel. Monotonic and low-cycle fatigue tests are conducted in ambient air, at room temperature, using standard 8-mm diameter specimens. The former tests are carried out under position control with constant displacement rate. The latter are performed under fully-reversed strain-controlled conditions, using the single-step test method, with strain amplitudes lying between ±0.4% and ±2.0%. After the tests, the fracture surfaces are examined by scanning electron microscopy in order to characterize the surface morphologies and identify the main failure mechanisms. Regardless of the strain amplitude, a softening behavior was observed throughout the entire life. Total strain energy density, defined as the sum of both tensile elastic and plastic strain energies, was revealed to be an adequate fatigue damage parameter for short and long lives.

Graphical Abstract

1. Introduction

DIN 34CrNiMo6 high-strength steel is a martensitic steel, and, within the group of advanced high-strength steels, provides the highest yield strength and the ultimate tensile strength. Martensitic steels, generally speaking, are characterized by a martensitic matrix containing small amounts of ferrite and or bainite. This microstructure is the result of a rapid quenching, which transforms most of the austenite into martensite. The main process responsible for the strengthening in this steel is the precipitation of a fine dispersion of alloy carbides during tempering.
This steel, in particular, is a very versatile engineering material employed in the manufacture of a wide range of critical mechanical components, such as axles, shafts, crankshafts, connecting rods, valves, propeller hubs, gears, couplings, torsion bars, aircraft components, and heavy duty parts of rock drills, among others. It advantageously combines high ductility, deep hardenability, toughness, and strength.
Such components, as is well-known, contain geometric discontinuities, broadly referred to as notches, and are subjected to severe loading histories. Under these circumstances, the highest stresses and strains are generally found close to the notch roots; due to these stress and strain concentration phenomena, even nominal elastic stresses may result in elastoplastic stress-strain fields around the notches. In this sense, fatigue damage accumulation caused by cyclic loading at the notch root is likely to lead to crack initiation and crack propagation, which can culminate in fatigue failure.
Therefore, an efficient design of mechanical components subjected to time-varying loads, based on damage-tolerant approaches, requires a full knowledge of the elastoplastic behavior of the material, including the main fatigue micro-mechanisms, as well as a careful evaluation of cyclic fatigue and monotonic mechanical properties. Nevertheless, so far, very little work has been performed in low-cycle fatigue regime for this steel. In this sense, this paper aims the systematic characterization of monotonic and cyclic behavior of DIN 34CrNiMo6. These data are essential to develop and validate more accurate numerical and analytical models, which can be employed in the development of safer and reliable mechanical components.

2. Experimental Procedure

2.1. Materials

As referred to above, the material used in this research was DIN 34CrNiMo6 high-strength steel. Its nominal chemical composition, in weight percentage, is presented in Table 1. This batch was oil quenched and tempered (Q & T). Firstly, it was austenitised at about 850–880 °C for approximately 30 min, followed by oil cooling in order to produce a quenched martensitic structure; then it was tempered at about 660 °C for at least 2 h and, finally, air cooled.

2.2. Monotonic Tensile Tests

Monotonic uniaxial tensile tests were conducted according to the procedure described in the ASTM E8 standard. Two 8 mm diameter specimens were tested in a computer-controlled 100 kN Instron 4206 electromechanical tension and compression universal testing machine (Instron, Norwood, MA, USA), at room temperature, under position control, and at a displacement rate of 1 mm per minute until specimen fracture occurred. The strain on the specimens was measured using an Instron 2630-100 axial extensometer (Instron, Norwood, MA, USA) with a gauge length of 50 mm. Data were recorded at a rate of 10 samples per second throughout the duration of the test.

2.3. Low-Cycle Fatigue Tests

Fully-reversed strain amplitude-controlled tests were conducted according to the procedure described in ASTM E606 standard. Tests were conducted on a computer-controlled 100 kN DARTEC closed-loop servo-hydraulic testing machine (Zwick, Hereford, UK), at room temperature, with sinusoidal waves, using 8 mm diameter specimens. Tests were performed for total strain amplitudes (Δε/2) of ±0.4%, ±0.5%, ±0.6%, ±0.8%, ±1.0%, ±1.25%, ±1.5%, and ±2.0% assuming a fixed strain ratio (Rε = −1), and a constant strain rate (dε/dt) equal to 8 × 10⁻³ s−1. At least 200 samples per cycle were collected and recorded using a 12.5 mm-gauge extensometer (model Instron 2620-601, Instron, Norwood, MA, USA) clamped to the specimen via two separated knife-edges. The single-step test (SST) was adopted in this research, i.e., each specimen was tested under constant strain amplitude until failure occurs, since the plastic response, in general, is path- and history-dependent. Tests were interrupted when specimens separated into two pieces. Additionally, five fully-reversed stress amplitude-controlled fatigue tests were also performed, assuming a stress ratio (Rσ) equal to −1. The stress amplitudes (Δσ/2) examined were equal to ±540, ±560, ±580, ±600, and ±635 MPa.

2.4. Analysis of Material Microstructure

The microstructure of the material was examined by optical microscopy (Zeiss Axiotech 100HD microscope, Zeiss, Jena, Germany). The sample was prepared according to the recommendations of the ASTM E3 standard. Firstly, a piece of material was cut using a bandsaw machine from a 20 mm diameter round bar perpendicularly to the main axis. Then, a preliminary polishing was carried out using a rotary disc and wet grit silicon papers with grit sizes progressively finer (P600, P1200 and P2500) in order to ensure a flat surface. After that, the sample was mounted in a cylindrical mold filled with synthetic resin. Next, the surface of the sample was carefully polished to a scratch-free condition using a rotary disc impregnated with diamond paste of different grades, namely 6 μm and 3 μm. The as-polished surface was successively examined with a microscope to guarantee the scratch-free condition. After final polishing, the sample surface was etched with nital (≈5% solution HNO3 in ethyl alcohol).

2.5. Analysis of Fracture Surfaces

The fracture surfaces of the specimens used in quasi-static uniaxial tensile tests and in low-cycle fatigue tests were examined by SEM. Samples were sectioned perpendicularly to the longitudinal axis of the specimens using a high-speed diamond saw. Before examination, they were ultrasonically cleaned in trichloroethylene solution, for 10 min, and then in distilled water, also for 10 min.
The objective of the fracture surface analysis of the uniaxial tensile tests was the characterization of the surface morphologies and the main failure mechanics. Regarding the low-cycle fatigue tests, the goal was the identification of the main fatigue damage mechanisms associated with the different levels of strain amplitude analyzed. Thus, in order to cover the range of strain amplitudes studied in this research, three different samples, corresponding to the cases of strain amplitudes equal to ±0.4%, ±1.0%, and ±2.0%, were examined.

3. Results and Discussion

3.1. Microstructure

Figure 1 presents the microstructure of the steel obtained by OM. The micrograph illustrates the grain boundaries and the non-uniform distribution of precipitates. As can be seen, the material has a fine microstructure, mainly composed of a very uniform gray martensitic matrix. The average grain size, obtained using the procedure described by the ASTM E112 standard, was about 8 μm. In addition, many inclusions with different sizes, ranging from 2 to 30 μm, were found. A representative example is denoted by the white arrow.
The presence of inclusions in DIN 34CrNiMo6 steel is well-known and has been reported in several studies. The typical inclusions found are sulfide inclusions, globular oxides, fragmented aluminia inclusions, and elongated silicate inclusions [1,2,3,4,5,6]. In the present research, despite several attempts, the chemical composition of the inclusions was not clearly identified.

3.2. Monotonic Behavior

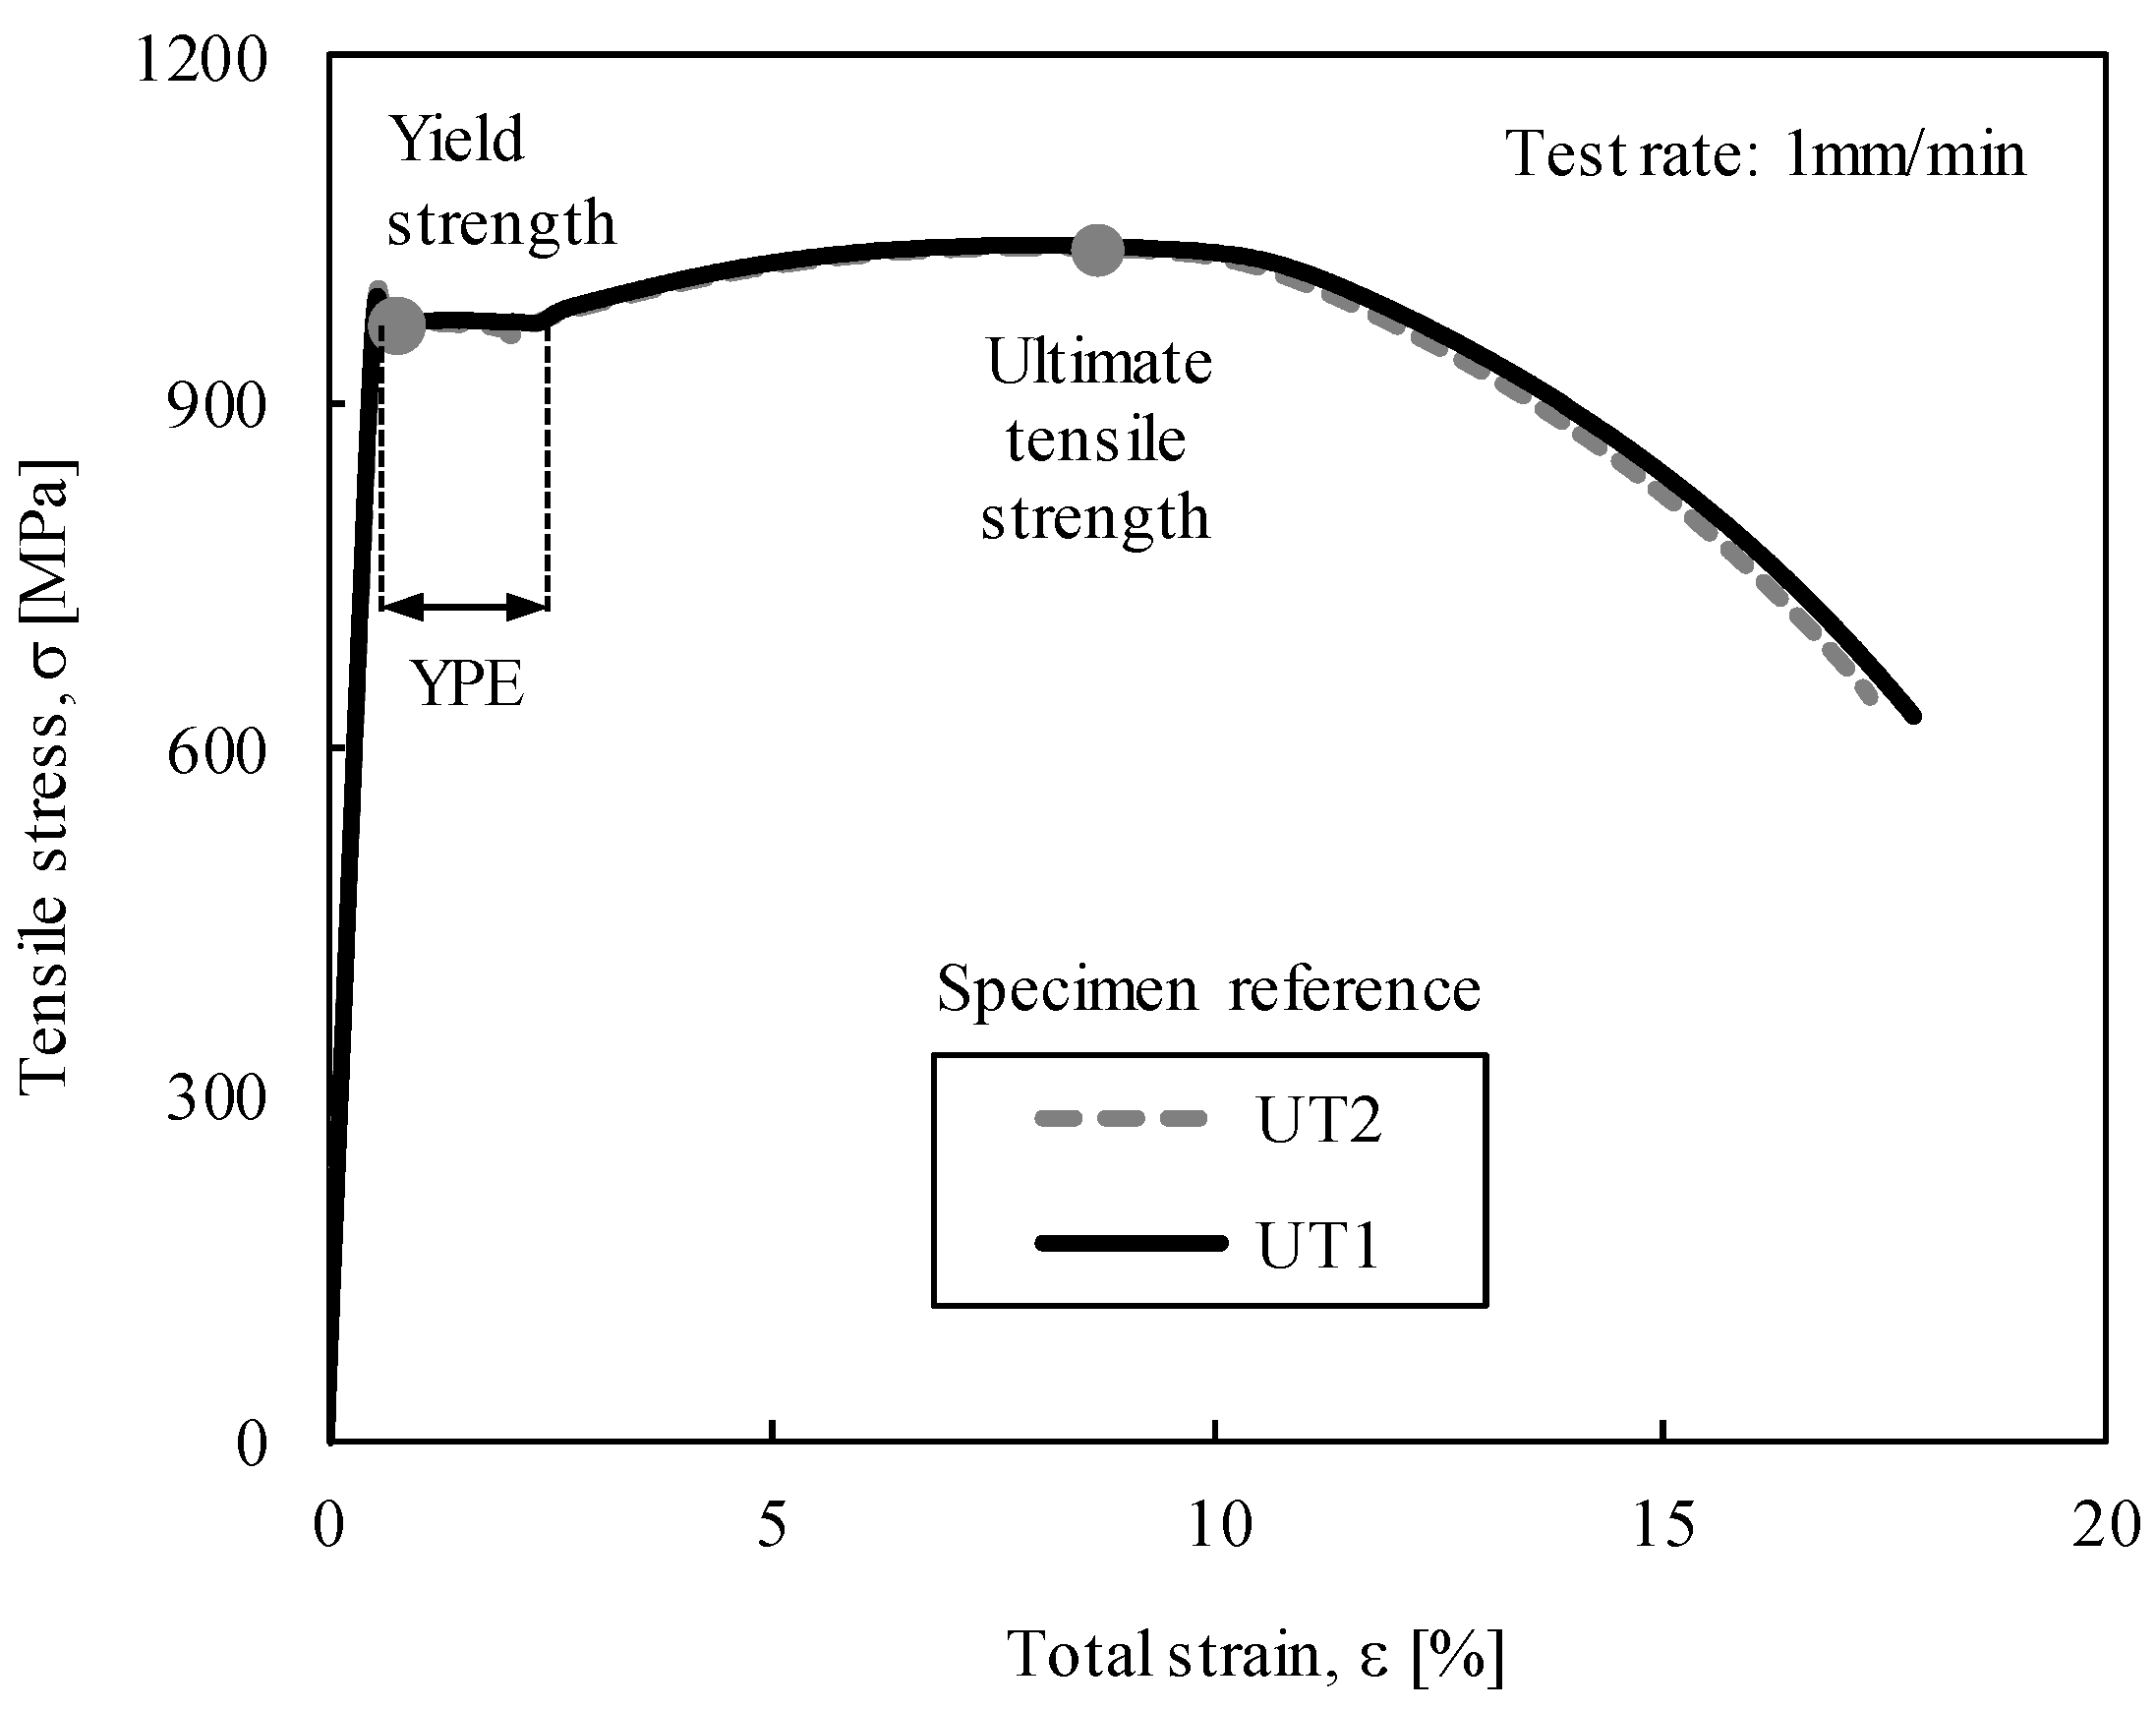
Figure 2 exhibits the tensile stress-strain curves obtained in this research for the specimens tested. As can be seen, the monotonic behavior of the two curves is very similar, except for the non-uniform plastic deformation region, after the ultimate tensile strength, with a maximum total strain greater than 17.2%. Furthermore, it is also possible to observe a yield point elongation (YPE), i.e., an area in which an increase in strain occurs without an increase in stress (0.59% < ε < 2.4%). The strain difference between the upper yield strength (first zero slope) and the onset of uniform strain hardening is about 1.93%; and the ultimate tensile strength was recorded for a total strain equal to 8.7%. The monotonic mechanical properties obtained are summarized in Table 2. These results are in good agreement with those reported in the literature [7] for nearly identical conditions. However, the yield strength and the ultimate tensile strength values determined in this research are slightly higher than the reference values, which can be associated with the different tempering temperatures. With regard to the elongation and reduction of area, the findings are in line with the literature.
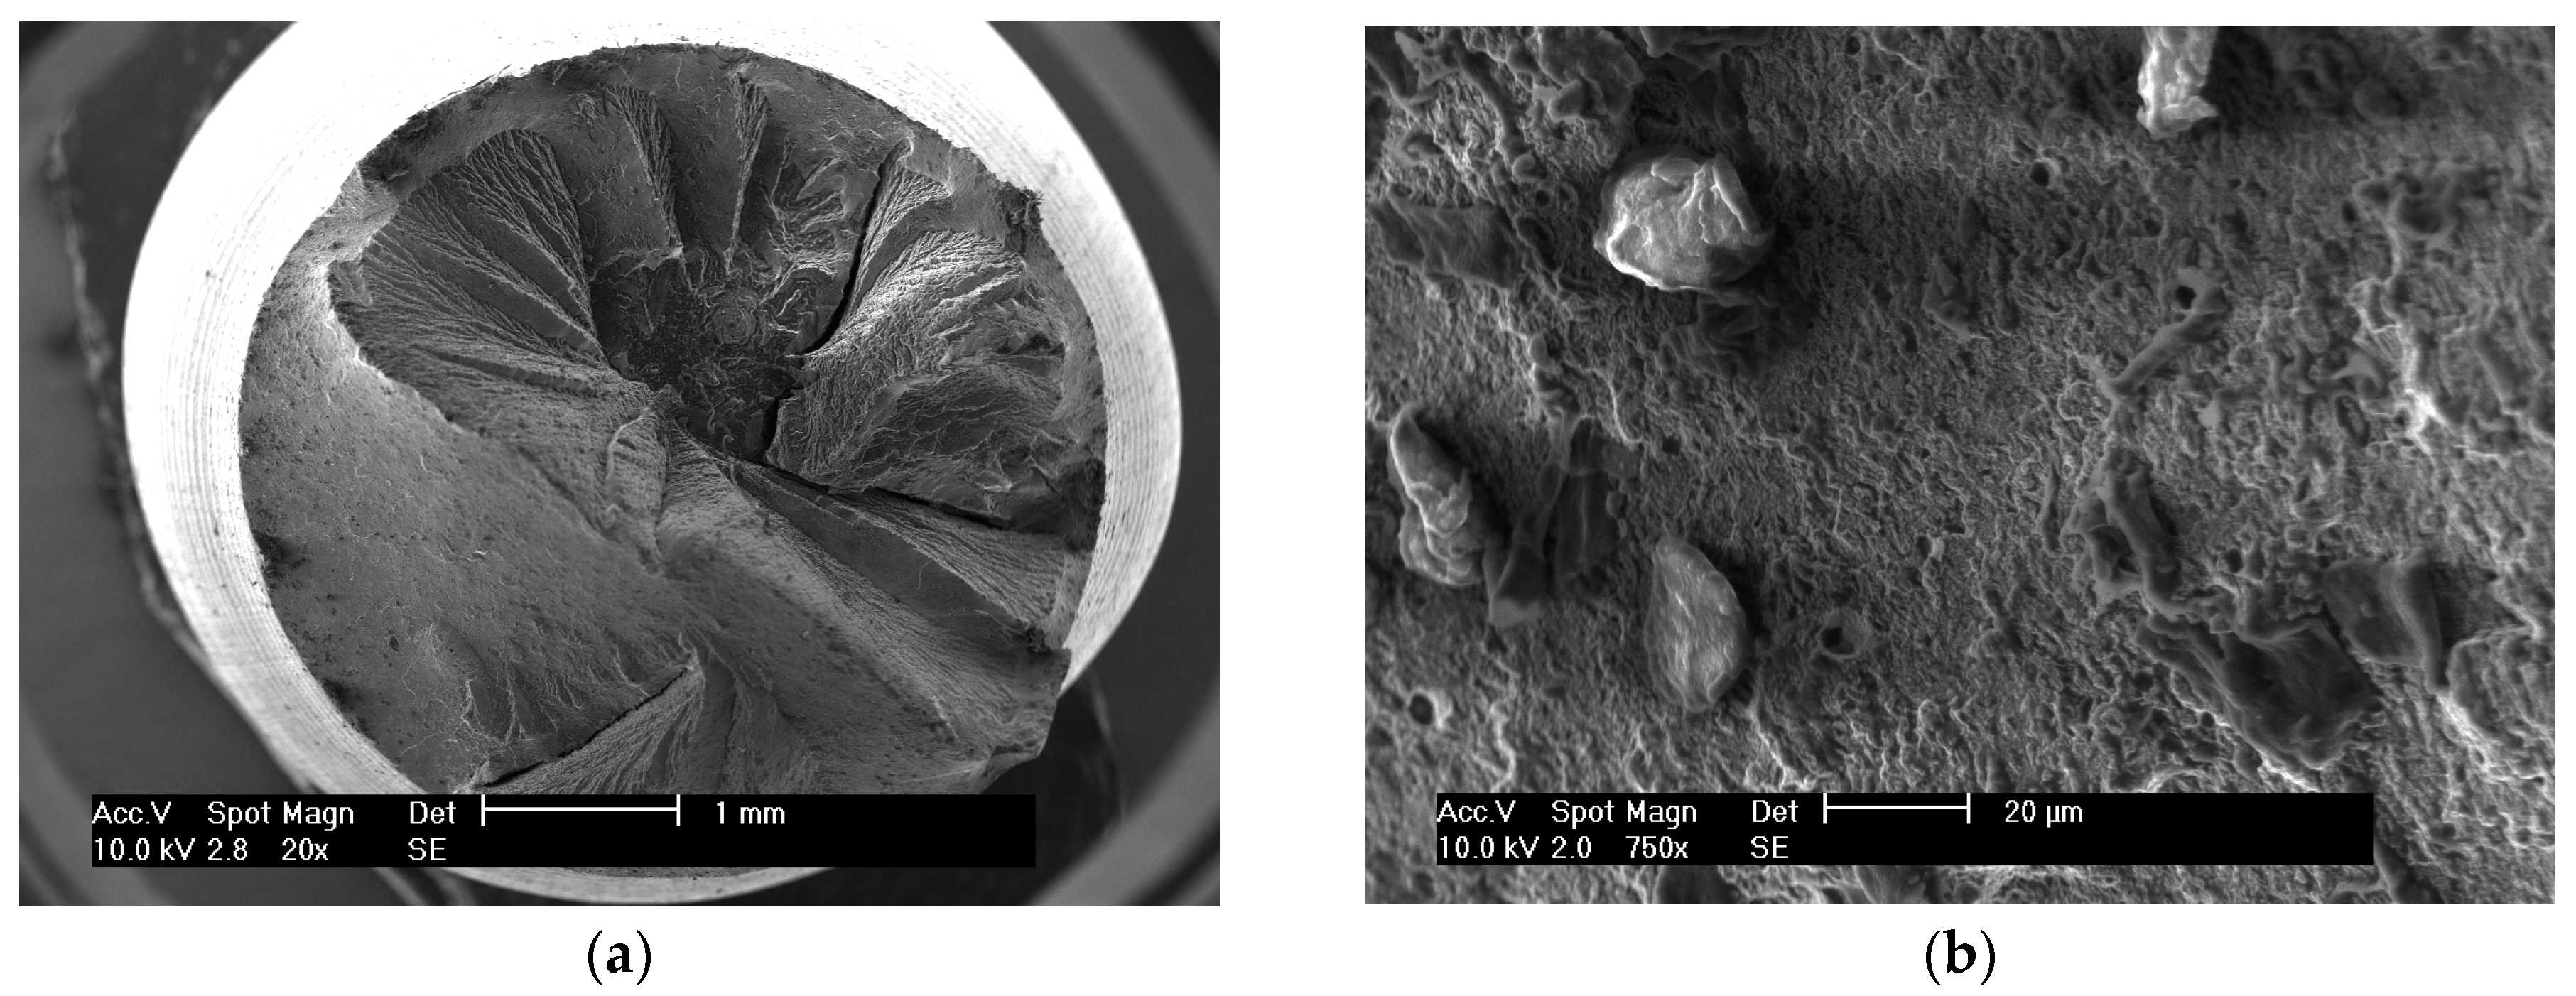
The tensile fracture surfaces were examined by SEM. Figure 3a,b displays two micrographs taken at low and high magnifications, respectively. Figure 3a shows considerable plastic deformation before fracture. The plastic deformation in the center of the plane of minimum cross-section, at the neck location, promotes the nucleation and growth of voids to a critical dimension. Necking starts when the stress-strain curve has passed the maximum point where plastic deformation is no longer uniform. Nevertheless, the typical ductile cup-and-cone fracture surface is not observed. In this case, the fracture is a mixed mechanism involving microvoid coalescence and cleavage. Figure 3b presents several inclusions found in the tensile fracture surface that are disseminated throughout the material. It was observed that these particles, when located at the surface, came off during the polishing process [6]. This is totally undesirable and inevitably leads to a reduction in fatigue strength.

3.3. Cyclic Behavior

3.3.1. Cyclic Stress-Strain Response

Figure 4a,b shows the stress-strain response for two strain amplitudes (Δε/2), respectively Δε/2 = ±2% and Δε/2 = ±0.8%. A strain-softening phenomenon occurs in both cases, i.e., the uncontrolled stress decreases with the increasing number of cycles until a stable state is achieved. In Figure 4a, the stable behavior is observed after 40–50 cycles; in Figure 4b, it occurs after about 500 cycles. Therefore, in this steel, the stable cyclic state is reached generically for life ratios lower than 40% of the total number of cycles to failure. In view of this fact, the hysteresis loops at the half-life were chosen as representative of the stable behavior.
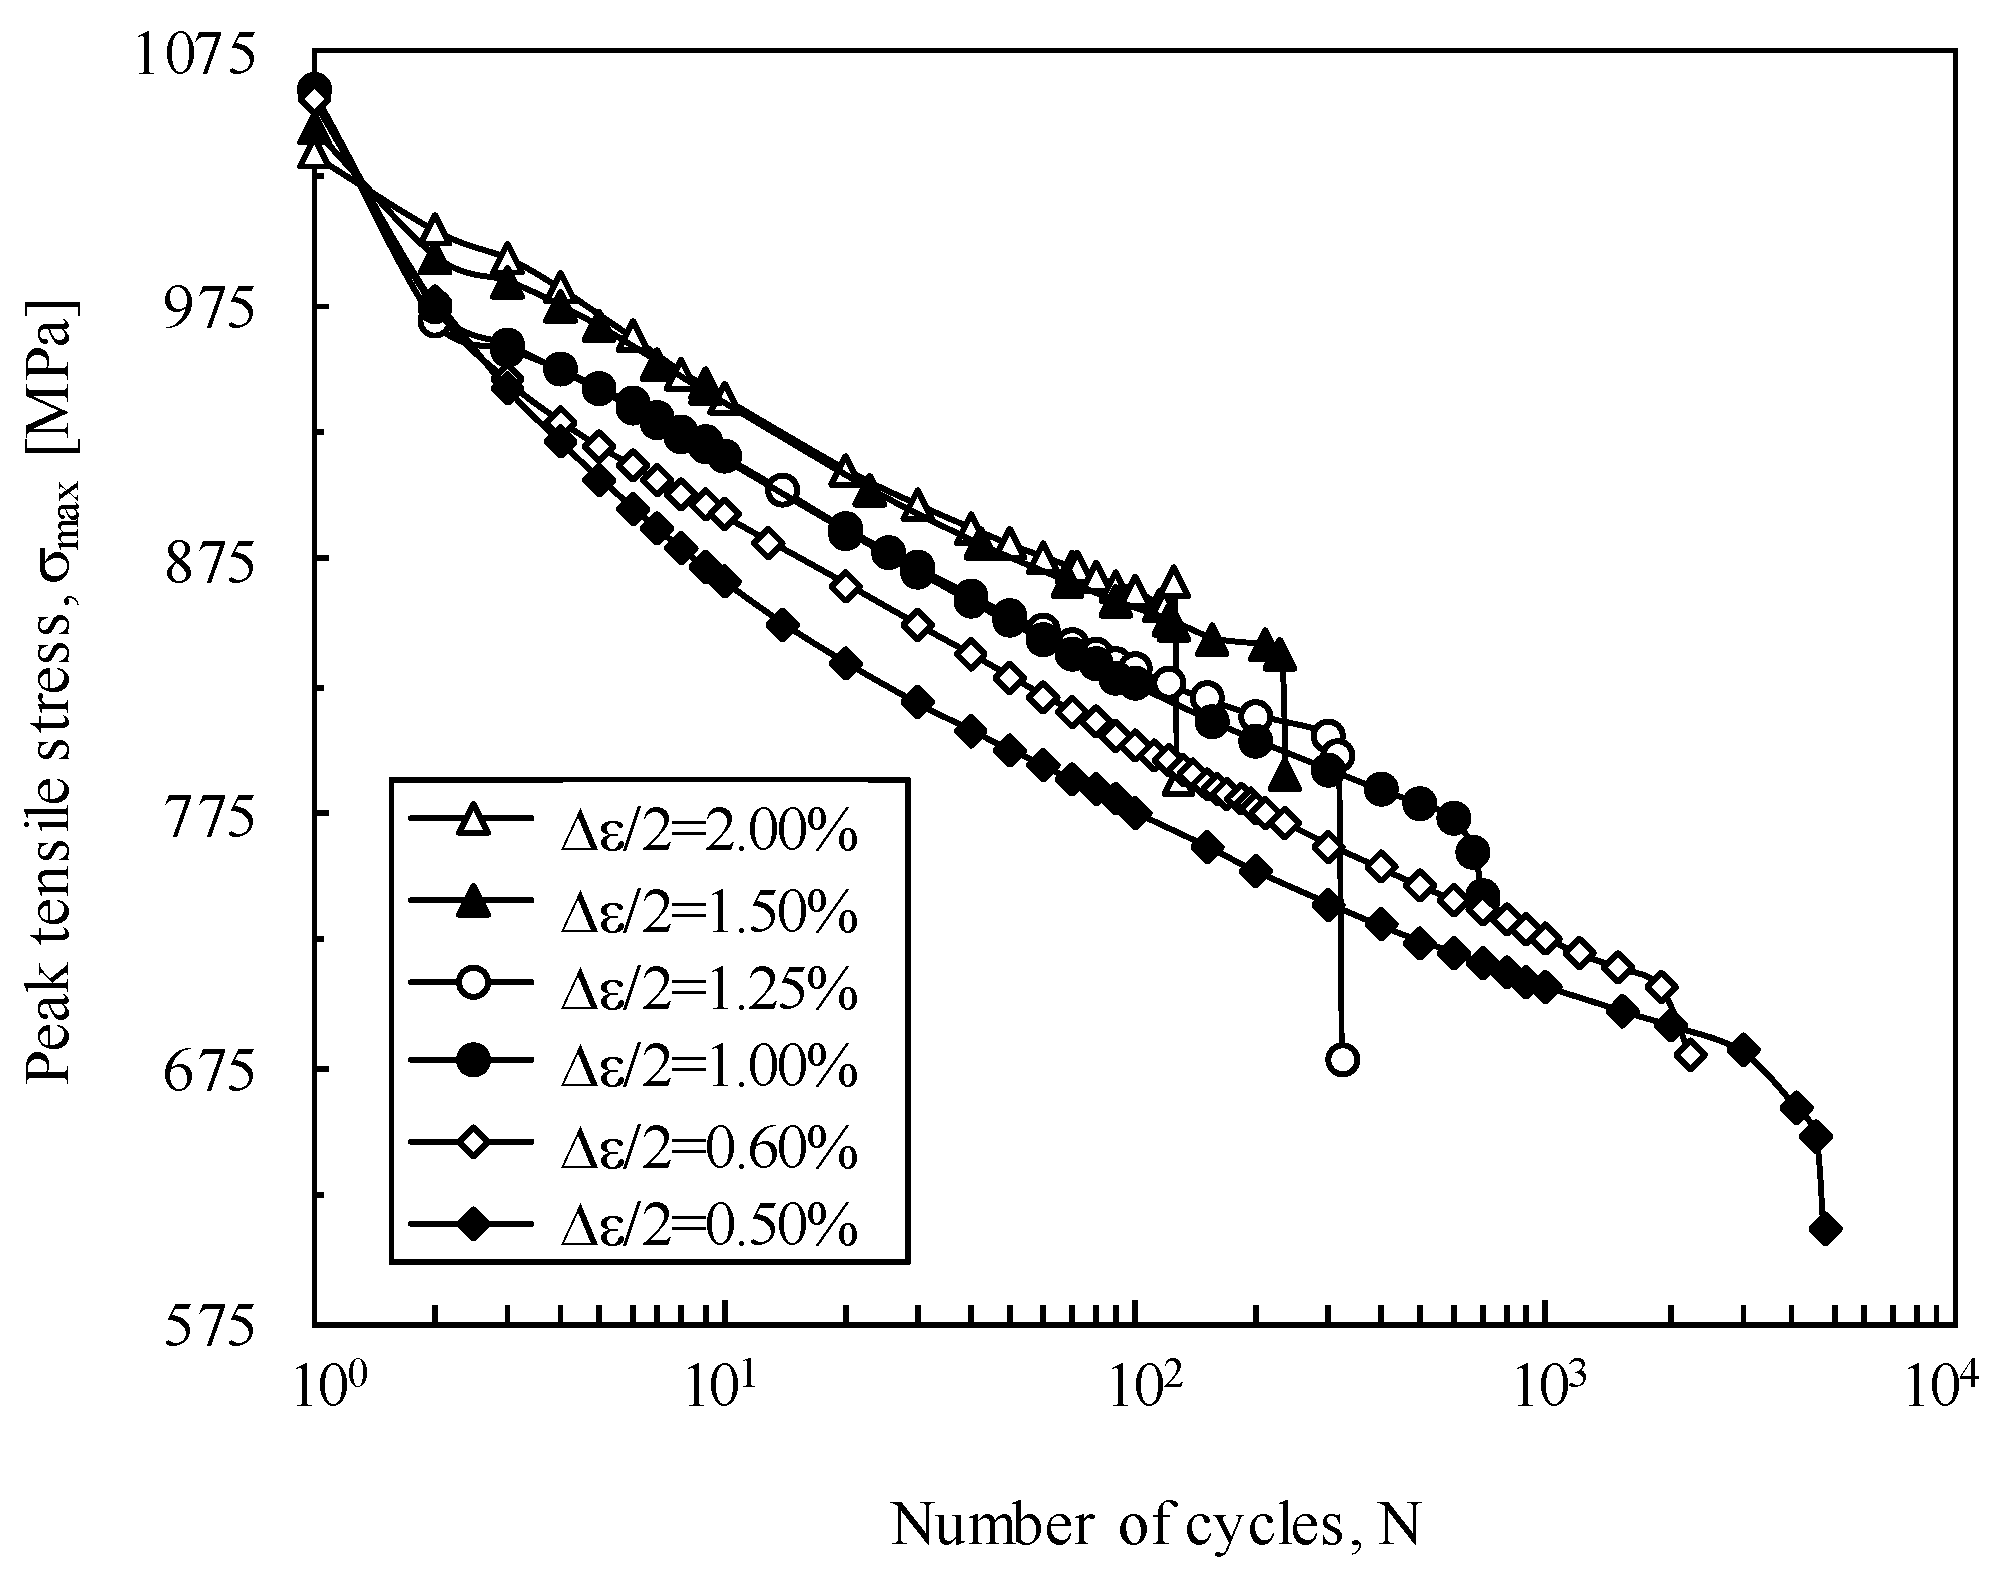
The peak tensile stresses versus the number of cycles at fixed strain amplitude, in a semi-log scale, are shown in Figure 5. Regardless of the strain amplitude, a gradual cyclic softening behavior is observed. A rapid drop in stress amplitude is also observed when failure is imminent. The softening behavior identified here agrees with the empirical rule proposed by Smith [8], in which metals with σUTSYS < 1.2, in general, cyclically soften (σUTSYS = 1.07).
During each test, the shape of the stress-strain hysteresis loops is continuously changing (see Figure 4). The geometry of the hysteresis loops can be evaluated by the ratio of the plastic strain range to the elastic strain range (SR), defined by
S R = Δ ε p Δ ε e
where Δεp is the plastic strain range and Δεe is the elastic strain range.
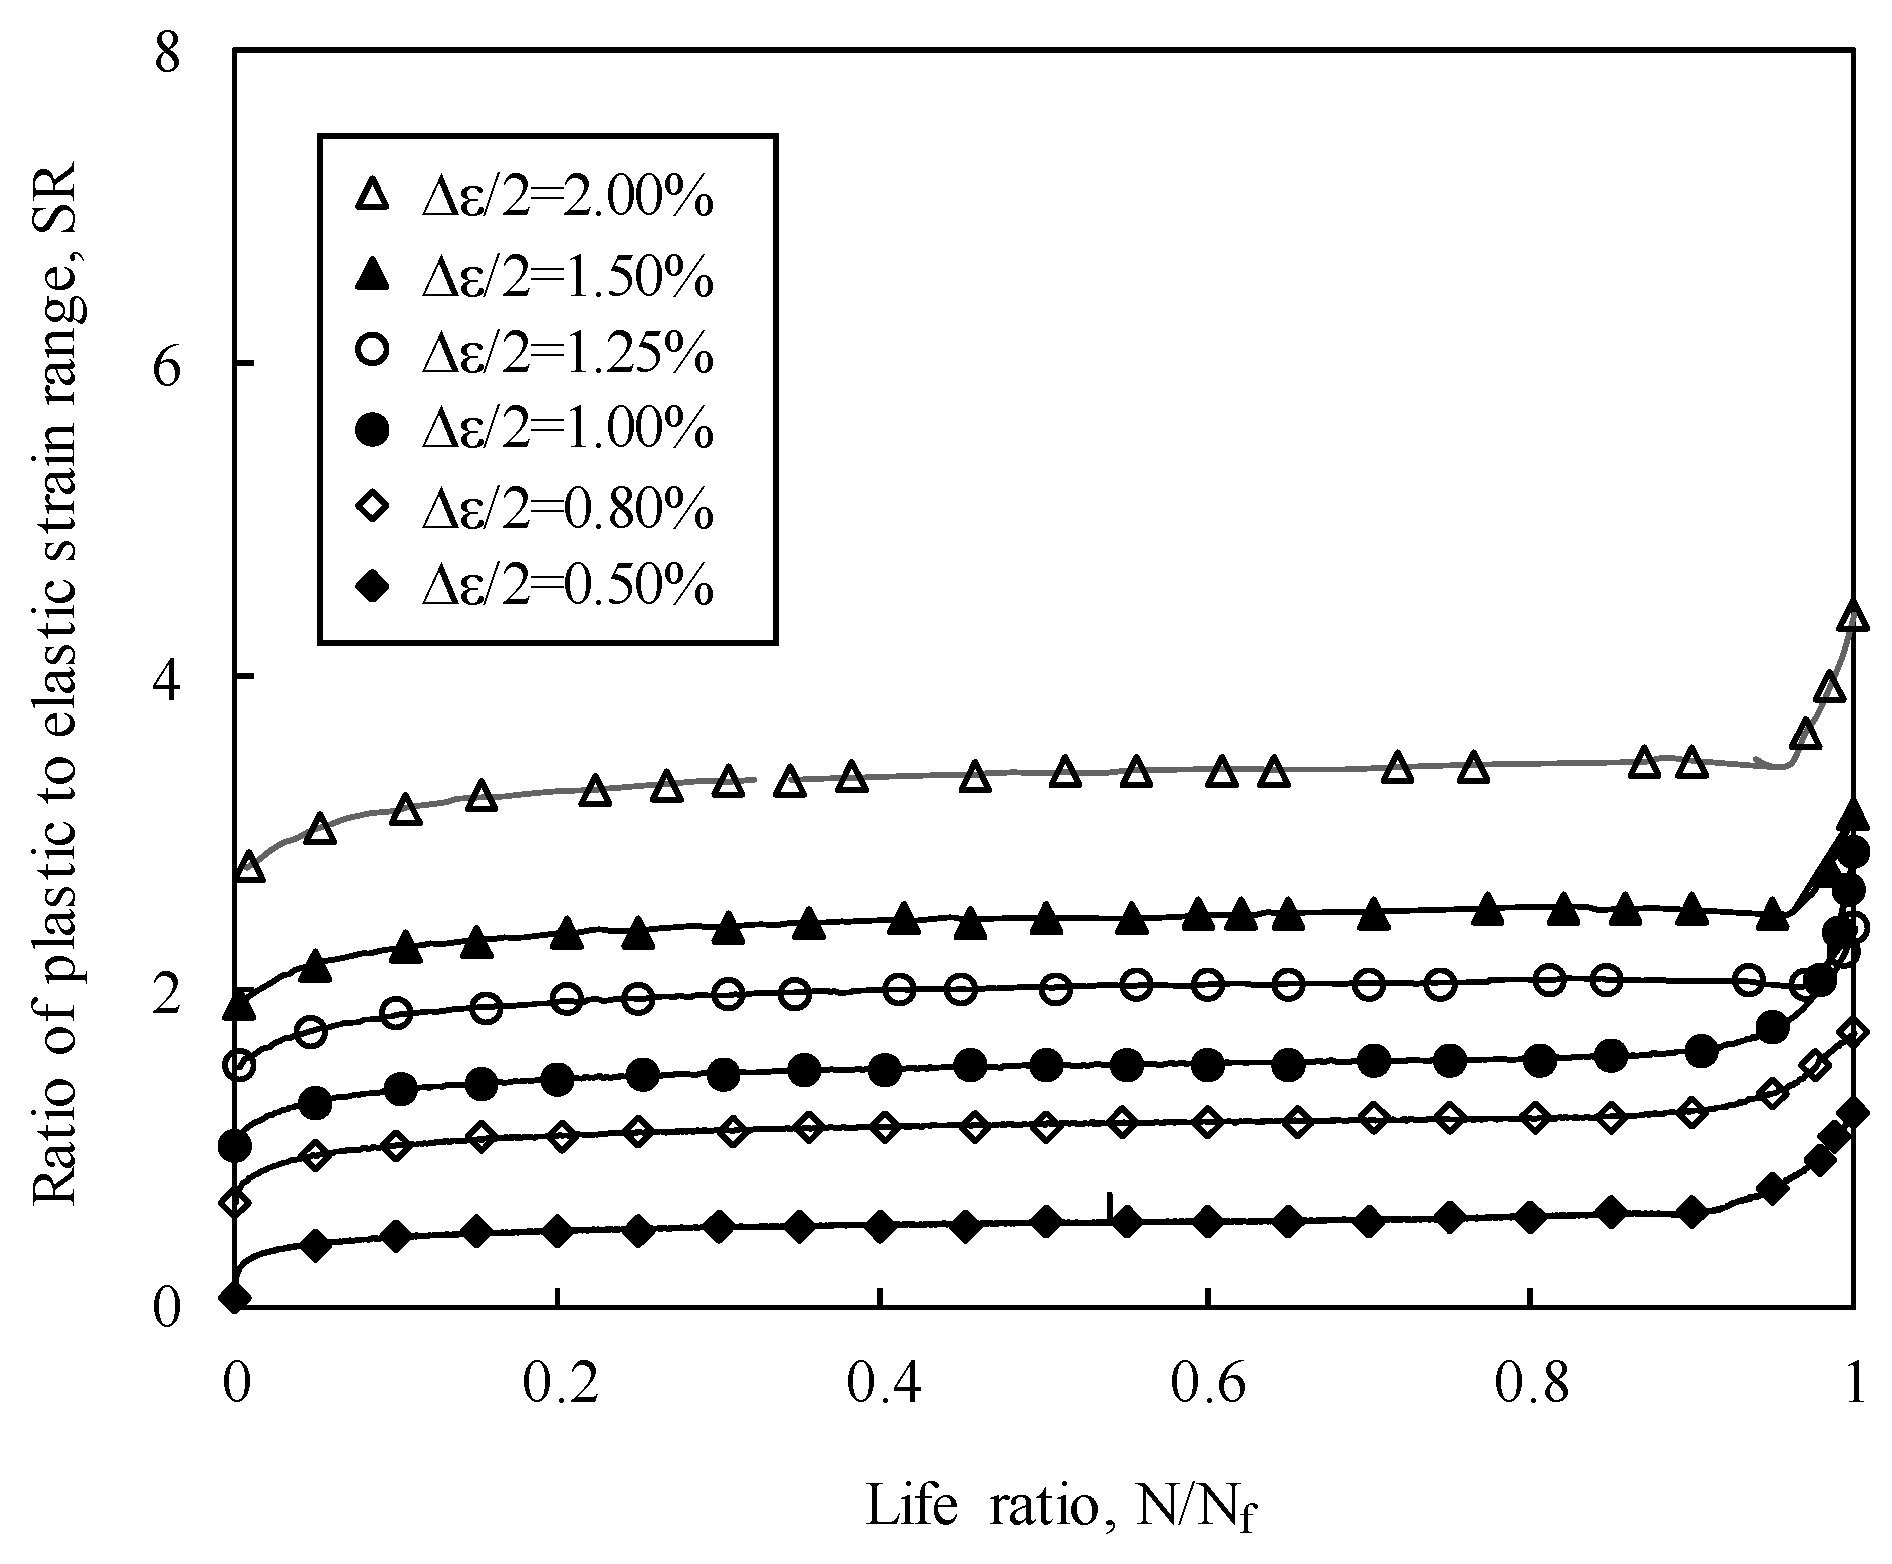
Figure 6 plots SR against the life ratio (N/Nf) for the different strain-controlled tests. As can be seen, the cyclic response comprises a rapid increase in SR, taking nearly 5% of the life ratio; followed by a region characterized by a smooth increase in this parameter up to 90%–95% of the life ratio; and a short region with a sudden increase in strain ratio until the fatigue failure. It can be also concluded that the strain ratio increases with the strain amplitude. These results are not surprising, because with the cyclic softening, the peak stress decreases (see Figure 5) and, consequently, the elastic strain range (proportional to the maximum stress) also drops, which leads to an increase in SR.
The variation of the degree of softening (DS) with the strain amplitude is presented in Figure 7. For strain-controlled conditions, DS can be expressed as
D S = σ a 1 σ a σ a 1
where σa1 is the stress amplitude at the first cycle, and σa is the stress amplitude at the half-life. According to the results presented in this figure, at the first stage, there is a rapid increase in the degree of softening with the strain amplitude, and then it gradually decreases (Δε > 0.52%) towards the minimum value. These results are in agreement with those obtained by Pape et al. [9] for this material (see Figure 7). As can be seen, the steep increase in the degree of softening for lower strain amplitudes occurs in both cases as well as the progressive reduction for higher amplitudes. Nevertheless, in the present research, the decrease in the degree of softening is more intense.
A convenient method of describing the stable material response is the cyclic stress-strain curve [10]. This curve can be represented by
Δ ε 2 = Δ σ 2 E + ( Δ σ 2 k ) 1 / n
where k’ is the cyclic hardening coefficient, and n’ is the cyclic hardening exponent. Generally speaking, it can be drawn by connecting the tips of stable hysteresis loops (at half-life) for different strain amplitudes. The stable hysteresis loops as well as the cyclic stress-strain curve are presented in Figure 8. Overall, the tips of the stable hysteresis loops are very close to the curve, either for the ascending or the descending branches, and, therefore, Ramberg-Osgood model (Equation (3)) satisfactorily describes the stabilized hysteresis loops. The k’ and n’ constants were calculated using the least square method and are presented in Figure 9.
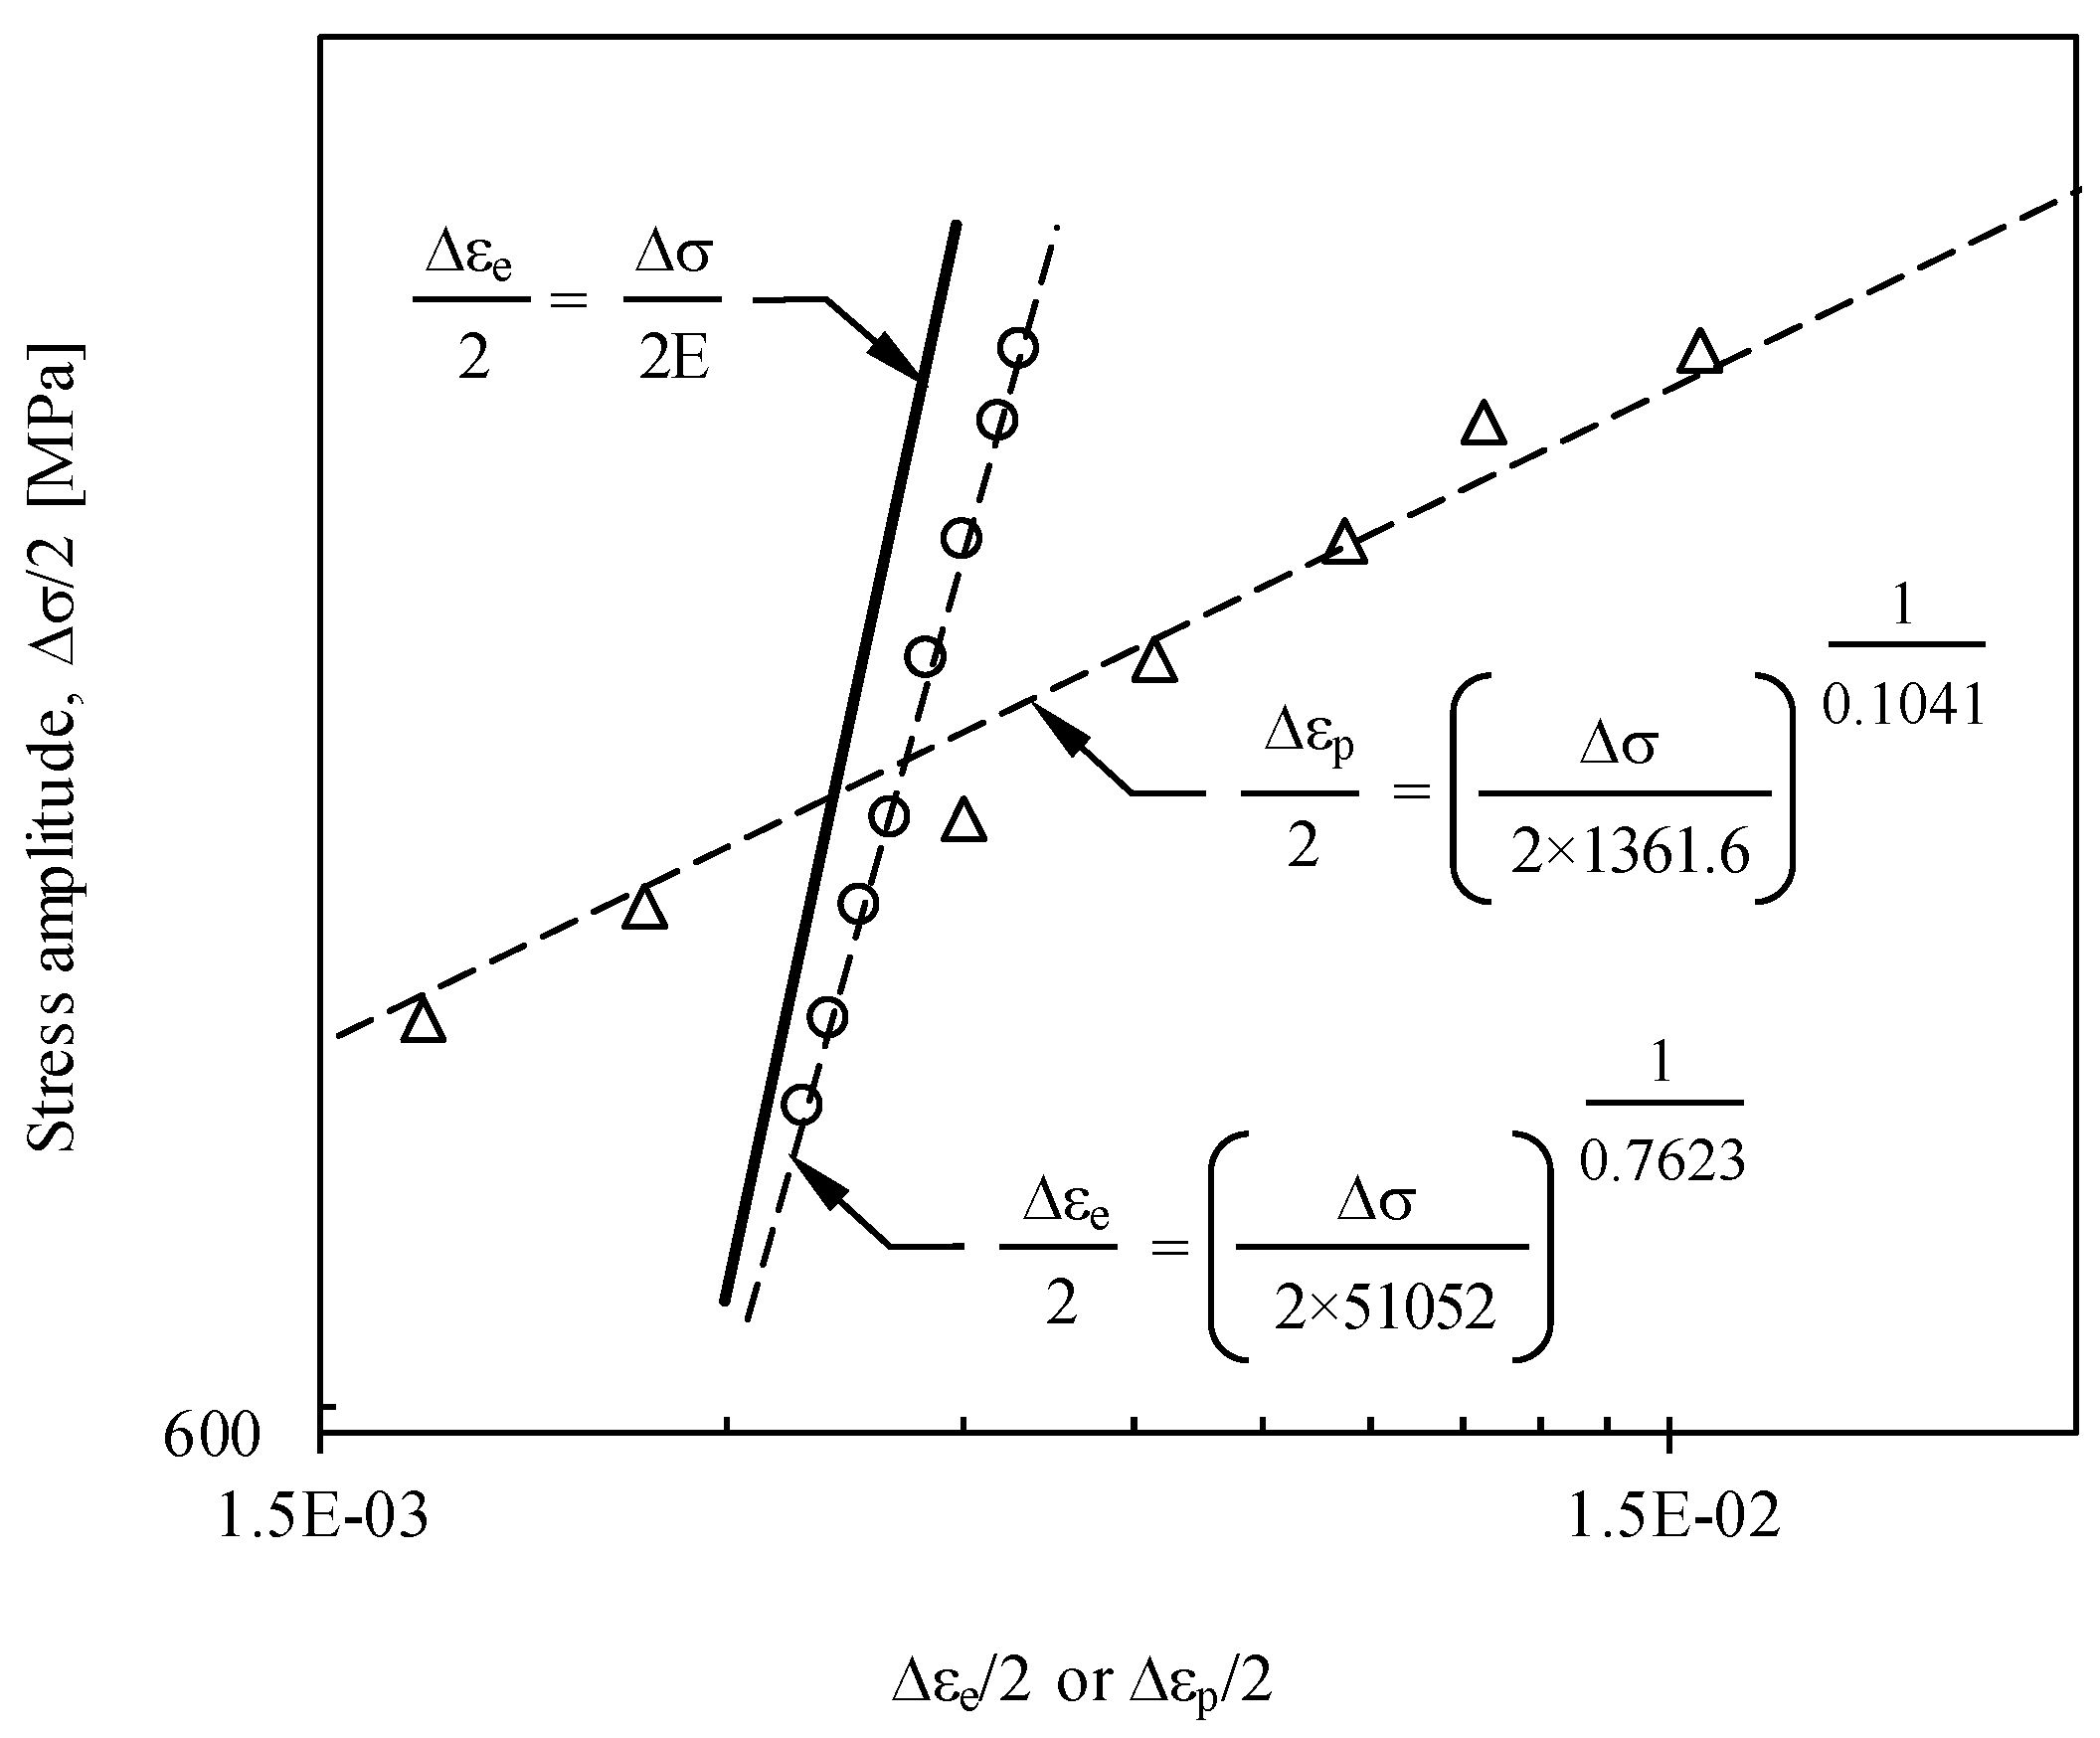
The slopes of the curves immediately after load reversal and at the start of the loading cycle are generally assumed to be equal. Although it may be reasonable for monotonic loading, the same is not valid for cyclic loading [11]. The effective elastic unloading modulus (E’), defined as the slope of the linear portion of the stable hysteresis loop upon strain reversal from the maximum load, varies with the cyclic characteristic of the material. Figure 9 plots the elastic (Δεe/2) and plastic (Δεp/2) strain amplitudes against the stress amplitude (Δσ/2) on a log-log scale. The former variable (circle symbols) was computed using E’. The prediction of the linear relationship using the value of E is also shown by the full line. In fact, there is a clear difference between both curves. In this steel, E’ decreases with the cyclic softening.

3.3.2. Low-Cycle Fatigue Properties

Stress-based approaches, first introduced by Wöhler, relate the stress amplitude (Δσ/2) and the fatigue life. Basquin [12] proposed the following relation:
Δ σ 2 = σ f ( 2 N f ) b Δ σ 2 E = σ f E ( 2 N f ) b Δ ε e 2 = σ f E ( 2 N f ) b
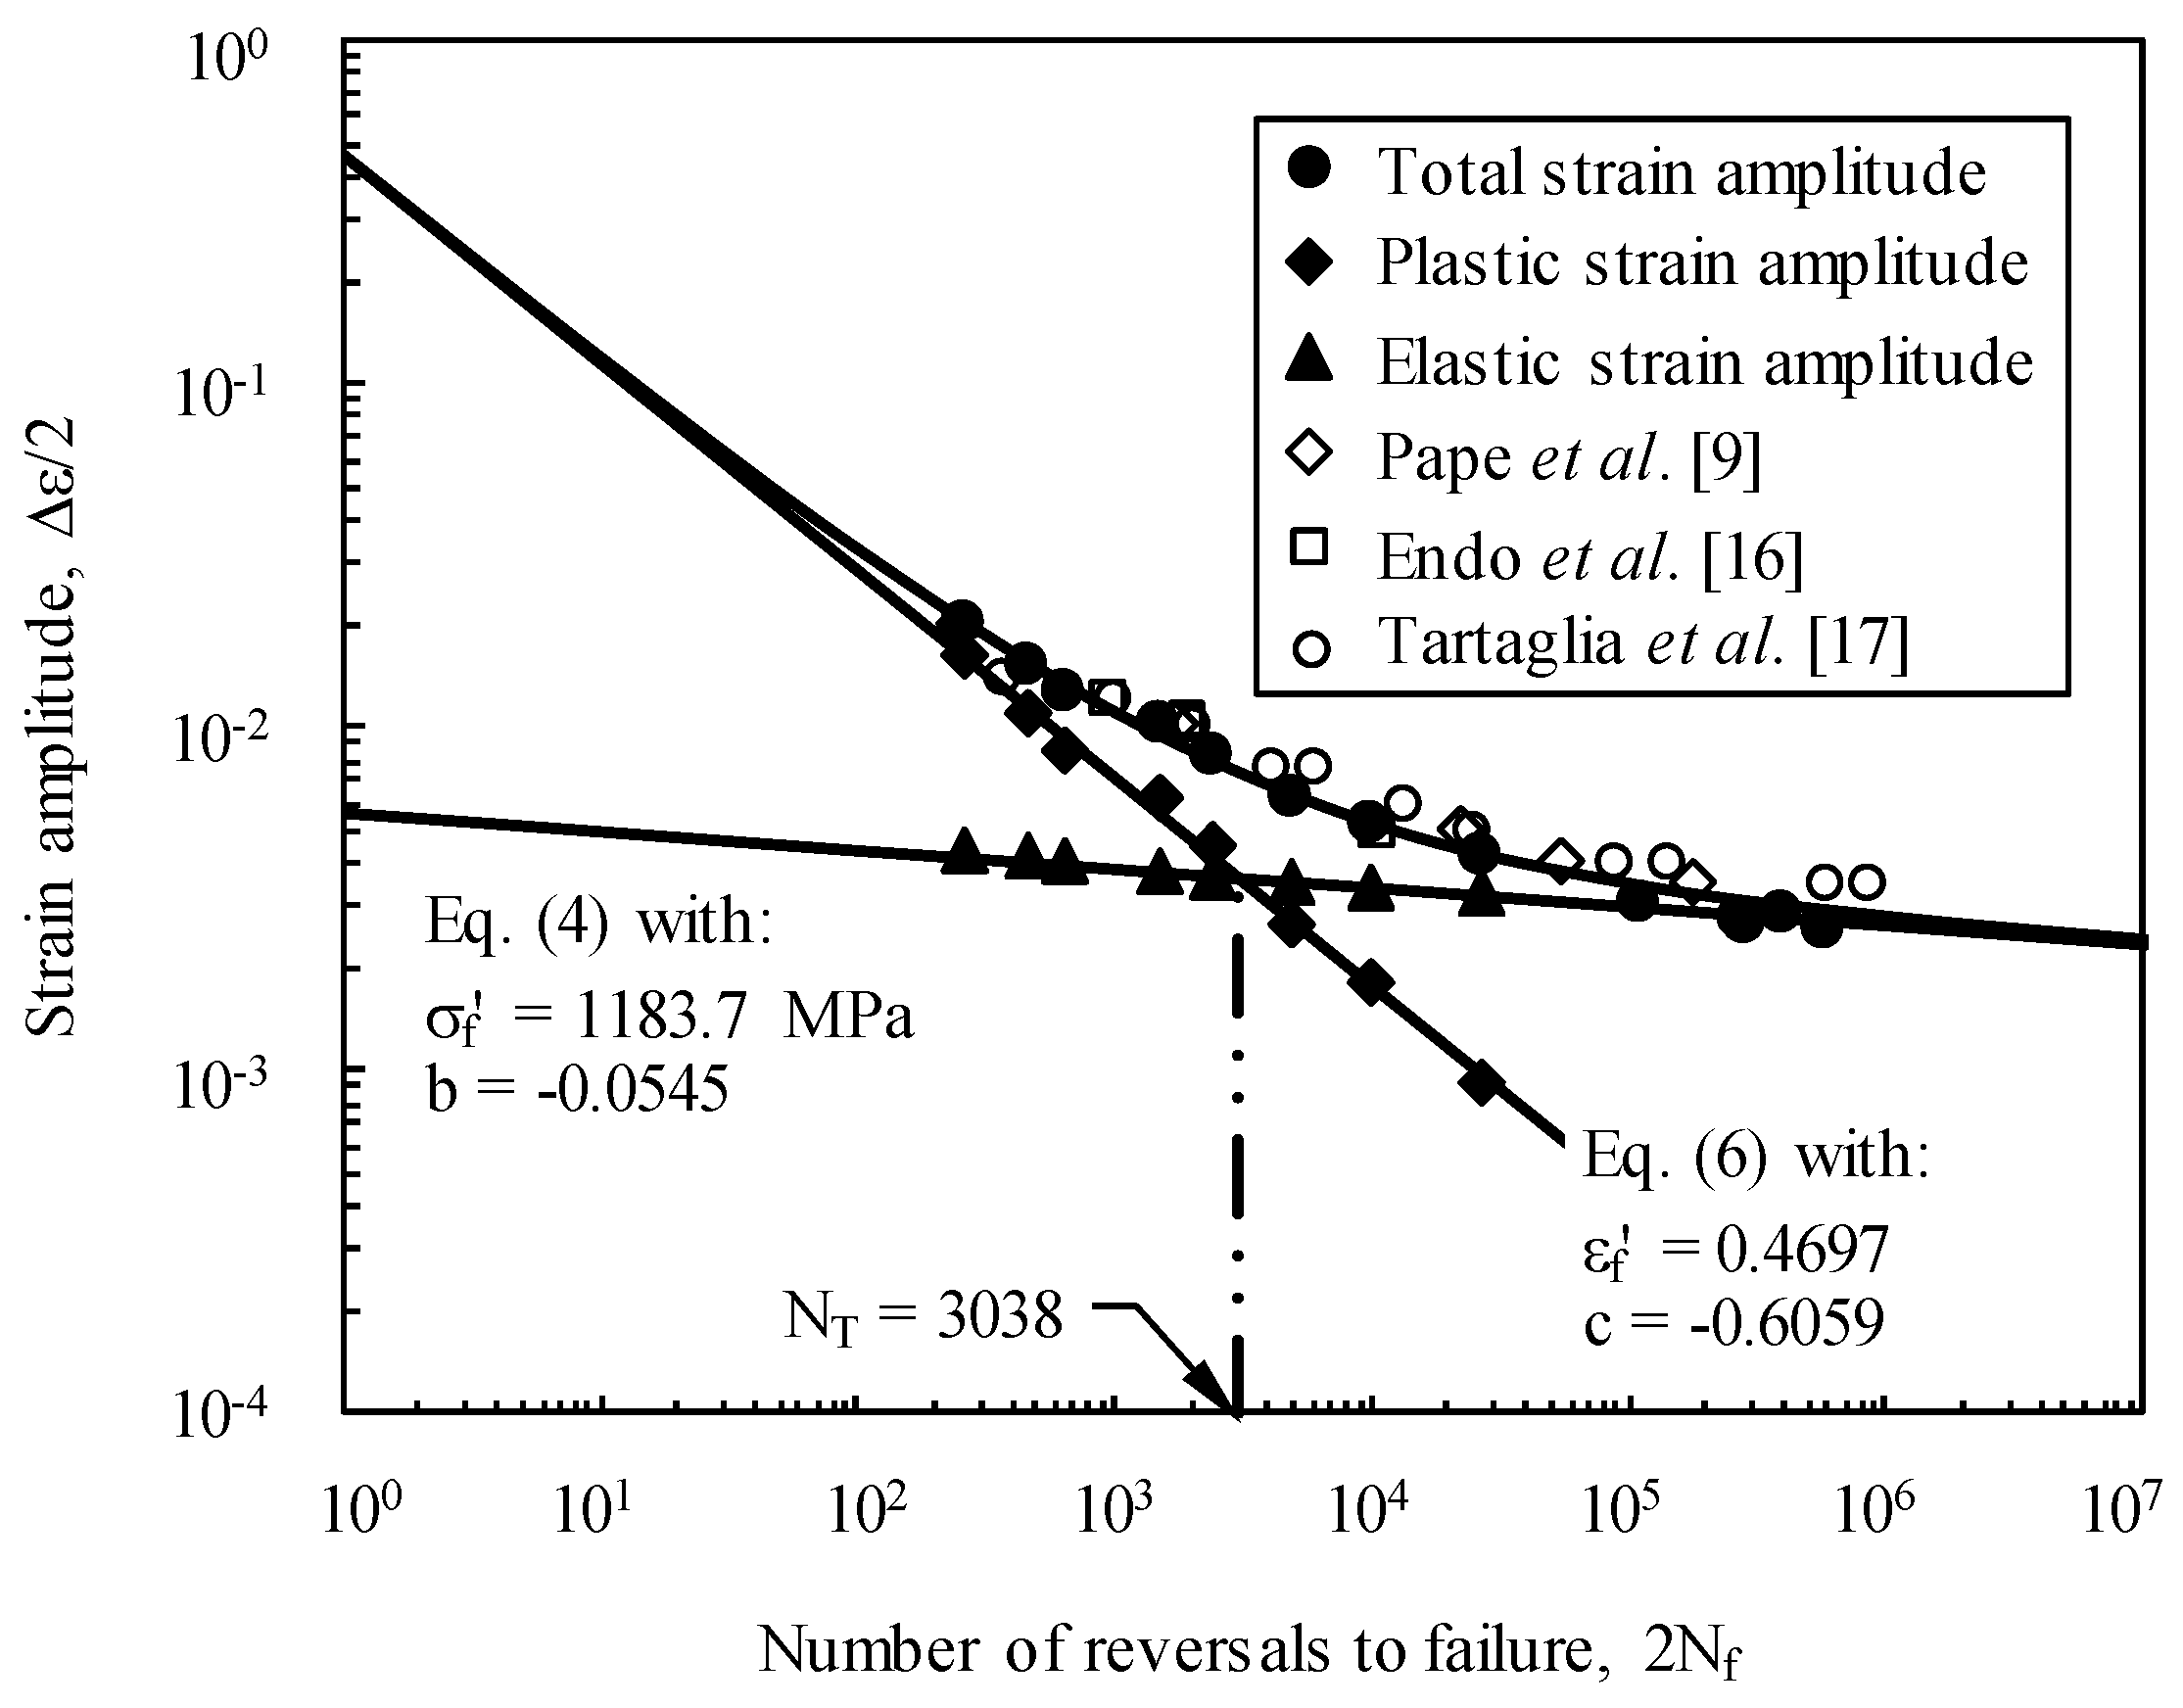
where σf’ is the fatigue strength coefficient, b is the fatigue strength exponent, and 2Nf is the number of reversals to failure. As is well-known, Equation (4), in a log-log scale, leads to a straight line, as illustrated in Figure 10. The unknowns, calculated by a best fit technique from the experimental data, are also presented in Figure 10. Based on an energy argument, Morrow [13] suggested a simple rule to relate the fatigue strength exponent to the cyclic hardening exponent (Equation (5)). The prediction (b ≈ −0.06842) is relatively close but not sufficiently precise. Note that the error is about 20%. In view of this fact, such a rule is not applicable in the case of this material.
b n 1 + 5 n
Strain-based approaches, in essence, establish relations between the elastic or plastic strain amplitude and the fatigue life. For low-cycle fatigue (Δεp > Δεe), as first observed by Coffin and Manson [14,15], the plastic strain amplitude (Δεp/2) and the number of reversals to failure (2Nf) can be expressed in the following form:
Δ ε p 2 = ε f ( 2 N f ) c
where εf’ and c are the fatigue ductility coefficient and the fatigue ductility exponent, respectively. This equation, in a log-log scale, leads to a straight line, as shown in Figure 10. The unknowns, evaluated by a best fit technique from the experimental data, are also listed in Figure 10. A similar relation to that of Equation (5) was proposed by Morrow [13] to relate c and n’ (Equation (7)). The predicted value (c ≈ −0.6579) is relatively close. The difference, in this case, is about 8%. However, in general, the correlation between experimental and predicted exponents is rather weak.
c 1 1 + 5 n
The fatigue strength relationship, defined in terms of total strain amplitude (see Equation (8)), is also plotted in Figure 10. The transition point (NT), defined as the life at which both the elastic and plastic strain amplitudes are equal, is relatively small (NT = 3038). For lives lower than NT, the plastic strain component prevails over the elastic one and vice versa. Thus, it can be concluded that longer lives (NT > 3038) require stress amplitudes lower than 815.8 MPa (Equation (4)) and strain amplitudes smaller than 0.73% (Equation (6)). The values of the total strain-life curve obtained in this study were compared with results found in the literature for the DIN 34CrNiMo6 high-strength steel [9,16,17]. Regardless of the sources and objectives of the studies, the results are all very close (see Figure 10).
Δ ε 2 = 1183.7 E ( 2 N f ) 0.0545 + 0.4697 ( 2 N f ) 0.6059
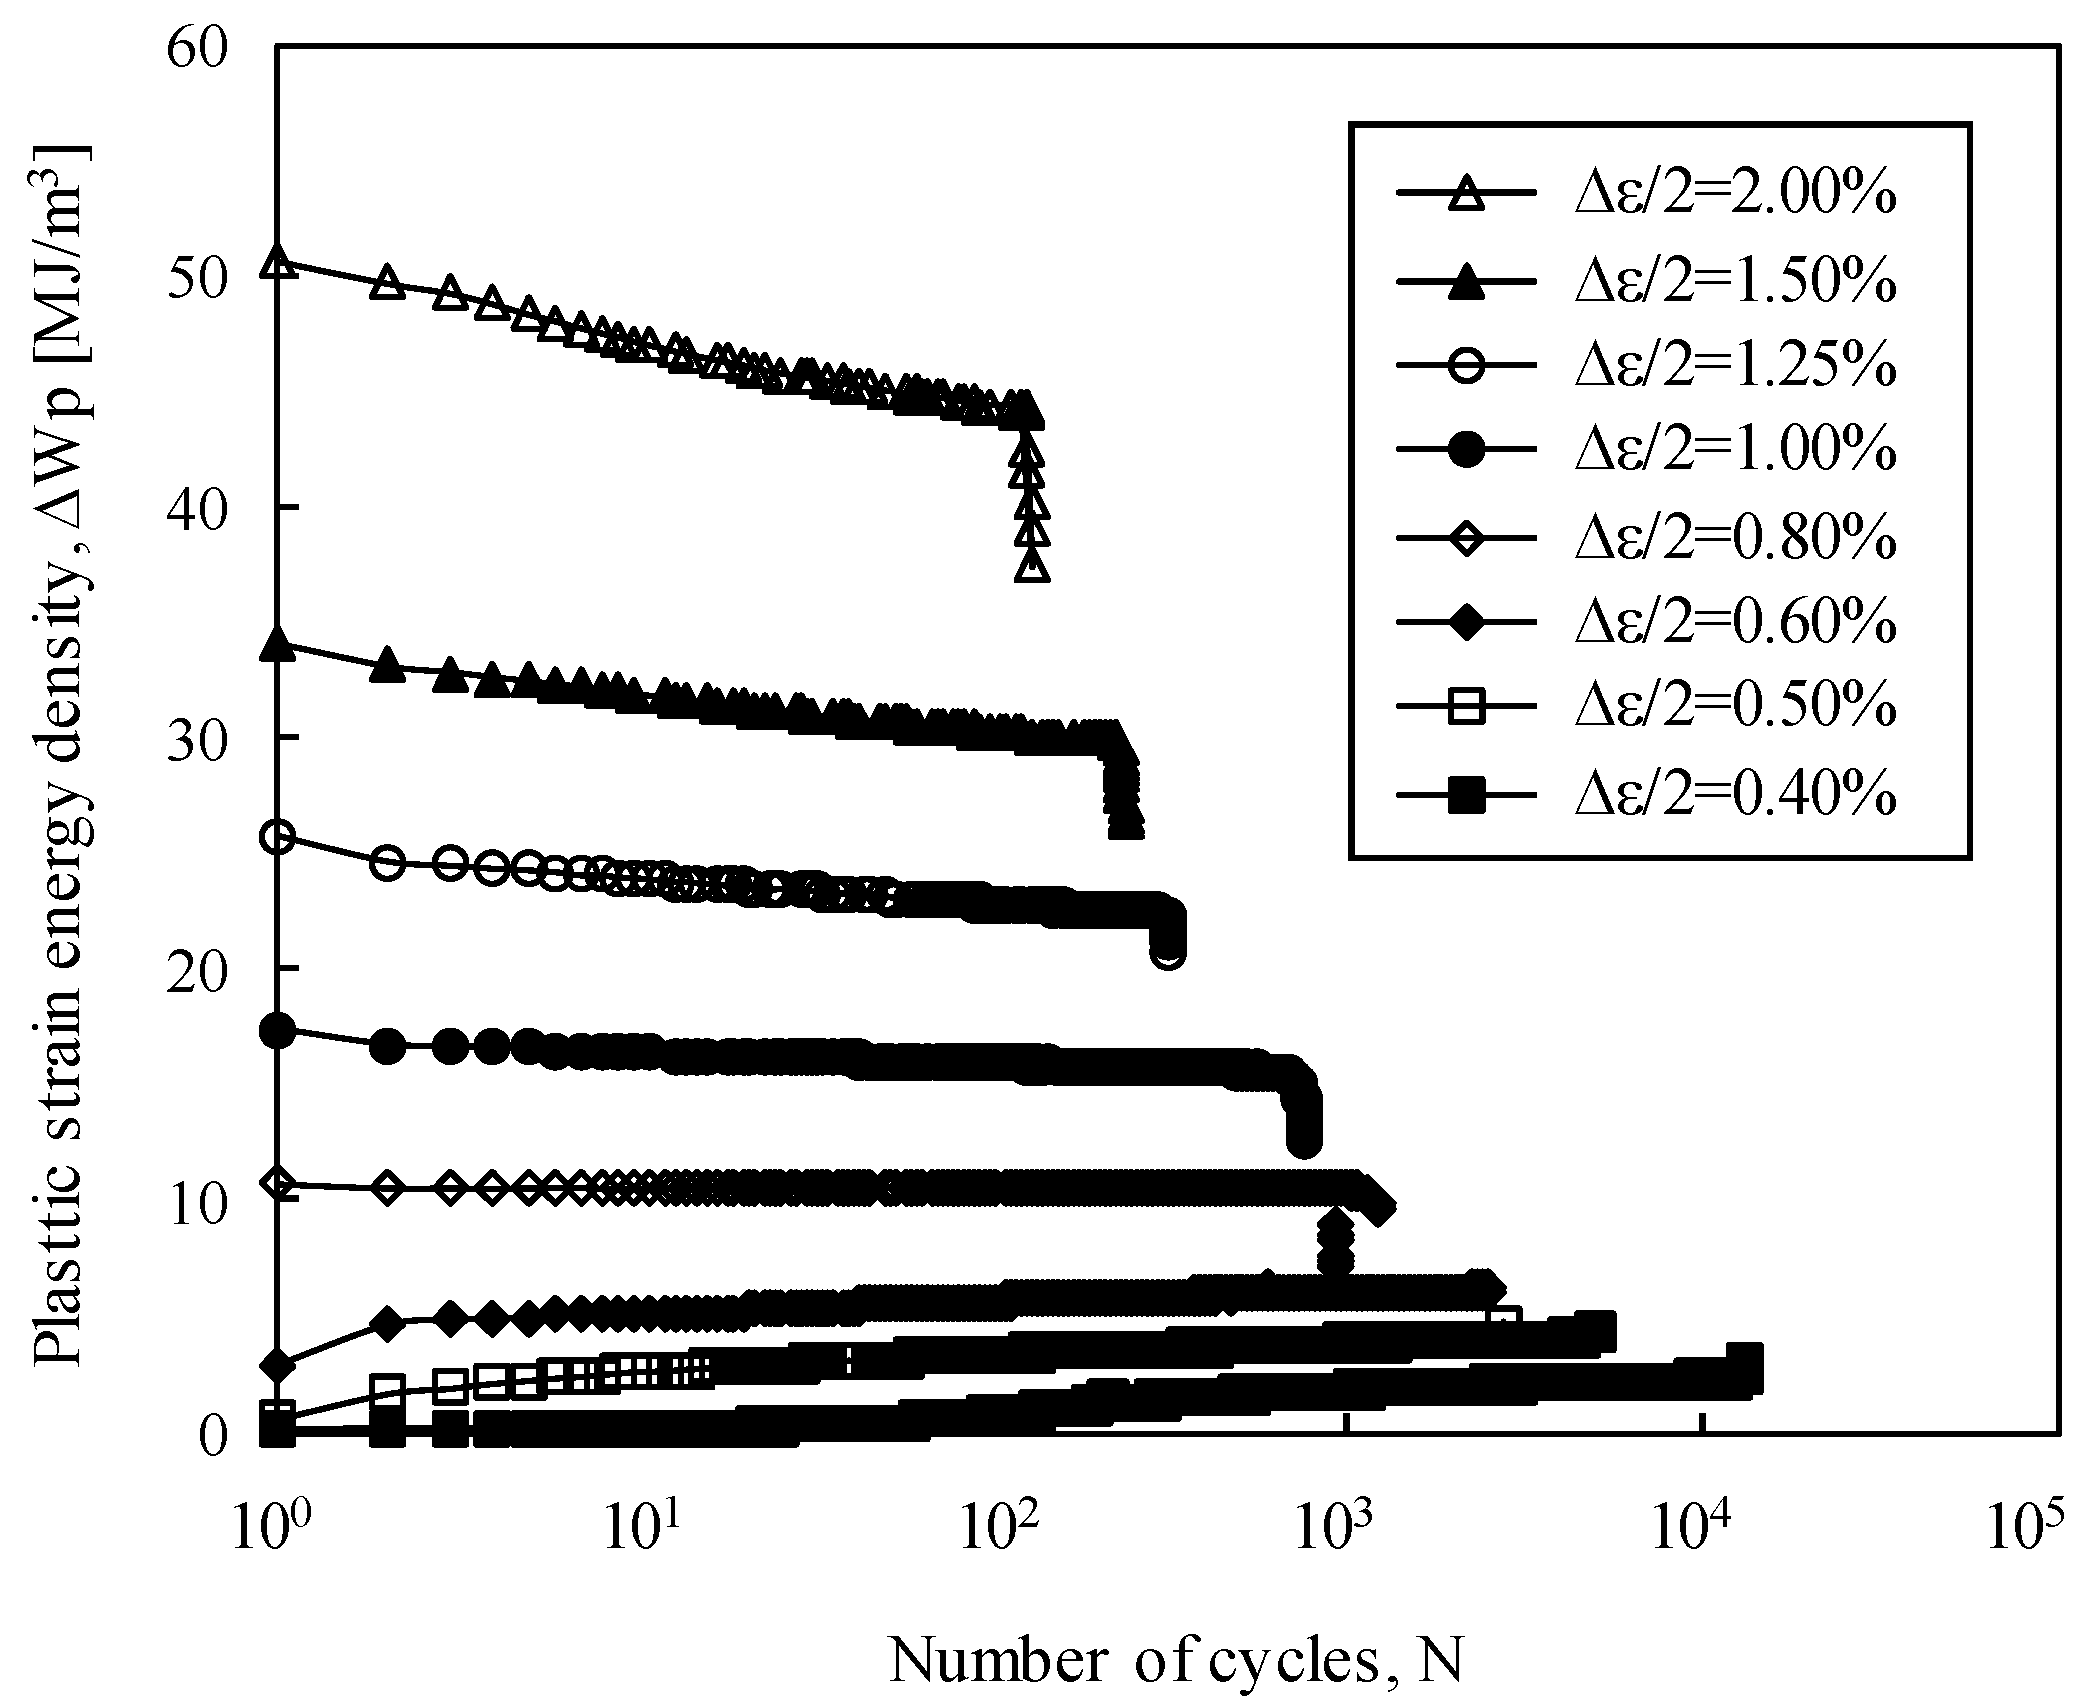
Energy-based approaches assume that the dissipated strain energy per cycle is a main contribution to the fatigue damage process. The plastic strain energy dissipated per cycle (ΔWp) due to plastic deformation is the area of the hysteresis loop. Under strain-controlled conditions, this parameter is almost constant during the life, which is a clear advantage (see Figure 11). For total strain amplitudes lower than ±0.5%, ΔWp slightly increases with the progress of fatigue life. In contrast, for greater values of Δε/2, there is a smooth decrease with the number of cycles.
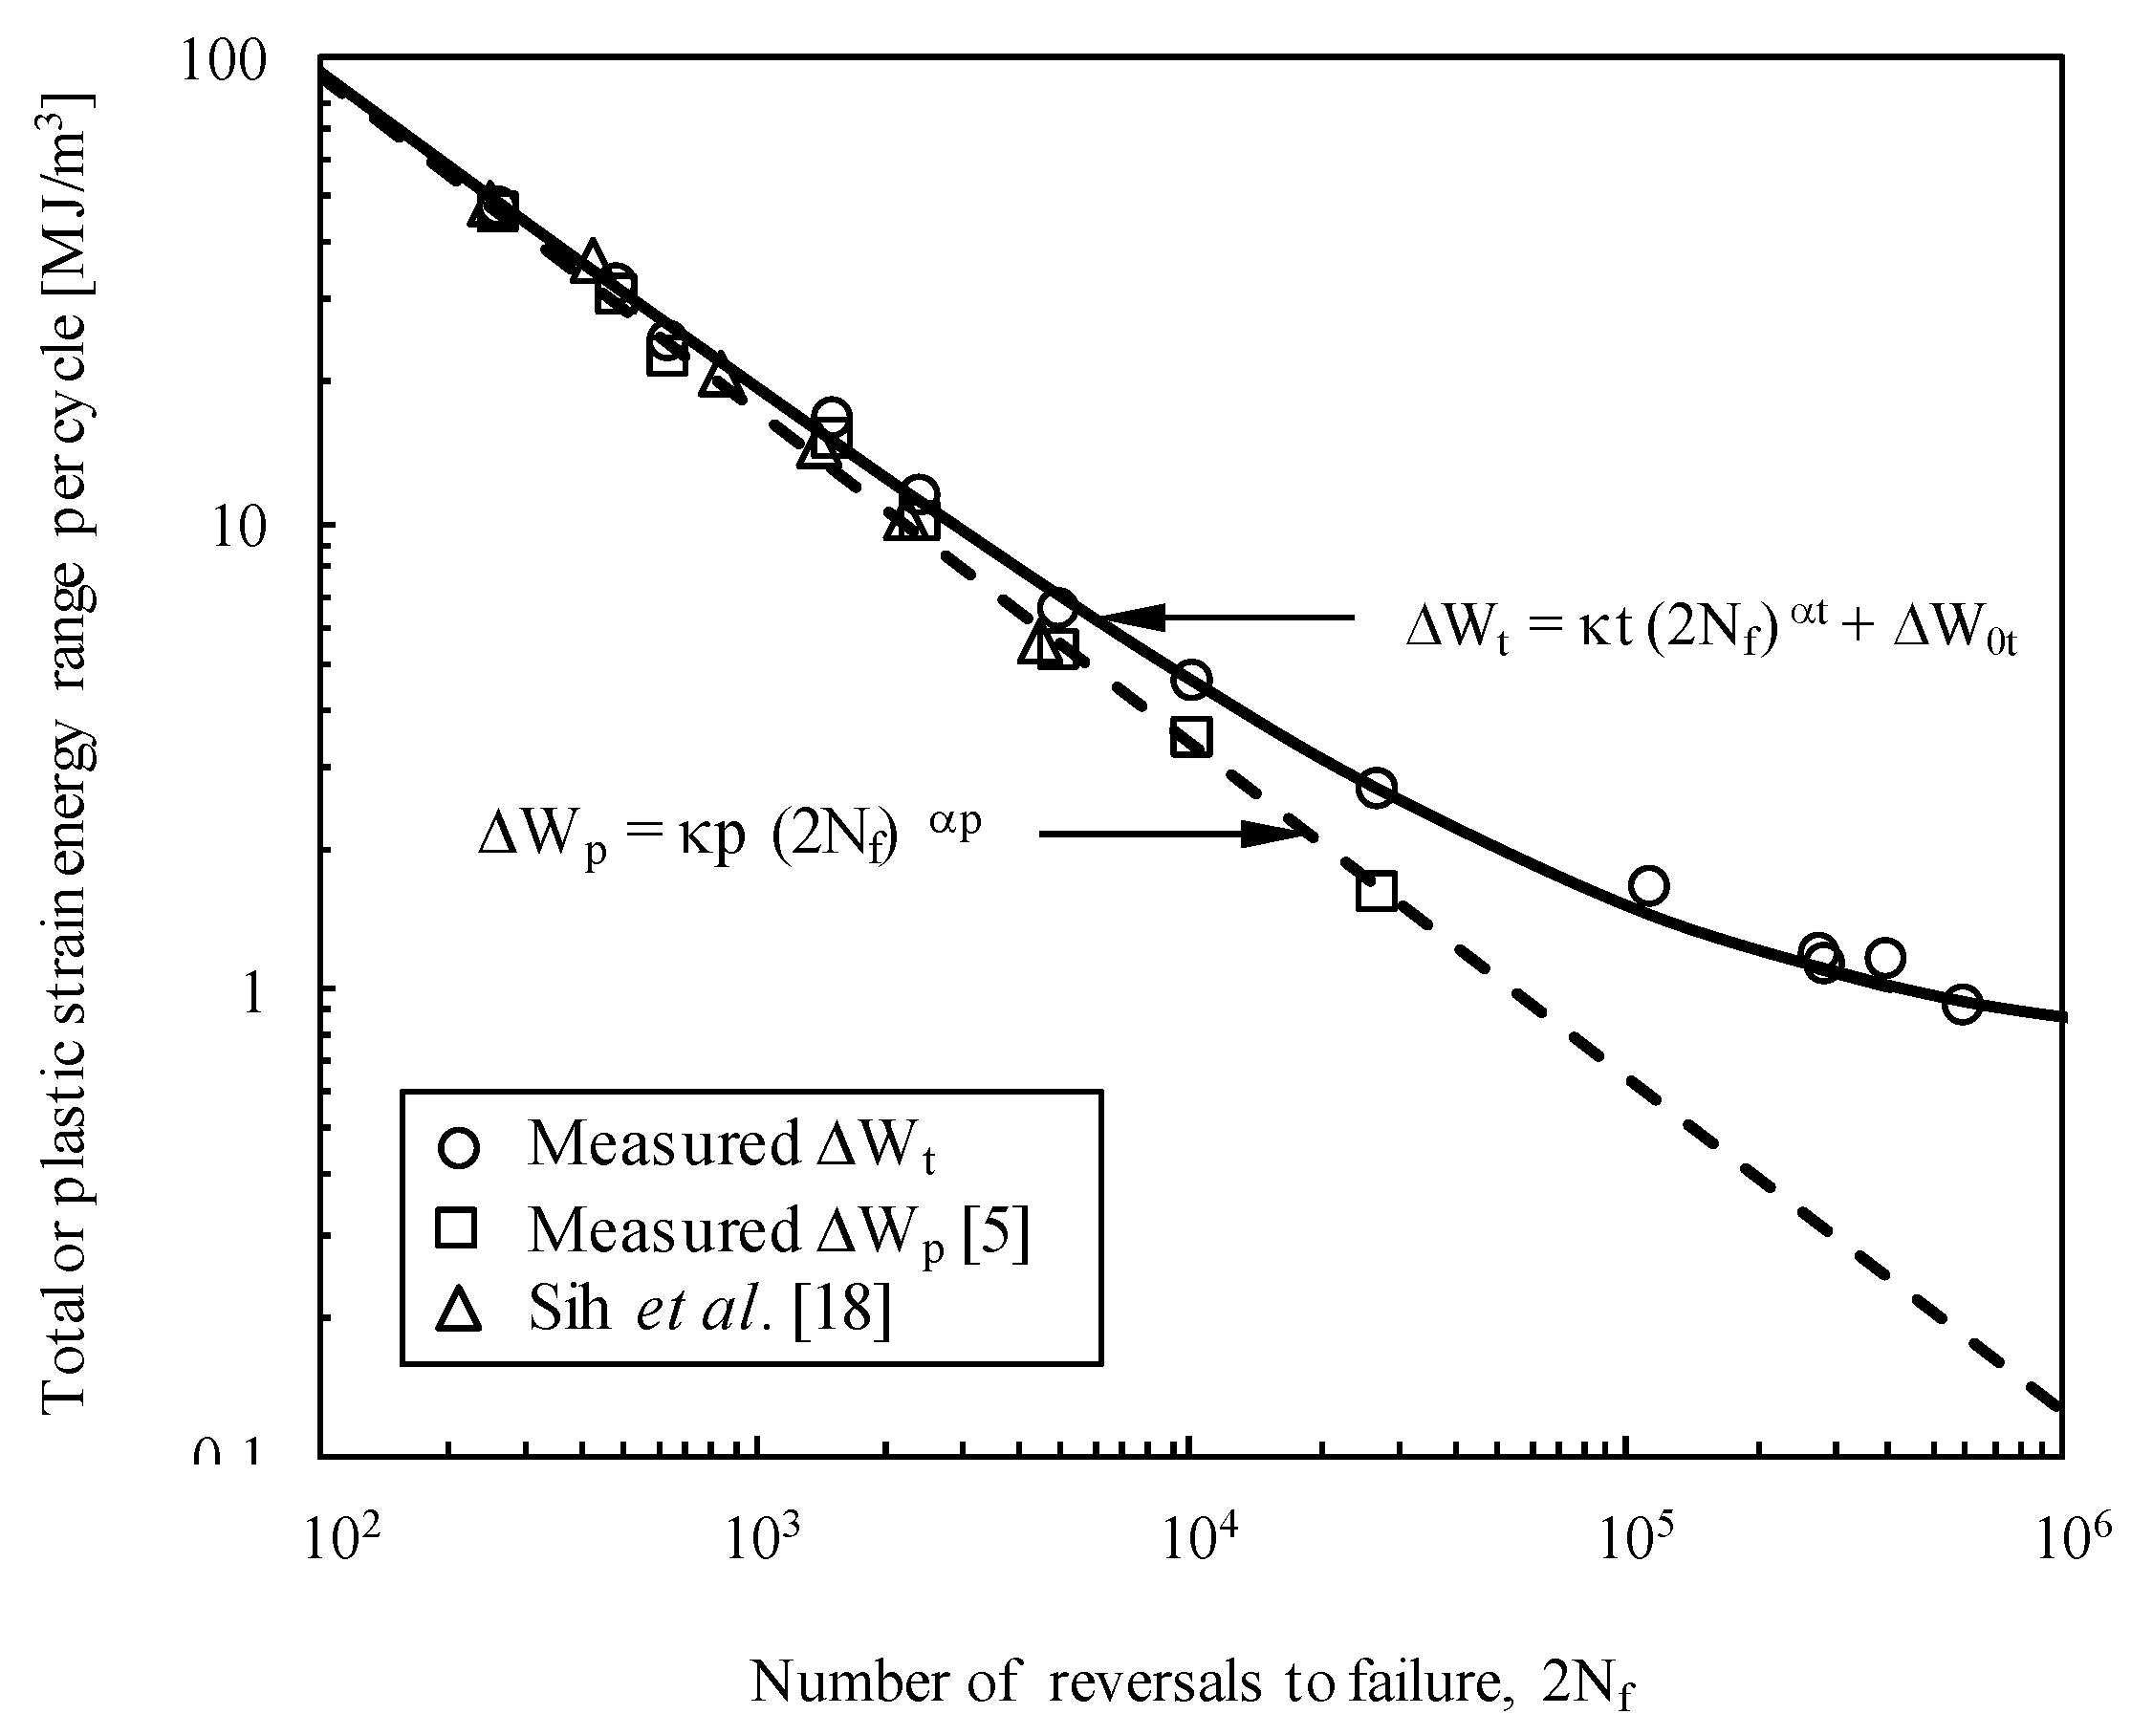
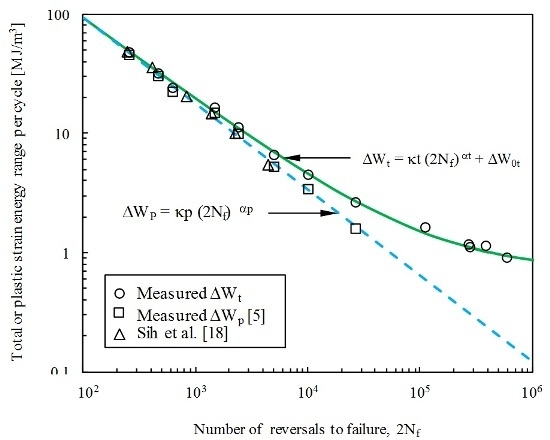
Figure 12 presents a plot of the ΔWp at the half-life versus the number of reversals to failure (2Nf). For high-strength steels, the plastic strain energy dissipated per cycle versus the number of reversals to failure, in a log-log scale, can be satisfactorily fitted by a straight line [11], i.e.,
Δ W p = κ p ( 2 N f ) α p
where κp and αp are two unknowns determined from the experimental data. The unknowns were obtained using the least square method and are listed in Table 3. The experimentally measured values of ΔWp were compared with predictions obtained in the literature [18]. As can be observed, the predicted values are practically superimposed on the dashed line and, therefore, are in good agreement with those measured experimentally.
This approach, as a damage parameter, has certain limitations. For longer lives, close to the fatigue limit of the material, ΔWp is a very small value, which makes it difficult to measure. To overcome this, the total strain energy (ΔW), given by the sum of the elastic and plastic strain energies, can be used to our advantage. However, both ΔWp and ΔW approaches are more suitable for fully-reversed or almost fully-reversed tests since they are not sensitive to the mean stress. Thus, the formulation proposed by Golos et al. [19] is preferable. In this case, both the sum of the hysteresis energy (ΔWp) and elastic energy associated with the tensile stress (ΔWe+) are used, i.e.,
Δ W t = Δ W p + Δ W e +
where ΔWp is the plastic strain energy per cycle, and ΔWe+ is the tensile elastic strain energy per cycle.
Figure 12 presents, in a log-log scale, the total strain energy range per cycle versus the number of reversals to failure. The experimental data can be fitted using the following expression [18]:
Δ W t = κ t ( 2 N f ) α t + Δ W 0 t
where κt > 0 and αt < 0. The constant ΔW0t is the tensile elastic energy at the material fatigue limit. The κt and αt constants can be determined from the best fit to the experimental data. Table 3 lists the final values calculated using the least square method. As can be seen from Figure 12, the total strain energy range per cycle is a very good correlating parameter for the fatigue life interval studied here. All the results are very close to the proposed function (Equation 11). The value of ΔW0t corresponds to a fatigue limit stress amplitude of 537 MPa. This is satisfactorily close to the values reported in the literature (526 ± 15 MPa) by Rabb [20] for smooth specimens subjected to tension-compression (R = −1).

3.3.3. Analysis of Fracture Surfaces

The analysis of the macroscopic surface morphologies after the low-cycle fatigue tests showed identical conclusions, i.e., fracture surfaces with angles at about 45° in relation to the loading axis [5]. A more detailed observation revealed the propagation of several cracks nucleated at the periphery of the specimens, leading to the formation of various fatigue steps, as a result of the junction of different propagation planes. The presence of fatigue striations combined with secondary cracks was also identified, which is evidence of transgranular crack propagation.
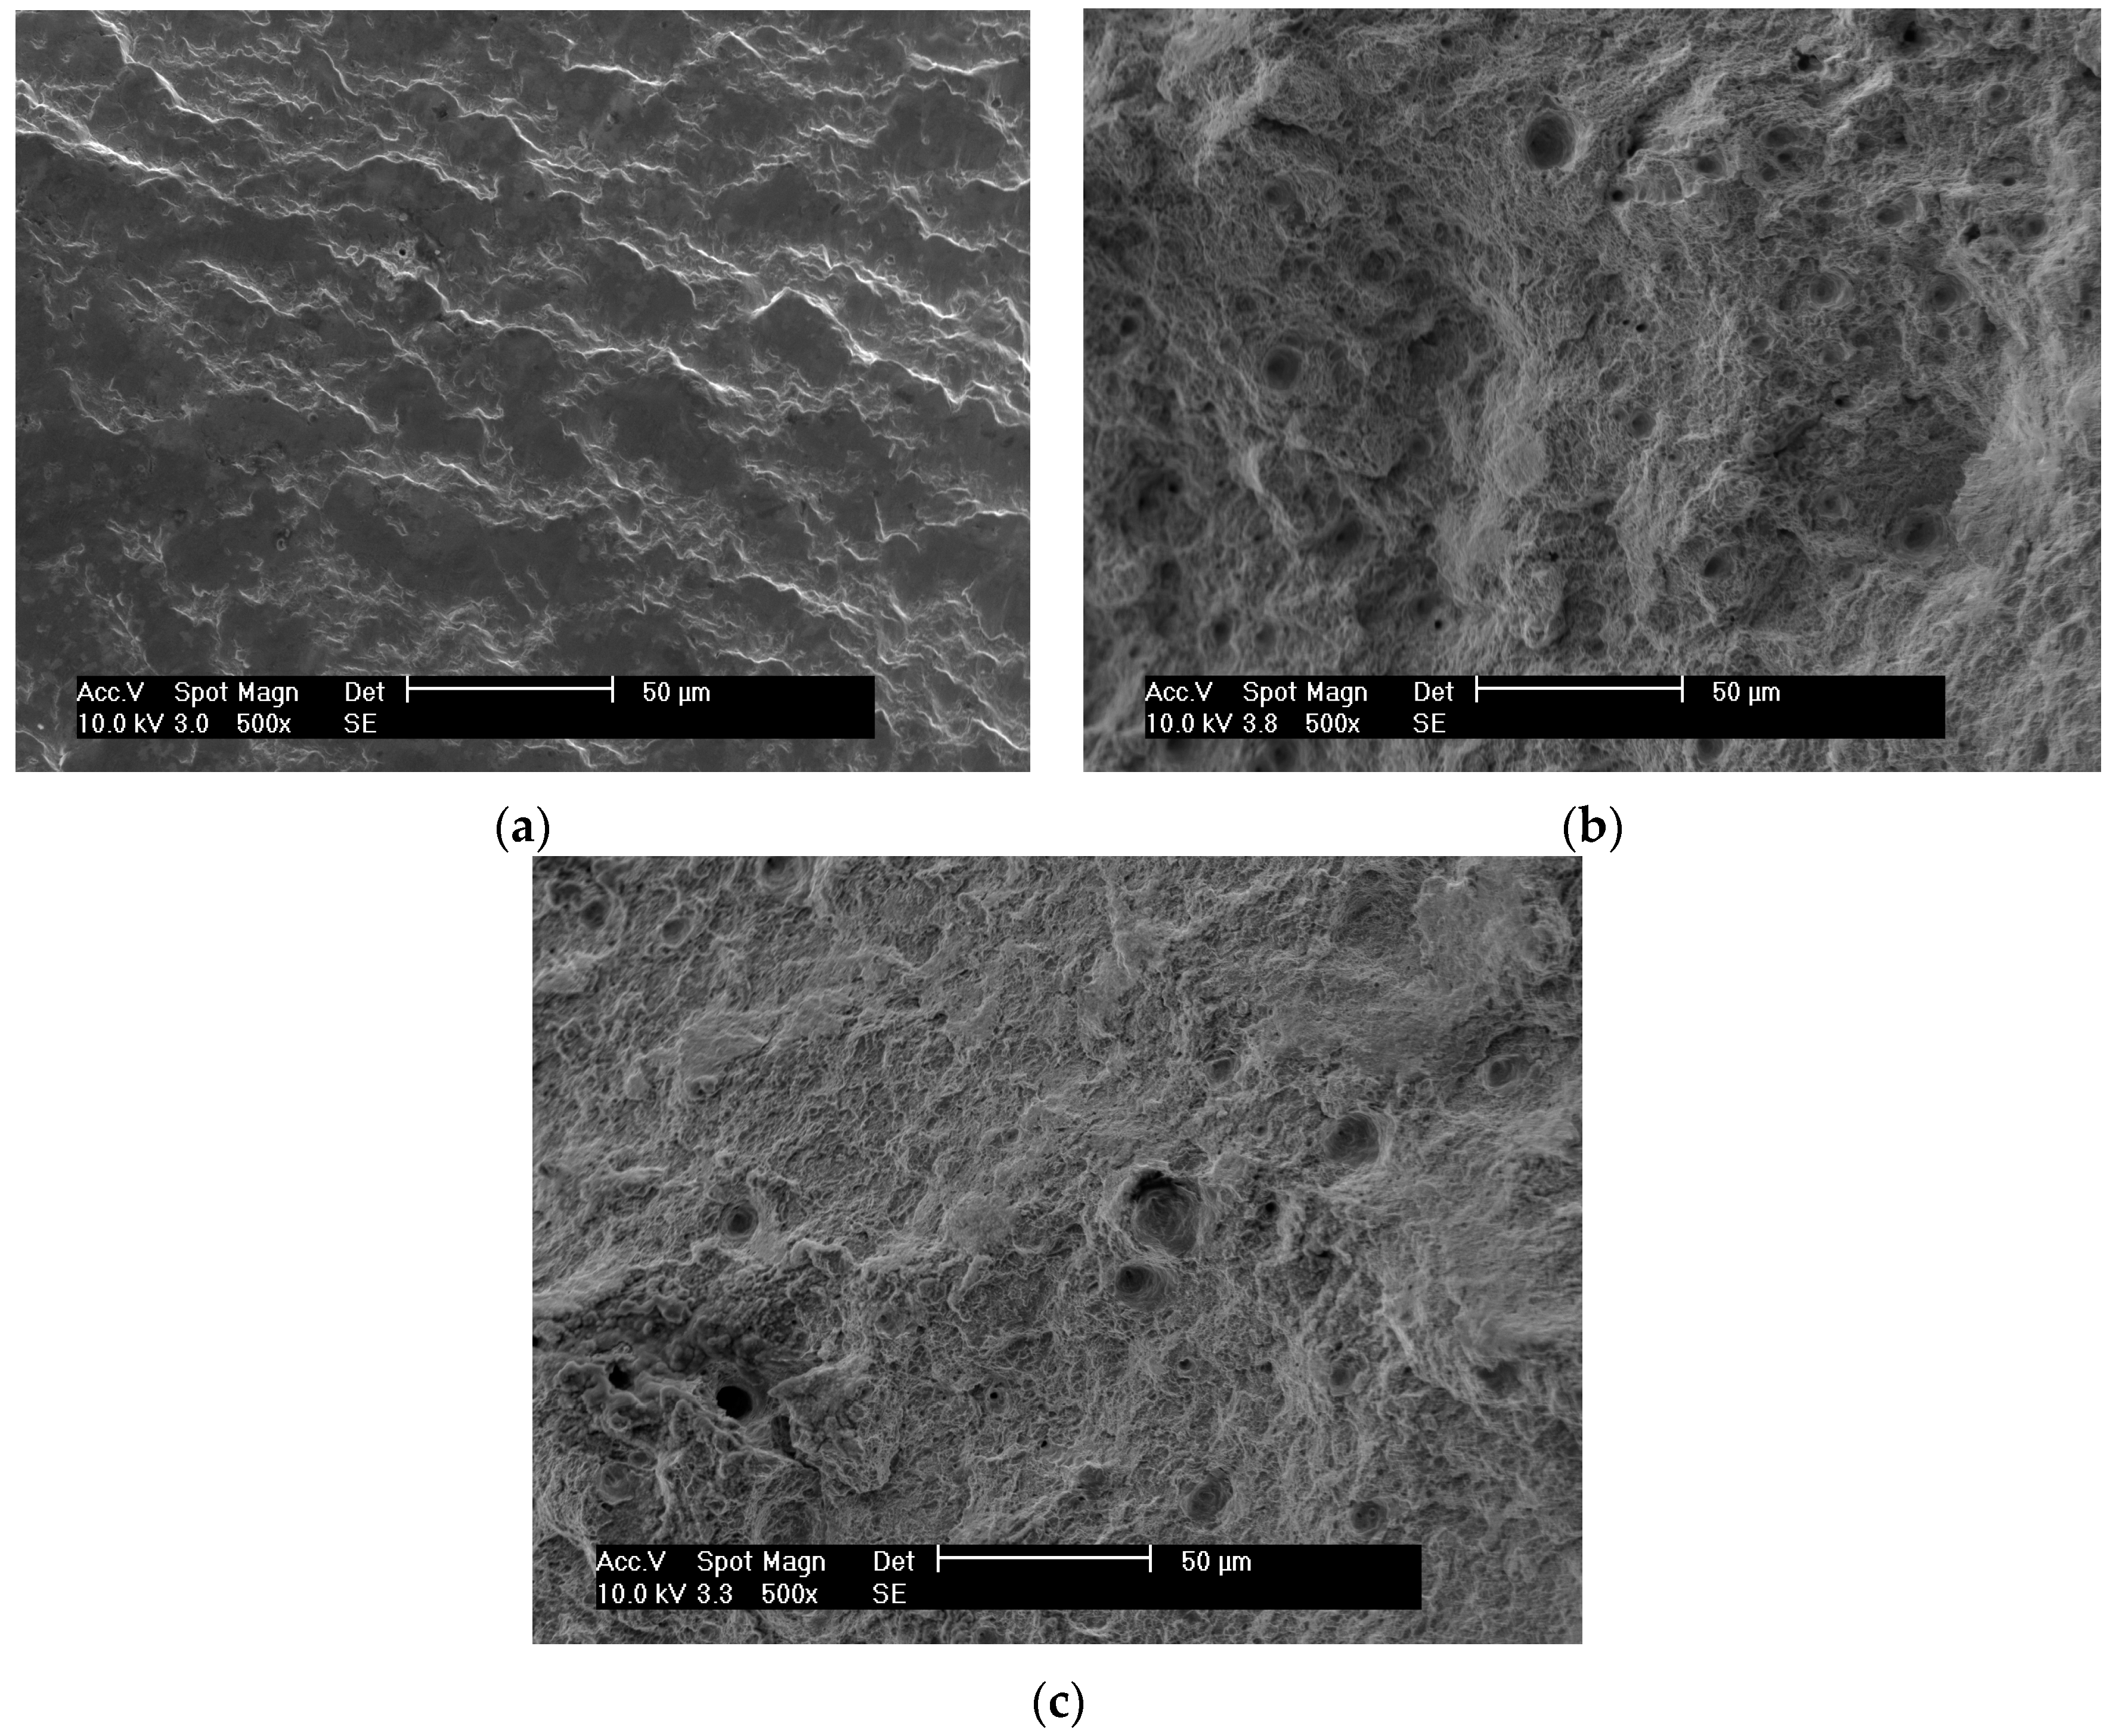
Figure 13a–c presents typical SEM images of fracture surfaces taken at high magnification near the crack initiation sites for different strain amplitudes. At lower strain amplitudes (Figure 13a), the initiation site is clearly dominated by cleavage-like facets, while at higher strain amplitudes (Figure 13b,c) the initiation site is a mixed of cleavage-like facets and ductile dimples. Moreover, the higher the strain amplitude, the more numerous the ductile dimples. The fatigue damage mechanism observed here results from the cyclic solicitations applied, which cause extrusions and intrusions leading to the formation of a microcrack smaller than the grain size along the slip band at the specimen surface. Then, the microcrack grows through the grain boundaries and eventually can form, by coalescence of shorter cracks, a critical one that propagates into the bulk perpendicularly to the stress axis.

4. Conclusions

In the present research, the monotonic and cyclic plastic deformation behavior of DIN 34CrNIMo6 high-strength steel has been investigated. Tests were carried out in ambient air, at room temperature, using standard specimens. After the tests, fracture surfaces were examined by scanning electron microscopy in order to characterize the surface morphologies and the main failure mechanisms. The following conclusions can be drawn:
  • The material exhibited a fine microstructure mainly composed of martensite and lower bainite. The average grain size obtained from the procedure described by the ASTM E112 standard was about 8 μm. As usual in this high-strength steel, inclusions with different sizes, ranging from 2 to 30 μm, were found;
  • The monotonic behavior of the material was investigated from uniaxial tensile tests conducted according to the procedure described in the ASTM E8 standard. The monotonic stress-strain curve was characterized by a yield point elongation (0.59% < ε < 2.4%); an ultimate tensile strength recorded for a total strain equal to 8.7%; and a large region of non-uniform plastic deformation with a maximum total strain greater than 17.2%. The fracture surfaces revealed a mixed mechanism involving microvoid coalescence and cleavage;
  • The cyclic plastic behavior of the material was studied under fully-reversed strain-controlled conditions. A strain-softening phenomenon was observed throughout the entire life. This behavior was identified regardless of the strain amplitude. The degree of softening was in line with the results available in the literature, i.e., a first stage of rapid increase (up to Δε/2 < 0.52%) and a second stage of progressive and smooth reduction;
  • The effective elastic unloading modulus (E’), defined as the slope of the linear portion of the stable hysteresis loop upon strain reversal from the maximum load, varied with the cyclic characteristic of this steel. The softening behavior observed here caused a decrease in E’;
  • The total strain energy density, defined as the sum of both tensile elastic and plastic strain energies, was revealed to be an adequate fatigue damage parameter for short and long lives. On the other hand, the plastic strain energy density is more recommended for shorter lives;
  • The SEM micrographs evidenced transgranular crack propagation. For higher strain amplitudes, initiation sites revealed a blend of cleavage facets with areas of ductile dimples; for lower amplitudes, initiation sites were dominated by cleavage facets.

Acknowledgments

The authors are indebted to the Portuguese Foundation for the Science and Technology (FCT) and COMPETE program from FEDER (European Regional Development Fund) for the financial support (Project UID/EMS/00285/2013).

Author Contributions

José D. M. Costa designed the experiments; Ricardo Branco and José D. M. Costa performed the experiments; All the authors contributed to writing the paper.

Conflicts of Interest

The authors declare no conflict of interest.

References

  1. Murty, Y.V.; Morral, J.E.; Kattamis, T.Z.; Mehrabian, R. Initial coarsening of manganese sulfide inclusions. Metall. Mater. Trans. 1975, 6A, 2031–2039. [Google Scholar] [CrossRef]
  2. Lee, W.S.; Su, T.T. Mechanical properties and microstructural features of AISI 4340 high-strength alloy steel under quenched and tempered conditions. J. Mater. Proc. Technol. 1999, 87, 198–206. [Google Scholar] [CrossRef]
  3. Costa, J.D.; Ferreira, J.M.; Ramalho, A.L. Fatigue and fretting fatigue of ion-nitrided 34CrNiMo6 steel. Theor. Appl. Fract. Mech. 2001, 35, 69–79. [Google Scholar] [CrossRef]
  4. Tartaglia, J.; Lazzari, K.; Hui, G.; Hayrynen, K. A comparison of mechanical properties and hydrogen embrittlement resistance of austempered vs. quenched and tempered 4340 steel. Metall. Mater. Trans. 2008, 39A, 559–576. [Google Scholar] [CrossRef]
  5. Branco, R.; Costa, J.D.; Antunes, F.V. Low-cycle fatigue behaviour of 34CrNiMo6 high strength steel. Theor. Appl. Fract. Mech. 2012, 58, 28–34. [Google Scholar] [CrossRef]
  6. Branco, R.; Costa, J.D.; Antunes, F.V. Fatigue behaviour and life prediction of lateral notched round bars under bending-torsion loading. Eng. Fract. Mech. 2014, 199, 66–84. [Google Scholar] [CrossRef]
  7. Boardman, B. Properties and Selection: Irons, Steels and High-Performance Alloys: Fatigue Resistance of Steels. In ASM Handbook; ASM: Materials Park, OH, USA, 2000; Volume 1, pp. 673–688. [Google Scholar]
  8. Smith, R.W.; Hirschberg, M.H.; Manson, S.S. Fatigue Behaviour of Materials under Strain Cycling in Low and Intermediate Life Range; NACA TN D-1574; National Advisory Committee for Aeronautics: Washington, DC, USA, 1963. [Google Scholar]
  9. Pape, J.; Neu, R. A comparative study of the fretting fatigue behavior of 4340 steel and PH 13-8 Mo stainless steel. Int. J. Fatigue 2007, 29, 2219–2229. [Google Scholar] [CrossRef]
  10. Ramberg, W.; Osgood, W.R. Description of Stress-Strain Curves by Three Parameters; NACA TN 902; National Advisory Committee for Aeronautics: Washington, DC, USA, 1943. [Google Scholar]
  11. Ellyin, F. Fatigue Damage, Crack Growth and Life Prediction, 1st ed.; Chapman & Hall: London, UK, 1997. [Google Scholar]
  12. Basquin, O.H. The exponential law of endurance tests. Am. Soc. Test. Mater. ASTM 1910, 10, 625–630. [Google Scholar]
  13. Morrow, J.D. Cyclic plastic strain energy and fatigue of metals. In International Friction, Damping and Cyclic Plasticity; ASTM STP 378; ASTM: West Conshohocken, PA, USA, 1965; pp. 45–87. [Google Scholar]
  14. Coffin, L.F. A study effects of cyclic thermal stresses on ductile metal. Trans. ASME 1954, 76, 931–950. [Google Scholar]
  15. Manson, S.S. Behaviour of Materials under Conditions of Thermal Stress; NACA TN-2933; National Advisory Committee for Aeronautics: Washington, DC, USA, 1954. [Google Scholar]
  16. Endo, T.; Morrow, J. Cyclic stress-strain and fatigue behavior of representative aircraft metals. J. Mater. 1969, 4, 159–175. [Google Scholar]
  17. Tartaglia, J.; Hayrynen, K. A Comparison of fatigue properties of austempered versus quenched and tempered 4340 steel. J. Mater. Eng. Perform. 2012, 21, 1008–1024. [Google Scholar] [CrossRef]
  18. Sih, G.C.; Jeong, D.Y. Hysteresis loops predicted by isoenergy density theory for Polycrystals. Part II: Cyclic heating and cooling effects predicted from nonequilibrium theory for 6061-T6 aluminum, SAE 4340 steel and Ti-8Al-1Mo-1V titanium cylindrical bars. Theor. Appl. Fracture Mech. 2004, 41, 267–289. [Google Scholar] [CrossRef]
  19. Golos, K.; Ellyin, F. Generalization of cumulative damage criterion to multilevel cyclic loading. Theor. Appl. Fracture Mech. 1987, 7, 169–176. [Google Scholar] [CrossRef]
  20. Rabb, R. Fatigue failure of a connecting rod. Eng. Fail. Anal. 1996, 3, 13–28. [Google Scholar] [CrossRef]
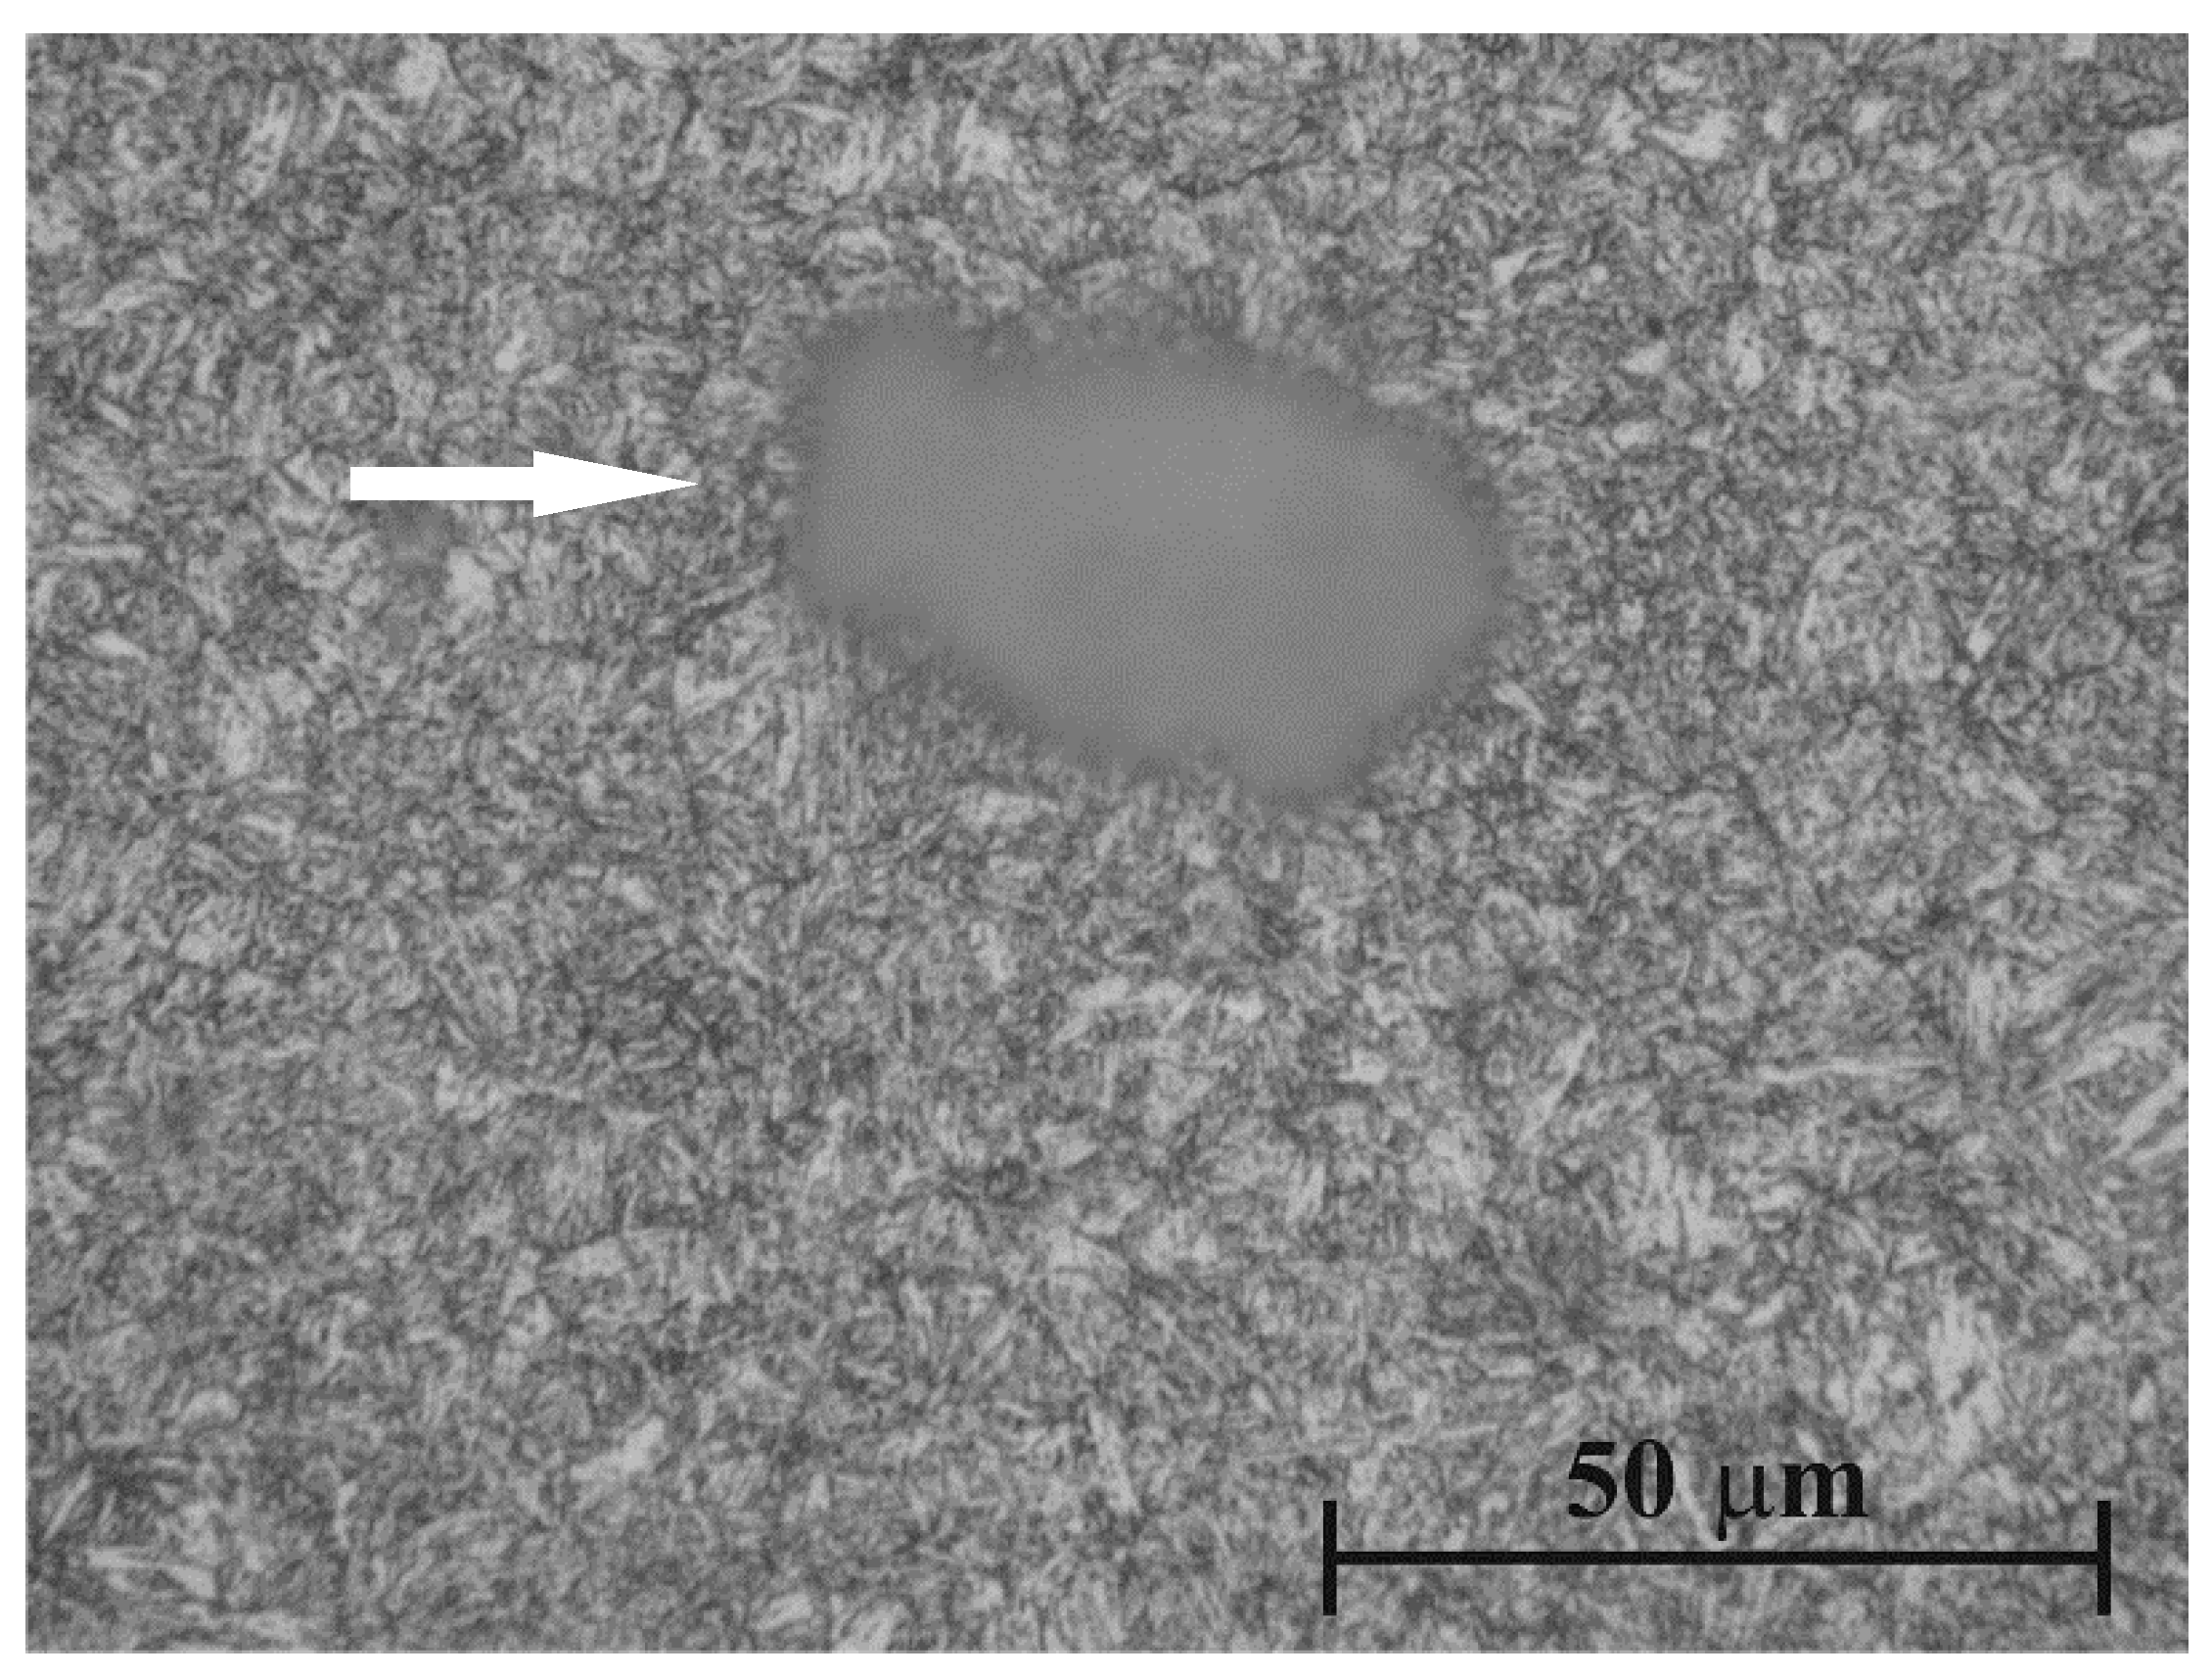
Figure 1. Microstructure of the DIN 34CrNiMo6 high-strength steel from a sample polished and etched with nital (optical microscopy).
Metals 06 00098 g001
Figure 2. Monotonic stress-strain curves obtained in the tensile tests.
Metals 06 00098 g002
Figure 3. Tensile fracture surfaces obtained by SEM: (a) low magnification; (b) high magnification.
Metals 06 00098 g003
Figure 4. Stress-strain hysteresis loops: (a) Δε/2 = ±2.0%; (b) Δε/2 = ±0.8%.
Metals 06 00098 g004
Figure 5. Evolution of the peak tensile stress with the number of cycles.
Metals 06 00098 g005
Figure 6. Ratio of plastic to elastic strain range versus life ratio.
Metals 06 00098 g006
Figure 7. Degree of softening versus strain amplitude.
Metals 06 00098 g007
Figure 8. Cyclic stress-strain curve obtained by connecting the tips of stable hysteresis loops for different strain amplitudes of the fully-reversed strain-controlled tests.
Metals 06 00098 g008
Figure 9. Relation between the cyclic stress amplitude and elastic and plastic strain amplitudes for the stable hysteresis loops.
Metals 06 00098 g009
Figure 10. Total strain-life, fatigue strength-life, and fatigue ductility-life curves [5]. Reprinted from Theoretical and Applied Fracture Mechanics, Vol. 58, Branco, R.; Costa, J.D.; Antunes, F.V. Low-cycle fatigue behavior of 34CrNiMo6 high strength steel, 28–34, Copyright (2012), with permission from Elsevier.
Metals 06 00098 g010
Figure 11. Cyclic plastic strain energy density versus number of cycles.
Metals 06 00098 g011
Figure 12. Total and plastic strain energy dissipated per cycle versus number of reversals to failure.
Metals 06 00098 g012
Figure 13. SEM micrographs of fracture surfaces near the crack initiation sites for different total strain amplitudes: (a) Δε/2 = 0.4%; (b) Δε/2 = 1.0%; (c) Δε/2 = 2.0% [5]. Reprinted from Theoretical and Applied Fracture Mechanics, Vol. 58, Branco, R.; Costa, J.D.; Antunes, F.V. Low-cycle fatigue behavior of 34CrNiMo6 high strength steel, 28–34, Copyright (2012), with permission from Elsevier.
Metals 06 00098 g013
Table 1. Nominal chemical composition of DIN 34CrNiMo6.
ElementCSiMnCrMoNi
Weight (%)0.34≤0.400.651.500.221.50
Table 2. Mechanical properties.
Mechanical PropertyValue aValue b [7]
Yield strength, σYS (MPa)967860
Ultimate tensile strength, σUTS (MPa)10351020
Elongation, εR (%)1820
Reduction of area, RA (%)5860
a Oil quenching: 850–880 °C, Tempering: 660 °C; b Oil quenching: 845 °C, Tempering: 650 °C.
Table 3. Constants of Equations (9) and (11).
PropertyValue
Coefficient κp (MJ/m3)2115.84
Exponent αp−0.6924
Coefficient κt (MJ/m3)2165.37
Exponent αt−0.6854
Constant ΔW0t (MJ/m3)0.7049