Abstract
Ti49.2Ni50.8 shape memory alloy (SMA) was processed by equal channel angular pressing (ECAP) for eight passes at 450 °C. The deformation homogeneity was analyzed on various planes across the thickness by Deform-3D software. Strain standard deviation (SSD) was used to quantify deformation homogeneity. The simulation result shows that the strain homogeneity is optimized by the third pass. Deformation homogeneity of ECAP was analyzed experimentally using microhardness measurements. Experimental results show that the gradual evolution of hardness with increasing numbers of passes existed and the optimum homogeneity was achieved after three passes. This is in good agreement with simulation results.
1. Introduction
TiNi-based shape memory alloys (SMAs) are considered one of the most promising materials for engineering and biomedical applications due to their unique shape memory effect and superelasticity [1,2]. In order to further improve the functional properties of TiNi SMAs, severe plastic deformation (SPD) methods have been employed to refine the microstructure of alloys [3]. The used techniques include high pressure torsion (HPT) [4] and equal channel angular pressing (ECAP) [5]. From an engineering application point of view, ECAP has the advantage of large sample size. Therefore, ECAP processing of TiNi SMAs receives more attention. In 2002, Pushin and his coworkers carried out the first ECAP of TiNi alloys and the grain size was reduced from 50–80 μm to 0.2–0.3 μm [5].
Until now, the principle of grain refinement resulting from ECAP has been well understood [6]. During conventional ECAP processing, an inhomogeneous microstructure may be achieved due to die geometry [7], friction [8] and strain hardenability of material [9]. For TiNi SMAs, martensitic transformation behavior and shape recovery properties are sensitive to microstructure. It has been reported that the transformation temperatures decrease with decreasing of grain size [10,11,12]. The dislocations introduced during cold working also might suppress martensitic transformation and improve the shape memory effect to some extent [13,14,15]. Therefore, deformation homogeneity is of critical importance for understanding processing-microstructure relationship and providing guideline on the optimization of shape recovery properties.
Finite element method (FEM) has been regarded as one of the important approaches to understand the deformation behavior and estimate the developed strain in the ECAP process [16,17,18]. However, to date, no report is available on the deformation homogeneity along different longitudinal planes of TiNi alloys. In the present work, FEM was used to analyze the deformation homogeneity by Deform-3D software. The simulation results were further experimentally validated by microhardness measurements.
2. Simulation Models
Deform-3D Version 6.1 (Scientific Forming Technologies Corporation, Columbus, OH, USA) was used to carry out the simulation of ECAP processing. In order to obtain the data of flow stress, the solution-treated Ti49.2Ni50.8 alloy samples was compressed using Gleeble 3500 machine (Dynamic Systems Inc, Poestenkill, NY, USA) at different strain rates. The compress tests were performed at 450 °C, at which most of the ECAP processing of intermetallic TiNi-based SMAs were carried out [4,19].
Figure 1 shows the FEM model for numerical simulation, including pressing ram, billet and ECAP die with φ = 120° and ѱ = 60°. The intersectional angle was selected because it gave the highest strain dispersal uniformity [17]. Route Bc was used since it was the optimum one for producing an ultrafine structure [6]. The billet used for analysis was cylindrical in shape with a diameter of 10 mm and a length of 60 mm. The simulation conditions, including geometry and process parameters, the FEM elements number, meshing method as well as the physical properties of Ti49.2Ni50.8 are summarized in Table 1. Figure 2 shows the plane sections taken through the processed ECAP billet in the simulation.
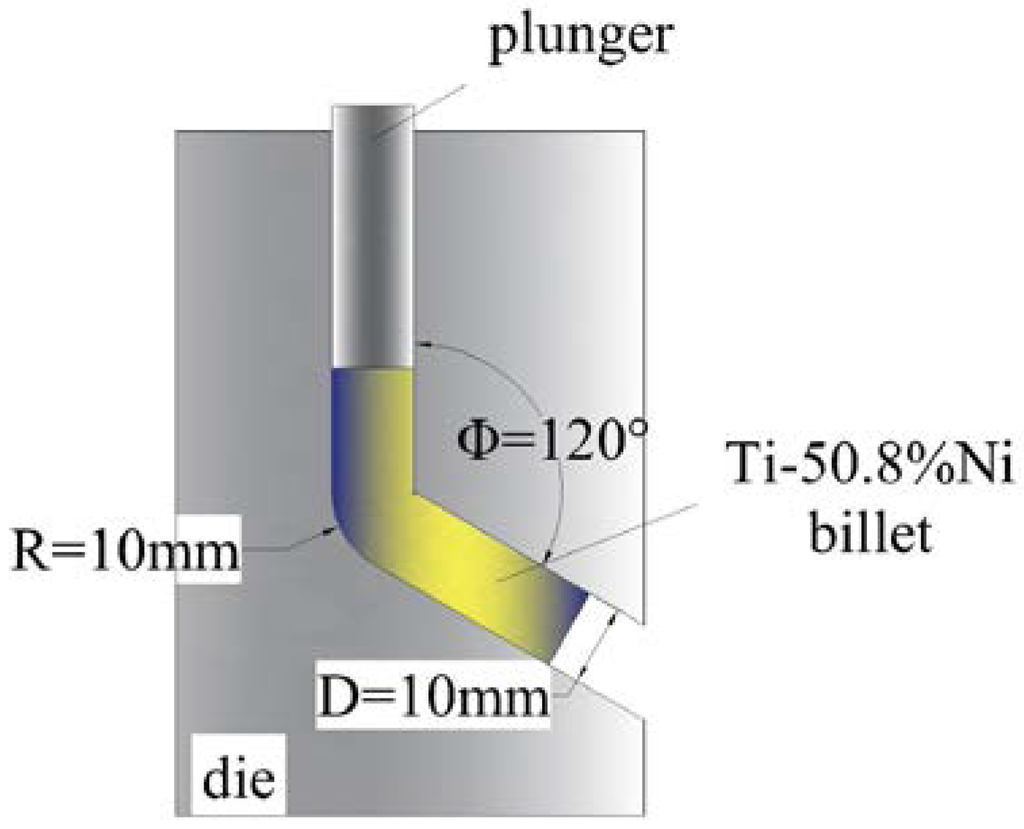
Figure 1.
FEM model for ECAP process.

Table 1.
Simulation parameters and physical properties of Ti49.2Ni50.8 sample.
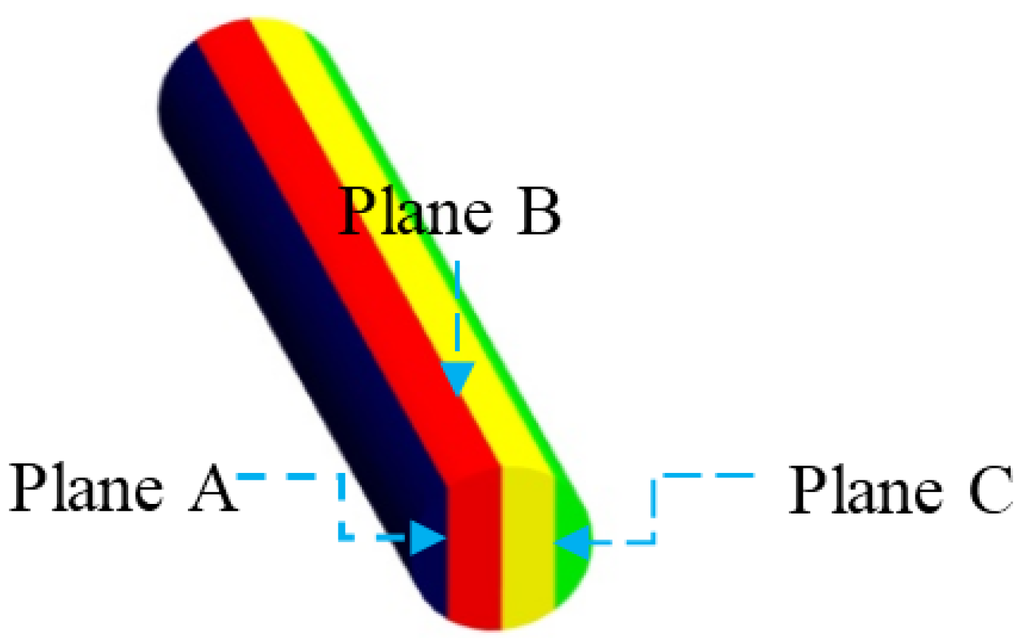
Figure 2.
Plane sections taken through the processed ECAP billet in the simulation and experimental work.
3. Homogeneity Calculation
The degree of strain distribution homogeneity was calculated from the simulation model by a mathematical coefficient called strain standard deviation (SSD) [20]:
where εi is the plastic strain magnitude in point i and εavg is the average plastic strain from 300 points at each plane section in the billet. The smaller the SSD value is, the better homogeneity of strain distribution [17,21].
4. Experimental Details
Before processing, the samples were annealed at 850 °C for 1 h, followed by water quenching. The samples were processed at the same parameters as described in the simulation model. The rod was kept at 450 °C for 10 min in a furnace prior to each pass, transferred to the pre-heated ECAP die as quickly as possible and then pressed at a rate of 10 mm/s. A graphitic lubricant was used to reduce the friction effect between the die and sample. The ECAPed billet was cut to the same three planes as in the simulation model (Figure 2) using the low speed diamond saw cutting machine to avoid the possible change of microstructure.
Vickers microhardness test was conducted on the sectioned planes with an applied load of 200 g and a dwell time of 10 s. The values of Vickers hardness (HV) were recorded using a HX-1000TM digital hardness tester (Shanghai Zhaoyi Photonics Co., Ltd, Shanghai, China) equipped with a Vickers diamond indenter. In order to investigate HV hardness distributions, 120 reading at every section were measured, as shown in Figure 3. The three narrow bands represent the different zones in the same plane. The width of the indentation is about 50 μm. In order to ensure the accuracy of the microhardness results, the distance between each test points is at least 300 μm.
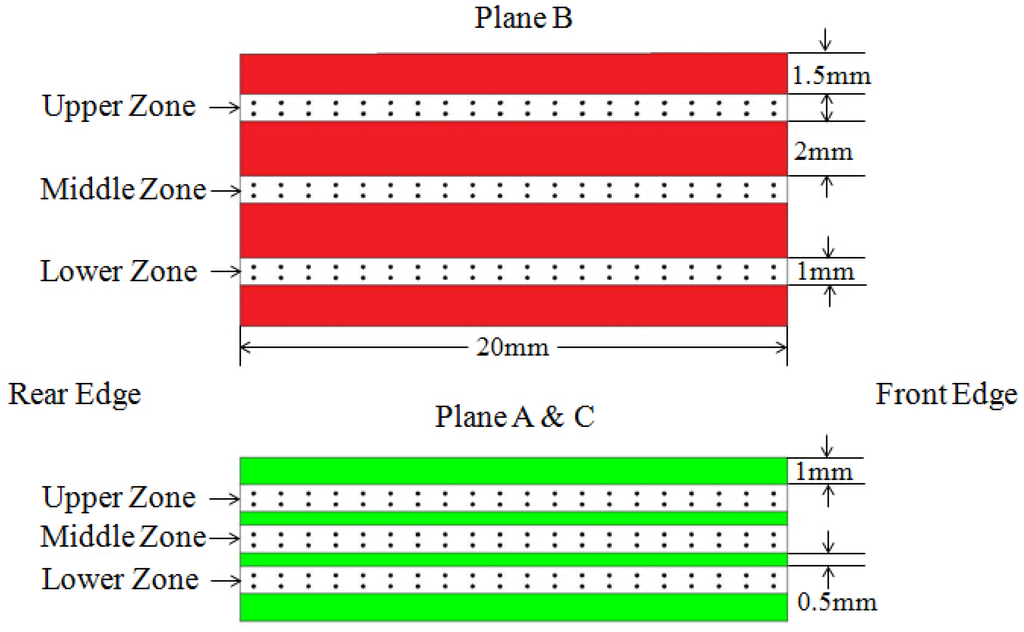
Figure 3.
Schematic illustrations of the positions of hardness measurement on planes.
5. Results and Discussion
In order to investigate strain homogeneity at each plane for the processed billet, it is necessary to measure the average strain at every plane. As an example, Figure 4 shows the examined zones in each plane. Hundred points were taken to measure the strain variation at every zone in each plane which is sufficient to track strain variance. The length of examined zone is 20 mm along the deformed sample. The middle zone is the center of plane C. The upper zone and the lower zone are symmetric, and the distance is 0.6 mm from the edge of plane C.
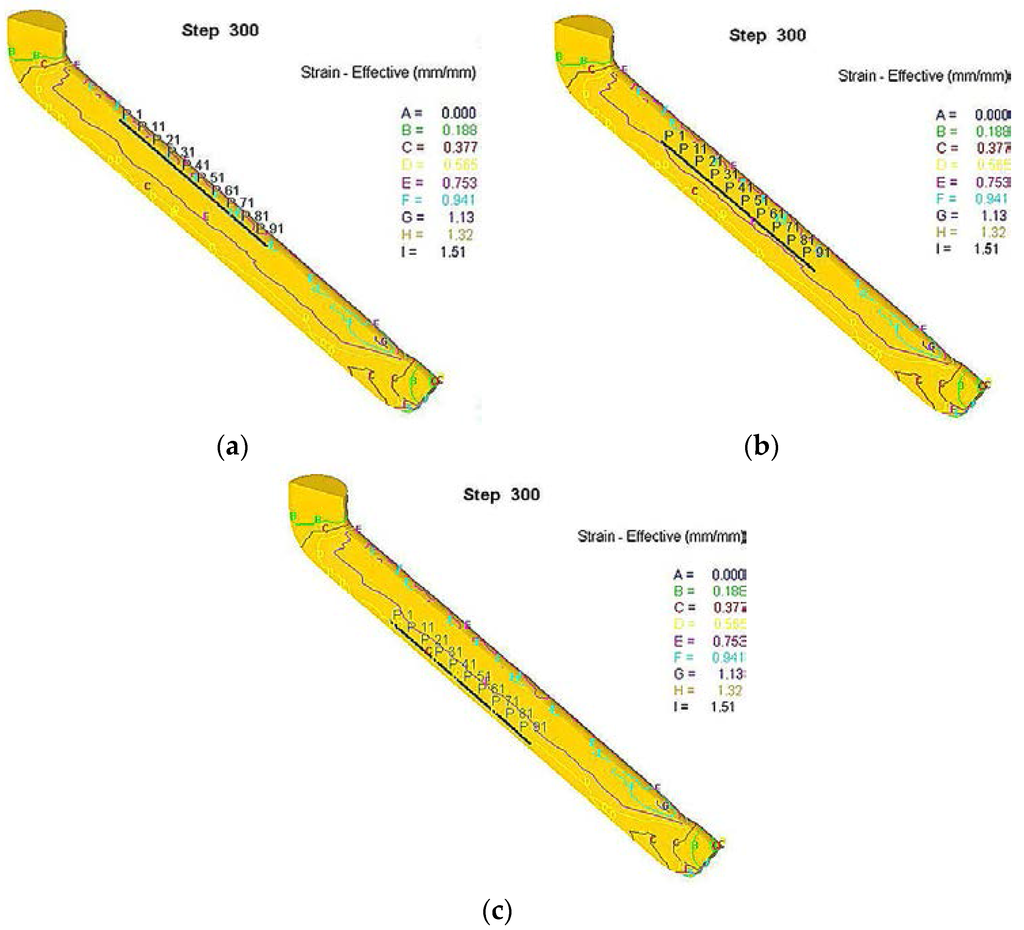
Figure 4.
Variable point tracking of effective strain at different positions in plane C: (a) upper zone; (b) middle zone; and (c) lower zone.
The effective strain was calculated using Equation (2)
where εx, εy and εz are normal strain in x, y and z direction, respectively; and γxy, γyz and γzx are shearing strain for x-y planes, y-z planes and z-x planes, respectively. The obtained effective strain distribution across various planes at 1, 3, 4 and 8 passes are presented in Figure 5. Generally speaking, the average strain increases as the pass number increases. Every plane shows the strain heterogeneity for each pass, but strain variance between planes is reduced to a great extent at the third pass rather than other passes. Figure 6 shows the deformation homogeneity using SSD quantifier as functions of pass number and plane section. Usually, increasing pass number results in an increase of strain distribution uniformity [18]. Thus, it is expected that SSD values will decrease with increasing pass number. SSD measurement shows that homogeneity is optimized at the third pass rather than other passes, which is consistent with the reported results [21]. Next, the microhardness of different planes was measured to experimentally validate the simulation results.
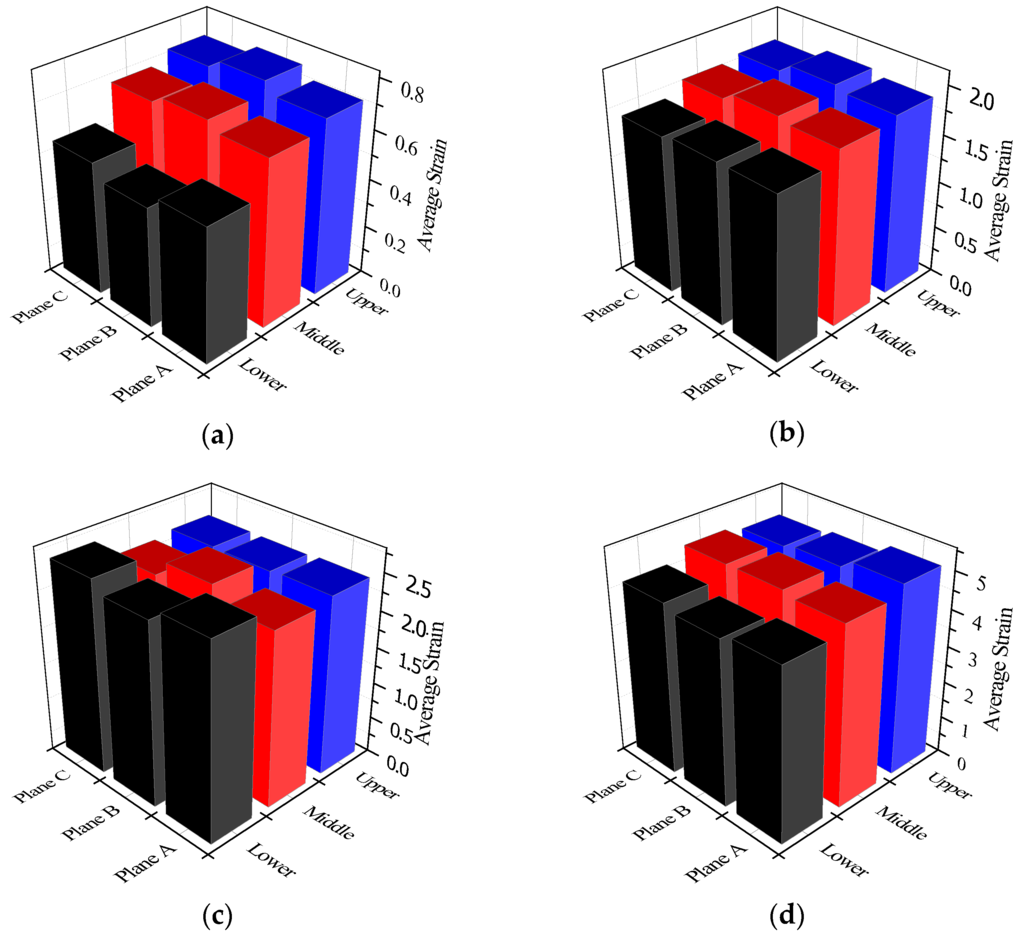
Figure 5.
Average strain distribution in the different planes of Ti49.2Ni50.8 alloy processed by ECAP for different passes: (a) 1 pass; (b) 3 passes; (c) 4 passes; and (d) 8 passes.
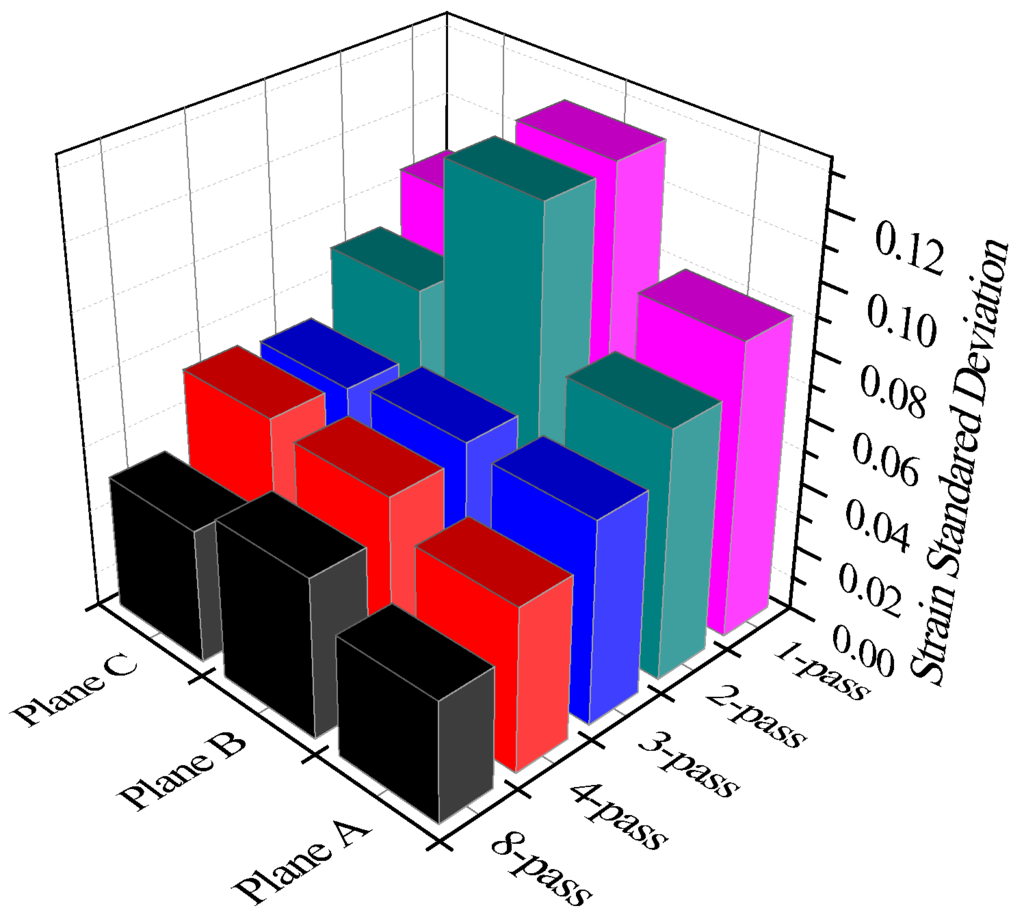
Figure 6.
The effect of pass number on SSD for ECAPed Ti49.2Ni50.8 alloy.
The homogeneity was first analyzed in terms of mapping contours, which were constructed by the software of Tecplot. The microhardness measurements were plotted with the position as shown in Figure 3. The blank region in Figure 3 was filled by the software using interpolation method. Figure 7 shows the individual microhardness plotted against the position on various planes of the solution-treated sample. The individual measurements are plotted in the form of color-coded contour maps to provide a direct and visual representation of the data. The significance of the colors is shown by the color scale given above the drawings. It is seen that solution-treated sample shows a uniform distribution of microhardness irrespective of the position. The average value of microhardness was determined to be 265 HV. This means that the homogeneous microstructure presents in the solution-treated sample. Figure 8 shows the individual microhardness measurements for the ECAPed samples with different pass numbers. It should be noted that the values of HV are plotted within two ranges in incremental step of 10, the first range from 260 to 330 for the samples with one and three passes, and the second range from 300 to 360 for the samples with four and eight passes. These maps are constructed with the vertical axis in the Y direction where Y = 0 denotes the lower rear point for each plane along the X-axis and the horizontal axis in the X direction where X = 0 and 20 mm mean the rear and front positions of each plane, respectively.
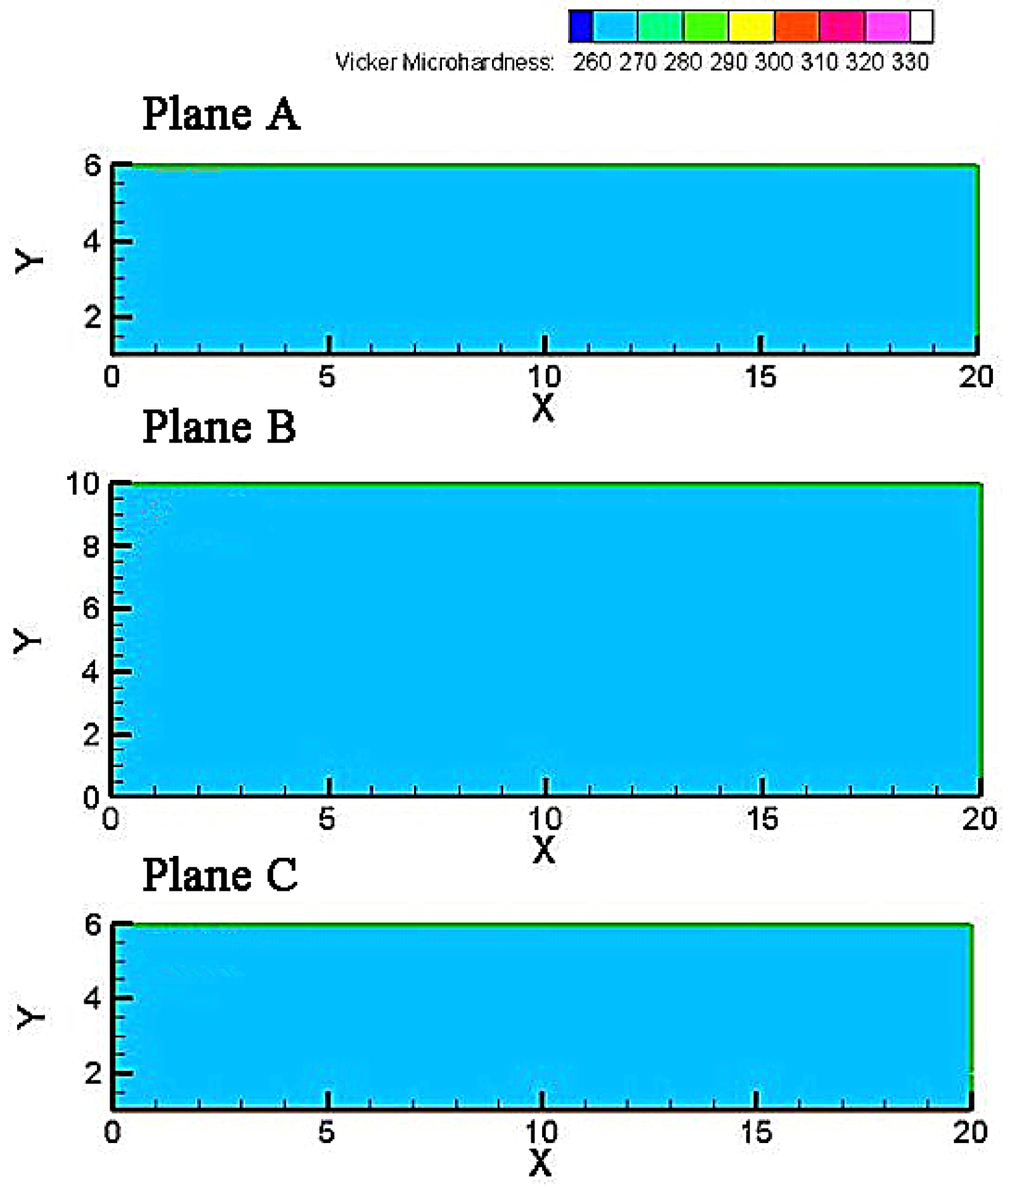
Figure 7.
Color-coded contour maps showing Vickers microhardness distributions at solution treated sample before deformation along various planes.
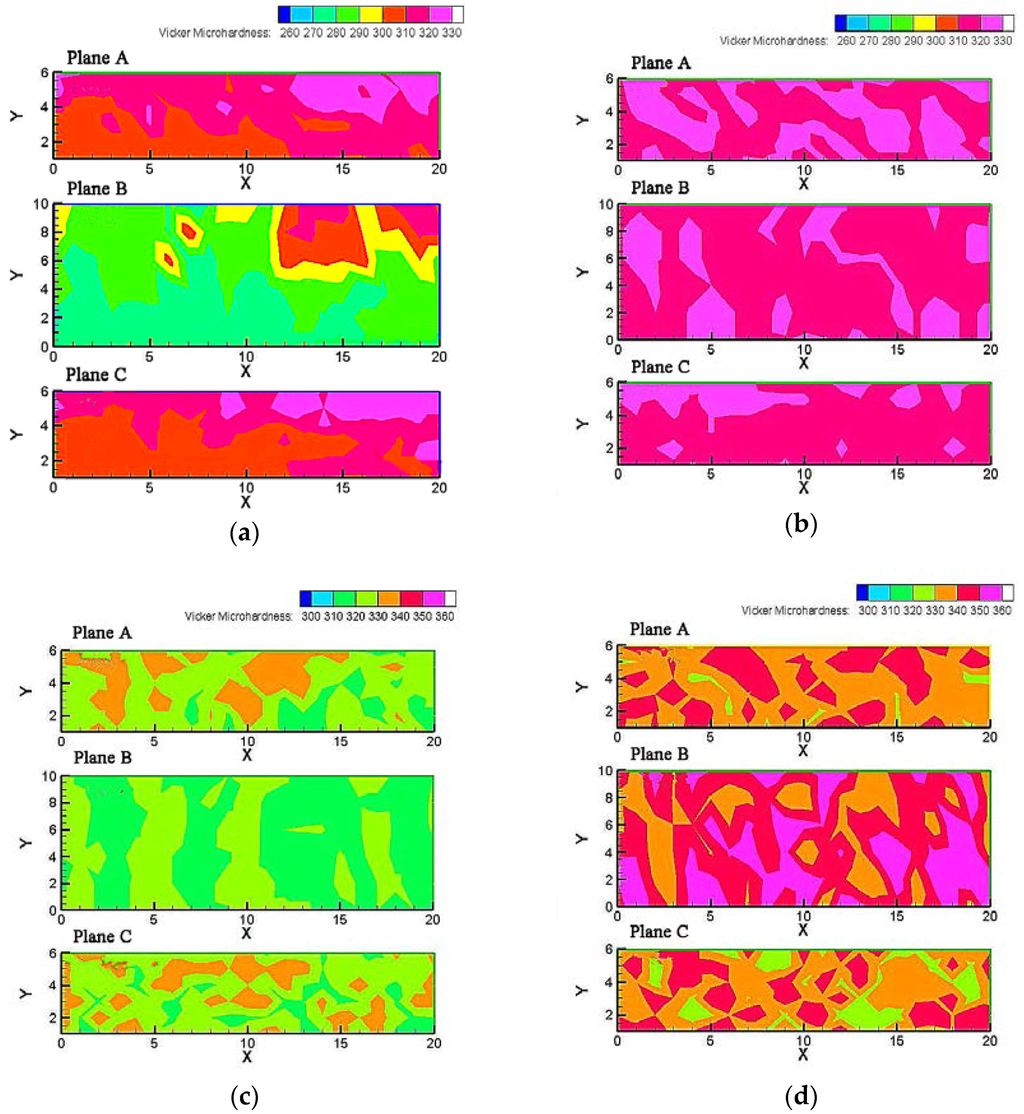
Figure 8.
Color-coded contour maps showing Vickers microhardness distributions along various planes for the samples processed after different pass numbers: (a) 1 pass; (b) 3 passes; (c) 4 passes; and (d) 8 passes.
Figure 8a shows the contour maps of the sample processed for one pass. Two important features can be observed. First, the microhardness is significantly higher than that of the solution-treated sample. This increase occurs over the entire planes due to the strengthening effect resulting from grain refinement and high-density dislocations introduced during ECAP. Since the sample is axis-symmetric, microhardness distribution of plane A and plane C are nearly the same. Second, an obvious inhomogeneity is revealed. The distribution of microhardness is less homogeneous than that of the solution-treated sample. The microhardness in the vicinity of lower surface are obviously lower than upper surface at each plane. The average hardness of bottom surface is reduced by 15–25 as compared to the remainder region at each plane. This inhomogeneous region is confined to within a width of about 2 mm from the bottom surface. The occurrence of the lower hardness region in the bottom of the sample, which is the characteristics of the ECAP die with outer corner radius, is attributed to the faster flow of the outer part compared with the inner part in the main deformation zone [22,23,24].
Figure 8b shows the contour maps of microhardness along entire planes after three passes. It is seen that microhardness increases. Furthermore, the homogeneity is improved as compared to that of the sample processed for one pass. Figure 8c,d shows the contour maps of microhardness along various planes for the samples processed after four and eight passes, respectively. The microhardness increases with increasing pass number to 8 passes. This is a general tendency and consistent with the simulation results in which the deformation strain increases with increasing pass number. As compared to the results shown in Figure 8b, the differences between microhardness values at different zones and different planes increase, as evidenced by the different color regions. For example, for the results of the eight-passed sample shown in Figure 8d, there are three kinds of color regions at each plane, respectively, and four kinds of color regions in the sample. This indicates that the inhomogeneous distribution of microhardness becomes more obvious with increasing pass number. In order to provide a clear comparison, Table 2 shows the detailed microhardness values with standard deviation. It is seen that the three-passes sample is more homogeneous among various planes.
Table 2.
Average microhardness values at different planes for the solution-treated and ECAP processed samples.
6. Conclusions
Higher accumulative strain is obtained by increasing ECAP pass number, which leads to more homogeneity, but heterogeneity still exists between planes. The simulation results show that the optimum homogeneity can be obtained after three passes at 450 °C, which is experimentally confirmed by the microhardness measurement. The results may provide the guideline on the optimization of microstructure and shape memory properties by ECAP processing.
Acknowledgments
This work was supported by the Fundamental Research Funds for the Central Universities and Harbin City Innovative Talents Research Special Program (2015RAXXJ033).
Author Contributions
All authors contributed equally to this work. Mohamed Osman and Yunxiang Tong conceived and designed the experiments; Diantao Zhang performed the experiments; Li Li analyzed the data; Yufeng Zheng contributed reagents/materials/analysis tools; and Diantao Zhang wrote the paper.
Conflicts of Interest
The authors declare no conflict of interest. The founding sponsors had no role in the design of the study; in the collection, analyses, or interpretation of data; in the writing of the manuscript, and in the decision to publish the results.
Abbreviations
The following abbreviations are used in this manuscript:
| ECAP | Equal channel angular pressing |
| SMA | Shape memory alloy |
| SSD | Strain standard deviation |
| FEM | Finite element method |
| SPD | Severe plastic deformation |
| HPT | High pressure torsion |
References
- Otsuka, K.; Kakeshita, T. Science and technology of shape-memory alloys: New developments. MRS Bull. 2002, 27, 91–100. [Google Scholar] [CrossRef]
- Otsuka, K.; Ren, X. Physical metallurgy of Ti-Ni-based shape memory alloys. Prog. Mater. Sci. 2005, 50, 511–678. [Google Scholar] [CrossRef]
- Valiev, R.Z.; Mukherjee, A.K. Nanostructures and unique properties in intermetallics, subjected severe plastic deformation. Scripta Mater. 2001, 44, 1747–1750. [Google Scholar] [CrossRef]
- Prokofiev, E.; Gunderov, D.V.; Lukyanov, A.; Pushin, V.; Valiev, R.Z. Mechanical behavior and stress-induced martensitic transformation in nanocrystalline Ti49.4Ni50.6 alloy. Mater. Sci. Forum. 2008, 584, 470–474. [Google Scholar] [CrossRef]
- Valiev, R.Z.; Langdon, T.G. Principles of equal-channel angular pressing as a processing tool for grain refinement. Prog. Mater. Sci. 2006, 51, 881–981. [Google Scholar] [CrossRef]
- Waitz, T.; Kazykhanov, V.; Karnthaler, H.P. Martensitic phase transformations in nanocrystalline NiTi studied by TEM. Acta Mater. 2004, 52, 137–147. [Google Scholar] [CrossRef]
- Kočiško, R.; Kvačkaj, T.; Kováčová, A.; Zemko, M. The influence of ECAP geometry on the effective strain distribution. Adv. Mater. Res. 2015, 1127, 135–141. [Google Scholar] [CrossRef]
- Quang, P.; Nghiep, D.M.; Kim, H.S. Simulation of the effective of friction on the deformation in equal channel angular pressing (ECAP). Key Eng. Mater. 2015, 656–657, 526–531. [Google Scholar] [CrossRef]
- Medeiros, N.; Moreira, L.P. Upper-bound analysis of die corner gap formation for strain-hardening materials in ECAP process. Comput. Mater. Sci. 2014, 91, 350–358. [Google Scholar] [CrossRef]
- Waitz, T.; Tsuchiya, K.; Antretter, T.; Fischer, F.D. Phase transformations of nanocrystalline martensitic materials. MRS Bull. 2009, 34, 814–821. [Google Scholar] [CrossRef]
- Tong, Y.X.; Liu, Y.; Miao, J.M.; Zhao, L.C. Characterization of a nanocrystalline NiTiHf high temperature shape memory alloy thin film. Scripta Mater. 2005, 52, 983–987. [Google Scholar] [CrossRef]
- Kuranova, N.N.; Makarov, V.V.; Pushin, V.G.; Uksusnikov, A.N. Thermo- and deformation induced martensitic transformations in binary TiNi-based alloys, subjected severe plastic deformation. Mater. Sci. Forum. 2013, 738–739, 530–534. [Google Scholar] [CrossRef]
- Lin, H.C.; Wu, S.K.; Chou, T.S.; Kao, H.P. The Effects of cold rolling on the martensitic transformation of an equiatomic TiNi alloy. Acta Metall. Mater. 1991, 39, 2069–2080. [Google Scholar] [CrossRef]
- Miller, D.A.; Lagoudas, D.C. Influence of cold work and heat treatment on the shape memory effect and plastic strain development of NiTi. Mater. Sci. Eng. A 2001, 308, 161–175. [Google Scholar] [CrossRef]
- Zhao, L.C.; Zheng, Y.F.; Cai, W. Study of deformation micromechanism in cold-deformed TiNi based alloys. Intermetallics 2005, 13, 281–288. [Google Scholar] [CrossRef]
- Lu, S.K.; Liu, H.Y.; Yu, L.; Jiang, Y.L.; Su, J.H. 3D FEM simulations for the homogeneity of plastic deformation in aluminum alloy HS6061-T6 during ECAP. Procedia Eng. 2011, 12, 35–40. [Google Scholar] [CrossRef]
- Djavanroodi, F.; Omranpour, B.; Ebrahimi, M.; Sedighi, M. Designing of ECAP parameters based on strain distribution uniformity. Prog. Nat. Sci. 2012, 22, 452–460. [Google Scholar] [CrossRef]
- Mahallawy, N.E.; Shehata, F.A.; Hameed, M.A.E.; Aal, M.I.A.E.; Kim, H.S. 3D FEM simulations for the homogeneity of plastic deformation in Al-Cu alloys during ECAP. Mater. Sci. Eng. A 2010, 527, 1404–1410. [Google Scholar] [CrossRef]
- Tong, Y.X.; Guo, B.; Chen, F.; Tian, B.; Li, L.; Zheng, Y.F.; Prokofiev, E.A.; Gunderov, D.V.; Valiev, R.Z. Thermal cycling stability of ultrafine-grained TiNi shape memory alloys processed by equal channel angular pressing. Scripta Mater. 2012, 67, 1–4. [Google Scholar] [CrossRef]
- Zaïri, F.; Aour, B.; Gloaguen, J.M.; Naït-Abdelaziz, M.; Lefebvre, J.M. Numerical modelling of elastic-viscoplastic equal channel angular extrusion process of a polymer. Comput. Mater. Sci. 2006, 38, 202–216. [Google Scholar] [CrossRef]
- Zhang, X.; Hua, L.; Liu, Y. FE simulation and experimental investigation of ZK60 magnesium alloy with different radial diameters processed by equal channel angular pressing. Mater. Sci. Eng. A 2012, 535, 153–163. [Google Scholar] [CrossRef]
- Kim, H.S. Finite element analysis of equal channel angular pressing using a round corner die. Mater. Sci. Eng. A 2001, 315, 122–128. [Google Scholar] [CrossRef]
- Kim, H.S. On the effect of acute angles on deformation homogeneity in equal channel angular pressing. Mater. Sci. Eng. A 2006, 430, 346–349. [Google Scholar] [CrossRef]
- Kim, H.S.; Seo, M.H.; Hong, S.I. On the die corner gap formation in equal channel angular pressing. Mater. Sci. Eng. A 2000, 291, 86–90. [Google Scholar] [CrossRef]
© 2016 by the authors; licensee MDPI, Basel, Switzerland. This article is an open access article distributed under the terms and conditions of the Creative Commons by Attribution (CC-BY) license (http://creativecommons.org/licenses/by/4.0/).