Article

Effect of Heat Input on Microstructure and High-Cycle Fatigue Properties of the CGHAZs in Wind Power Steel


1
State Key Laboratory of Metastable Materials Science and Technology, Yanshan University, Qinhuangdao 066004, China
2
CITIC Metal Co., Ltd., Beijing 100004, China
*
Authors to whom correspondence should be addressed.
Metals 2026, 16(6), 635; https://doi.org/10.3390/met16060635
Submission received: 10 April 2026 / Revised: 3 June 2026 / Accepted: 4 June 2026 / Published: 9 June 2026
(This article belongs to the Special Issue Recent Advances in High-Performance Steel (2nd Edition))

Abstract

Wind turbine towers rely on welded joints for structural continuity, and the coarse-grained heat-affected zone (CGHAZ) at these joints is the principal site of fatigue damage under service loading. This study characterises the influence of welding heat input on the microstructural constitution, high-cycle fatigue response, and fracture mechanisms of Gleeble-simulated CGHAZs in a Nb-microalloyed wind power steel. Thermal cycles representative of submerged arc welding at 15, 25, 35, and 45 kJ/cm were applied, and the resulting microstructures were examined by optical microscopy, SEM, EBSD, and TEM. Raising the heat input produced systematic microstructural coarsening: the densities of low-angle grain boundaries (LAGBs) and high-angle grain boundaries (HAGBs) fell by approximately 40% and 26%, respectively, while the mean equivalent diameter (MED) and prior austenite grain (PAG) size grew by roughly 64% and 67%. Life partitioning showed that crack nucleation accounted for more than 84% of total fatigue cycles in every condition, identifying it as the life-governing damage stage. Over the 15-to-45 kJ/cm range, the CGHAZ fatigue strength at 2 × 10⁶ cycles deteriorated from 246.9 MPa to 208.5 MPa (a 15.6% reduction), while the mean fatigue striation spacing widened from 0.142 μm to 0.183 μm (an increase of 28.9%). These results demonstrate that judicious heat-input selection is a practical and effective means of preserving CGHAZ fatigue integrity in wind tower steel fabrication, and they address a previously unresolved gap concerning high-cycle fatigue fracture mechanisms in this critical microstructural zone.

1. Introduction

Driven by the global energy transition and the “Dual Carbon” goals, the wind power industry is accelerating its evolution towards large megawatt capacities and deep-sea applications. The trend imposes stringent requirements on the lightweight design and service life of tower structures [1,2], making the structural integrity of the tower a decisive factor for the reliability and lifecycle of the wind turbine [3,4]. Wind turbine towers are primarily assembled in sections via welding. At the welded joints, fatigue cracks tend to initiate preferentially at the weld toe position due to stress concentration effects induced by geometric profiles [5]. Microscopically, this corresponds to the coarse-grained heat-affected zone (CGHAZ). As a core process parameter, welding heat input not only dictates welding efficiency but also profoundly influences the phase transformation path, microstructural morphology, and final mechanical properties of the CGHAZ by regulating the welding thermal cycle [4,6]. Given that the CGHAZ is the vulnerable region of the welded joint [7], and statistics indicate that approximately 80% of failures in welded structures originate from fatigue damage in this zone [8], it has become an urgent need and a research priority to investigate the mechanism of welding heat input on the fatigue performance of the CGHAZ. Achieving precise control over the microstructure and service performance of this critical zone is essential for enhancing the operational safety of wind turbine towers.
The extant research has principally concentrated on the relationship between microstructural evolution and mechanical properties (e.g., impact toughness and hardness) in the CGHAZ of low-carbon steels under varying heat inputs. An increase in heat input (25–300 kJ/cm) for Q420C steel led to significant grain coarsening in the CGHAZs and the massive precipitation of proeutectoid/massive ferrite, resulting in a drastic reduction in impact toughness [6]. Similarly, Yuan et al. [9] revealed that higher heat input caused grain coarsening and an increase in bainite content, which decreased both joint hardness and impact toughness in the CGHAZs of Q355D low-alloy steel. Zeng et al. [10] observed that an increase in heat input resulted in the coarsening of the microstructure and an increase in the size of the martensite/austenite (M/A) constituents, leading to a decline in impact toughness. Additionally, certain studies have identified that the impact of heat input on properties does not invariably result in a monotonous decrease [11,12]. Wu et al. [13] studied V-Ti-N-Nb weathering steels, revealing that increasing heat input (10–70 kJ/cm) promotes M/A constituent formation and coarsening in the CGHAZ. This microstructural evolution significantly degrades toughness, establishing a critical link between thermal cycles and mechanical performance degradation. Xu et al. [14] noted that the HAZ microstructure remained relatively stable with increasing heat input for Q420FRE steel; significant material softening occurred, resulting in reduced impact toughness. Conversely, Fu et al. [15] confirmed from the perspective of cooling rates that for Q420qENH steel, increased cooling rates (i.e., lower heat input) promoted grain refinement and consequently increased hardness. The extant studies have elucidated the effects of heat input on microstructure and general mechanical properties. However, a critical gap in research persists concerning the effects of heat input on the microstructure and fatigue properties of CGHAZ, along with the underlying mechanisms.
In this study, the CGHAZs of a wind power steel were simulated under typical heat inputs using a Gleeble 3800-GTC thermomechanical simulation system (Dynamic Systems Inc., Poestenkill, NY, USA). The main objectives of this study are to investigate the influence of heat input on the microstructure and fatigue performance of the simulated CGHAZs and to elucidate the underlying mechanisms by which high-cycle fatigue life is influenced by heat input. The research addressed a significant research gap concerning the high-cycle fatigue performance and fracture mechanisms of CGHAZs, providing a solid theoretical and experimental foundation for the development of wind power steel.

2. Materials and Methods

This study employed an experimental steel containing 0.038 wt.% Nb, with its chemical composition detailed in Table 1. Chemical composition was determined using a direct-reading spectrometer (ARL-iSpark8860, Thermo Fisher Scientific, Waltham, MA, USA). The experimental steels were smelted in a 200 kg vacuum induction furnace (BR-VM-200, Bona, Shanghai, China) and subsequently cast into ingots. The ingots underwent homogenization treatment at 1210 °C for 2 h, followed by the steel plates which were rolled using the Thermo-Mechanical Control Process (TMCP) with the following parameters: heating temperature 1210 °C, holding time ≥ 0.5 h; first-stage rolling final temperature ≥ 1020 °C, followed by holding until intermediate billet thickness reached 45 mm. Second stage rolling started at ≤900 °C, with a final rolling temperature of 800 °C. Accelerated cooling was applied immediately after rolling, with water entry temperature at 770 °C and reheating temperature at 530°. Subsequently, the steel plate was cooled to room temperature, thereby completing the production of the experimental steel.
Cylindrical specimens (diameter 10 mm, length 120 mm) were machined with their longitudinal axis oriented perpendicular to the rolling direction, as depicted in Figure 1. CGHAZ thermal histories corresponding to submerged arc welding at four heat inputs (15, 25, 35, and 45 kJ/cm) and were reproduced on a Gleeble 3800-GTC thermo-mechanical simulator (DSI, Poestenkill, NY, USA) using temperature profiles derived from the Rykalin-2D model. A K-type thermocouple spot-welded at the specimen midpoint provided closed-loop temperature control. The standard cycle consisted of resistance heating at 100 °C/s to a 1350 °C peak temperature, a 1 s isothermal hold, and subsequent cooling to 200 °C. Phase transformation temperatures during the thermal cycle were determined by concurrent dilatometry.
Cross-sections were extracted from the thermocouple-bonded gauge region, prepared by standard metallographic procedures, and etched in 4% nital. Phase morphology was surveyed using an optical microscope (OM, Axiover-200 MAT, ZEISS, Baden-Wurttemberg, Germany) and a scanning electron microscope (SEM, SU5000, Hitachi, Tokyo, Japan). Quantitative phase-fraction measurements were conducted in Image-Pro Plus software (version 6.0) on a minimum of ten randomly chosen fields per condition to ensure statistical representativeness. For EBSD, specimens were surface-prepared by ion-beam milling under high vacuum (IM4000II, Hitachi, Tokyo, Japan). Scans covering 150 μm × 150 μm areas at a 0.25 μm step size were acquired with an Oxford C-Swift detector, and crystallographic orientation data were processed in AZtecCrystal 2.1 software (Oxford, UK). Transmission electron microscope (TEM, JEM-F200, JEOL, Tokyo, Japan) foils (3 mm diameter) were produced by electropolishing in 7% perchloric acid–ethanol solution. Carbon extraction replicas were additionally prepared to isolate precipitate particles; more than 500 particles per condition were characterised by TEM combined with energy-dispersive X-ray spectroscopy (EDS, Oxford, UK) to obtain size distributions and elemental compositions.
Shown in Figure 1 are the geometric outlines and sizes of CGHAZ samples prepared for tensile and high-cycle fatigue experiments. Uniaxial tensile tests at ambient temperature (displacement-control mode, crosshead speed 0.72 mm/min) were performed on an electromechanical testing machine (E45.105, MTS, Eden Prairie, MN, USA). Yield strength, tensile strength, and uniform elongation were taken as the mean of three repeat tests. Vickers microhardness was recorded under a 500 gf load (FM-ARS-9000, FUTURE-TECH, Sinsheim, Germany), with ten randomly positioned indentations averaged per specimen. High-cycle fatigue tests were carried out on a servo-hydraulic machine (Landmark 370.10, MTS, Eden Prairie, MA, USA) in stress-control mode using a sinusoidal waveform (stress ratio R = 0.1, frequency 20 Hz). The staircase method of Dixon and Mood was applied in conformity with GB/T 24176-2009 [16] to determine the fatigue limit at 2 × 10⁶ cycles. Following failure, fracture surfaces were examined by SEM to identify crack origins, characterise propagation markings, and assess final overload zones. Each CGHAZ sample underwent microhardness testing using a micro-Vickers hardness tester (FM-ARS-9000, FUTURE-TECH, Sinsheim, Germany) at 500 gf. The reported hardness is the mean of ten random indentation spots.

3. Results

3.1. Microstructures

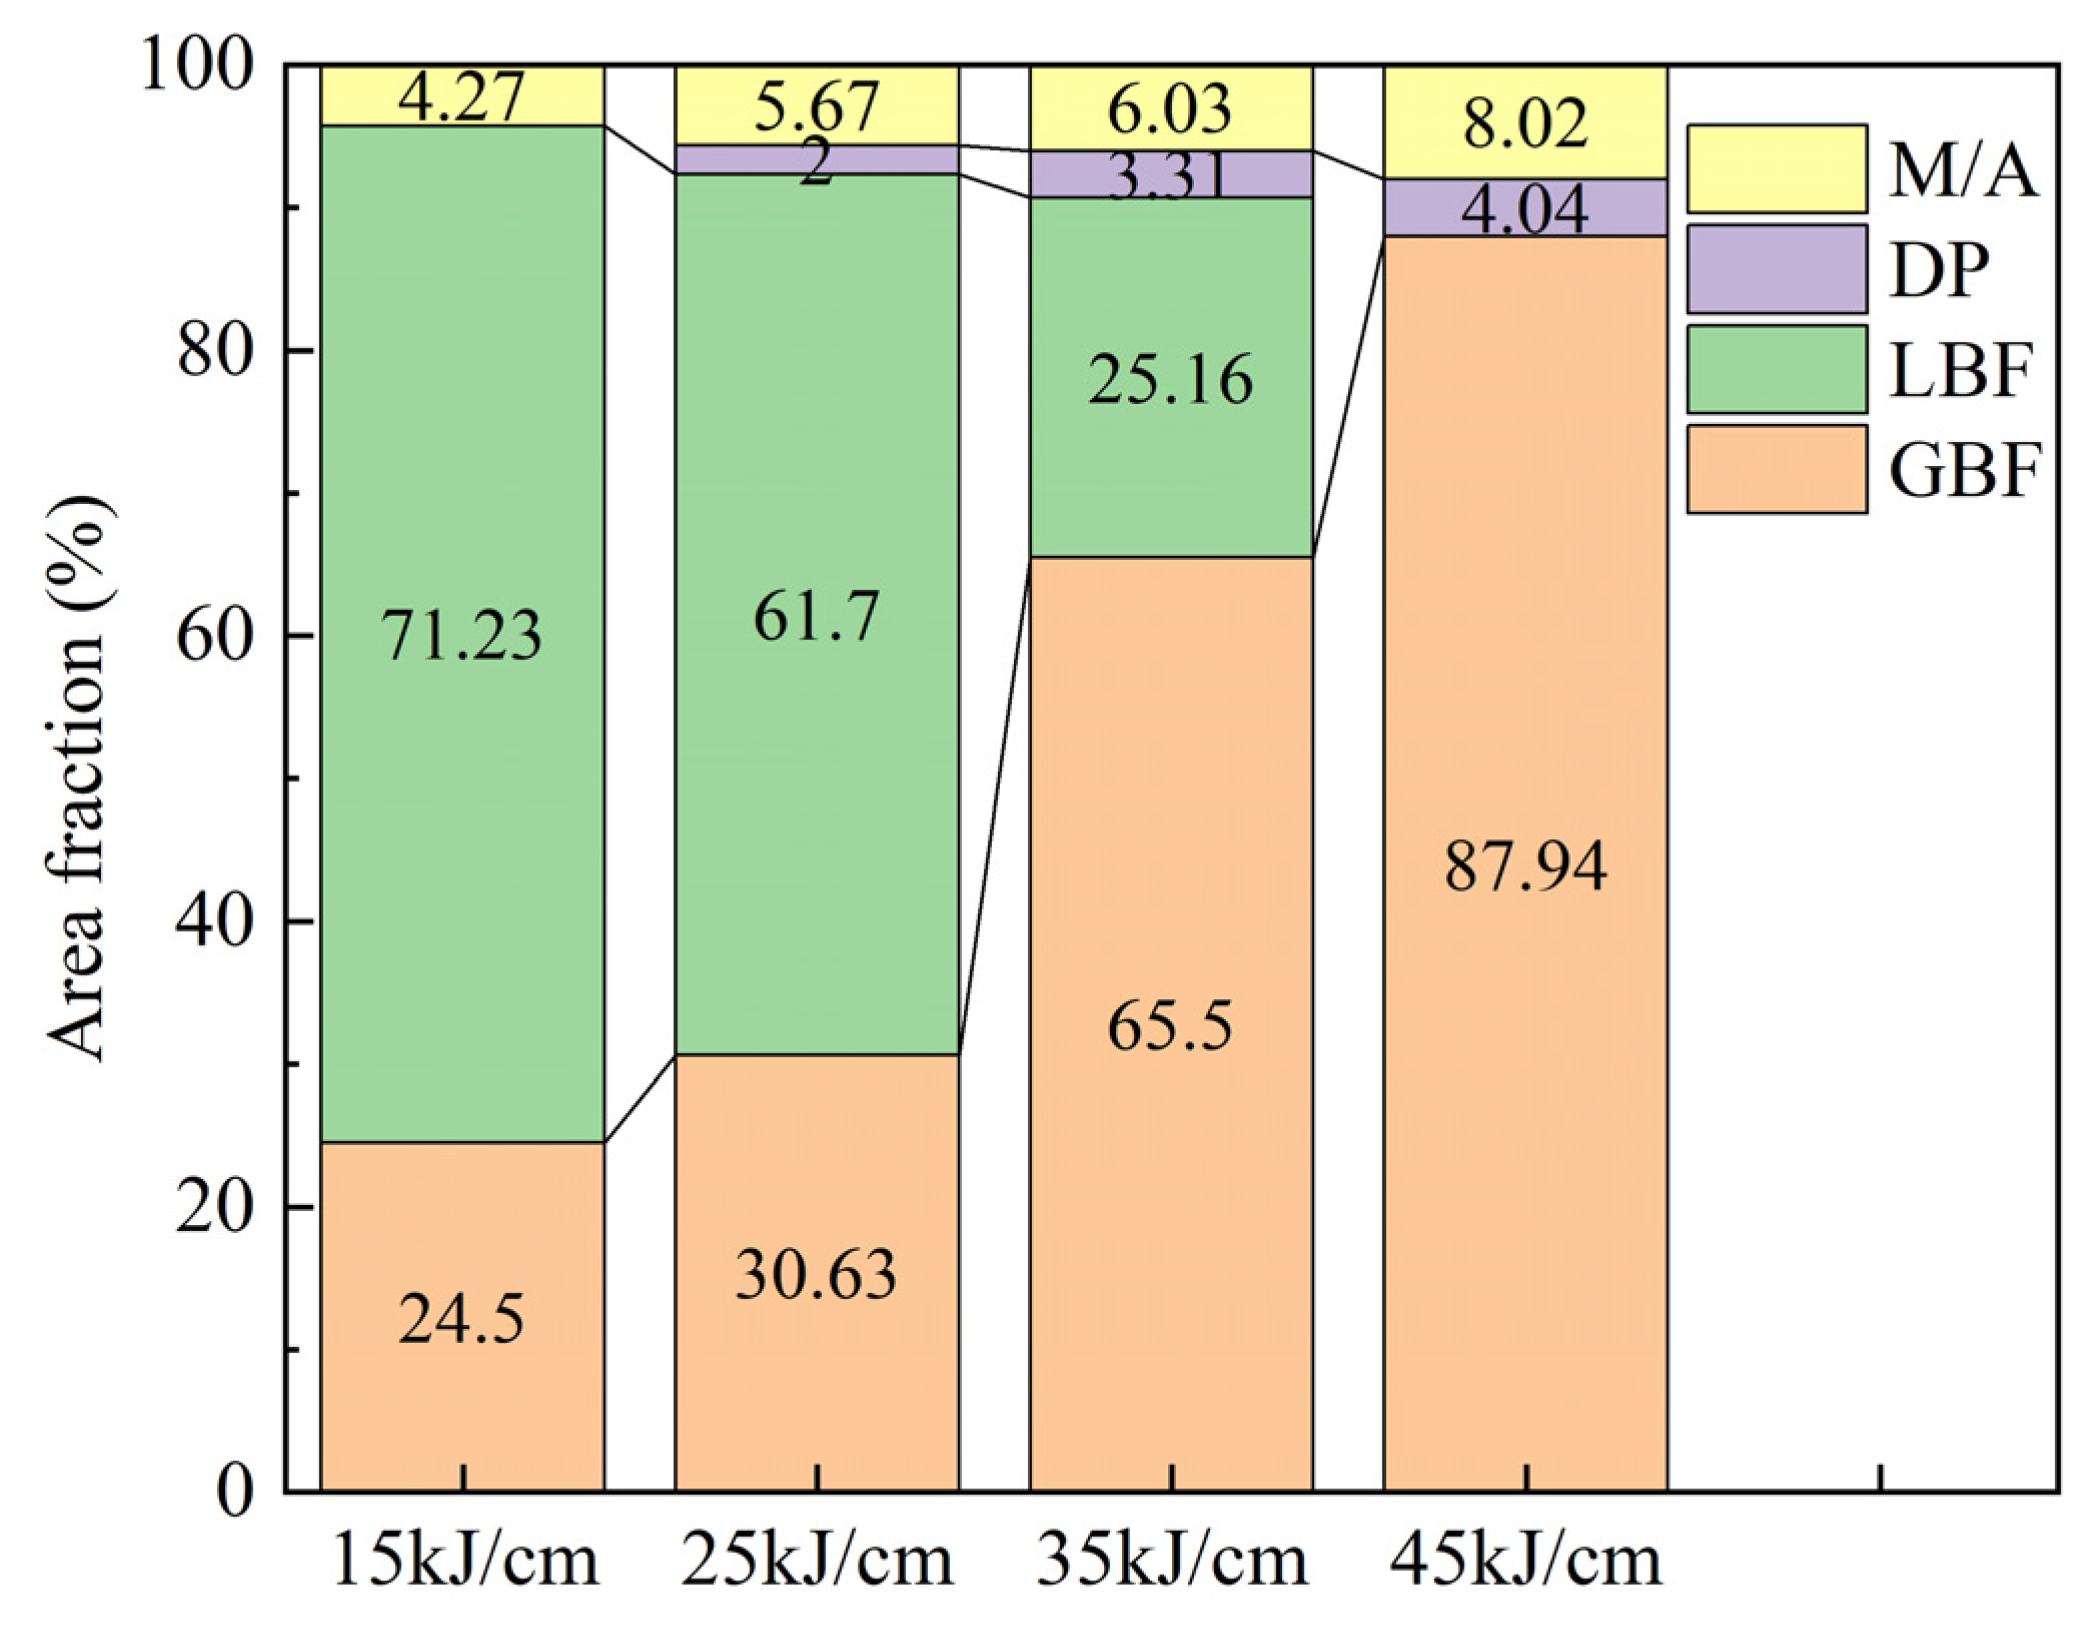
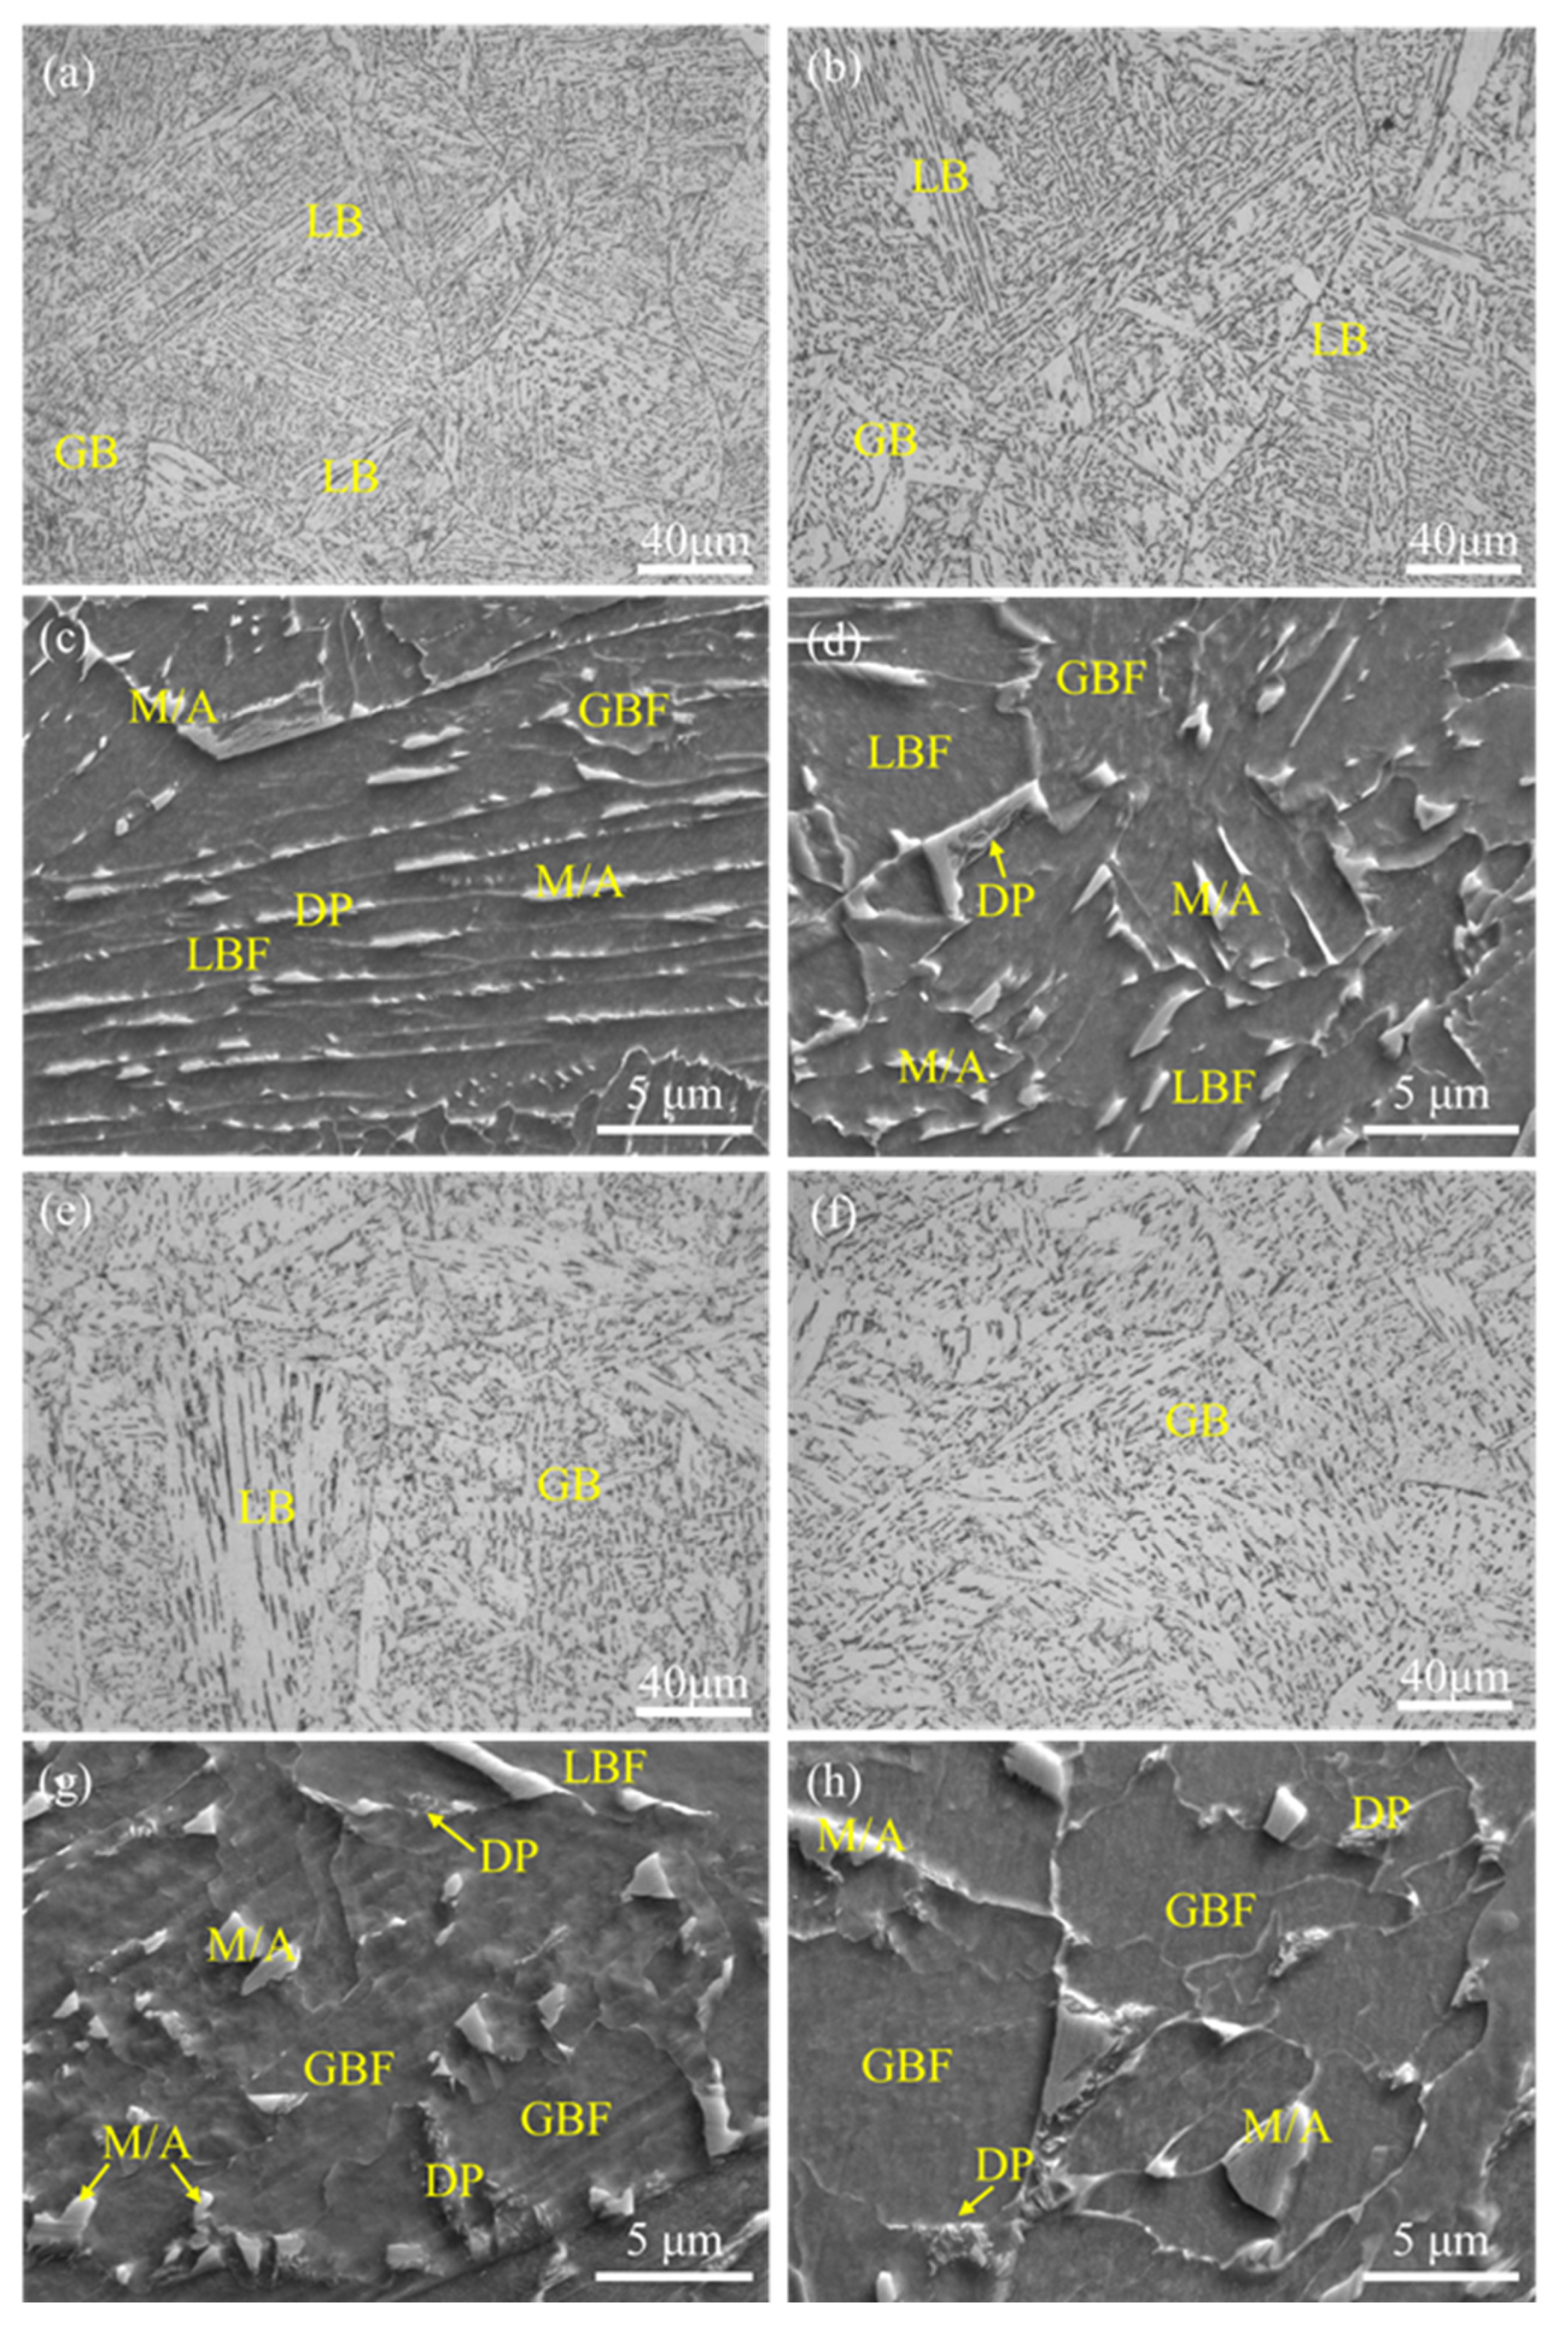
Representative OM and SEM images of the four simulated CGHAZ conditions are shown in Figure 2, and the quantitative phase fractions are summarised in Figure 3. In all conditions the microstructure was bainite-dominated, consisting of lath bainitic ferrite (LBF), granular bainitic ferrite (GBF), martensite/austenite (M/A) constituents, and degenerated pearlite (DP). At 15 kJ/cm the microstructure was characterised by an LBF matrix with GBF, M/A, and DP as minority phases. As heat input was raised, GBF, M/A, and DP fractions grew monotonically at the expense of LBF, such that at 45 kJ/cm the microstructure was entirely granular, comprising GBF, M/A, and DP without measurable LBF.
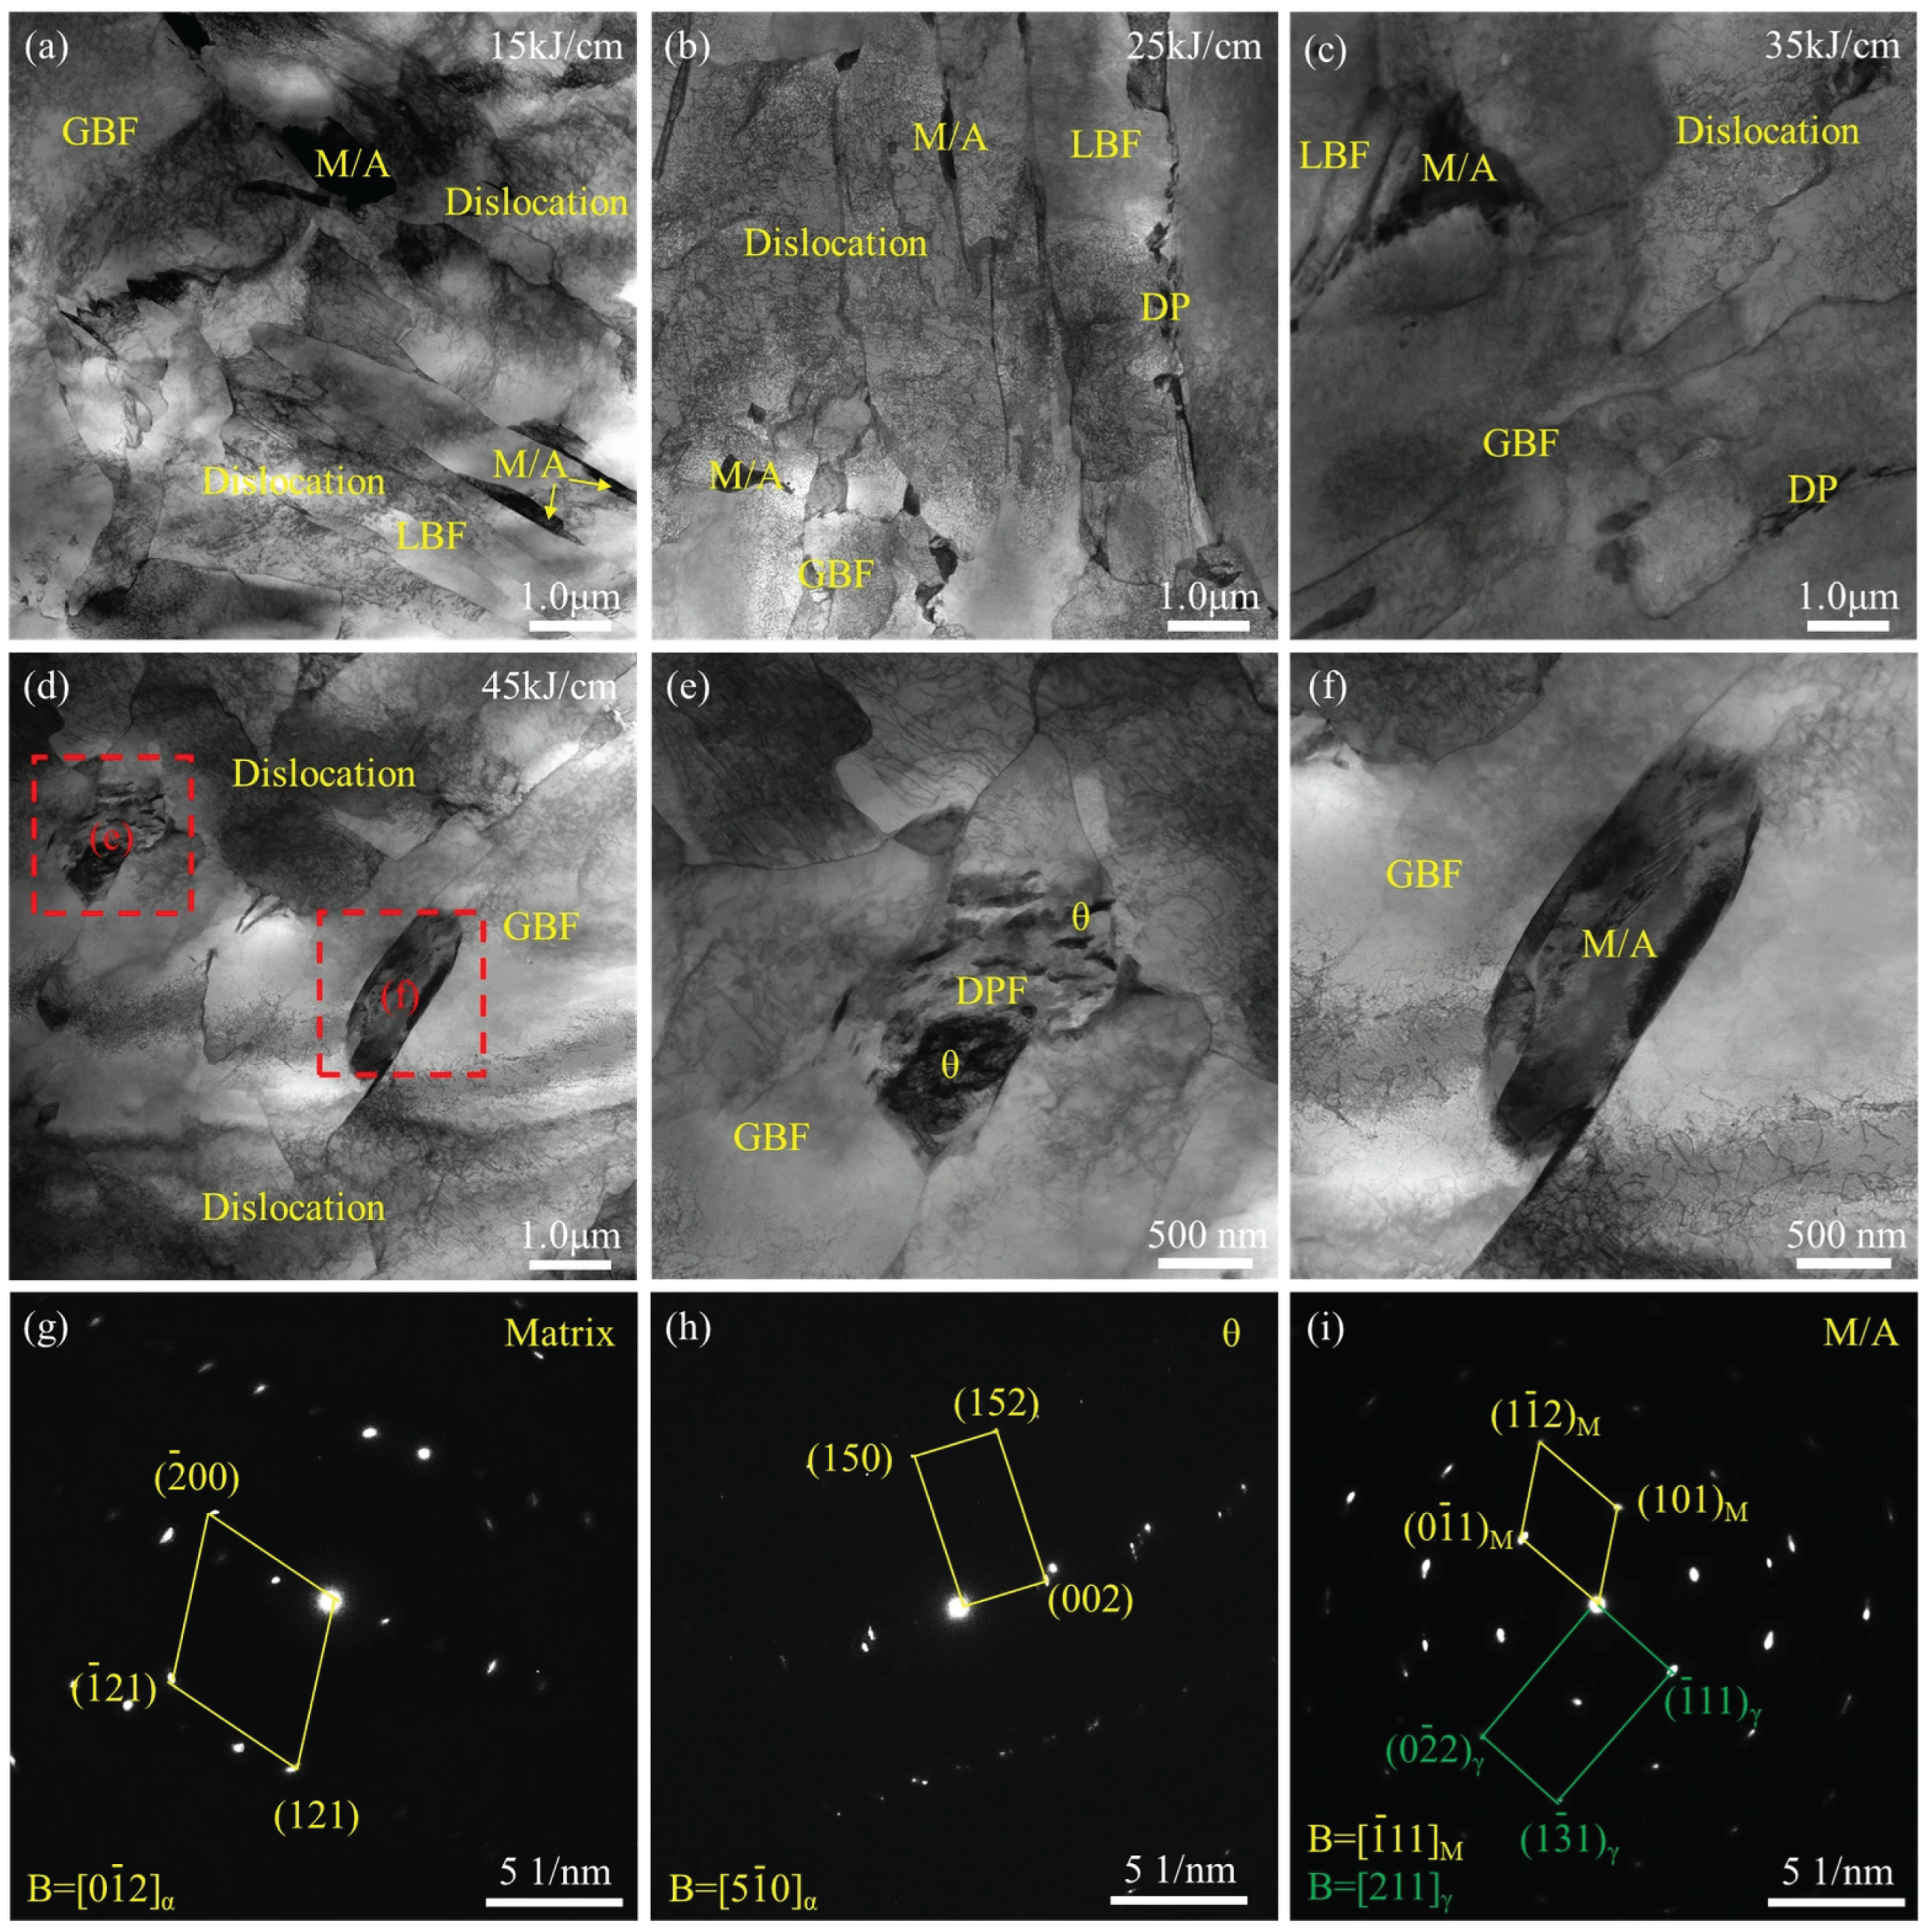
Figure 4 presents TEM micrographs of the simulated CGHAZ at different heat inputs. The microstructural features of the CGHAZ observed via TEM are fully consistent with the results obtained from OM and SEM observations in Figure 2. The intragranular dislocation substructure became progressively sparser with increasing heat input, evidenced by fewer and more loosely distributed dislocation lines. SAED analysis confirmed that the bainitic ferrite matrix was body-centred cubic (BCC) (Figure 4g). At 45 kJ/cm, higher-magnification images (Figure 4e,f) revealed the DP constituent—composed of theta-carbide grains surrounded by degenerated pearlite ferrite (DPF), verified by the theta-phase SAED pattern in Figure 4h—and M/A islands, whose SAED pattern (Figure 4i) exhibited reflections from both BCC martensite and face-centred cubic (FCC) retained austenite.
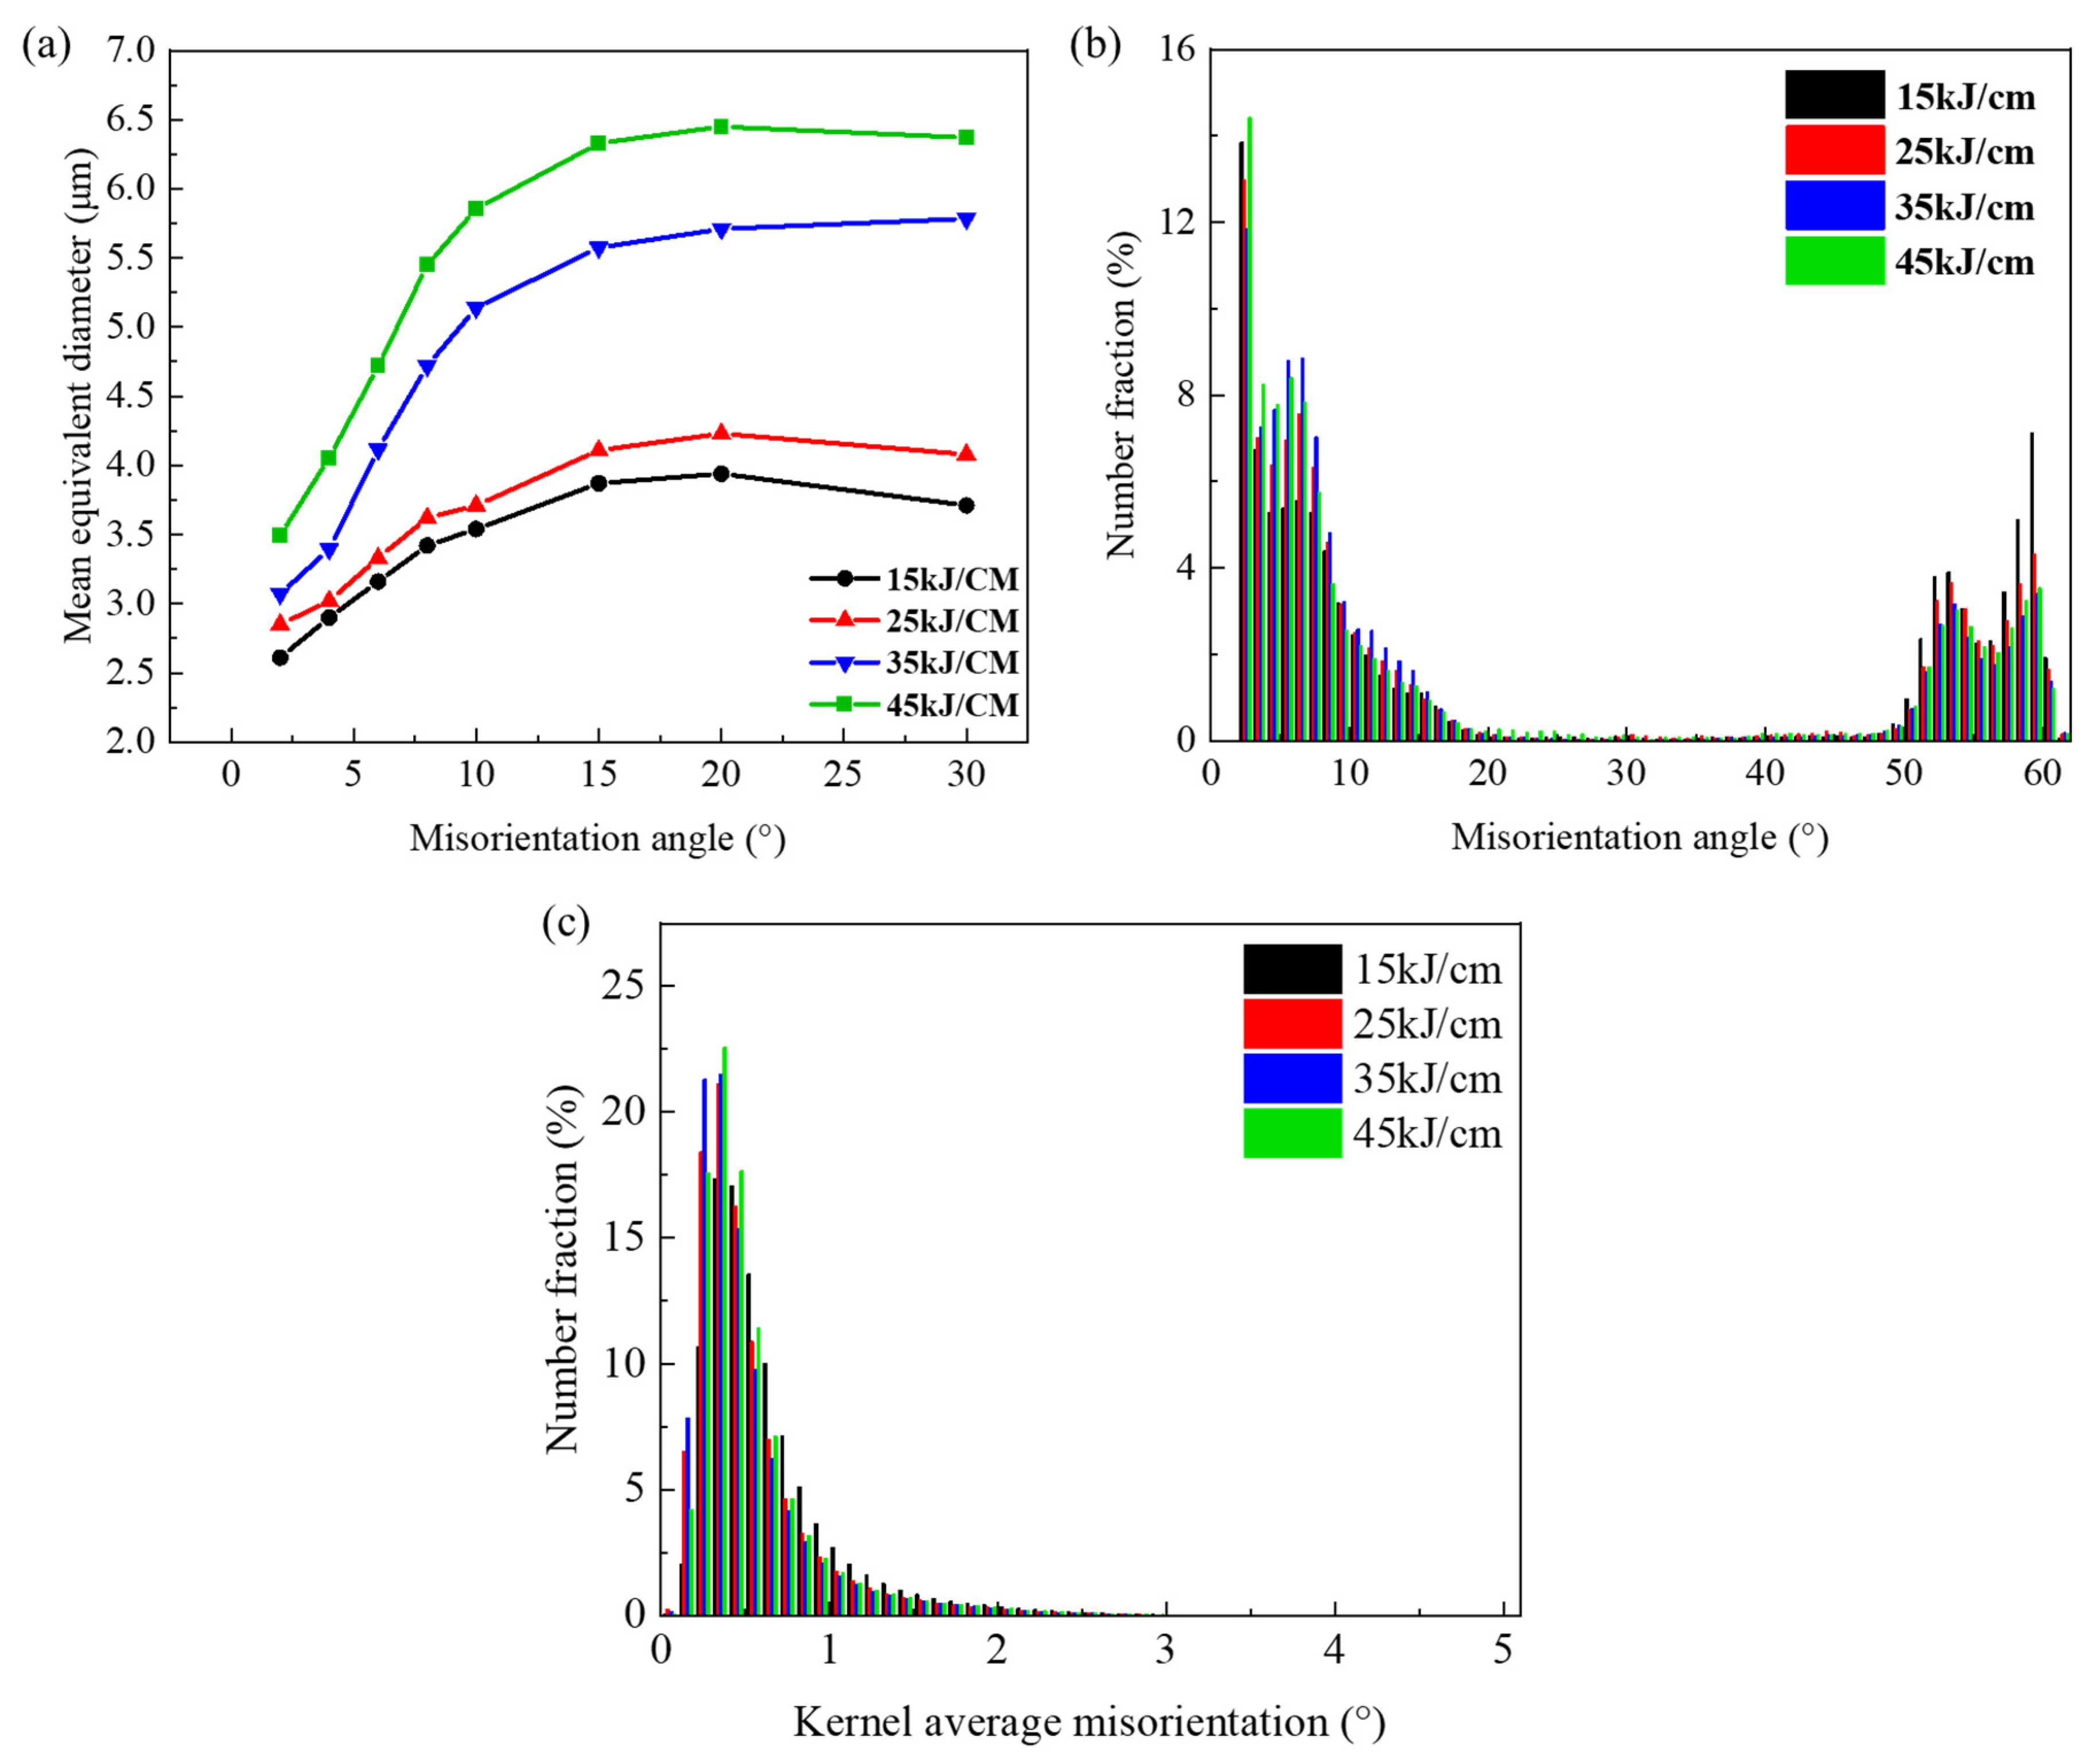
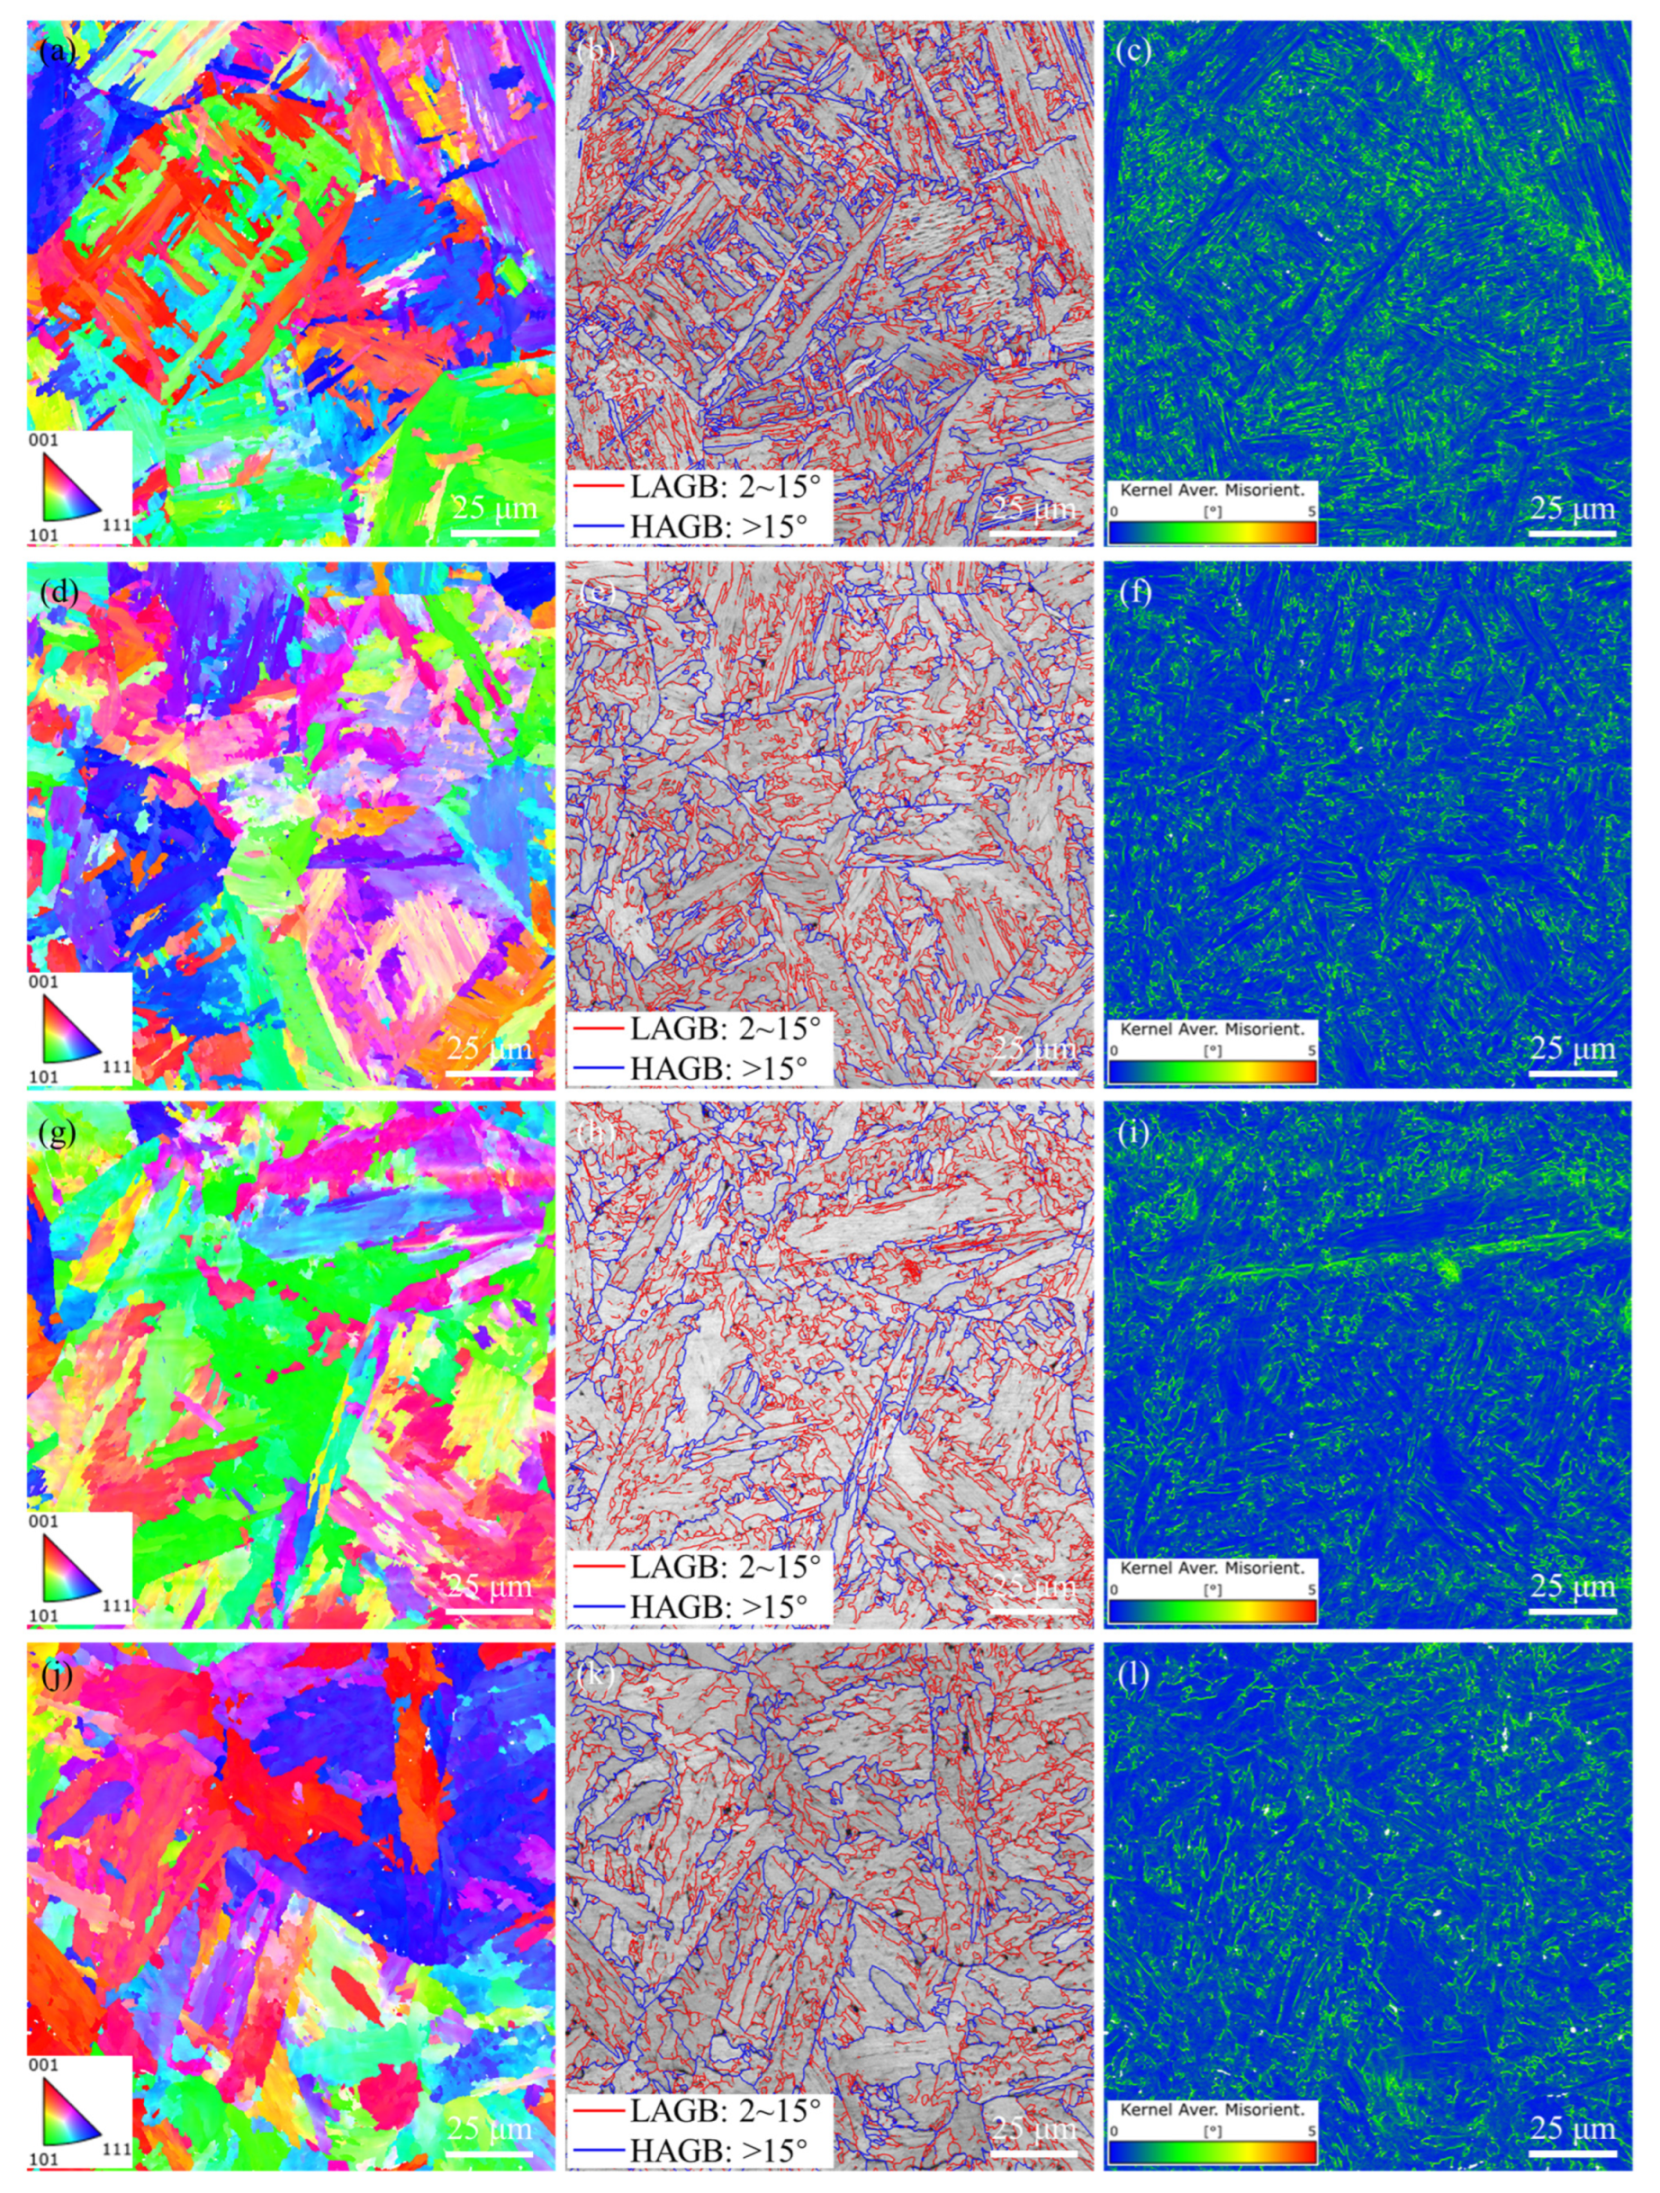
The EBSD results in Figure 5 and Figure 6 elucidated the crystallographic orientation characteristics in the simulated CGHAZ. Table 2 presents statistical data on the crystallographic features in the simulated CGHAZ. Inverse pole figures (IPFs) reflect grain orientations within the simulated CGHAZ under different crystallographic orientations through distinct coloration. In the simulated CGHAZs with varying heat inputs, mixed-color grains exhibited random orientations. The mean equivalent diameter (MED) is a key parameter for characterizing ferrite matrix grain size in alloy materials [17,18]. As shown in Figure 6a, the MED defined by different misorientation angles (MTAs) increased with rising heat input. This result indicated that heat input had a coarsening effect on the CGHAZ microstructure.
The red and blue lines in the image quality (IQ) plots (Figure 5b,e,h,k) represent low-angle grain boundaries (LAGBs) with MTA ranges from 2 to 15° and high-angle grain boundaries (HAGBs) with MTAs greater than 15°, respectively. It is revealed that the HAGB fraction (MTA > 15°) contracted from 42.3% to 30.8% as heat input rose from 15 to 45 kJ/cm, while the LAGB fraction (MTA 2–15°) expanded correspondingly. Grain boundary densities, calculated following reference [19], showed HAGB density declining from 0.321 to 0.194 μm−1 and LAGB density falling from 0.437 to 0.325 μm−1—reductions of approximately 40% and 26%, respectively (Table 2).
A significant drop in grain-boundary density inside the CGHAZ follows from heat-input-induced grain coarsening. KAM values serve as an effective visual proxy for dislocation density [20]. Higher KAM numbers reflect denser dislocation arrangements [21]. KAM maps (Figure 5c,f,i,l) and the associated KAM frequency distributions (Figure 6c) showed a decrease in mean KAM value from 0.63 to 0.54 with increasing heat input, indicating lower local strain gradients and reduced dislocation density, in agreement with TEM observations (Figure 4).
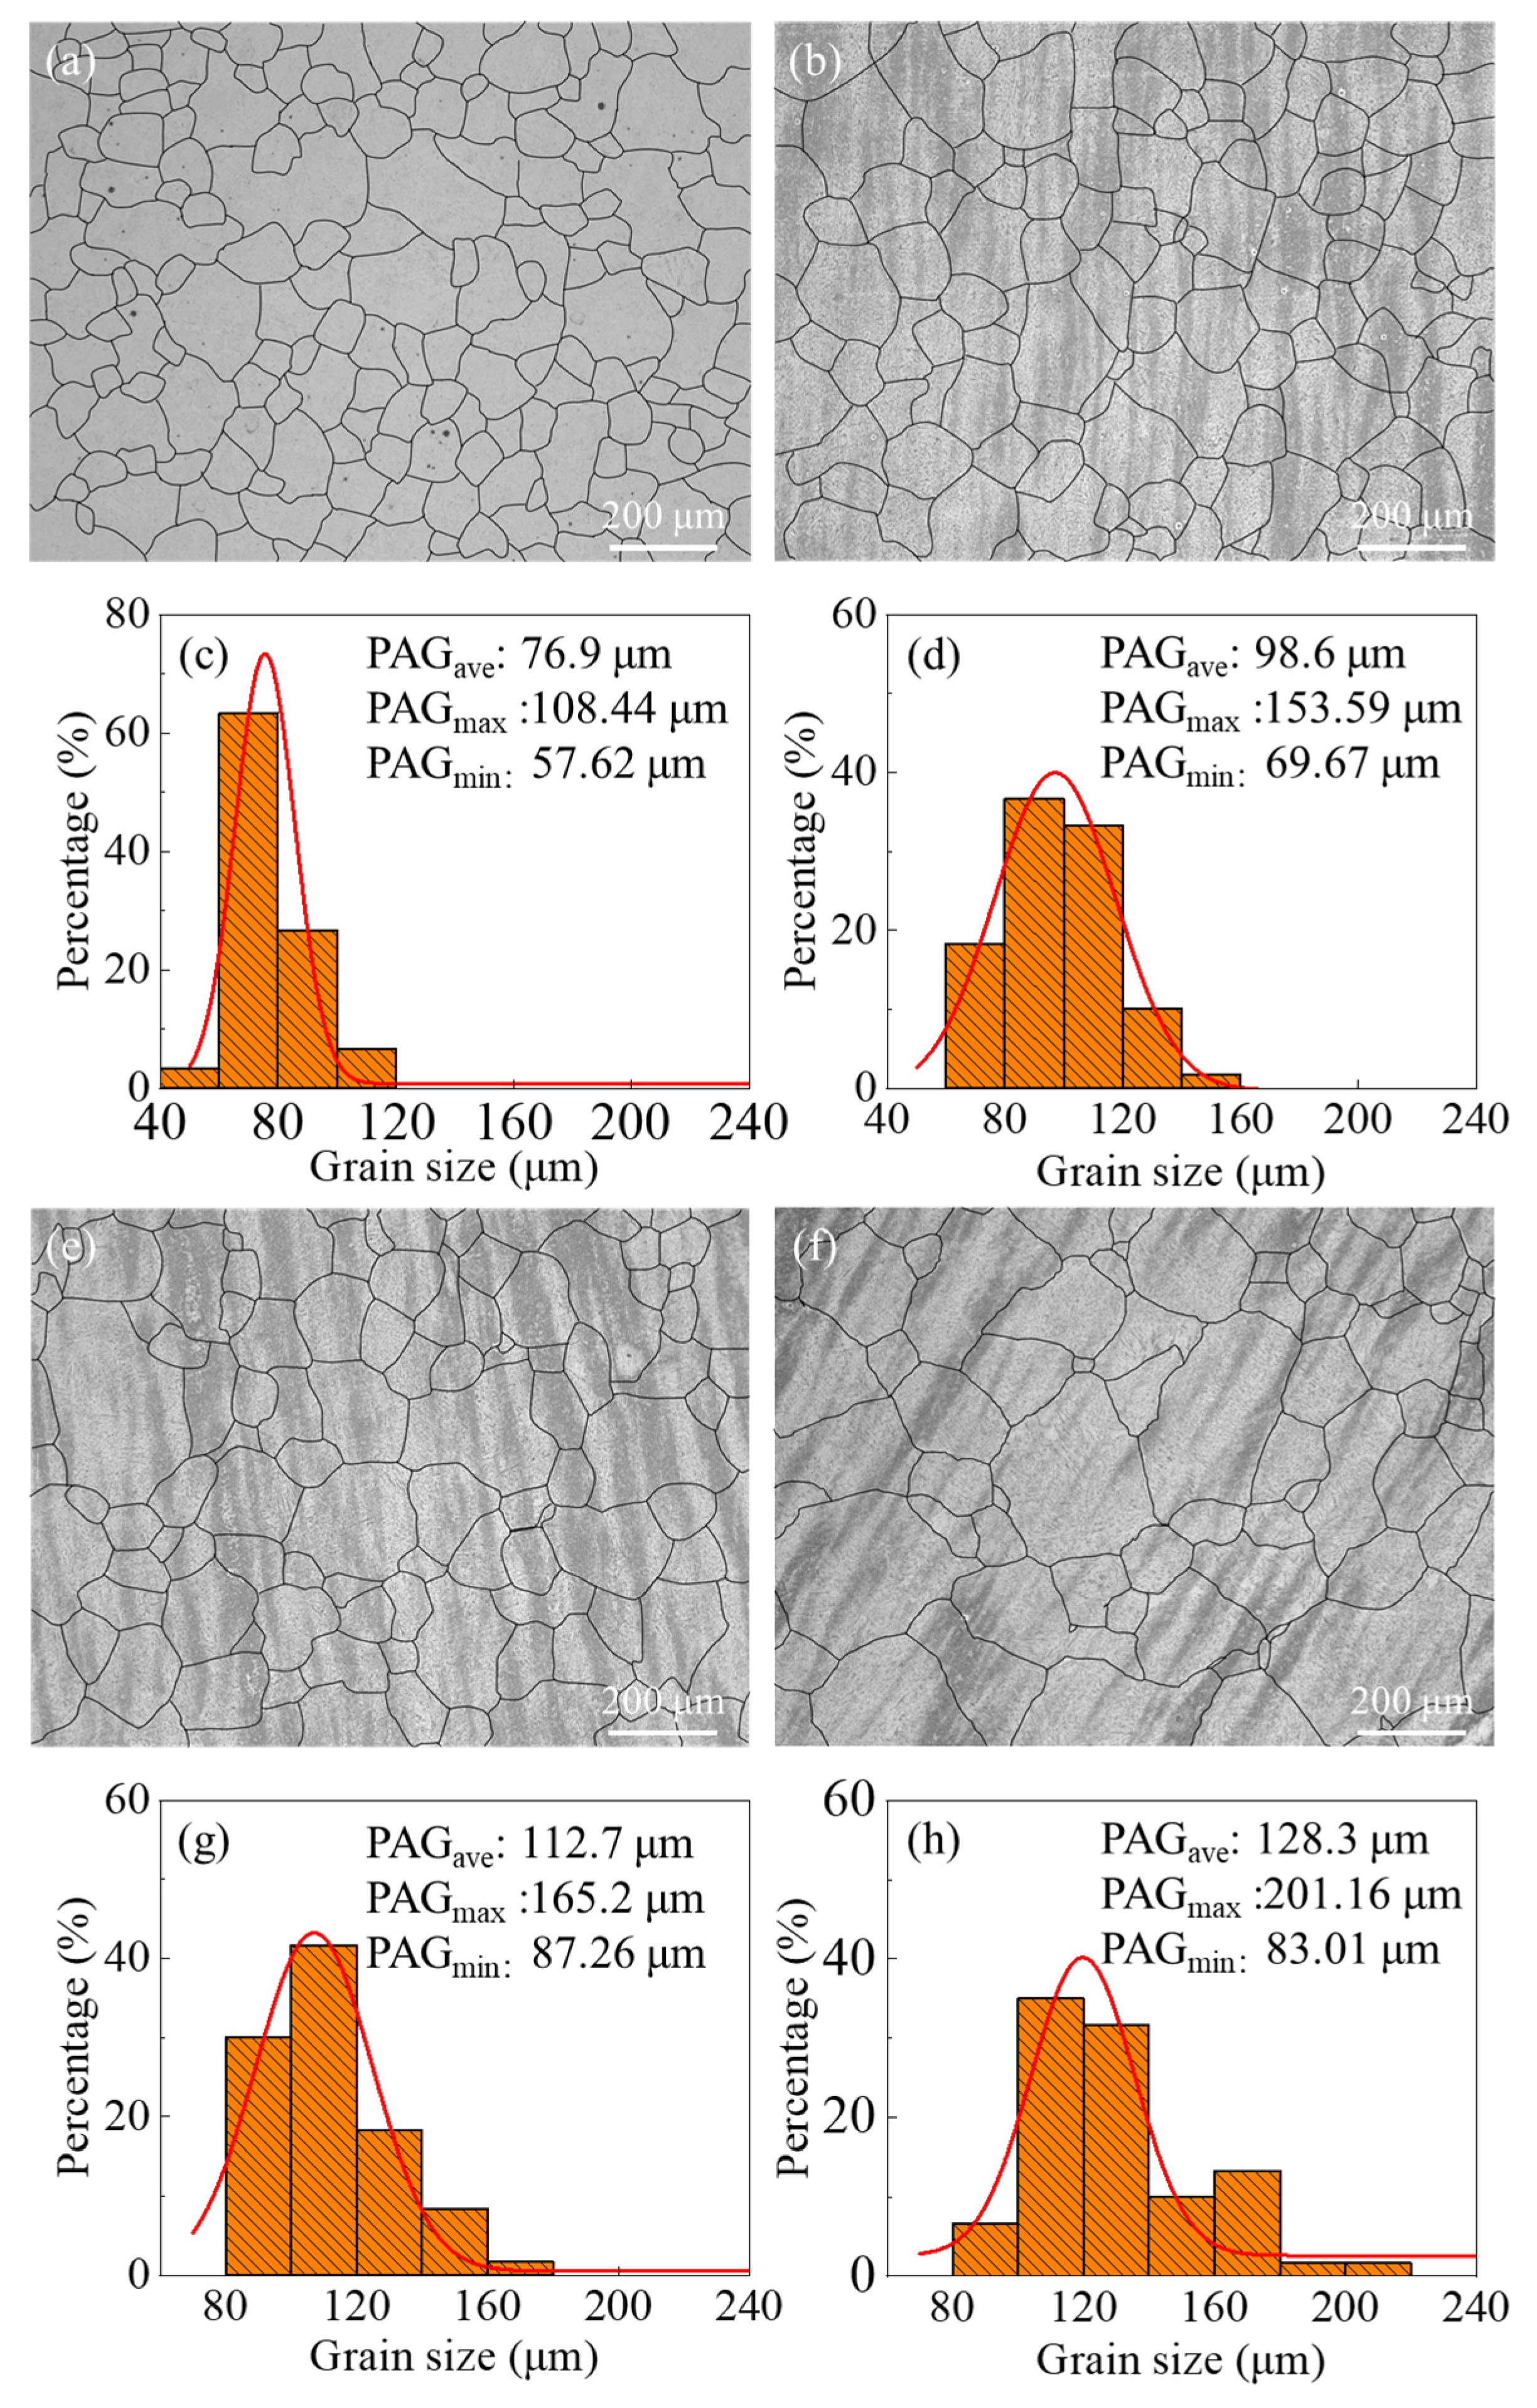
Depicted in Figure 7 are characteristic prior austenite grains (PAGs) from the CGHAZ, together with grain-size distributions measured across a range of heat-input conditions. The results revealed pronounced grain coarsening: the mean PAG diameter increased from 76.9 um at 15 kJ/cm to 128.3 um at 45 kJ/cm, an enlargement of approximately 67%. The Gaussian-fitted size distributions also broadened with rising heat input.
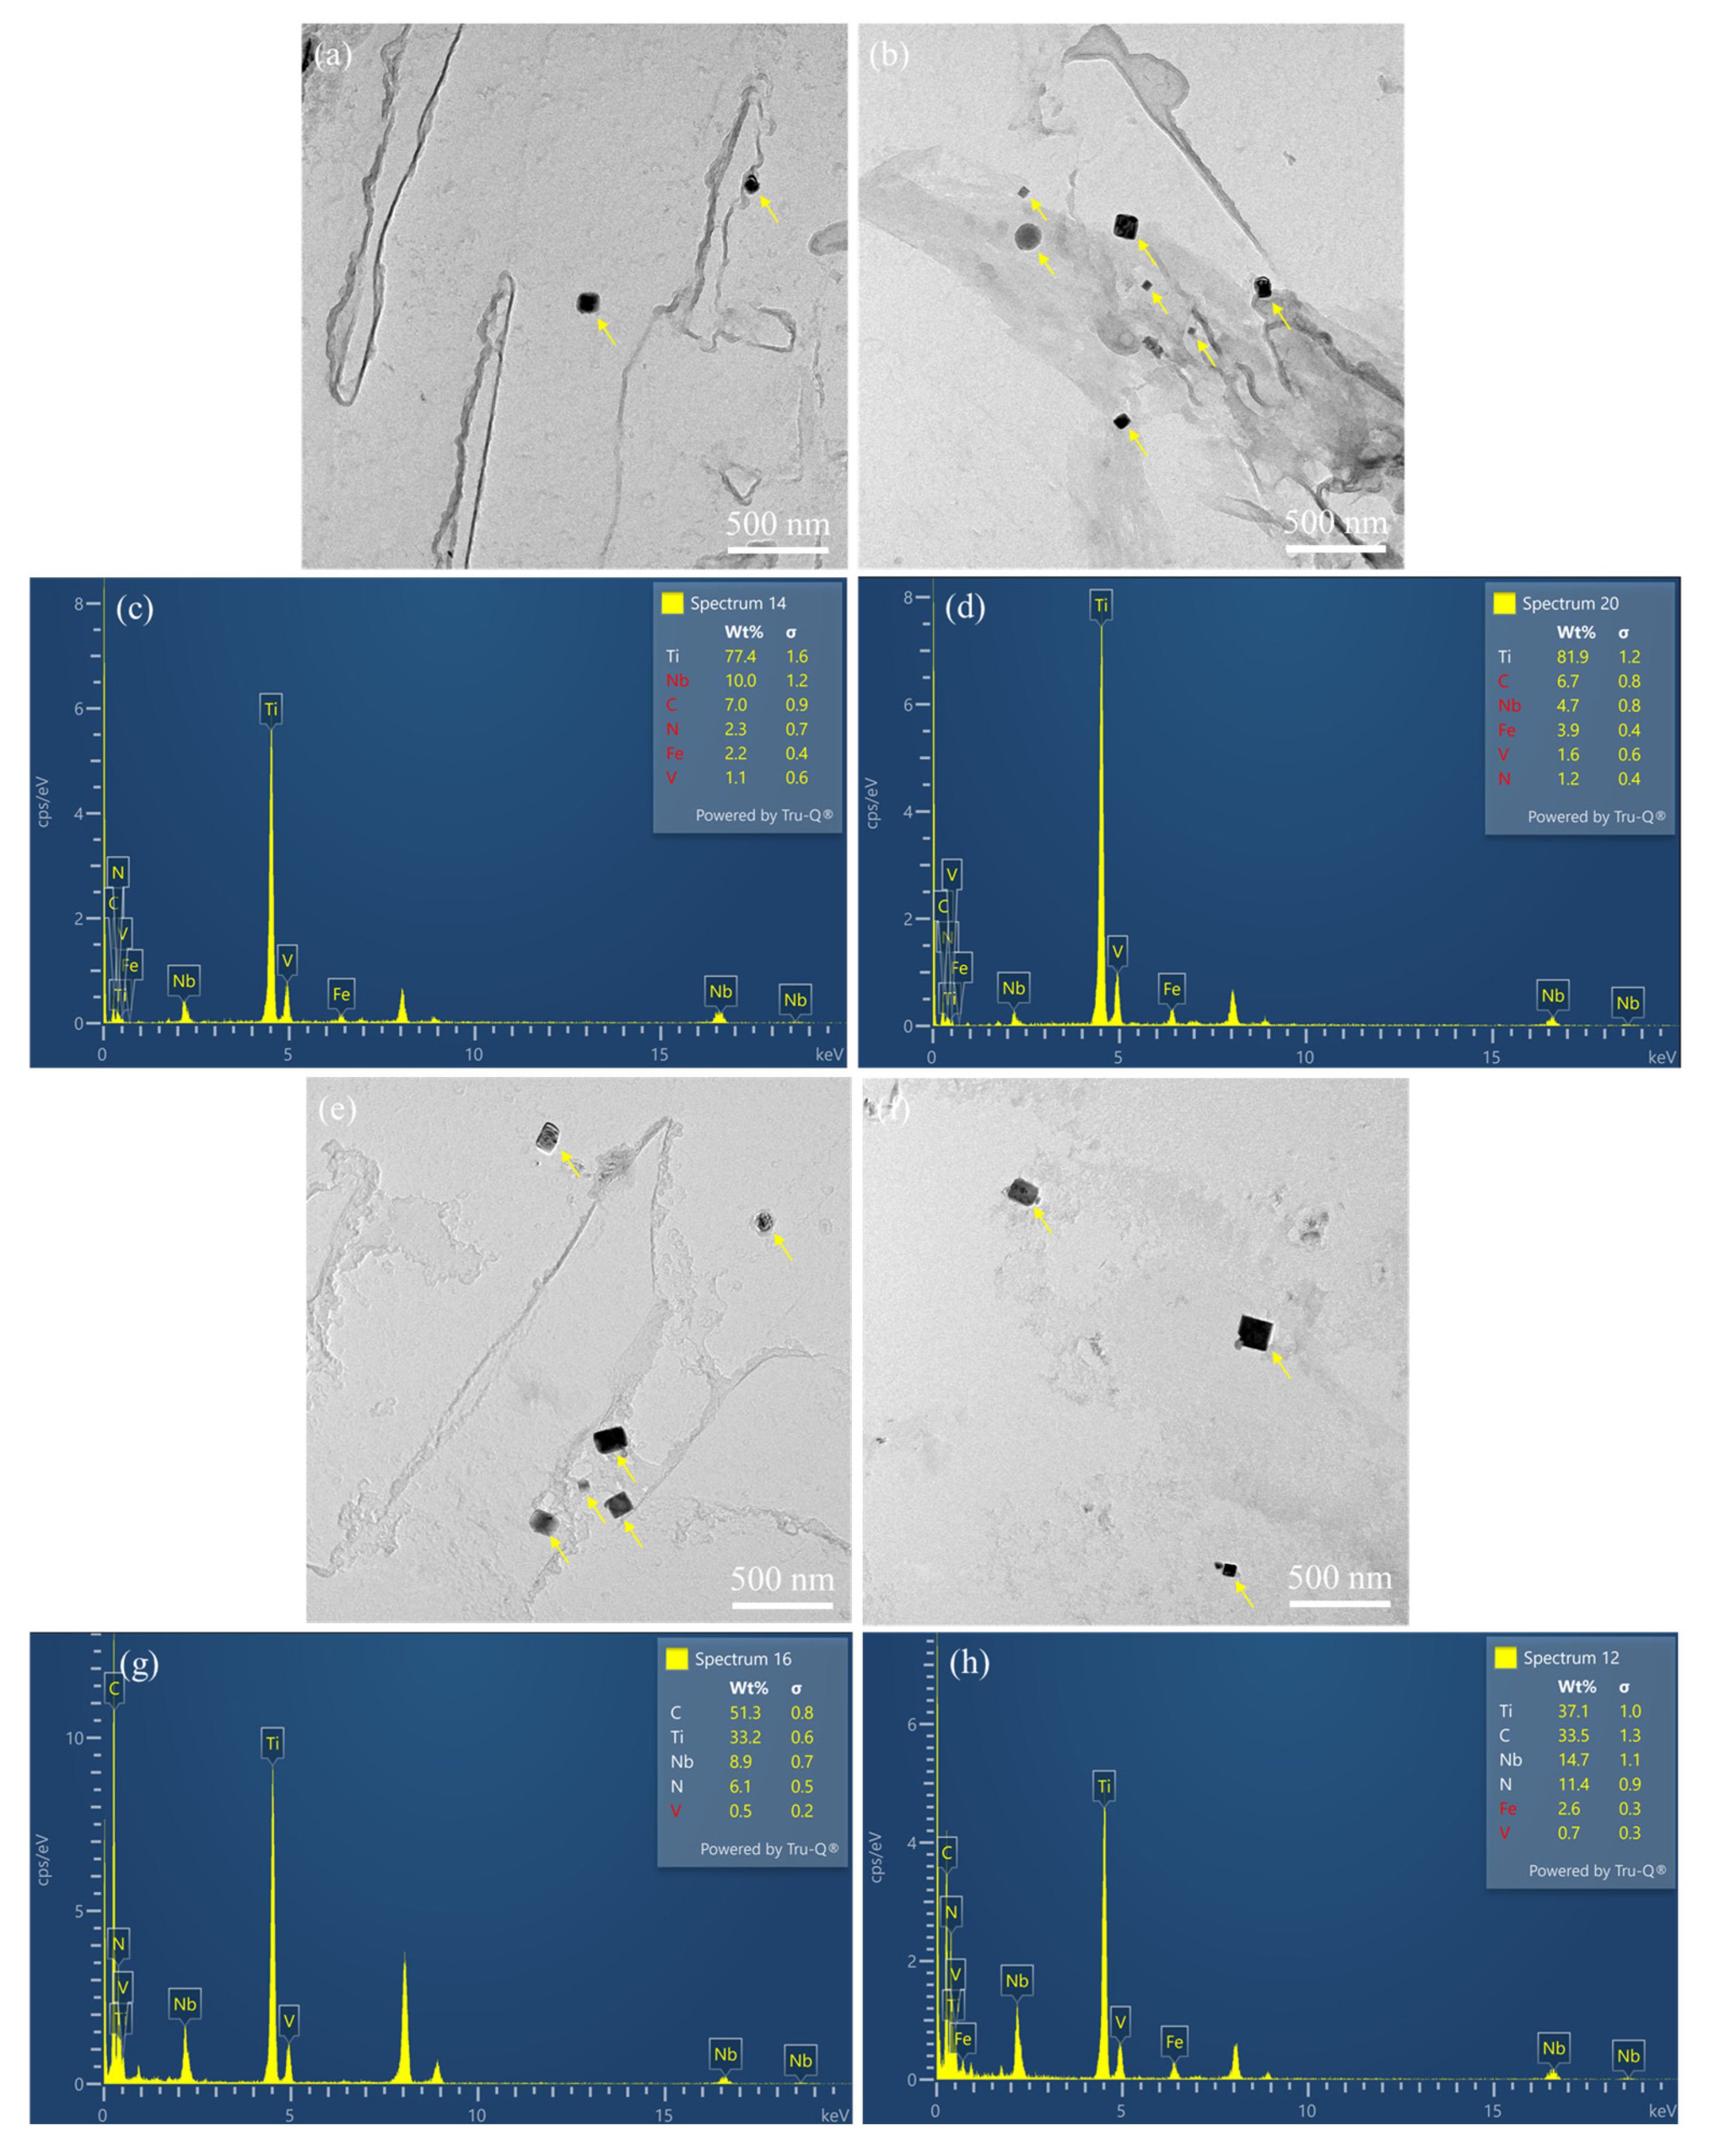
Figure 8 displays TEM micrographs of precipitated particles in the simulated CGHAZ and corresponding energy-dispersive spectroscopy (EDS) point analysis. EDS point analysis of carbon extraction replicas identified the precipitates at all heat inputs as (Ti, Nb, V) (C, N) composite carbonitrides. Increasing heat input from 15 to 45 kJ/cm caused the mean particle diameter to grow from 52.2 nm to 74.8 nm and the average volume fraction to increase from 0.23% to 0.56%, reflecting particle coarsening driven by extended high-temperature dwell.

3.2. Mechanical Properties

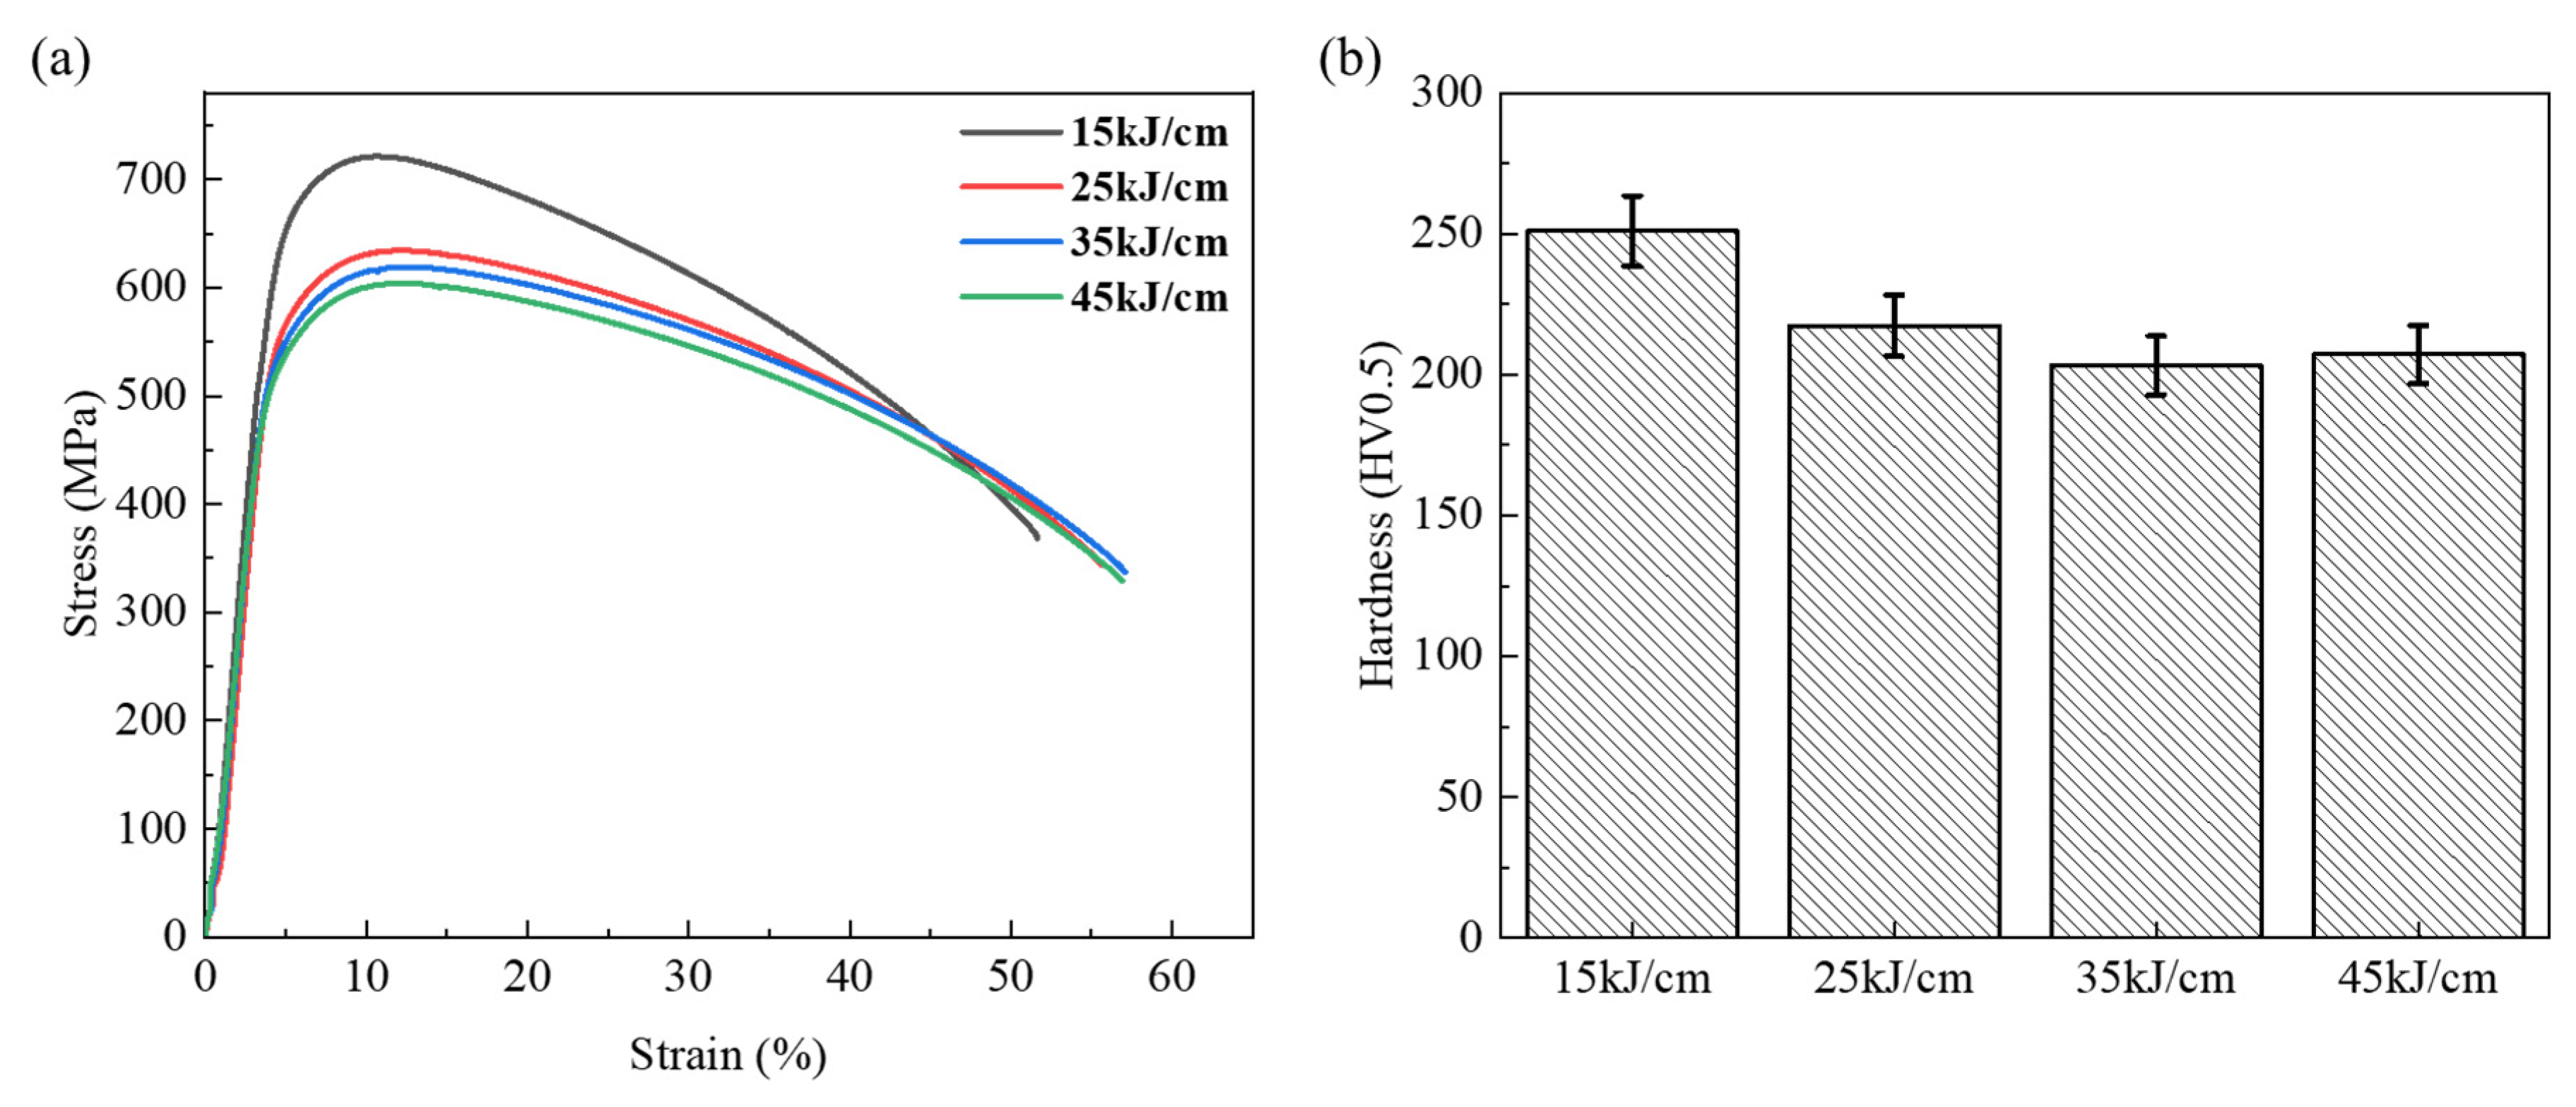
Engineering stress–strain curves and hardness results are presented in Figure 9 and collated in Table 3. All static strength metrics declined monotonically with increasing heat input: yield strength dropped from 555 MPa to 481 MPa, tensile strength from 720 MPa to 608 MPa, and Vickers hardness from 250.9 HV0.5 to 207.2 HV0.5, confirming a pronounced softening effect attributable to microstructural coarsening and the reduction in dislocation substructure density documented in Section 3.1. Uniform elongation showed a modest improvement, rising from 7.9% to 10.1%, consistent with the greater plastic compliance of a softer granular bainite microstructure.
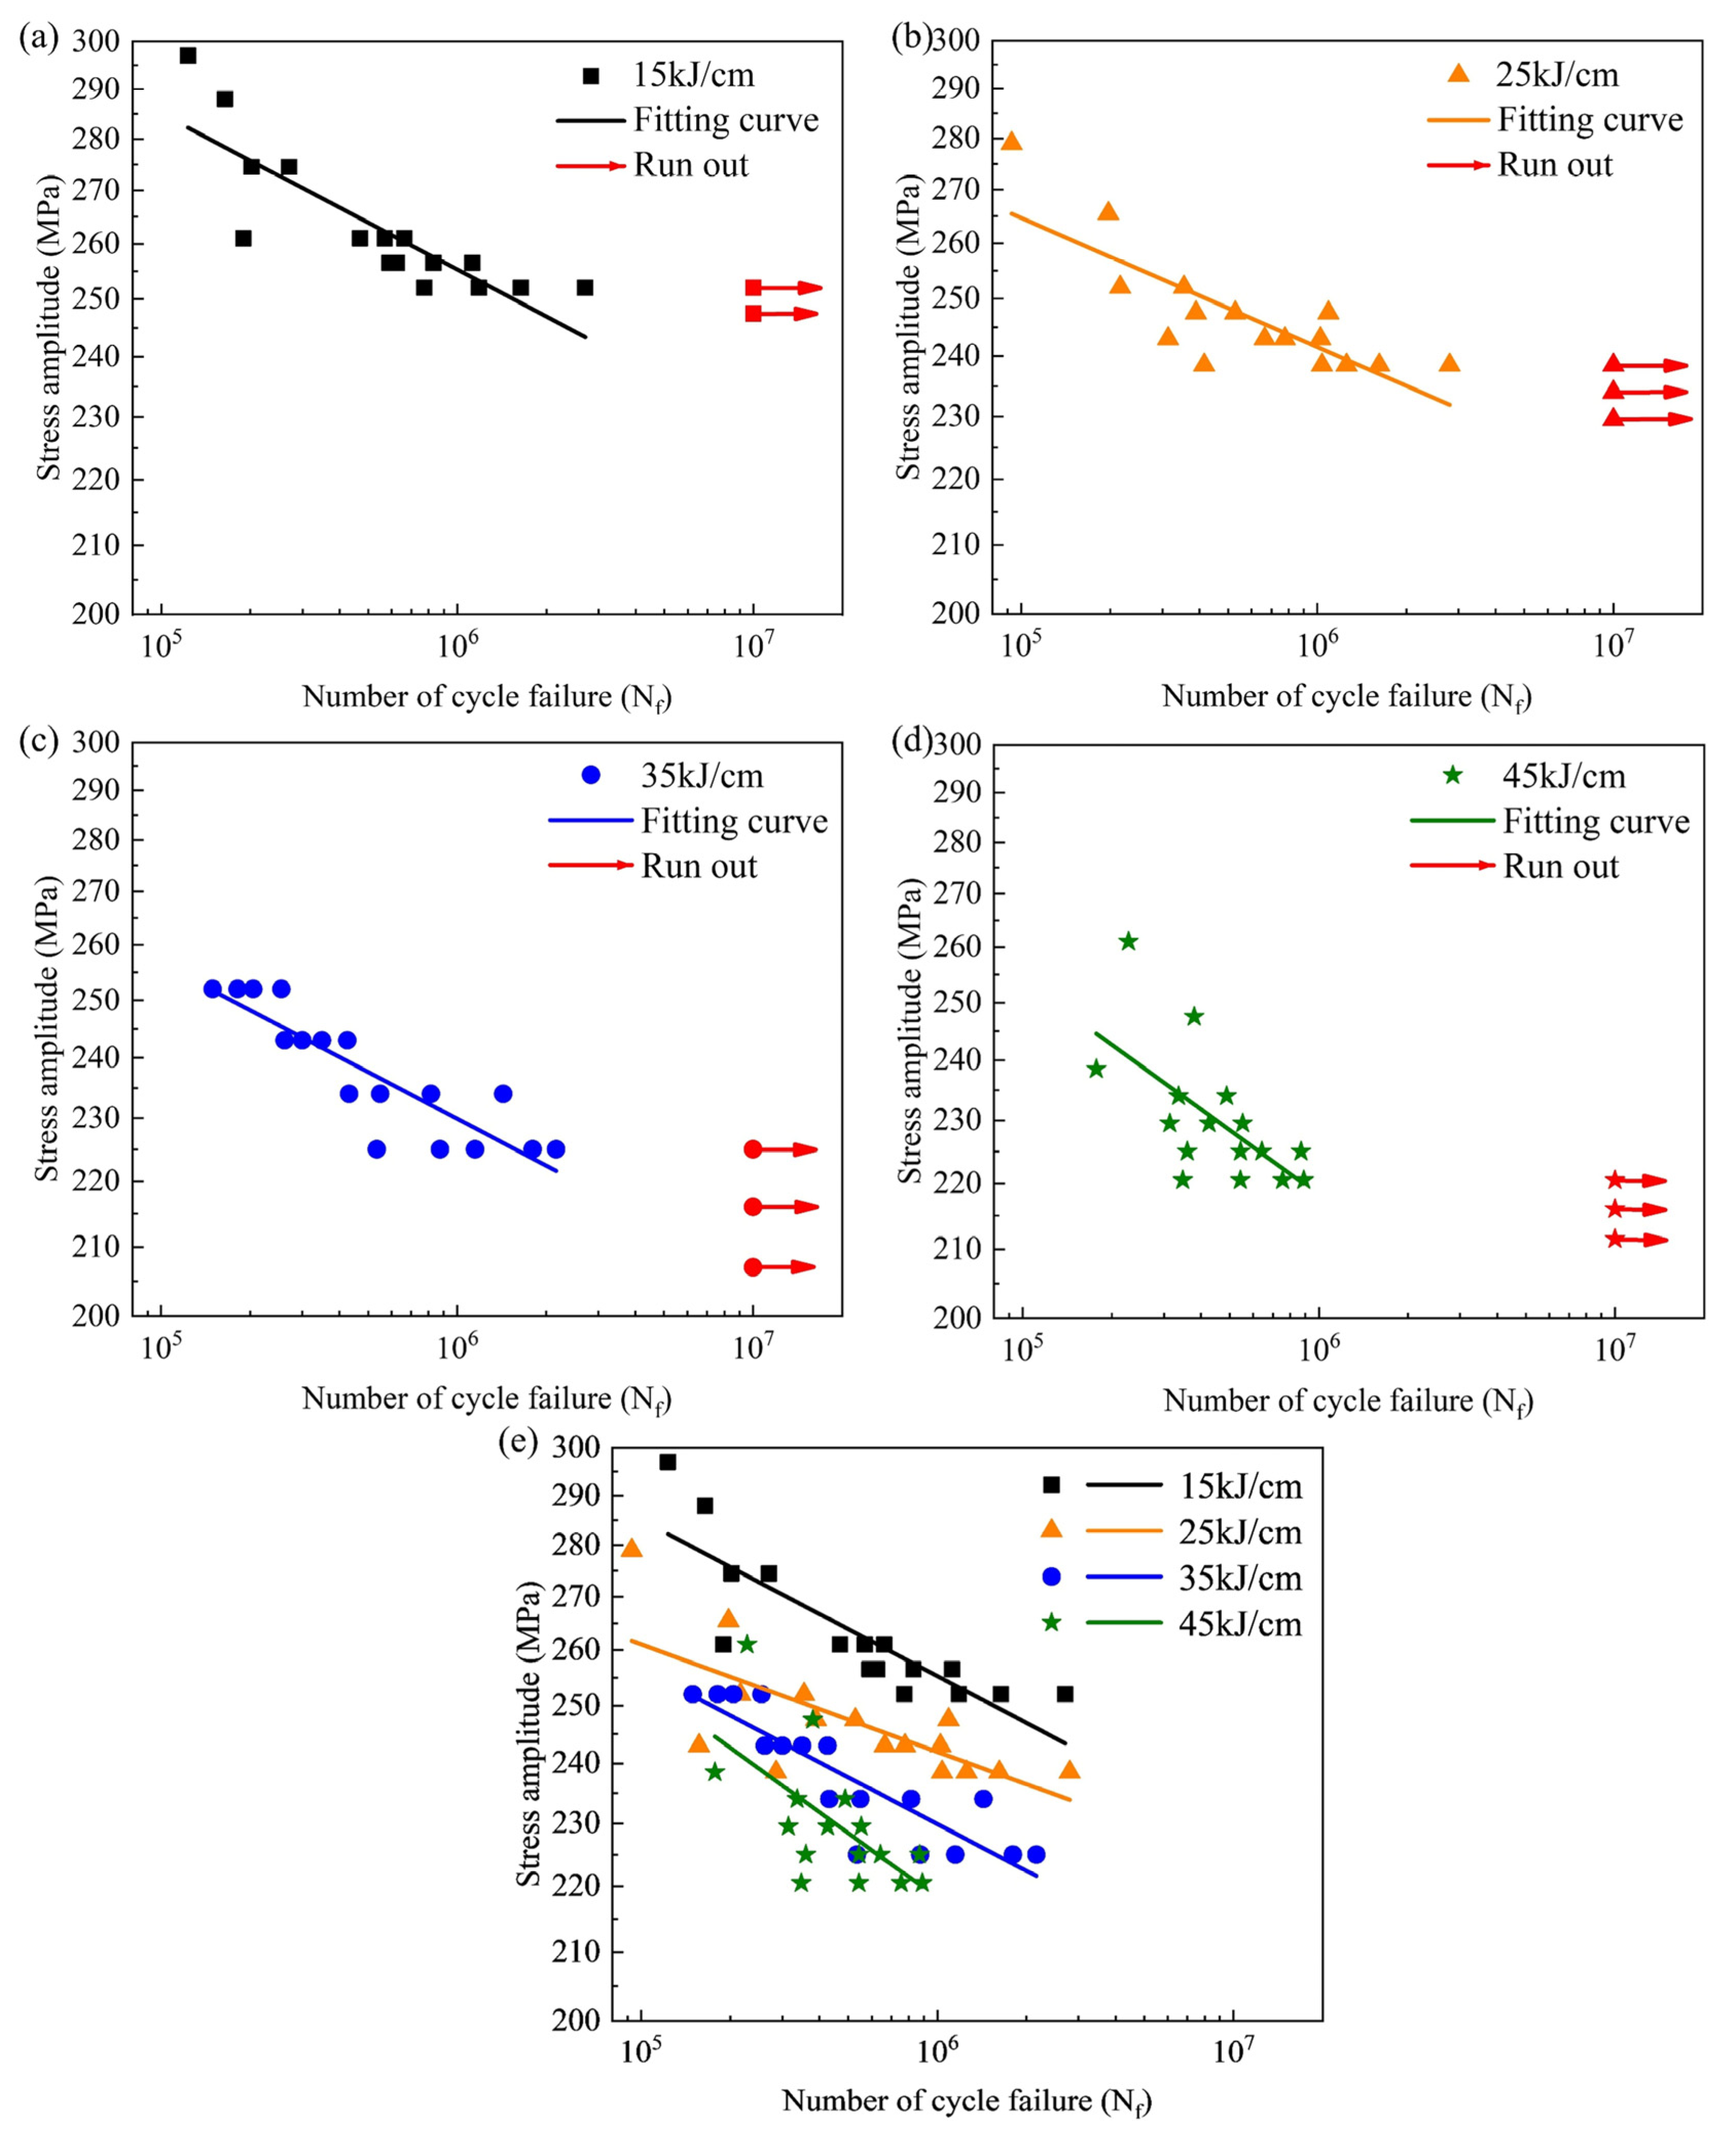
Figure 10 shows the high-cycle fatigue performance of simulated CGHAZ under different heat inputs. The corresponding S-N curves (Woehler curves) for each CGHAZ specimen are shown in Figure 10a, b, c, and d, respectively. It can be observed that the fatigue data obtained from the CGHAZ specimens exhibited a relatively concentrated distribution. The S-N curves of the failed CGHAZ specimens were fitted using the following equations [22,23]:
l o g σ a = l o g σ f ′   − b   ∗ l o g ( N f )
where σa denotes the stress amplitude, σ f ′ represents the fatigue strength coefficient, Nf indicates the number of cycles to failure, and b is the fatigue strength index. Figure 10e shows the fitting results of Nf versus stress amplitude, with the fitting equation for the CGHAZ specimen as follows:
15 kJ/cm: log σa = 2.69 − 0.05 ∗ log(Nf)
25 kJ/cm: log σa = 2.62 − 0.04 ∗ log(Nf)
35 kJ/cm: log σa = 2.65 − 0.05 ∗ log(Nf)
45 kJ/cm: log σa = 2.73 − 0.06 ∗ log(Nf)
Therefore, consistent with the trends observed for tensile strength and hardness, the fatigue strength of the simulated CGHAZ specimens gradually decreased from 246.9 MPa to 208.5 MPa as the heat input increased from 15 kJ/cm to 45 kJ/cm.

3.3. Fatigue Fracture Characteristics

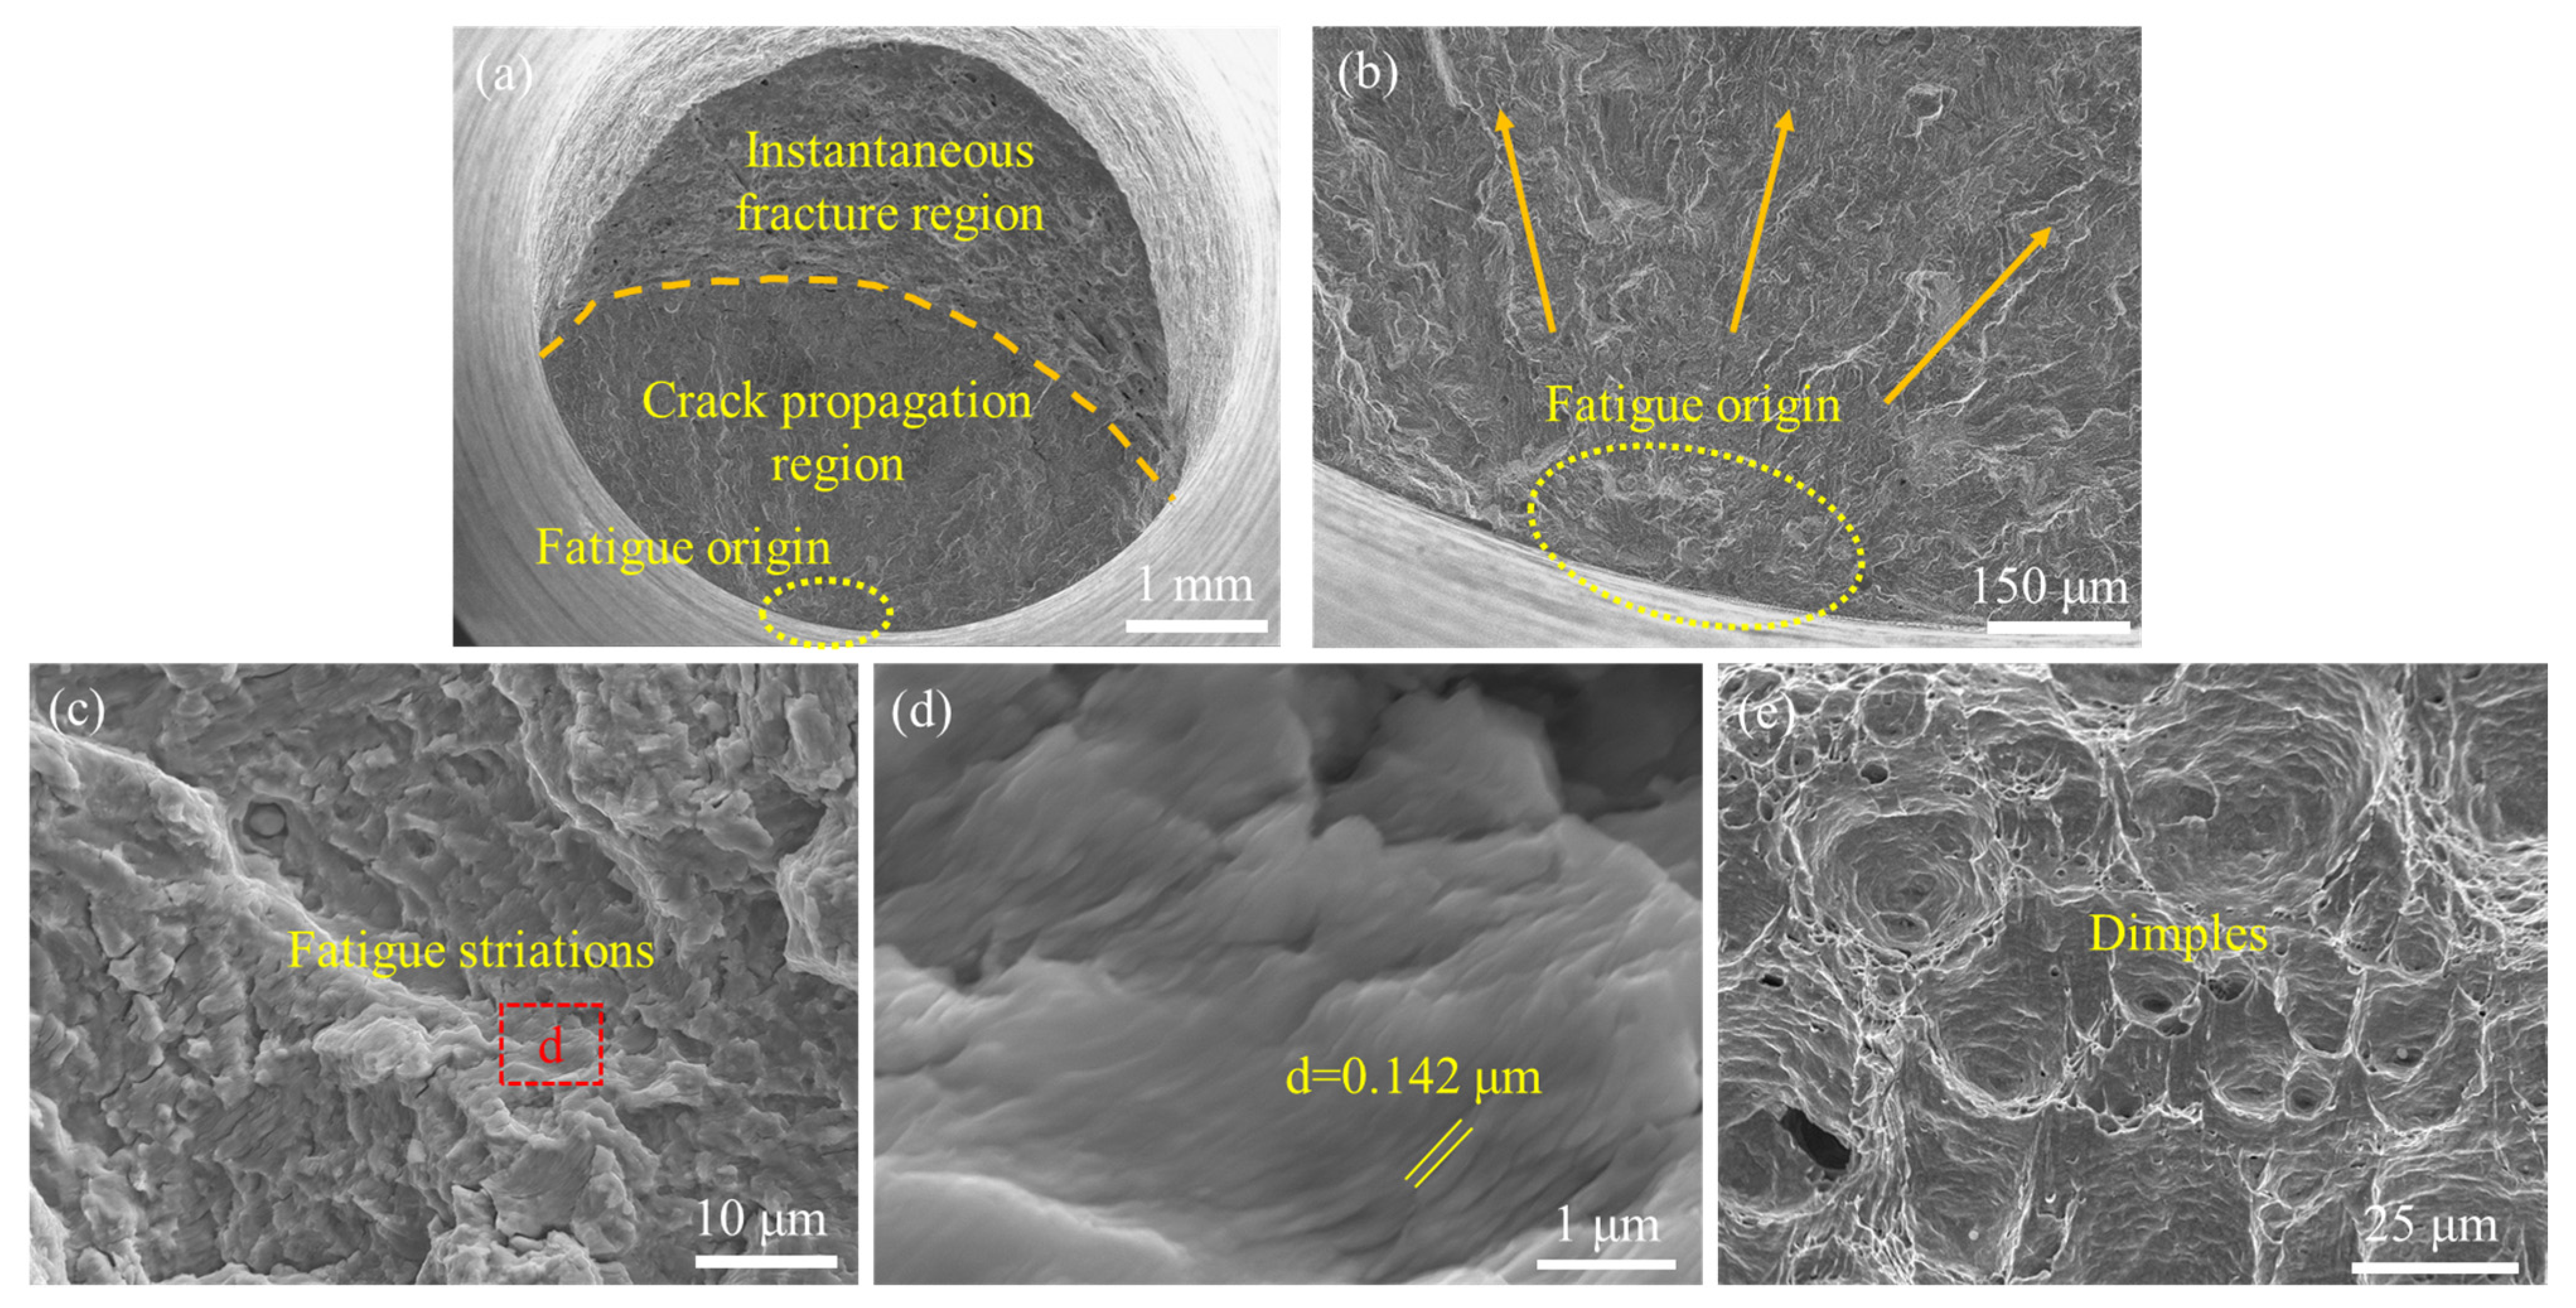
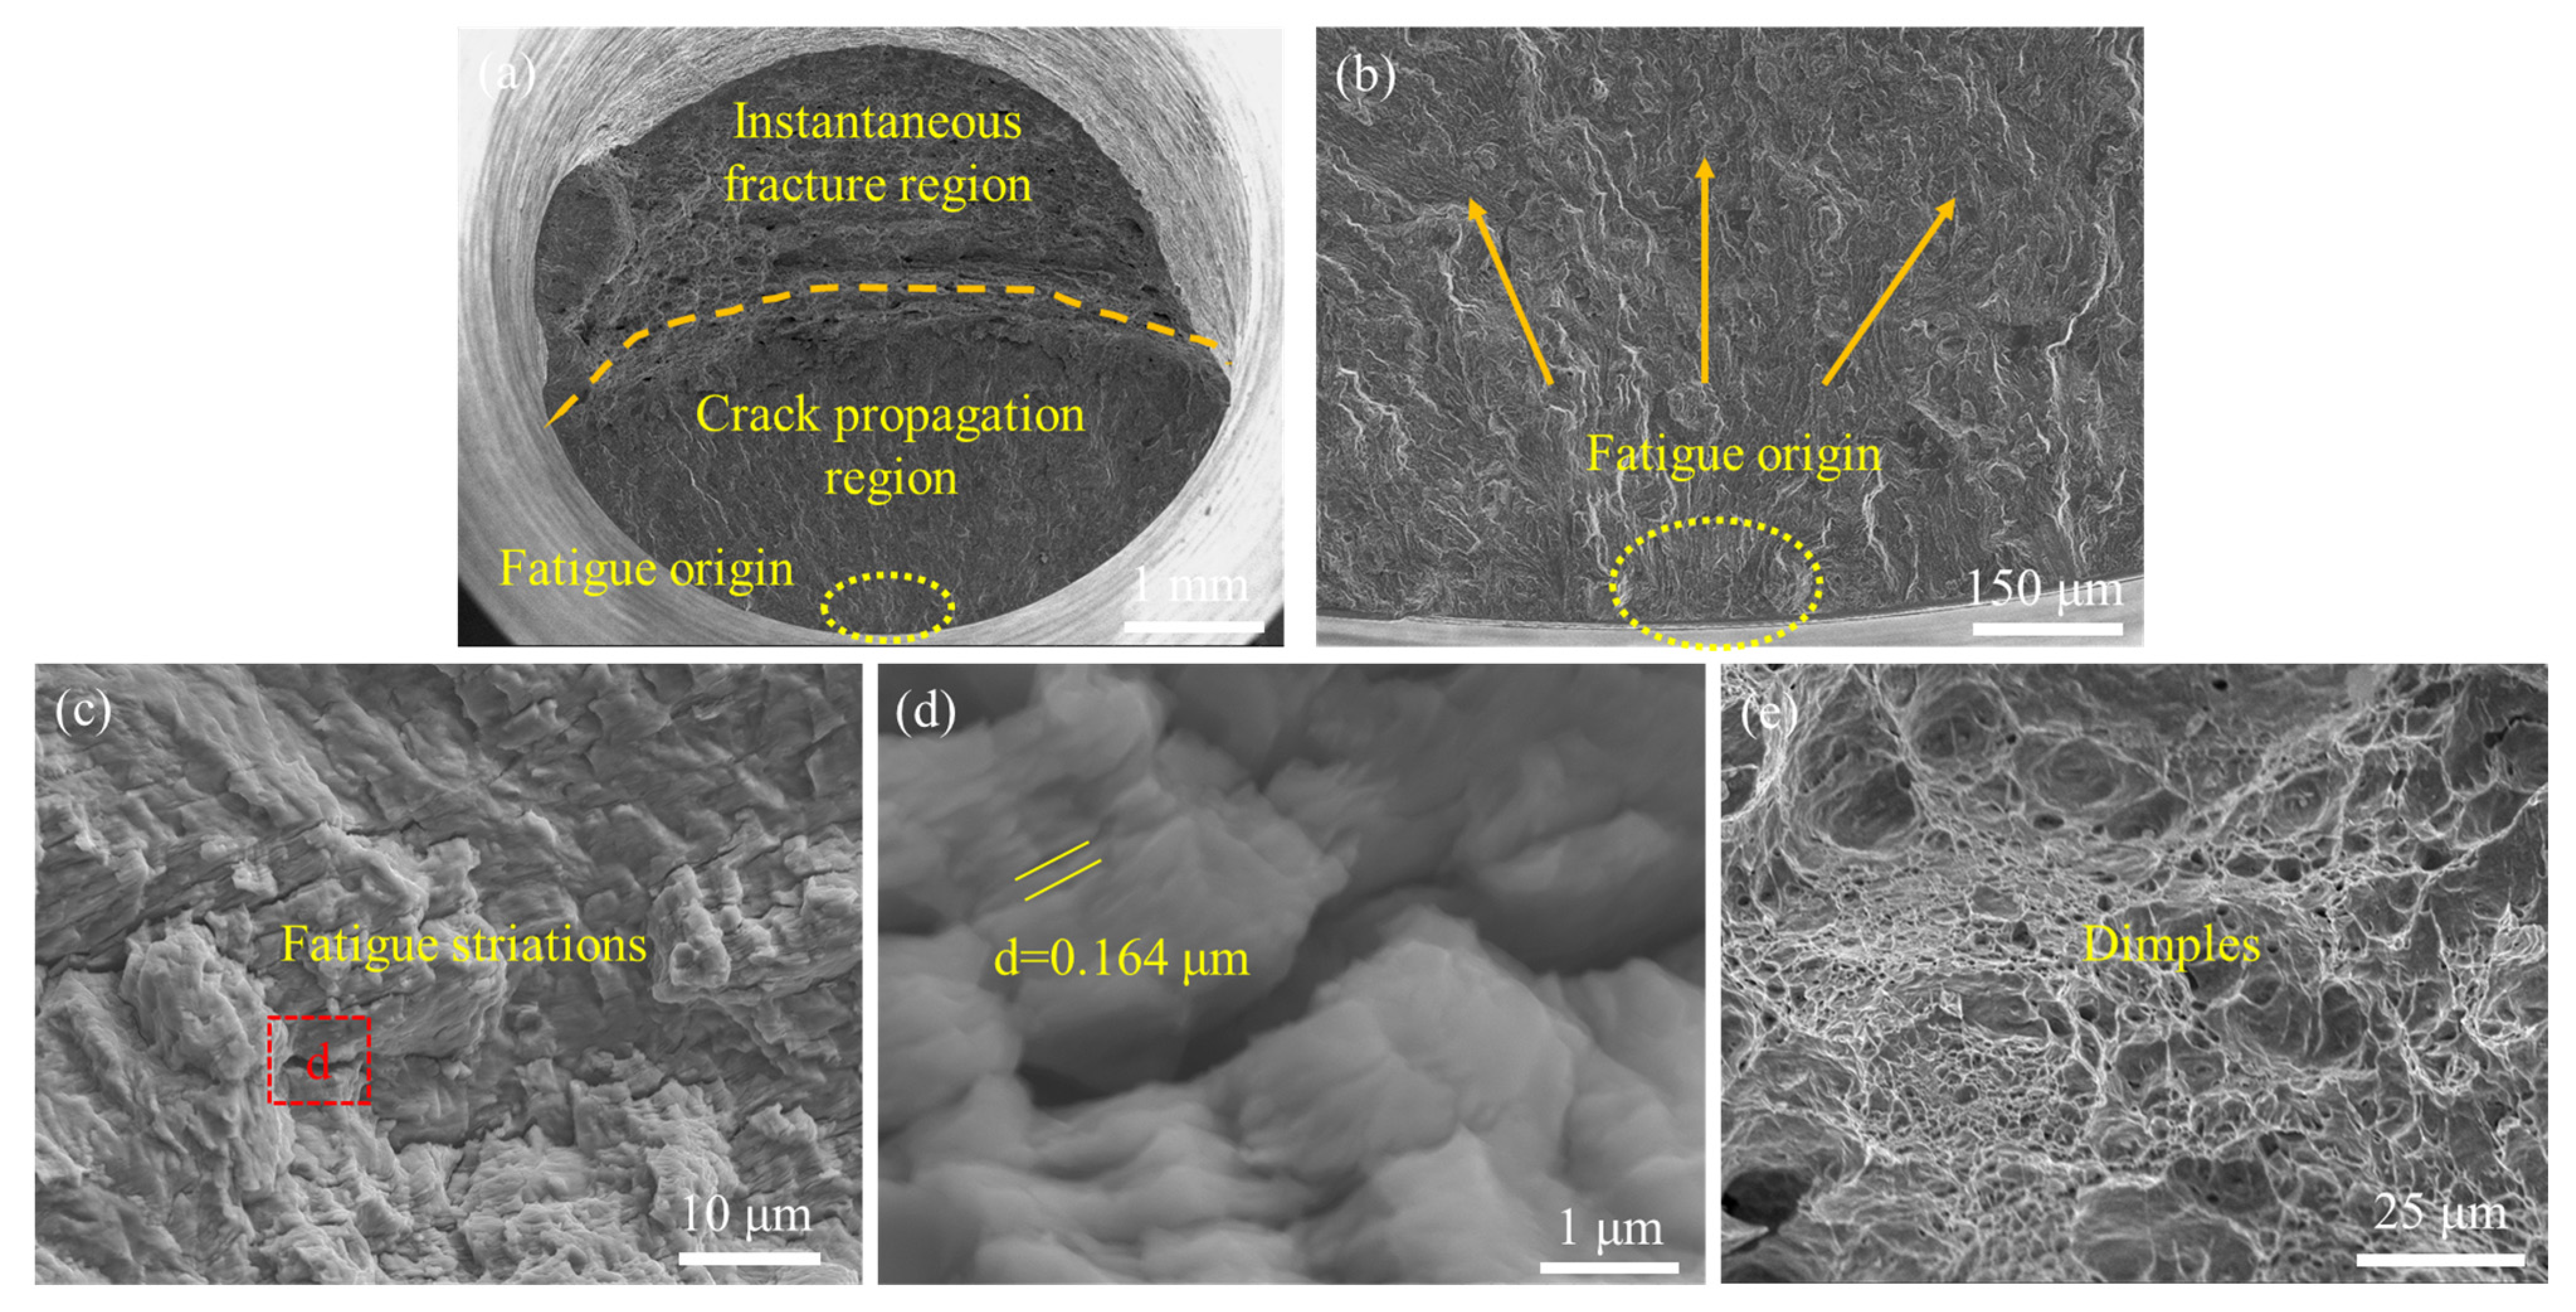
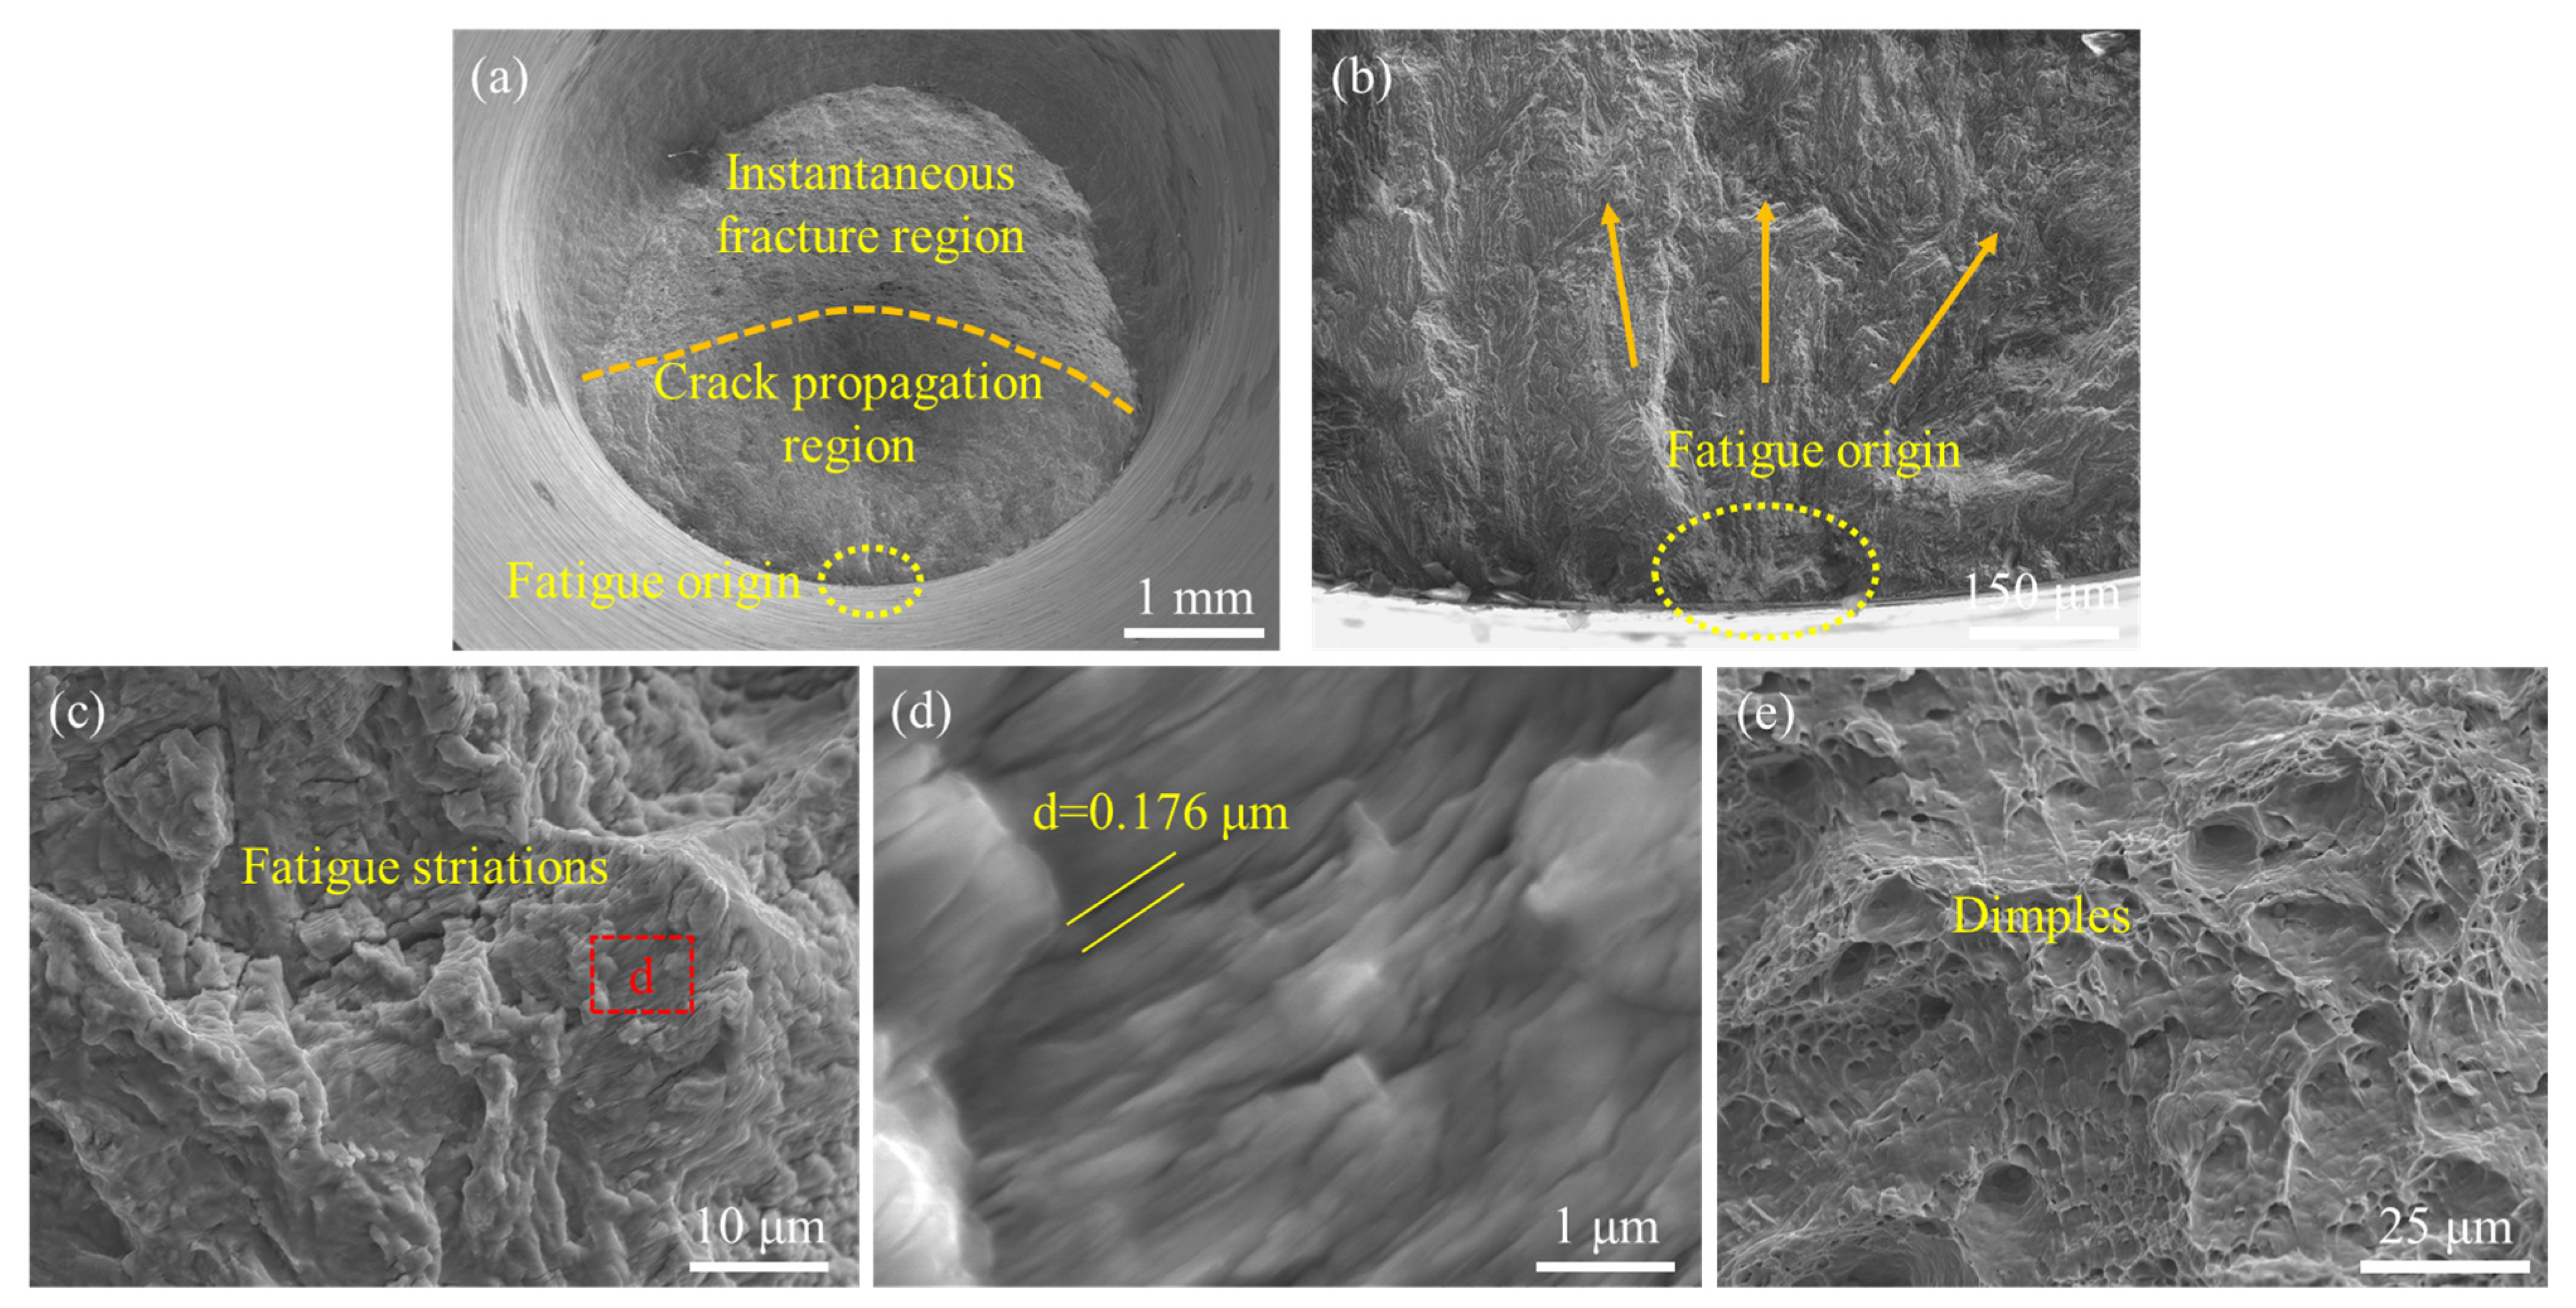
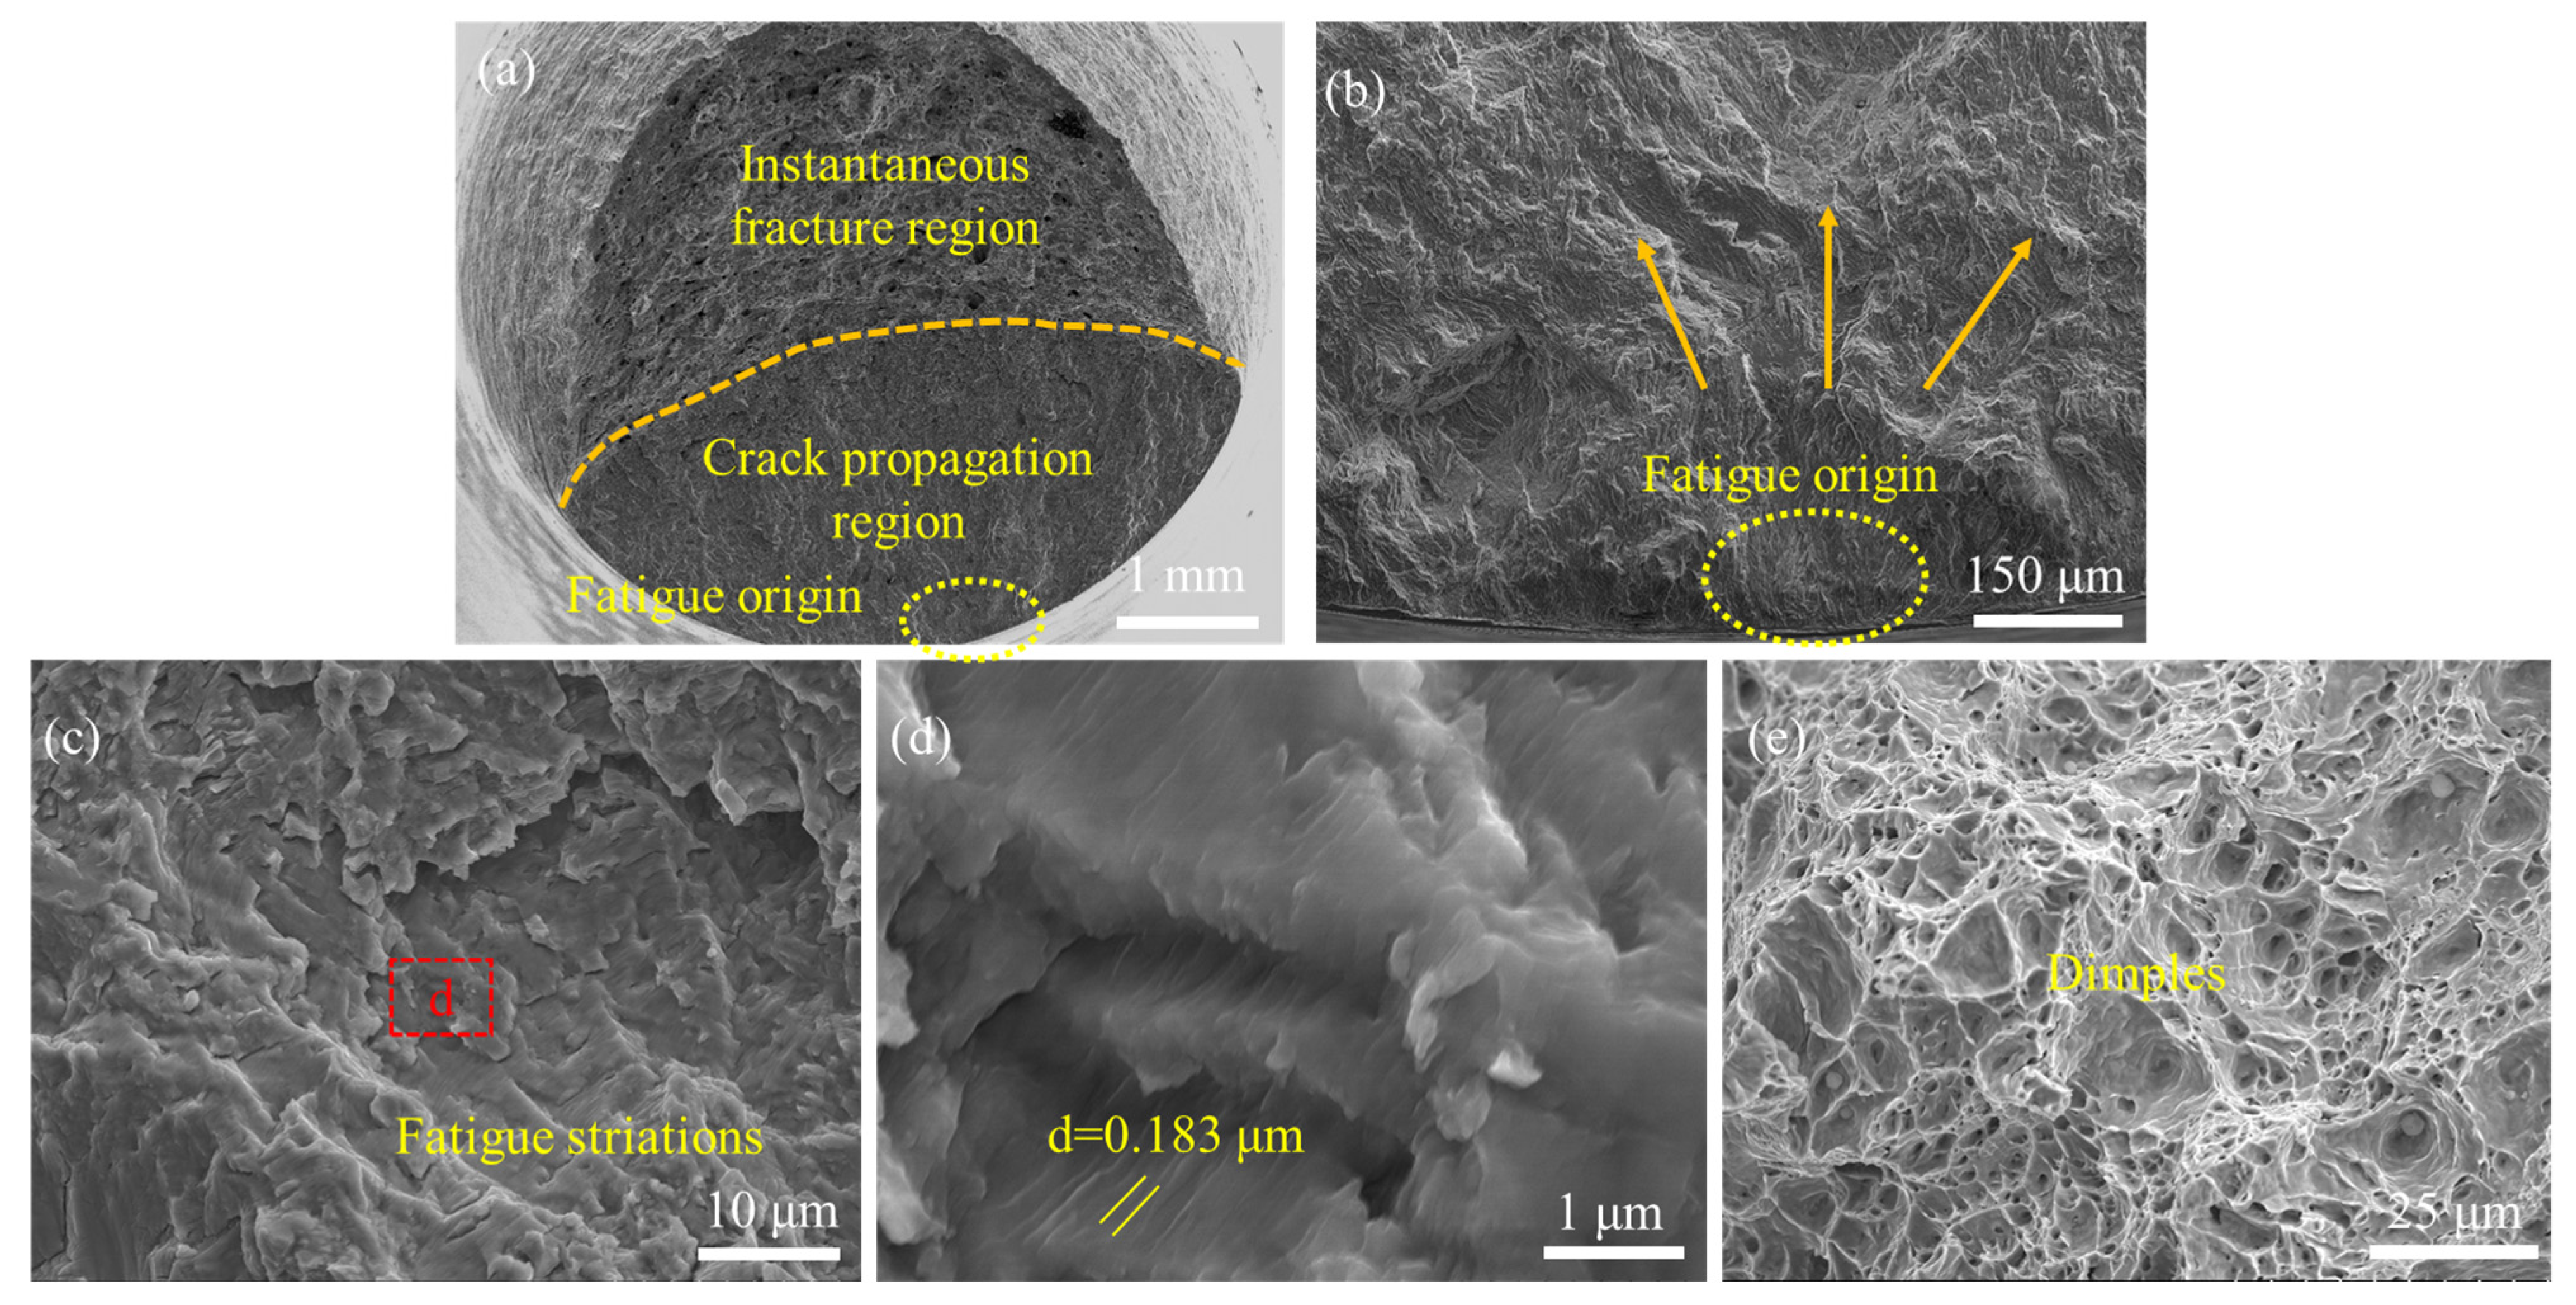
SEM examination of the fracture surfaces of representative failure specimens (Figure 11, Figure 12, Figure 13 and Figure 14; yellow arrows indicate the local crack growth direction) showed that all four CGHAZ conditions exhibited the same three-stage damage progression: surface crack nucleation, stable subcritical propagation delineated by well-resolved fatigue striations, and final overload fracture featuring equiaxed dimples of variable size. Propagation proceeded predominantly perpendicular to the cyclic stress axis.
Fatigue life breaks down into two contributions—the life spent initiating a crack and the life spent propagating it. Examination of the stable crack growth regions revealed a systematic increase in mean fatigue striation spacing with heat input: from 0.142 μm at 15 kJ/cm to 0.183 um at 45 kJ/cm, representing a widening of 28.9%. Because each striation corresponds to crack advance during a single load cycle [24,25], this trend directly reflects accelerated crack growth kinetics at higher heat inputs, consistent with the reduced HAGB density available to deflect or temporarily arrest the advancing crack front.
Quantitative life partitioning revealed that crack propagation consumed between 17,324 and 27,541 cycles—equivalent to only 0.64–15.52% of the total failure life—across the four conditions. Accordingly, crack initiation life constituted more than 84% of total fatigue life in every case, establishing nucleation as the dominant fatigue damage mechanism. This dominance of the initiation stage is consistent with findings reported in the literature for comparable welded steel microstructures [26,27].

4. Discussion

4.1. Microstructure Evolutionary

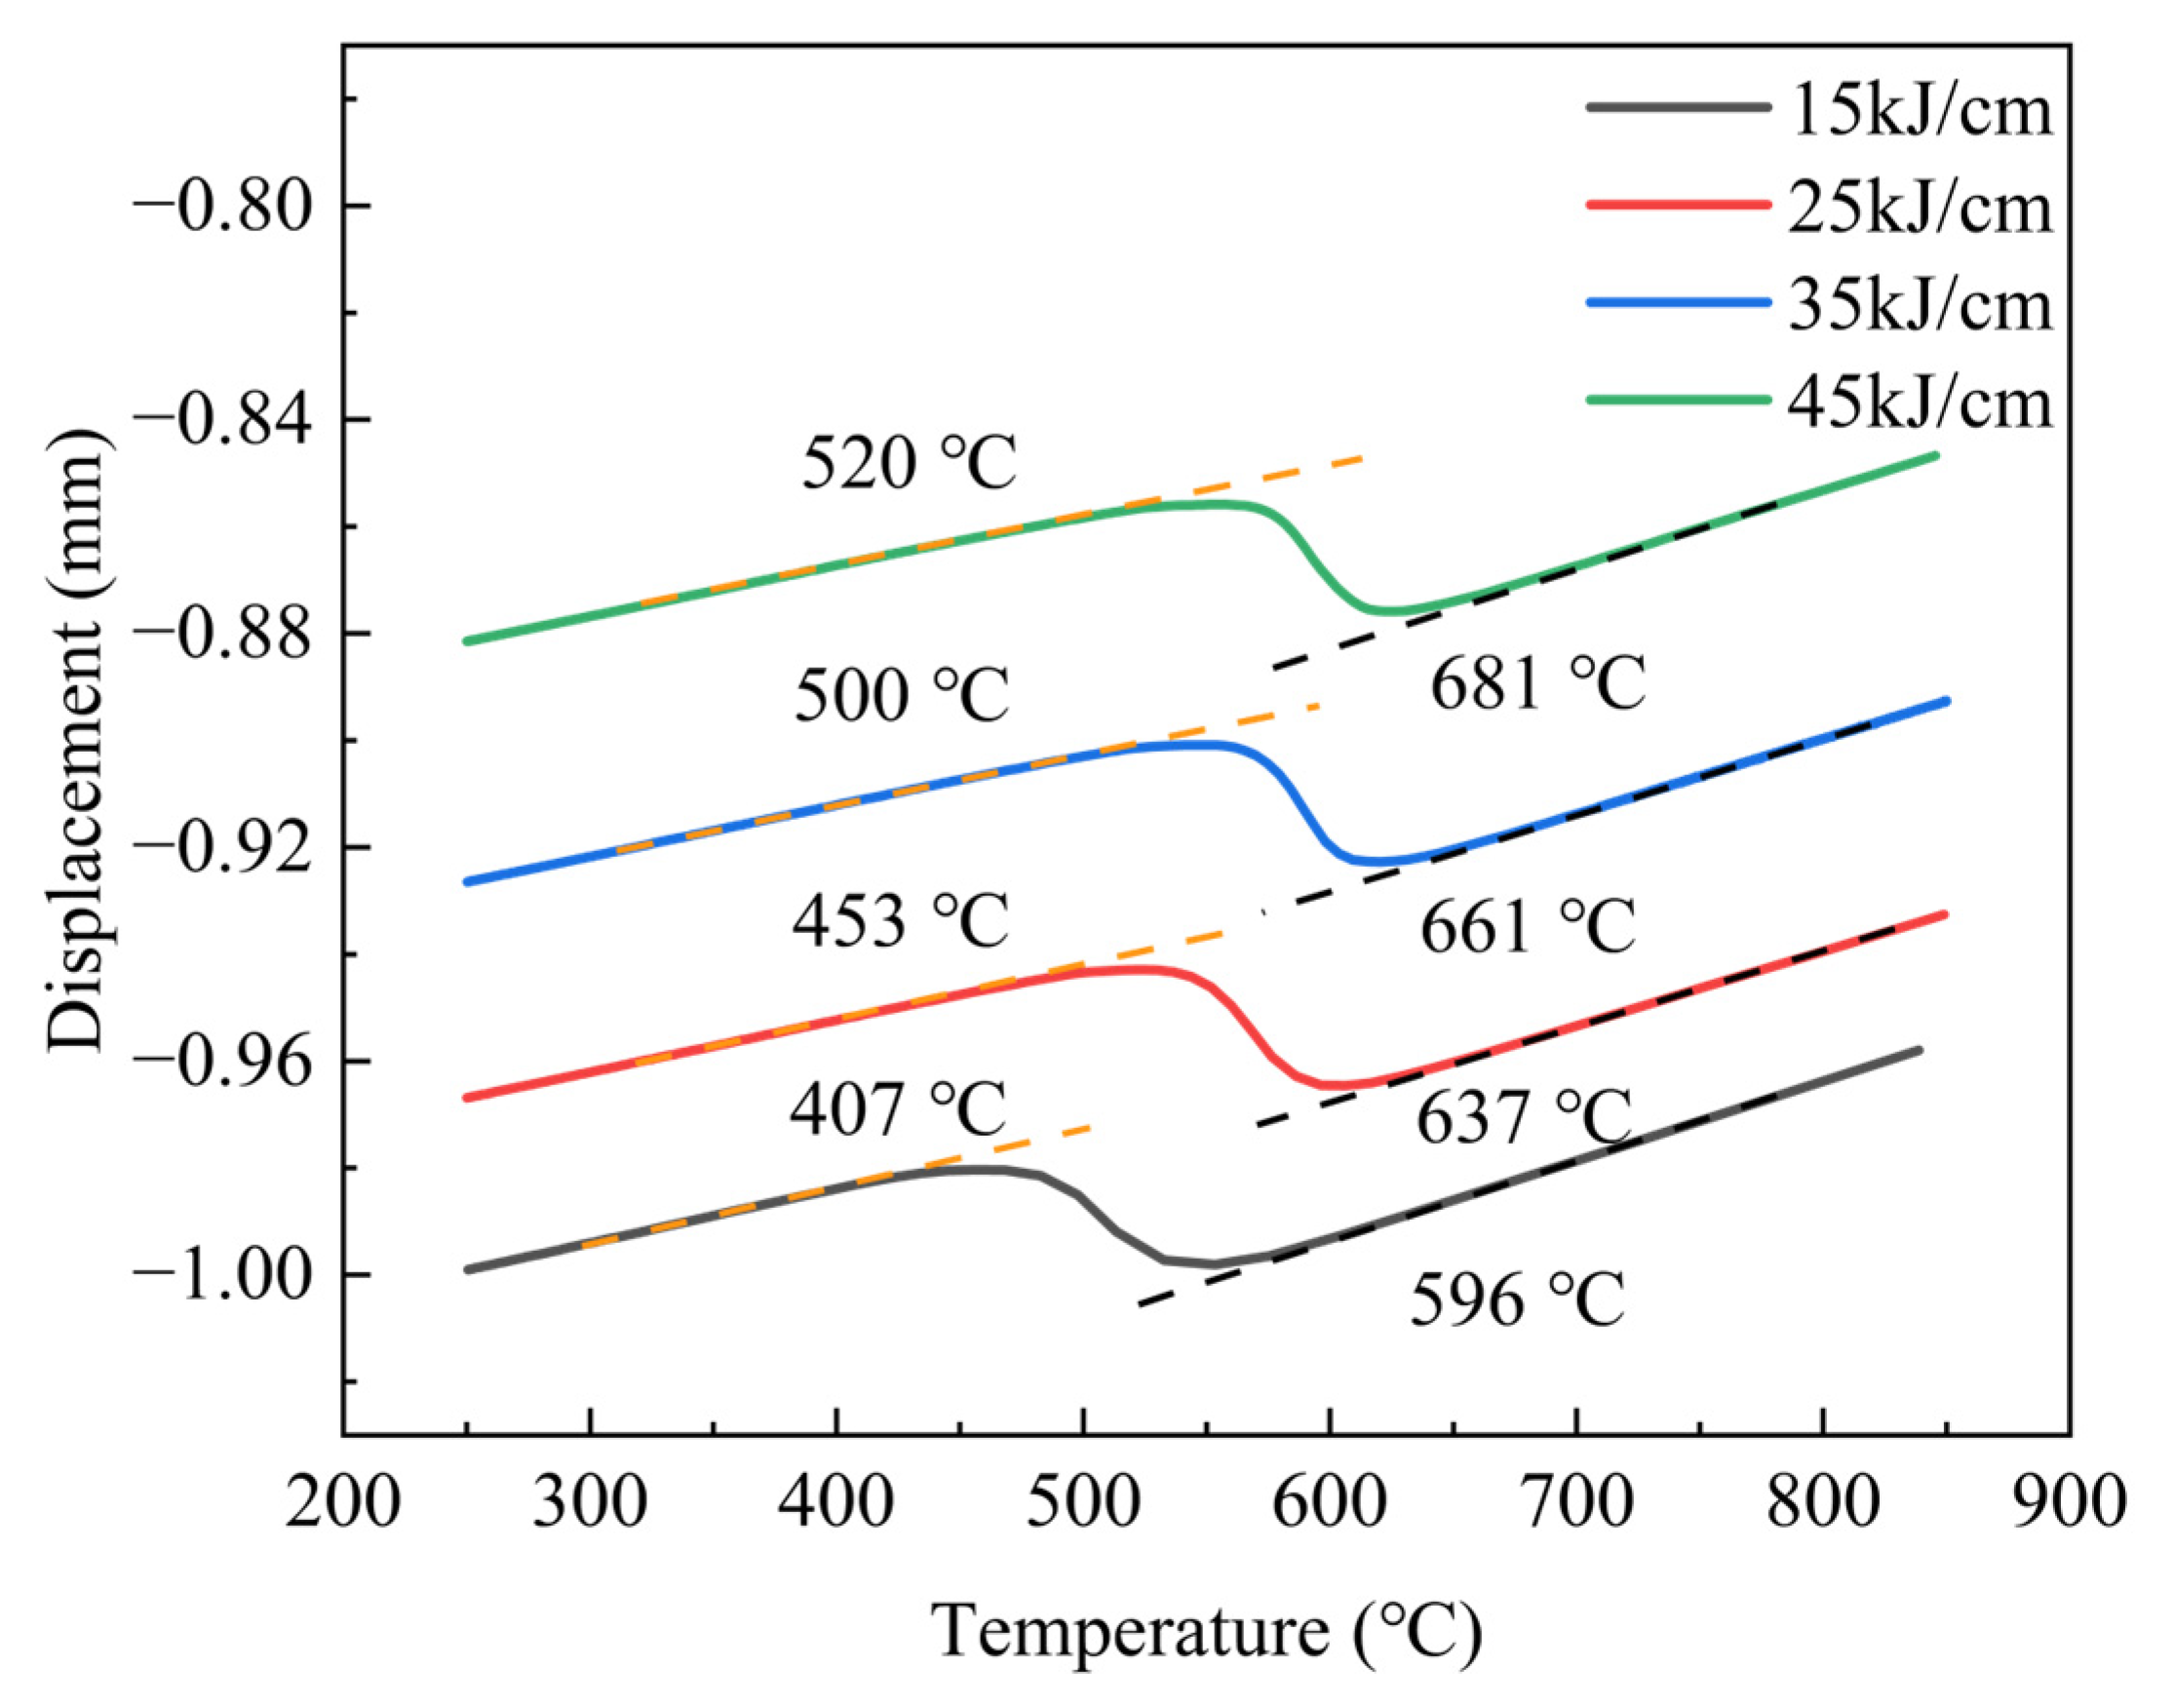
Figure 15 presents the dilatometric curve of the CGHAZ measured on the Gleeble 3800-GTC system during the thermal simulation, with the green and blue dotted lines denoting the tangents to the corresponding curve segments. With increasing heat input, the onset temperature (Ar3) of the γ→α phase transformation in the simulated CGHAZ rose from 596 °C to 681 °C, while the finish temperature (Ar1) increased from 407 °C to 520 °C. The Ar3 and Ar1 temperatures were determined from continuous cooling dilatometry curves using the tangent method. The cooling rate significantly decreased with increasing heat input, providing ample time for carbon atom and alloy element diffusion. This promoted the nucleation and growth of α phase and pearlite, thereby elevating the Ar3 and Ar1 temperatures [28]. Consequently, the ferrite structure coarsened significantly with increasing heat input. Simultaneously, the elevated temperatures led to carbon enrichment, resulting in increased M/A and DP content (Figure 3). Additionally, prolonged diffusion at elevated temperatures caused coarsening of precipitation particles, with particle size increasing as heat input rises (Figure 8). As heat input was increased, the cooling rate of the CGHAZ was observed to decrease and the high-temperature holding time was prolonged, leading to coarsening of prior austenite grains (PAGs) (Figure 7) and a consequent reduction in total grain boundary area. This grain coarsening effect directly reduced the density of HAGBs associated with grain boundaries. With increasing heat input, although the GB content increased and the LB content decreased, the reduction in total grain boundary area caused by PAG coarsening remained dominant. Moreover, the decreased LB content diminished the contribution of intragranular lath substructures to LAGBs. Consequently, both LAGB and HAGB densities exhibited a decreasing trend within the CGHAZ. Furthermore, due to the prevalence of intragranular substructures, the LAGB density consistently remained higher than that of HAGBs (Table 2).
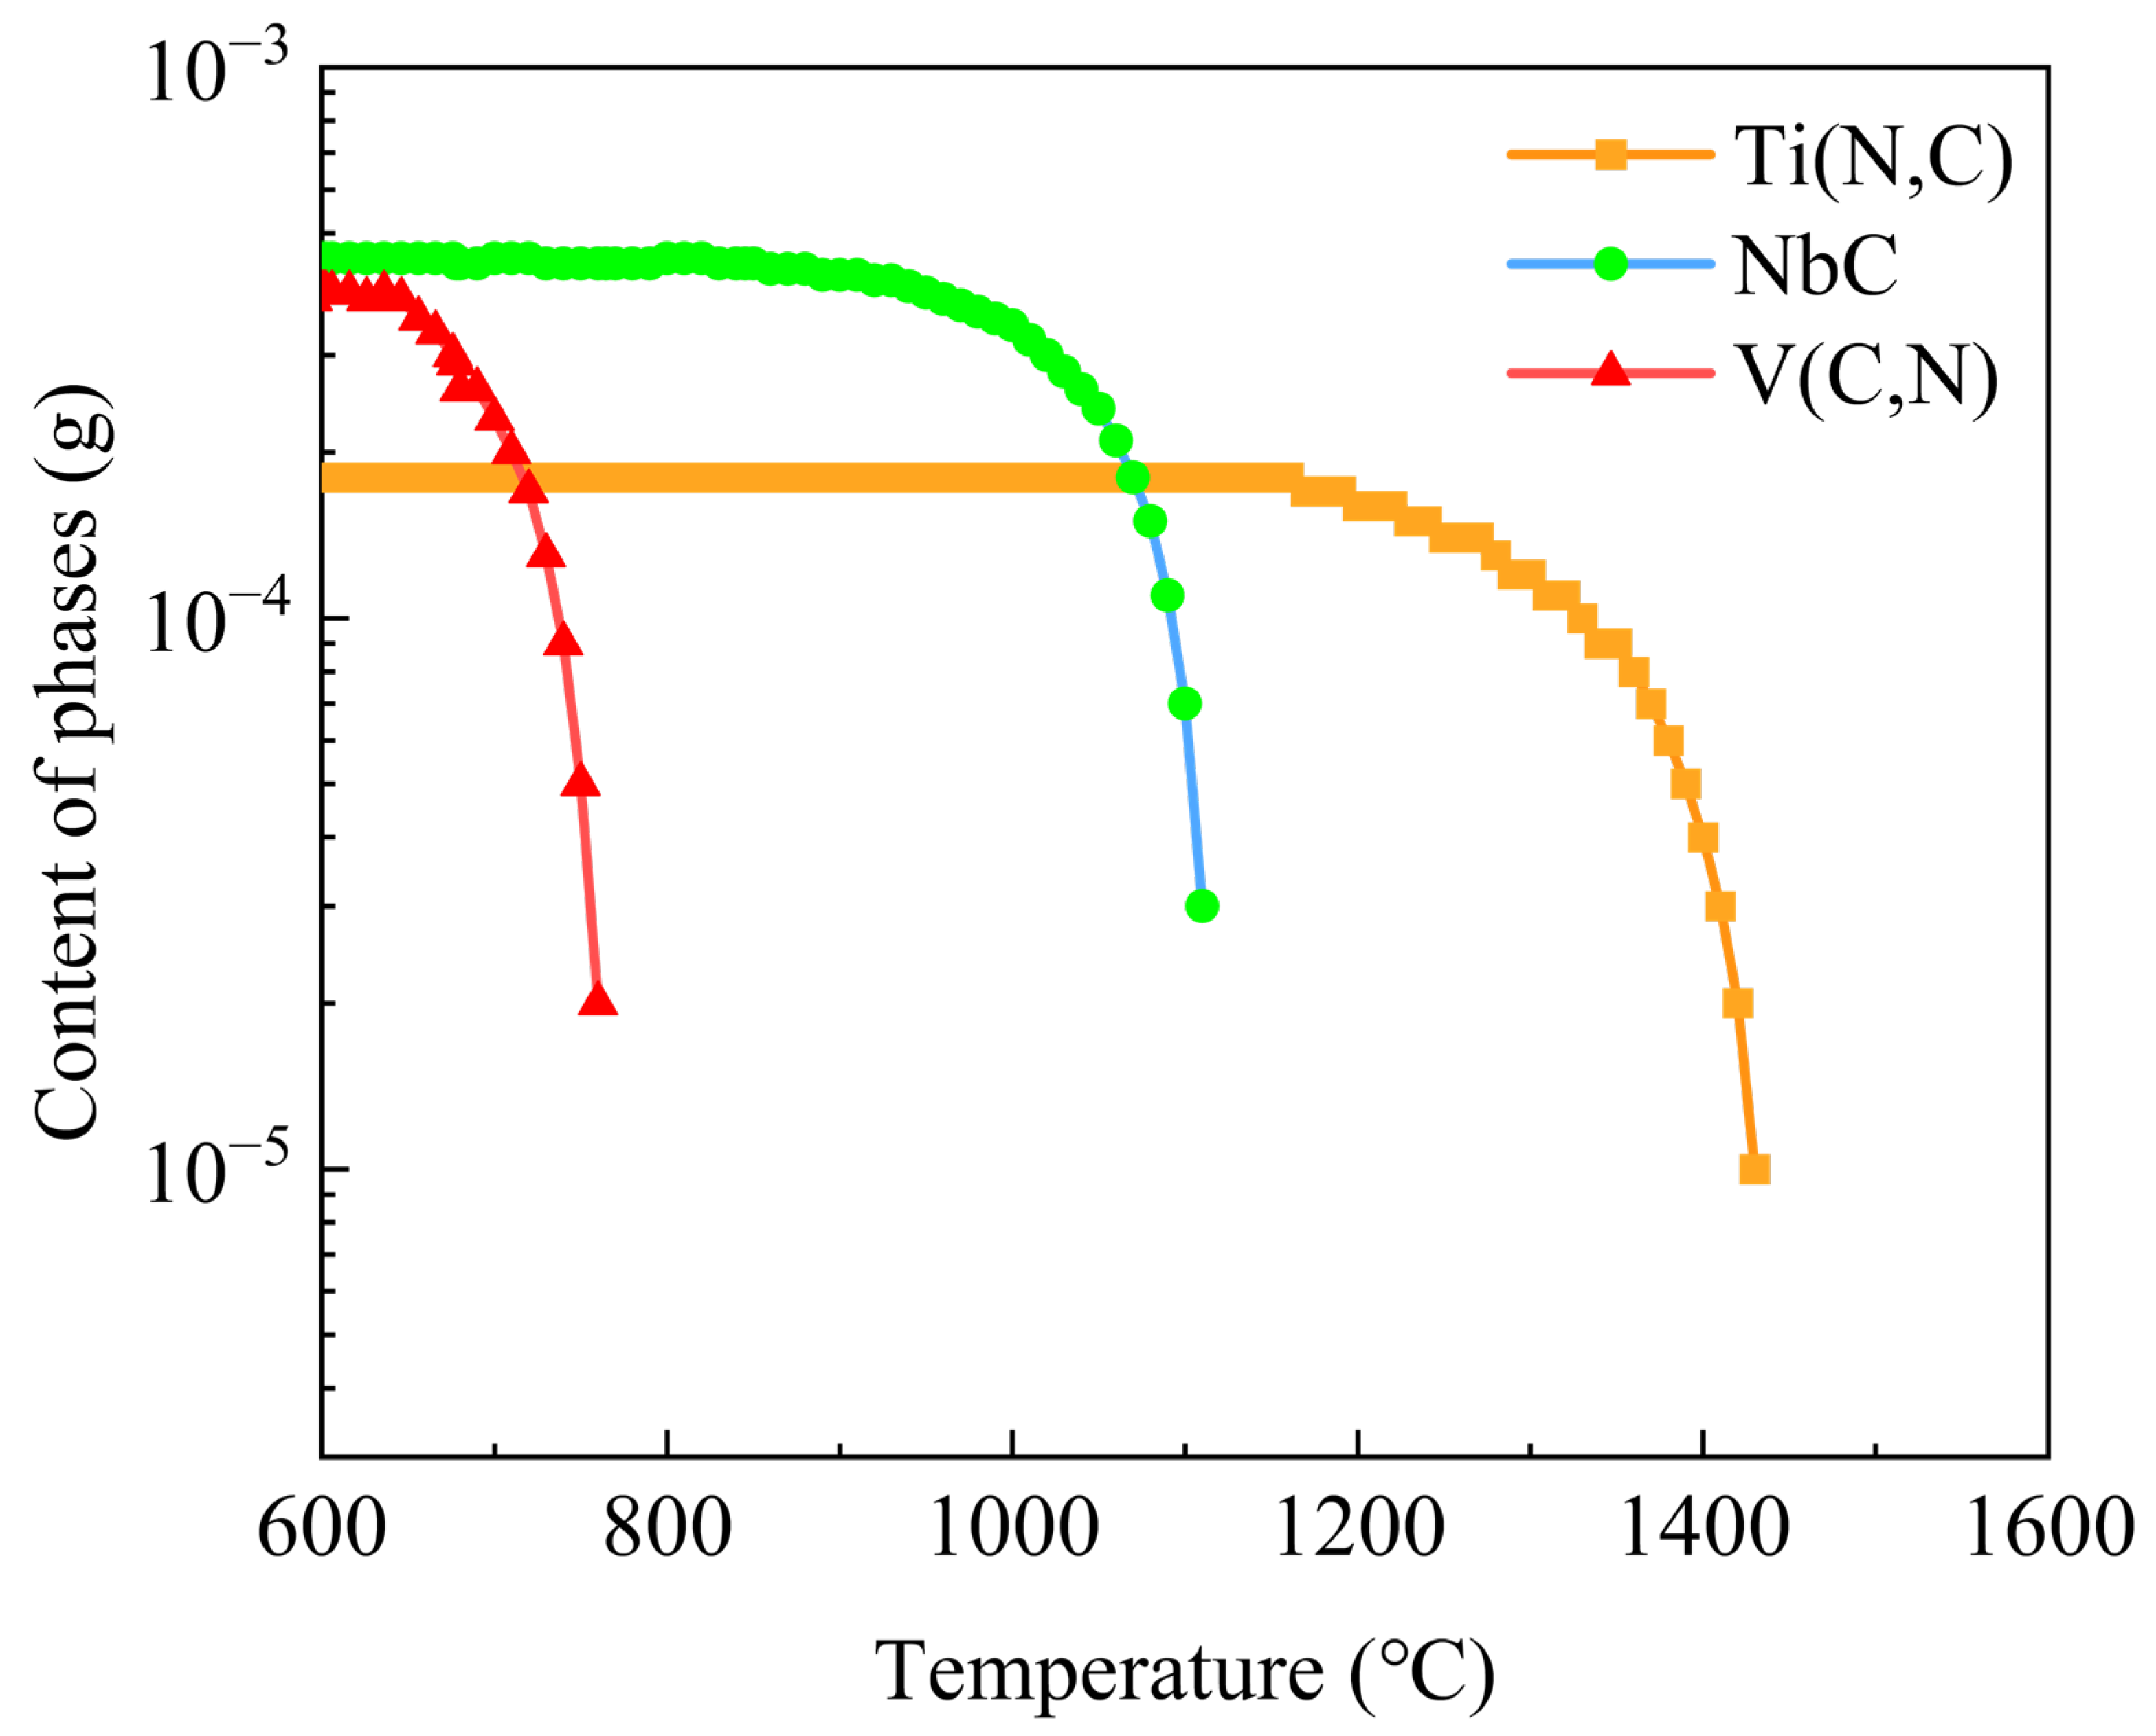
Figure 16 presents the thermodynamic calculation results of precipitated phases obtained using Thermo-CalcTM 4.0 software with the TCFE13 database. The precipitation temperatures of Ti (N,C), V (C,N), and NbC phases were determined to be approximately 1439 °C, 765 °C, and 1110 °C, respectively. During the welding heating process, the NbC and V (C,N) phases completely dissolved into the austenite matrix, whereas the Ti (N,C) phase, owing to its high thermal stability, underwent only partial dissolution. Upon subsequent cooling, the precipitates formed sequentially in the order of Ti (N,C), NbC, and V (C,N). Notably, the partially retained Ti (N,C) particles served as preferential nucleation sites for subsequent precipitation, promoting the epitaxial growth of NbC and V (C,N) phases on their surfaces. This resulted in the formation of complex (Ti,Nb,V) (C,N) precipitates with a core–shell structure [29,30]. With increasing heat input, both the average diameter and volume fraction of the (Ti,Nb,V) (C,N) particles in the CGHAZ increased accordingly.
The presence of precipitated particles in steel exerted resistance to the migration of γ grain boundaries [31,32]. According to the Zener model, these precipitated particles exerted a pinning force on γ grains boundaries [33], thereby restricting their migration capability (Equation (6)).
P z = 3 f v γ γ γ 2 r
where P z represents the pinning force exerted by precipitated particles on the γ grain boundaries, f v denotes the volume fraction of the particles, γ γ γ stands for the interfacial energy between two adjacent γ grains, and r signifies the radius of the particles. As the heat input increased, the residence time at high temperatures was prolonged. Consequently, the precipitated particles coarsened, and their average size increased. Meanwhile, some precipitates dissolved back into the matrix, which led to a decrease in the particle number density. These changes collectively resulted in a weakening of the pinning force exerted by the precipitated particles on the γ grain boundaries. The diminished pinning effect reduced the resistance to grain boundary migration, which in turn led to an increase in the average size of the PAGs and a corresponding increase in the MED within the CGHAZ (Figure 6 and Figure 7).

4.2. Fatigue Damage Mechanism

To elucidate the fatigue fracture mechanism in the CGHAZs under varying heat inputs, it was essential to analyze the initiation and propagation of fatigue cracks. The results presented above indicated that the crack initiation behavior played a dominant role in the fatigue fracture process. The primary factor contributing to the initiation of fatigue cracks was the presence of local strain concentrations within the alloy materials [34], which were the result of irreversible plastic deformation [35]. It has been demonstrated that grain boundaries impede dislocation motion in polycrystalline materials [35,36]. During cyclic deformation, HAGBs hindered dislocation movement, leading to the accumulation of dislocation pile-ups and the formation of stress concentrations at these boundaries, which induced the initiation of fatigue cracks [37,38]. However, dislocations possessed the capacity to migrate through LAGBs into adjacent grains [39], making LAGB cracking a formidable challenge. The increased heat input reduced the density of both LAGBs and HAGBs in the CGHAZs. Consequently, this effect diminished the resistance to fatigue crack initiation.
The difference in grain size leads to changes in the number of dislocations piled up per unit length ahead of grain boundaries [40]. According to Taylor theory and the Orowan formula, the relationship between shear stress (τ) and dislocation density (ρ) during plastic deformation can be expressed as follows [41]:
τ = τ 0 + K G b ρ
where τ0 represents the initial shear stress required to initiate dislocation motion in the absence of other dislocations, K is an empirical constant, and G is the shear modulus, while b is the Burgers vector. During plastic deformation, assuming the shear stress acting on each grain follows Schmid’s law—which describes the relationship between grain crystallographic orientation and stress—the relationship among these variables can be expressed as
τ = Ω σ
where Ω represents the Schmid factor, and σ denotes the applied normal flow stress on both ends of the specimen, which is comparable to the material’s yield strength. According to the derivation by Zhang et al. [40], the relationship among the number of dislocation pile-ups per unit length (n), the parameter ρ, and Ω is given by the following equation:
n = ρ = Ω σ − σ 0 K G b
where σ0 is the dislocation glide threshold stress, reflecting the resistance to deformation within the crystal. According to the Hall–Petch relationship, the following relation exists between the grain size (d) and yield stress:
σ − σ 0 = k d − 1 / 2
where k is a constant that characterizes the degree of influence of grain boundaries on strength. In this study, d is the MED determined from EBSD data, as reported in [17,18]. Based on Equations (9) and (10), the relationship between the number of dislocation pile-ups and grain size satisfies
n = k Ω K G b d
As shown in Equation (11), the number of dislocation pile-ups at grain boundaries continuously increases with the grain size of polycrystalline materials. When the number of dislocation pile-ups reaches a critical value (nc), localized cracking occurs at the grain boundaries [40], leading to fatigue cracks [42]. An increase in heat input results in an increased MED of the CGHAZ (Table 2), thereby increasing the number of dislocation pile-ups. This finding suggested that the propensity for fatigue cracking may increase. Therefore, higher heat input produced a combined effect in CGHAZ specimens, manifesting as a decrease in LAGB alongside an increase in MED. This effect served to weaken the inhibitory effect on fatigue crack initiation.
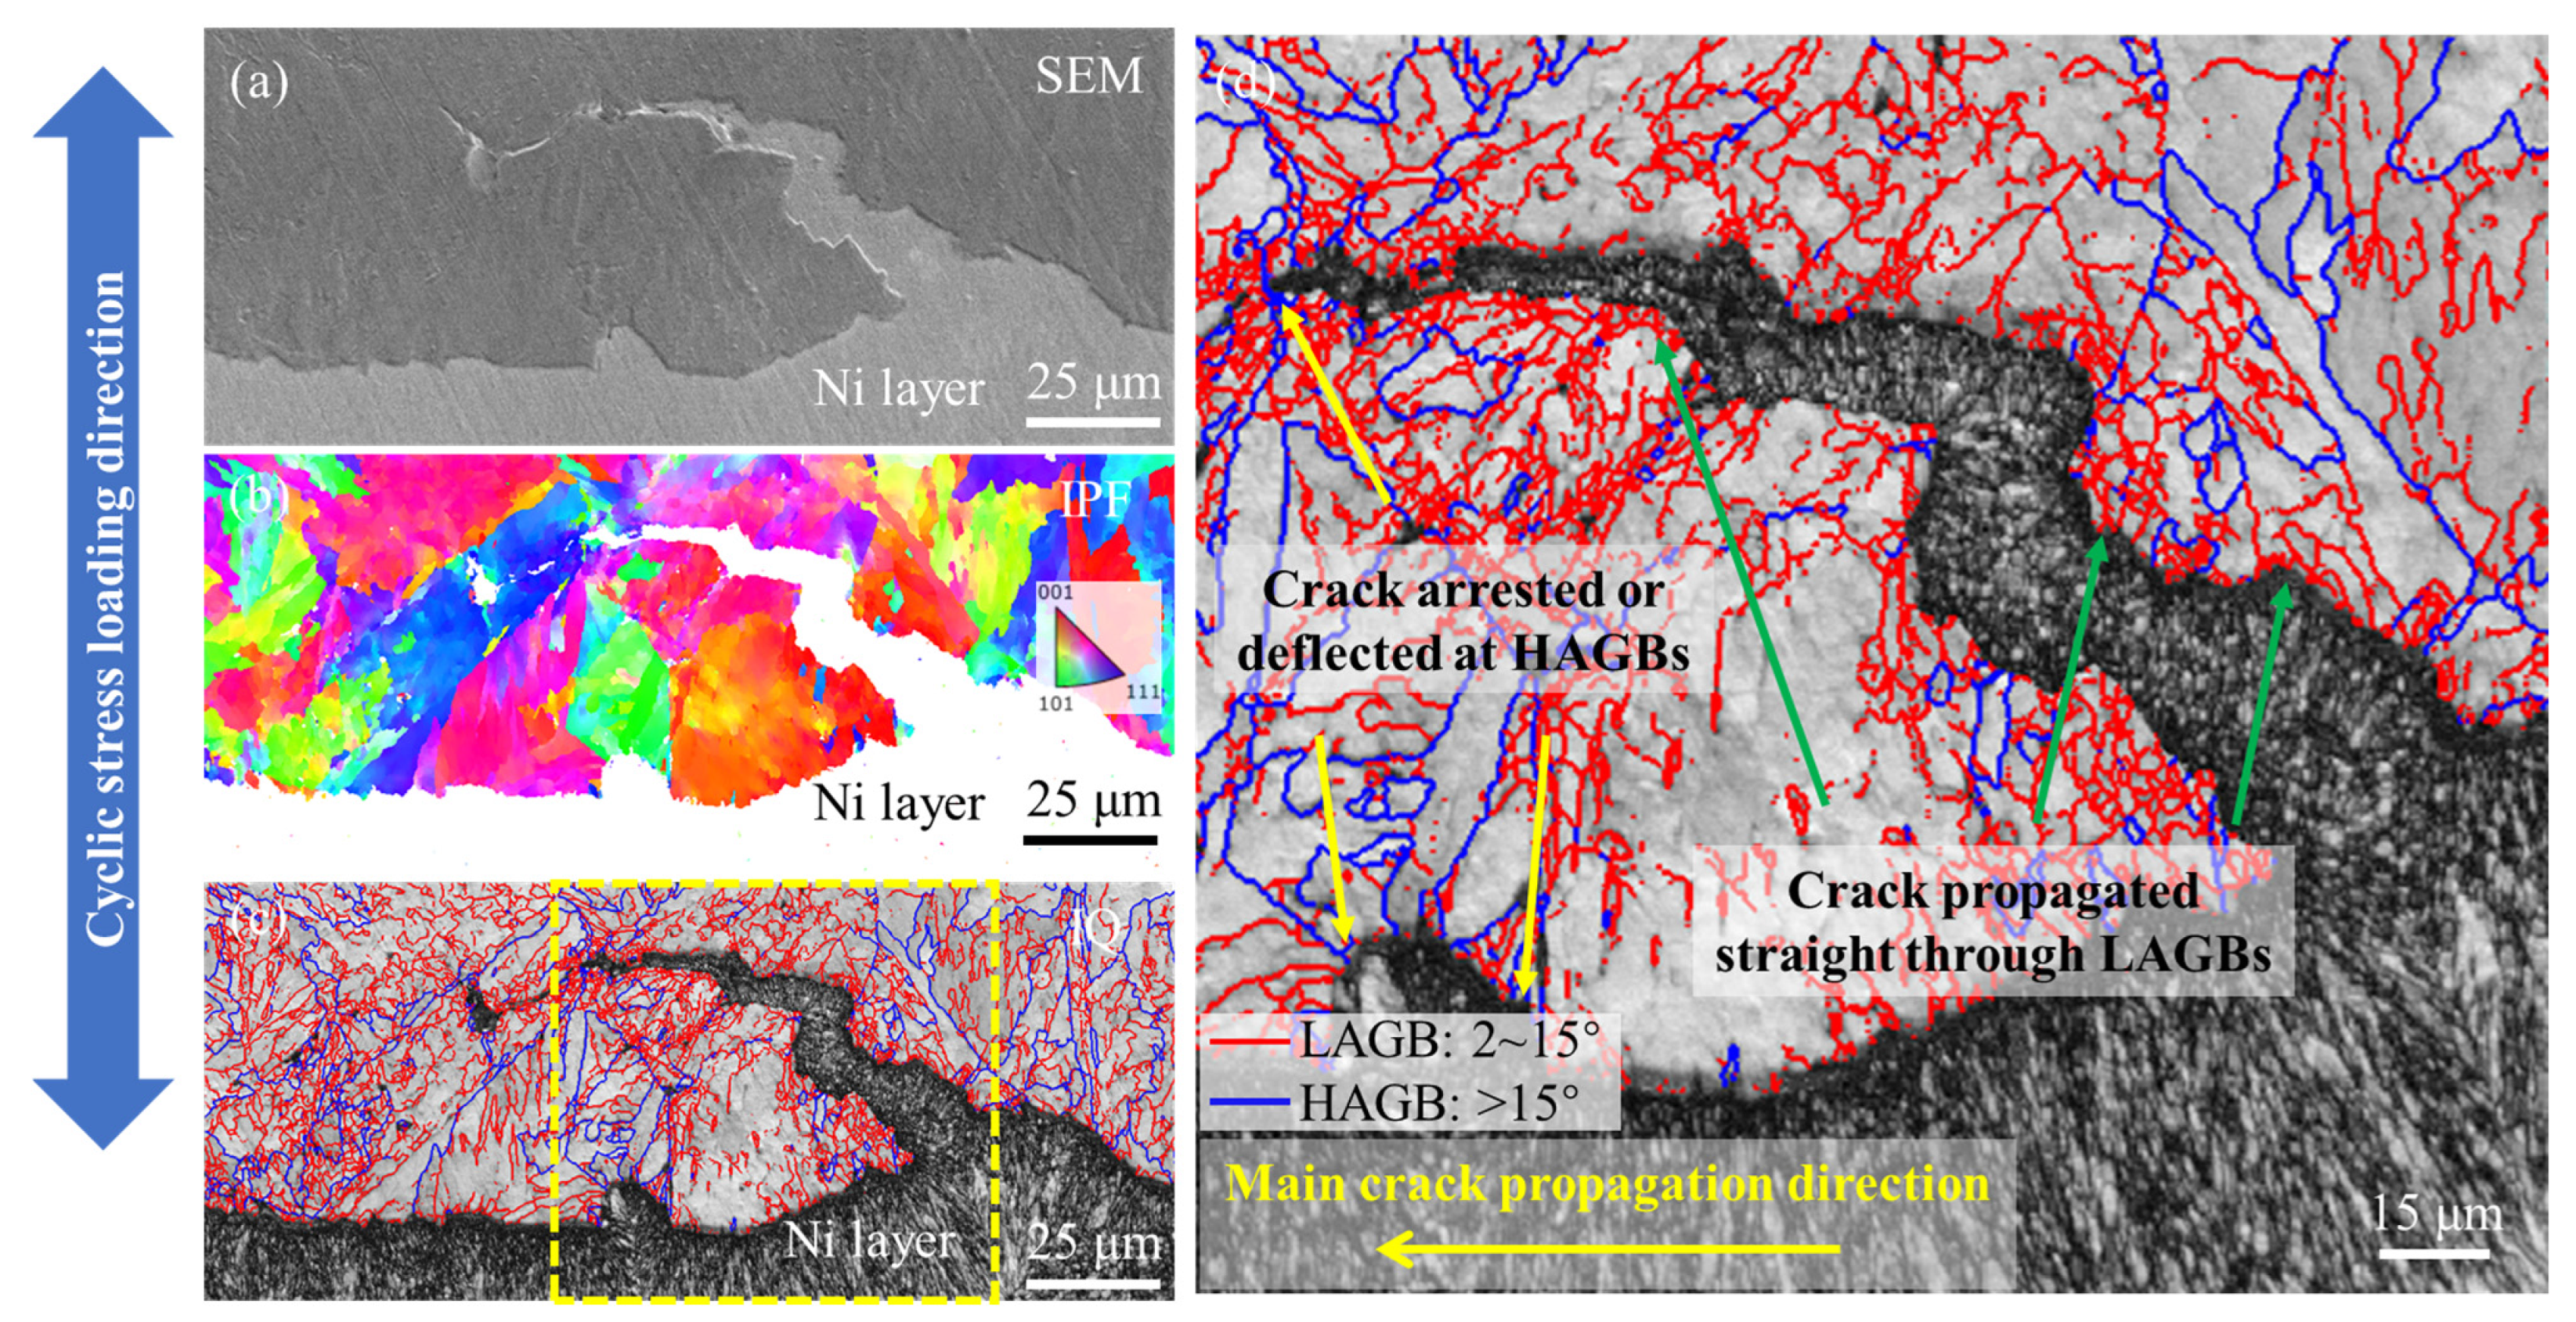
Following the nucleation of fatigue microcracks on the surface of CGHAZ specimens, the fatigue cracks propagated into the interior of the specimens under cyclic stress loading. Figure 17 characterizes the propagation paths of these fatigue microcracks within the CGHAZ. Prior to EBSD analysis, the fatigue fracture surface was protected by a nickel coating. The primary fatigue crack propagated predominantly perpendicular to the cyclic loading direction, with local deflections caused by the obstructive effect of high-angle grain boundaries (HAGBs). Secondary microcracks initiated from the main crack; these generally propagated directly through low-angle grain boundaries (LAGBs) but were deflected or arrested when encountering HAGBs. The results indicated that HAGBs effectively impede fatigue crack propagation, whereas LAGBs lack this capability. This phenomenon can be attributed to the significant disparity in crystallographic orientation across HAGBs, which necessitated a considerable expenditure of energy to alter the crack path and accommodate a new crystallographic plane [19,32]. Furthermore, although HAGBs have an adverse effect during the crack initiation stage by hindering dislocation motion (i.e., detrimental to crack initiation resistance), they ultimately inhibit crack propagation to a certain extent. In contrast, LAGBs exhibit the opposite behavior. Consequently, an increase in heat input leads to a reduction in HAGB density within the simulated CGHAZ (Table 2), thereby weakening the inhibitory effect on fatigue crack propagation and shortening the fatigue crack propagation life.
In summary, the study indicated that an increase in heat input promoted both the initiation and propagation of fatigue cracks, thereby exerting a negative influence by reducing both the crack initiation lifetime and propagation lifetime. However, it was imperative to recognize that crack initiation lifetimes accounted for over 84% of the total failure lifetimes. Compared to the propagation lifetime, the increase in heat input exerted a more significant negative impact on the reduction of crack initiation lifetime. It was determined that fatigue crack initiation was the predominant factor leading to fatigue failure fractures. Finally, as the heat input increases, the fatigue strength of the simulated CGHAZ decreased continuously from 246.9 MPa to 208.5 MPa.

5. Conclusions

The present study investigated the effects of heat input on the microstructure and high-cycle fatigue properties of the simulated CGHAZs in wind power steel using the Gleeble 3800-GTC system. The characteristics and damage mechanisms of fatigue fractures were thoroughly elucidated. The key conclusions are summarized as follows.
(1)
Heat input governed the phase balance of the simulated CGHAZ: GBF, M/A, and DP fractions rose progressively while LBF declined, so that at 45 kJ/cm the microstructure was entirely granular. Concurrently, grain boundary densities of both LAGBs and HAGBs decreased, the MED enlarged, and prior austenite grains coarsened. These changes originate from the slower cooling rates and prolonged high-temperature exposure at elevated heat inputs, which weaken (Ti, Nb, V) (C, N) Zener pinning and permit uninhibited austenite grain boundary migration.
(2)
All static mechanical indices—yield strength, tensile strength, and Vickers hardness—decreased monotonically over the 15-to-45 kJ/cm range (from 555 to 481 MPa, 720 to 608 MPa, and 250.9 to 207.2 HV0.5, respectively), while uniform elongation increased modestly from 7.9% to 10.1%. The CGHAZ fatigue limit at 2 × 10⁶ cycles fell correspondingly from 246.9 MPa to 208.5 MPa, a 15.6% reduction, confirming that elevated heat input degrades both static and cyclic performance.
(3)
Fatigue crack initiation was identified as the life-controlling damage mechanism, accounting for more than 84% of total failure life across all conditions. Higher heat input reduced LAGB density and increased grain size, collectively diminishing the microstructure’s resistance to crack nucleation: a sparser grain boundary network provided fewer obstacles to dislocation accumulation, and larger grains promoted greater dislocation pile-up numbers, hastening attainment of the critical value required for boundary microcracking.
(4)
EBSD crack path mapping demonstrated that HAGBs effectively deflected and retarded advancing fatigue cracks by forcing changes in the crystallographic crack plane, whereas LAGBs provided negligible impedance. The loss of HAGB density with increasing heat input therefore directly weakened crack-propagation resistance, producing wider fatigue striations (0.142 to 0.183 μm) and shorter propagation lives.
(5)
For wind power steel applications, increasing welding heat input exerts a dual detrimental influence on CGHAZ fatigue performance: it simultaneously lowers resistance to crack initiation and accelerates crack propagation. Since initiation life dominates, the degradation of crack-nucleation resistance is the principal concern in practice. Controlling heat input within appropriate limits thus represents an effective fabrication strategy for safeguarding the high-cycle fatigue integrity of welded wind turbine tower structures.

Author Contributions

Conceptualization, G.Z. and Q.W.; Methodology, G.Z. and Y.K.; Formal analysis, G.Z. and L.Z.; Investigation, G.Z., L.Z. and Y.K.; Resources, J.H.; Data curation, G.Z., J.H. and L.Z.; Writing—original draft, G.Z.; Writing—review and editing, Q.W. and Z.L.; Visualization, G.Z.; Supervision, Q.W. and Z.L.; Project administration, G.Z.; Funding acquisition, Q.W. and Z.L. All authors have read and agreed to the published version of the manuscript.

Funding

This work was supported by the Major Scientific and Technological Innovation Project of CITIC Group (Grant Number 2022zxkya06100) and the CITIC Metal—CBMM Collaborative R&D Project for Niobium Technology Advancement (Grant Number M2149-2024).

Data Availability Statement

The original contributions presented in this study are included in the article. Further inquiries can be directed to the corresponding authors.

Conflicts of Interest

Authors Guodong Zhang, Jiangli He and Zhongzhu Liu were employed by the company CITIC Metal Co., Ltd. The remaining authors declare that the research was conducted in the absence of any commercial or financial relationships that could be construed as a potential conflict of interest.

Abbreviations

The following abbreviations are used in this manuscript:
CGHAZCoarse-grained heat-affected zone
LAGBsLow-angle grain boundaries
HAGBsHigh-angle grain boundaries
MEDMean equivalent diameter
PAGsPrior austenite grains
TMCPThermomechanical control process
OMOptical microscope
SEMScanning electron microscope
EBSDElectron backscatter diffraction
TEMTransmission electron microscope
EDSEnergy-dispersive X-ray spectroscopy
LBFLath bainitic ferrite
GBFGranular bainitic ferrite
DPFDegenerated pearlite ferrite
SAEDSelected area electron diffraction
BCCBody-centered cubic
FCCFace-centered cubic
IPFsInverse pole figures
MTAsMisorientation angles
IQImage quality
KAMKernel average misorientation

References

  1. National Energy Administration; Ministry of Industry and Information Technology; SASAC; State Administration for Market Regulation. Guidelines on Promoting High-Quality Development of Energy Equipment. Installation 2025, 1–4. [Google Scholar] [CrossRef]
  2. Zeng, B.; Liu, H.B.; Zhou, D.Z.; Zhang, Y.D.; Cong, Y.L.; Tang, Z.D. Wave fatigue analysis and optimization of all-steel bucket foundation for offshore wind power. Acta Energiae Solaris Sin. 2023, 44, 367–374. [Google Scholar] [CrossRef]
  3. Zhao, L. Global Offshore Wind Market Outlook 2022-2031. Wind Energy 2022, 7, 46–51. [Google Scholar] [CrossRef]
  4. Cao, J.; Ren, W.; Zhang, G.; Yin, S.; Liu, Z.; Sun, X. Effect of Weld Surface Quality on the Fatigue Performance of Q420 Steel Used in Offshore Wind Tower Tube. Metals 2026, 16, 148. [Google Scholar] [CrossRef] [Scilit]
  5. Zhen, C.B.; Liu, S.H.; Zhang, A.F.; Xing, S.J.; Zhang, R.Z. Fatigue Strength Analysis of Ship’s Welded Structures Based on Method of Notch Stress. J. Shanghai Jiao Tong Univ. 2025, 59, 458–465. [Google Scholar] [CrossRef]
  6. Long, H.; Wang, G.; Wang, P.; Ma, J.; Luo, X.; He, H. Study on the Influence of Heat Input on Microstructure and Properties of Q420C Steel Welded Joints. Coatings 2025, 15, 957. [Google Scholar] [CrossRef] [Scilit]
  7. Schubnell, J.; Carl, E.; Widerspan, V.; Collmann, M. Determination of Loading and Residual Stresses on Offshore Jacket Structures by X-ray Diffraction. J. Mar. Sci. Eng. 2023, 11, 1304. [Google Scholar] [CrossRef] [Scilit]
  8. Wang, Z.Y. Metal supervision and inspection of wind turbine tower foundation ring. J. Anhui Electr. Eng. Prof. Tech. Coll. 2016, 21, 83–85. [Google Scholar] [CrossRef]
  9. Yuan, X.D.; Yang, F.Q.; Liu, Z.J.; Zhang, Y.B. Effect of heat input on microstructure and mechanical properties of Q355D medium plate welded joints. Electr. Weld. Mach. 2026, 56, 59–66. [Google Scholar] [CrossRef]
  10. Zeng, D.P.; Zheng, S.X.; An, T.B.; Zuo, Y.; Ma, C.Y. Effect of Heat Input on Microstructure and Properties of Q440qENH Weathering Steel SAW Joints. Chin. J. Mech. Eng. 2025, 61, 147–155. [Google Scholar] [CrossRef] [Scilit]
  11. Xie, S.; Xu, C.; Wang, X.; Feng, X.; Xiao, K.; Liu, P. Effect of Welding Heat Input on Microstructure and Properties of Coarse Grain Zone in Heat Affected Zone of Ultra-Low Carbon Bainitic Steel. Mat. Res. 2022, 25, e20210180. [Google Scholar] [CrossRef] [Scilit]
  12. Pang, X.F. Study on Microstructure and Properties of Q460 Steel Gas Shielded Welded Joints for UHV Transmission Towers. Hot Work. Technol. 2016, 45, 240–243. [Google Scholar] [CrossRef]
  13. Wu, J.; Luo, W.; Nie, F.; Zhang, D.; Xiao, Y.; Zhang, Y.; Hu, B.; Wang, Q. Welding heat input effect on microstructure and toughness of coarse-grained heat-affected zone in V-Ti-N-Nb microalloyed weathering steel. Mater. Today Commun. 2026, 51, 114867. [Google Scholar] [CrossRef] [Scilit]
  14. Xu, K.; Wu, K.M.; Wang, H.H.; Li, L.; Qin, Z.P.; Wu, N.C. Effect of heat input on microstructure and mechanical properties of welded heat affected zone in Q420FRE steel. J. Wuhan Univ. Sci. Technol. 2015, 38, 254–258. [Google Scholar] [CrossRef]
  15. Fu, Y.; Feng, F.; Li, J.; Zeng, Z.; Zhang, D.; Ma, D.; Wu, B. Determination of SH-CCT curve and study on microstructure and properties of heat-affected zone of Q420qENH steel base metal in composite steel plate welding. Ind. Constr. 2025, 55, 1–7. [Google Scholar] [CrossRef] [Scilit]
  16. GB/T 24176-2009; Metallic Materials—Fatigue Testing—Statistical Planning and Analysis of Data. Standardization Administration of China: Beijing, China, 2009.
  17. Zhao, L.Y.; Wang, Q.F.; Shi, G.H.; Yang, X.Y.; Qiao, M.L.; Wu, J.P.; Zhang, F.C. In-depth understanding of the relationship between dislocation substructure and tensile properties in a low-carbon microalloyed steel. Mater. Sci. Eng. A 2022, 854, 143681. [Google Scholar] [CrossRef] [Scilit]
  18. Zhang, S.M.; Liu, K.; Chen, H.; Xiao, X.P.; Wang, Q.F.; Zhang, F.C. Effect of increased N content on microstructure and tensile properties of low-C V-microalloyed steels. Mater. Sci. Eng. A 2016, 651, 951–960. [Google Scholar] [CrossRef] [Scilit]
  19. He, J.L.; Wang, Q.M.; Zhao, L.Y.; Hu, B.; Wang, Q.F. Competitive growth of martensite/austenite constituent and degenerated pearlite and the impact toughness in the coarse-grained heat-affected zone of a low carbon microalloying steel. J. Mater. Res. Technol. 2025, 36, 789–805. [Google Scholar] [CrossRef] [Scilit]
  20. Kumar, N.; Kumar, P. Investigation on microstructural and mechanical integrity of GTAW dissimilar welded joint of IN 718/ASS 304L using Ni-based filler IN 625 using EBSD and DHD techniques. Int. J. Press. Vessel. Pip. 2024, 209, 105213. [Google Scholar] [CrossRef] [Scilit]
  21. Xue, J.L.; Guo, W.; Zhang, Y.X.; Xia, M.S.; Jia, Q.; Chi, J.X.; Shi, J.X.; Wu, Y.; Zhang, H.Q. Local microstructure and mechanical characteristics of HAZ and tensile behavior of laser welded QP980 joints. Mater. Sci. Eng. A 2022, 854, 143862. [Google Scholar] [CrossRef] [Scilit]
  22. Basquin, O.H. The exponential law of endurance tests. Am. Soc. Test. Mater. Proc. 1910, 10, 625–630. [Google Scholar]
  23. Murakami, Y.; Takagi, T.; Wada, K.; Matsunaga, H. Essential structure of S-N curve: Prediction of fatigue life and fatigue limit of defective materials and nature of scatter. Int. J. Fatigue 2021, 146, 106138. [Google Scholar] [CrossRef] [Scilit]
  24. Connors, W.C. Fatigue striation spacing analysis. Mater. Charact. 1994, 33, 245–253. [Google Scholar] [CrossRef] [Scilit]
  25. Moreira, P.M.G.P.; de Matos, P.F.P.; de Castro, P.M.S.T. Fatigue striation spacing and equivalent initial flaw size in Al 2024-T3 riveted specimens. Theor. Appl. Fract. Mec. 2004, 43, 89–99. [Google Scholar] [CrossRef] [Scilit]
  26. He, C.; Huang, C.X.; Liu, Y.J.; Wang, Q.Y. Fatigue damage evaluation of low-alloy steel welded joints in fusion zone and heat affected zone based on frequency response changes in gigacycle fatigue. Int. J. Fatigue 2014, 61, 297–303. [Google Scholar] [CrossRef] [Scilit]
  27. He, H.F.; Yang, D.D.; Ren, Z.H.; Zhao, R.C.; Huang, J.H. The proportion between the gear bending fatigue crack initiation and total life: A quantitative study. Eng. Fail. Anal. 2025, 175, 109611. [Google Scholar] [CrossRef] [Scilit]
  28. Wang, Y.; Ma, Q.; Liu, Z.; Pei, C.; Zhang, J.; Yu, L.; Li, H.; Gao, Q. Effect of heat input on microstructure and mechanical properties of simulated heat-affected zone in G115 steel. Int. J. Press. Vessel. Pip. 2025, 216, 105534. [Google Scholar] [CrossRef] [Scilit]
  29. Wen, H.; Wang, Q.; Dou, Y.; Wang, Q.; Xu, X.; Wang, Q. Comparison of Strengthening Mechanism of the Nb, V, and Nb-V Micro-Alloyed High-Strength Bolt Steels Investigated by Microstructural Evolution and Strength Modeling. Metals 2024, 14, 1309. [Google Scholar] [CrossRef] [Scilit]
  30. Park, H.; Jo, H.H.; Kim, S.H.; Kim, C.; Moon, J.; Chung, J.H.; Lee, B.H.; Lee, C.H. Distinct roles of Nb, Ti, and V microalloying elements on the fire resistance of low-Mo steels. J. Mater. Res. Technol. 2025, 37, 2144–2151. [Google Scholar] [CrossRef] [Scilit]
  31. Liu, F.C.; Li, J.W.; Wang, Q.; Liu, Y.D.; Bai, Y.; He, T.; Yuan, G. Microstructural refinement by the formation of acicular ferrite on Ti–Mg oxide inclusion in low-carbon steel. Mat. Sci. Eng. A 2021, 824, 141795. [Google Scholar] [CrossRef] [Scilit]
  32. Shi, G.H.; Zhao, H.L.; Zhang, S.M.; Wang, Q.F.; Zhang, F.C. Microstructural characteristics and impact fracture behaviors of low-carbon vanadium-microalloyed steel with different nitrogen contents. Mat. Sci. Eng. A 2020, 769, 138501. [Google Scholar] [CrossRef] [Scilit]
  33. Zener, C. Theory of Growth of Spherical Precipitates from Solid Solution. J. Appl. Phys. 1949, 20, 950–953. [Google Scholar] [CrossRef] [Scilit]
  34. Antolovich, S.D.; Armstrong, R.W. Plastic strain localization in metals: Origins and consequences. Prog. Mater. Sci. 2014, 59, 1–160. [Google Scholar] [CrossRef] [Scilit]
  35. Figueroa, J.C.; Laird, C. Crack initiation mechanisms in copper polycrystals cycled under constant strain amplitudes and in step tests. Mater. Sci. Eng. 1983, 60, 45–58. [Google Scholar] [CrossRef] [Scilit]
  36. Tanaka, K.; Mura, T. A dislocation model for fatigue crack initiation. J. Appl. Mech. 1981, 48, 97–103. [Google Scholar] [CrossRef] [Scilit]
  37. Sangid, M.D.; Maier, H.J.; Sehitoglu, H. The role of grain boundaries on fatigue crack initiation–An energy approach. Int. J. Plast. 2011, 27, 801–821. [Google Scholar] [CrossRef] [Scilit]
  38. Essmann, U.; Gösele, U.; Mughrabi, H. A model of extrusions and intrusions in fatigued metals I. Point-defect production and the growth of extrusions. Philos. Mag. A 1981, 44, 405–426. [Google Scholar] [CrossRef] [Scilit]
  39. Kobayashi, S.; Inomata, T.; Kobayashi, H.; Tsurekawa, S.; Watanabe, T. Effects of grain boundary- and triple junction-character on intergranular fatigue crack nucleation in polycrystalline aluminum. J. Mater. Sci. 2008, 43, 3792–3799. [Google Scholar] [CrossRef] [Scilit]
  40. Zhang, Z.J.; Zhang, P.; Li, L.L.; Zhang, Z.F. Fatigue cracking at twin boundaries: Effects of crystallographic orientation and stacking fault energ. Acta Mater. 2012, 60, 3113–3127. [Google Scholar] [CrossRef] [Scilit]
  41. Wang, Y.J.; Li, L.L.; Zhang, Z.J.; Zhang, Z.F. Effects of grain size and Schmid factor difference on fatigue cracking at twin boundaries in CrCoNi medium-entropy alloy. Acta. Metall. Sin. 2025, 1–11. Available online: https://www.ams.org.cn/EN/10.11900/0412.1961.2024.00211 (accessed on 8 January 2025).
  42. Li, L.L.; Zhang, Z.J.; Zhang, P.; Zhang, Z.F. A review on the fatigue cracking of twin boundaries: Crystallographic orientation and stacking fault energy. Prog. Mater. Sci. 2023, 131, 101011. [Google Scholar] [CrossRef] [Scilit]
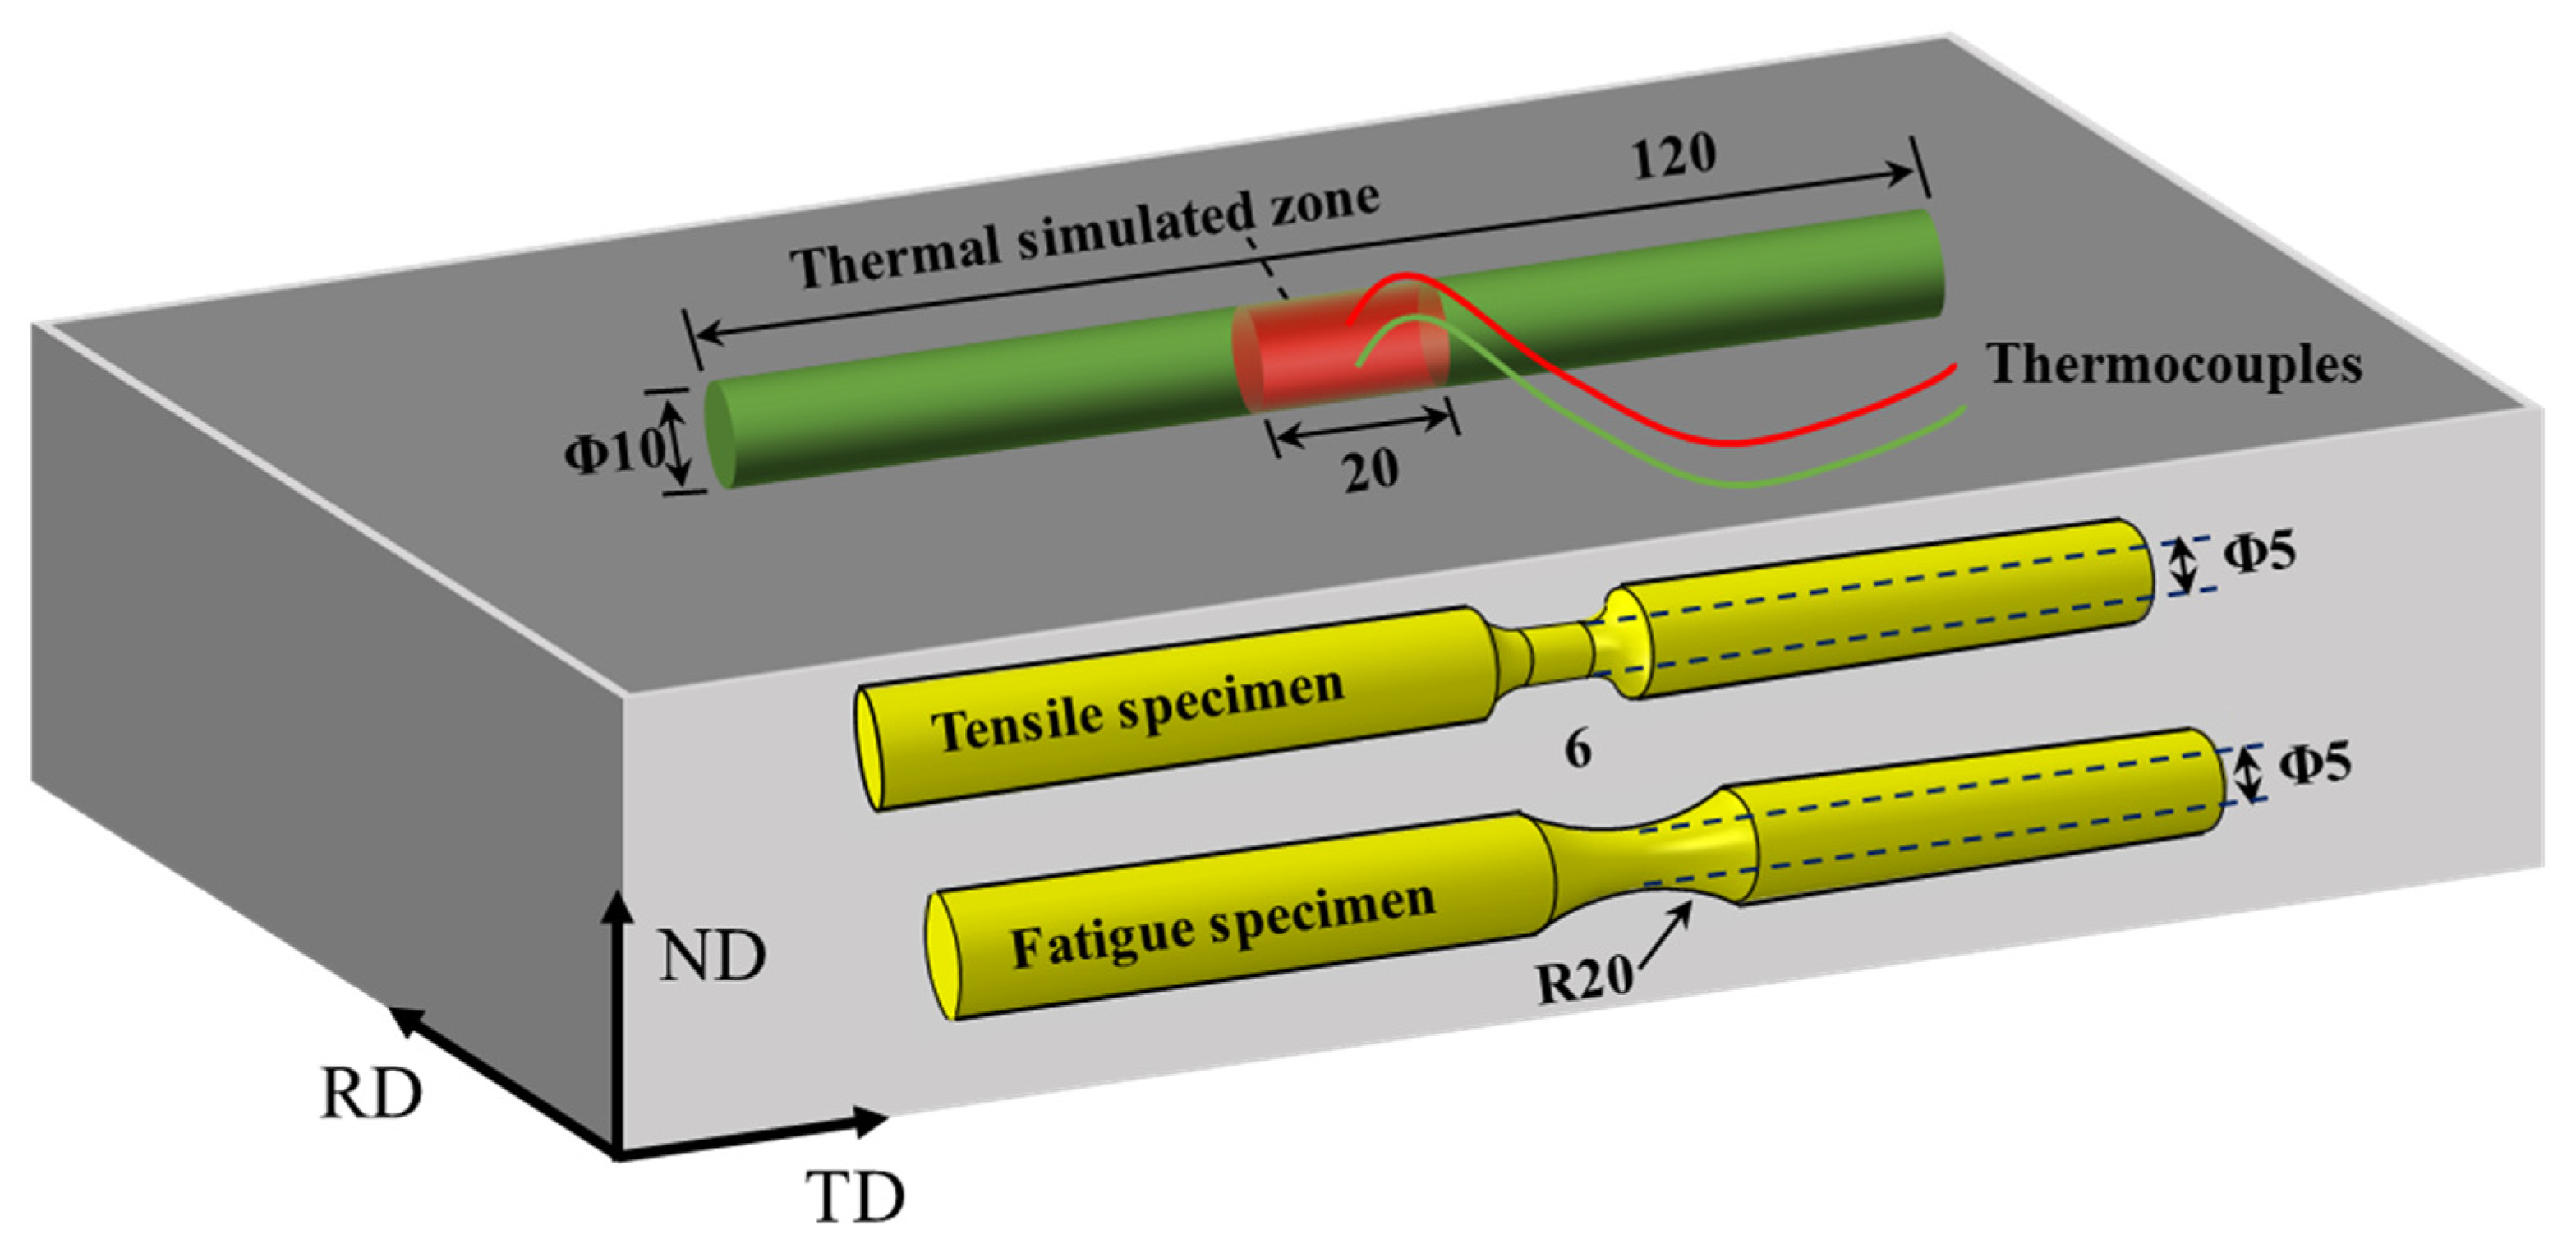
Figure 1. Three-dimensional diagram of the thermal simulated specimens.
Metals 16 00635 g001
Figure 2. Typical OM and SEM micrographs of the simulated CGHAZs: (a,c) 15 kJ/cm; (b,d) 25 kJ/cm; (e,g) 35 kJ/cm; (f,h) 45 kJ/cm. LB—lath bainite, GB—granular bainite, LBF—lath bainitic ferrite, GBF—granular bainitic ferrite, M/A—M/A constituent, DP—degenerated pearlite.
Metals 16 00635 g002
Figure 3. Area fraction of each microstructure in the simulated CGHAZs.
Metals 16 00635 g003
Figure 4. Typical TEM micrographs of the simulated CGHAZs: (a) 15 kJ/cm; (b) 25 kJ/cm; (c) 35 kJ/cm; (d) 45 kJ/cm. (e,f) Magnified images of the selected areas from (d). (g) Selected area electron diffraction (SAED) pattern of the bainitic ferrite matrix, (h) SAED pattern of the θ phase, and (i) SAED pattern of the M/A constituent.
Metals 16 00635 g004
Figure 5. Inverse pole figures (IPFs) (a,d,g,j), image quality (IQ) maps with grain boundary distributions (b,e,h,k), and kernel average misorientation (KAM) maps (c,f,i,l) in the simulated CGHAZs: 15 kJ/cm (a–c); 25 kJ/cm (b–f); 35 kJ/cm (g–i); 45 kJ/cm (j–l).
Metals 16 00635 g005
Figure 6. Mean equivalent diameter (MED) as a function of misorientation angles (MTAs) (a), and the number fraction of MTA (b), and the number fraction of kernel average misorientation (KAM) value (c) in the simulated CGHAZs.
Metals 16 00635 g006
Figure 7. Micrographs (a,b,e,f) and statistical histograms (c,d,g,h) of prior austenite grains (PAGs) in the simulated CGHAZs: (a,c) 15 kJ/cm; (b,d) 25 kJ/cm; (e,g) 35 kJ/cm; (f,h) 45 kJ/cm.
Metals 16 00635 g007
Figure 8. TEM micrographs (a,b,e,f) and EDS point analysis (c,d,g,h) of precipitated particles in the simulated CGHAZs: (a,c) 15 kJ/cm; (b,d) 25 kJ/cm; (e,g) 35 kJ/cm; (f,h) 45 kJ/cm.
Metals 16 00635 g008
Figure 9. Engineering stress–strain curves (a) and hardness (b) of each specimen in the CGHAZs.
Metals 16 00635 g009
Figure 10. High-cycle fatigue properties of the simulated CGHAZs with different heat inputs: (a) 15 kJ/cm; (b) 25 kJ/cm; (c) 35 kJ/cm; (d) 45 kJ/cm; (e) S-N curves fitted with Nf vs. stress amplitude.
Metals 16 00635 g010
Figure 11. Typical fatigue fracture morphologies of 15 kJ/cm CGHAZ failure specimen (σa = 252 MPa, Nf = 2,703,251): (a) overall morphology; (b) fatigue origin; (c) fatigue crack propagation region; (d) magnified image of the selected area from (c); (e) instantaneous fracture region.
Metals 16 00635 g011
Figure 12. Typical fatigue fracture morphologies of 25 kJ/cm CGHAZ failure specimen (σa = 238.5 MPa, Nf = 285,338): (a) overall morphology; (b) fatigue origin; (c) fatigue crack propagation region; (d) magnified image of the selected area from (c); (e) instantaneous fracture region.
Metals 16 00635 g012
Figure 13. Typical fatigue fracture morphologies of 35 kJ/cm CGHAZ failure specimen (σa = 225 MPa, Nf = 875,203): (a) overall morphology; (b) fatigue origin; (c) fatigue crack propagation region; (d) magnified image of the selected area from (c); (e) instantaneous fracture region.
Metals 16 00635 g013
Figure 14. Typical fatigue fracture morphologies of 45 kJ/cm CGHAZ failure specimen (σa = 238.5 MPa, Nf = 177,405): (a) overall morphology; (b) fatigue origin; (c) fatigue crack propagation region; (d) magnified image of the selected area from (c); (e) instantaneous fracture region.
Metals 16 00635 g014
Figure 15. Thermal dilatometric curves in the simulated CGHAZs at different heat input.
Metals 16 00635 g015
Figure 16. Thermodynamic calculations of the precipitated particles in the simulated CGHAZ.
Metals 16 00635 g016
Figure 17. Typical SEM micrograph (a), IPF (b), and IQ map (c) with grain boundary distributions of the propagation path of fatigue cracks in the heat input of 35 kJ/cm CGHAZ. (d) Magnified view of the selected region in (c).
Metals 16 00635 g017
Table 1. Chemical composition of experimental steel (wt.%).
CSiMnPSCrNbVTiAltFe
0.070.231.420.0050.0040.240.0380.0250.0150.031Balance
Table 2. EBSD statistical data of the simulated CGHAZs.
HAGBLAGBMED-MTA ≥ 15° (μm)
Number FractionLHAGB (mm) ρ H A G B
(1/μm)
Number FractionLLAGB (mm) ρ L A G B
(1/μm)
15 kJ/cm42.3%7.220.32157.7%9.830.4373.87
25 kJ/cm35.7%4.870.21664.3%8.770.3904.11
35 kJ/cm31.8%4.430.19768.2%8.540.3795.57
45 kJ/cm30.8%4.370.19469.2%7.320.3256.33
Table 3. Mechanical property summary of the simulated CGHAZs.
SpecimenYield Strength (MPa)Tensile Strength (MPa)Uniform Elongation (%)Hardness (HV0.5)
15 kJ/cm555 ± 1720 ± 17.9 ± 0.1250.9 ± 5.4
25 kJ/cm514 ± 6636 ± 29.0 ± 0.1217.3 ± 5.8
35 kJ/cm490 ± 1617 ± 210.0 ± 0.2203.3 ± 5.6
45 kJ/cm481 ± 1608 ± 510.0 ± 0.1207.2 ± 6.1
Disclaimer/Publisher’s Note: The statements, opinions and data contained in all publications are solely those of the individual author(s) and contributor(s) and not of MDPI and/or the editor(s). MDPI and/or the editor(s) disclaim responsibility for any injury to people or property resulting from any ideas, methods, instructions or products referred to in the content.