Article

The Influence of Geometry and Orientation on the Cellular Substructure and Local Mechanical Properties of Additively Manufactured AISI 316L


1
Institute of Materials Science and Engineering, RPTU University Kaiserslautern-Landau, 67663 Kaiserslautern, Germany
2
Institute for Mechanical and Automotive Design, RPTU University Kaiserslautern-Landau, 67663 Kaiserslautern, Germany
*
Author to whom correspondence should be addressed.
Metals 2026, 16(6), 636; https://doi.org/10.3390/met16060636
Submission received: 31 March 2026 / Revised: 27 May 2026 / Accepted: 2 June 2026 / Published: 9 June 2026
(This article belongs to the Section Additive Manufacturing)

Abstract

The complex geometries feasible with Laser Powder Bed Fusion (PBF-LB/M) lead to varying sizes of scanned cross sections within the layers and hence differing cooling rates. Since PBF-LB/M results in intragranular cell structures, which cause relatively high strengths in the austenitic steel AISI 316L, the influence of changes in the specimen size on the cell structure was investigated. The results obtained from the geometries realized in this work showed no significant influence of the specimen size on the cell sizes. To analyze the relation between the cell structure and the mechanical properties, cyclic indentation tests (CIT) were performed accordingly, revealing no clear influence of the specimen size on the mechanical properties and no correlation between the cell size and the mechanical properties. Additionally, the impact of the cell size on the well-known anisotropy in mechanical properties of AISI 316L produced via PBF-LB/M was investigated. While the cell size was observed to be independent of the specimen orientation on the build plate, the orientation between the direction of loading and the building direction reveals a slight influence on the mechanical properties obtained from CIT. In comparison to the properties determined using CIT, a stronger influence of the orientation between the load and the building direction was observed in tensile tests, which was not caused by the intragranular cells. It was concluded that the anisotropy in the tensile properties is mainly affected by the texture, the elongated grains, and the layer orientation.

1. Introduction

Additive manufacturing (AM) allows for the fabrication of complex, topology-optimized, and thus lightweight components through the layer-wise deposition of material [1]. With the development of different processes, AM offers the means to produce metallic components. Laser Powder Bed Fusion (PBF-LB/M) is a metallic powder-based additive manufacturing method, enabling small layer thicknesses, and thus, relatively precise metallic parts [1].
Common features of parts produced through PBF-LB/M comprise anisotropic mechanical properties depending on the orientation, i.e., the direction of applied load with respect to the building direction (BD) [2,3,4,5,6,7,8,9,10,11], rough “as-built” (AB) surfaces [9,12,13], residual stresses [1,9,12], and process-induced microstructural defects, such as gas pores and lack-of-fusion defects [3,4,11,12,13]. Besides this, materials manufactured by this AM technique reveal specific microstructural characteristics [2,9,10,11,12,13,14,15,16,17], which are the focus of the present work. Prominent microstructural aspects are the melt pool boundaries and grains elongated along the BD, while the latter grow epitaxially, i.e., through the different layers [2,3,4,8,9,10,12,15,16,17,18,19]. The direction of grain elongation is determined by the heat flux towards the already solidified material, opposing the BD. Depending on the material and process parameters, a texture of the grains can occur as well [3,8,9,10,12,16,17,20]. These features result from the layer-by-layer buildup, and the accompanied remelting of the previously deposited layers, which cause thermal gradients and rapid cooling and thus complex thermal histories throughout the material volume [4,8,9,12,20].
The extent of the microstructural features described above as well as their influence on the mechanical properties depends on the utilized material. In the context of AM, the austenitic steel AISI 316L is one of the most commonly used metallic materials, with relevance in the automotive, aerospace [7,13], biomedical [13], and chemical [21] industry. Using PBF-LB/M, higher tensile and yield strengths in relation to conventional production can be achieved for this steel [2,12,13,14,22]. For AISI 316L produced by PBF-LB/M, an additional microstructural feature occurs, i.e., a cellular structure within the grains. The walls of these intragranular cells consist of dislocations that impede dislocation movement inside the cells [2,14,15,16,17,18,19,20,22,23], which leads to relatively high tensile strengths. However, this increase in strength not only results from the cell structures, but is also caused by other process-induced microstructural phenomena, such as grain elongation, as shown in [2,12,14,16,17,18,20]. As reported in [12,18,19,22,23], the cellular structures might result from thermomechanical loading due to the repeated heating during PBF-LB/M, which introduced thermal strain and a cellular dislocation structure similar to the dislocation structures observed in cyclically loaded materials. Note that, besides dislocation cells, atomic segregation of the alloying elements—especially Cr and Mo—at the cell walls occurs and nanoparticles consisting of Mn- or Cr-enriched Si-oxides can be found randomly distributed throughout the cell structure [12,14,15,16,17,18,19,20,22,23]. The high cooling rates do not allow for sufficient diffusion time of the heavy alloying elements, leading to the described segregation [18,19,20,22,23]. The cells are elongated, tubular structures, and hence, in metallographically prepared samples, they can appear equiaxial, elongated, or somewhere in between, depending on the orientation of the section plane to the tubular structure [2,9,12,18,20,22,23]. The direction of the longitudinal axis of the tubular cells is contingent on the orientation of the associated grain, as well as the directions of the thermal gradient and preferred growth [9,18,24], called side-branching. Side-branching occurs if a variation in the thermal gradient induces a 90° rotation in the orientation of the cells, resulting in a better alignment with the thermal gradient [18,24].
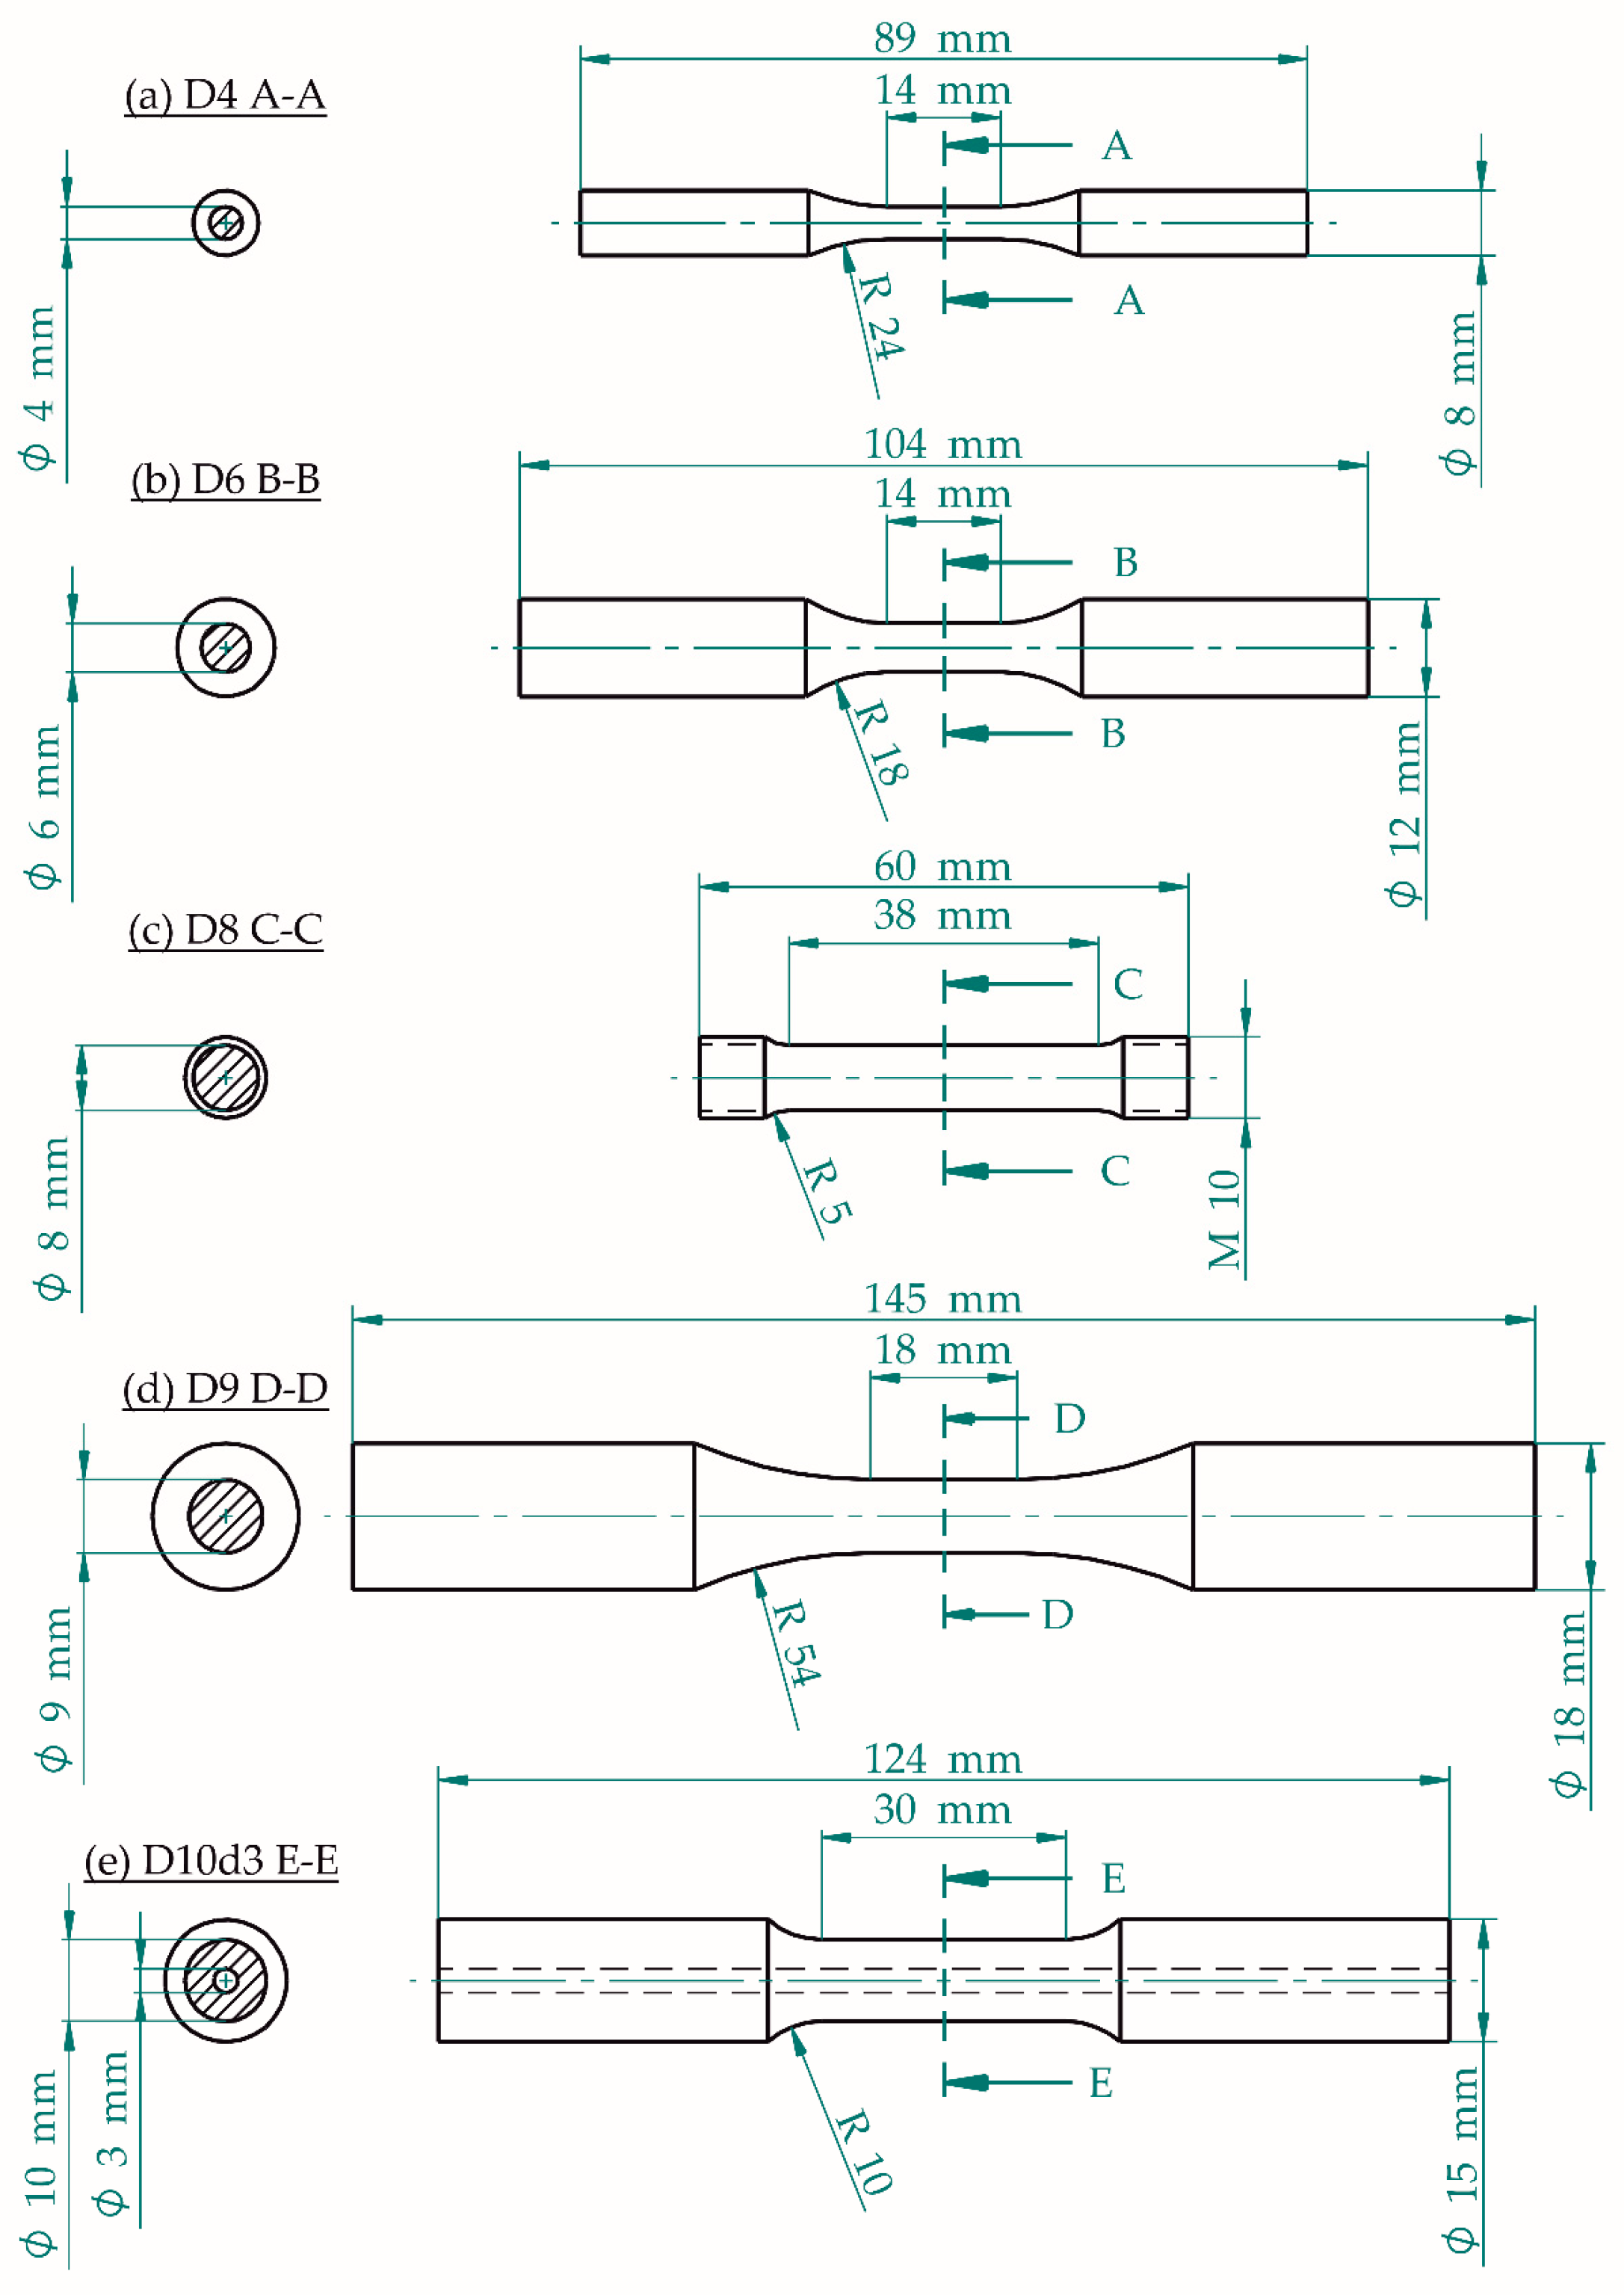
Considering the complex geometries of additively manufactured components, especially topology-optimized structures, different scanned cross-sectional areas within the different layers of a component are present, leading to varied cooling times and thermal histories during the manufacturing process. These can result in variations in the cell sizes and the mechanical properties. Furthermore, complex component geometries are associated with varied orientations of the local loading direction with respect to the layer planes. The resulting anisotropy in the mechanical properties has been reported in different works [3,4,5,6,7,8,9,10]. However, the impact of the cellular structure on the anisotropy itself has not been investigated thoroughly. On this background, the aim of this work was to examine the effect of the different scanned cross-sectional areas and specimen orientations on the microstructure, especially the intragranular cell structure of AISI 316L specimens produced via PBF-LB/M. Additionally, cyclic indentation tests (CIT) were performed on different specimen types to analyze the mechanical properties depending on the specimen sizes and the corresponding cell structure. Moreover, the influence of the orientation of the loading direction to the build direction on the mechanical properties was investigated. For this, besides CIT at differently oriented specimens, tensile tests were performed. In this context it was analyzed which microstructural features cause anisotropy in the mechanical properties, while a special focus was placed on the cell structure. Note that CIT enables the analysis of the cyclic deformation behavior in several sections of the specimens [5,25,26,27] and thus, in different directions of the cellular structure, whereas during tensile testing, the loading direction is defined by the longitudinal axis of the specimens. Beyond these considerations, the specimen geometries examined in this work are required for a thorough analysis of the influence of different loading types on the fatigue behavior. The respective fatigue tests, which are planned in future work, must be performed using different test rigs, necessitating the specimen geometries shown in Figure 1.

2. Materials and Methods

2.1. Specimen Fabrication and Material

In this work, net-shaped specimens made of AISI 316L were manufactured using the Laser Powder Bed Fusion (PBF-LB/M) process, as detailed by Ahmed et al. [28]. Therefore, a 3D Systems ProX DMP 320 (3D Systems, Rock Hill, SC, USA) device, equipped with a 500 W fiber laser and a wavelength of 1070 nm was utilized. Within each layer, the inner cross-sectional area of each specimen was scanned first, followed by the contour. The process parameters used for the contour and inner area are given in Table 1. The scanning direction was unidirectional, while a 245° rotation of the scanning direction after each layer was realized. Note that a minimum layer time of 12,000 ms was realized to provide similar starting temperatures for each layer. During the manufacturing process, a nitrogen inert gas atmosphere was provided to prevent oxidation.
The specimens were produced in three orientations: vertical (V), where the direction of loading is parallel to the building direction, horizontal (H), where the direction of loading is perpendicular to the BD, and 45° (45), which lies between V and H. In total, five different specimen geometries were fabricated, with varying lengths and diameters in the gauge section (see Figure 1). The different types are named D4, D6, D8, D9, and D10d3, according to their diameters in the gauge length. Before removal from the build plate, the specimens underwent a stress-relief heat treatment at 650 °C for 2 h with subsequent furnace cooling to prevent dimensional changes caused by residual stresses after removal.
Since the same batch of virgin powder as well as identical manufacturing parameters were used to manufacture all the specimens, their chemical composition can be assumed to be similar. In Table 2, the chemical composition determined via spark emission spectrometry on the clamping shaft of a D9 specimen is given.
Figure 1. Overview of the different specimen geometries.
Metals 16 00636 g001

2.2. Microstructural Analysis

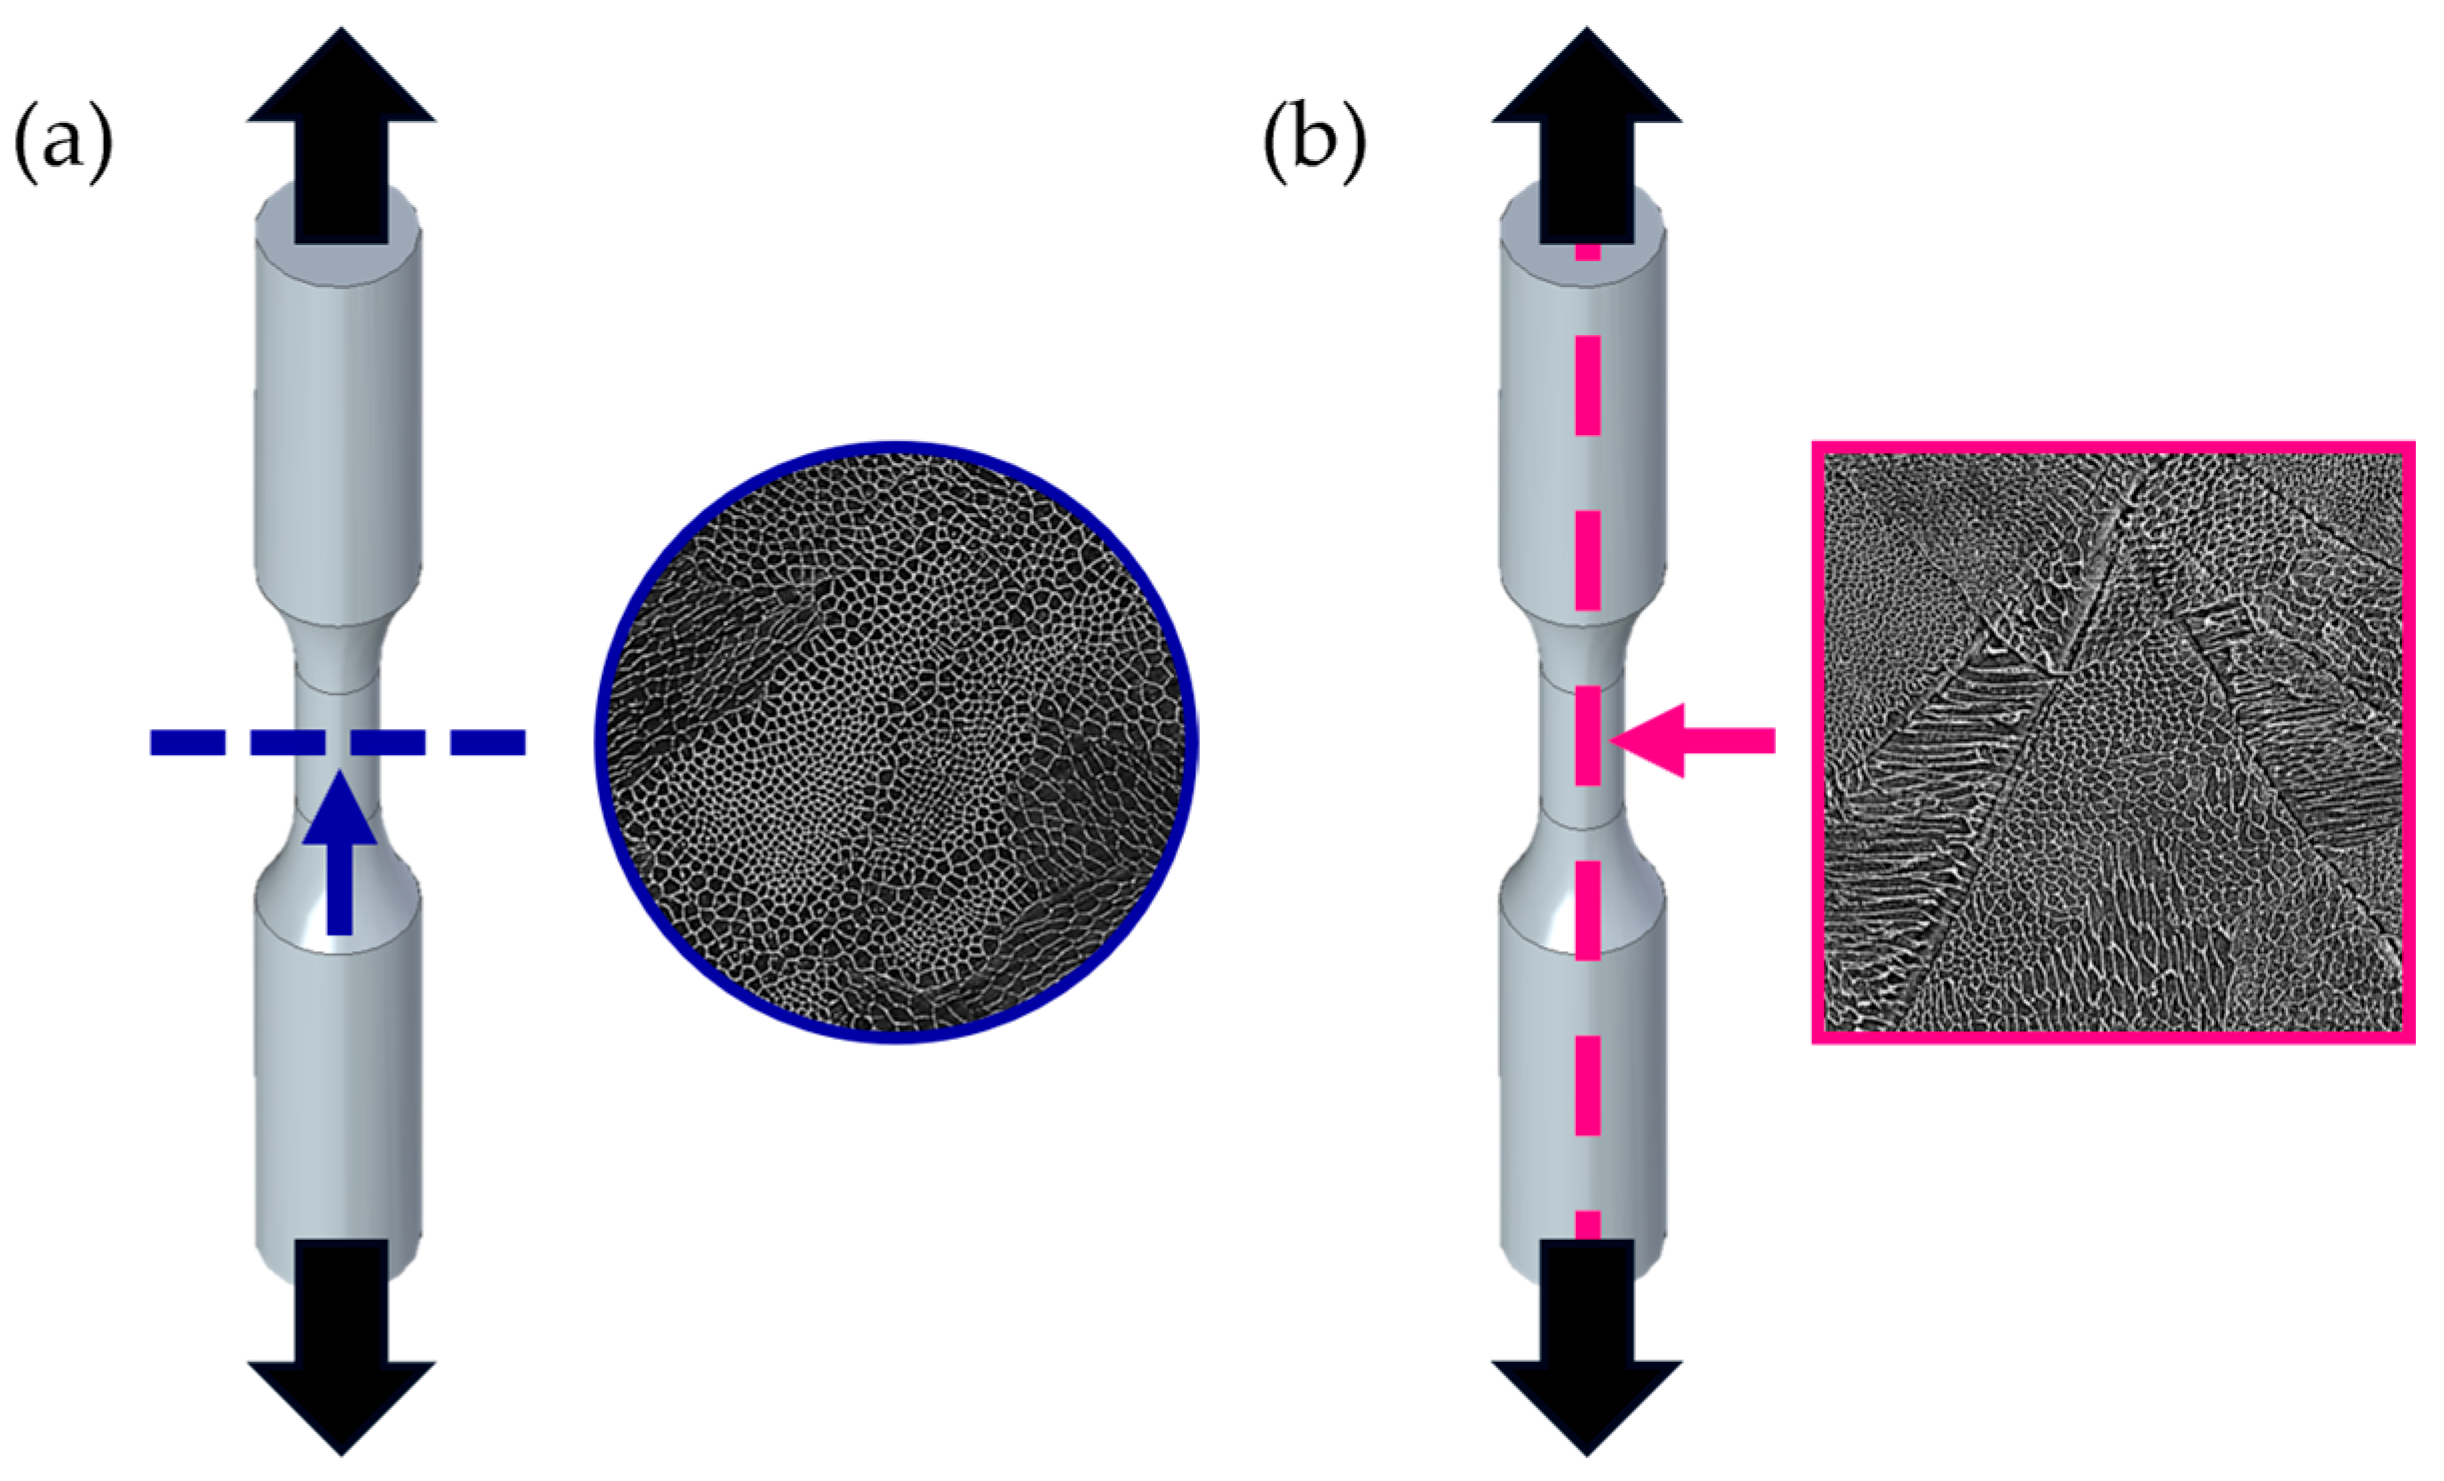
To investigate the microstructure and mechanical properties of the different specimen types, metallographic samples were extracted from the gauge section volume. Therefore, cross sections (C) perpendicular to the loading direction (Figure 2a) and longitudinal sections (L) parallel to the loading direction (Figure 2b) were examined.
For electron backscatter diffraction (EBSD) analyses, a Tescan Clara (Tescan, Brno, Czech Republic) scanning electron microscope (SEM) equipped with an Ametek Octane 9 (Ametek, Berwyn, PA, USA) EBSD detector was used, providing information on the grain structure and the texture. The samples investigated with EBSD were prepared via wet grinding with SiC papers in grit stages of 240, 500, and 1200 and subsequent electrolytic polishing with a Struers LectrilPol-5 (Struers APS, Ballerup, Denmark). Note that for EBSD analyses only longitudinal sections were investigated, since it was easier to define the relation between the load and the building direction after preparation.
The same SEM was used to analyze the intragranular cell structures, since high resolution imaging was required. The same samples were mechanically prepared through wet grinding using SiC papers and the same grit stages mentioned above, and subsequent polishing with a 3 µm diamond suspension, followed by an oxide polishing with alumina suspension (OPA). To visualize the cell structure, the samples were etched at 50 °C for 60 s using V2A etchant. For every combination of specimen size, orientation, and section type, at least five images with an average area of approximately 165 µm2 were analyzed, and hence, sections of roughly 825 µm2 each were investigated.

2.2.1. EBSD Analyses

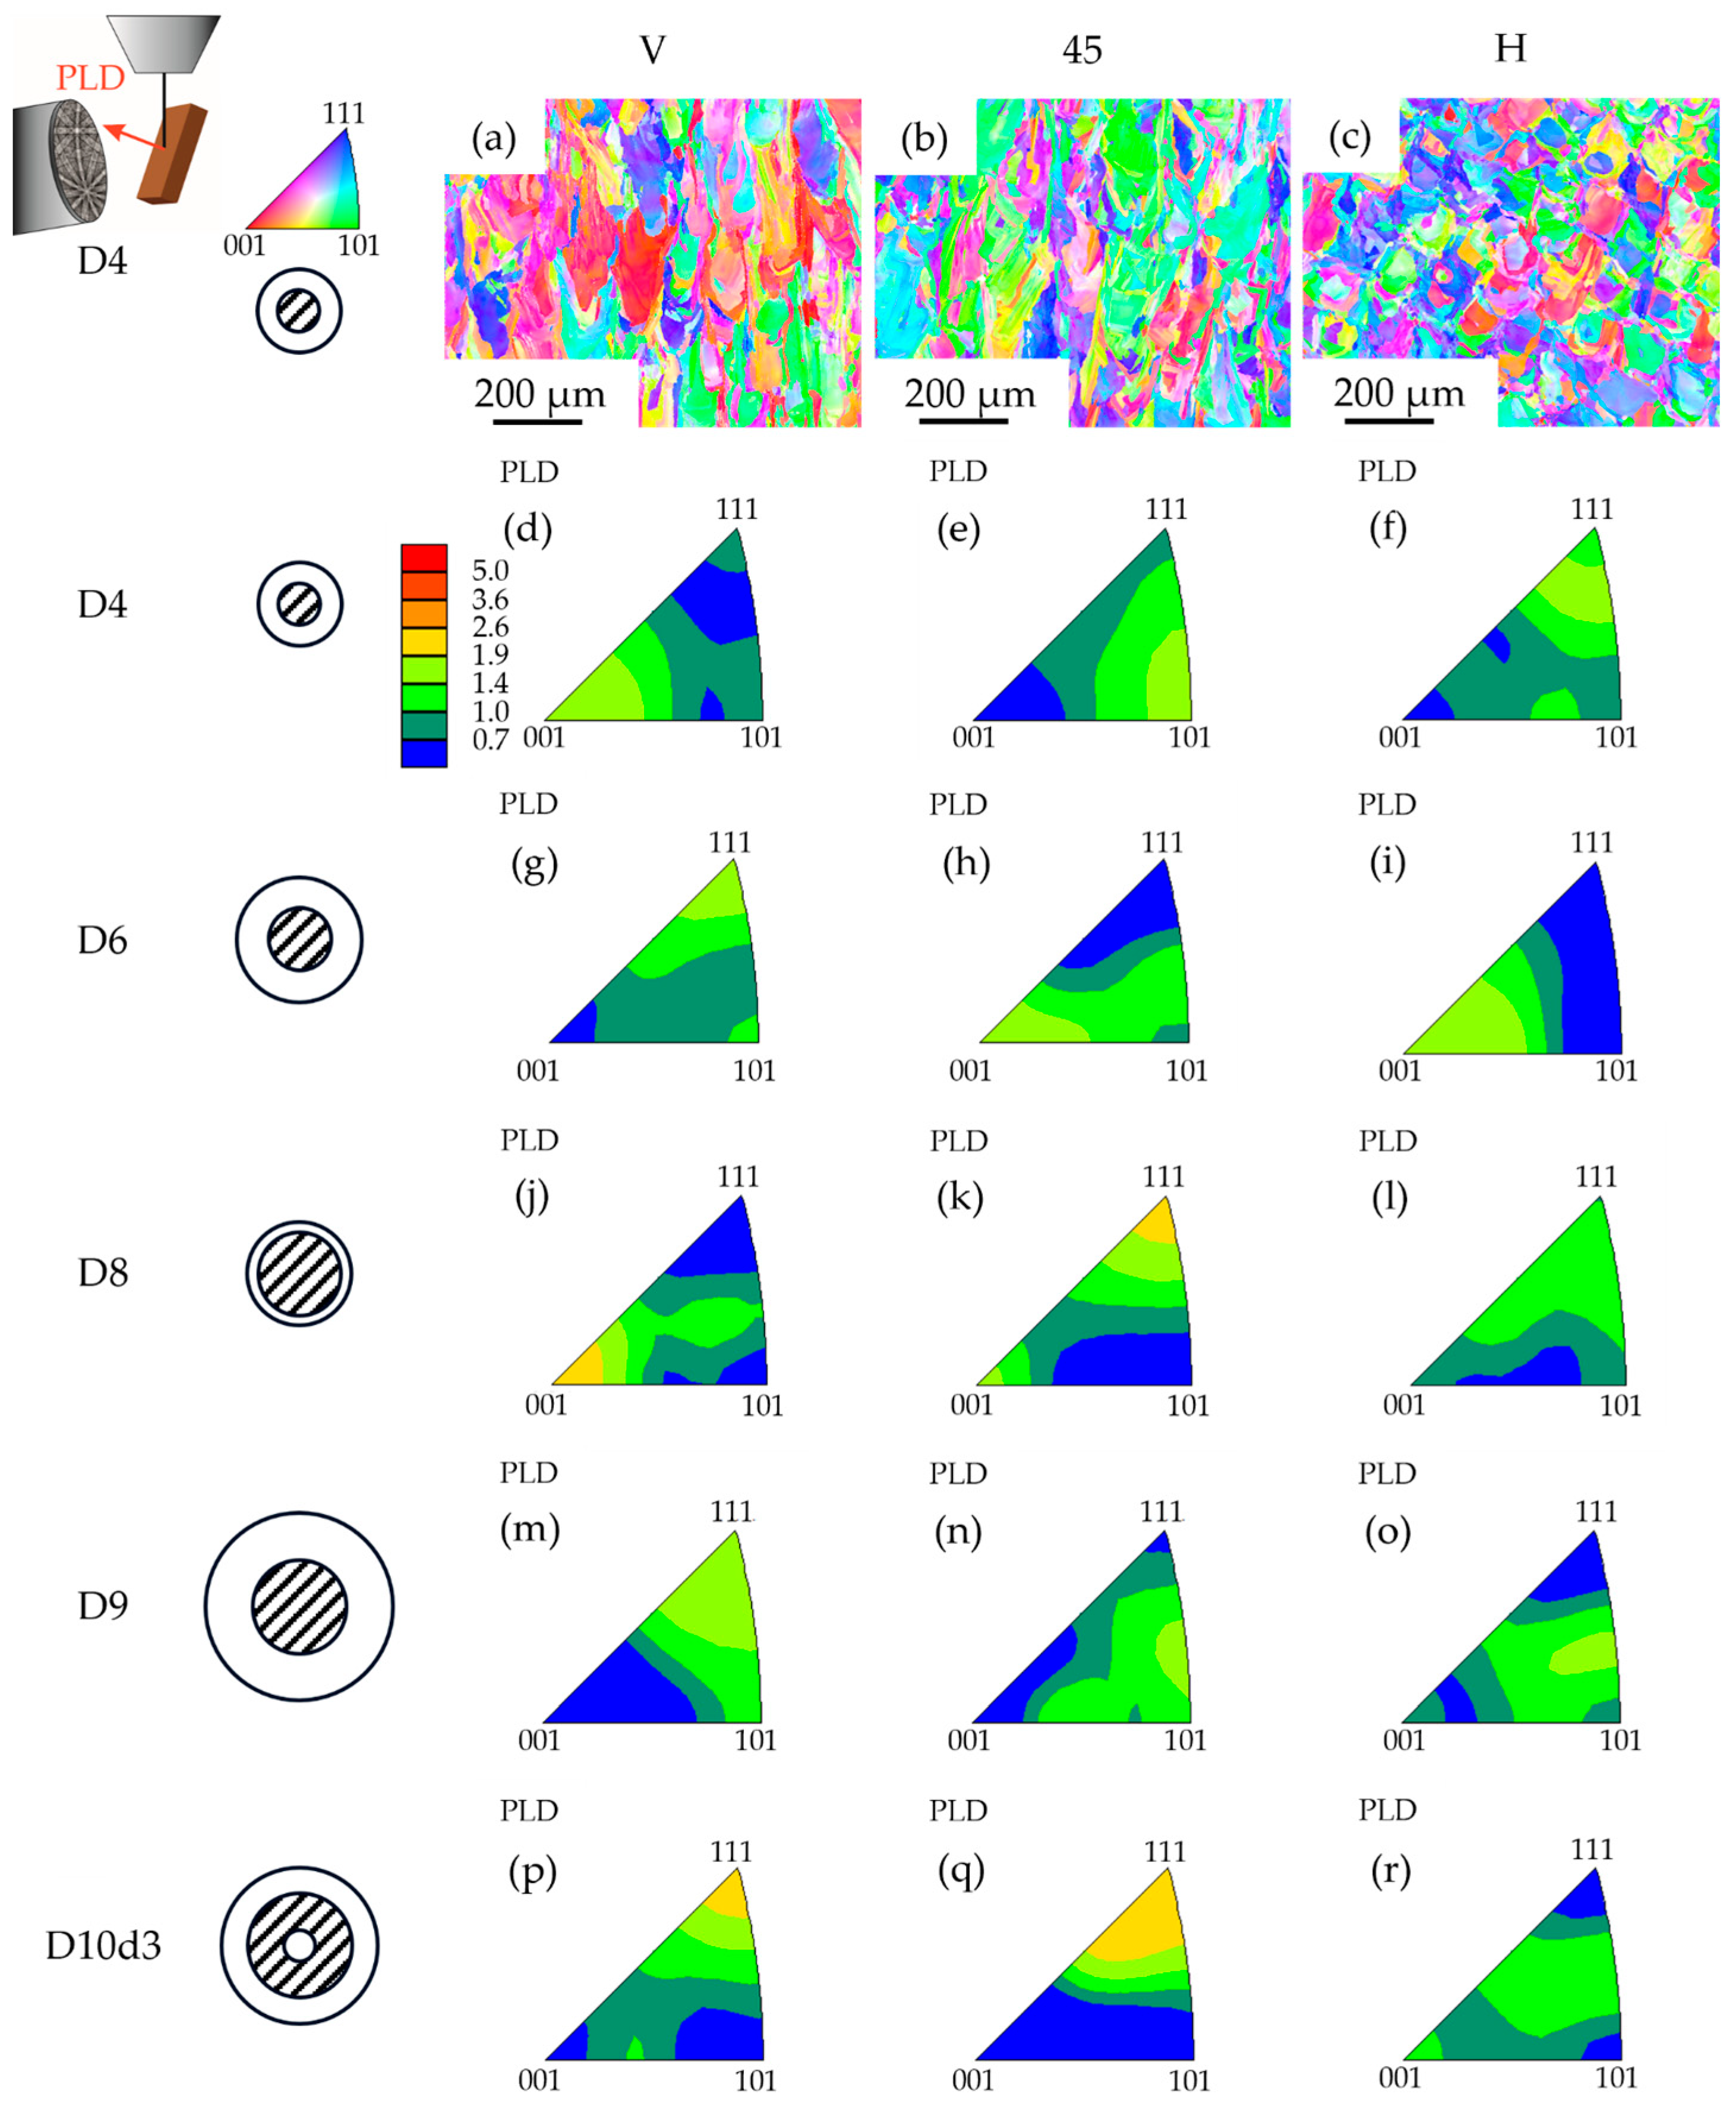
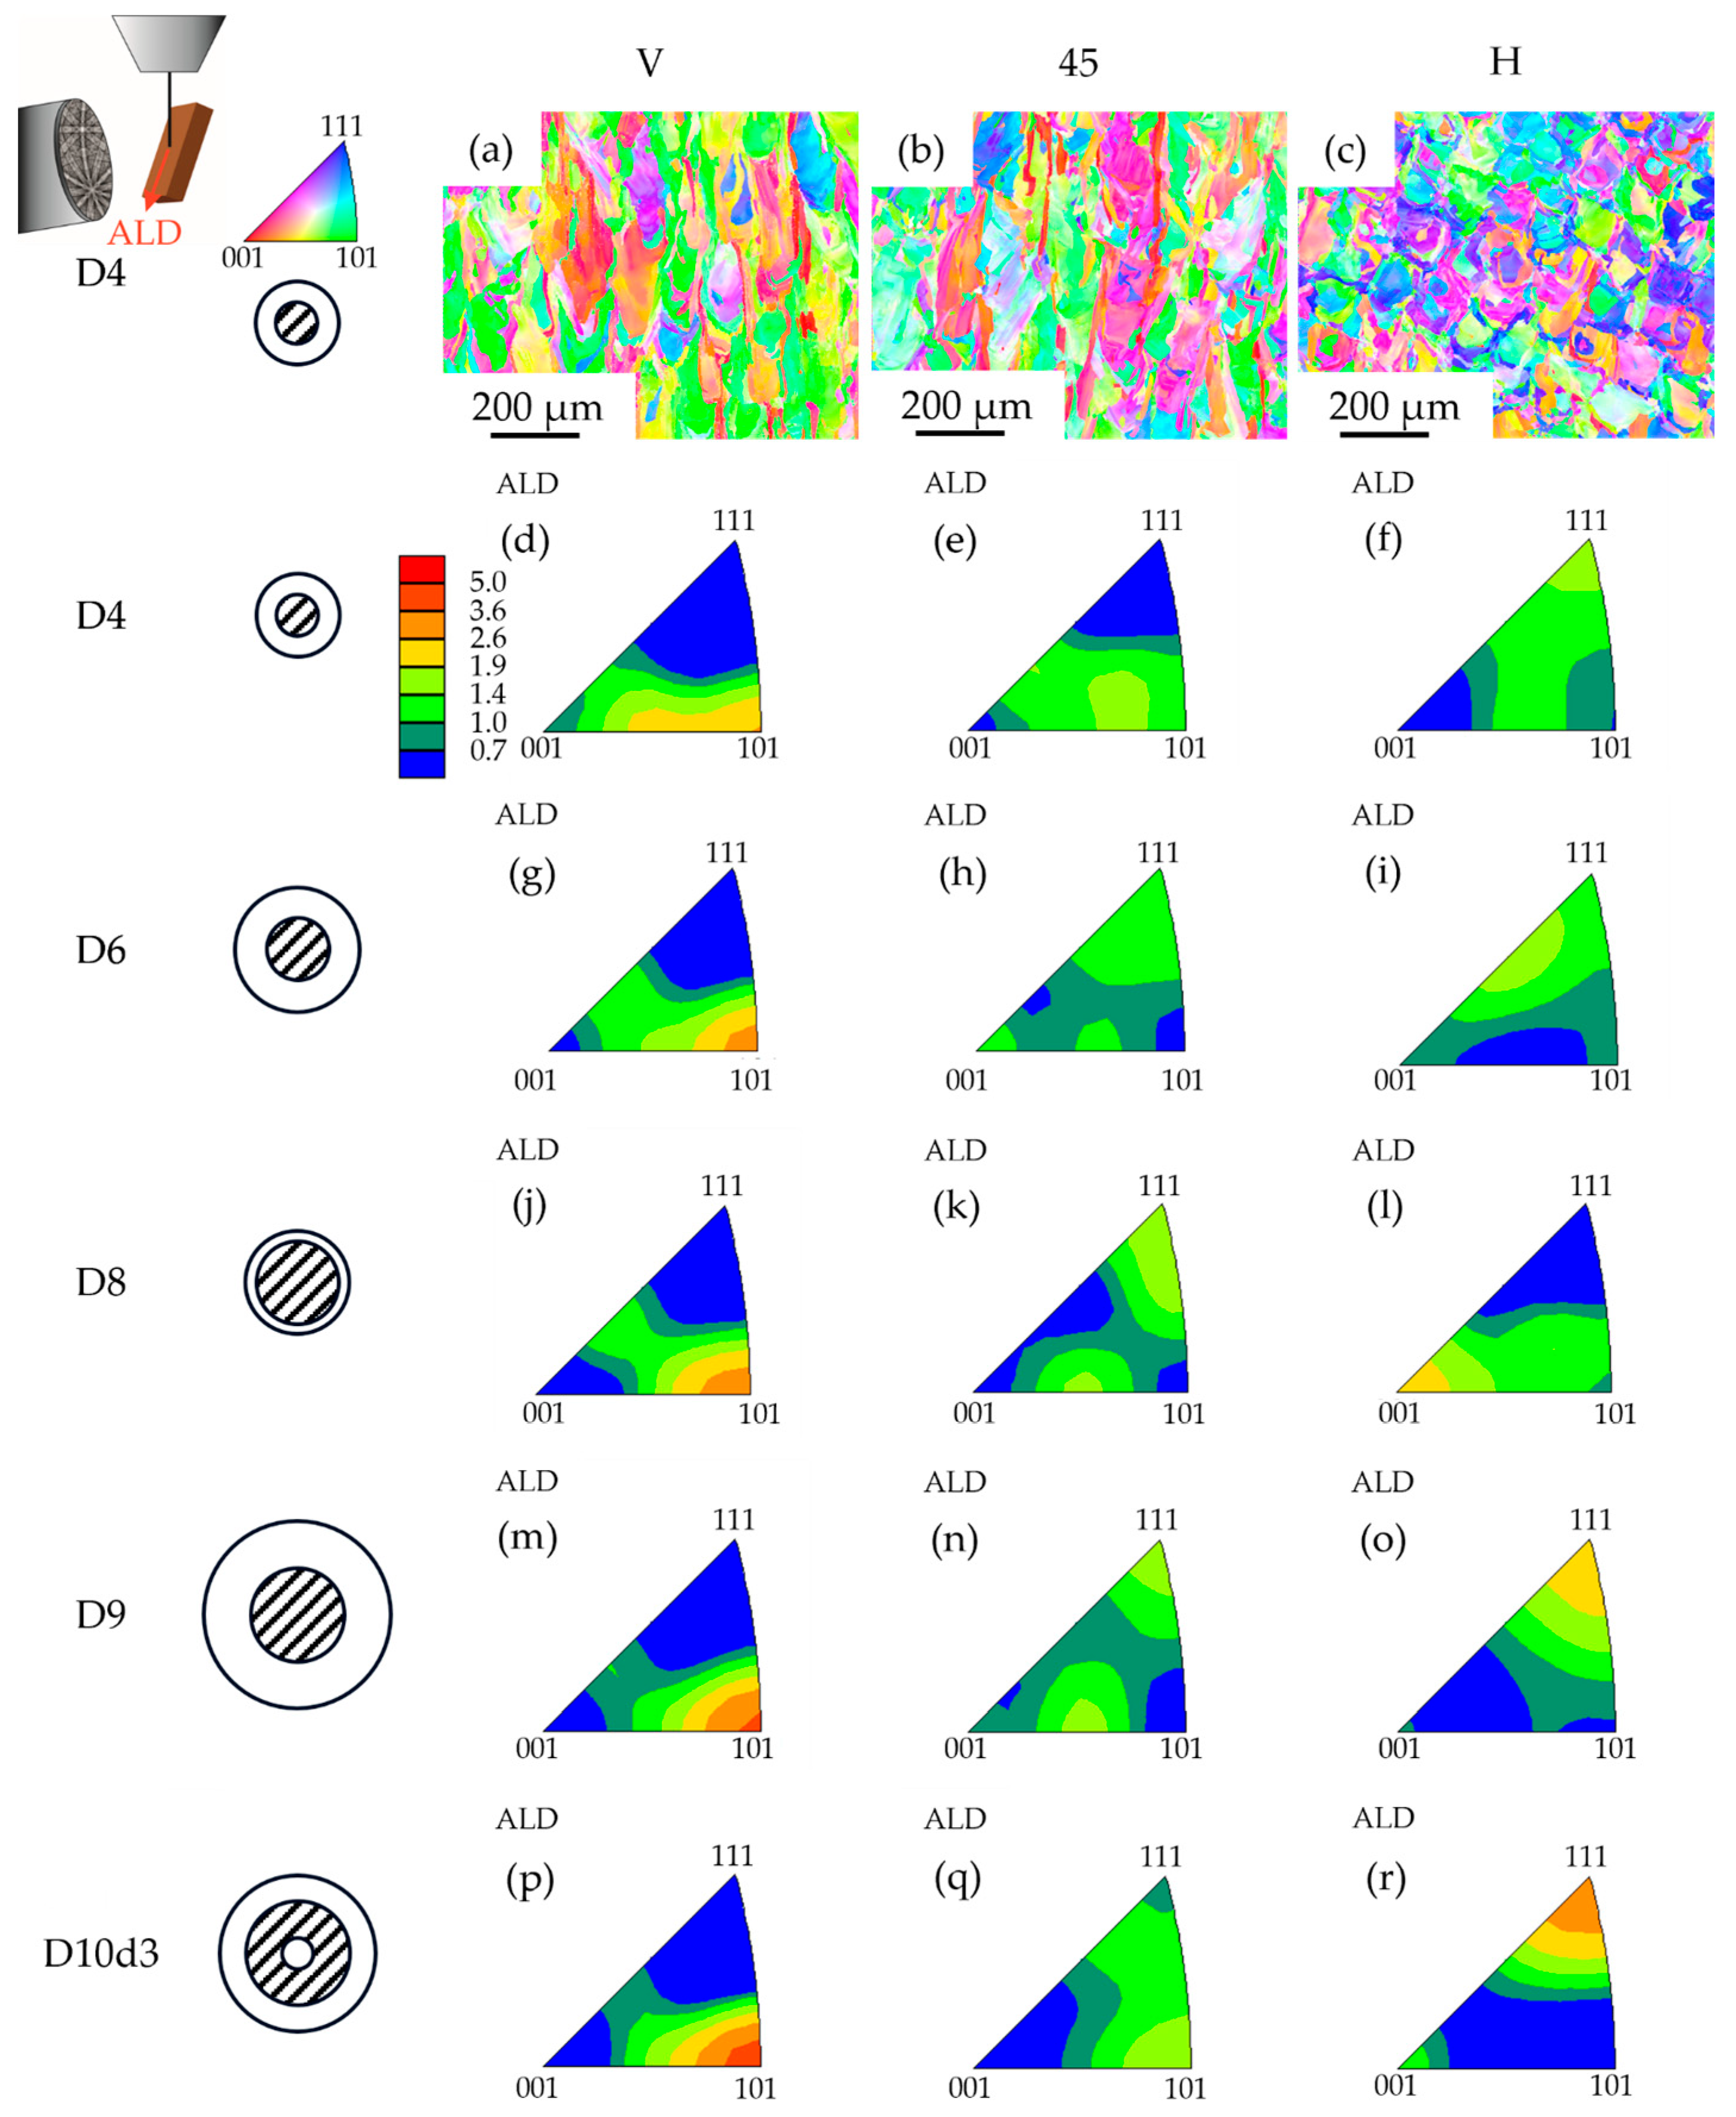
The results obtained in the EBSD analyses are illustrated in Figure 3 and Figure 4. Both show exemplary EBSD orientation maps for all three orientations of the D4 specimen geometry. While Figure 3 represents the orientations perpendicular to the load direction (PLD), Figure 4 shows the orientations obtained along the loading direction (ALD). Note that the orientations shown in Figure 3 and Figure 4 are based on the same EBSD measurement. Additionally, the inverse pole figures, which represent the grain orientations with respect to the considered direction, are given for all specimen types.
In the EBSD orientation maps, the elongated grains along the building direction can be seen in the vertical specimen orientation (Figure 3a and Figure 4a), whereas the H orientation reveals more circular grains, characteristic for the microstructure perpendicular to BD (Figure 3c and Figure 4c). The microstructure of the 45° oriented samples reasonably consists of a mixture of both V and H (Figure 3b and Figure 4b).
Perpendicular to the loading direction (Figure 3), a slight texture in [111] direction is visible for some specimens, which is most pronounced in the vertical and 45 orientations of the specimen geometry D10d3. However, no consistent, orientation-dependent texture is visible. For example, the vertical orientations of the D8 and D10d3 specimens show distinctly different textures. Additionally, the texture varies throughout the specimen geometries but is not very strong for any of the conditions.
Along the loading direction (Figure 4) a stronger texture is observed than that seen in Figure 3 and which differs between the orientations. The V orientation reveals the most pronounced texture in [101] direction consistently for all specimens types, which is in accordance with the results of Charmi et al. [3], who did not find an influence of specimen geometry on the crystallographic orientation. However, the extent of the texture differs slightly between the different geometries. Moreover, the H orientation tends to show a texture in [111] direction, except for the D8 specimen, and is most pronounced in D10d3. The 45° oriented specimens reveal a mixture of the V and H orientations, which is also in accordance with the reports of Charmi et al. [3].
From the EBSD maps of the D8 specimen geometries ALD, the Euler angles were calculated using EDAX OIM Analysis V8 (Ametek, Berwyn, PA, USA) software. First, the orientation distribution function (ODF) was created with a resolution of 5° for the Euler angles φ1 (ranging from 0° to 360°), Φ (in the range from 0° to 180°), and for φ2 (from 0° to 360°), which can be found in the supplementary materials section in Tables S1–S3. From this, the ODF occurrence intensity was extracted for each set of Euler angles and the respective Young’s modulus EE was determined for each combination in accordance with Bunge [29] and Rösler et al. [30]. The elastic constants C11 = 191.2 GPa, C12 = 117.9 GPa, and C44 = 138.6 GPa given in Teklu et al. [31] for an FCC Fe-Cr-Ni alloy with a Cr-Ni composition of 18–12 were used. Based on these results, a representative EE was estimated in accordance with its dependency on the crystallographic orientation for each specimen orientation. For this, each result of EE was multiplied by the respective ODF occurrence intensity and were added up, leading to a consideration of the distribution of the crystallographic orientation. This sum was then divided by the sum of the ODF occurrence intensity to calculate a weighted Young’s modulus for each specimen orientation EE and their corresponding standard deviations (see Table 3).

2.2.2. Cell Structure Analysis

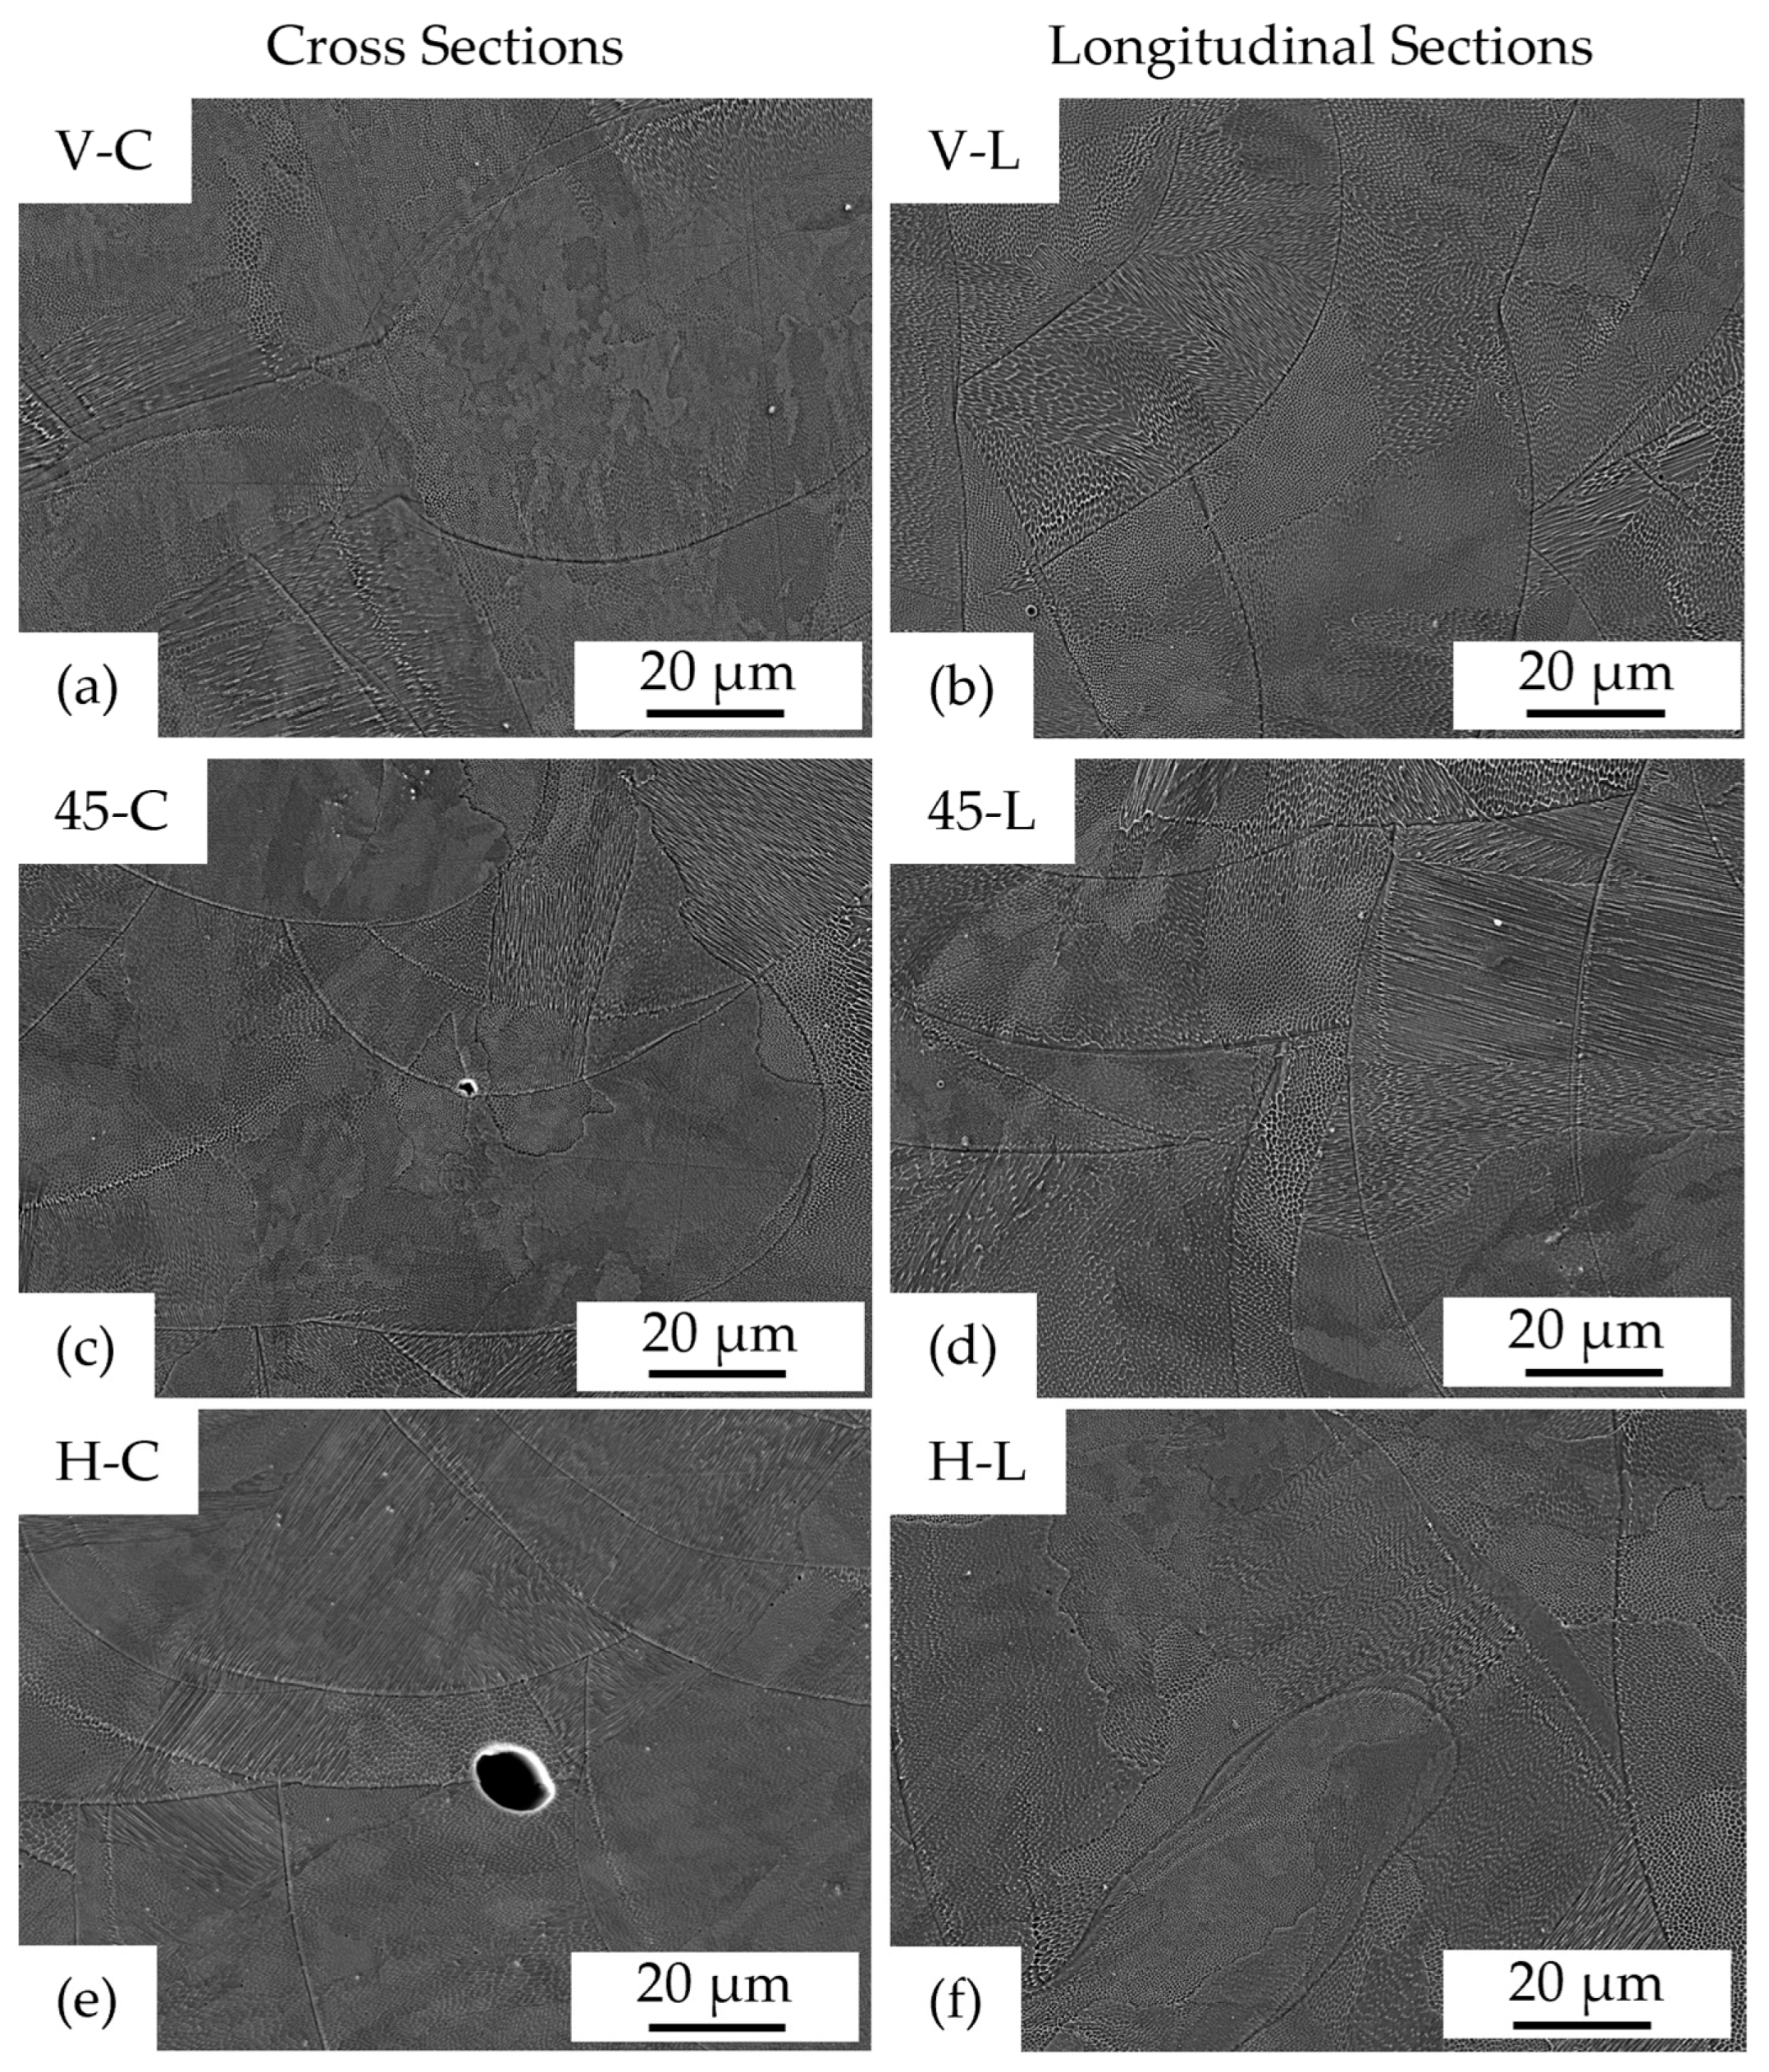
Figure 5 shows exemplary SEM images obtained from the cross and longitudinal sections of all three orientations of the D10d3 specimen geometry. Due to the differing grain orientations within the sectional planes as well as side-branching [18,24], the cell structures in Figure 5 show different shapes: equiaxial cells, elongated cells, and cell forms ranging in between. The cell shape variations were found to be similarly distributed throughout the analyzed sections, regardless of cross (C) or longitudinal (L) section. To quantitatively analyze the cell structures, their geometry needed to be determined. For this, only the equiaxial cell structures were focused on in this work, since they can be comparably quantified between the different sample orientations. However, as the thermal conditions are assumed to be similar within the sample volume, the characterization of the equiaxial cells is expected to provide representative results for the respective conditions.
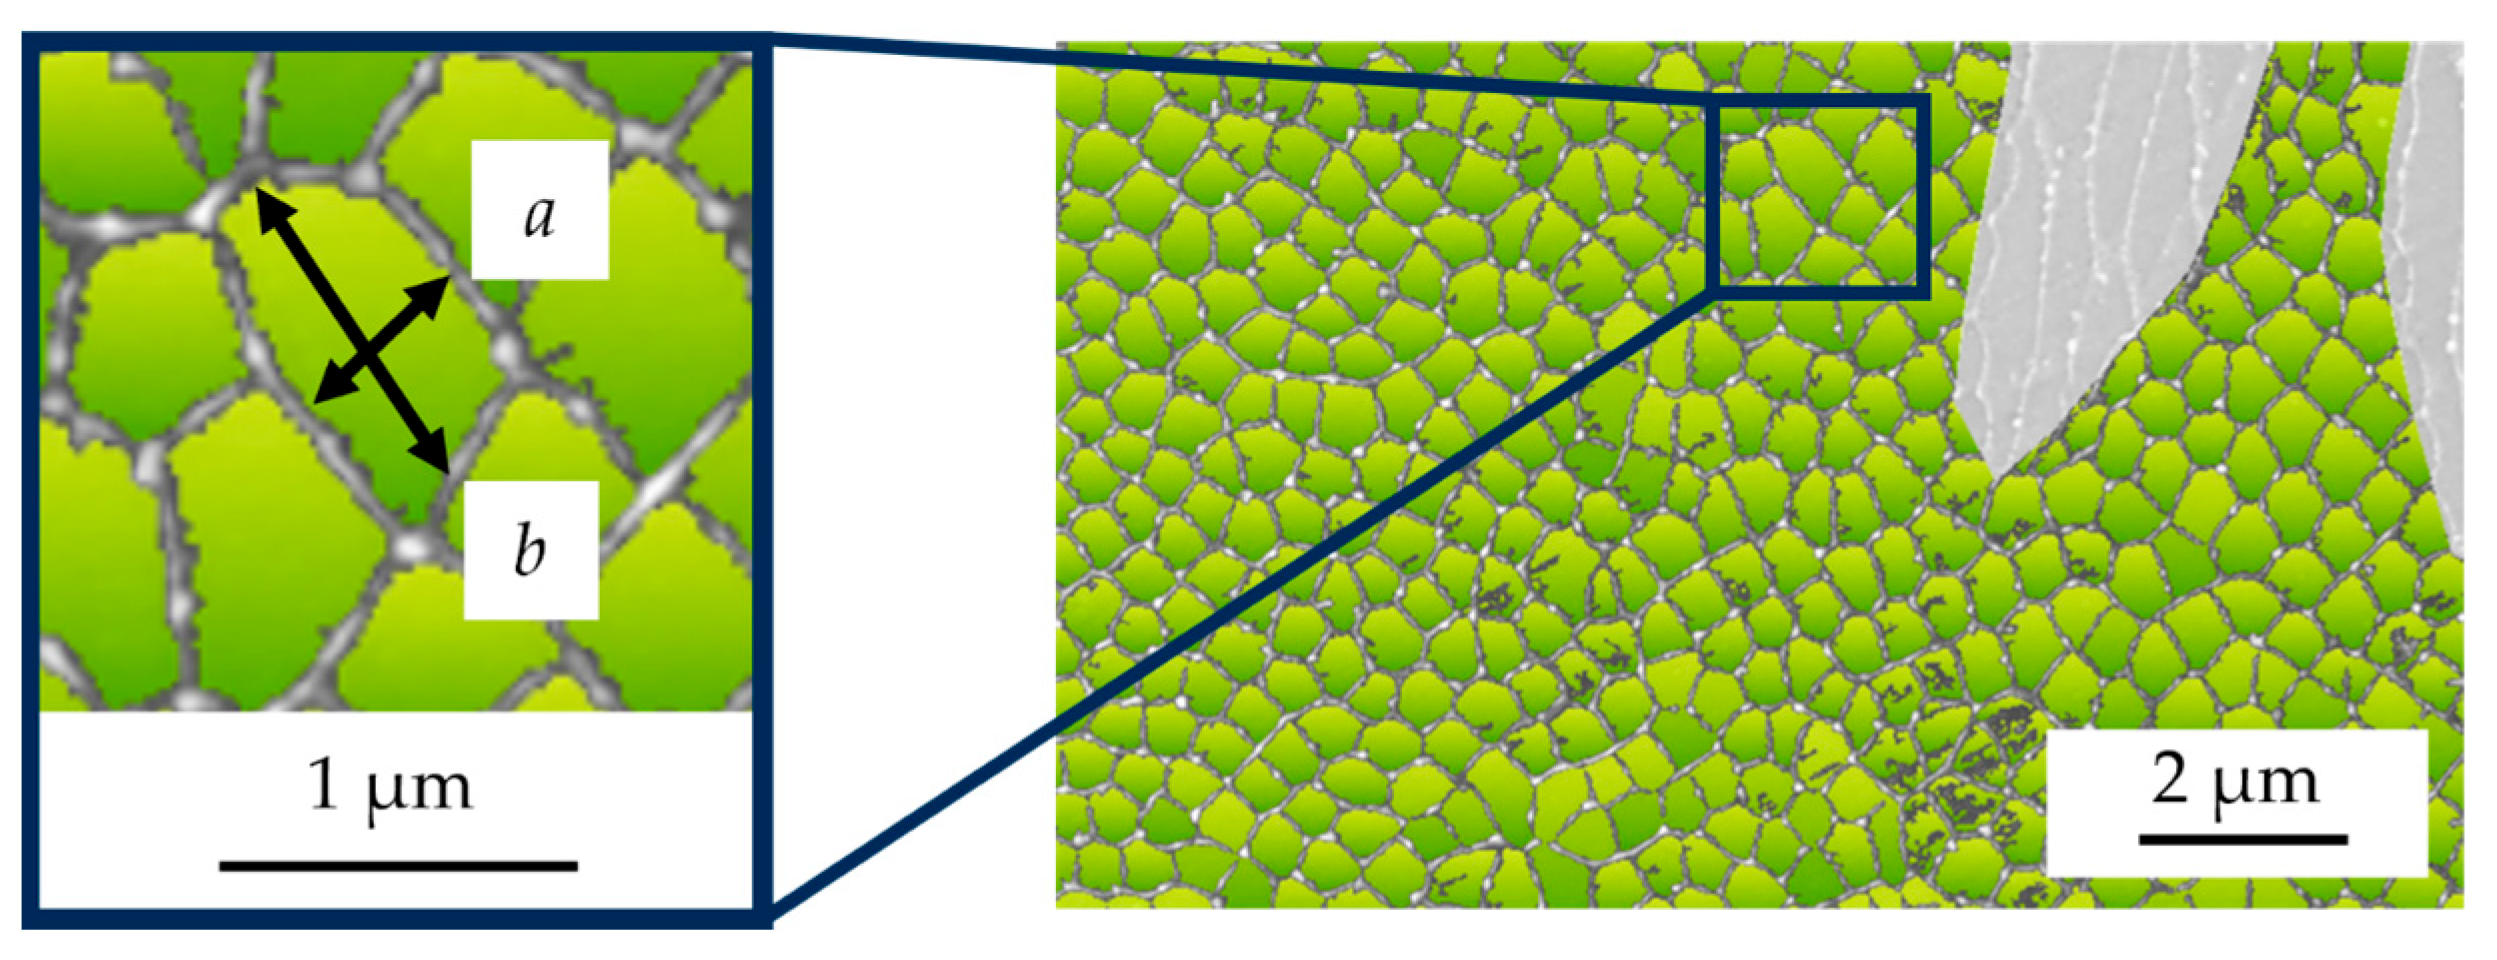
To describe the equiaxial cells, they were approximated by ellipses according to Equation (1). The minor ellipse axis a and the major ellipse axis b were determined for the equiaxial cell structures as seen in Figure 6, using IMAGIC IMS software V16 (Imagic Bildverarbeitung AG, Glattbrugg, Switzerland). From a and b, the average cell area Acell was calculated.
A cell = π   ×   a   ×   b .
For the C and L sections of all specimen types, average values of a, b, and Acell and their standard deviations were determined based on the analyses performed on five SEM micrographs according to Figure 6. Only Acell will be shown in the following due to the approximately constant a/b ratio between 0.65 and 0.77, since all three parameters yielded the same conclusions, and Acell includes the information given by both a and b.

2.3. Determination of the Mechanical Properties

To determine the local mechanical properties for the different types of specimens, cyclic indentation tests (CIT) were performed using a Fischerscope HM2000 (Helmut Fischer GmbH, Soling, Germany). In CIT, the material was loaded with a Vicker’s indenter for 10 indentation cycles, using a sinusoidal load at a frequency of f = 1/12 Hz and a maximum indentation force of Fmax = 1000 mN. Throughout the cycles, the indentation force F and the indentation depth h were continuously measured. Thus, from the data obtained in the first cycle, microhardness (Martens hardness HM) can be determined.
Starting from the 2nd cycle, a F-h hysteresis loop can be measured using CIT [25]. Analogous to the stress-strain hysteresis obtained from uniaxial fatigue tests, the plastic indentation depth amplitude ha,p is determined as half the width of the hysteresis at mean loading (0.5 Fmax) and can be used to characterize the plastic deformation within a single cycle. Therefore, the evolution of ha,p during the CIT characterizes the cyclic deformation behavior. Consequently, the plot of ha,p versus the number of cycles N (ha,p-N curve) represents the cyclic deformation behavior. From the 5th cycle on, a change in slope of the ha,p-N curve occurs, which indicates the saturation of macroplastic deformation and the transition to the domination of microplastic deformation. This regime of the ha,p-N curve can be described with the power law function ha,pII, as shown in Equation 2 [25], where aII is the coefficient of ha,pII and eII represents the exponent of the ha,p-N curve in the regime between the 5th and 10th cycle. Note that a steeper slope is associated with stronger cyclic hardening and, thus, eII is called the cyclic hardening exponentCHT. Since a higher |eII| results from more pronounced cyclic hardening, |eII| directly correlates with the cyclic hardening potential of a material.
h a , pII = a II   ×   N   e II ,
Consequently, the two CIT parameters were obtained, providing information on the material’s strength (HM) and cyclic deformation behavior (eII). To determine reliable average values of HM and eII, 40 CIT were carried out on both the longitudinal and cross sections of each specimen geometry. Moreover, 90% confidence intervals were determined using these results as well as a normal (or Gaussian) distribution. Note that for each condition the 40 measurement points were distributed over 2 different sectional planes. Furthermore, it should be noted that a multiaxial stress state exists beneath the indenter [32,33,34], which makes a simple comparison between sectional planes difficult. However, the indentation direction is parallel to the direction of maximum stress [32].
In comparison, tensile testing allows for uniaxial loading along the longitudinal axis of the specimens, which leads to clear correlations between the build direction and the mechanical properties of differently oriented specimens. To determine the monotonic properties for all three orientations, three total strain-controlled tensile tests according to DIN EN ISO 6892-1 were performed per orientation, using the D8 specimen geometry and a Zwick/Roell Z250 with a maximum force of 250 kN (zwickRoell GmbH, Ulm, Germany) testing device [35]. Based on these tests, average values and the respective standard deviations were calculated.

3. Results

3.1. Analysis of the Cell Structures

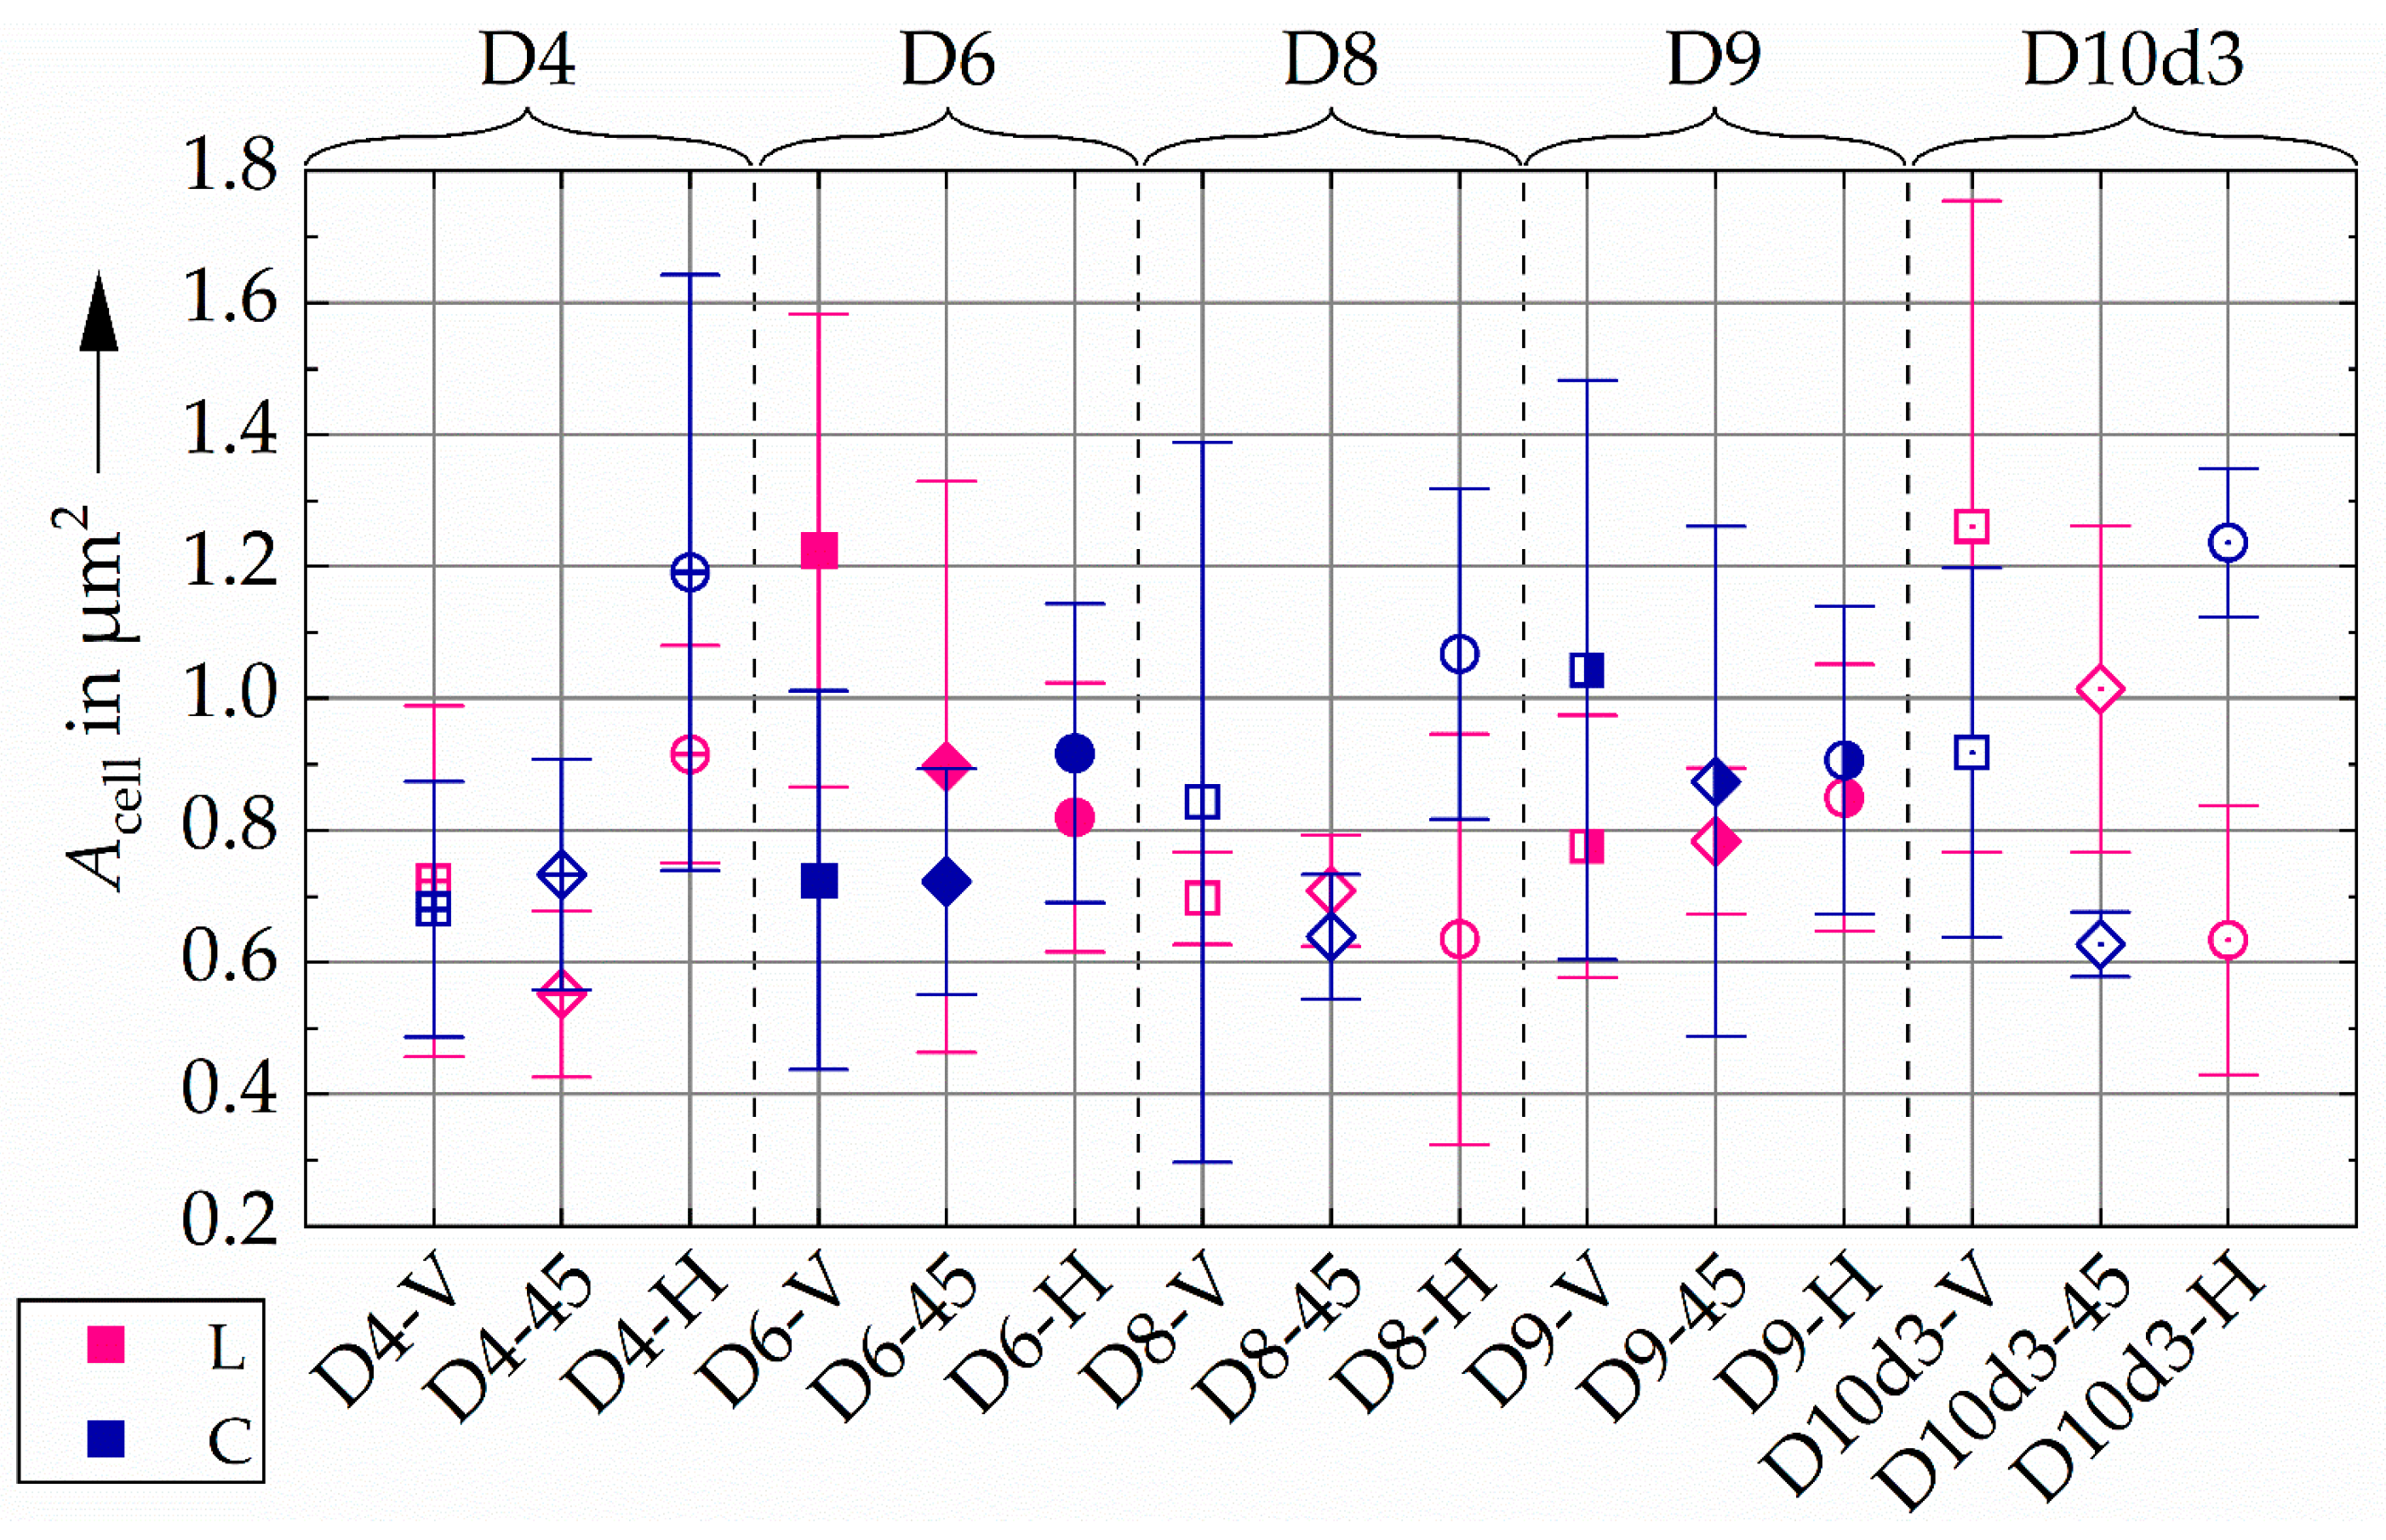
As shown in Section 2.2.2, the areas of the equiaxial cells Acell were determined for all five specimen geometries in the cross and longitudinal sections, which is summarized in Figure 7 and the values of which can be found in the supplementary materials section in Tables S4 and S5. The results obtained from the cross-sectional analysis show a slight tendency towards a larger cell size in the horizontal orientation than in the vertical one. However, this does not apply to all geometries. In this context it should be noted that since the focus is on the equiaxial cells, the influence of the scanned area within a single layer (the area of the cross section of the specimen perpendicular to the BD) of a specimen is analyzed rather than the influence of the grain elongation on cell size, if different orientations are compared. With a change in the orientation, the scanned area changes significantly, while limiting the analyses to equiaxial cells excludes the effect of grain elongation. Similarly, no clear trend in Acell with respect to the specimen geometries is observed, especially when considering the deviation between the mean values shown in Figure 7. In accordance with the results observed in the cross sections, no effects of the specimen orientation or geometry on the cell area are obtained in the longitudinal sections. Comparing Acell obtained from the cross and the longitudinal sections also reveals no systematic differences.
Generally, the average cell areas determined for the different specimens and planes vary within a certain range, showing no systematic changes. Thus, it can be concluded that the variations in heat flux caused by the different geometries and orientations used in this work are insufficient to influence the size of the equiaxial cells. Note that the specimen volume, exposure areas, and dwell time between layers varied between the different specimen types but appeared to have no significant impact on cell size in the analyzed range of manufacturing parameters.

3.2. Analysis of the Mechanical Properties Obtained with CIT

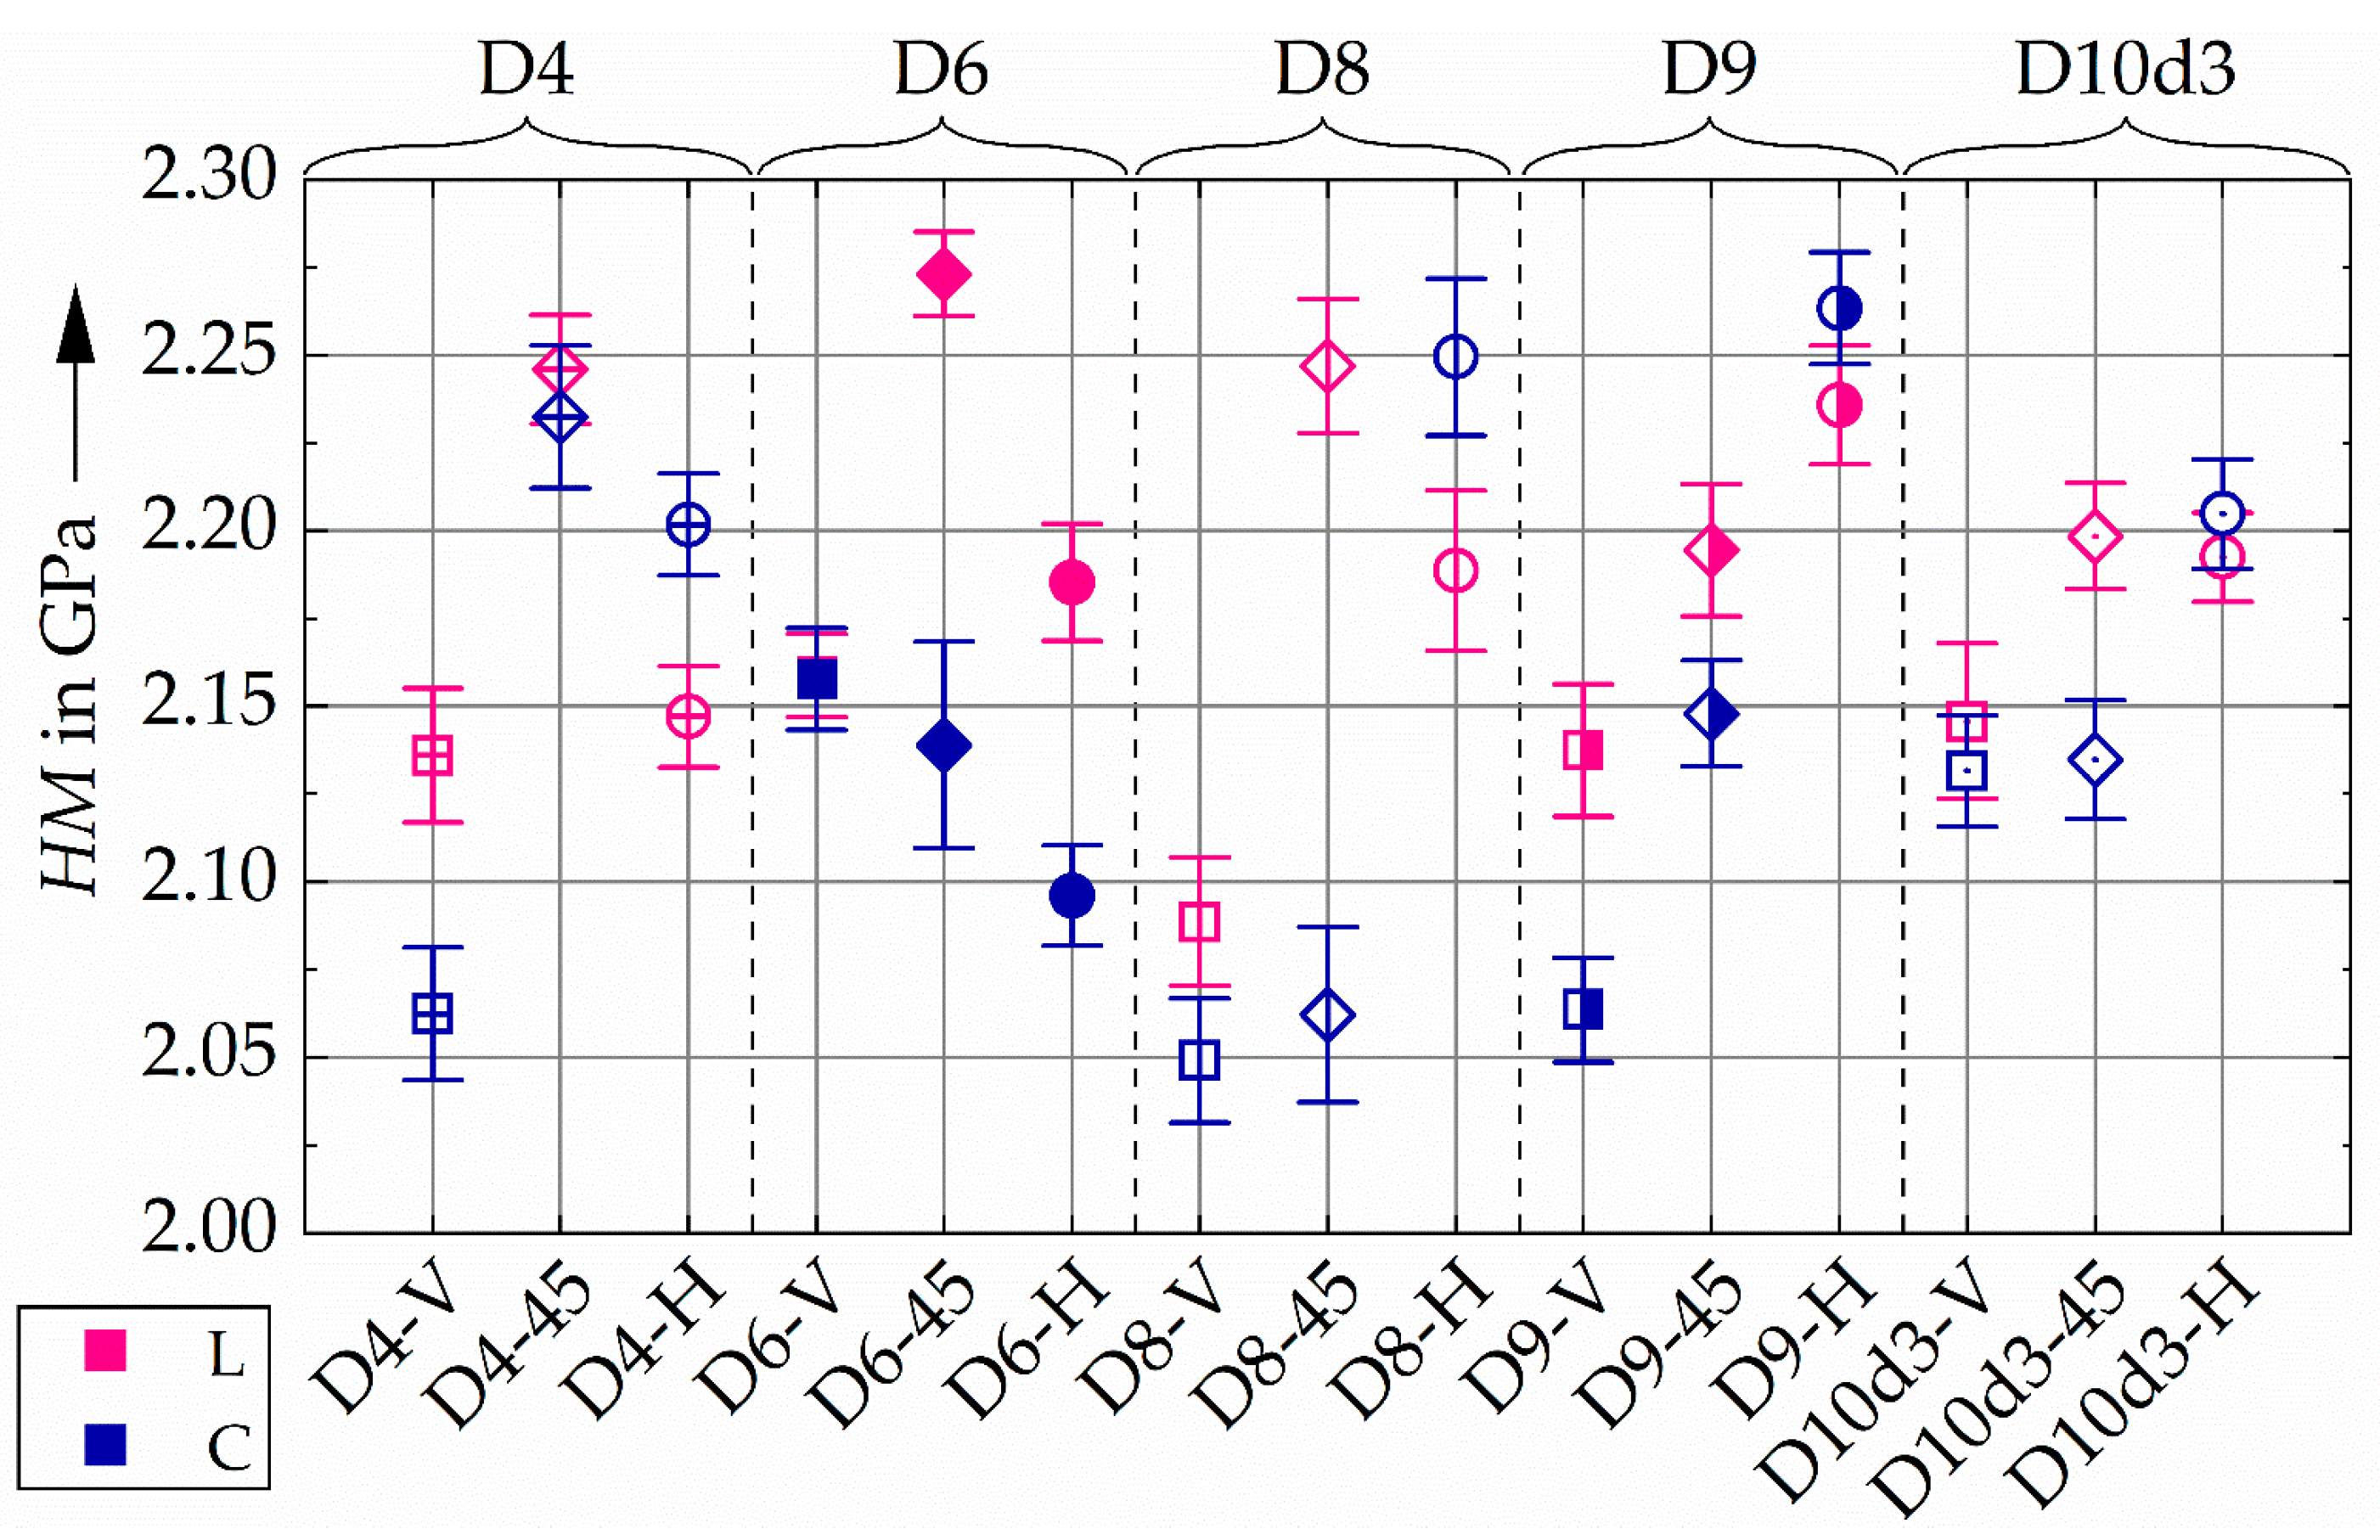
To analyze the influence of the specimen geometry and orientation on the mechanical properties, HM and |eII| were determined from the same longitudinal and cross sections used for characterizing the cell structures. The microhardness HM measured in the cross sections is higher for the horizontal than for the vertical orientation in most specimen geometries (see Figure 8). This tendency is only reversed in the D6 specimen type. For the 45° orientation, no clear trend can be observed, since this orientation leads to hardness values in the range of the V orientation in some geometries, while others fall in the HM range of the H orientation. Additionally, the D4 specimen tends to show the highest cross-sectional hardness of the 45° orientation. Considering the influence of the specimen geometry, changes in hardness levels between the different specimen types can be observed; however, these differences occur neither systematically (e.g., decreasing hardness with increasing specimen volume or vice versa) nor consistently for the orientations. For example, D4 shows the lowest HM in the V orientation, while D6 reveals a hardness minimum in the horizontal orientation. Moreover, from D4 to D6 an increase in the volume leads to a decrease in hardness for the 45° and H orientations, while a further increase in volume to D9 results in a hardness increase for these orientations, with a difference in that increase between the orientations.
The results of the longitudinal sections show higher HM in the H than the V orientation for all specimen types. However, contrary to the results obtained from the cross sections, the 45° orientation shows the highest microhardness, except for the D9 specimen geometry. Similar to the analyses of the cross sections, no consistent systematic change in HM due to the variations in specimen geometries can be observed.
Overall, the microhardness measurements reveal an influence of the specimen orientation, for both the cross and longitudinal sections. However, even if the changes observed are significant and clearly indicate differences, their extent is rather limited and not consistent between the different specimen geometries.
Considering the commonly known anisotropy that leads to higher strengths at loading perpendicular to the building direction (H orientation in tensile tests (see Section 3.3)) [3,4,5,6,7,10,11], the HM obtained from the cross and longitudinal sections should differ for each type of specimen, since the direction of maximum stress in indentation tests is along the indentation direction. Thus, the HM measured in the longitudinal sections of the V orientation should be higher than the hardness obtained in the cross sections. For the H orientation the opposite tendency would be expected, while no deviations in HM between the cross and longitudinal section are anticipated for the 45 orientations. For D4, D8, D9 and D10d3 the expectations regarding the H and V orientations can be observed, whereas for D6 the opposite of the expected trend is visible. However, in the 45° orientation, no differences between the cross and longitudinal sections are observed only for D4, while the other specimen types lead to higher HM in the longitudinal sections. This underlines that the measurements obtained in CIT cannot detect the influence of orientation on tensile strength, which will be discussed in more detail in Section 4.
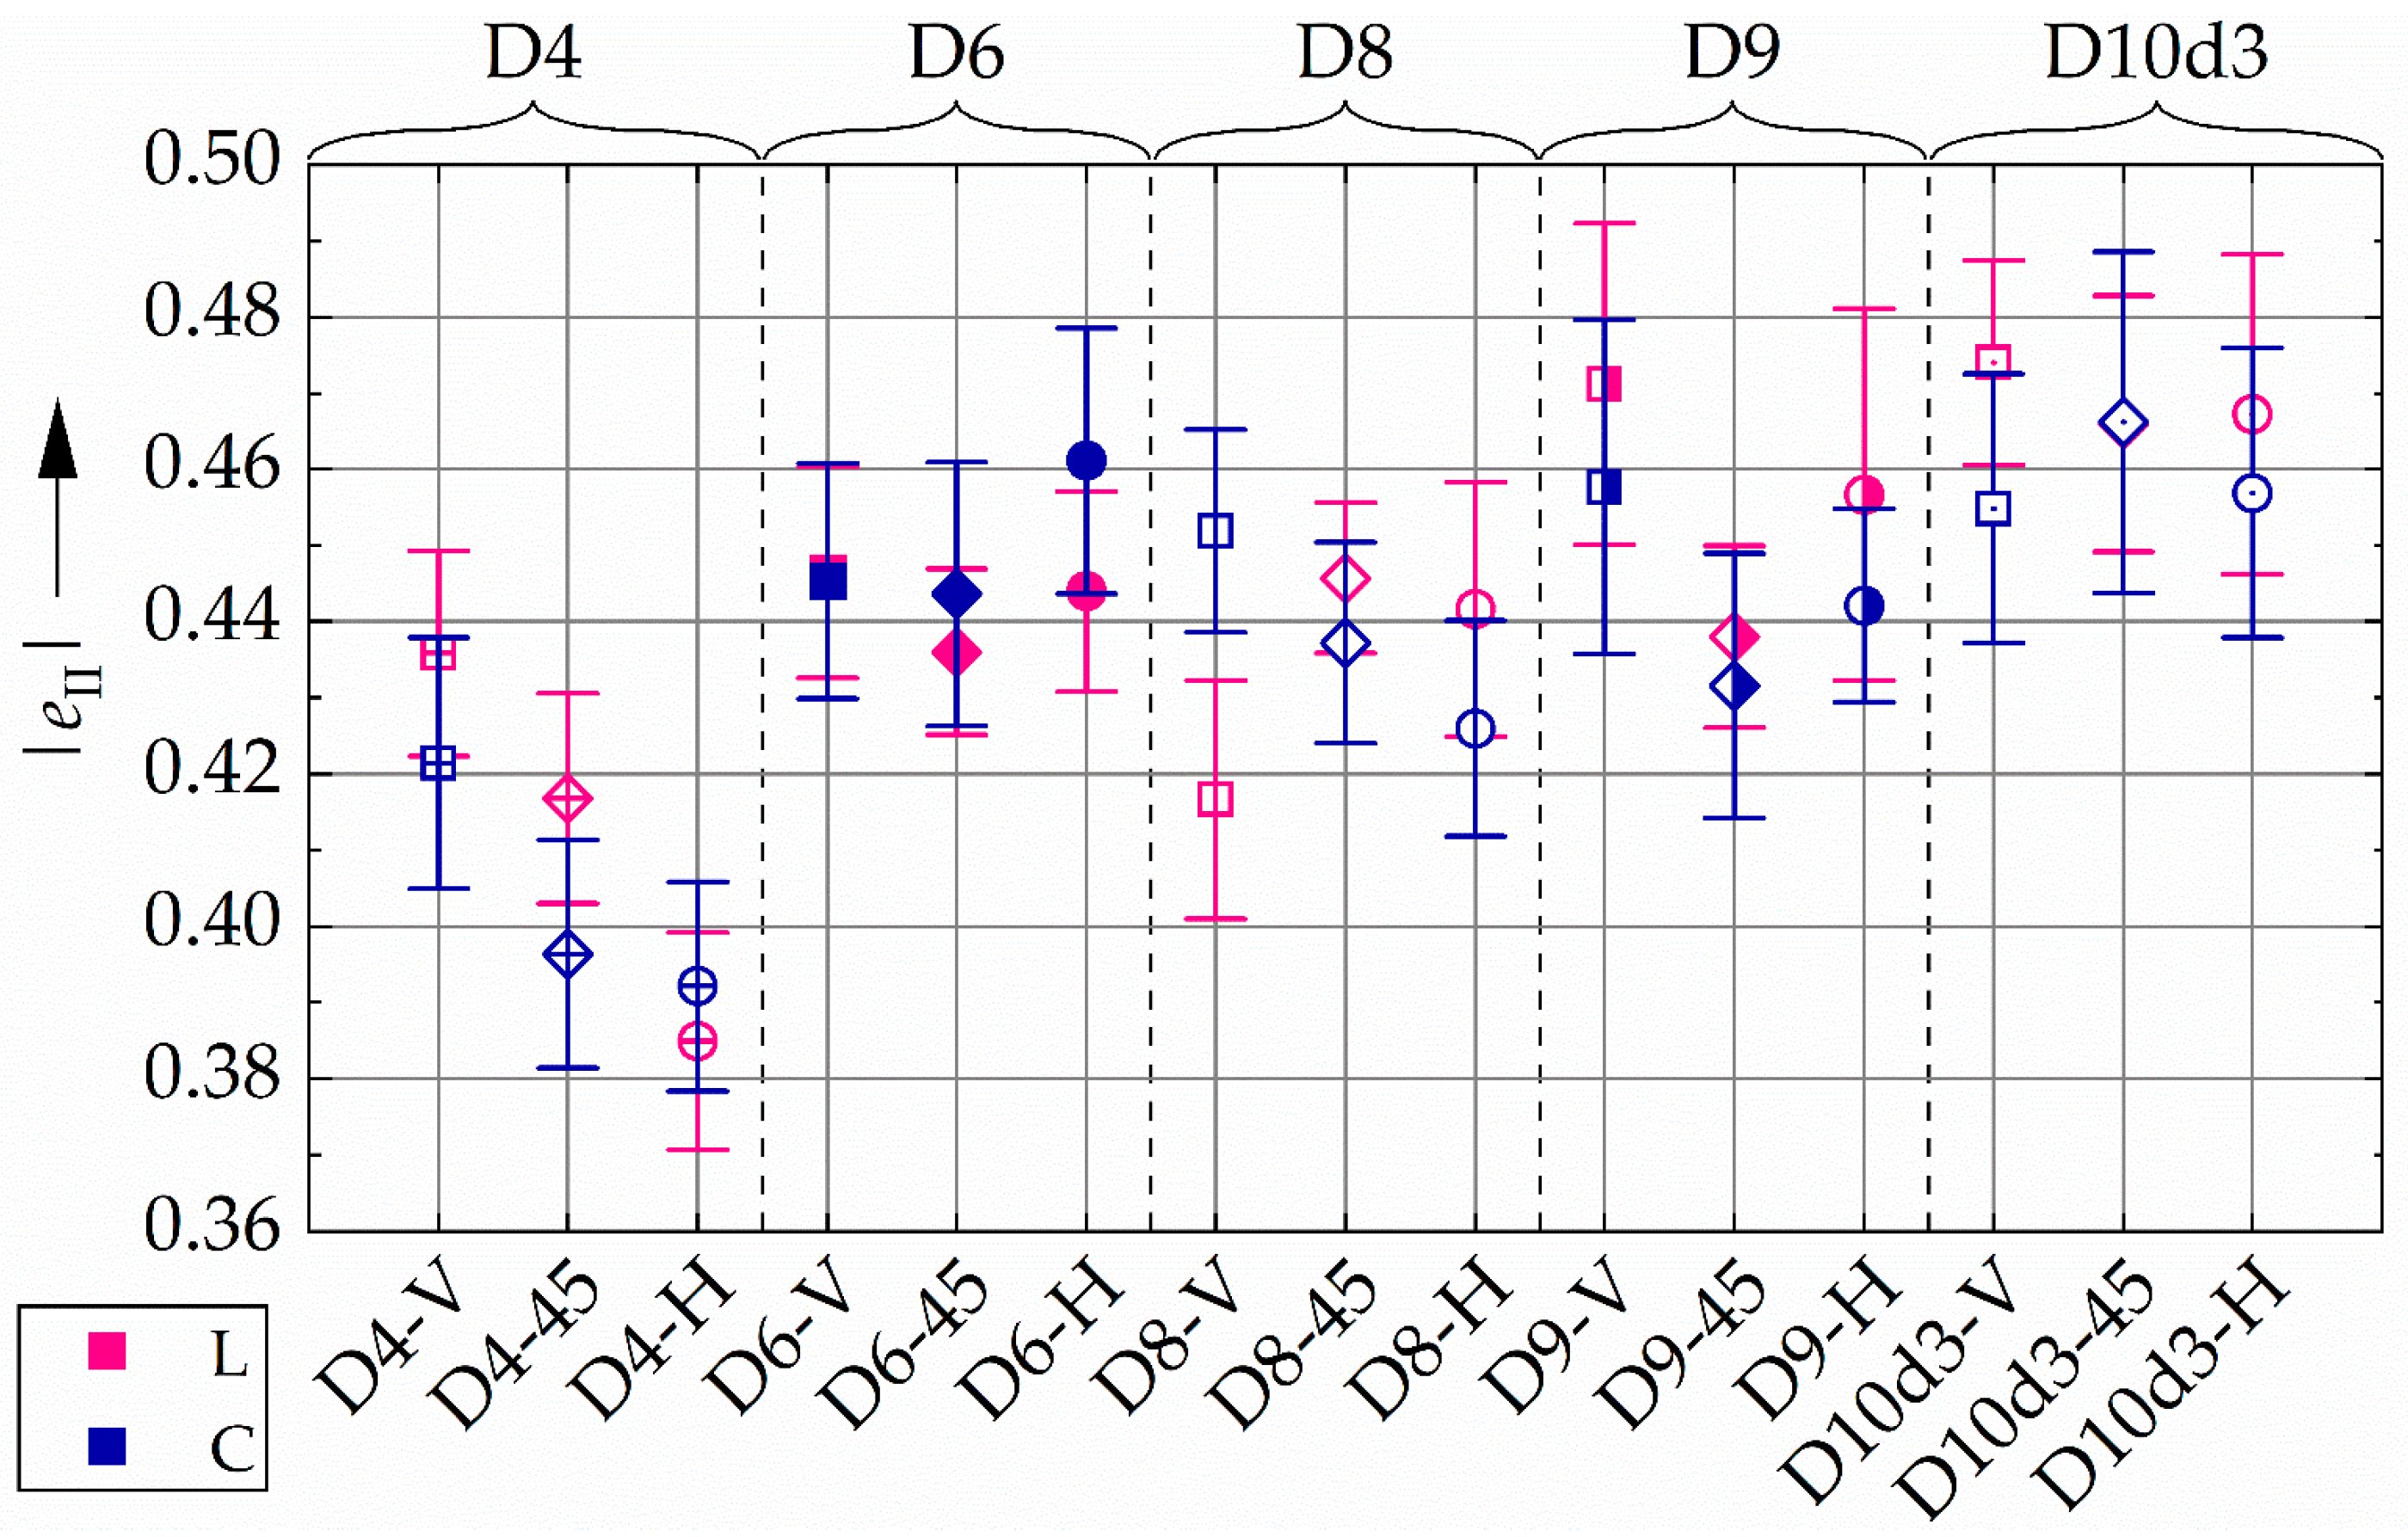
In Figure 9, the |eII| obtained for all specimen geometries and orientations are illustrated. For both cross and longitudinal sections, only small changes, all within the confidence intervals, can be seen between the orientations of each geometry type as well as between the different geometries. An influence of the orientation and a significant deviation in relation to the other specimen geometries is only visible for D4.
Compared to the other more voluminous specimen types, D4 shows the smallest |eII|, which decreases from the V to the 45° to the H orientation. However, this anisotropic mechanical behavior is related to the orientation of the specimen during manufacturing and not to the orientation of the load direction with respect to the building direction, since the deviations observed between the cross and the longitudinal section for the different orientations are negligible. A potential reason for this is the much smaller volume in the gauge length as well as the larger differences in the scanned area within a layer between the different specimen orientations. The latter is expected to lead to a faster cooling rate for the V orientation and smaller |eII|. In the bigger specimens this difference might be less relevant, since a potentially critical area size is reached. There could exist a possible specimen volume limit above which the cyclic hardening exponentCHT stays the same and below which it is affected. However, this needs to be investigated in further work and cannot be finally concluded based on the present results.
Examining the results of HM and |eII|, more pronounced deviations are shown in the hardness than in the cyclic hardening potential. While the hardness measurements reveal deviations between the conditions, |eII| only shows changes between the orientations of the smallest specimen geometry. However, no systematic influence of the specimen size and orientation as well as the sample plane used for CIT on the mechanical measurements was observed, indicating similar micromechanical properties across the investigated range of specimen sizes.

3.3. Monotonic Mechanical Properties

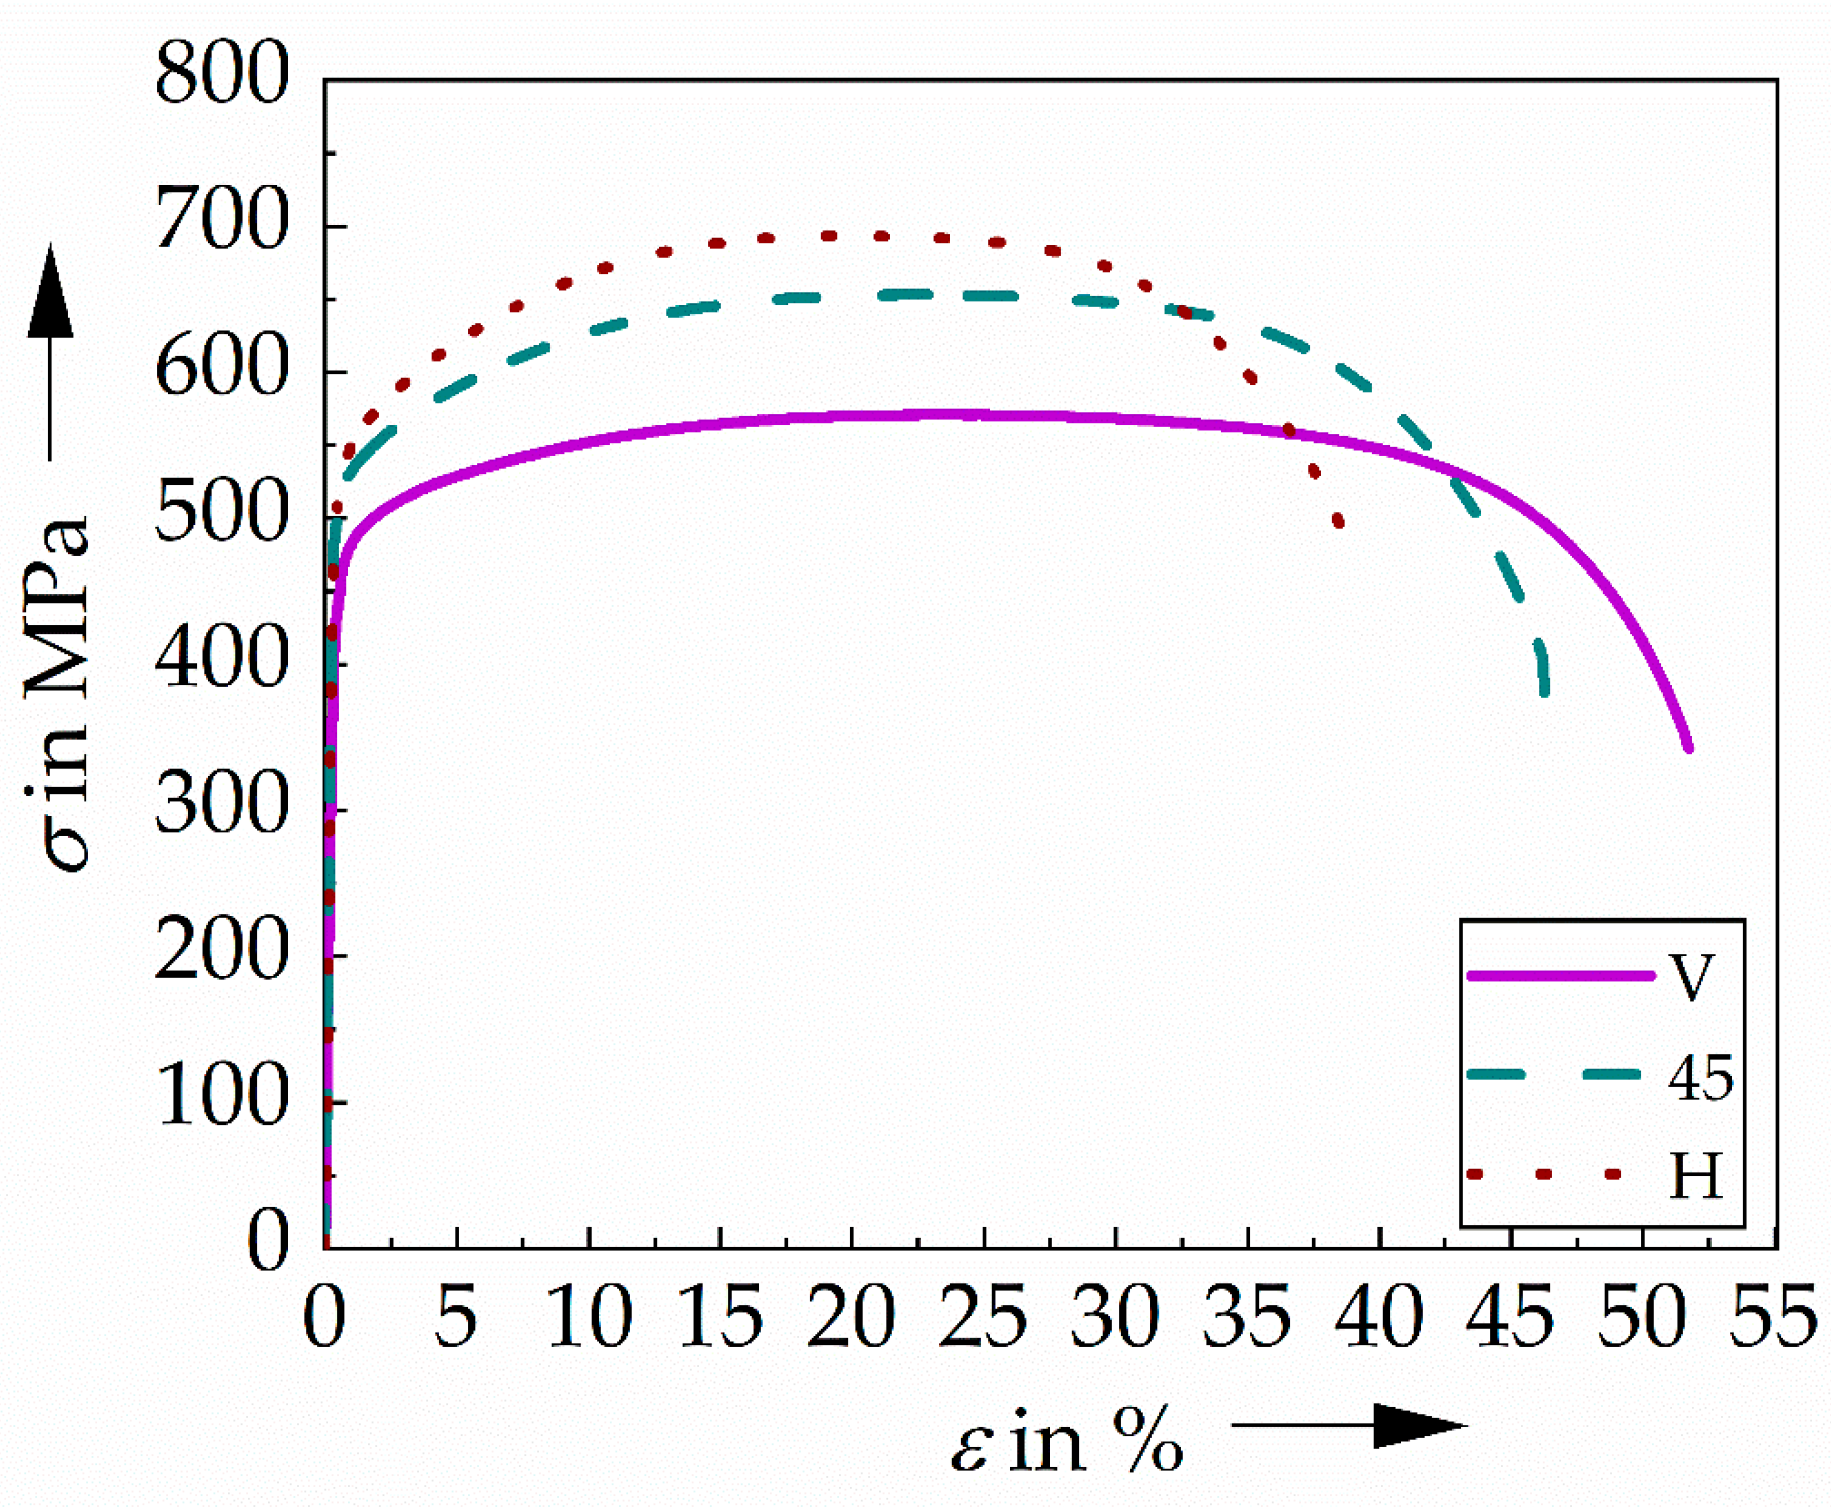
To analyze the influence of the specimen orientation on a bigger scale and, thus, on the macroscopic mechanical properties, tensile tests were performed on the D8 specimen geometry. The resulting stress-strain curves (σ-ε curves) shown in Figure 10 clearly reveal an anisotropy in the monotonic properties. Moreover, the ultimate tensile strength (Rm), 0.2% yield strength (Rp0.2), elongation at fracture (A), and Young’s modulus were determined, which are given in Table 4.
The results obtained in the tensile tests show that the V orientation has a lower strength (Rm and Rp0.2) and E as well as a higher A than the H oriented specimens, while the 45 orientation exhibit values between the other orientations. This anisotropy in the monotonic mechanical properties is commonly attributed to grain elongation and the layer arrangement with respect to the loading direction [6,8,10,11,13,30,36]. However, these microstructural features only influence plastic deformation and thus, the difference in E must result from another feature, i.e., texture, since the elastic modulus in CrNi steels strongly depends on grain orientation [3,10,30,31]. The textures shown in Figure 4j–l reveal a preferred grain orientation for V specimens in [101] and a lower E, while the H orientation showed a slight [001] preferred crystallographic orientation with a higher Young’s modulus. This can also be seen in the Young’s modulus calculations based on the crystallographic orientations EE given in Table 3: the V orientation reveals a significantly lower EE than the other orientations. However, for the other orientations EE indicates a higher stiffness for the 45° orientation, contrasting with the results obtained in the tensile tests. In this context it should be noted that the [101] texture observed in the V orientation is the strongest and the other orientations show only a weak texture, which might not be representative for E of these orientations. Thus, the smaller E obtained in the tensile tests at vertically orientated specimens is assumed to be caused by the [101] preferred crystallographic orientation. However, since the textures measured are relatively weak, only slight deviations in E obtained in the tensile tests are observed.

4. Discussion

Since the mechanical properties shown in Section 3.2 and Section 3.3 must be related to microstructural features, their correlation with the cell size discussed in Section 3.1 was analyzed. Considering the cyclic hardening potential, represented by |eII|, only differences depending on the specimen orientation can be observed for the D4 specimens, i.e., a decrease in |eII| from the vertical to the 45° to the horizontal orientation. In correlation to this, a general increase in Acell can be observed in the longitudinal and cross sections (the only exception is the longitudinal section of the 45° orientation), which is reasonable since the scanned area increases from V to 45 to H orientation, leading to slower cooling rates. However, considering the statistical deviation, these tendencies are weak and require a bigger database for reliable conclusions. Moreover, these correlating trends between Acell and |eII| of the D4 specimens are not shown in HM, which also disables a clear conclusion.
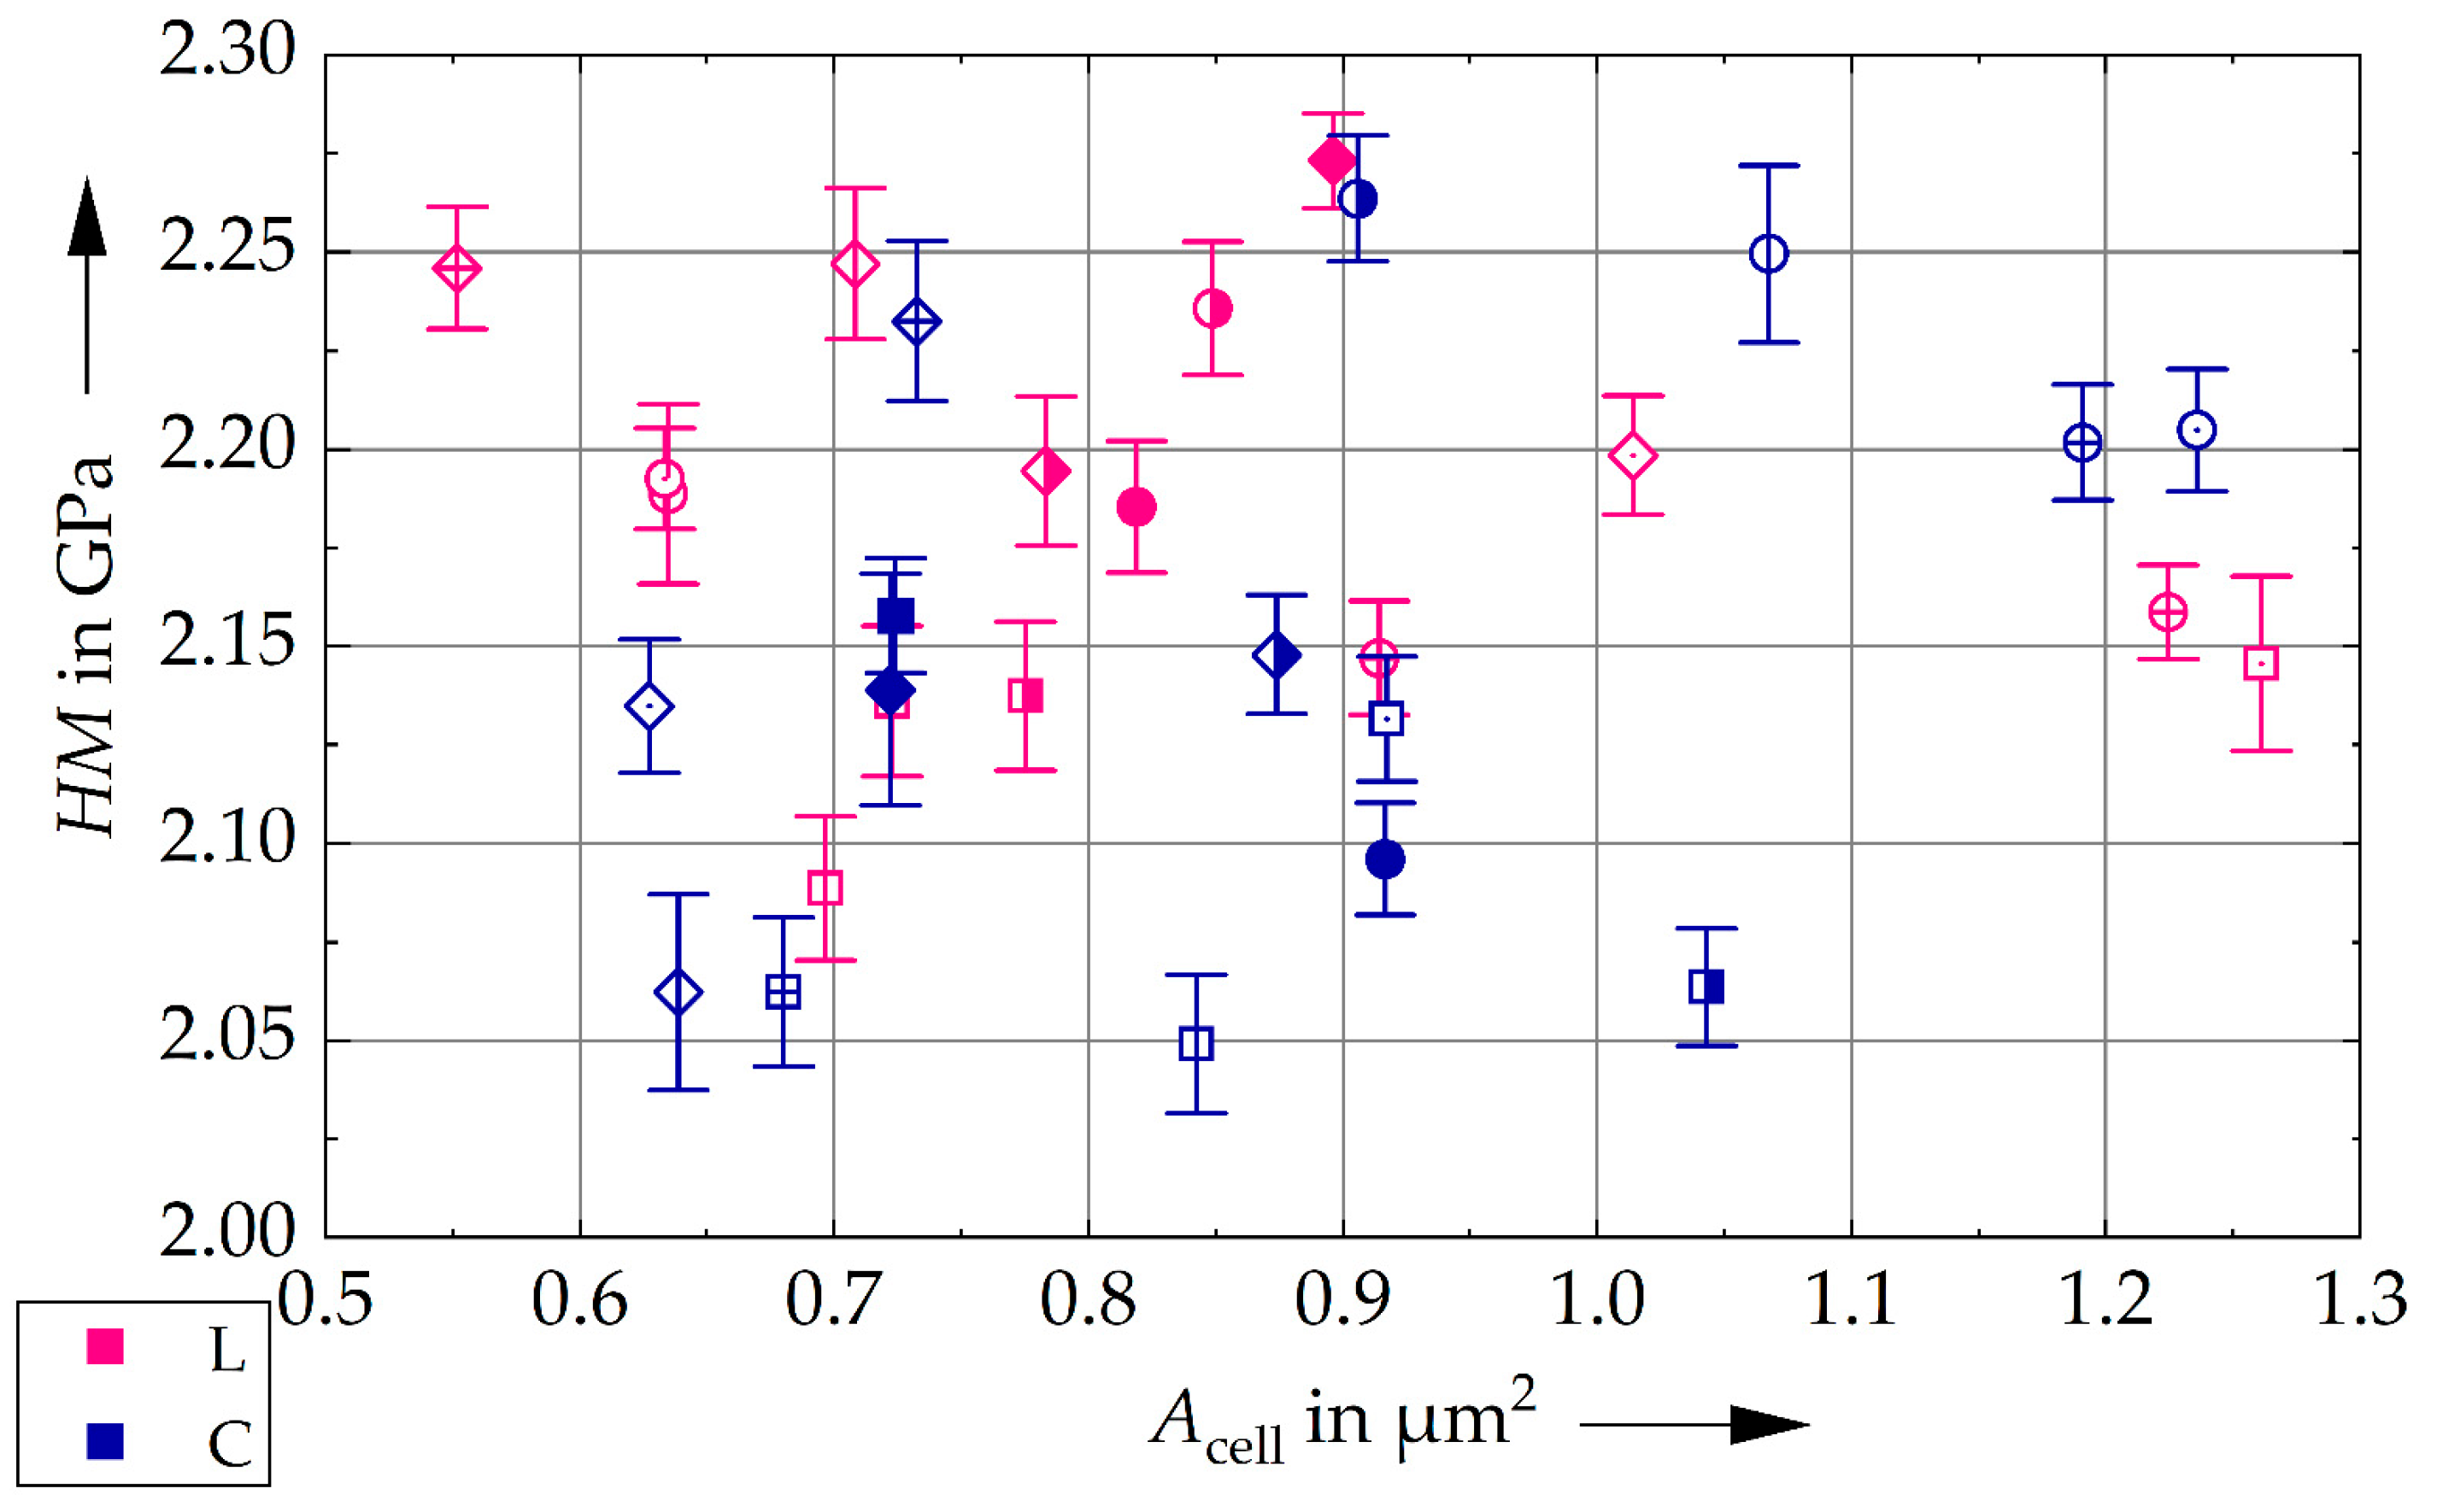
For the other geometries |eII| does not show any trends with changing orientation or specimen size and hence, in the following only HM is compared with Acell. Although HM shows no systematic changes in dependency with the specimen size and orientation, a correlation with Acell might be possible. Hence, HM is plotted vs. Acell in Figure 11. As shown in Figure 11, no correlation between either measurements can be observed. This becomes especially clear for the D9 specimen: here, HM increases from V to 45 to H orientation in both the longitudinal and the cross section, while Acell is nearly constant for all orientations and sectional planes.
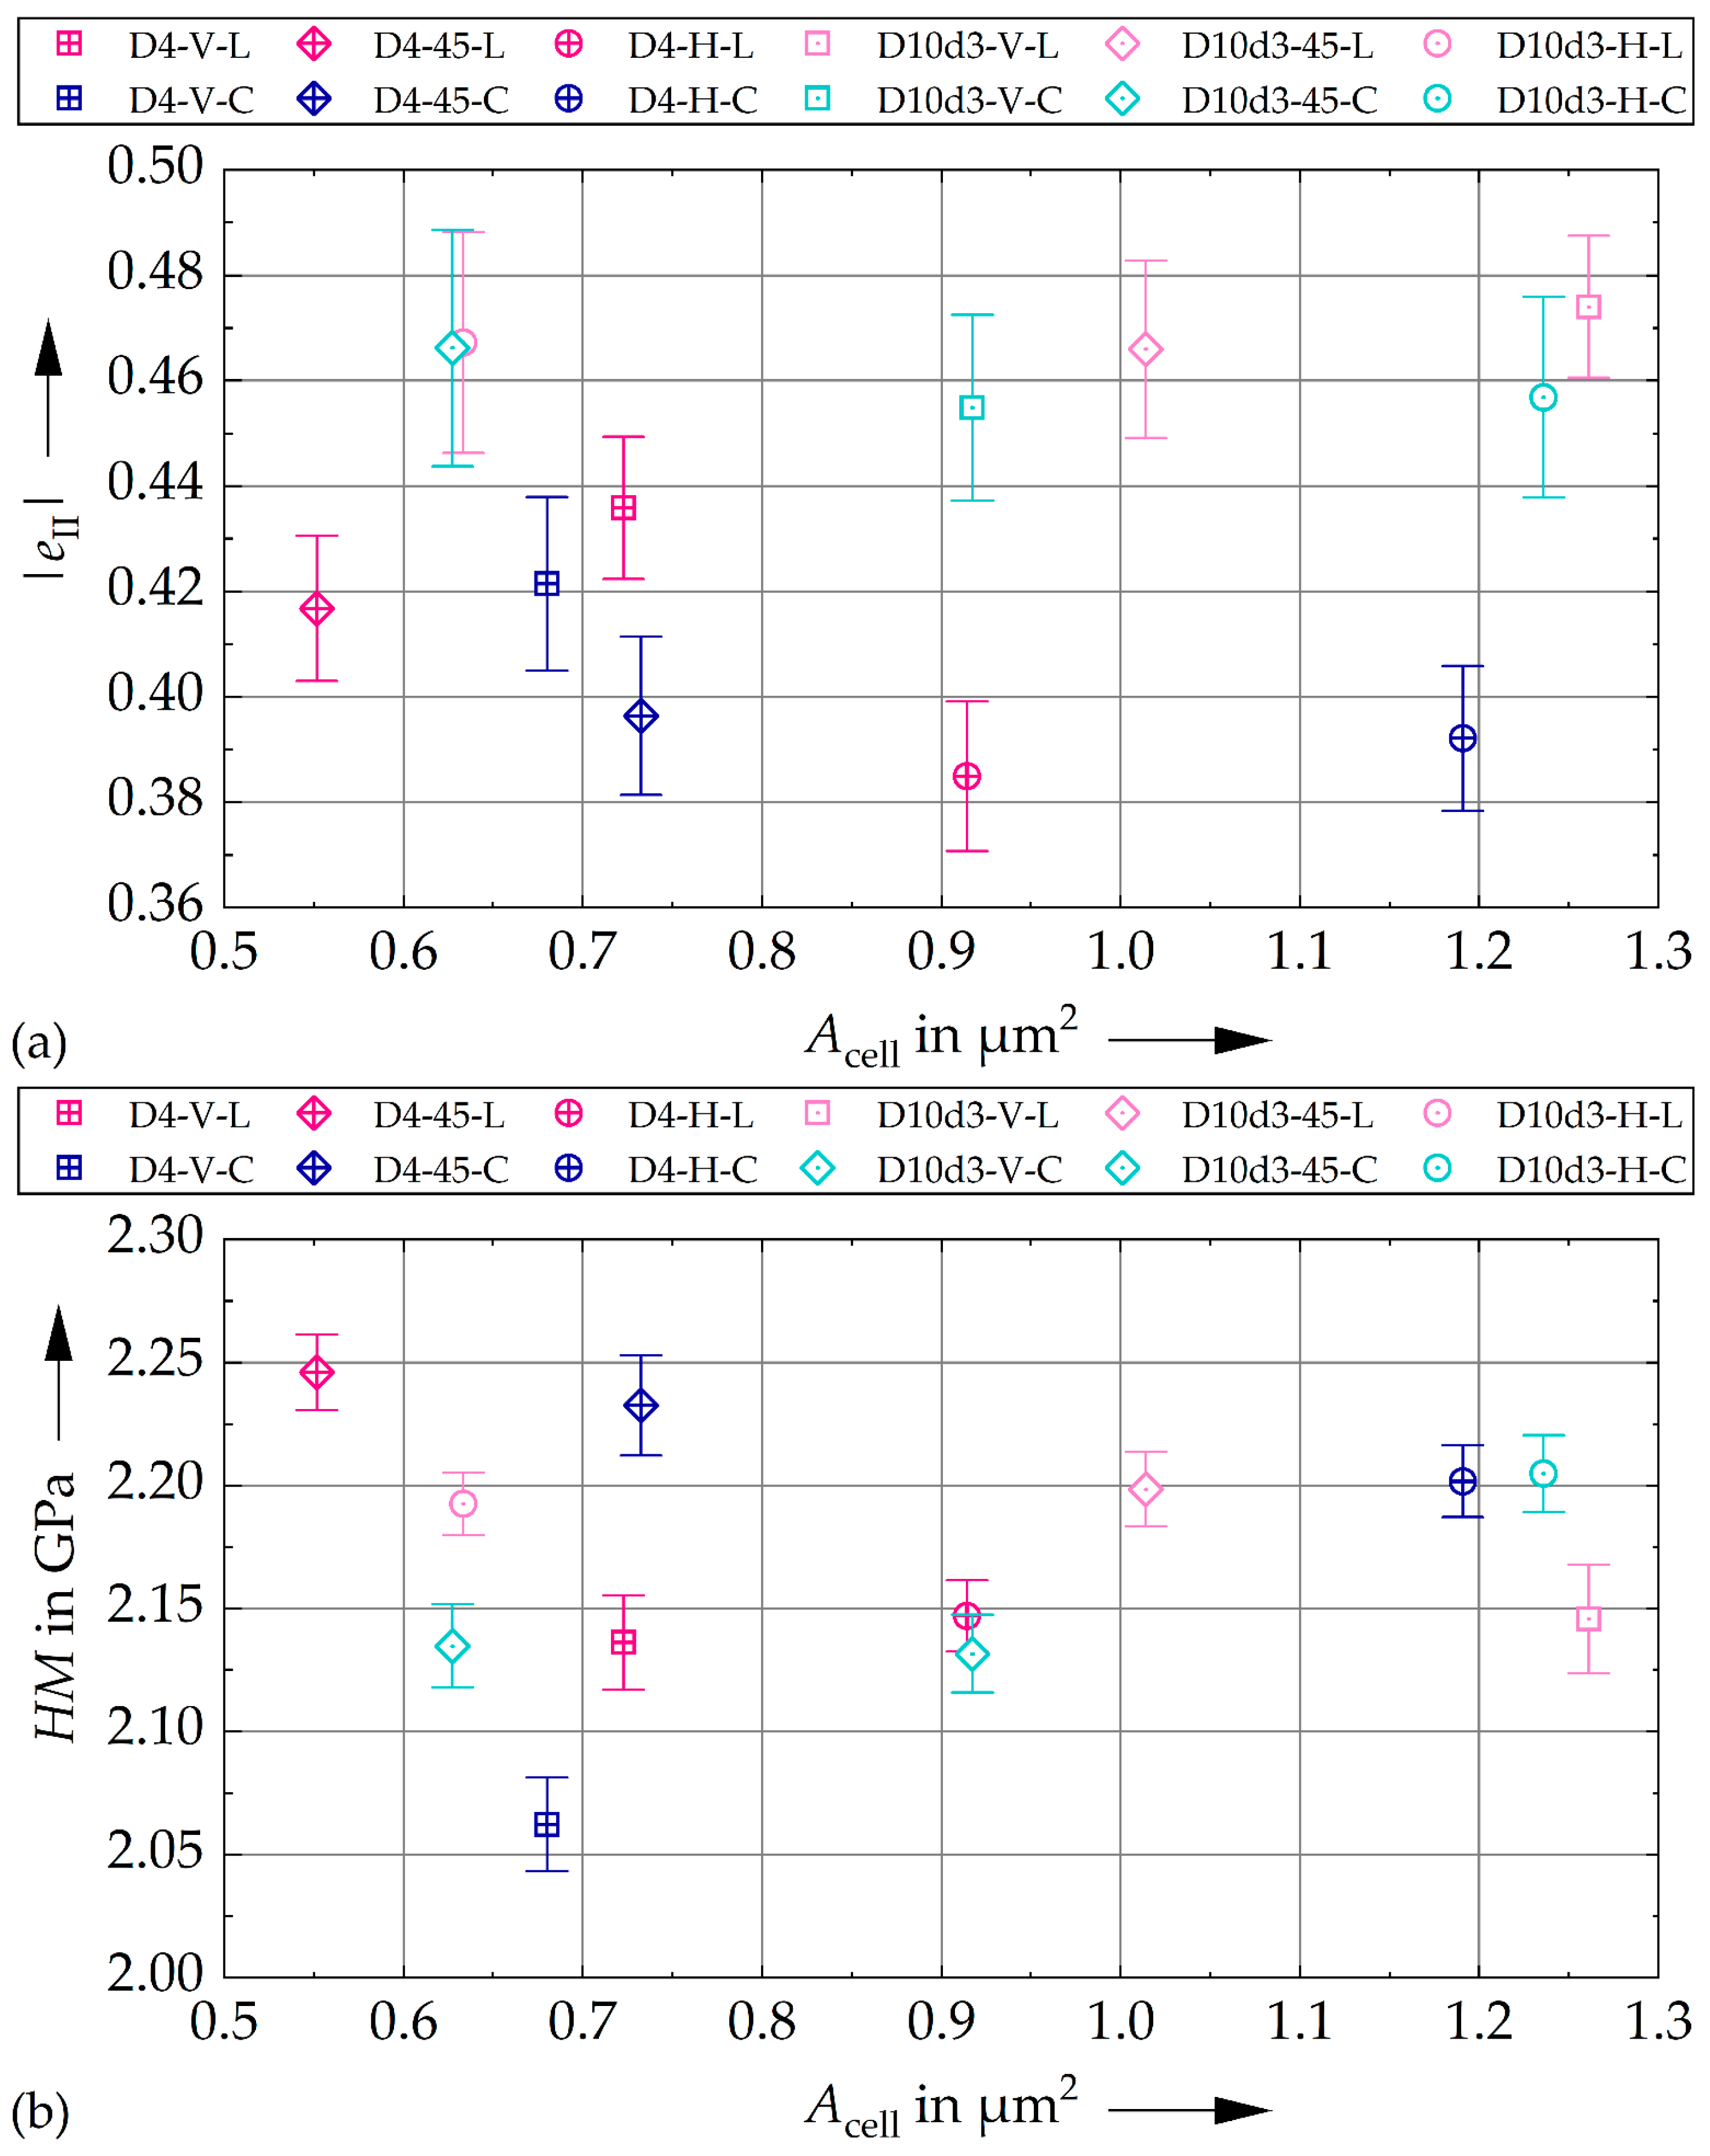
For a clearer visualization that no strong correlations between the cell area and the mechanical properties occur for the specimen sizes considered in this work, the mechanical properties HM and |eII| are plotted against Acell for only the smallest and largest specimen geometries in Figure 12a,b. While higher and less scattered |eII| can be seen for D10d3 in Figure 12a, this trend is independent of the orientation and cannot be observed for HM in Figure 12b. Therefore, Figure 12 also reveals that there is no relationship between the mechanical properties and the cell size with respect to the specimen orientation, underlining the conclusion made above.
However, from literature it is well-known that the cell size has an impact on the mechanical properties [7,10,14,15,16,17,20]. Consequently, it is concluded that the mechanical properties obtained in this work are not only determined by the cell structure, but by other microstructural features. One possible feature is the texture shown in Figure 3 and Figure 4 [8,10,14,20,24]. However, considering the results obtained for D9, the texture does not explain the changes in HM: if the texture were the sole reason for the changes in HM from V to 45° to H orientation, different trends should be observed in the longitudinal and the cross sections, as the main load direction in relation to the crystallographic orientation changes and since the textures between L and C are different. In this context it must be considered that multiaxial stresses occur beneath the indenter, limiting the resolution of orientation-dependent properties. In summary, neither the texture nor Acell can be used to explain the changes in HM.
Additionally, other microstructural features, which are known to be relevant from literature, must be considered, i.e., variations in the dislocation density [17,18,20,22] as well as differences in the dislocation arrangement [2,12,14,15,16,17,18,20,22,23], and elemental segregation [12,14,17,18,20,22,23] within the cell structures. The lack of systematic correlation between Acell and the mechanical properties (Figure 11 and Figure 12) is assumed to result from a superimposed influence of these microstructural features with the cell structure and the texture.
Further microstructural features occurring on a larger scale are the layer boundaries and the grain structure, i.e., the elongation along the building direction. Since the indents that result from CIT have a diagonal of approximately 30 µm, they cannot reflect the interaction between the plastic deformation behavior and these microstructural features. Hence, the results obtained in tensile tests using the D8 specimen geometry must be considered to determine the microstructural reasons for mechanical anisotropy. In the D8 specimens nearly no differences in Acell between the V, 45 and H orientations are observed in the longitudinal sections. In the cross sections, the H orientation reveals a slightly larger Acell, which is however accompanied by a relatively high scatter. Consequently, the pronounced anisotropy in the properties obtained in the tensile tests are not caused by changes in the size of the intragranular cell structure. Since only a slight texture, which differs between the orientations, is observed in the D8 specimen geometry, the strong anisotropy cannot be explained solely by this microstructural feature. As the properties related to plastic deformation differ stronger than E, other microstructural features are assumed to influence the anisotropy. Hence, the grain elongation and arrangement of the layer boundaries are expected to be the main factors for the anisotropy obtained in tensile tests. Additionally, variations in the dislocation density within the cell interiors and walls as well as elemental segregation at the cell boundaries may also have an impact on the anisotropy observed in tensile tests [10,11]. However, since the cyclic hardening potential |eII| varies only slightly, no substantial changes in the dislocation density and segregation effects are expected.
Note that the effects based on the elemental segregation as well as dislocation density and arrangement are influenced by the stress-relief heat treatment applied (650 °C for 2 h). Moreover, this kind of heat treatment has a minimal effect on the cell sizes and thus a slight impact on the mechanical properties [4,15,16,17,19,20]. Consequently, the stress-relief heat treatment might decrease the differences between the different geometries, which must be considered in the interpretation of the results presented. In this context lower temperatures have shown less reduction in the cell sizes and a slight change in the mechanical properties (i.e., tensile and yield strengths) while temperatures starting at 800 °C tend to cause a dispersion of the cell structure (diffusion in the segregated elements and a reduction in the dislocation density), decreasing the mechanical strength [15,16,17,19,20].

5. Conclusions

In the presented work, the influence of the geometry and the orientation on the grain structure, the characteristics of the intergranular cell structure, and the resulting mechanical properties of AISI 316L manufactured via Laser Powder Bed Fusion (PBF-LB/M) were investigated. Therefore, different specimen geometries were realized in three orientations of the longitudinal/load axis to the building direction, i.e., parallel (V), perpendicular (H), and 45° (45). Moreover, the resulting cell structures were examined using SEM analyses, while the mechanical properties were determined through CIT and tensile tests. Additionally, EBSD analyses of the grain orientation were performed. The results obtained in this work lead to the following conclusions:
•
The specimen geometry/size was found to have no significant impact on the average cell area Acell and the cyclic hardening potential (represented by |eII|) obtained in both sectional planes, either parallel or perpendicular to the direction of the applied load.
•
Similarly, the orientation of the specimen with respect to the building direction was identified to have little to no impact on the Acell and |eII| obtained in the cross and longitudinal sectional planes.
•
HM was found to vary significantly, but not in accordance with either the specimen size or orientation.
•
The specimen geometry and size were found to have an influence on the intensity of the texture, however not a systematic one. Only for the vertical orientation a consistent [101] texture was obtained along the building direction, becoming more pronounced with increasing scanned cross-sectional size.
•
No correlations between the changes in HM and Acell or the texture were observed for the specimen geometries and orientations. Hence it is assumed that a superimposition of these and other microstructural features (e.g., dislocation density, segregation at the cell walls) led to the variations in hardness.
•
The cell size was determined to be identical in the tensile specimens and thus to have no impact on the anisotropy seen in the tensile tests. In contrast, the differences in the texture showed a correlation with the changes in the determined Young’s modulus, which, however, cannot explain the pronounced anisotropy in elastic–plastic deformation. Hence, other microstructural features, especially the grain elongation and layer boundary arrangement, are assumed to have a strong impact on the anisotropy seen in the tensile tests.
The conclusions made are limited to the specimen sizes/geometries considered in this work. For much larger and smaller volumes other influences on the cell structure may occur, which is supported by the results obtained for the smallest specimen geometry (D4), showing slightly different trends. However, the specimens studied in this work consist of a relatively wide range of sizes, including hollow samples, which all show no significant influence of the specimen geometry on HM, Acell, and |eII|, being relevant for other studies that use different specimen geometries within the range investigated in this work. In this context it should be noted that the specimens analyzed in this work were heat-treated (650 °C, 2 h), which only slightly influences the cell structures [4,15,16,17,19,20].

Supplementary Materials

The following supporting information can be downloaded at: https://www.mdpi.com/article/10.3390/met16060636/s1, Table S1: Orientation distribution function (ODF) of the D8 specimen geometry and vertical orientation, Table S2: Orientation distribution function (ODF) of the D8 specimen geometry and 45° orientation, Table S3: Orientation distribution function (ODF) of the D8 specimen geometry and horizontal orientation, Table S4: Analysis of the longitudinal sections of all specimen geometries and orientations, and Table S5: Analysis of the cross sections of all specimen geometries and orientations.

Author Contributions

Conceptualization, P.R. and B.B.; methodology, P.R. and B.B.; investigation, P.R. and A.W.; resources, B.B., T.B., and R.T.; data curation, P.R.; writing—original draft preparation, P.R.; writing—review and editing, B.B., T.B., A.W., and R.T.; visualization, P.R.; supervision, B.B., T.B., and R.T.; project administration, B.B., T.B., and R.T.; funding acquisition, B.B., T.B., and R.T. All authors have read and agreed to the published version of the manuscript.

Funding

This research was funded by the German Research Foundation, DFG, grant number 505646807 (https://gepris.dfg.de/gepris/projekt/505646807).

Data Availability Statement

The original contributions presented in this study are included in the article/Supplementary Materials. Further inquiries can be directed to the corresponding author.

Acknowledgments

The authors would like to thank the technical staff and research assistants who made this publication possible.

Conflicts of Interest

The authors declare no conflicts of interest.

Abbreviations

The following abbreviations are used in this manuscript:
4545° orientation of the specimen
Aelongation at fracture
aminor ellipse axis
Acellaverage cell area (aka cell size)
aIIcoefficient of the power law function ha,pII
ALDparallel to or along the loading direction
AMadditive manufacturing
bmajor ellipse axis
BDbuilding direction
Ccross section
C11monocrystal elastic constant
C12monocrystal elastic constant
C44monocrystal elastic constant
CITcyclic indentation tests
D4specimen geometry with a diameter of 4 mm in the gauge length 
D6specimen geometry with a diameter of 6 mm in the gauge length 
D8specimen geometry with a diameter of 8 mm in the gauge length 
D9specimen geometry with a diameter of 9 mm in the gauge length 
D10d3specimen geometry with an outer diameter of 10 mm and an inner diameter of 3 mm in the gauge length
EYoung’s modulus
εstrain
EEYoung’s modulus calculated using Euler angles and elastic constants
eIIcyclic hardening exponent
EBSDelectron backscatter diffraction
Findentation force
ffrequency
Fmaxmaximum indentation force
Hhorizontal orientation of the specimen
hindentation depth
ha,pplastic indentation depth amplitude
hdhatch distance
HMMarten’s hardness (microhardness)
Llongitudinal section
Nnumber of cycles
ODForientation distribution function
OPAoxide polishing alumina
PBF-LB/MLaser Powder Bed Fusion
ΦBunge Euler angle
φ1Bunge Euler angle
φ2Bunge Euler angle
PLlaser power
PLDperpendicular to the loading direction 
Rmultimate tensile strength
Rp0.20.2% yield strength
σstress
SEMscanning electron microscope
Vvertical orientation of the specimen
vscanning speed

References

  1. Gibson, I.; Rosen, D.; Stucker, B.; Khorasani, M. Additive Manufacturing Technologies; Springer International Publishing: Cham, Switzerland, 2021. [Google Scholar]
  2. Zhou, B.; Xu, P.; Li, W.; Liang, Y.; Liang, Y. Microstructure and Anisotropy of the Mechanical Properties of 316L Stainless Steel Fabricated by Selective Laser Melting. Metals 2021, 11, 775. [Google Scholar] [CrossRef] [Scilit]
  3. Charmi, A.; Falkenberg, R.; Ávila, L.; Mohr, G.; Sommer, K.; Ulbricht, A.; Sprengel, M.; Neumann, R.S.; Skrotzki, B.; Evans, A. Mechanical anisotropy of additively manufactured stainless steel 316L: An experimental and numerical study. Mater. Sci. Eng. A 2021, 799, 140154. [Google Scholar] [CrossRef] [Scilit]
  4. Pitrmuc, Z.; Šimota, J.; Beránek, L.; Mikeš, P.; Andronov, V.; Sommer, J.; Holešovský, F. Mechanical and Microstructural Anisotropy of Laser Powder Bed Fusion 316L Stainless Steel. Materials 2022, 15, 551. [Google Scholar] [CrossRef] [Scilit]
  5. Blinn, B.; Klein, M.; Gläßner, C.; Smaga, M.; Aurich, J.; Beck, T. An Investigation of the Microstructure and Fatigue Behavior of Additively Manufactured AISI 316L Stainless Steel with Regard to the Influence of Heat Treatment. Metals 2018, 8, 220. [Google Scholar] [CrossRef] [Scilit]
  6. Deev, A.A.; Kuznetcov, P.A.; Petrov, S.N. Anisotropy of Mechanical Properties and its Correlation with the Structure of the Stainless Steel 316L Produced by the SLM Method. Phys. Procedia 2016, 83, 789–796. [Google Scholar] [CrossRef] [Scilit]
  7. Alsalla, H.H.; Smith, C.; Hao, L. Effect of build orientation on the surface quality, microstructure and mechanical properties of selective laser melting 316L stainless steel. Rapid Prototyp. J. 2018, 24, 9–17. [Google Scholar] [CrossRef] [Scilit]
  8. Casati, R.; Lemke, J.; Vedani, M. Microstructure and Fracture Behavior of 316L Austenitic Stainless Steel Produced by Selective Laser Melting. J. Mater. Sci. Technol. 2016, 32, 738–744. [Google Scholar] [CrossRef] [Scilit]
  9. Fu, J.; Qu, S.; Ding, J.; Song, X.; Fu, M.W. Comparison of the microstructure, mechanical properties and distortion of stainless steel 316 L fabricated by micro and conventional laser powder bed fusion. Addit. Manuf. 2021, 44, 102067. [Google Scholar] [CrossRef] [Scilit]
  10. Siriraksophon, K.; Vajragupta, N.; Uthaisangsuk, V. Anisotropic plasticity and damage of additively manufactured 316L stainless steel by multiscale approach. Mech. Mater. 2026, 212, 105509. [Google Scholar] [CrossRef] [Scilit]
  11. Ahn, S.Y.; Kim, E.S.; Karthik, G.M.; Ramkumar, K.R.; Jeong, S.G.; Kim, R.E.; Gu, G.H.; Kim, H.S. Thickness effect on the microstructures, mechanical properties, and anisotropy of laser-powder bed fusion processed 316L stainless steel. J. Mater. Sci. 2022, 57, 18101–18117. [Google Scholar] [CrossRef] [Scilit]
  12. Zhong, Y.; Liu, L.; Wikman, S.; Cui, D.; Shen, Z. Intragranular cellular segregation network structure strengthening 316L stainless steel prepared by selective laser melting. J. Nucl. Mater. 2016, 470, 170–178. [Google Scholar] [CrossRef] [Scilit]
  13. Hao, L.; Dadbakhsh, S.; Seaman, O.; Felstead, M. Selective laser melting of a stainless steel and hydroxyapatite composite for load-bearing implant development. J. Mater. Process. Technol. 2009, 209, 5793–5801. [Google Scholar] [CrossRef] [Scilit]
  14. Wang, Y.M.; Voisin, T.; McKeown, J.T.; Ye, J.; Calta, N.P.; Li, Z.; Zeng, Z.; Zhang, Y.; Chen, W.; Roehling, T.T.; et al. Additively manufactured hierarchical stainless steels with high strength and ductility. Nat. Mater. 2018, 17, 63–71. [Google Scholar] [CrossRef] [Scilit]
  15. Chao, Q.; Thomas, S.; Birbilis, N.; Cizek, P.; Hodgson, P.D.; Fabijanic, D. The effect of post-processing heat treatment on the microstructure, residual stress and mechanical properties of selective laser melted 316L stainless steel. Mater. Sci. Eng. A 2021, 821, 141611. [Google Scholar] [CrossRef] [Scilit]
  16. Krakhmalev, P.; Fredriksson, G.; Svensson, K.; Yadroitsev, I.; Yadroitsava, I.; Thuvander, M.; Peng, R. Microstructure, Solidification Texture, and Thermal Stability of 316 L Stainless Steel Manufactured by Laser Powder Bed Fusion. Metals 2018, 8, 643. [Google Scholar] [CrossRef] [Scilit]
  17. Roirand, H.; Pugliara, A.; Malard, B.; Hor, A.; Saintier, N. Multiscale study of additively manufactured 316 L microstructure sensitivity to heat treatment over a wide temperature range. Mater. Charact. 2024, 208, 113603. [Google Scholar] [CrossRef] [Scilit]
  18. Wang, X.; Nadimpalli, V.K.; Tiedje, N.S.; Jensen, D.J.; Yu, T. Additive-Manufacturing-Induced Cell Structure in Stainless Steel 316L: 3D Morphology and Formation Mechanism. Metall. Mater. Trans. A 2025, 56, 506–517. [Google Scholar] [CrossRef] [Scilit]
  19. Barode, J.; Brander, M.; Yu, T.; Nadimpalli, V.K.; Jensen, D.J.; Wang, X. Cell Structure in LPBF 316L-Microstructural Heterogeneity, Thermal Stability, and Mechanical Properties. Materials 2025, 18, 475. [Google Scholar] [CrossRef] [Scilit]
  20. Voisin, T.; Forien, J.-B.; Perron, A.; Aubry, S.; Bertin, N.; Samanta, A.; Baker, A.; Wang, Y.M. New insights on cellular structures strengthening mechanisms and thermal stability of an austenitic stainless steel fabricated by laser powder-bed-fusion. Acta Mater. 2021, 203, 116476. [Google Scholar] [CrossRef] [Scilit]
  21. Di, W.; Yongqiang, Y.; Xubin, S.; Yonghua, C. Study on energy input and its influences on single-track, multi-track, and multi-layer in SLM. Int. J. Adv. Manuf. Technol. 2012, 58, 1189–1199. [Google Scholar] [CrossRef] [Scilit]
  22. Saeidi, K.; Gao, X.; Zhong, Y.; Shen, Z.J. Hardened austenite steel with columnar sub-grain structure formed by laser melting. Mater. Sci. Eng. A 2015, 625, 221–229. [Google Scholar] [CrossRef] [Scilit]
  23. Bertsch, K.M.; Meric de Bellefon, G.; Kuehl, B.; Thoma, D.J. Origin of dislocation structures in an additively manufactured austenitic stainless steel 316L. Acta Mater. 2020, 199, 19–33. [Google Scholar] [CrossRef] [Scilit]
  24. Pham, M.-S.; Dovgyy, B.; Hooper, P.A.; Gourlay, C.M.; Piglione, A. The role of side-branching in microstructure development in laser powder-bed fusion. Nat. Commun. 2020, 11, 749. [Google Scholar] [CrossRef] [Scilit]
  25. Kramer, H.S.; Starke, P.; Klein, M.; Eifler, D. Cyclic hardness test PHYBALCHT–Short-time procedure to evaluate fatigue properties of metallic materials. Int. J. Fatigue 2014, 63, 78–84. [Google Scholar] [CrossRef] [Scilit]
  26. Blinn, B.; Ley, M.; Buschhorn, N.; Teutsch, R.; Beck, T. Investigation of the anisotropic fatigue behavior of additively manufactured structures made of AISI 316L with short-time procedures PhyBaLLIT and PhyBaLCHT. Int. J. Fatigue 2019, 124, 389–399. [Google Scholar] [CrossRef] [Scilit]
  27. Görzen, D.; Ostermayer, P.; Lehner, P.; Blinn, B.; Eifler, D.; Beck, T. A New Approach to Estimate the Fatigue Limit of Steels Based on Conventional and Cyclic Indentation Testing. Metals 2022, 12, 1066. [Google Scholar] [CrossRef] [Scilit]
  28. Ahmed, N.; Barsoum, I.; Haidemenopoulos, G.; Al-Rub, R.A. Process parameter selection and optimization of laser powder bed fusion for 316L stainless steel: A review. J. Manuf. Process. 2022, 75, 415–434. [Google Scholar] [CrossRef] [Scilit]
  29. Bunge, H.-J. Texture Analysis in Materials Science: Mathematical Methods; Elsevier: London, UK; Boston, MA, USA, 1982. [Google Scholar]
  30. Rösler, J.; Harders, H.; Bäker, M. Mechanisches Verhalten der Werkstoffe; Springer Fachmedien: Wiesbaden, Germany, 2012; Available online: https://link.springer.com/book/10.1007/978-3-658-26802-2 (accessed on 1 June 2026).
  31. Teklu, A.; Ledbetter, H.; Kim, S.; Boatner, L.A.; McGuire, M.; Keppens, V. Single-crystal elastic constants of Fe-15Ni-15Cr alloy. Metall. Mater. Trans. A 2004, 35, 3149–3154. [Google Scholar] [CrossRef] [Scilit]
  32. Feng, G.; Qu, S.; Huang, Y.; Nix, W.D. An analytical expression for the stress field around an elastoplastic indentation/contact. Acta Mater. 2007, 55, 2929–2938. [Google Scholar] [CrossRef] [Scilit]
  33. Casagrande, A.; Cammarota, G.P.; Micele, L. Relationship between fatigue limit and Vickers hardness in steels. Mater. Sci. Eng. A 2011, 528, 3468–3473. [Google Scholar] [CrossRef] [Scilit]
  34. Durst, K.; Backes, B.; Göken, M. Indentation size effect in metallic materials: Correcting for the size of the plastic zone. Scr. Mater. 2005, 52, 1093–1097. [Google Scholar] [CrossRef] [Scilit]
  35. DIN EN ISO 6892-1; Metallic Materials—Tensile Testing—Part 1: Method of Test at Room Temperature. International Organization for Standardization: Geneva, Switzerland, 2020.
  36. Callister, W.D.; Rethwisch, D.G. Materials Science and Engineering: An Introduction, 8th ed.; John Wiley & Sons: Hoboken, NJ, USA, 2010. [Google Scholar]
Figure 2. Schematic of the extraction of the metallographic cross section, which is taken perpendicular to the load direction (a) and longitudinal section, which is taken parallel to the load direction (b).
Metals 16 00636 g002
Figure 3. EBSD maps obtained in the longitudinal sections extracted from D4 specimens in the vertical (a), 45° (b), and horizontal (c) orientations, as well as inverse pole figures (IPF) representing the grain orientations perpendicular to the loading direction (PLD) for all specimen geometries D4 (d–f), D6 (g–i), D8 (j–l), D9 (m–o), and D10d3 (p–r) and for all orientations vertical (d,g,j,m,p), 45° (e,h,k,n,q) and horizontal (f,i,l,o,r).
Metals 16 00636 g003
Figure 4. EBSD maps obtained in the longitudinal sections extracted from D4 specimens in the vertical (a), 45° (b), and horizontal (c) orientations, as well as IPFs representing the grain orientations along the loading direction (ALD) for all specimen geometries D4 (d–f), D6 (g–i), D8 (j–l), D9 (m–o), and D10d3 (p–r) and for all orientations vertical (d,g,j,m,p), 45° (e,h,k,n,q) and horizontal (f,i,l,o,r).
Metals 16 00636 g004
Figure 5. Illustration of the cell structures obtained in AISI 316L, shown at the examples of cross (C) (a,c,e) and longitudinal (L) (b,d,f) sections of D10d3 samples in the vertical (a,b), 45° (c,d), and horizontal (e,f) orientation.
Metals 16 00636 g005
Figure 6. Illustration of the procedure to determine the minor ellipse axis a and major ellipse axis b of the cell structures.
Metals 16 00636 g006
Figure 7. Comparison of the average cell areas Acell obtained from the longitudinal and the cross sections of all different specimen geometries and orientations.
Metals 16 00636 g007
Figure 8. Comparison of the microhardness HM obtained from the longitudinal and the cross sections of all different specimen geometries and orientations.
Metals 16 00636 g008
Figure 9. Comparison of the cyclic hardening exponentCHT |eII| obtained from the longitudinal and the cross sections of the different specimen geometries and orientations.
Metals 16 00636 g009
Figure 10. Representative σ-ε curves obtained from differently oriented D8 tensile specimens.
Metals 16 00636 g010
Figure 11. Analysis of the correlation between HM and Acell based on all data obtained from the different specimen types and sectional planes. A legend for the symbol allocations can be found in Figure 9.
Metals 16 00636 g011
Figure 12. Analysis of the correlation between |eII| and Acell (a) as well as HM and Acell (b) based on all data obtained from the D4 and D10d3 specimen types and both sectional planes.
Metals 16 00636 g012
Table 1. PBF-LB/M process parameters used for the contour and inner area.
SectionLayer Thickness tLaser Power PLScanning Speed vHatch Distance hd
Inner area30 µm215 W900 mm/s100 µm
Contour area30 µm85 W450 mm/s100 µm
Table 2. Chemical composition of the investigated austenitic CrNi steel AISI 316L obtained at a D9 specimen clamping shaft via optical spark spectroscopy.
Element in wt. %
CSiMnCrMoNNi
0.02
± 0.01
0.54
± 0.01
0.94
± 0.01
17.54
± 0.07
2.32
± 0.01
0.059
± 0.001
12.99
± 0.01
Table 3. Young’s modulus (EE) calculated using Bunge Euler angles of the EBSD maps for the D8 specimen geometries and V, 45°, and H orientations.
OrientationV45H
EE in GPa149 ± 56198 ± 56177 ± 56
Table 4. Ultimate tensile strength (Rm), 0.2% yield strength (Rp0.2), elongation at fracture (A), and Young’s modulus (E) obtained in tensile tests for different orientations of D8 specimens.
OrientationV45H
Rm in MPa577 ± 6651 ± 8688 ± 7
Rp0.2 in MPa449 ± 16488 ± 13505 ± 5
E in GPa188 ± 12197 ± 8207 ± 10
A in %50.4 ± 1.545.8 ± 1.541.8 ± 3.3
Disclaimer/Publisher’s Note: The statements, opinions and data contained in all publications are solely those of the individual author(s) and contributor(s) and not of MDPI and/or the editor(s). MDPI and/or the editor(s) disclaim responsibility for any injury to people or property resulting from any ideas, methods, instructions or products referred to in the content.