Article

Effect of Annealing Temperature on Microstructure, Texture, and Magnetic Properties of Non-Oriented Silicon Steel for Electric Vehicle Traction Motors

1
National Engineering Research Center of Continuous Casting Technology, Central Iron and Steel Research Institute, Beijing 100081, China
2
School of Metallurgical and Ecological Engineering, University of Science and Technology Beijing, Beijing 100083, China
*
Author to whom correspondence should be addressed.
Metals 2025, 15(11), 1235; https://doi.org/10.3390/met15111235
Submission received: 29 July 2025 / Revised: 7 September 2025 / Accepted: 18 October 2025 / Published: 10 November 2025
(This article belongs to the Special Issue Electrical Steels)

Abstract

Improving the efficiency of electric vehicle traction motors requires non-oriented silicon steels with low core loss and favorable magnetic induction. This study aims to clarify the influence of annealing temperature on the microstructure, texture, and magnetic properties of a 3.2%Si–0.9%Al steel, providing guidance for process optimization. Optical metallography, X-ray diffraction, and electron backscatter diffraction were employed to characterize the evolution. Recrystallization was completed between 620 °C and 720 °C, during which fine recrystallized grains replaced the deformed structure, accompanied by the nucleation of {111}<112> and {114}<481> grains. With further annealing from 850 °C to 1050 °C, grain growth occurred, resulting in an α*-fiber texture dominated by {114}<481>. The fraction of high-angle {114}<481> grains increased, while low-angle {111}<112> grains decreased. This microstructural evolution significantly influenced the magnetic properties of non-oriented electrical steel. The P1.5/50 and P1.0/400 core losses reached minimum values of 2.02 W/kg and 16.48 W/kg at 1010 °C and 930 °C, respectively, while B50 decreased slightly from 1.670 T to 1.652 T. These findings indicate that precise control of the annealing temperature is an effective strategy to tailor microstructure and texture, thereby optimizing the magnetic properties of non-oriented electrical steel.

1. Introduction

In recent years, with the continuous rise in crude oil prices and the worsening environmental pollution caused by the combustion of fossil fuels, the development of the traditional fuel vehicle industry is facing a crisis [1]. In contrast, electric vehicles have become increasingly popular among consumers due to their advantages in improving fuel economy, reducing greenhouse gas emissions, and minimizing environmental pollution [2,3]. The traction motor is one of the key components of electric vehicles; it not only determines energy conversion efficiency but also influences the vehicle’s performance parameters. Meanwhile, non-oriented silicon steel serves as the raw material for the traction motor’s iron core (stator and rotor). Excellent traction motor performance requires non-oriented silicon steel with low iron loss at high frequencies. This is because low high-frequency iron loss can effectively reduce the energy conversion loss from electrical energy to mechanical energy at high speeds, thereby contributing to extending the vehicle’s driving range [4,5]. Additionally, higher magnetic induction can increase the motor’s torque, which not only benefits vehicle start-up, acceleration, climbing, and sustained high-speed driving but also allows for a more compact motor size, saving valuable interior space [6,7,8].
It is well known that the manufacturing process of non-oriented silicon steel for electric vehicle traction motors is lengthy and technologically complex. Continuous annealing is particularly critical, as it is the final process that determines the microstructure and texture of non-oriented silicon steel, which are closely related to its magnetic properties. Numerous studies have examined the effects of annealing temperature on the microstructure, texture, and magnetic properties of non-oriented silicon steel with different thicknesses. Park et al. [9] investigated 0.5 mm thick non-oriented silicon steel and demonstrated that new Goss and Cube grains preferentially nucleated within shear bands, followed by the nucleation of {111}<112> grains within deformation bands. Cunha et al. [10] reported that in 0.5 mm thick 3% Si non-oriented silicon steel, grain size increased continuously with annealing temperature, accompanied by an increase in the volume fraction of the Goss component and a decrease in the {111}<112> component. However, the cold-rolled microstructure of 0.5 mm thick non-oriented silicon steel differs from that of thinner gauges, leading to distinct recrystallization behaviors during annealing. Qiao et al. [11] confirmed that in 0.3 mm thick 2.97% Si non-oriented silicon steel, the decrease in the area fraction of {100}<130> and the increase in {111}<112> during grain growth caused deterioration in magnetic induction. Nevertheless, the nucleation process was not addressed. Li et al. [12] prepared 0.1 mm thick non-oriented silicon steel by single and double cold rolling, respectively, and found that the single cold-rolled material, after annealing, mainly developed {111}<112> and {114}<481> textures. In this case, {111}<112> grains nucleated both at the boundaries and interiors of {111}<110> deformed grains, while {114}<481> grains nucleated at the boundaries of {114}<110> deformed grains. However, the grain growth process was not discussed. In another study, Li et al. [13] prepared 0.2 mm thick 3.12% Si non-oriented silicon steel using a single cold rolling process without prior normalization. The final annealed sheets exhibited pronounced α*-fiber and γ-fiber textures, which differs from industrial manufacturing practices where normalization is typically applied before single cold rolling.
These findings indicate that although extensive work has been carried out, most previous studies have either focused on relatively thick sheets or examined texture evolution and grain growth separately, without providing a systematic analysis of the coupled nucleation and growth mechanisms in thin-gauge non-oriented silicon steel produced under industrial routes. In this study, 0.3 mm thick non-oriented silicon steel for electric vehicle traction motors was selected as the research subject. The microstructural characteristics, texture evolution, and magnetic properties under different annealing temperatures were systematically analyzed, aiming to clarify the regulating role of annealing temperature in the relationship between microstructure, texture, and magnetic properties. The results provide both theoretical insights and practical guidance for optimizing the annealing process of non-oriented silicon steel in electric vehicle traction motors.

2. Experimental Materials and Methods

In this study, the initial materials were 3.2%wt Si–0.9%wt Al non-oriented silicon steel cold-rolled sheets with a thickness of 0.3 mm industrially manufactured by a domestic steel plant. The detailed chemical composition is listed in Table 1. The industrial production process involved heating 240 mm thick slabs at 1140 °C for 120 min, followed by hot rolling to a thickness of 2.2 mm. The hot-rolled sheets were then normalized at 950 °C for 3 min and subsequently cold-rolled to 0.3 mm with a reduction of 86%.
The final annealing experiments were performed in a laboratory tube-type furnace (CPI, Hefei, China). First of all, the cold-rolled sheets were sheared into 300 mm × 30 mm both in longitudinal and transverse directions with respect to rolling direction. Subsequently, in order to study microstructure and texture during recrystallization and grain growth, these cold-rolled sheets were annealed at temperatures ranging from 620 °C to 1050 °C for 3 min under an atmosphere of 25% H2 and 75% N2. After annealing, the samples were cooled to room temperature in air.
All samples subjected to different annealing temperatures were taken from adjacent regions at the transverse center of the cold-rolled sheet. The samples were cut into 8 mm × 10 mm along TD (transverse direction) and RD (rolling direction), respectively, using a wire electrical discharge machine. The cross-sections defined by the ND (normal direction) and RD, which were ground, polished, and etched with a 4% nitric acid solution, were obtained for metallographic and microtexture analysis. To enhance the representativeness of grain statistics under annealing temperatures exceeding 930 °C, measurements were conducted on cross-sections defined by the ND and TD. Microstructure was observed by an optical microscope (Carl Zeiss AG, Oberkochen, Germany). The recrystallization fraction was estimated from the micrographs using Image-Pro Plus 6.0 software [14].
In addition, microtexture characterization is performed by a scanning electron microscope (Carl Zeiss AG, Oberkochen, Germany) equipped with an electron backscatter diffraction system (OXFORD INSTRUMENTS). To ensure statistical reliability and minimize sampling bias, the EBSD scan area was set to at least 2500 μm × 300 μm. For samples annealed at 930–1050 °C, a larger scan region of no less than 3800 μm × 2800 μm was employed. The acquired data are computed by a commercial software (AZtecCrystal 2.1), and a misorientation angle of 15° is defined as the threshold between different orientations.
The samples for macrotexture analysis were cut into 15 mm × 20 mm along TD and RD, respectively. Macrotextures were examined by an X-ray diffractometer (Malvern Panalytical B.V., Almelo, Netherlands) operating at 35 kV and 45 mA. The examined position is defined by S = 2 a/d, where a is the distance from the center layer and d is the thickness of the samples. In other words, S = 1 represents the surface layer, while S = 0 represents the center layer. A software (X’ pert texture 1.1a) was applied to calculate orientation distribution function (ODF) from three incomplete pole figures {110}, {200} and {211} according to the series expansion method. The calculated results are displayed as constant φ2 = 45° section in Euler space. Figure 1 presents the ideal crystallographic components on the φ2 = 45° section of the orientation distribution function (ODF).
The magnetic properties of the final annealed samples at 850 °C, 890 °C, 930 °C, 970 °C, 1010 °C, and 1050 °C were measured using a single sheet tester (Linkjoin Technology Co., Ltd., Loudi, China). Magnetic induction (B50) was measured under a magnetic field strength of 5000 A/m, and core loss (P1.5/50 and P1.0/400) was evaluated at flux densities of 1.5 T/50 Hz and 1.0 T/400 Hz in both RD and TD. The final values of core loss (P1.5/50 and P1.0/400) and magnetic induction (B50) were obtained by averaging the data collected in the RD and TD.

3. Results and Discussion

3.1. Microstructure and Texture of Cold-Rolled Sheet

As shown in Figure 2, the microstructure of the cold-rolled sheet consists of shear bands and deformation bands throughout the thickness. The shear bands are mainly distributed in the subsurface region and are inclined at an angle of approximately 19–26° with respect to the rolling direction, while the deformation bands are primarily located in the central region, exhibiting flattened and elongated microstructures that are nearly parallel to the RD. The formation of these two types of microstructures is attributed to different deformation conditions. In the subsurface region, shear deformation dominates due to friction between the rolls and the sheet surface, whereas in the central region, the sheet is mainly subjected to plane strain compression [15,16,17,18].
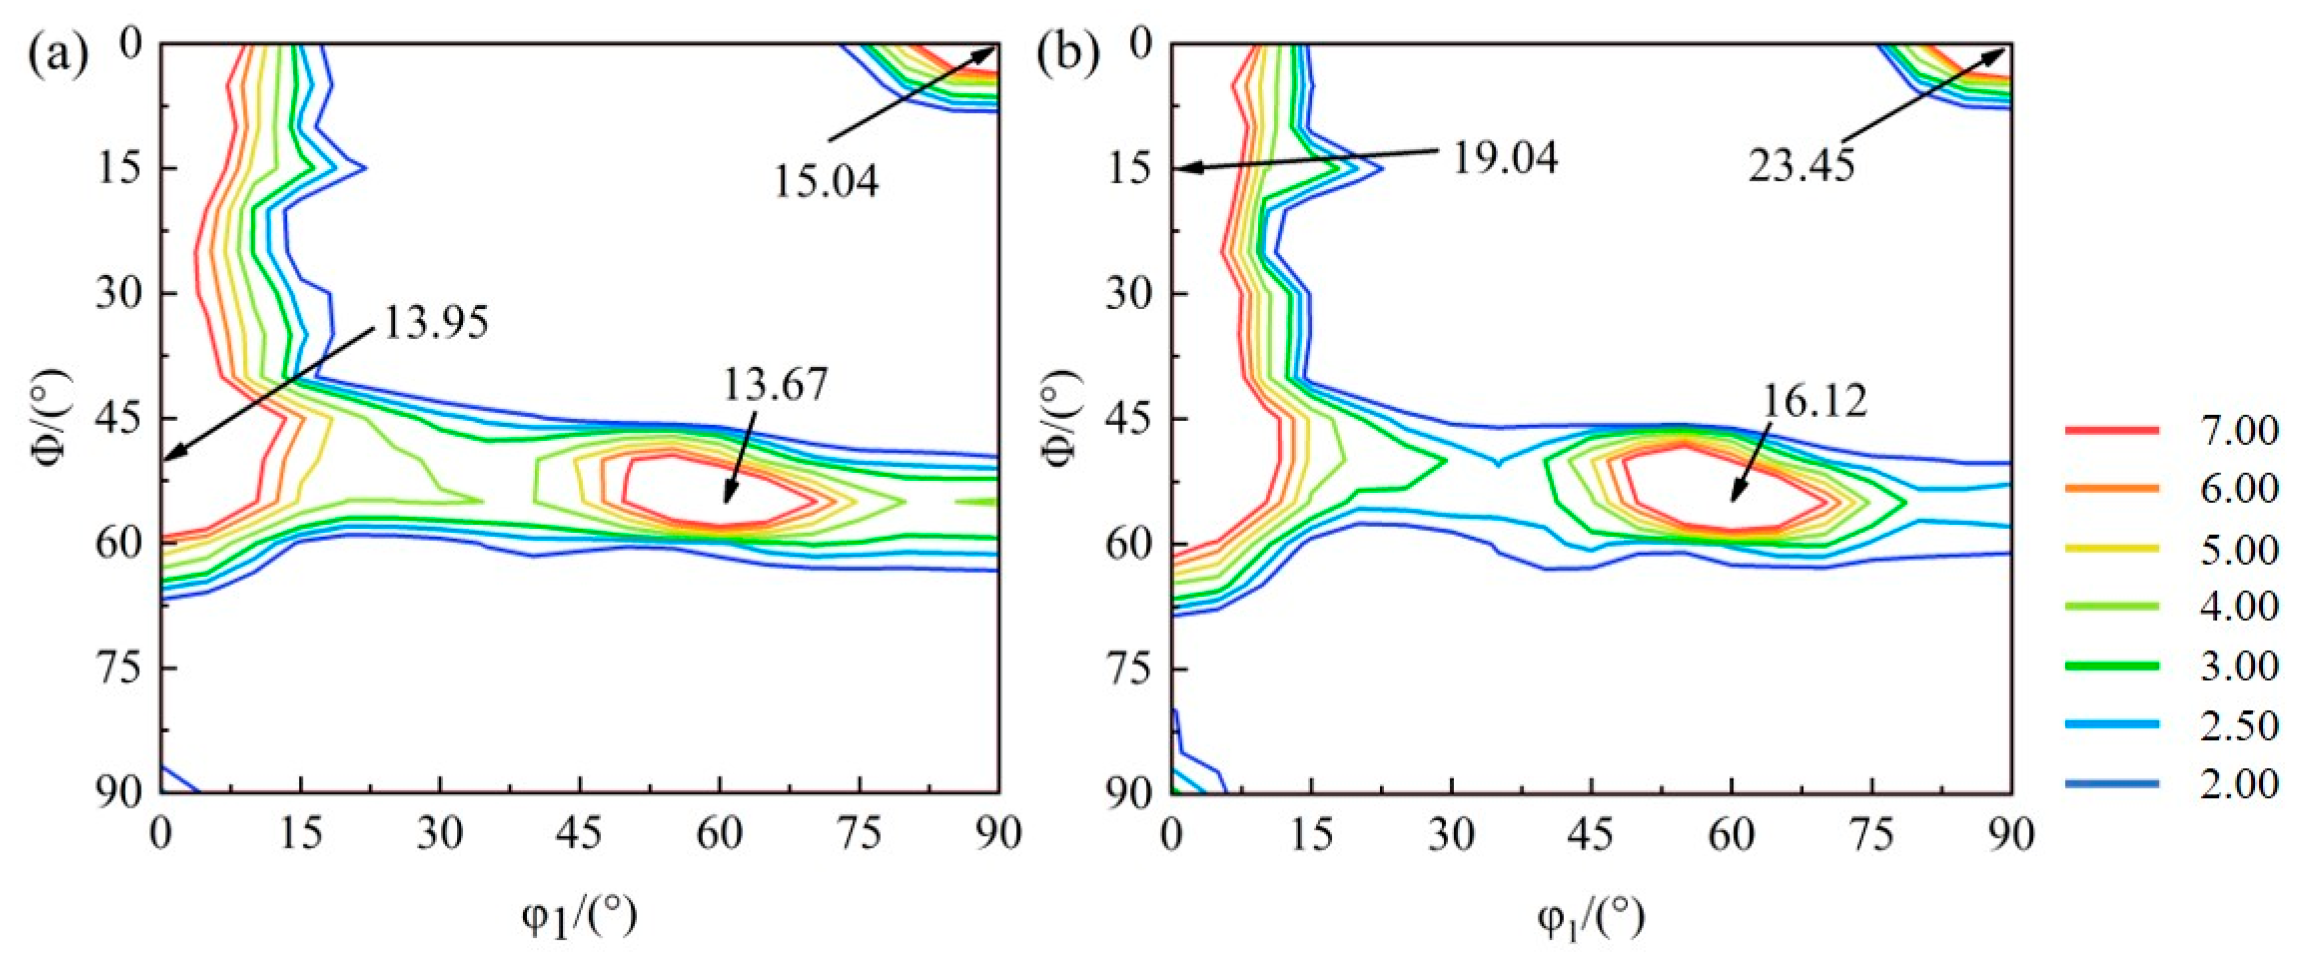
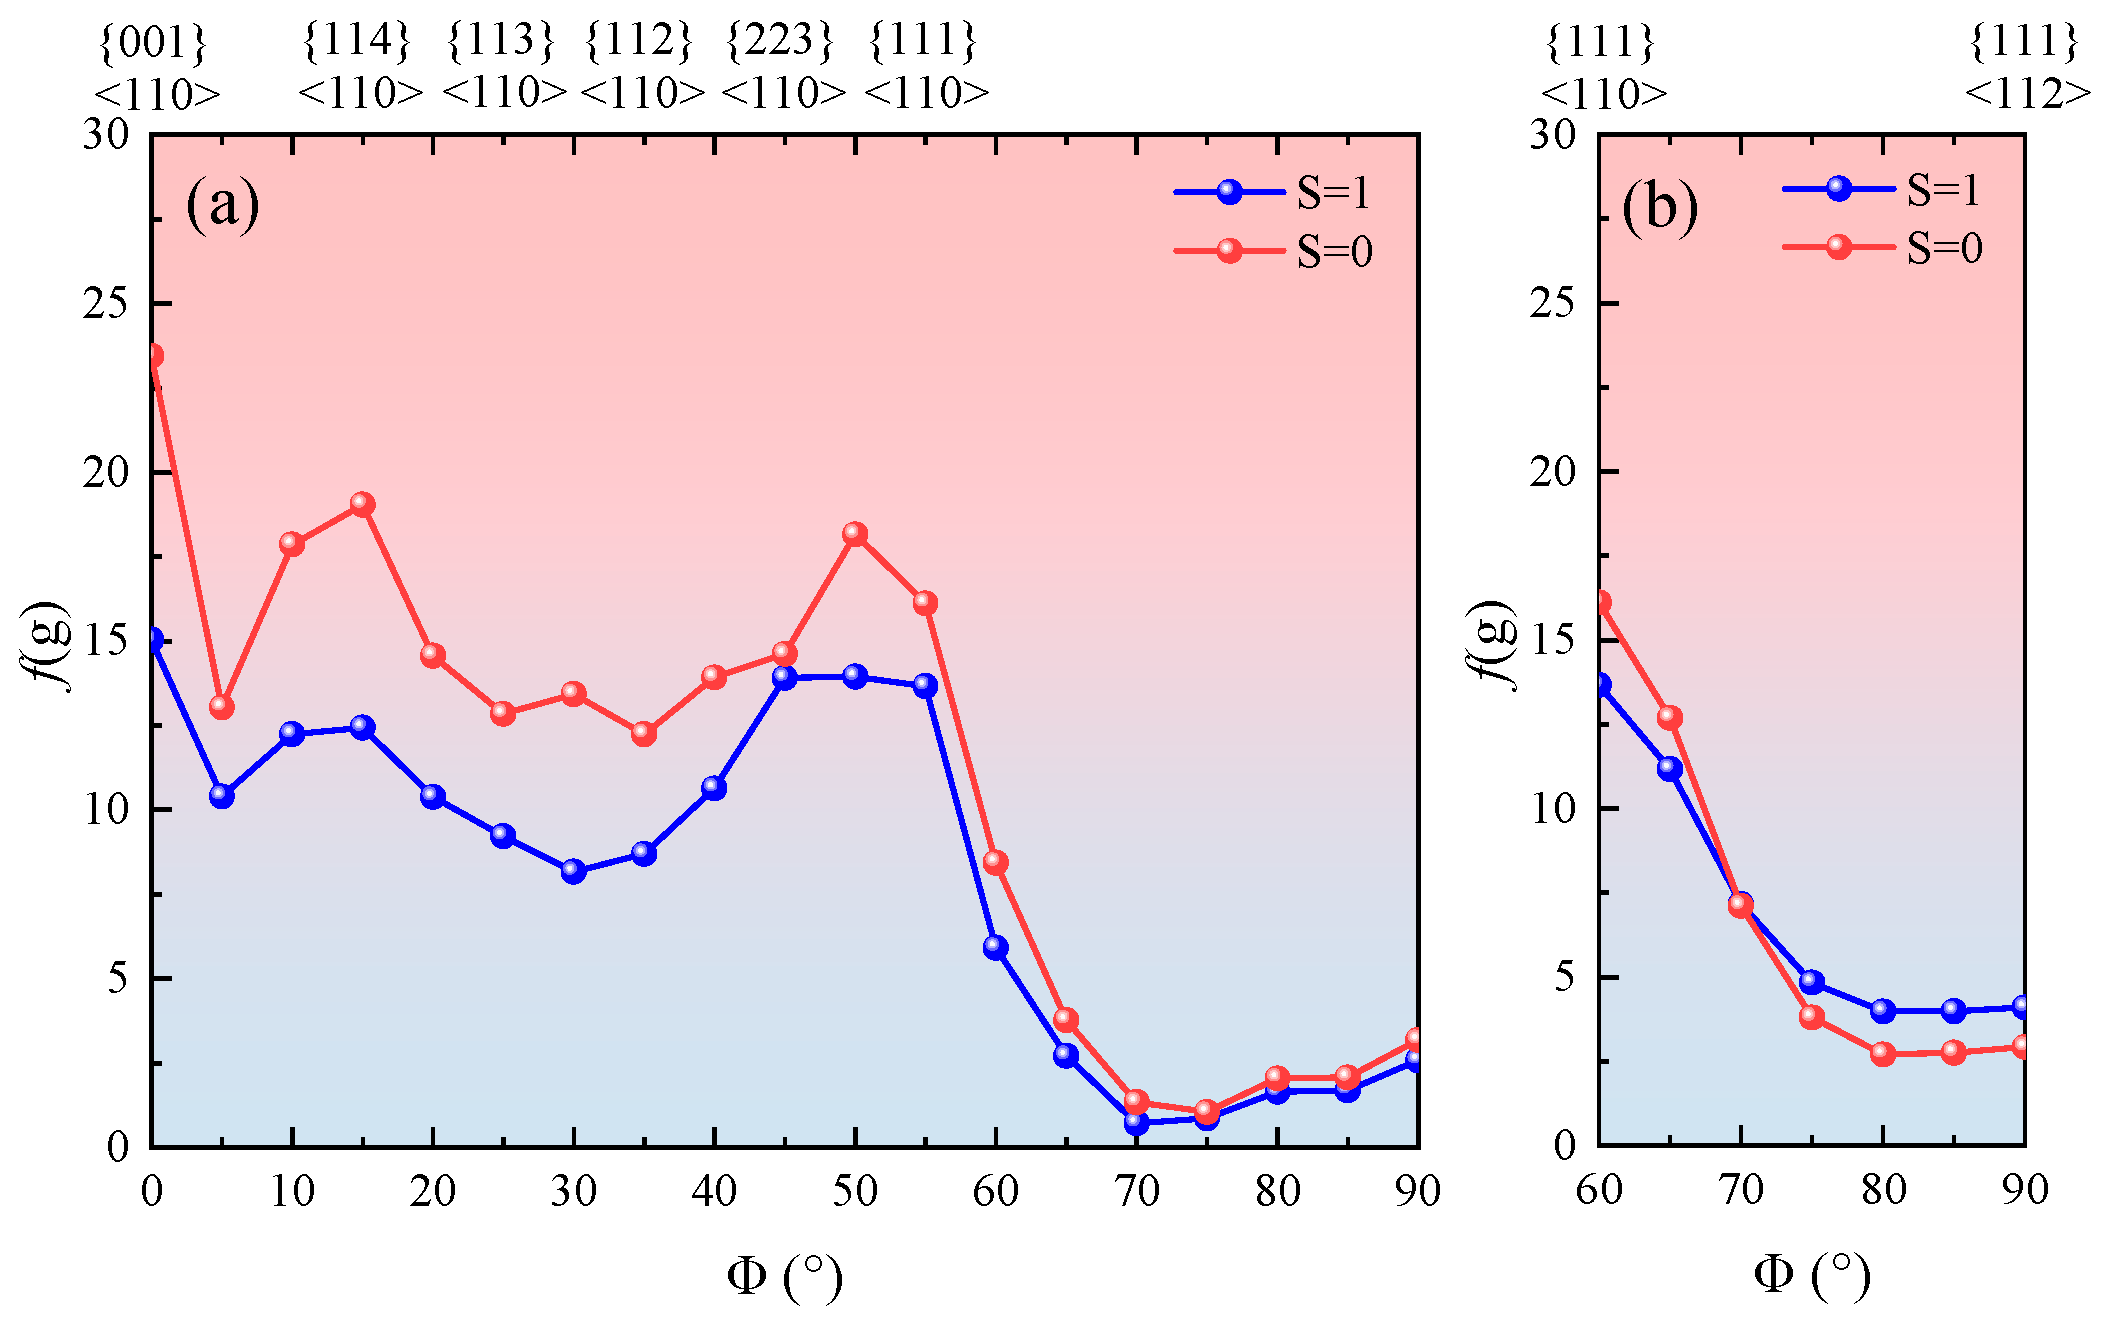
In addition, it can be clearly seen from Figure 3 that the cold-rolled sheet exhibits similar types of texture at both S = 1 and S = 0, consisting of α-fiber and γ-fiber textures. Among them, the α-fiber texture shows higher intensity, with a pronounced peak at the {001}<110> component, while the γ-fiber texture is relatively weaker, particularly at the {111}<112> component. This observation is consistent with the experimental results reported by Wang [19]. As is well known, in cold-rolled polycrystalline body-centered cubic (BCC) metals, two primary crystal rotation paths have been identified: (1) {001}<100> → {001}<110> → {112}<110> → {223}<110>; (2) {110}<001> → {554}<225> → {111}<112> → {111}<110> → {223}<110> [20]. Notably, when the cold rolling reduction exceeds 75%, the {111}<112> component becomes unstable [21]. In the present study, the cold-rolled sheet was subjected to a high reduction of up to 86%.
Based on Figure 4a,b, the intensity of the α-fiber orientation line at S = 0 is higher than that at S = 1. In contrast, the γ-fiber orientation line near the {111}<112> component shows lower intensity at S = 0 compared with S = 1. Meanwhile, the intensity of the {001}<110> component is 15.04 at S = 1, increasing to 23.45 at S = 0, while that of the {111}<112> component decreases from 4.10 at S = 1 to 2.93 at S = 0. This difference is attributed to the stronger effect of plane strain compression in the S = 0 region.

3.2. Microstructure and Texture During Recrystallization

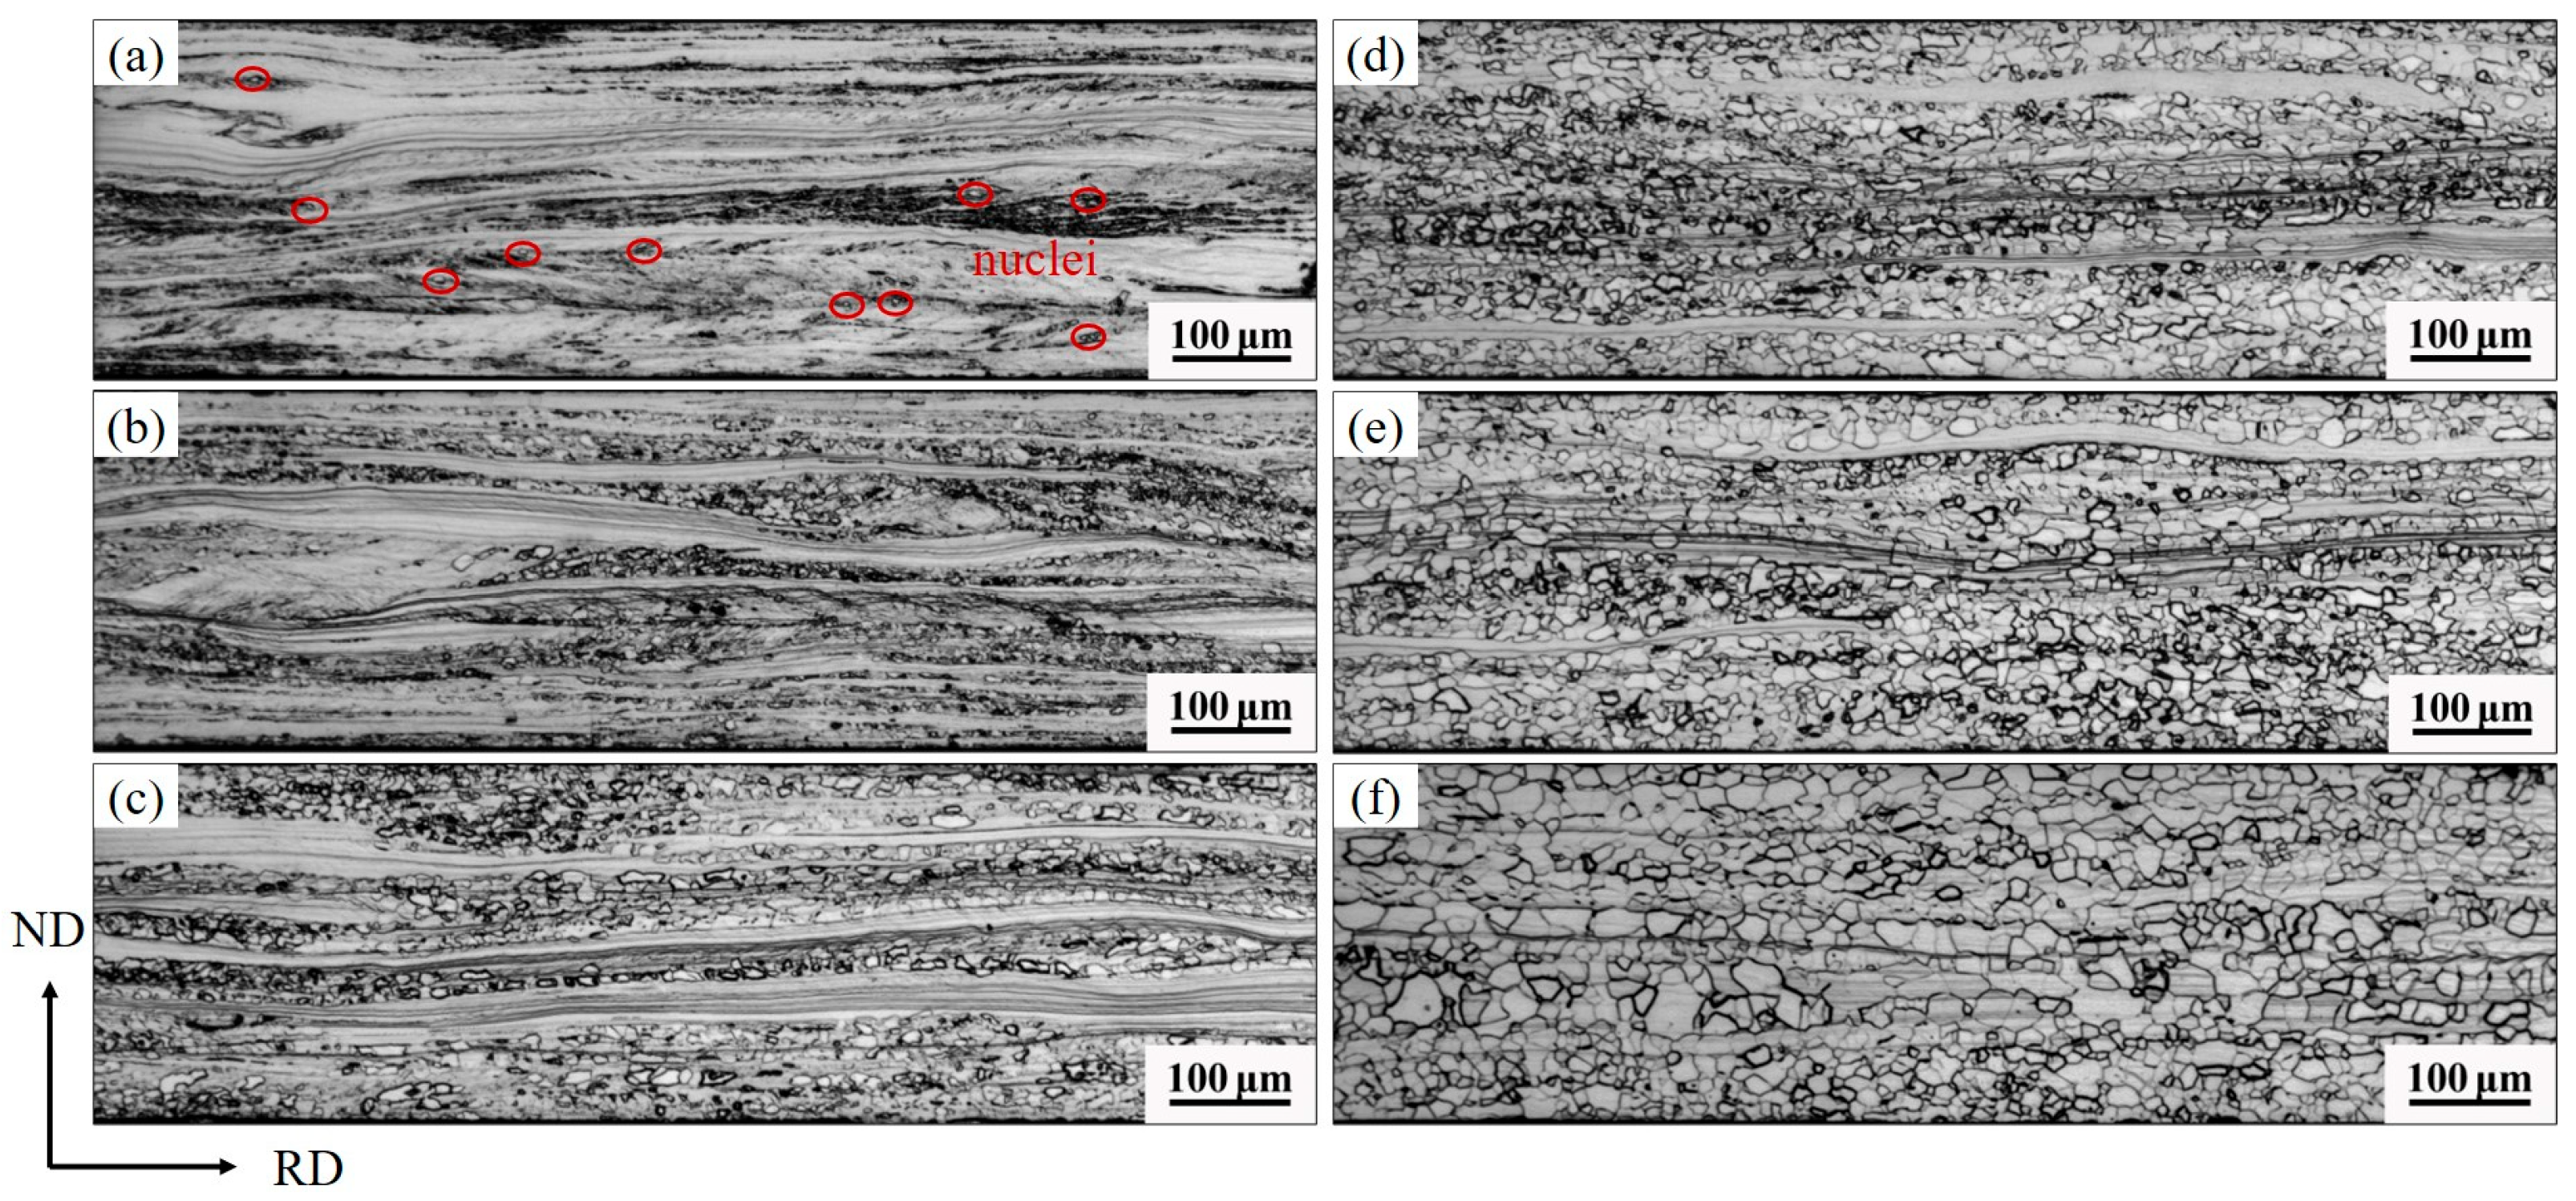
Figure 5 and Figure 6 illustrate the microstructural evolution and the corresponding recrystallization fraction during annealing at 620–720 °C. With increasing annealing temperature, both the number of recrystallized grains and the recrystallization fraction in the annealed samples increase. However, the recrystallization process exhibits inhomogeneity along the thickness direction. Recrystallization is first observed after annealing at 620 °C, where isolated nuclei are primarily located at grain boundaries and within shear bands. This is because the high dislocation density within shear bands leads to greater stored strain energy, which promotes the onset of recrystallization [22,23]. Similarly, the regions near grain boundaries also possess higher stored strain energy. At 640 °C, dense nucleation begins within the shear bands, resulting in a rapid increase in the recrystallization fraction, reaching approximately 63%. However, recrystallization has not yet occurred in the deformation bands due to their relatively low stored strain energy, which requires a higher temperature to be activated [24]. From 660 °C to 700 °C, recrystallization begins to occur in the deformation bands, and the previously formed recrystallized grains start to grow, with the recrystallization fraction increasing from 79% to 97%. However, the increasing trend of the recrystallization fraction slows down. At 720 °C, the original deformed microstructure in the cold-rolled sheet completely disappears, and it is entirely replaced by fine recrystallized grains.
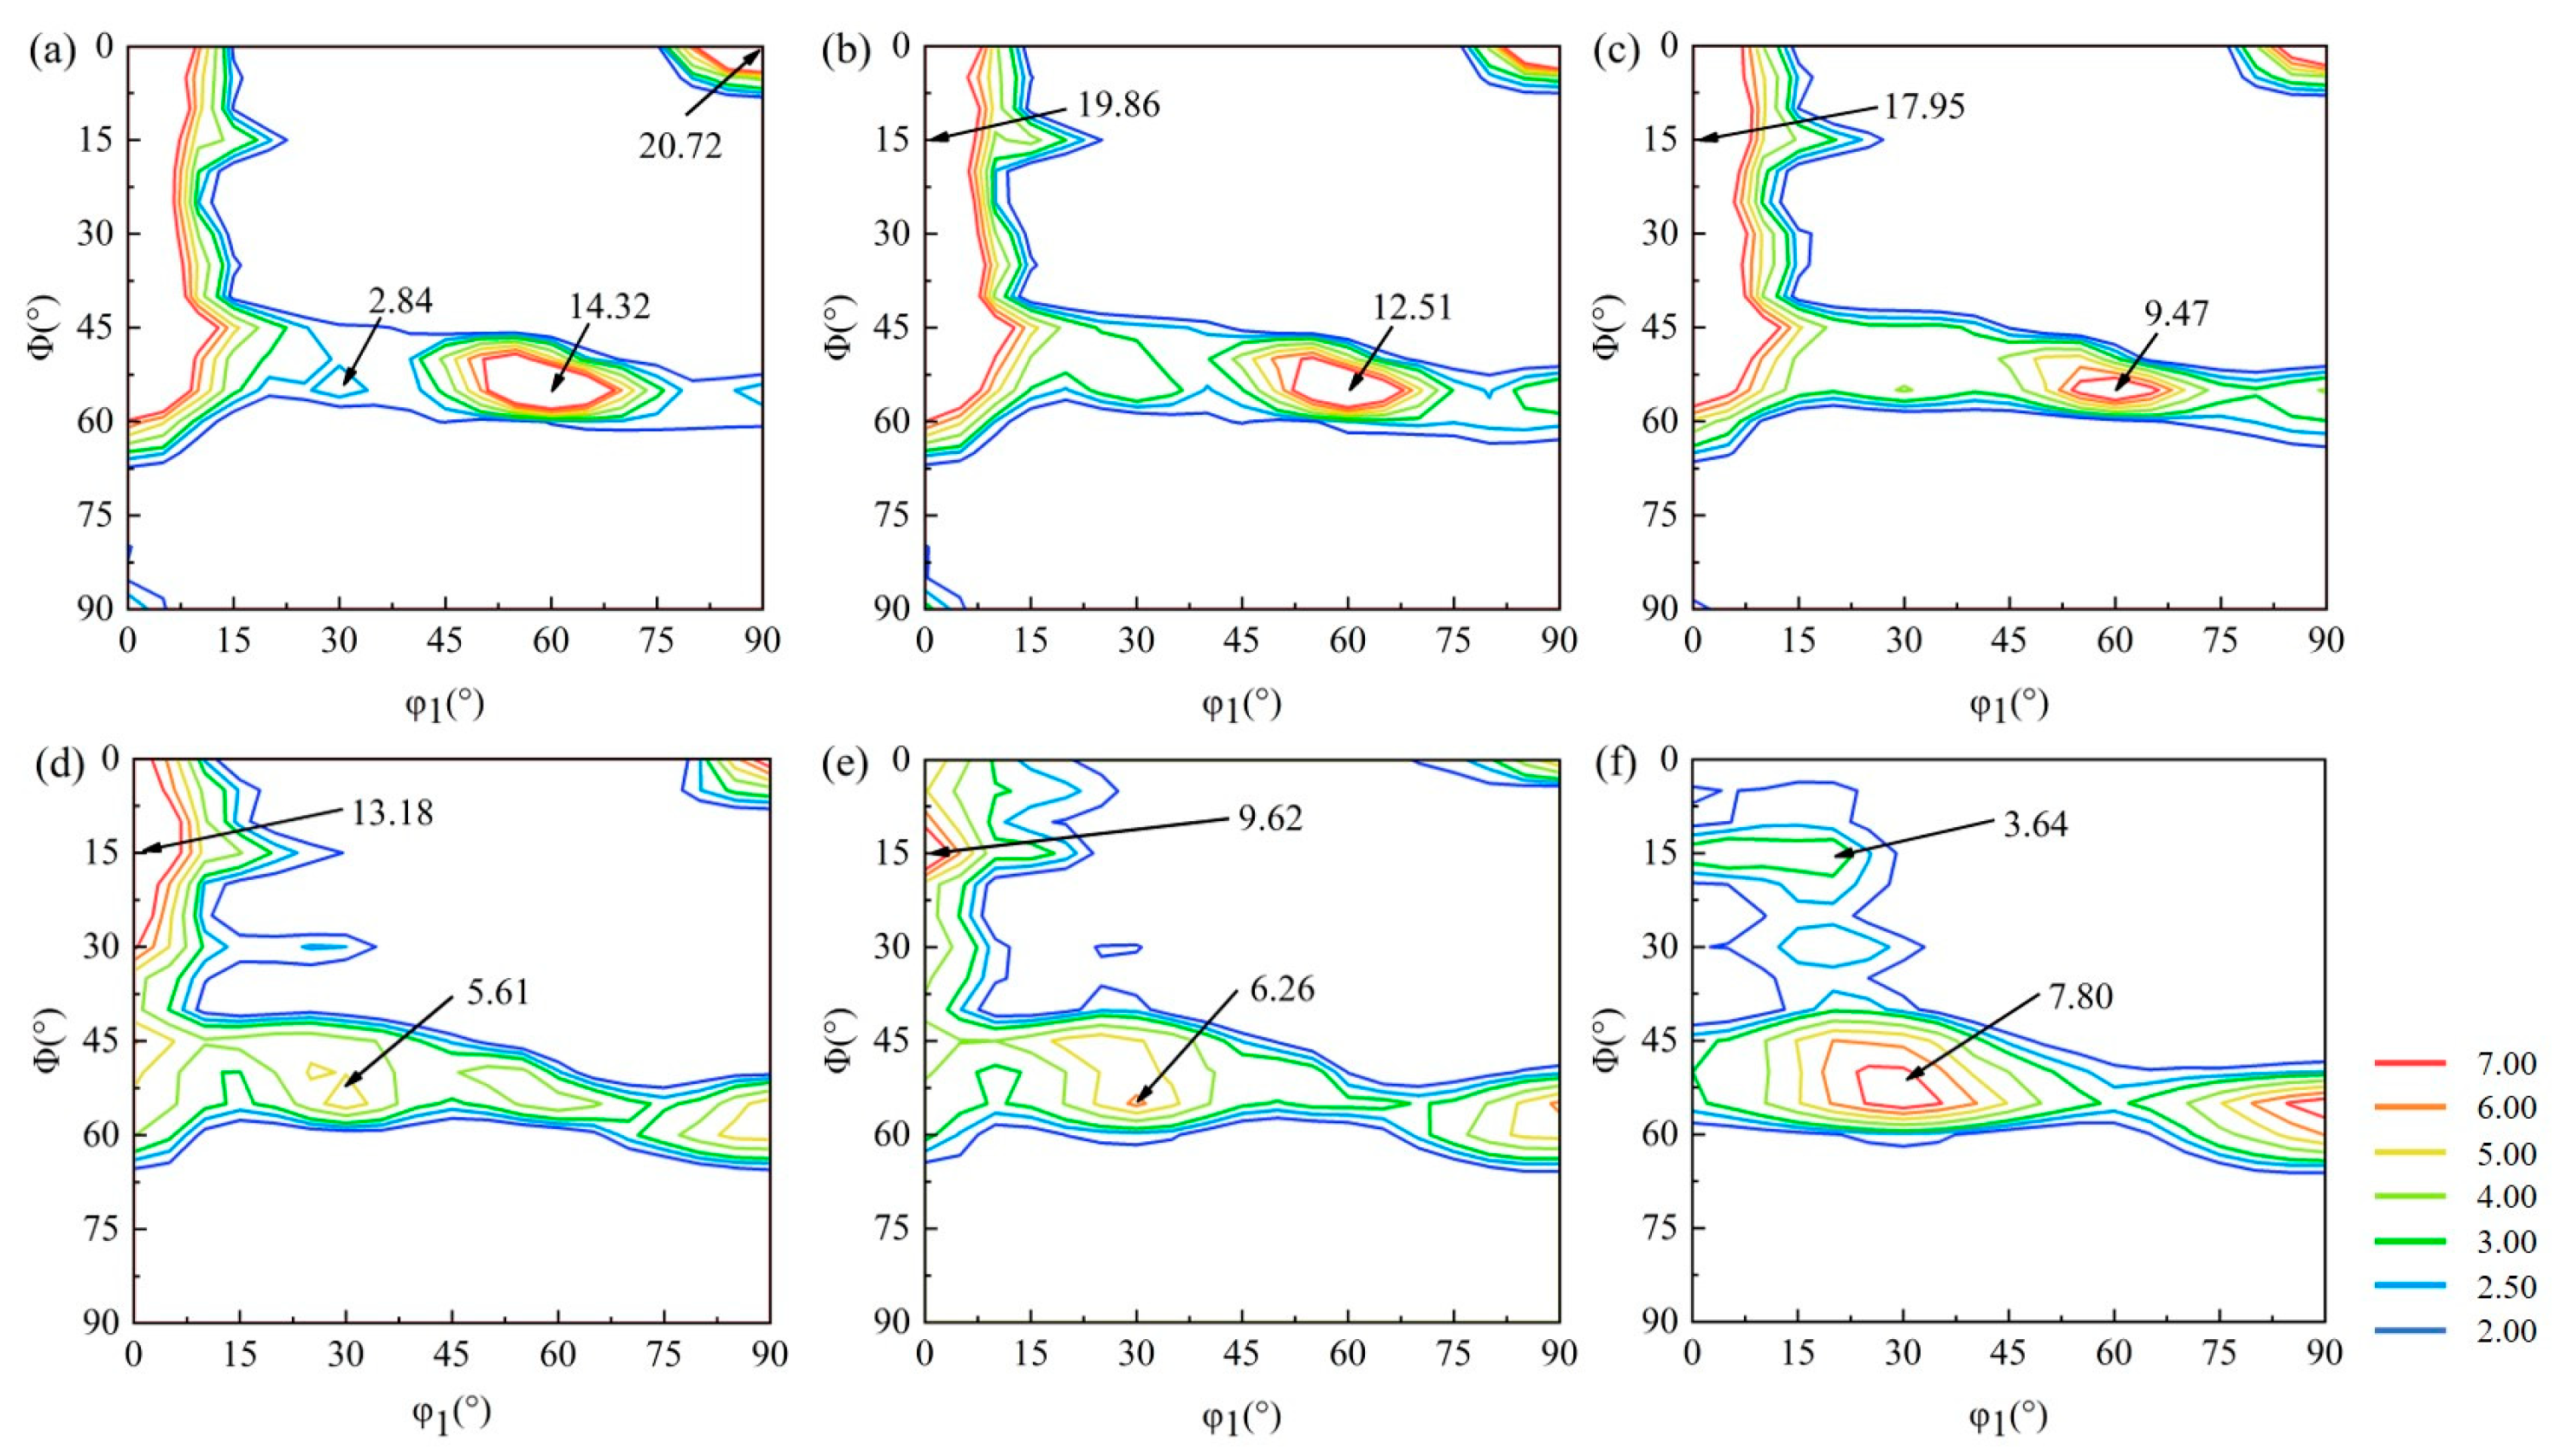
After annealing at 620 °C, only a very small number of recrystallized grains are observed, and recovery is the dominant process. As shown in Figure 7a, since recovery does not change the types of texture, the macrotexture of the sample annealed at 620 °C is similar to that of the cold-rolled sample. Based on Figure 7b–f, as the annealing temperature increases from 640 °C to 720 °C, the intensity of the α-fiber texture decreases, while those of the γ-fiber and α*-fiber textures increase. In particular, the intensity of the {111}<112> component increases from 2.84 to 7.80. Moreover, the γ-fiber texture appears earlier than the α*-fiber texture during the recrystallization process. According to the findings of Jiao et al. [25], in the early stage of recrystallization, {111}<112> grains tend to nucleate and grow within the deformed {111}<110> matrix. In the later stages of recrystallization, however, {114}<481> grains which belong to the α*-fiber texture typically nucleate at the grain boundaries of the deformed {112}<110> and {001}<110> matrix [26].
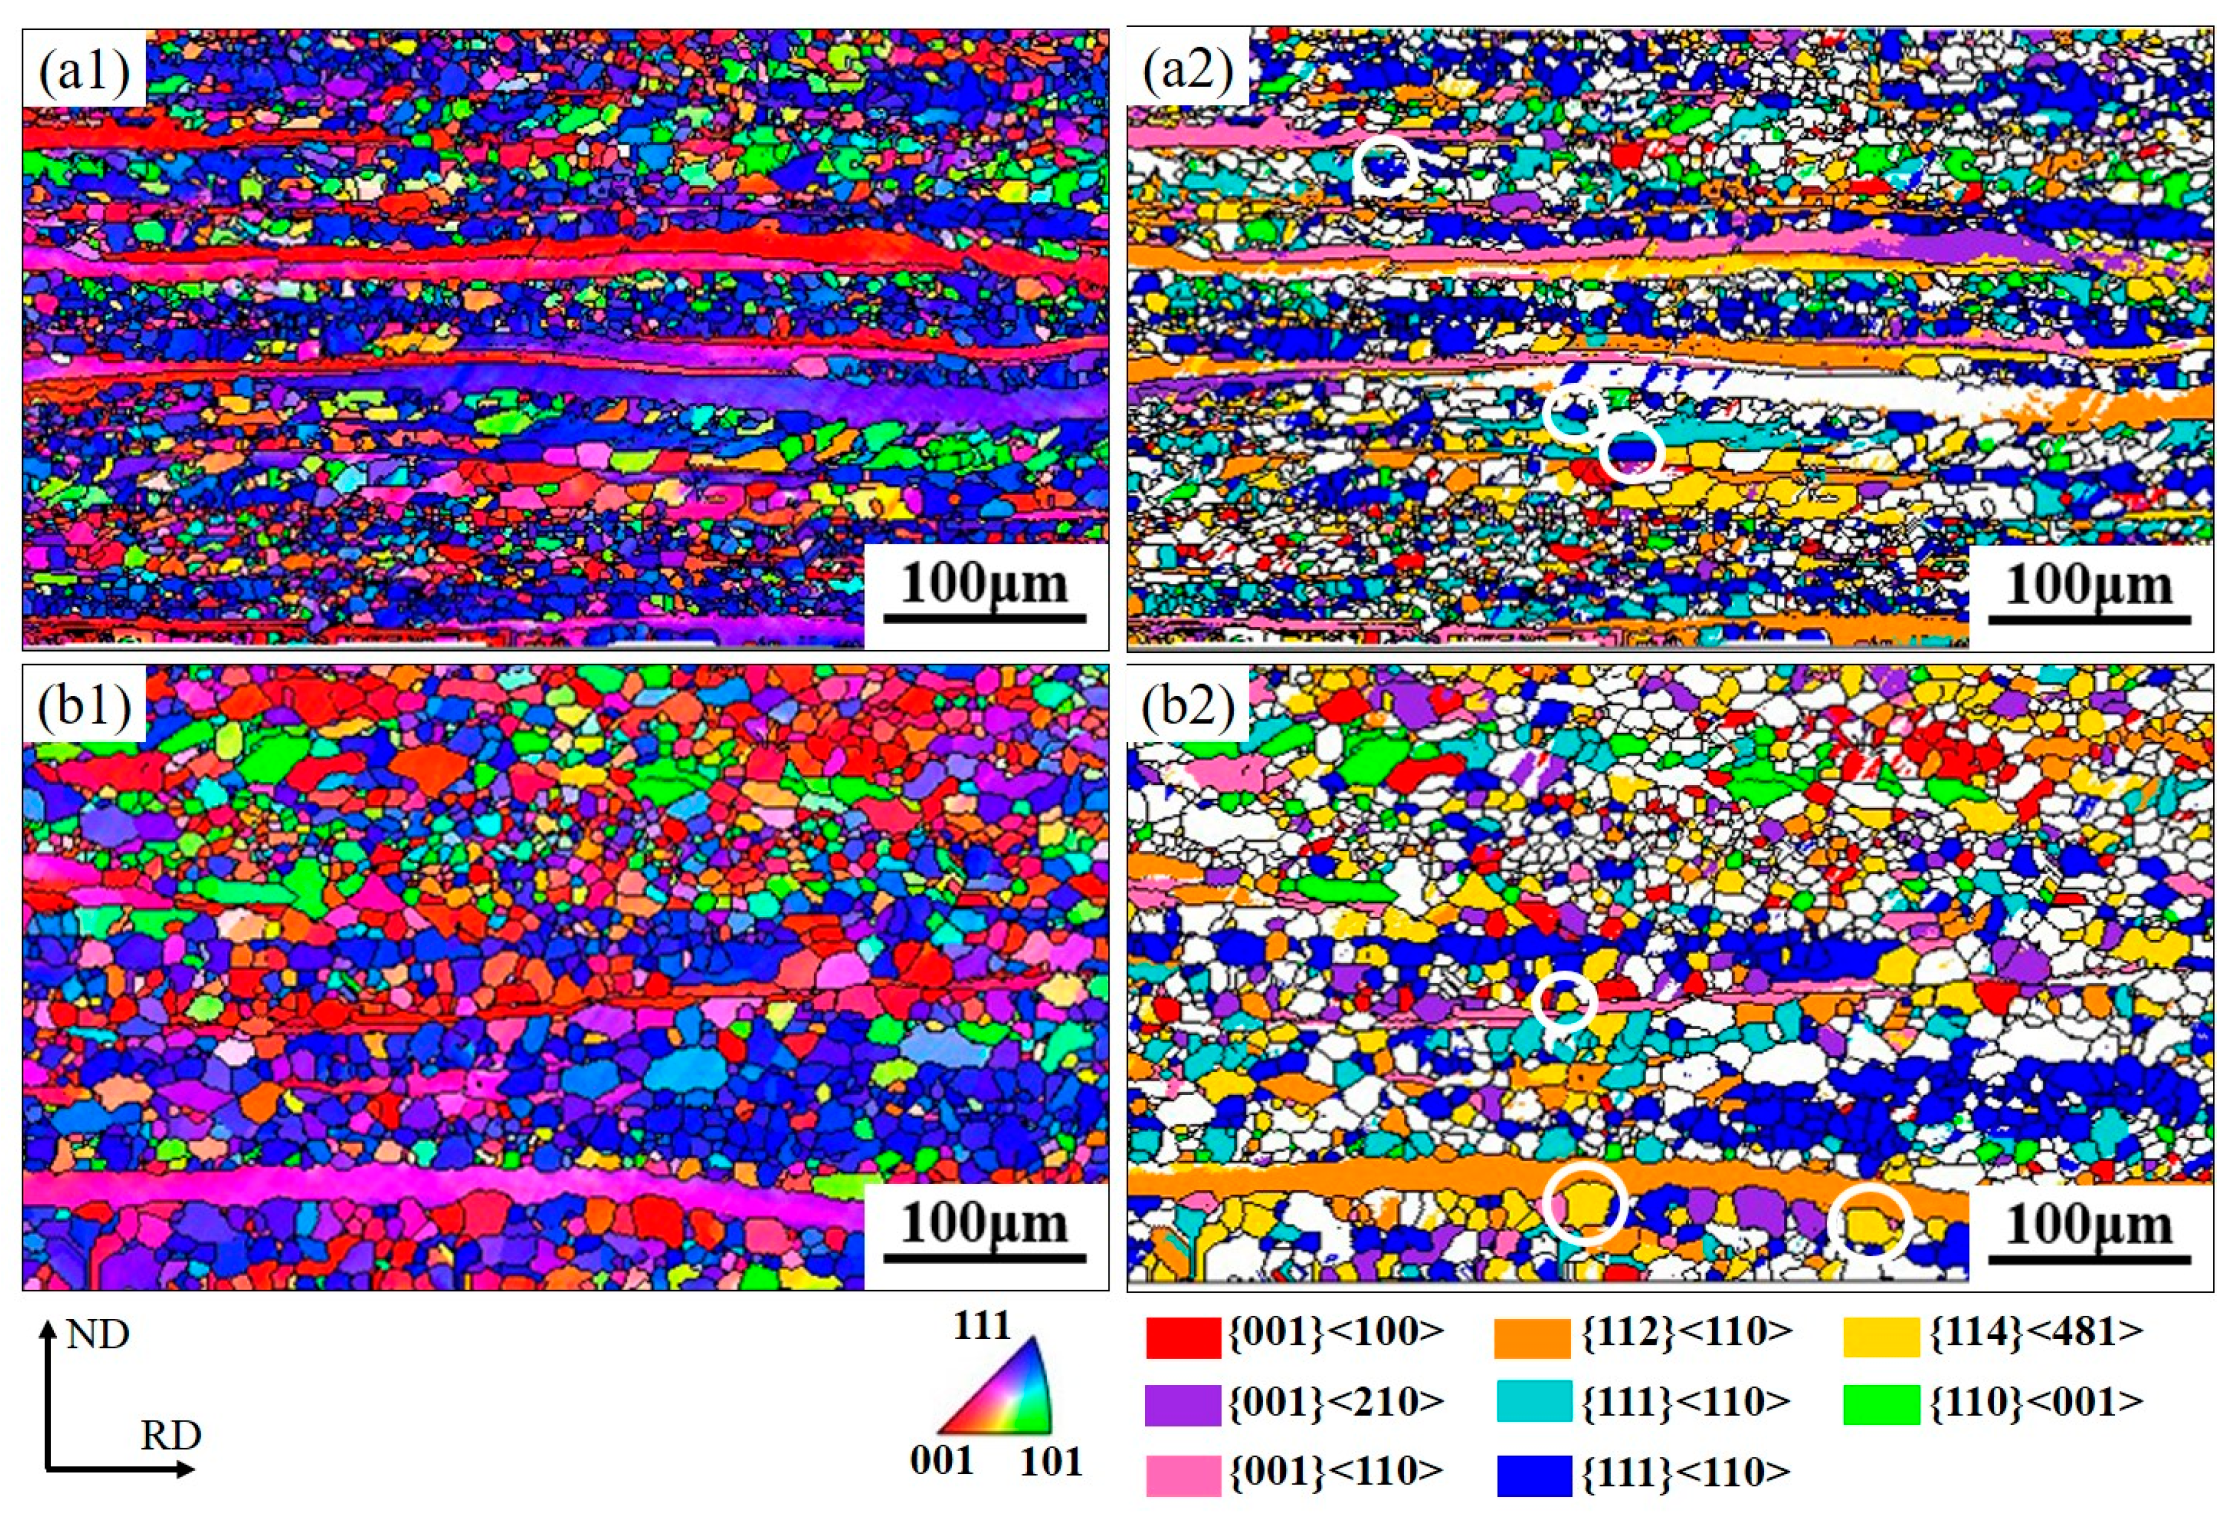
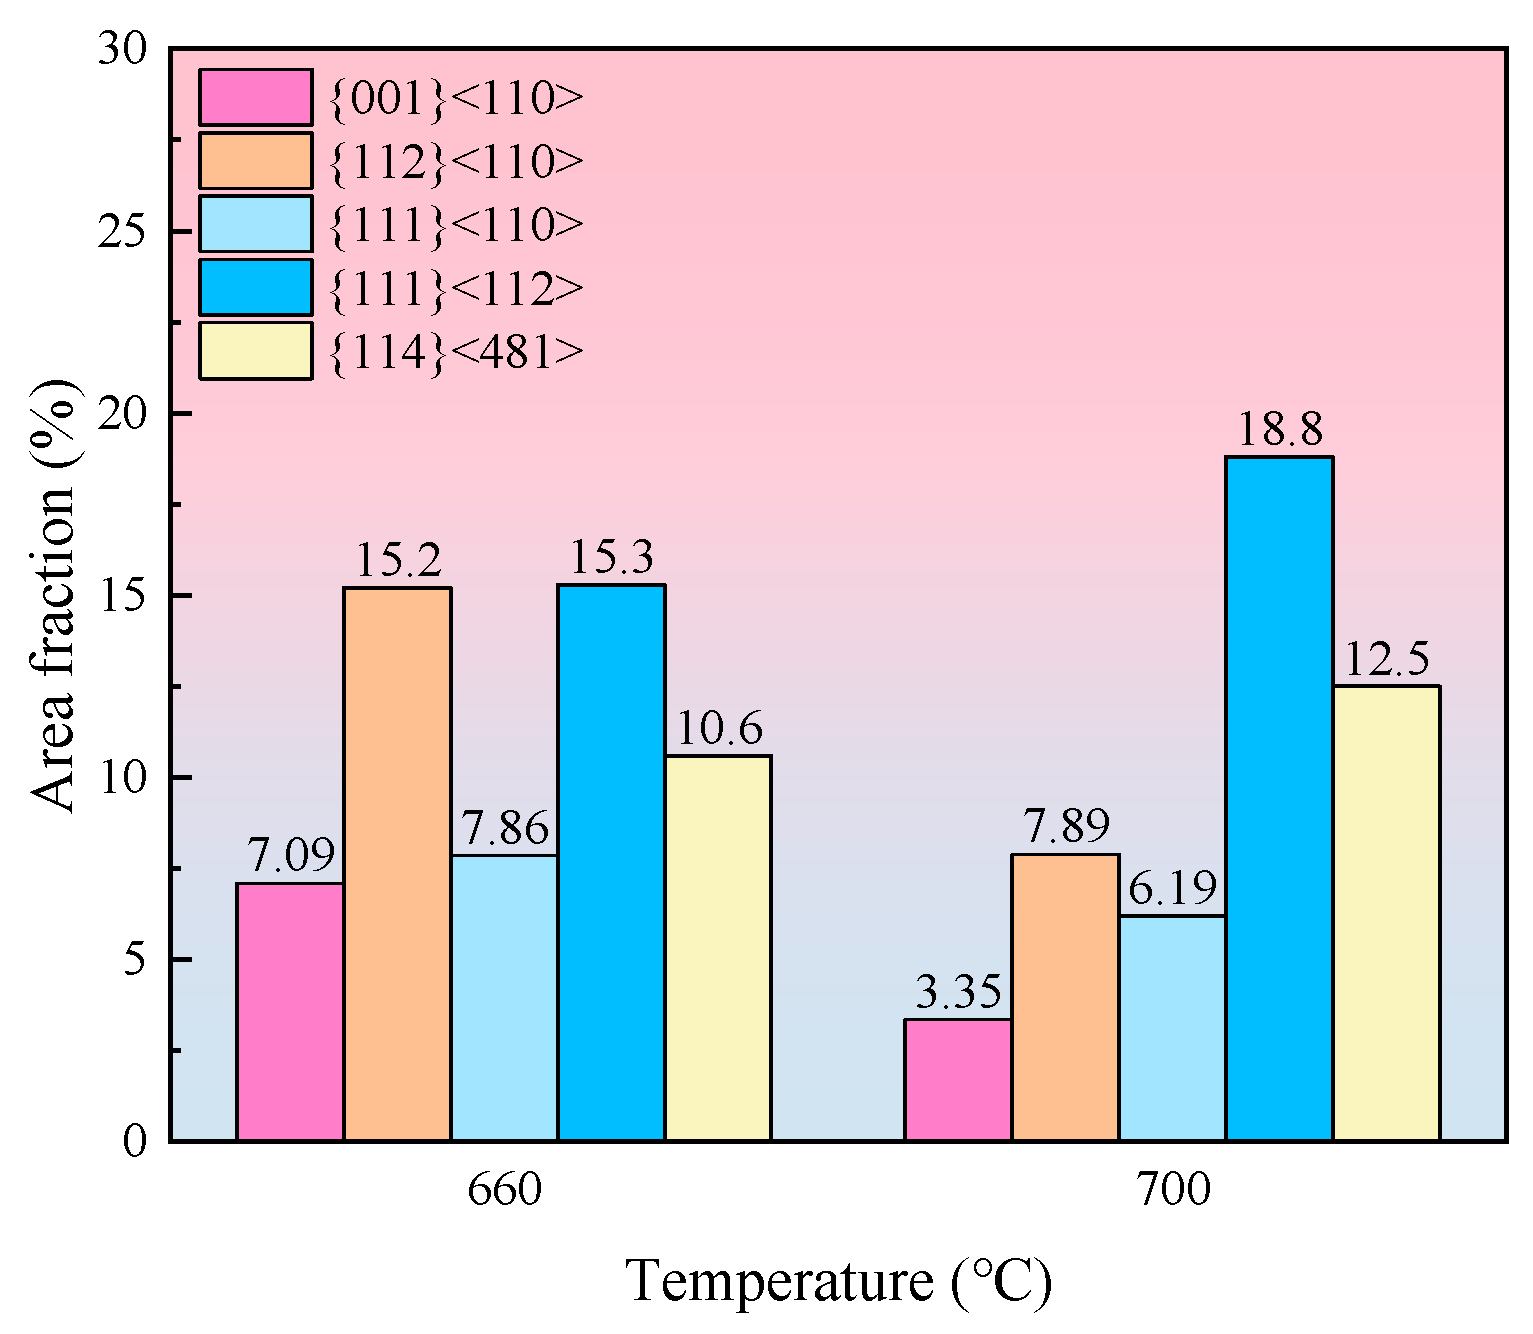
Generally, the driving force for recrystallization is the stored strain energy, meaning that at the same temperature, grains with higher stored strain energy will recrystallize first. The stored strain energy of different deformation matrices follows the order: E{111}<112> > E{111}<110> > E{112}<110> > E{001}<110> [9]. It is evident that deformed grains with {111}<112> and {111}<110> components recrystallize earlier, while those with {001}<110> component are the last to recrystallize. Figure 8(a1,b1) shows the inverse pole figure maps of samples at 660 °C and 700 °C, respectively. As shown in Figure 8(a2), the white circles indicate that {111}<112> grains nucleated within the deformed {111}<110> matrix and consumed the surrounding {111}<110> grains at 660 °C. Moreover, Figure 8(b2) reveals that a small portion of the deformed matrices with {112}<110> and {001}<110> components were still retained at 700 °C. At this stage, the white circles indicate that {114}<481> grains began to nucleate at the grain boundaries of the deformed {112}<110> and {001}<110> grains. According to Figure 9, from 660 °C to 700 °C, the area fractions of {001}<110>, {112}<110>, and {111}<110> grains (belonging to the α-fiber texture) decreased from 7.09%, 15.2%, and 7.86% to 3.35%, 7.89%, and 6.19%, respectively. Conversely, those of {111}<112> grains (associated with the γ-fiber texture) and {114}<481> grains (associated with the α*-fiber texture) increased from 15.3% and 10.6% to 18.8% and 12.5%, respectively.

3.3. Microstructure and Texture During Grain Growth

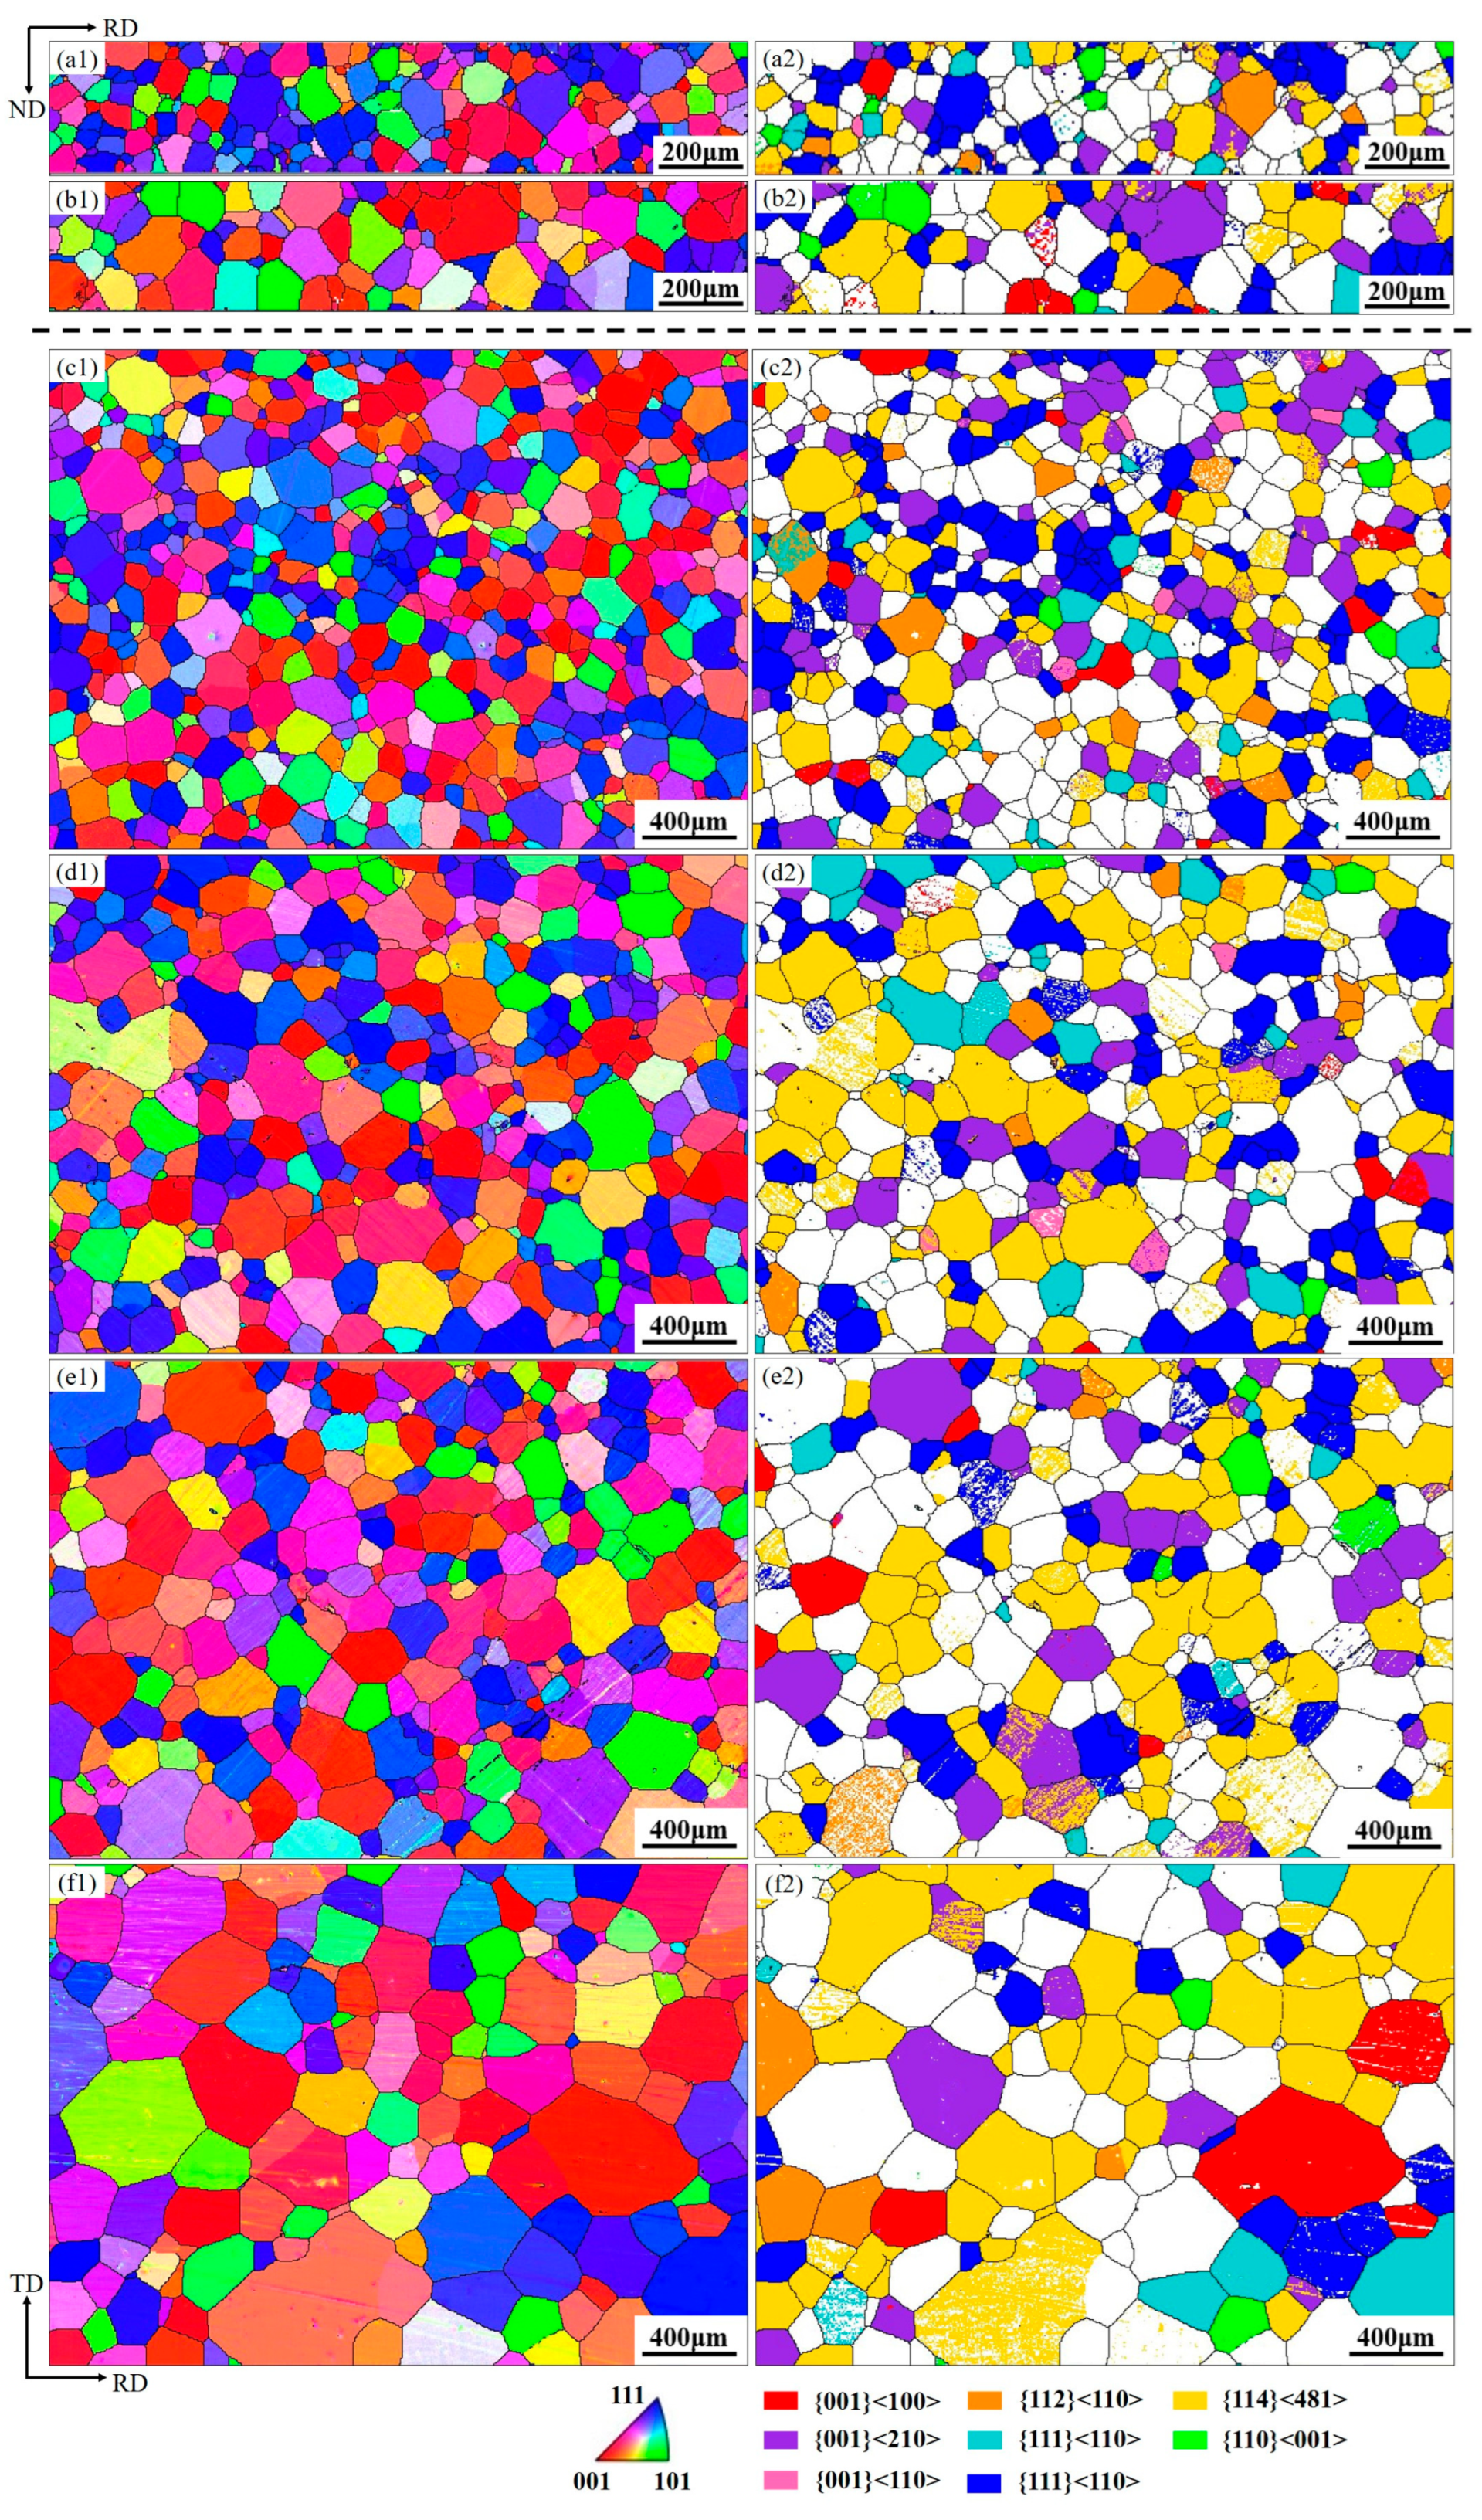
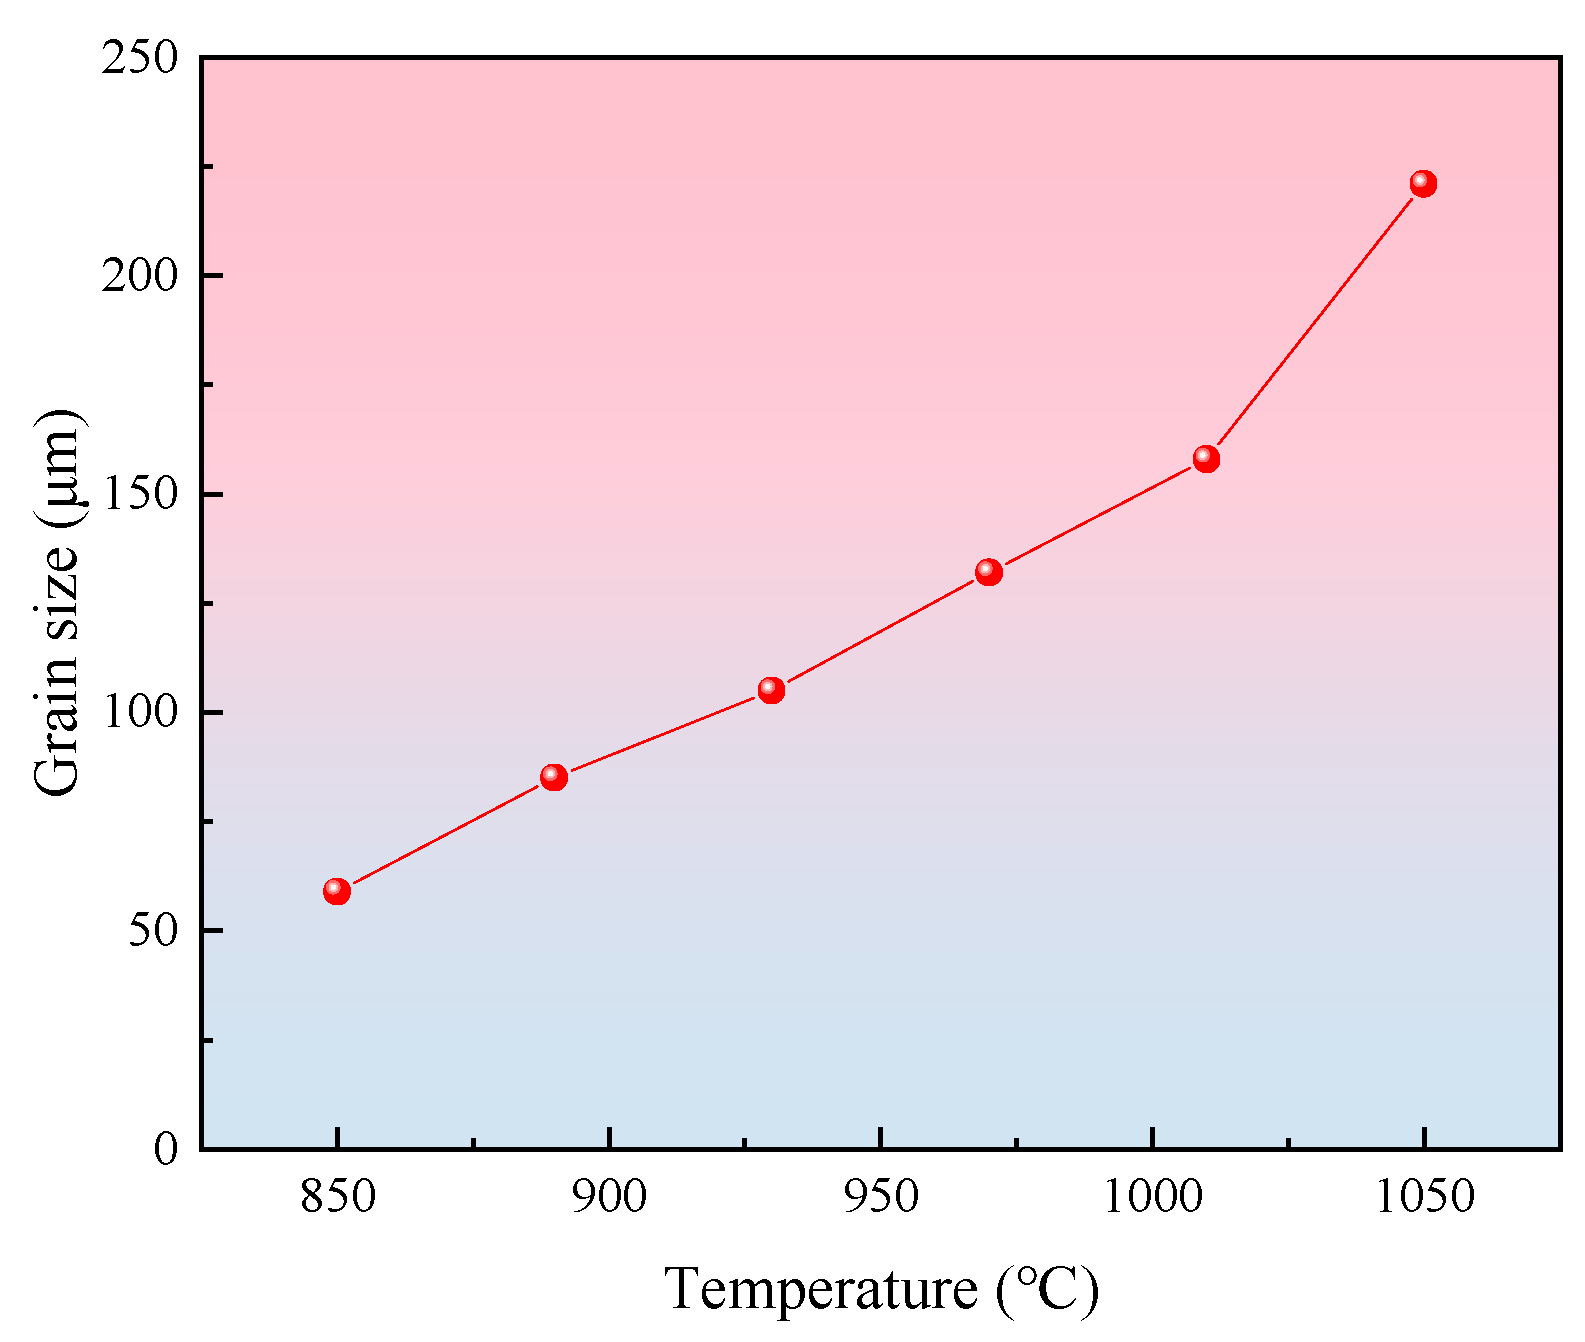
According to Figure 10(a1–f1), from 850 °C to 1050 °C, the annealed samples underwent complete recrystallization, and the average grain size increased with rising annealing temperature. The measured average grain sizes are presented in Figure 11, showing a rapid increase from 59 μm at 850 °C to 221 μm at 1050 °C. During normal grain growth, the grain growth rate is determined by the grain boundary mobility and the driving force, as expressed in Equation (1) [27]:
v = M · P
where v is the grain growth rate, M is the grain boundary mobility, and P is the driving force for grain growth. The increase in annealing temperature is highly beneficial for grain growth, as it enhances the grain boundary mobility [28].
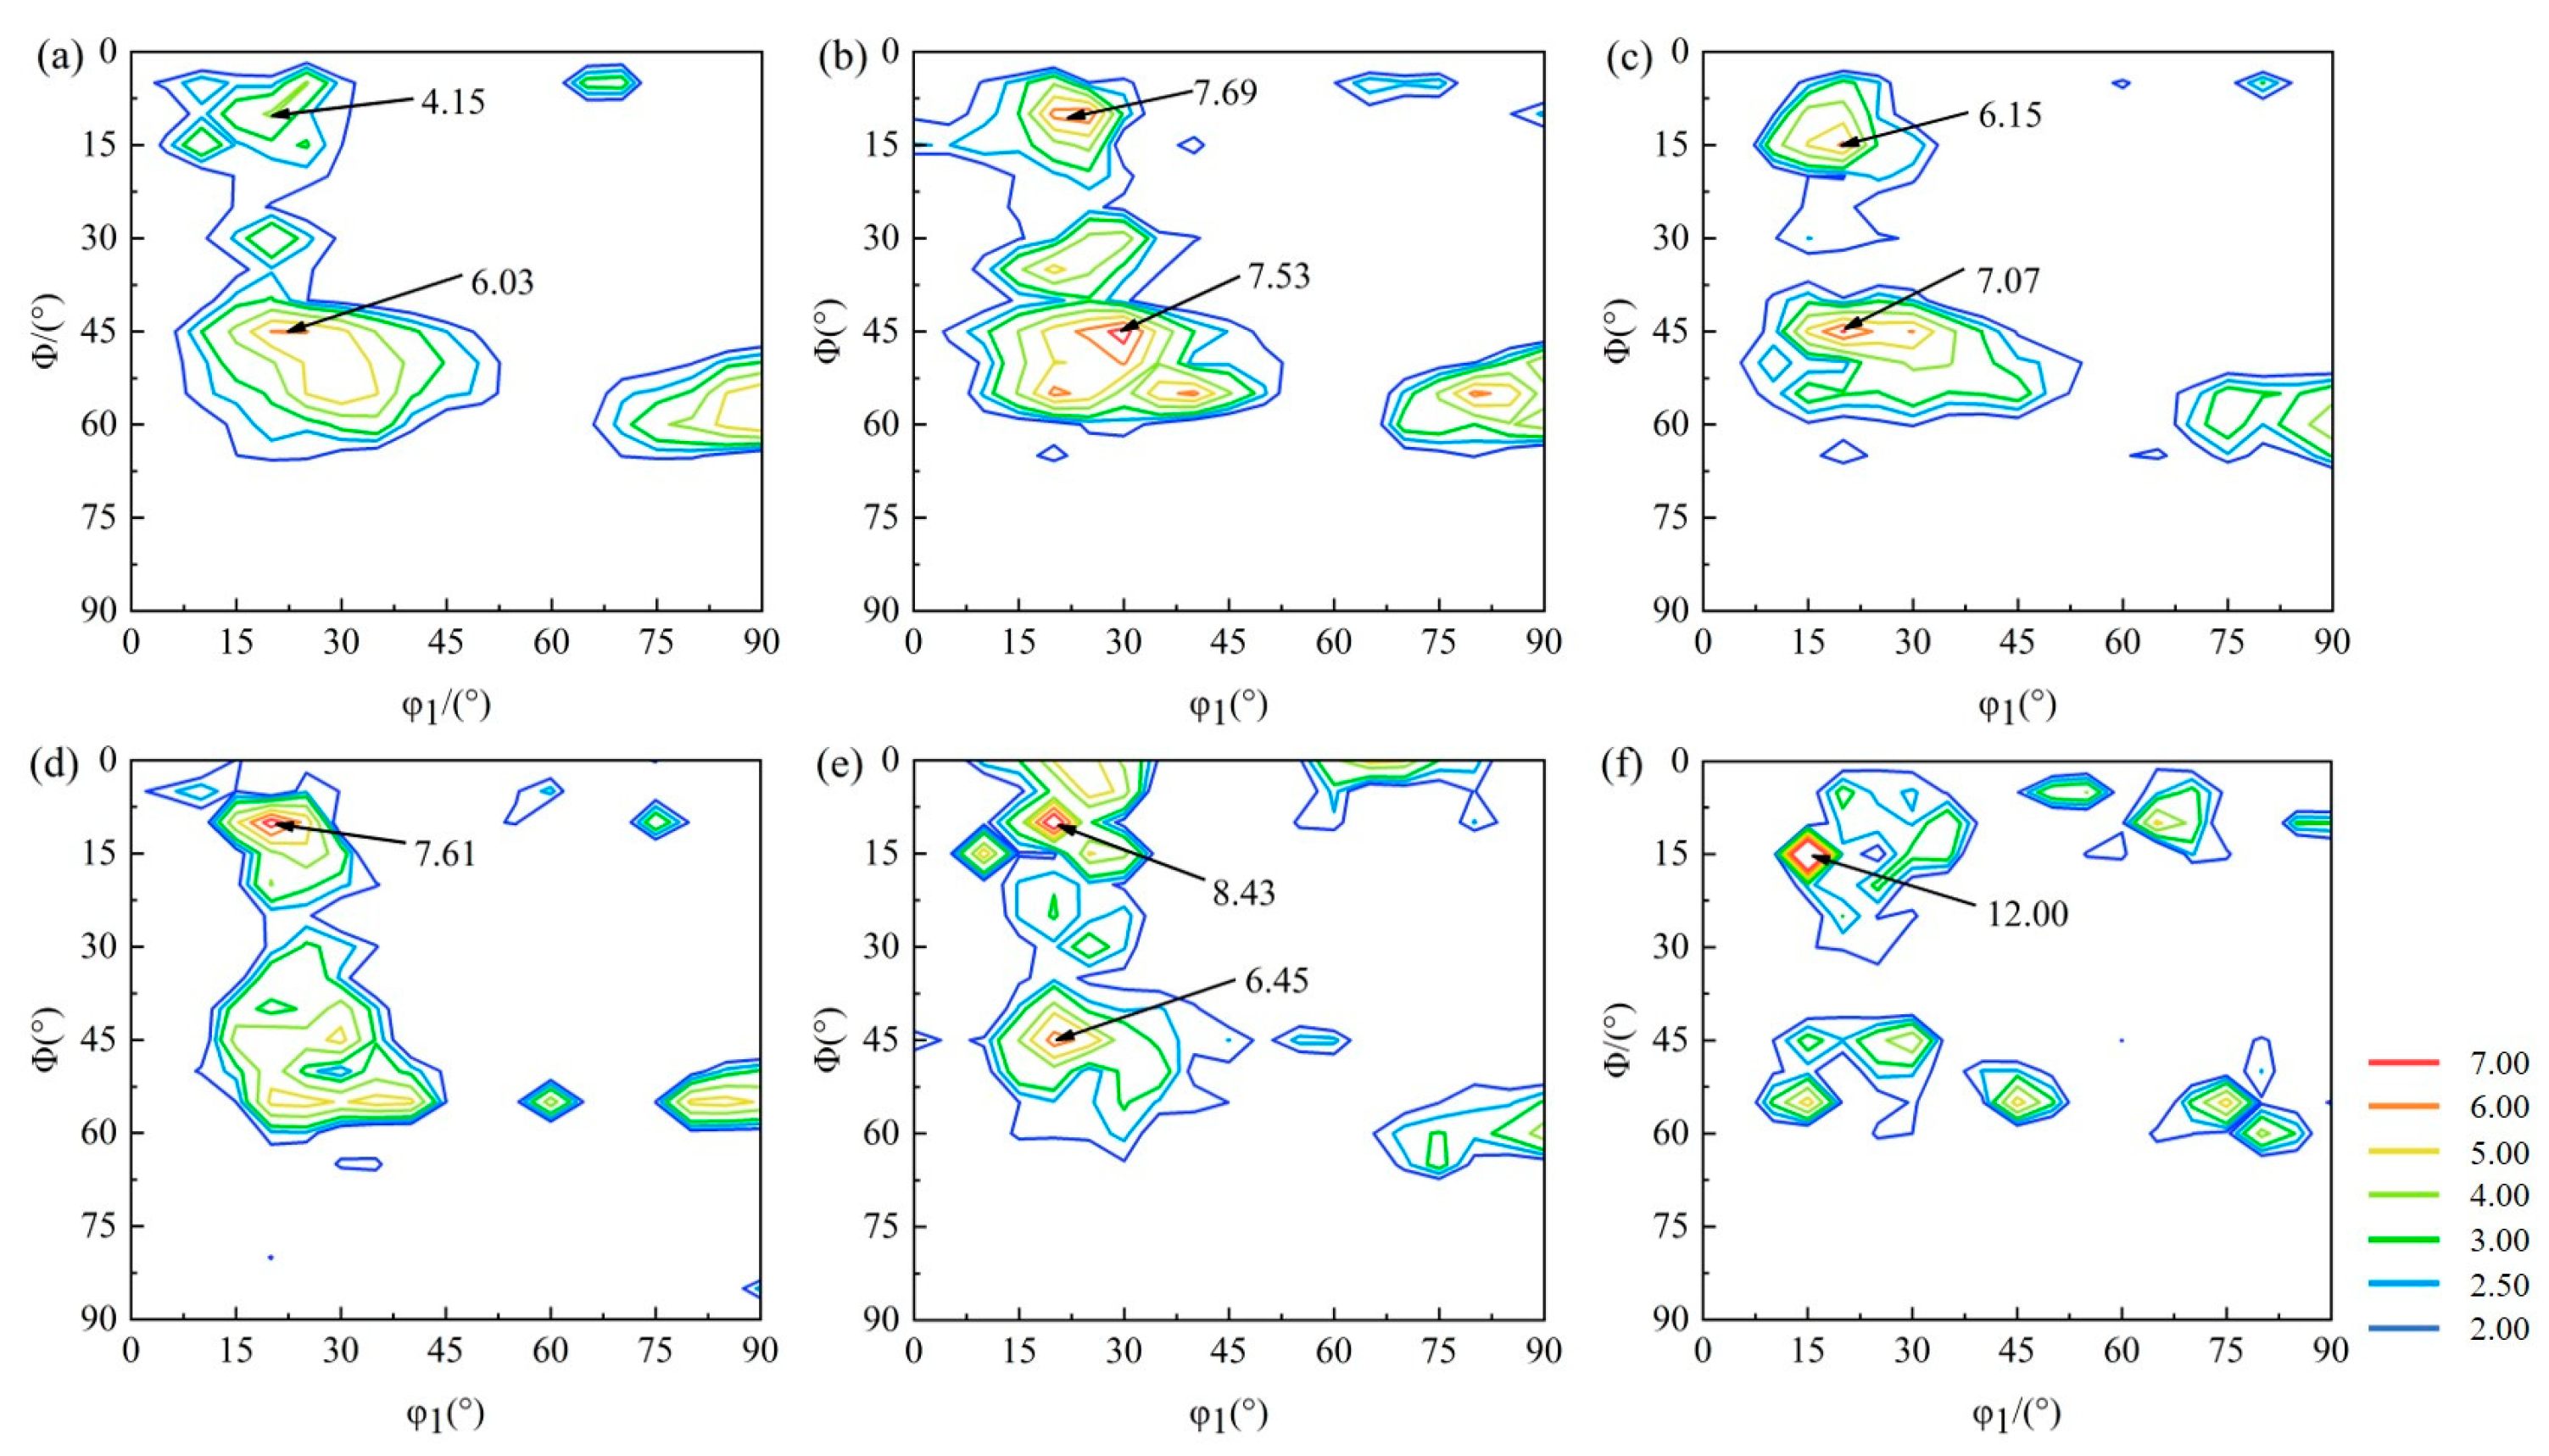
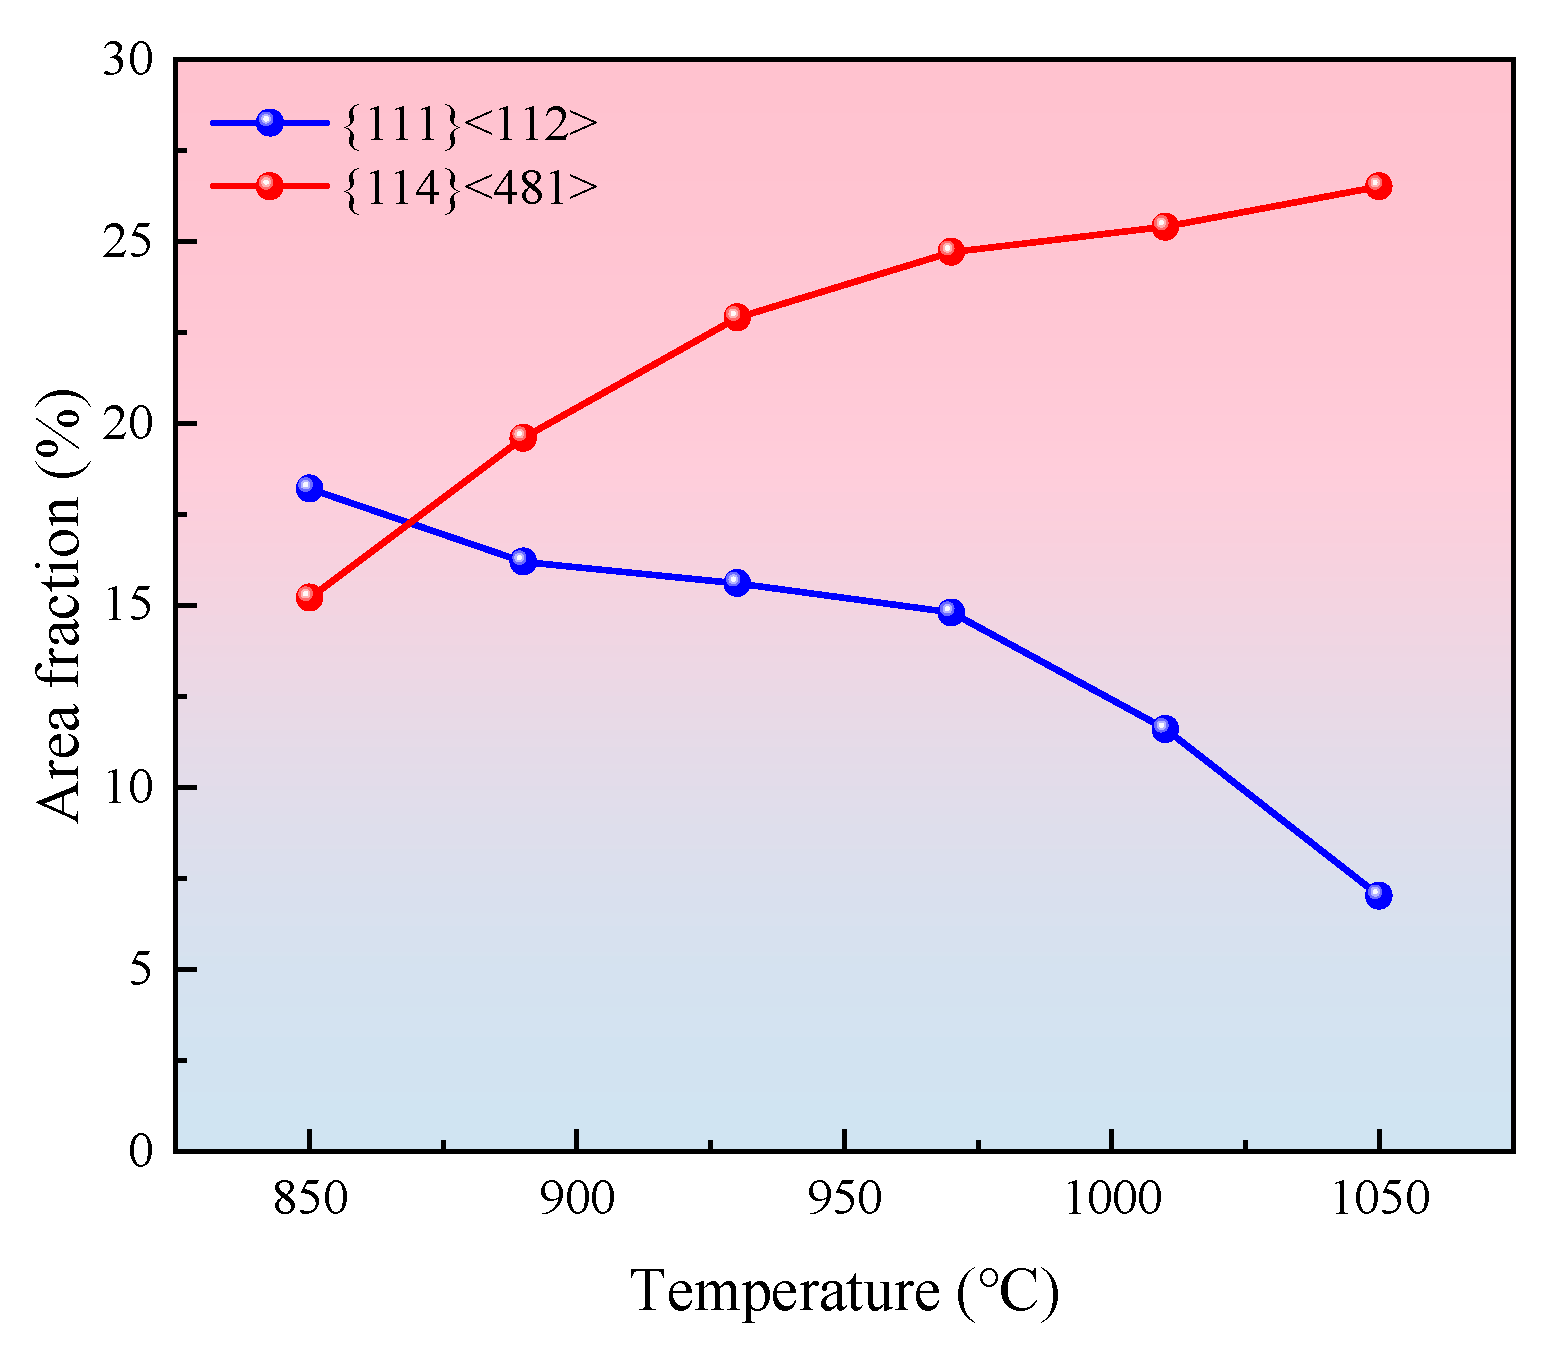
Furthermore, as shown in Figure 12, the annealed sample exhibits a macrotexture dominated by the α*-fiber and γ-fiber textures at 850 °C. Among them, the {111}<112> component, associated with the γ-fiber, displays a relatively high intensity. From 850 °C to 1050 °C, the macrotexture of the annealed samples gradually concentrates along the α*-fiber orientation line. In particular, at 1050 °C, the {114}<481> component belonging to the α*-fiber exhibits the highest intensity, peaking at 12.00. Combined with Figure 10(a2–f2) and Figure 13, it can be seen that with increasing annealing temperature (850 °C to 1050 °C), the area fraction of {111}<112> grains decreases from 18.2% to 7.02%, while that of {114}<481> grains increases from 15.2% to 26.5%. This is attributed to the difference in the distribution of their grain boundary misorientations.
It is widely accepted that small-angle grain boundaries, with a misorientation of less than 15° between adjacent grains, are considered to have low grain boundary mobility [29]. Conversely, large-angle grain boundaries (misorientation > 15°) are regarded as having high mobility. In other words, grains surrounded by large-angle grain boundaries tend to migrate more easily during annealing. Figure 14 illustrates the distribution of grain boundary misorientations for {111}<112> and {114}<481> grains at 850 °C. Among them, the frequency of small-angle grain boundaries in {111}<112> grains is 23.61%, while that of large-angle grain boundaries is 76.39%. For {114}<481> grains, the frequency of small-angle grain boundaries is 18.34%, and that of large-angle grain boundaries is 81.53%. It is clear that the frequency of large-angle grain boundaries in {114}<481> grains is higher than that in {111}<112> grains. Therefore, grain boundary migration in {114}<481> grains is easier compared with that in {111}<112> grains. This accounts for the observed increase in the area fraction of {114}<481> grains from 15.2% to 26.5%, accompanied by a decrease in that of {111}<112> grains from 18.2% to 7.02%, within the temperature range of 850 °C to 1050 °C.

3.4. Magnetic Properties

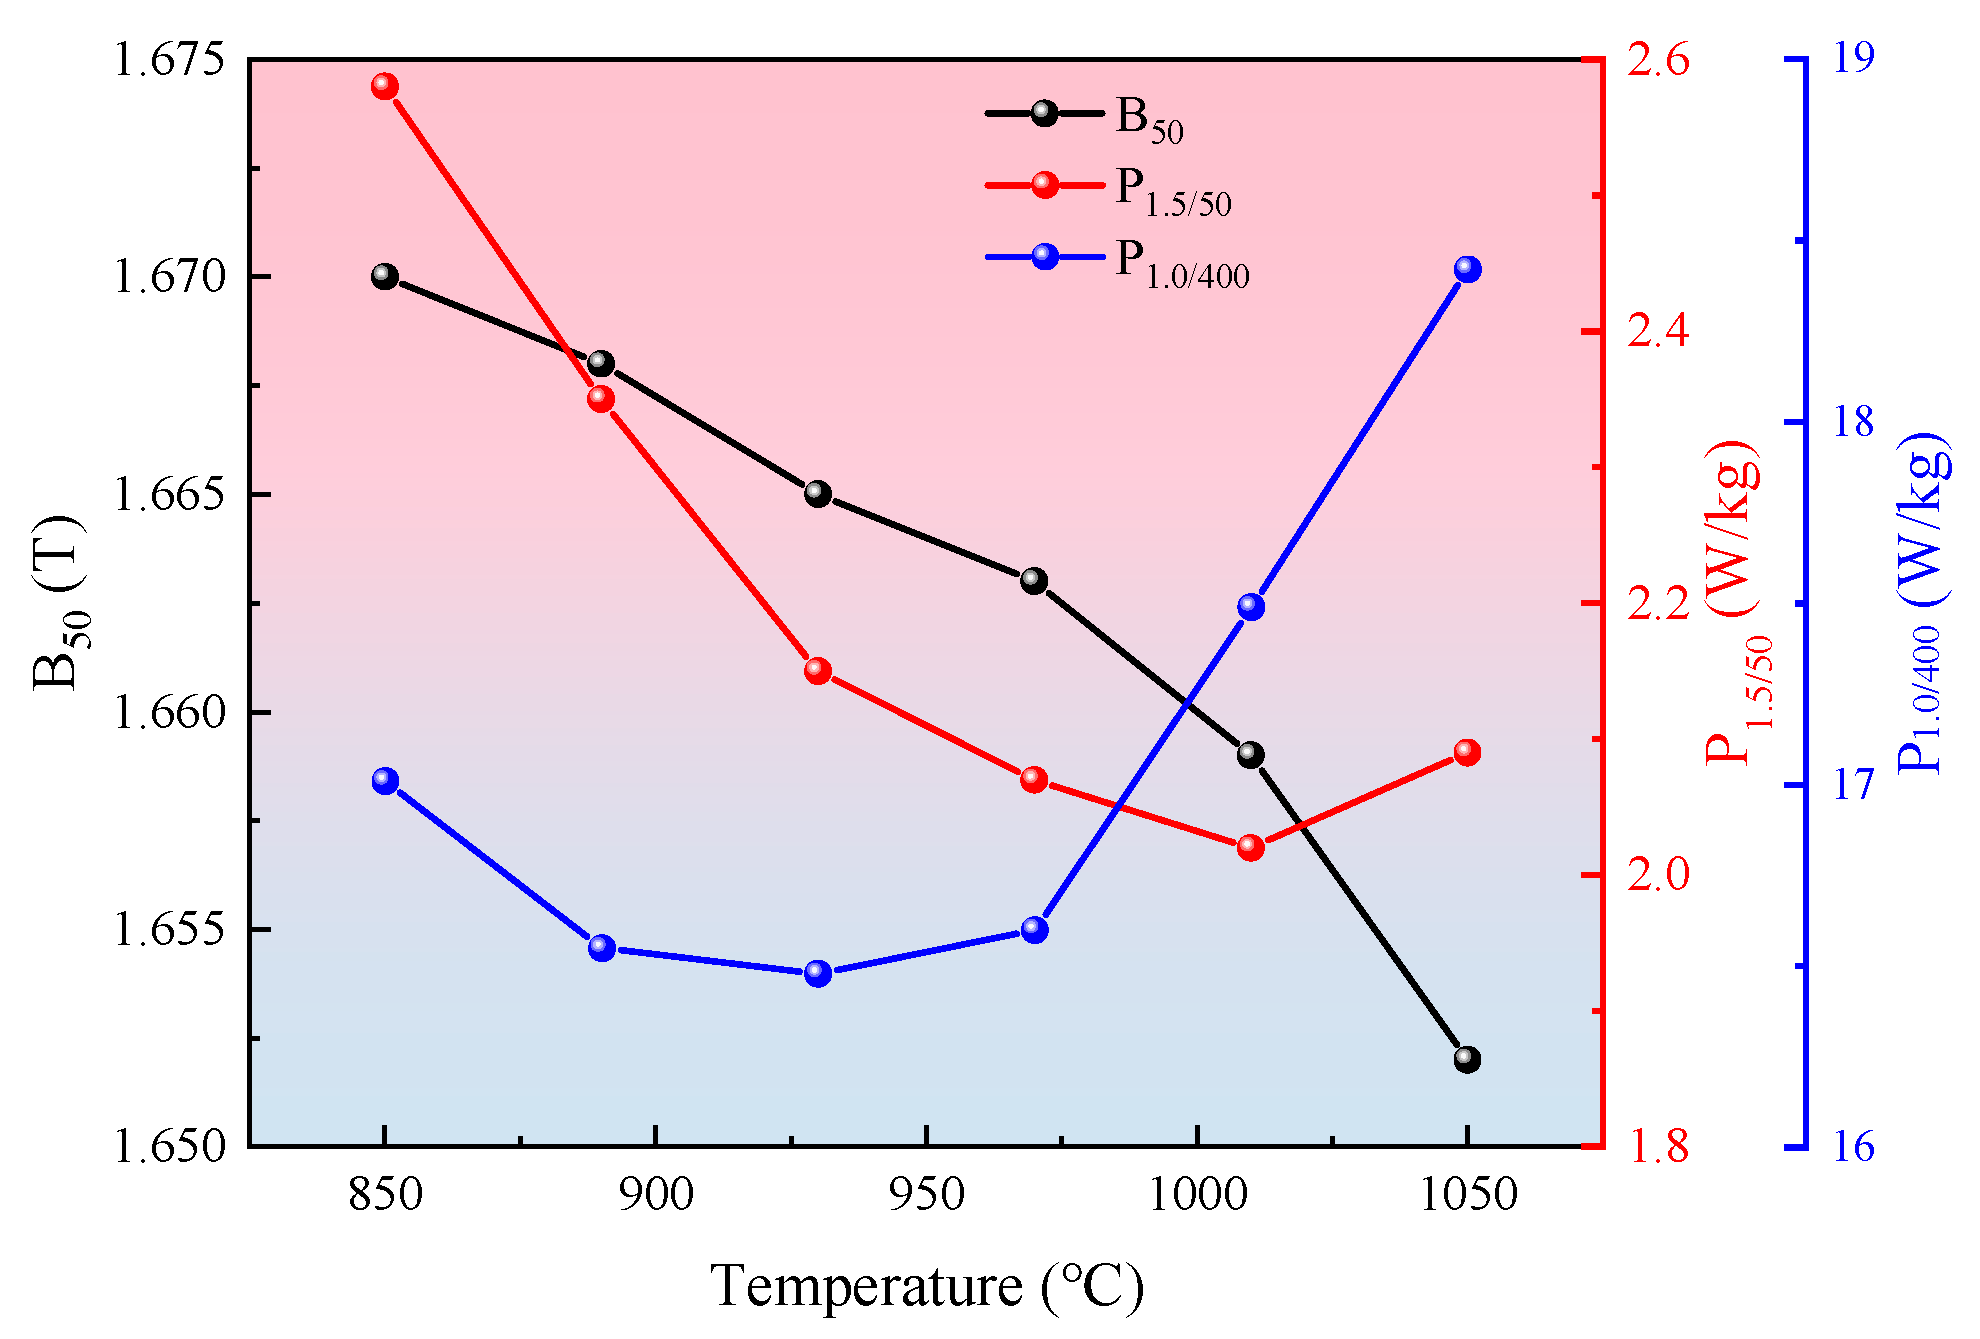
In non-oriented silicon steel, iron loss can be divided into hysteresis loss, eddy current loss, and anomalous loss [30]. An increase in grain size leads to a reduction in hysteresis loss but an increase in eddy current loss. Therefore, there is an optimal grain size that minimizes the total iron loss [31]. We can see from Figure 15 that P1.5/50 decreases sharply from 850 °C to 1010 °C, attaining its minimum value of 2.02 W/kg. After that, it increases slowly to 2.09 W/kg at 1050 °C. Meanwhile, P1.0/400 decreases gradually from 17.01 W/kg at 850 °C to 16.48 W/kg at 930 °C, followed by a dramatic increase from 970 °C to 1050 °C. According to Figure 11, the optimal grain size for P1.5/50 is 158 μm, while that for P1.0/400 is 105 μm. This difference is due to the fact that eddy current loss is proportional to the square of frequency, making it the dominant component of iron loss in the high-frequency range [32,33].
For non-oriented silicon steel with a given chemical composition, the magnetic induction is strongly influenced by the crystallographic texture and the grain size [34,35]. The quantitative relationship between texture and magnetic induction can be described using the A(g) parameter proposed by Kestens et al. [36], defined as the minimum angle between the magnetization vector of orientation g and the crystallographic ⟨001⟩ direction. Lower A-values are generally associated with facilitated magnetization processes in non-oriented silicon steel, thereby leading to improved magnetic induction. According to previous reports [37], the A-values for typical components are as follows: A{111}⟨112⟩ = 35.0 > A{114}⟨481⟩ = 27.3 > Aλ-fiber = 22.5. This indicates that the {114}⟨481⟩ orientation is more closely aligned with the λ-fiber compared with {111}⟨112⟩, implying a relatively smaller yet still favorable contribution to magnetic induction. In contrast, the {111}⟨112⟩ component represents a typical hard magnetization orientation, which strongly suppresses magnetic induction. In the present study, despite the decrease in the unfavorable {111}⟨112⟩ component and the increase in the favorable {114}⟨481⟩ component with annealing from 850 °C to 1050 °C, magnetic induction (B50) did not improve, as shown in Figure 15. The magnetic induction B50 decreased from 1.670 T at 850 °C to 1.652 T at 1050 °C. This deterioration can be primarily attributed to the increase in grain size, which grew from 59 μm at 850 °C to 221 μm at 1050 °C. On the one hand, the reduction in grain boundary area caused by grain coarsening can facilitate magnetization by lowering pinning effects and promoting domain wall motion. On the other hand, the concomitant enlargement of magnetic domains and reduction in the number of domain walls simplifies the domain structure. Within the grain size range considered in this study, the latter effect dominates, making magnetization primarily governed by high-energy domain rotation. This adverse effect of domain rotation on magnetization ultimately leads to the continuous decrease in B50 observed in the experiments.

4. Conclusions

1.
Recrystallization of the cold-rolled sheet begins at 620 °C and completes at 720 °C. During this process, the original deformed microstructure is replaced by fine recrystallized grains. In the early stage of recrystallization, {111}<112> grains nucleate within the deformed {111}<110> matrix and progressively consume it. In the later stage, {114}<481> grains nucleate and grow at the grain boundaries of the deformed {112}<110> and {001}<110> matrix. After recrystallization, the {111}<112> and {114}<481> components become the dominant texture components in the annealed sheet, replacing the α-fiber texture observed before recrystallization.
2.
From 850 °C to 1050 °C, the average grain size of the annealed non-oriented silicon steel sheet increases rapidly from 59 μm to 221 μm. During the grain growth process, the area fraction of {114}<481> grains surrounded by high-angle grain boundaries continuously increases, while that of {111}<112> grains surrounded by low-angle grain boundaries gradually decreases, due to high-angle grain boundaries exhibiting higher grain boundary mobility. As a result, the {114}<481> component becomes the dominant texture component in the annealed sheet at higher temperatures.
3.
There is an optimal grain size at which the total core loss reaches its minimum. At high frequencies, where eddy current loss dominates, the optimal grain size tends to decrease. With increasing annealing temperature, the core losses P1.5/50 and P1.0/400 of the non-oriented silicon steel initially decrease and subsequently increase, exhibiting minimum values at 1010 °C and 930 °C, respectively. The gradual decline in magnetic induction (B50) is attributed to the increase in average grain size.

Author Contributions

Conceptualization, S.C. and L.X.; methodology, S.C. and F.G.; validation, S.C., L.X. and F.G.; formal analysis, S.C.; investigation, L.X.; resources, S.Q.; data curation, F.G.; writing—original draft preparation, S.C.; writing—review and editing, L.X. and S.Q.; project administration, S.Q.; funding acquisition, S.Q. All authors have read and agreed to the published version of the manuscript.

Funding

This research was funded by Department of Science and Technology of Anhui Province (Anhui Province Science and Technology Breakthrough Plan Project), grant number 202423i08050049.

Data Availability Statement

The original contributions presented in the study are included in the article, further inquiries can be directed to the corresponding authors.

Acknowledgments

The authors would like to thank Qihang Zhou for assistance with software and visualization, and Yong Gan for supervision during the research.

Conflicts of Interest

Authors Shaoyang Chu, Feihu Guo and Shengtao Qiu was employed by the company Central Iron and Steel Research Institute. The remaining authors declare that the research was conducted in the absence of any commercial or financial relationships that could be construed as a potential conflict of interest.

References

  1. Oda, Y.; Okubo, T.; Takata, M. Recent development of non-oriented electrical steel in JFE steel. JFE Tech. Rep. 2016, 21, 7–13. [Google Scholar]
  2. Senda, K.; Namikawa, M.; Hayakawa, Y. Electrical steels for advanced automobiles–core materials for motors, generators and high-frequency reactors. JFE Tech. Rep. 2004, 4, 67–73. [Google Scholar]
  3. Akira, K.; Kazunari, T. Development of the IMA Motor for the V6 Hybrid Mid-size Sedan. In Proceedings of the SAE 2005 World Congress, Detroit, MI, USA, 11–14 April 2005. [Google Scholar]
  4. Pei, R.; Zeng, L.; Chen, X.; Liu, X. Studies of high-efficiency electrical steels used in electric vehicle motors. J. Shanghai Jiaotong Univ. (Sci.) 2012, 17, 319–322. [Google Scholar] [CrossRef]
  5. Kubota, T. Recent progress on non-oriented silicon steel. Steel Res. Int. 2005, 76, 464–470. [Google Scholar] [CrossRef]
  6. Toda, H.; Oda, Y.; Kohno, M.; Ishida, M.; Zaizen, Y. A new high flux density non-oriented electrical steel sheet and its motor performance. IEEE Trans. Magn. 2012, 48, 3060–3063. [Google Scholar] [CrossRef]
  7. Wakisaka, T.; Arai, S.; Kurosaki, Y. Electrical steel sheet for traction motor of hybrid/electrical vehicles. Nippon Steel Tech. Rep. 2013, 103, 116–120. [Google Scholar]
  8. Elwert, T.; Goldmann, D.; Römer, F.; Buchert, M.; Merz, C.; Schueler, D.; Sutter, J. Current developments and challenges in the recycling of key components of (hybrid) electric vehicles. Recycling 2016, 1, 25–60. [Google Scholar] [CrossRef]
  9. Park, J.T.; Szpunar, J.A. Evolution of recrystallization texture in nonoriented electrical steels. Acta Mater. 2003, 51, 3037–3051. [Google Scholar] [CrossRef]
  10. Cunha, M.A.; Paolinelli, S.C. Effect of the annealing temperature on the structure and magnetic properties of 3% Si non-oriented steel. J. Magn. Magn. Mater. 2003, 254, 379–381. [Google Scholar] [CrossRef]
  11. Qiao, J.; Liu, C.; Guo, F.; Xiang, L.; Qiu, S.; Wang, H. Effect of recrystallization annealing temperature on texture and magnetic properties of 2.97% Si non-oriented silicon steel. Metall. Res. Technol. 2019, 116, 412. [Google Scholar] [CrossRef]
  12. Li, Z.H.; Wang, G.D.; Liu, H.T. Effects of processing routes on recrystallization texture development and magnetic properties of 0.10 mm ultrathin non-oriented electrical steel sheets for high-frequency application. J. Alloys Compd. 2023, 935, 167984. [Google Scholar]
  13. Li, Z.; Xie, S.; Wang, G.; Liu, H. Ultrathin-gauge high silicon non-oriented electrical steel with high permeability and low core loss fabricated by optimized two-stage cold rolling method. Mater. Charact. 2022, 183, 111593. [Google Scholar] [CrossRef]
  14. Yu, L.; Luo, H.W. Effect of partial recrystallization annealing on magnetic properties and mechanical properties of non-oriented silicon steel. Acta Metall. Sin. 2020, 56, 291–300. [Google Scholar]
  15. Ushioda, K.; Hutchinson, W.B. Role of shear bands in annealing texture formation in 3% Si–Fe (111)[112] single crystals. ISIJ Int. 1989, 29, 862–867. [Google Scholar] [CrossRef]
  16. Böttcher, A.; Lücke, K. Influence of subsurface layers on texture and microstructure development in RGO electrical steel. Acta Metall. Mater. 1993, 41, 2503–2514. [Google Scholar] [CrossRef]
  17. Dorner, D.; Zaefferer, S.; Raabe, D. Retention of the Goss orientation between microbands during cold rolling of an Fe–3%Si Single Crystal. Acta Mater. 2007, 55, 2519–2530. [Google Scholar]
  18. Raabe, D.; Lücke, K. Rolling and annealing textures of BCC metals. Mater. Sci. Forum. 1994, 157, 597–610. [Google Scholar]
  19. Wang, J.; Li, J.; Wang, X.F.; Tian, J.J.; Zhang, C.H.; Zhang, S.G. Effect of heating rate on microstructure evolution and magnetic properties of cold rolled non-oriented electrical steel. J. Iron Steel Res. Int. 2010, 17, 54–61. [Google Scholar] [CrossRef]
  20. Inagaki, H. Fundamental aspect of texture formation in low carbon steel. ISIJ Int. 1994, 34, 313–321. [Google Scholar] [CrossRef]
  21. Hölscher, M.; Raabe, D.; Lücke, K. Rolling and recrystallization textures of BCC steels. Steel Res. 1991, 62, 567–575. [Google Scholar] [CrossRef]
  22. Liu, J.; Sha, Y.; Hu, K.; Zhang, F.; Zuo, L. Formation of Cube and Goss texture after primary recrystallization in electrical steels. Metall. Mater. Trans. A 2014, 45, 134–138. [Google Scholar] [CrossRef]
  23. Dafe, S.S.F.; Costa Paolinelli, S.; Cota, A.B. Influence of thermomechanical processing on shear bands formation and magnetic properties of a 3% Si non-oriented electrical steel. J. Magn. Magn. Mater. 2011, 323, 3234–3238. [Google Scholar] [CrossRef]
  24. Sidor, J.J.; Verbeken, K.; Gomes, E.; Schneider, J.; Calvillo, P.R.; Kestens, L.A.I. Through process texture evolution and magnetic properties of high Si non-oriented electrical steels. Mater. Charact. 2012, 71, 49–57. [Google Scholar] [CrossRef]
  25. Jiao, H.; Xu, Y.; Song, W.; Zhang, Y.; Cao, G.; Li, C.; Niu, J.; Misra, R.D.K. High-permeability and thin-gauge non-oriented electrical steel through twin-roll strip casting. Mater. Des. 2017, 136, 23–33. [Google Scholar] [CrossRef]
  26. Homma, H.; Nakamura, S.; Yoshinaga, N. On {h,1,1}<1/h,1,2>, the recrystallisation texture of heavily cold rolled BCC steel. Mater. Sci. Forum 2004, 467, 269–274. [Google Scholar]
  27. Hillert, M. On the theory of normal and abnormal grain growth. Acta Metall. 1965, 13, 227–238. [Google Scholar] [CrossRef]
  28. Turnbull, D. Theory of grain boundary migration rates. JOM 1951, 3, 661–665. [Google Scholar] [CrossRef]
  29. Omura, T.; Hayakawa, Y. Influence of primary-recrystallization texture on selective growth of Goss grains. Mater. Trans. 2013, 54, 14–21. [Google Scholar] [CrossRef]
  30. Campos, M.F.; Teixeira, J.C.; Landgraf, F.J.G. The optimum grain size for minimizing energy losses in iron. J. Magn. Magn. Mater. 2006, 301, 94–99. [Google Scholar] [CrossRef]
  31. Shiozaki, M.; Kurosaki, Y. The effects of grain size on the magnetic properties of nonoriented electrical steel sheets. J. Mater. Eng. 1989, 11, 37–43. [Google Scholar] [CrossRef]
  32. Oda, Y.; Kohno, M.; Honda, A. Recent development of non-oriented electrical steel sheet for automobile electrical devices. J. Magn. Magn. Mater. 2008, 320, 2430–2435. [Google Scholar] [CrossRef]
  33. Campos, M.F.; Yonamine, T.; Fukuhara, M.; Landgraf, F.J.G.; Achete, C.A.; Missell, F.P. Effect of frequency on the iron losses of 0.5% and 1.5% Si nonoriented electrical steels. IEEE Trans. Magn. 2006, 42, 2812–2814. [Google Scholar] [CrossRef]
  34. PremKumar, R.; Samajdar, I.; Viswanathan, N.N.; Singal, V.; Seshadri, V. Relative effect(s) of texture and grain size on magnetic properties in a low silicon non-grain oriented electrical steel. J. Magn. Magn. Mater. 2003, 264, 75–85. [Google Scholar] [CrossRef]
  35. Gomes, E.; Schneider, J.; Verbeken, K.; Barros, J.; Houbaert, Y. Correlation between microstructure, texture, and magnetic induction in nonoriented electrical steels. IEEE Trans. Magn. 2010, 46, 310–313. [Google Scholar] [CrossRef]
  36. Kestens, L.; Jacobs, S. Texture control during the manufacturing of nonoriented electrical steels. Texture Stress Microstruct. 2008, 2008, 173083. [Google Scholar] [CrossRef]
  37. Ning, X.; Liang, Y.; Wang, Y.; Feng, Y.; Lin, J. A comprehensive study on texture evolution and recrystallization mechanism of Fe-4.5 wt% Si with strong {114}<481>. J. Mater. Res. Technol. 2023, 27, 7506–7520. [Google Scholar]
Figure 1. Ideal crystallographic components on the φ2 = 45° section of ODF.
Metals 15 01235 g001
Figure 2. Microstructure of cold-rolled sheet.
Metals 15 01235 g002
Figure 3. Macrotexture of cold-rolled sheet. (a) S = 1; (b) S = 0.
Metals 15 01235 g003
Figure 4. The α-fiber and γ-fiber orientation lines of the cold-rolled sheet at S = 1 and S = 0. (a) α-fiber orientation line; (b) γ-fiber orientation line.
Metals 15 01235 g004
Figure 5. Recrystallized microstructure at different annealing temperatures. (a) 620 °C; (b) 640 °C; (c) 660 °C; (d) 680 °C; (e) 700 °C; (f) 720 °C.
Metals 15 01235 g005
Figure 6. Relationship between recrystallization fraction and annealing temperature.
Metals 15 01235 g006
Figure 7. Macrotexture evolution at different annealing temperatures during recrystallization. (a) 620 °C; (b) 640 °C; (c) 660 °C; (d) 680 °C; (e) 700 °C; (f) 720 °C.
Metals 15 01235 g007
Figure 8. Inverse pole figure maps and specific crystallographic component maps annealed at 660 °C and 700 °C. (a1,a2) 660 °C; (b1,b2) 700 °C.
Metals 15 01235 g008
Figure 9. Area fraction of specific crystallographic components after annealing at 660 °C and 700 °C.
Metals 15 01235 g009
Figure 10. Inverse pole figure maps and specific crystallographic component maps at different annealing temperatures during grain growth. (a1,a2) 850 °C; (b1,b2) 890 °C; (c1,c2) 930 °C; (d1,d2) 970 °C; (e1,e2) 1010 °C; (f1,f2) 1050 °C.
Metals 15 01235 g010
Figure 11. Relationship between grain size and annealing temperature.
Metals 15 01235 g011
Figure 12. Macrotexture evolution at different annealing temperatures during grain growth. (a) 850 °C; (b) 890 °C; (c) 930 °C; (d) 970 °C; (e) 1010 °C; (f) 1050 °C.
Metals 15 01235 g012
Figure 13. Area fractions of {111}<112> and {114}<481> grains at different annealing temperatures during grain growth.
Metals 15 01235 g013
Figure 14. Distribution of Grain Boundary Misorientation for {111}<112> and {114}<481> Grains at 850 °C.
Metals 15 01235 g014
Figure 15. Relationship between Magnetic Properties and Annealing Temperature.
Metals 15 01235 g015
Table 1. Chemical composition of the non-oriented silicon steel.
SiAlMnCSPN
3.20.90.270.00240.00190.0130.0018
Disclaimer/Publisher’s Note: The statements, opinions and data contained in all publications are solely those of the individual author(s) and contributor(s) and not of MDPI and/or the editor(s). MDPI and/or the editor(s) disclaim responsibility for any injury to people or property resulting from any ideas, methods, instructions or products referred to in the content.