Article

Novel Alloy Designed Electrical Steel for Improved Performance in High-Frequency Electric Machines

by
Carl Slater
*,
Xiyun Ma
,
Gwendal Lagorce
,
Juliette Soulard
and
Claire Davis
WMG (Warwick Manufacturing Group), University of Warwick, Coventry CV4 7AL, UK
*
Author to whom correspondence should be addressed.
Metals 2025, 15(10), 1066; https://doi.org/10.3390/met15101066
Submission received: 26 August 2025 / Revised: 11 September 2025 / Accepted: 22 September 2025 / Published: 23 September 2025
(This article belongs to the Special Issue Electrical Steels)

Abstract

The increase in electrification and desire for greater electrical motor efficiency under a range of operating conditions for different products (e.g., household appliances, automotive and aerospace) is driving innovative motor designs and demands for higher performing electrical steels. Improvements in the magnetic, electrical and/or mechanical properties of electrical steels are required for high-volume electric motors and recent advances include steels with increased silicon (Si) content (from <3.5 wt% Si up to 6.5 wt%). Whilst the 6.5 wt% Si steels provide increased motor performance at high frequencies, the formation of a brittle BCC B2/D03 phase means that they cannot be cold-rolled, and therefore the production route involves siliconization after the required thickness strip is produced. The advances in computationally driven alloy design, coupled with physical metallurgical understanding, allow for more adventurous alloy design for electrical steels, outside the traditional predominantly Fe-Si compositional space. Two alloys representing a new alloy family called HiPPES (High-Performing and Processable Electrical Steel), based on low cost commonly used steel alloying elements, have been developed, cast, rolled, heat-treated, and both magnetically and mechanically tested. These alloys (with nominal compositions of Fe-3.2Mn-3.61Si-0.63Ni-0.75Cr-0.15Al-0.4Mo and Fe-2Mn-4.5Si-0.4Ni-0.75Cr-0.09Al) offer improvements compared to current ≈3 wt% Si grades: in magnetic performance (>25% magnetic loss reduction at >1 kHz), and in tensile strength (>33% increase in tensile strength with similar elongation value). Most importantly, they are maintaining processability to allow for full-scale commercial production using traditional continuous casting, hot and cold rolling, and annealing. The new alloys also showed improved resilience to grain size, with the HiPPES materials showing a <5% variance in loss at frequencies greater than 400 Hz for grain sizes between 55 and 180 µm. Comparatively, a commercial M250-35A material showed a 40% increase in loss for the same range. The paper reports on the alloy design approach used, the microstructures, and the mechanical, electrical and magnetic properties of the developed novel electrical steels compared to conventional ≈3 wt% Si and 6.5 wt% Si material.

1. Introduction

Global trends towards electrification to reduce CO2 emissions is driving demand for higher-performance electric machines, including low-cost bulk-produced efficient motors, as well as powerful systems for applications in domains such as aerospace. For example, the accelerated targets of COP26 for all new cars and vans sold to be fully electric by 2040 have led to the production of electric vehicles (EVs) increasing dramatically, with sales rising from 3.25 M to 6.75 M units from 2020 to 2021 and predicted to accelerate further. This means that the demand for the key components/materials for these machines will also increase in volume as well as in improved performance. Non-grain-oriented (NGO) electrical steel is a key material in electric motors; on average, each EV has around 30 kg of electrical steel in the motors. The 2021 production of electrical steel worldwide was 5.1 Mt [1], with current projections suggesting that if 250–350 M EV per year are being manufactured by 2030, this requires a minimum increase of 150% (a total of 12.5 Mt) in global production of electrical steel. The development of new electrical steel grades that improve the efficiency of electric motors will therefore provide future environmental benefits.
Current NGO electrical steels typically use <3.5 wt% silicon (Si), with 3.2 wt% being the most widely used commercially [2], and represent an improvement over pure iron, which was the soft magnetic material of choice in the early 20th century. Modern NGO electrical steels are predominantly binary alloys (Fe-Si) with minor additions for grain pinning (aluminum (Al), nitrogen (N)) and offer a cost-effective, mass-producible alloy which dominates (around 80%) the soft magnetic materials market for electric motors [3].
In the early 1900s, 6.5 wt% Si electrical steel was first proposed for electric machines due to its superior magnetic properties (increased electrical resistivity and reduced coercivity) based on theoretical predictions [4]. Until the early 2000s, the commercial drive to produce this material was limited but the desire for higher-frequency motors has meant that it is now being produced and used in high-performance applications. However, this material is extremely brittle due to the transformation from a disorder BCC phase (A2) to the ordered BCC structures of the B2 and D03 phases [5,6], which limits its processability. Electrical steels are produced by continuous casting, followed by hot/cold rolling, and annealing to strips with gauges 0.35 mm and below. However, 6.5 wt% Si steels are too brittle to be cold-rolled, and therefore alternate processing routes are required, such as twin roll casting [7], melt spinning [8], warm temper rolling [9], and siliconization [10,11]. The latter siliconization route has been commercialized and involves the deposition of SiCl4 onto a ≈3 wt% Si steel strip of required final thickness followed by heat treatment to diffuse Si into the strip to achieve the desired final composition. There are still challenges for the widespread adoption of 6.5 wt% Si electrical steel due to its higher cost, limited volume production and difficulties in subsequent processing (such as stamping), which means there are still opportunities to develop higher performance NGO electrical steels.
EVs (and other electrical motor applications) not only need electrical steels with improved magnetic properties but higher strength levels would be beneficial as well. With motor RPMs increasing and the preference to use thinner laminations (which reduce eddy current losses), then higher loads and stresses are being experienced by the sheets. It is known that the magnetic properties of electrical steels are significantly deteriorated when stresses exceed the materials yield stress [12], therefore high-strength steel is also needed where a centrifugal force is applied.
This paper presents the development of a new family of alloys called HiPPES (High-Performing and Processable Electrical Steel) that have been designed to provide high-performance electro-magnetic properties (similar to those of 6.5 wt% Si electrical steel) and increased strength (compared to ≈3 wt% Si electrical steel) using low-cost alloying additions but avoiding the formation of brittle phases.

2. Fundamentals of Alloy Design for the Proposed Steels

An alloy design approach has been adopted to identify and assess a large matrix of potential compositions using Thermocalc 2024a (TCFe9 and MOBFe5 databases) and Matlab 2024b, as illustrated in Figure 1. A feedback loop generates a composition within the defined limits that is fully ferritic (BCC > 0.99, this includes all BCC phase and is used to remove alloys that may contain retained austenite) and then determines specific alloy characteristics used for performance ranking. A temperature of 500 °C was selected for the predictions, as below this temperature CALPHAD simulation can start to predict equilibrium-phase formations of inter-metallics that would not form during the conventional processing of steels due to the non-equilibrium conditions.
The alloy additions were limited to seven elements that are commonly used as alloying additions in high-production volume steels, based on the following rationale:
  • Carbon (C)—Provides solid solution strengthening when added in small quantities; however, the solubility of carbon in ferrite is limited, and therefore an upper limit is defined to avoid cementite/pearlite formation.
  • Silicon (Si)—Known to strongly increase resistivity and reduce coercivity.
  • Manganese (Mn)—Increases resistivity although a strong austenite stabilizer.
  • Nickel (Ni)—Suppresses BCC B2 and D03 phases, also a weak austenite stabilizer.
  • Chromium (Cr), aluminum (Al), and molybdenum (Mo)—Stabilize ferrite without promoting BCC B2 and D03 phases.
For each of the compositions that meet the criteria of being fully ferritic then performance indices are calculated using the following criteria:
  • Resistivity: Eddy current losses within a soft magnetic material can be significantly reduced through increasing electrical resistivity. This has been calculated through the empirical relationship (Equation (1)), where all additions are in wt% [13].
    R e s i s t i v i t y = 10.11 + 6.1985 M n + 11.7499 S i + 2.9755 N i + 5.5696 C r  
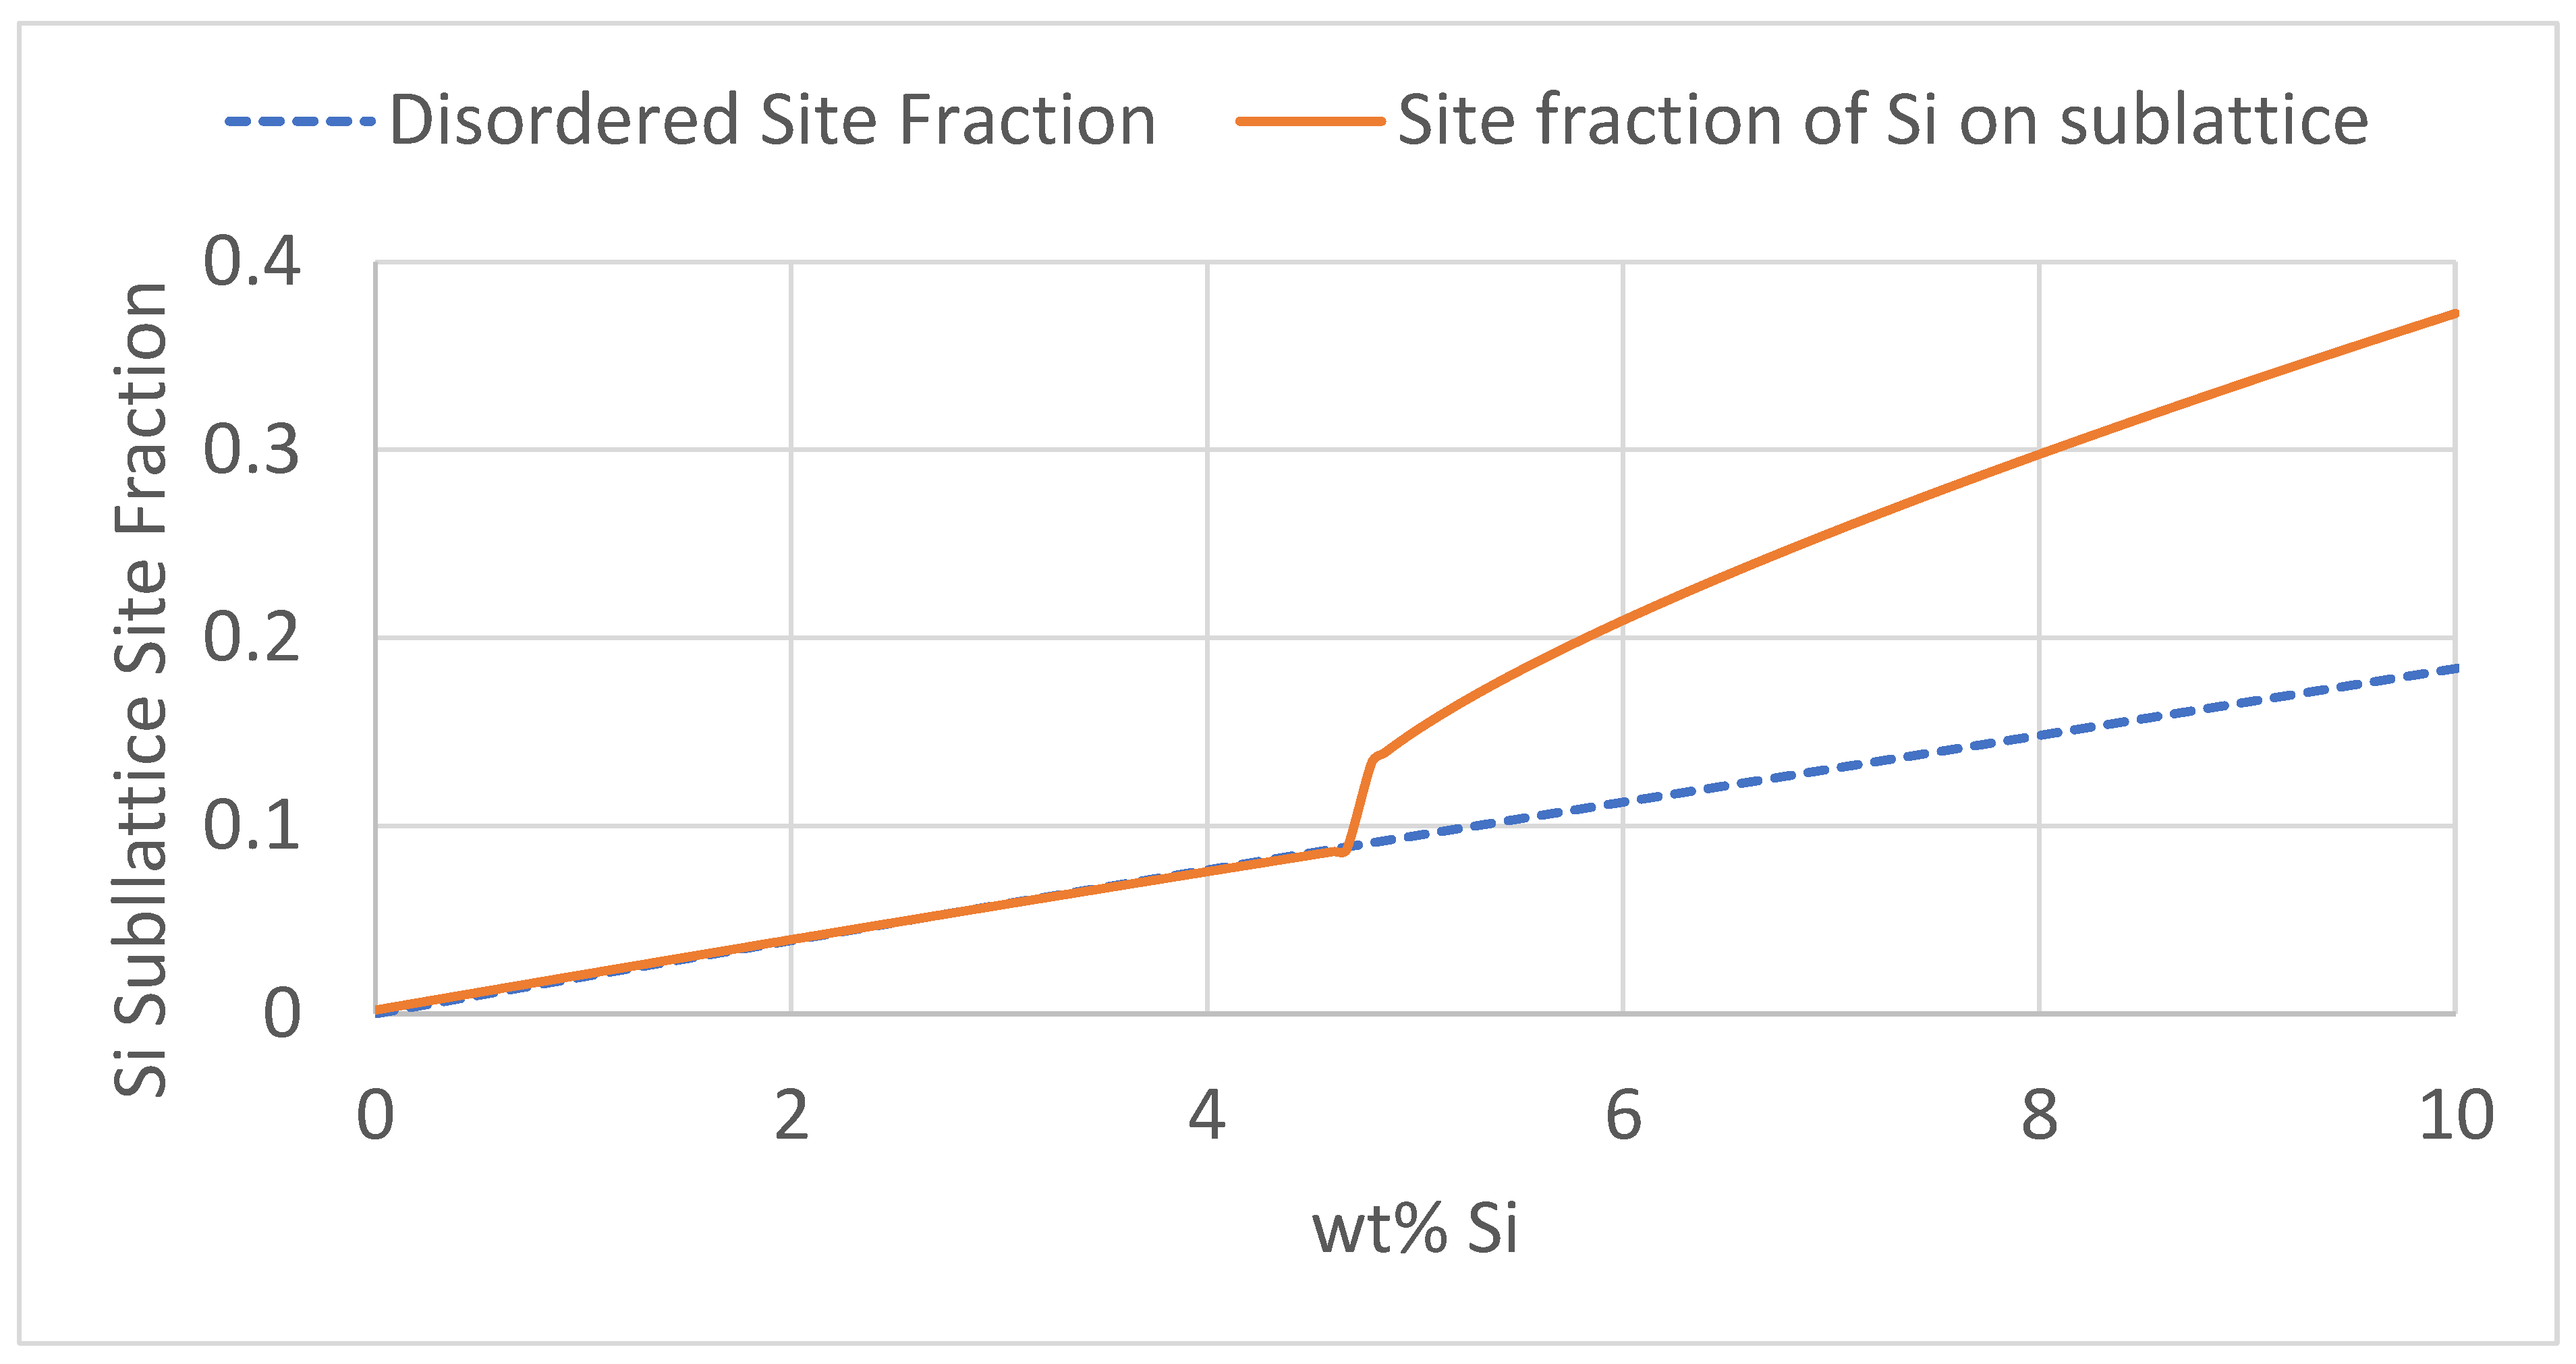
  • A2-B2 Transformation Temperature: As B2 forms at a lower Si content than D03, then just the B2 phase needs to be mapped for stability to avoid the brittle ordered phase. The B2 and DO3 phases form when the silicon concentration reaches a critical concentration (around 4.2 and 5.3 wt%, respectively, for B2 and D03 phases in a Fe-Si binary system at 500 °C [14]) which is when ordering becomes more favorable between the nearest neighbor and the next nearest neighbor [15]. This can be predicted through CALPHAD type simulations when the concentration of Si on a given sublattice position deviates away from the global concentration (Figure 2). In Figure 2, the sublattice site occupancy of silicon can be seen as a function of Si wt%. For a given temperature, at the critical silicon content, it becomes energetically more favorable for silicon atoms to occupy a repeated sublattice location. This increase away from that of a random distribution has been deemed in this study as the A2-B2 transformation temperature. This approach allows the formation of ordered phases as a function of equilibrium temperature, including for more complex non-binary compositions, to be determined. Modern CALPHAD databases (such as Thermocalc TCFe10) can distinguish between BCC A2 and B2 phases and so automate this step.
  • Atomic % Fe: At low frequencies, magnetic losses are governed less by resistivity and more by hysteretic losses, and as such minimizing the total alloying element content is preferential. Whilst this alloy design approach is for higher-frequency applications of electrical steels, considering a metric of the total alloy content is useful for considering potential changes to magnetic saturation. It is also important from a steel-making perspective, since making higher alloying element concentrations can be challenging, needing more master alloy additions that can chill the liquid steel and requiring reheating practices.
  • Lattice parameter: Whilst the lattice parameter is the least important metric in terms of alloy design, the lattice parameter has a known correlation to a materials magnetic response to stress [16], and as such is calculated as part of this design loop.
The relationship between increasing resistivity (beneficial) and decreasing A2-B2 transformation temperature (detrimental) in the Fe-Si binary system can be seen in Figure 3. For high-frequency e-machine electrical steel, it is desirable to identify compositions that affect performance in the bottom-right corner of this diagram, deviating from the performance of the binary system [8].
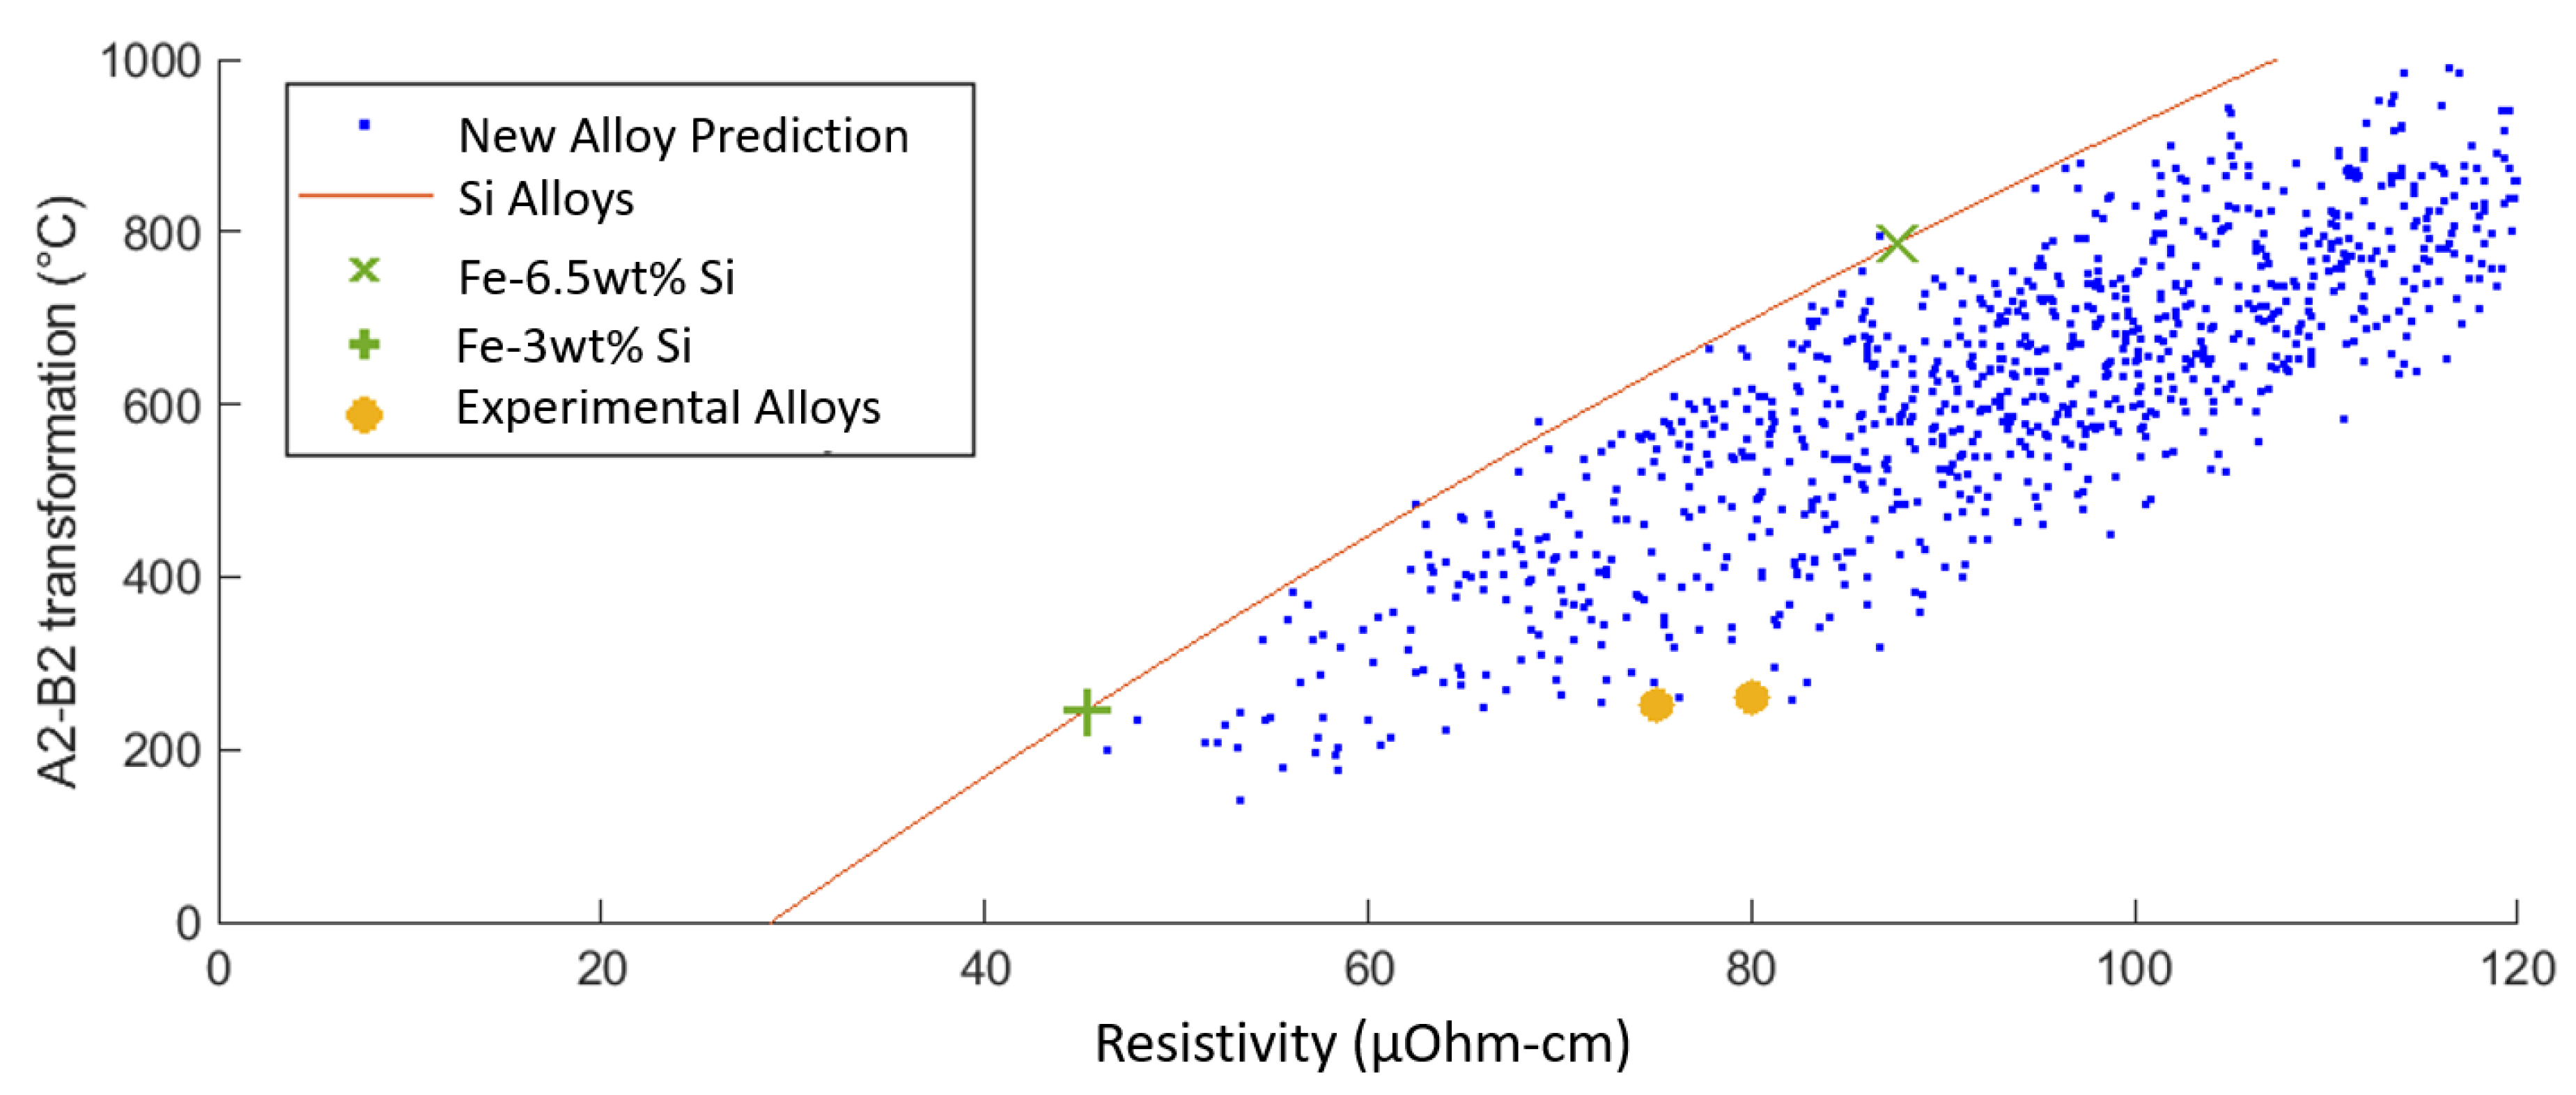
Figure 4 illustrates the outcome for numerous composition combinations for resistivity and A2-B2 transformation temperature, where each data point refers to a specific alloy composition. Any alloy composition that has inferior properties compared to the binary Fe-Si system, based on a lower resistivity than the current 3 wt% Si steels or a higher A2-B2 transformation temperature than the current state-of-the-art 6.5 wt% Si steel, has been filtered out from the results. It can be clearly seen that many potential alloys offer a superior balance between resistivity and A2-B2 transformation. For this research, resistivity and A2-B2 transformation were the main metrics by which a favorable alloy was selected. For predicted alloys that have similar resistivity and A2-B2 transformation, maximizing Atomic % Fe was the next criterion.
Figure 4 also shows the two alloys that were chosen for experimental verification. These alloys both show similar A2-B2 transformation temperatures (252 and 255 °C) to that of the Fe-3 wt% Si, but offer resistivity more comparable to Fe-6.5 wt% Si.

3. Experimental Methodology

Based on the above alloy design methodology and results in Figure 4, four compositions were identified for experimental investigation. Two experimental alloys were selected (named E1 and E2). In addition, casts of 3 wt% Si and 6.5 wt% Si binary Fe-Si compositions were selected to represent alloys similar to commercial grades (named C1 and C2, respectively). The 3 wt% Si grade was selected as a simplified benchmark to conventional production electrical steel. A 6.5 wt% Si composition was used to represent a simplified “state of the art” high Si grade. The actual compositions are given in Table 1, determined using an Oxford Instruments Foundry Master Pro OES (Optical Emission Spectrometry, Oxford Instruments, Abingdon, UK). Carbon and sulfur was determined using an Eltra CS200, with oxygen and nitrogen measured using an Eltra ON 900 (Eltra GmbH, Haan, Germany). The 10 kg melts were produced using a Consarc 30 kW VIM and cast into a 30 mm × 80 mm × 210 mm mold. For comparative purposes then a commercial 0.35 mm electrical steel sheet supplied by Tata Steel Cogent Power (Surahammars Bruk) was assessed (M250-35A), and its composition can also be seen in Table 1.
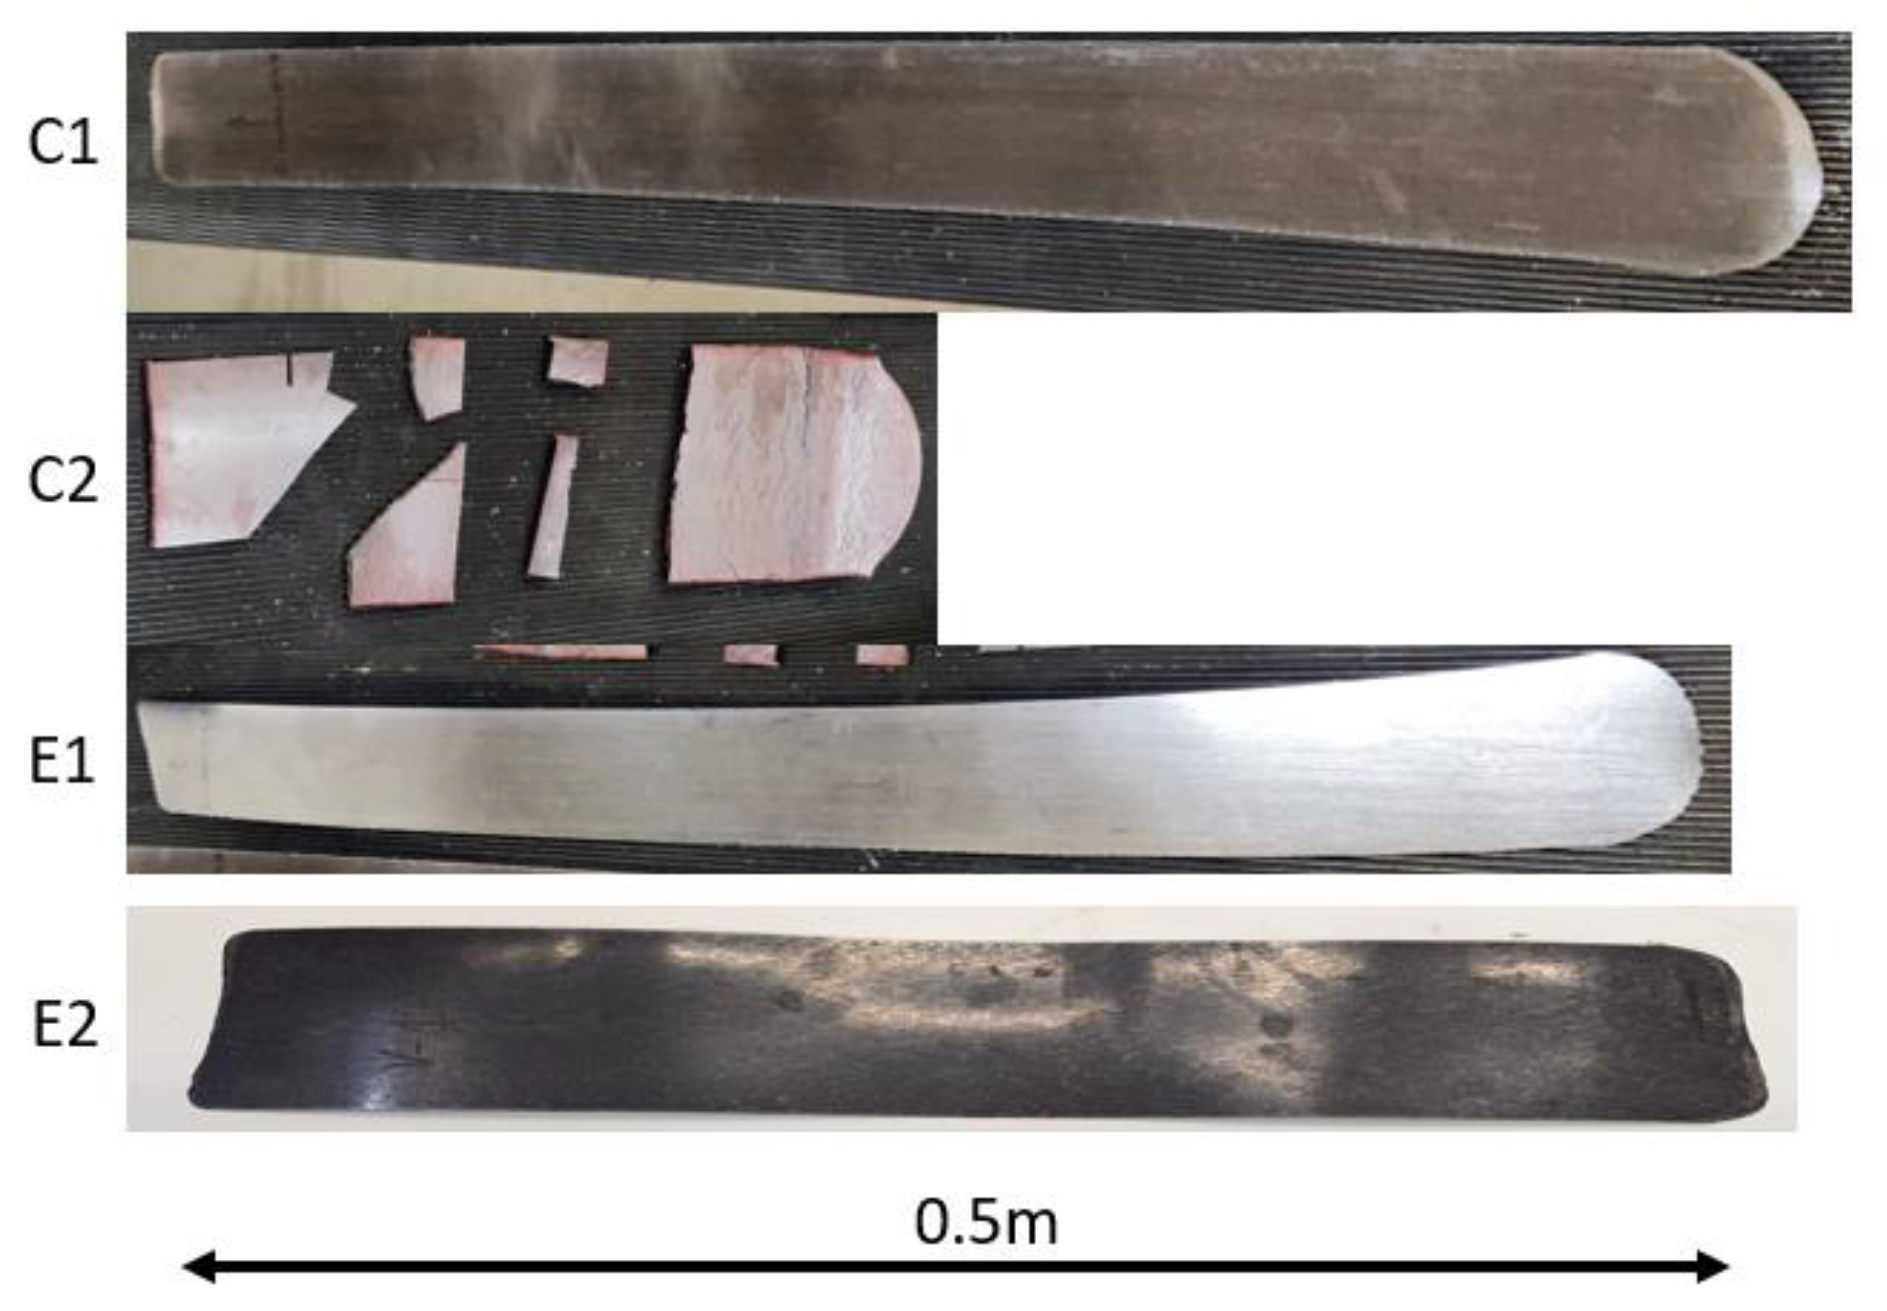
The ingots were homogenized at 1200 °C for 3 h then rolled to 2.5 mm in seven passes, reheating to 1050 °C after each pass. The strips were pickled in 40% HCl solution for 10 mins before cold rolling to 0.35 mm. The final strips were annealed at 1100 °C for 1 h in N5 argon (with a flow rate of 200 mL/min) and furnace-cooled to room temperature. The final anneal heat treatment resulted in an average equivalent-circle grain size of around 100 µm for grades E1 and E2. For C1 and C2, the average equivalent-circle grain size was larger at 180 µm. For the assessment of the grain size effect on the magnetic properties, the annealing time was adjusted between 10 mins and 2 hours. It should be noted that the C2 material cracked during hot rolling and could only be processed to a 3 mm hot-rolled strip with no cold rolling. Images of the rolled products can be seen in Figure 5.
Samples from the annealed strips were cut to 300 mm × 30 mm × 0.35 mm. Electrical resistivity measurements and magnetic testing was carried out on these samples. The resistivity measurements were carried out using a Cropico Microhmmeter DO5000 (Seaward GMC Instruments Group, Peterlee, UK) over a length of 200 mm. Magnetic performance measurements were made using the MPG 200 platform with the single sheet tester (SST) (Brockhaus, Lüdenscheid, Germany) configuration to the international standard IEC 60404-2 [17]. Tests were performed either to 1.0 or 1.5 T, which covers the range of flux densities typically used to characterize these materials across multiple frequencies. Successive tests were carried out starting at 50 Hz then at frequencies of 100, 200, 400, 800, 1000, 1500, 2000, 2500, and 3000 Hz. Measurements of iron loss and coercivity were taken. Commercial M250-35A samples (which have an average equivalent-circle-diameter grain size of 100–120 µm) were also tested in the same manner for benchmarking data.
Sub-sized dog-bone tensile samples were electro-discharge machined (EDM) at the university from the electrical steel strips following the ASTM E8 standard [18] (gauge length of 25 mm and gauge width of 6 mm). All samples were taken with the gauge length along the rolling direction. Testing was carried out on an Instron 5985 static machine (Instron, High Wycombe, UK) equipped with a 10 kN load cell and a video extensometer. The crosshead speed used was 1 mm/min before 1% strain and 5 mm/min afterwards, and the criteria for the end of test was a drop in the load by 40%. A total of 3–6 tests were carried out per alloy.
To analyze the microstructure of the electrical steels, samples were ground and polished to a 0.05 µm finish. Electron Backscatter Diffraction (EBSD) patterns were measured using a JEOL JSM-7800F Field Emission Scanning Electron Microscope (FE-SEM) (JEOL Ltd, Tokyo, Japan). Grain size was measured using the line intercept method of >600 grains per condition, providing a mean grain size.

4. Results and Discussion

4.1. Electrical Resistivity and Microstructure

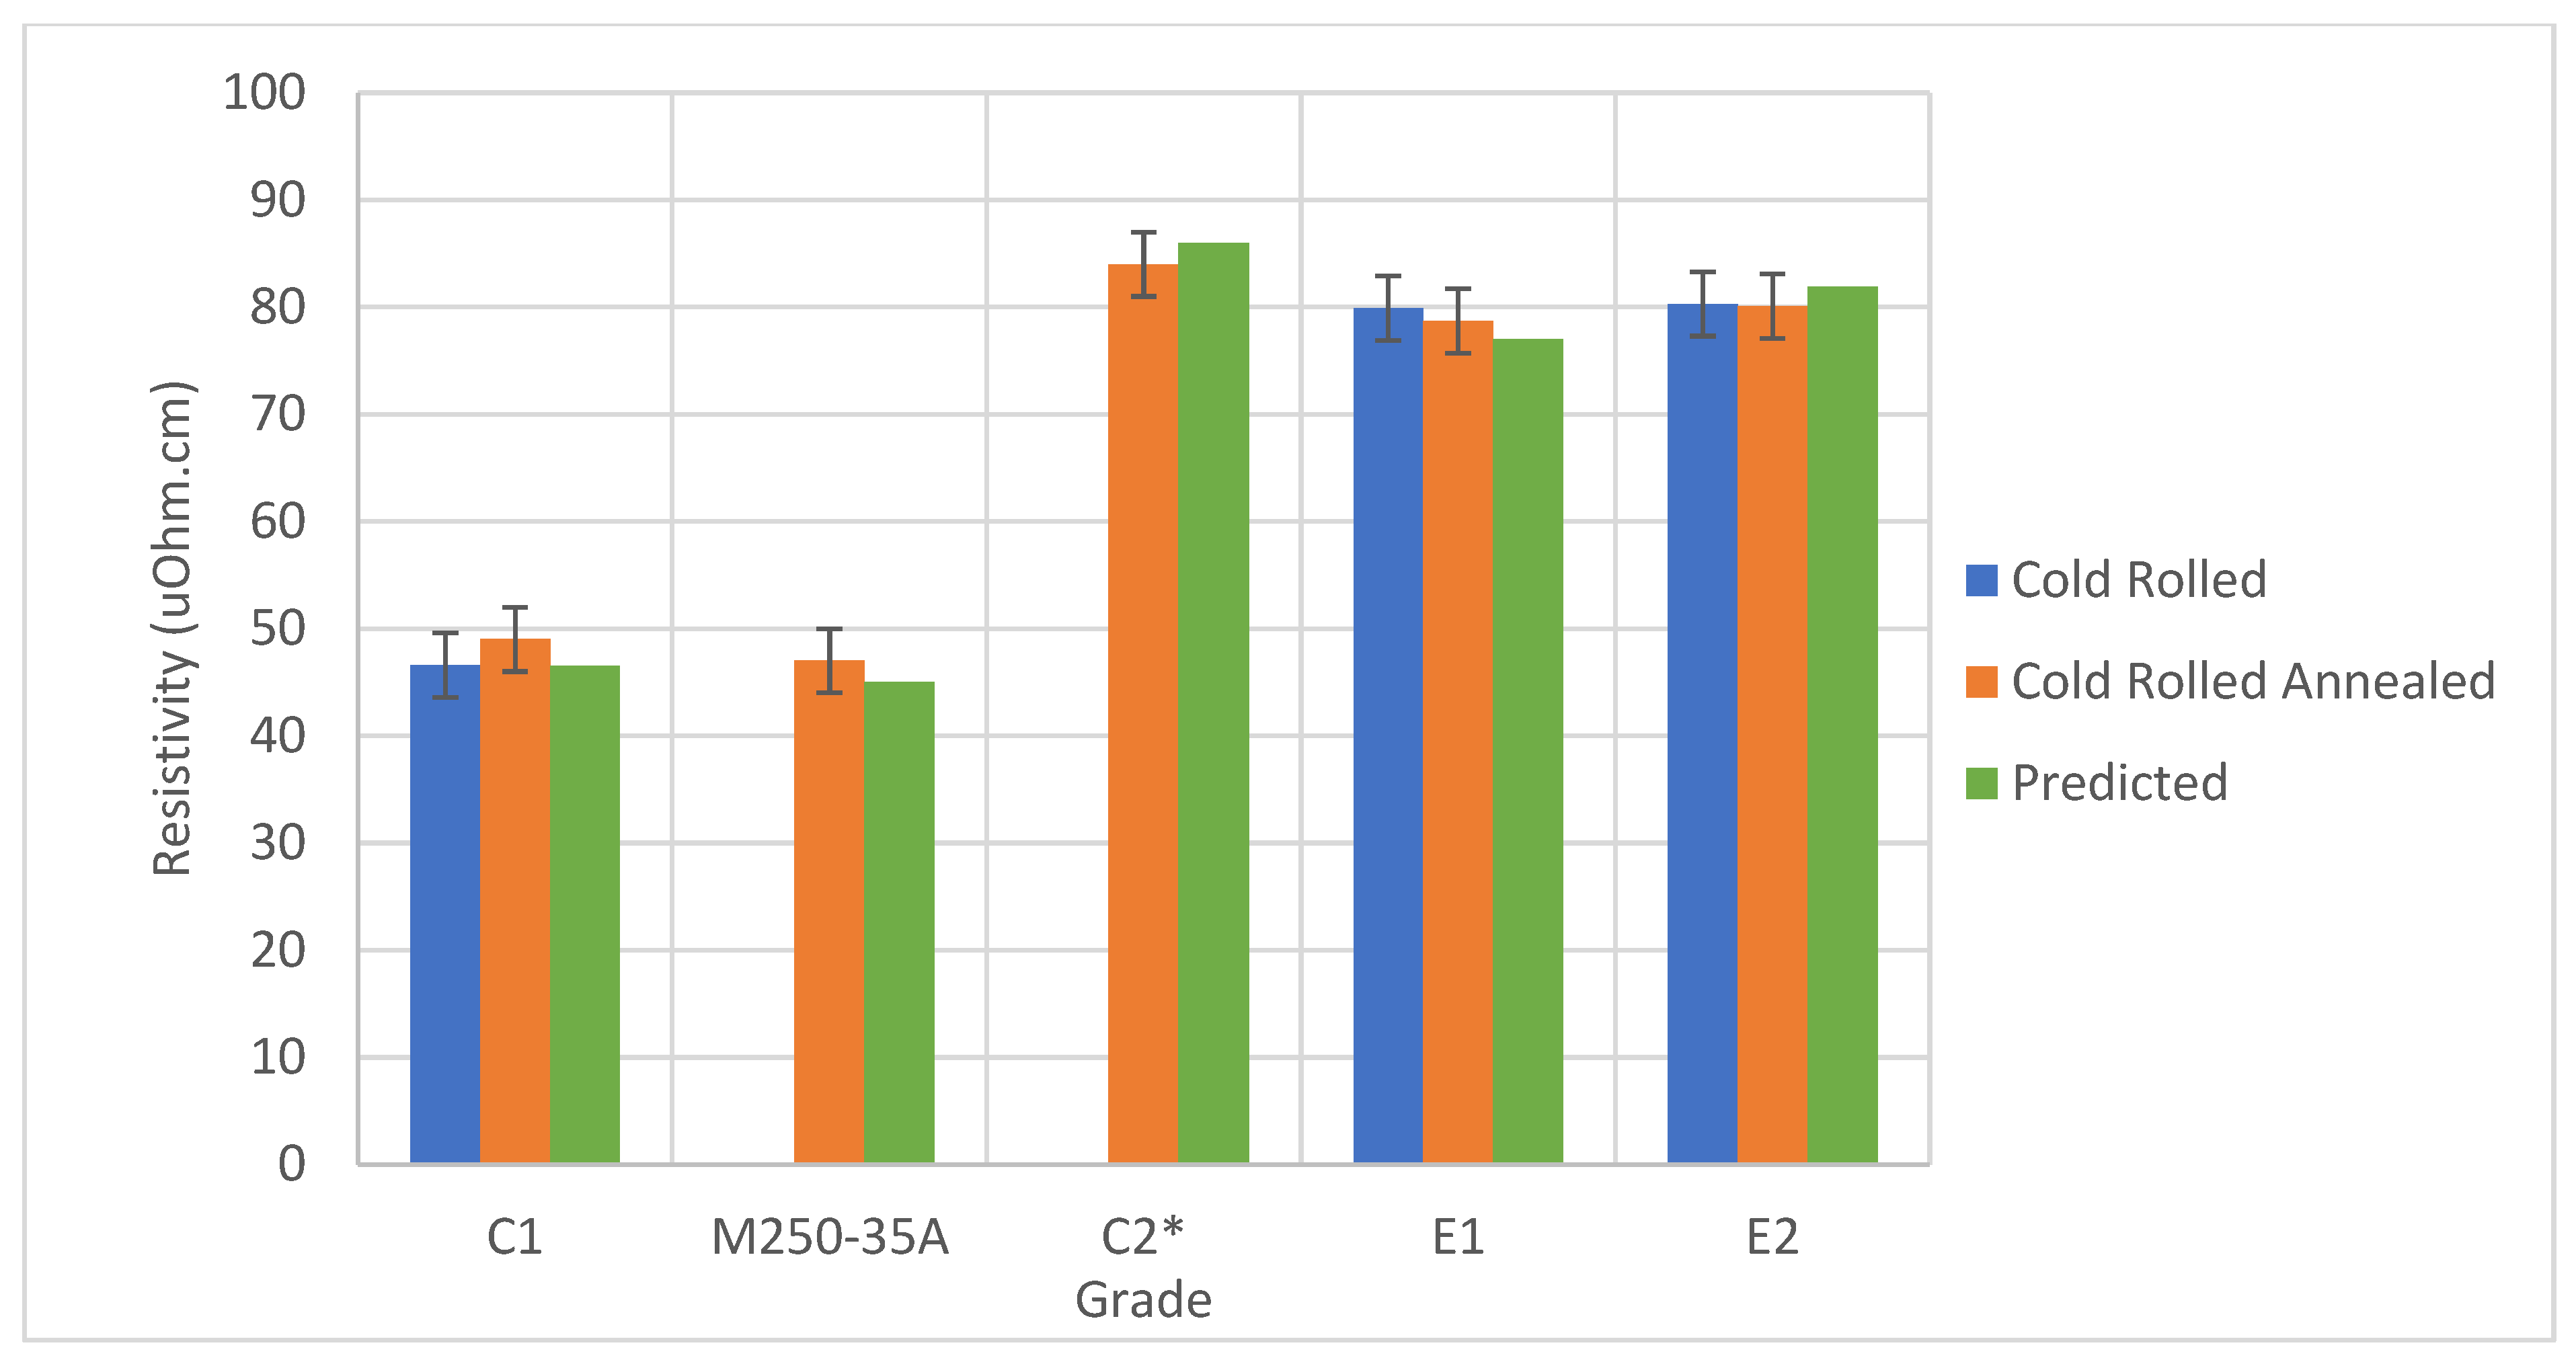
The predicted and measured electrical resistivity values for the experimentally produced alloys can be seen in Figure 6, compared to a commercial grade of M250-35A. Good agreement can be seen for the predicted and measured values for all samples, with no significant resistivity change being seen between the different processing states (hot-rolled, cold-rolled, and annealed) which indicates that resistivity values are dominated by composition (solid solution effects) rather than microstructural effects (grain size differences or presence of dislocations). Due to the poor processability of the 6.5 wt% Si grade (C2) electrical resistivity was not possible. C1 with its composition chosen to represent a current standard 3 wt% Si electrical has similar resistivity to the commercial M25-35A material.
The new alloys, E1 and E2, achieve a much higher resistivity compared to the baseline C1 and M250-35A steels and are only ≈8% lower than that of the 6.5 wt% Si steel, C2. The predictions from Equation (1), which are based on elements in solid solution, agree with the measured values, as the alloying elements in the designed alloys are expected to be in solid solution.
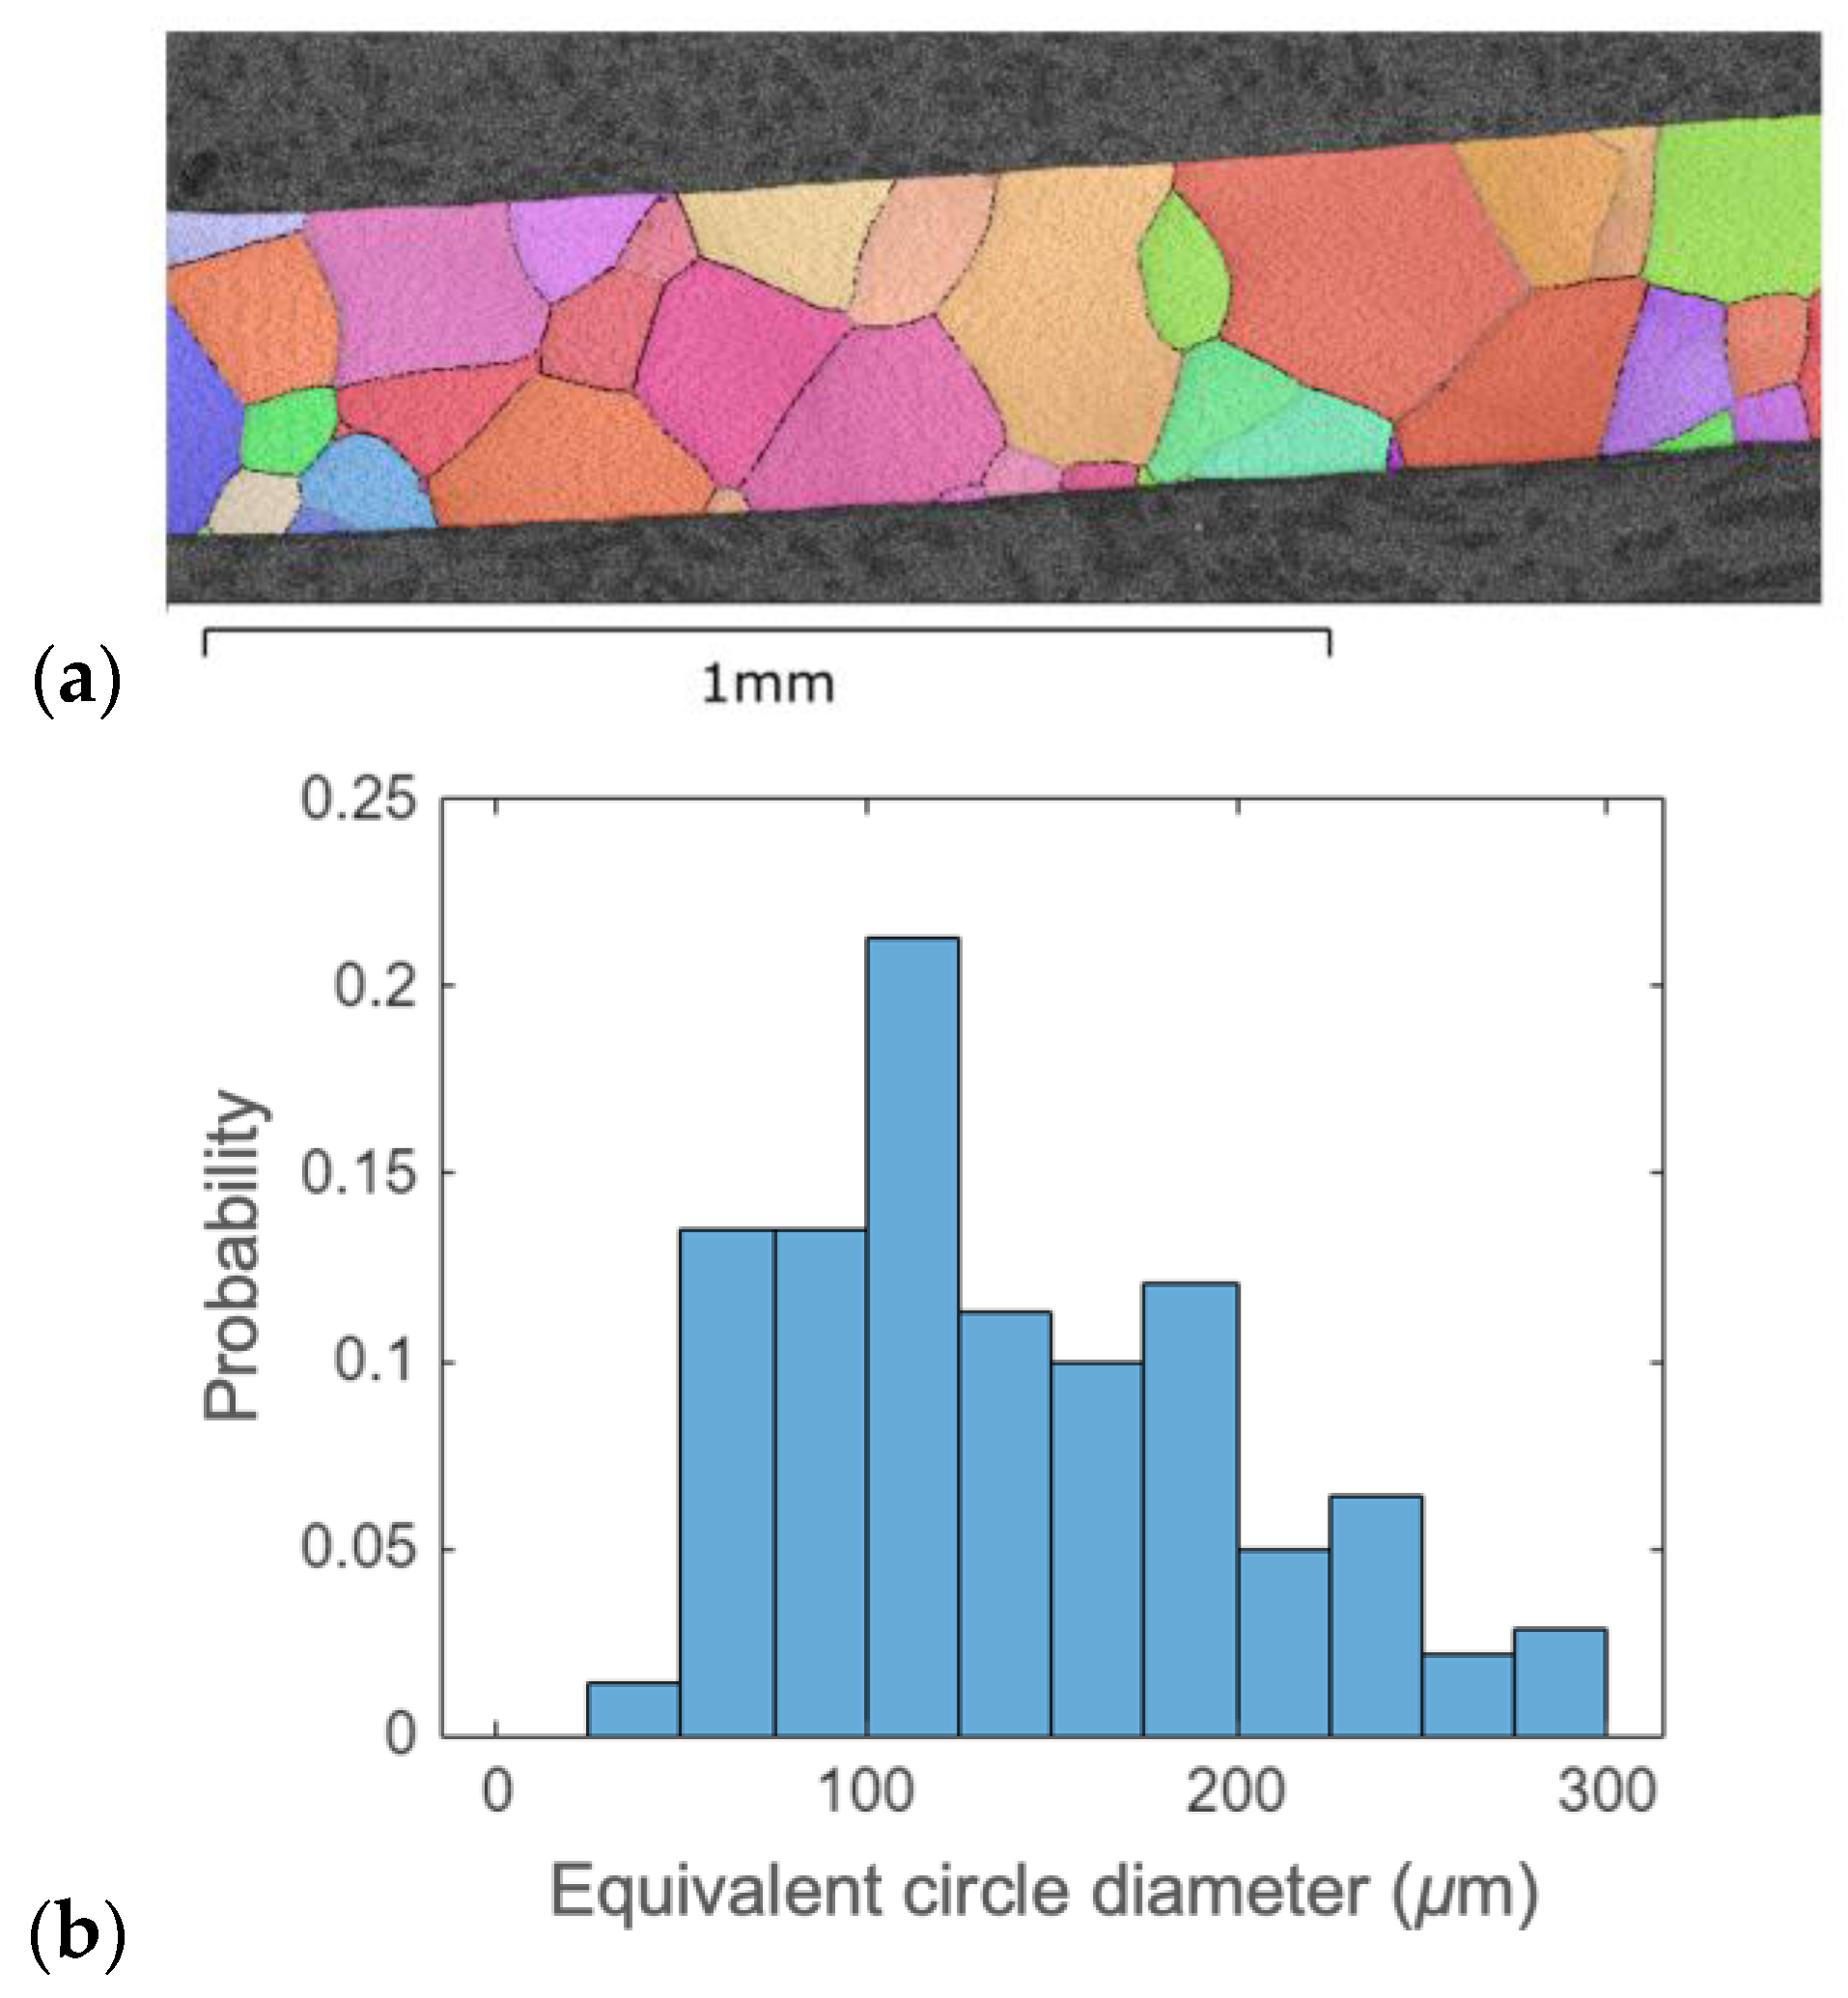
Figure 7a shows a typical EBSD microstructure of the HiPPES alloy accompanied with the grain size distribution (Figure 7b). The microstructure and distribution show an equiaxed, unimodal, lognormal grain structure. There are no visible precipitates present, which is consistent with Thermocalc predictions.

4.2. Magnetic Testing

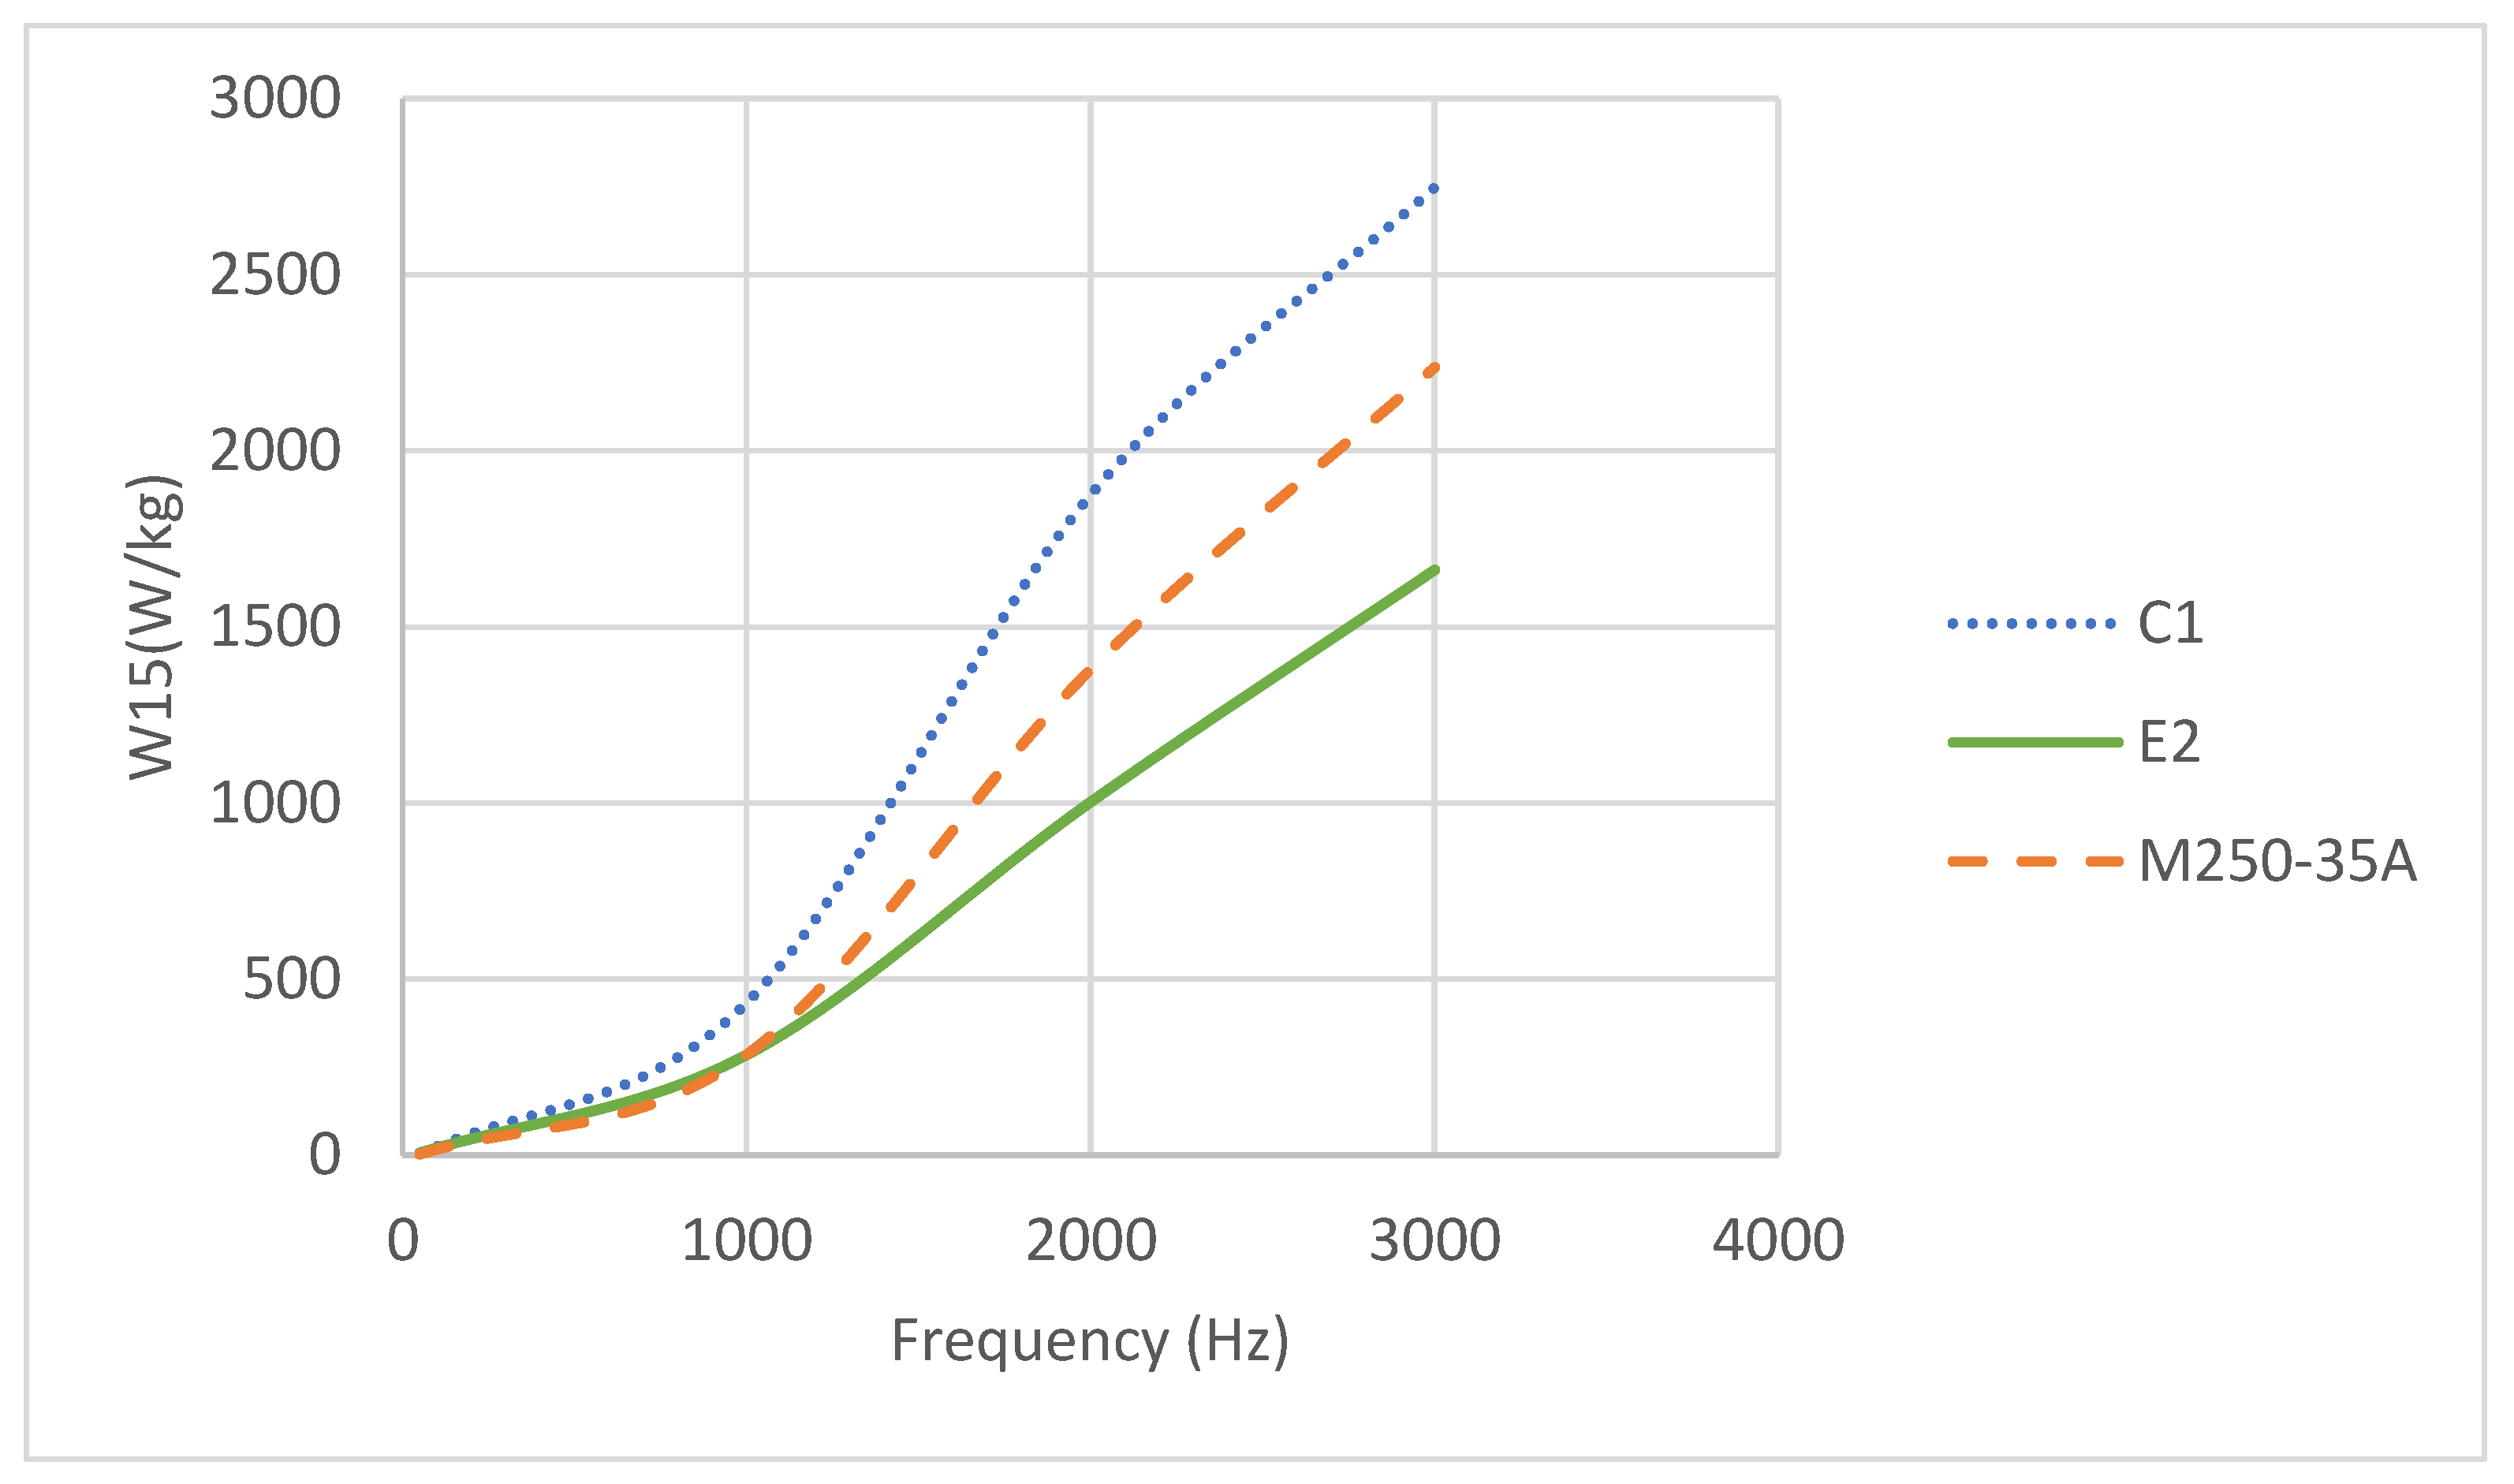
Figure 8 shows the multifrequency losses for the lab products C1 and E2 in addition to a commercial sample of M250-35A. C1 is the binary 3 wt% Si alloy that is a simplified version of the commercial M250-35A grade. M250-35A shows lower losses compared to the C1 benchmark material, which is likely due to presence of Mn and AlN resulting in grain refinement (from 180 µm in C1 to 100 µm in M250-35A) and therefore operating at a more optimized grain size (this has been reported to be around 100–120 µm for conventional electrical steel [19], and will be discussed further later in this paper). Commercial grades are also typically coated, which can provide a minor tensile stress to improve the magnetic properties [20].
Comparing alloy E2 and M250-35A (both 0.35 mm and around 100 μm grain size), M250-35A shows a marginally improved performance at low frequencies; this is attributed to iron losses dominating the total loss at these frequencies. E2 has a much higher alloy content and shows slightly greater losses. However, at frequencies above 900 Hz E2 starts to show improved performance. At 3000 Hz (when eddy current losses are having an increasing influence on the overall losses), E2 shows over 25% reduction in losses compared to M250-35A.

4.3. High-Frequency Testing Under Load

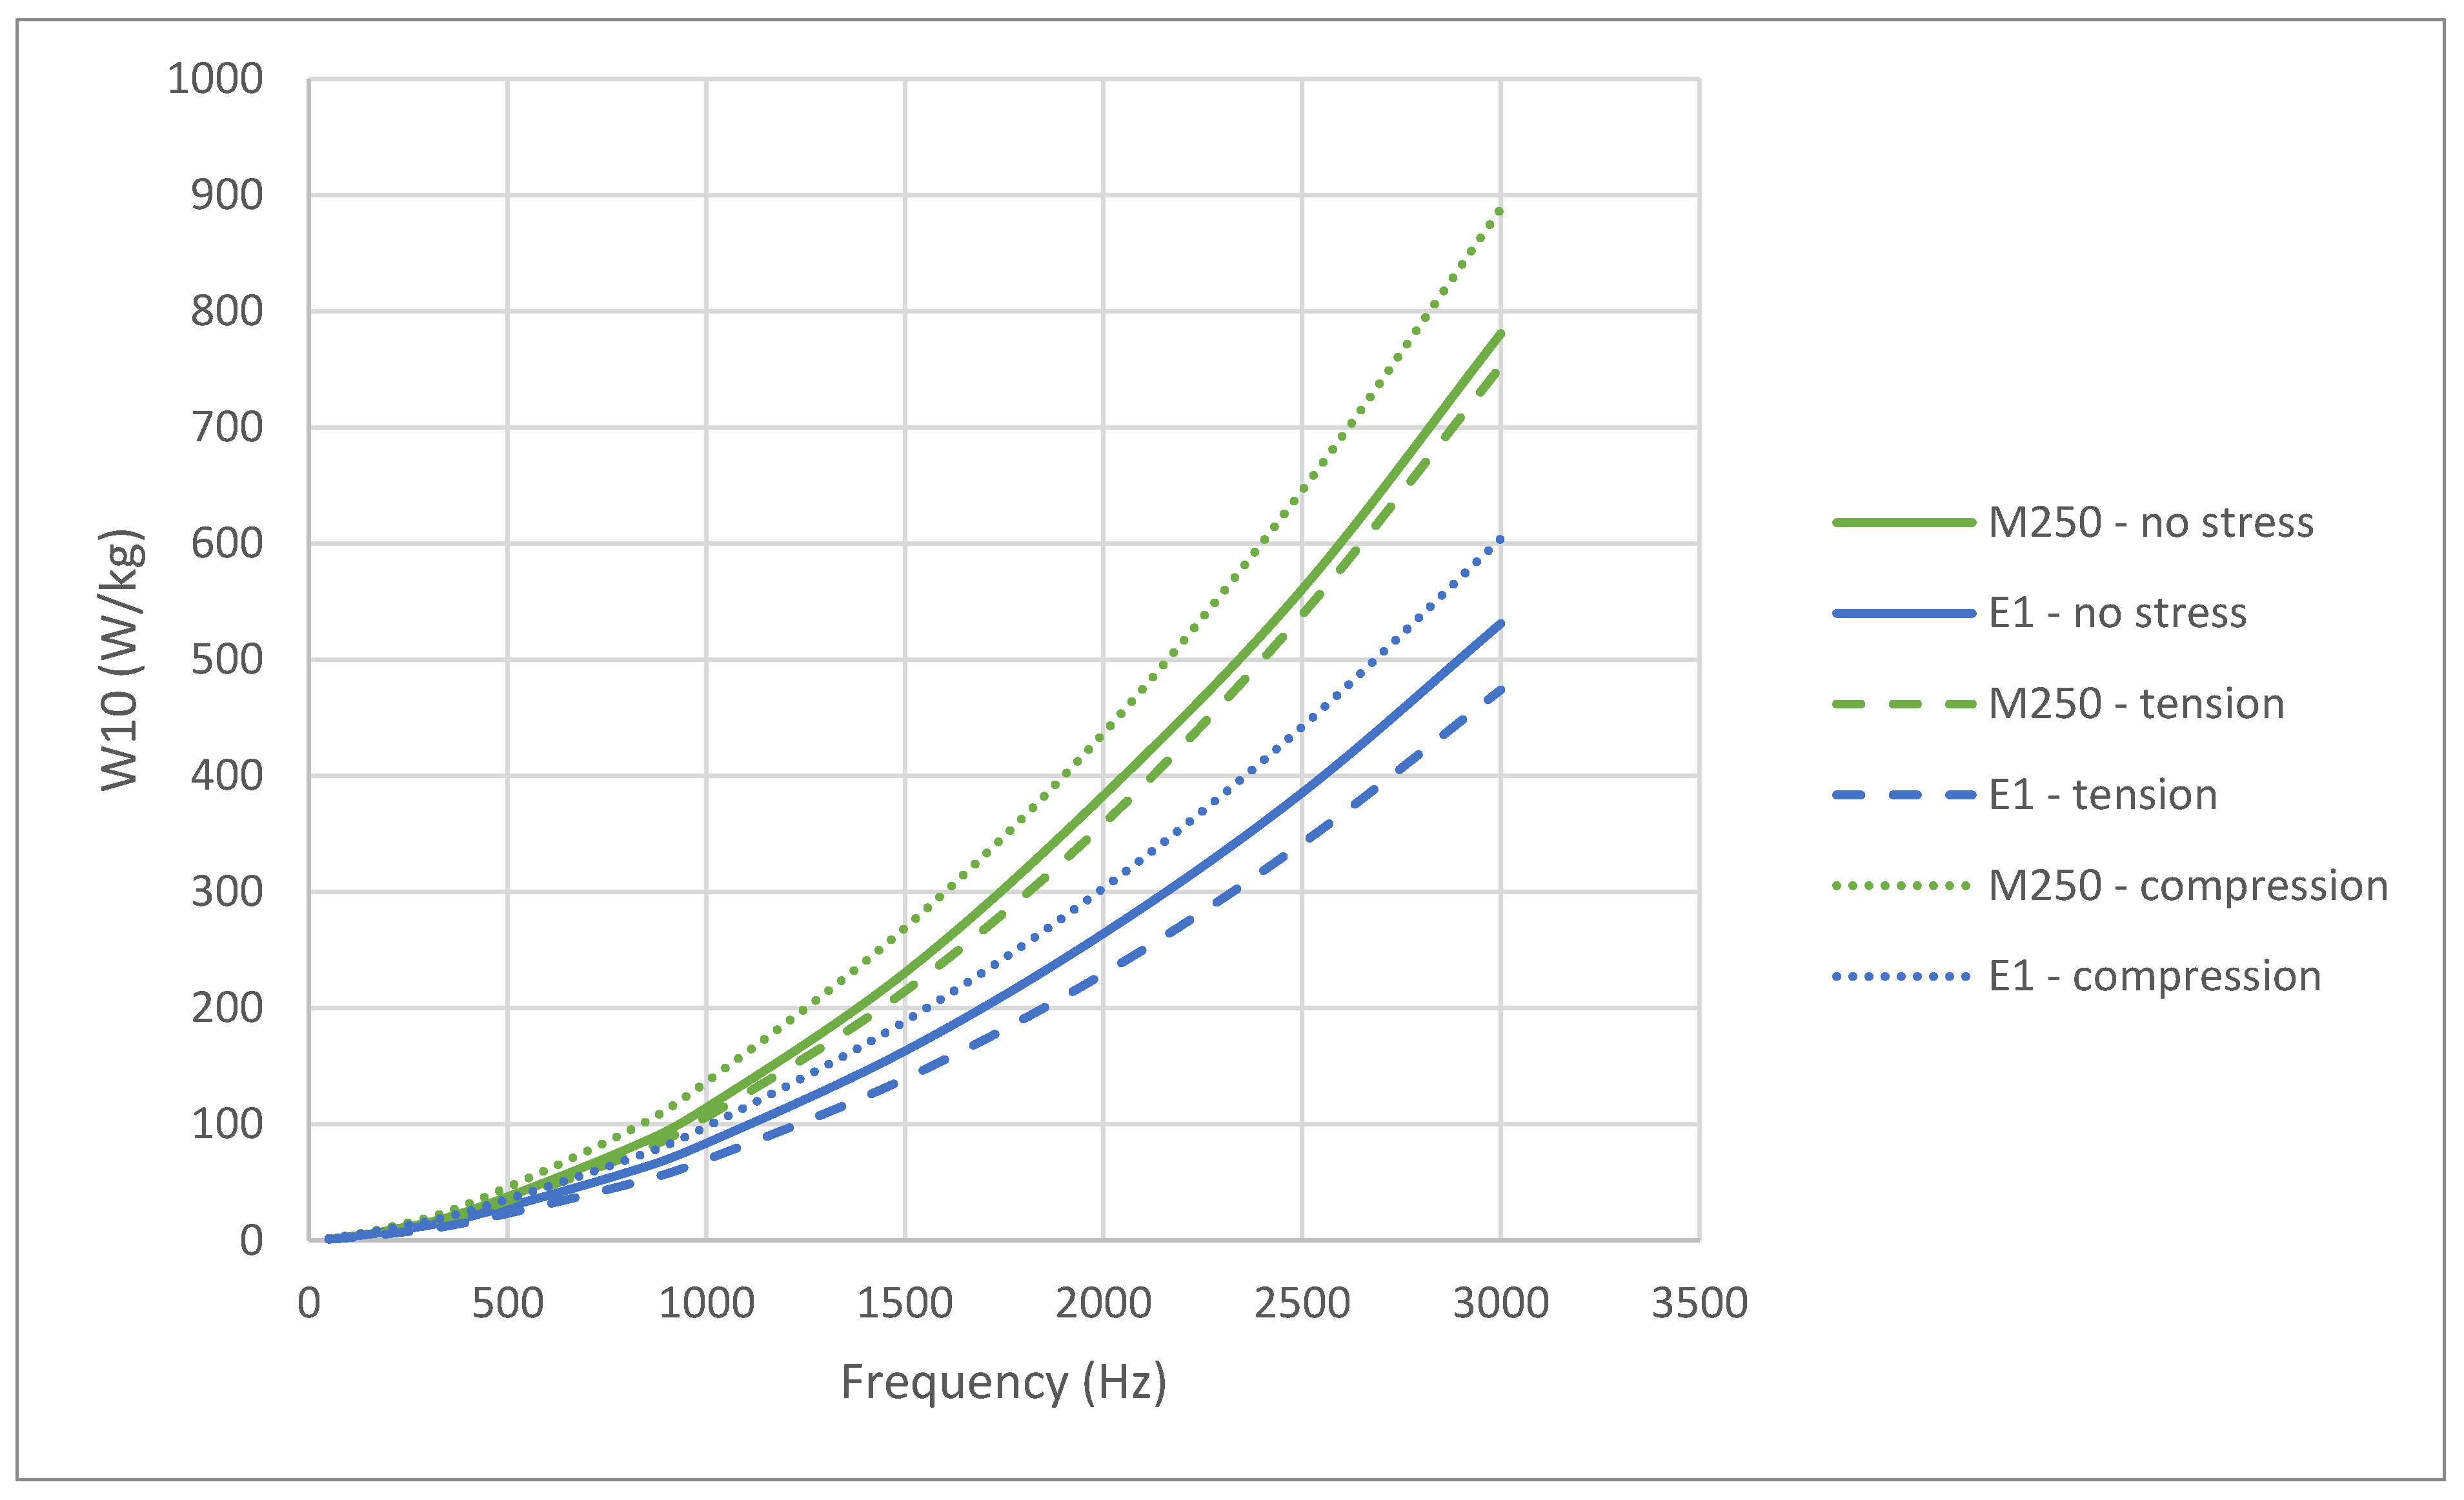
Electrical steel sheets in an e-machine can be exposed to compressive stress from shrink fitting and/or tensile stresses during the high-speed revolutions of the motor. Loss measurements have therefore been carried out under 50 MPa compressive and tensile stresses. The results for the commercial M250-35A and E1 samples can be seen in Figure 9. When comparing E1 with M250-35A under no stress, a reduction in loss at 3000 Hz of over 33% was measured (which is consistent with the relative loss reduction in alloy E2 shown in Figure 8). M250-35A shows the typical response to stress as reported in the literature [21]. Under the compressive stress, around a 12% increase in loss is seen at all frequencies. Under the tensile stress, a small reduction in the magnetic loss is seen. This response occurs because of the difference in magnetic exchange energy under load (ratio between interatomic distance and the radius of the 3d electron shell, the a/r ratio). The Bethe–Slater relationship shows that iron typically exhibits an a/r ratio lower than that of the peak exchange energy [22]. A small elastic tensile load increases the exchange energy and therefore reduces losses. Alloy E1 shows consistently lower losses for all frequencies and load conditions. Compressive stress can be seen to increase the losses by around 13% (similar to M250-35A); however, a greater absolute and proportional reduction in losses under tensile load can be seen in Alloy E1 (around 12%, compared to 4% in M250-35A). This improved performance under tension suggests that the base a/r ratio for E1 occurs on a steeper position of the Bethe–Slater curve to that of M250-35A.
In all cases, the change in losses due to stress appear to be proportional to the zero-stress condition and does not show an independent relationship to frequency.

4.4. Magnetic Performance as a Function of Grain Size

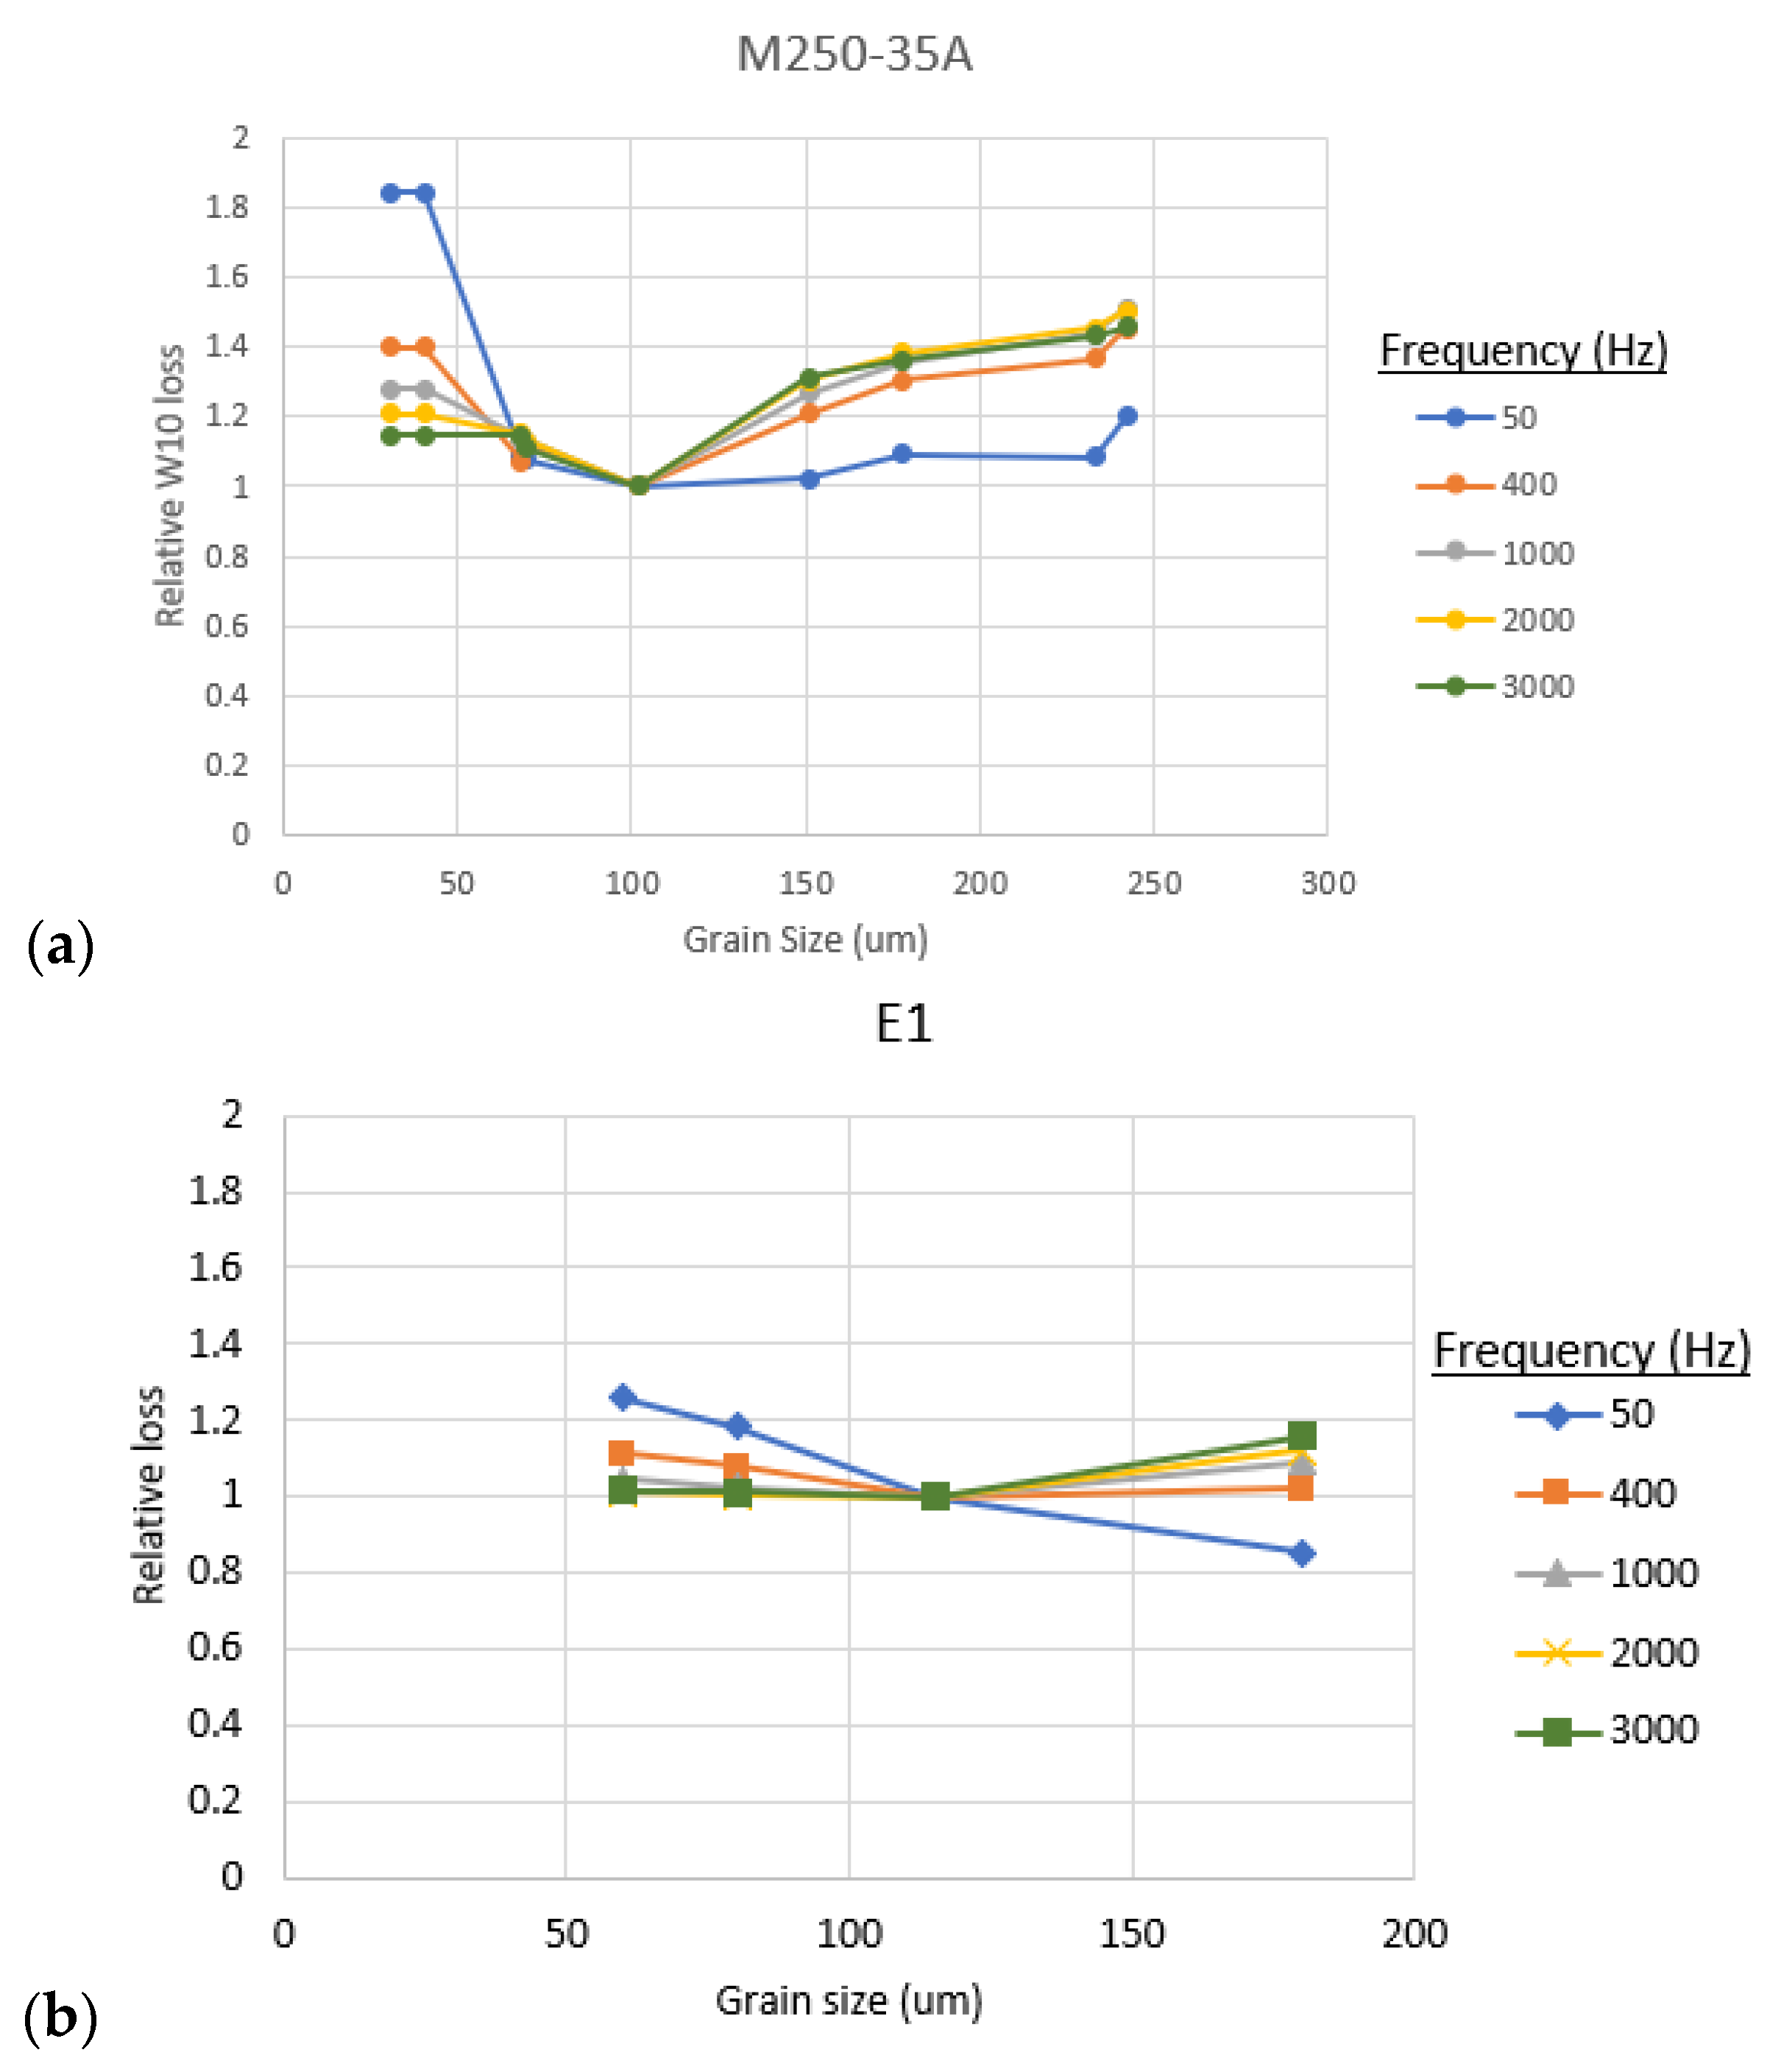
NGO electrical steels are known to have an optimum grain size range to minimize magnetic losses. As loss is dependent on both grain size and frequency, the loss measurements were normalized with respect to the loss determined for samples with a 100–120 µm average equivalent-circle-diameter grain size (this being the commercial standard for NGO electrical steels). The results show the relative sensitivity of the magnetic performance to a non-optimized grain size, which might occur during manufacturing. Figure 10a shows the grain size and frequency effect on the relative W10 loss for M250-35 commercial electrical steel. This agrees well with what is known in the literature, where a grain size of 100–120 µm has been highlighted for minimal loss [19]. Wang et al. [23] showed that decreasing the grain size from 90 to 20 µm resulted in a 60 and 40% increase in loss at 50 and 400 Hz, respectively. This aligns reasonably well with Figure 10a where, for the same frequencies and grain sizes, an increase in loss of 36 and 65% would be expected, respectively.
The impact of a finer grain size on loss appears to reduce with increasing frequency, with testing at 3000 Hz showing the lowest sensitivity to finer grain sizes. This suggests that the increase in resistivity (and therefore lower eddy current losses due to an increase in grain boundary area) act to compensate for the hysteretic losses generated from small grains. As eddy current losses dominate at higher frequencies, this part of the curve flattens. This trend can be seen in reverse, where larger grains appear to provide lower losses at higher frequencies. This is due to the reduction in resistivity and therefore an increase in eddy current losses. As eddy current losses become proportionally more dominant, the impact of the larger grains becomes more integral to the losses.
Figure 10b shows the grain size and frequency dependence on relative loss for the alloy E1. At frequencies of 400 Hz and higher, a much flatter response to grain size is seen compared to M250-35A. This suggests that by alloying specifically to increase resistivity, grain size is playing a much weaker role in the overall eddy current losses. Whilst an optimum grain size of around 120 µm is still apparent, at frequencies >400 Hz less than 20% variation in loss can be seen when changing grain size from 55 to 180 µm. This lack of sensitivity to grain size not only allows for a much broader process window during production, but also the ability to tailor the alloy for other properties. For instance, at frequencies over 1000 Hz, reducing the grain size to 50 µm or less would result in around 5% increase in loss, but this can provide an increase of 70 MPa in yield strength (based on a k value of 19 for a ferritic steel in a Hall–Petch calculation [24]). It should be noted that texture has not been determined in these samples as a function of grain size, however work by de Campos et al. (2005) [25] showed that changing grain size in NGO materials did not show a significant change in texture and therefore is unlikely to be playing a role in these tests.

4.5. Mechanical Testing

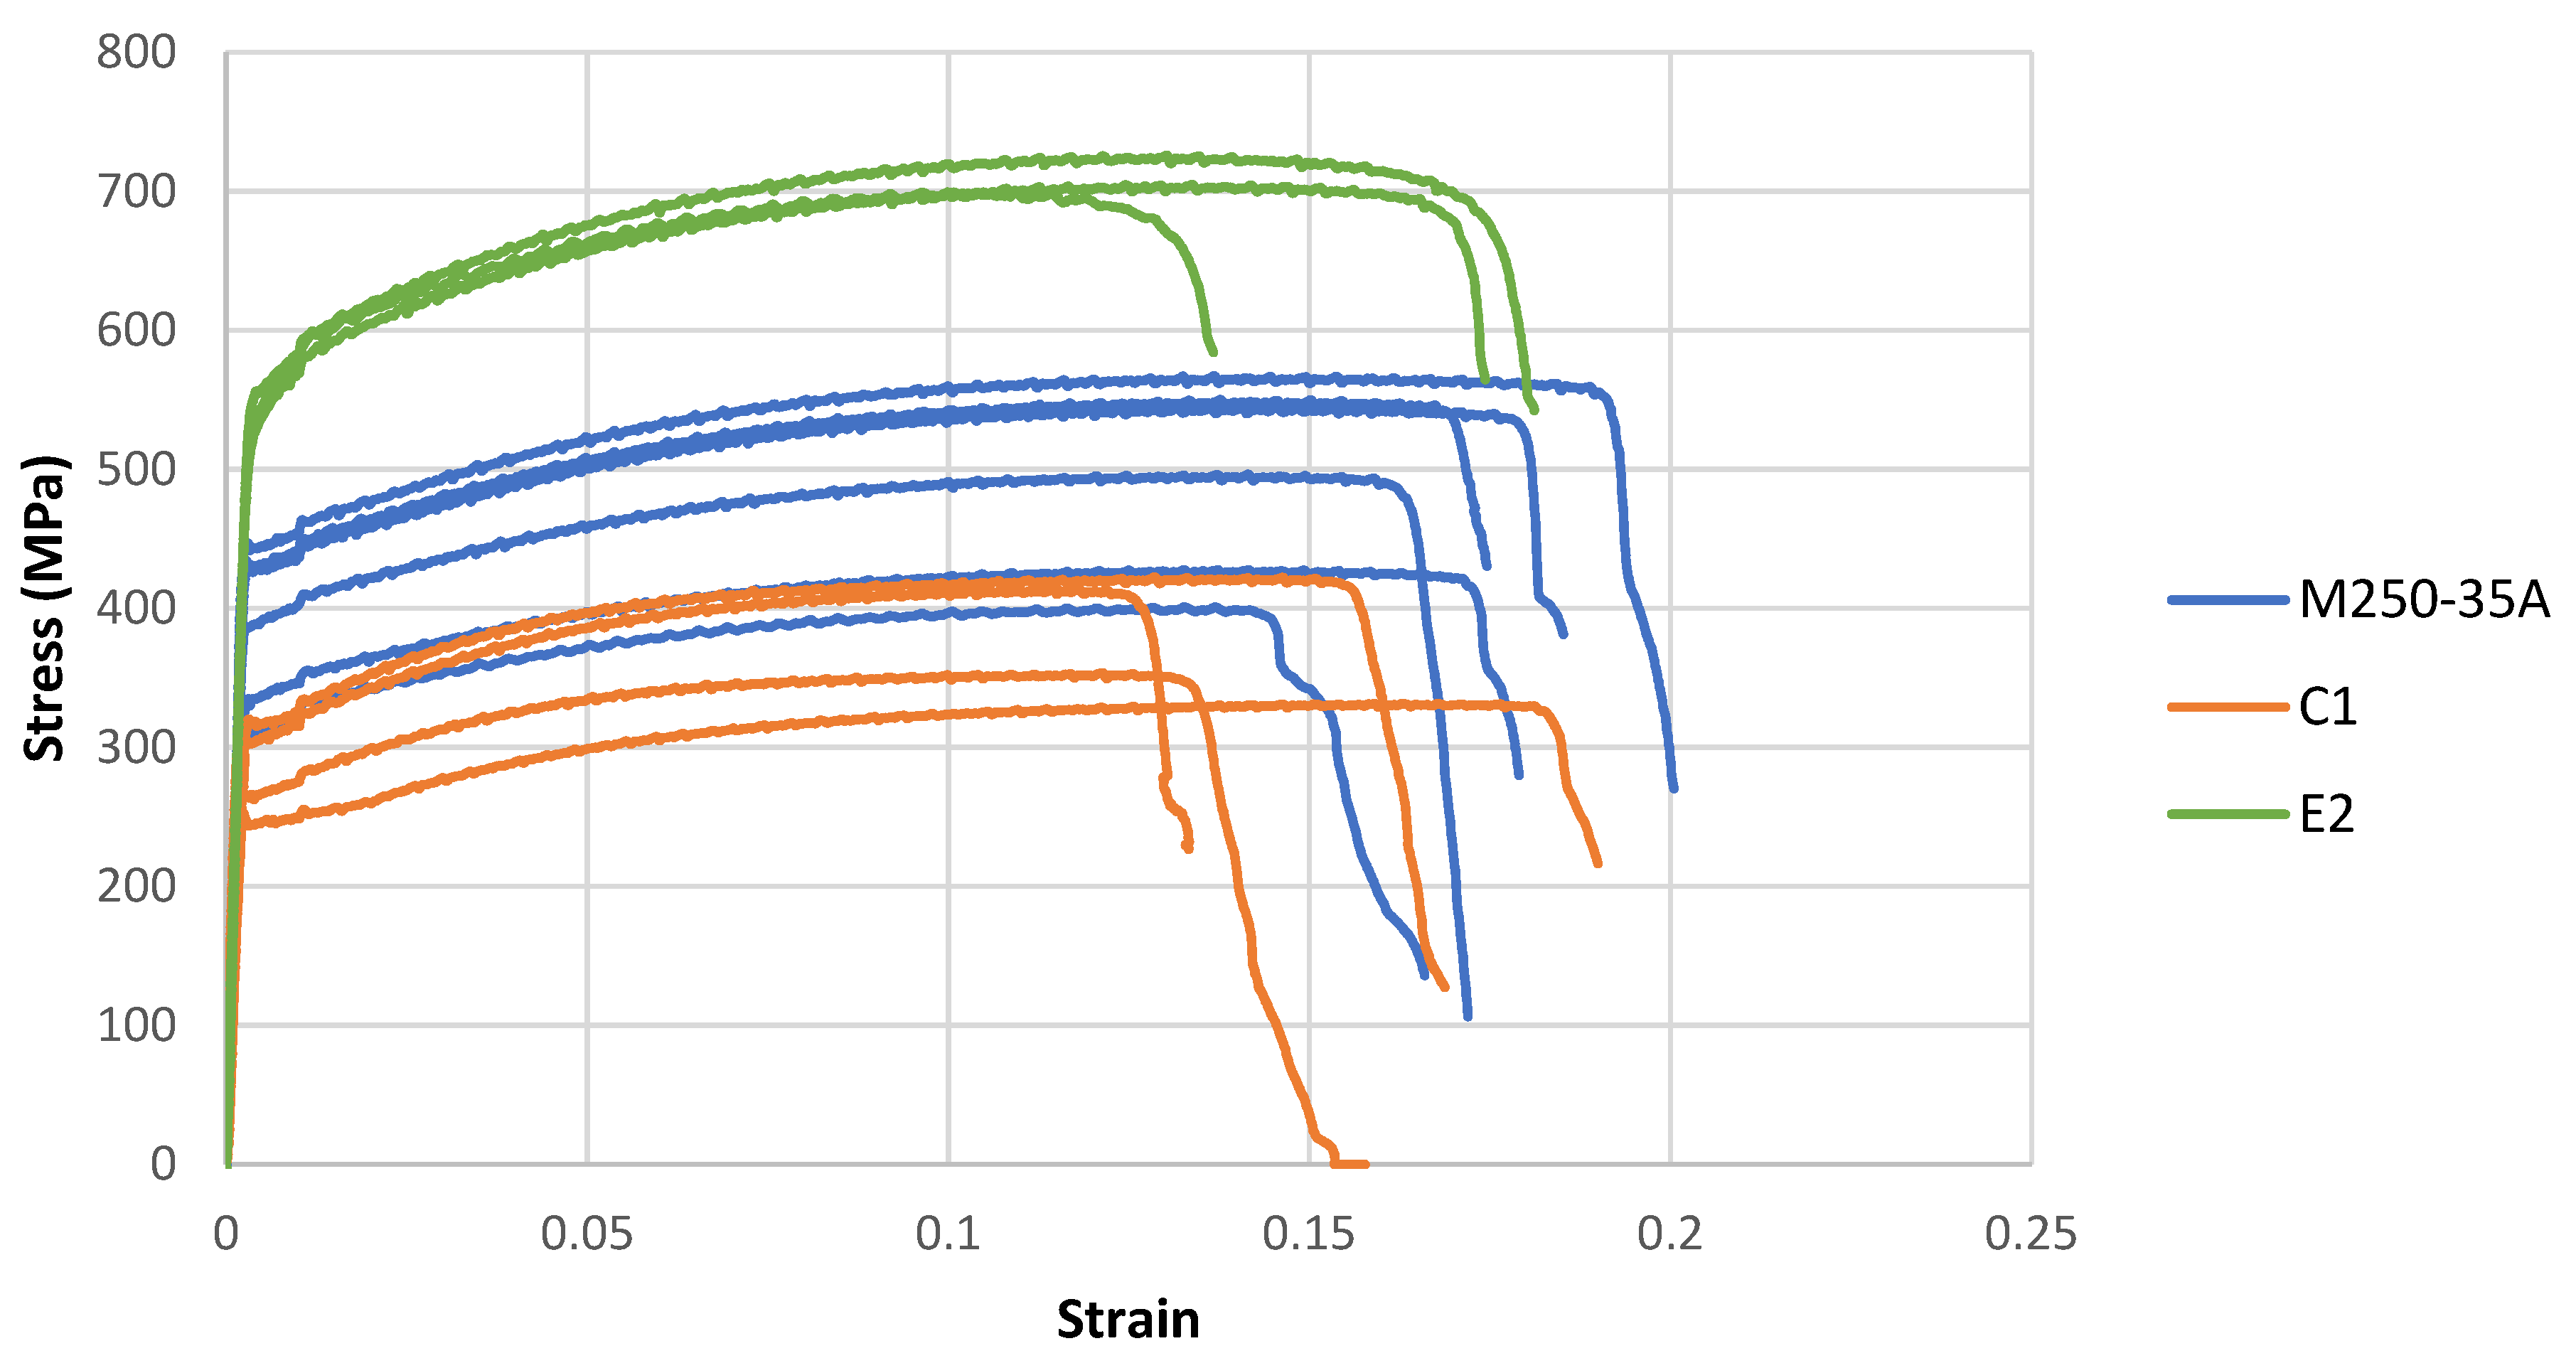
Figure 11 shows the tensile stress–strain curves for C1, M230-35A and E2. The commercial-grade M230-35A shows a significant amount of variation in its strength and elongation values; however, it consistently shows a higher yield strength and UTS compared to the C1 material. Whilst the C1 (3 wt% Si) composition was chosen to represent the commercial electrical steel, the differences in alloying elements present cause differences in the mechanical properties. The 180 µm grain size in C1, compared with around a 100–120 µm grain size typical of a commercial M250-35A, is expected to account for most of the 80 MPa difference between the mean UTS of the two materials, based on a Hall–Petch strength contribution. E2 shows much higher strength than the commercial M250-35A grade. There is over 220 MPa difference between the mean UTS values, with the majority of this difference being attributed to the additional solid solution strengthening from the Mn and additional Si content in the steel (equating to around 180 MPa increase compared to the 3 wt% Si material, using solid solution coefficients of 34 and 82 MPa/wt% for Mn and Si, respectively [26]. There is also an additional strength increment coming from refining the grains by 80 µm grain size (180 to 100 µm). It is unclear at this stage why E2 shows such an improvement in the consistency in yield and UTS. Variability for thin gauge material is common, particularly as these materials typically have only 1–2 grains through the thickness of the sheet.
Increasing the strength of electrical steel is important for applications using thin sheets in high-speed motors. For example, Internal Permanent Magnet (IPM) electric machines, which are widely used for electric vehicles because of their high efficiency and high power/torque density, give rise to high mechanical loads on the sheets. It is known that solid solution strengthening, and nano-scale precipitation can be used to produce higher-strength electrical steels with minimal negative influence on the magnetic properties [27]. Therefore, the designed new alloys E1 and E2 provide benefits in terms of reducing the high-frequency magnetic losses, due to their increased resistivity, and higher strength, which would allow for operation under high-loading conditions and/or use of thinner sheets.
This research has identified, using an alloy design approach, a novel family of alloys, termed HiPPES (High-Performing and Processable Electrical Steel), that exhibit significantly reduced magnetic losses at high frequencies while preserving ductility, with validation using two experimentally produced alloys. The main alloy design criteria are based on suppressing the formation of detrimental ordered BCC phases, which impair ductility, and increasing both strength and resistivity using solid solution alloying additions. It is important to note that the two experimental HiPPES grades examined in this study have not been fully optimized or are the most high-performing alloys predicted by the alloy design approach, but serve as proof-of-concept for the proposed approach to alloy design that significantly steps away from the traditional predominantly Fe-Si binary alloys. Further in-depth study of a specific alloy is needed to optimize the alloy for a specific case study utilizing characterization equipment such as Lorenz microscopy. Compared to conventional non-grain-oriented (NGO) electrical steel grades, the experimentally examined HiPPES alloys offer up to a 33% reduction in magnetic losses at 3000 Hz, a nearly 50% increase in strength, and a much lower sensitivity of magnetic losses to grain size variations compared to commercial M250-35A material.

5. Conclusions

A combination of CALPHAD modelling and empirical relationships was employed to define criteria for HiPPES grades that included mapping the predicted formation of the brittle, ordered B2 phase based on composition and temperature. A feedback loop was used that identified favorable combinations of resistivity (a key metric for magnetic loss performance at high frequencies) and the A2-to-B2 phase-transition temperature (a proxy for ductility during cold rolling). A family of potential alloys, designated HiPPES (High-Performing and Processable Electrical Steels), were identified and tested. The key findings are summarized as follows:
  • Fabrication: The 6.5 wt% Si electrical steel could not be cold-rolled as it was brittle, whereas both HiPPES alloys and the 3 wt% Si steel were successfully rolled to a final gauge of 0.35 mm.
  • Resistivity: Predicted and measured resistivity values agreed within 6%, with the two HiPPES alloys exhibiting up to a 90% increase in resistivity compared to the 3 wt% Si steel and M250-35A.
  • Magnetic Losses: At 1.5 T, a HiPPES alloy demonstrated over 40% lower losses compared to the 3 wt% Si steel and 25% lower losses than M250-35A. At 1 T, losses improved by 33% relative to M250-35A.
  • Stress Sensitivity: Under compressive loads, the HiPPES alloy showed a comparable response to M250-35A. However, under tensile loads, the HiPPES alloy showed a 12% reduction in losses compared to M250-35A, which showed only a 4% reduction in losses.
  • Grain Size Dependence: The HiPPES alloy exhibited little variation in magnetic losses (<20%) across grain sizes from 60 to 180 µm at frequencies above 400 Hz. By contrast, M250-35A showed over 40% variation in losses under similar conditions.
  • Mechanical Strength: The HiPPES alloy demonstrated an approximately 220 MPa increase in ultimate tensile strength (UTS) compared to M250-35A and over 350 MPa compared to 3 wt% Si steel. This enhancement was primarily attributed to solid solution strengthening from alloying additions.

6. Patents

A patent (The University of Warwick. Non-Grain Oriented Electrical Steel Alloys. UK Patent Application No. GB2414302.6, filed 30 September 2024) has been filed pertaining to the HiPPES alloy classification.

Author Contributions

Conceptualization, C.S.; Methodology, C.S., G.L., J.S. and C.D.; Software, J.S.; Investigation, C.S. and X.M.; Data curation, X.M. and G.L.; Writing—original draft, C.S. and C.D.; Writing—review & editing, C.S. and C.D.; Supervision, C.D.; Funding acquisition, C.D. All authors have read and agreed to the published version of the manuscript.

Funding

This research was funded by the RAEng Chair held by Davis (RCSRF1718_6_51).

Data Availability Statement

The original contributions presented in this study are included in the article. Further inquiries can be directed to the corresponding author(s).

Acknowledgments

The authors would like to thank the EPSRC-funded FEMM hub (https://www.electricalmachineshub.ac.uk/ accessed on 21 September 2025) for their support during the initial stages of the development of these alloys. The authors would also like to thank the High-Value Manufacturing Catapult at WMG for their ongoing support for them.

Conflicts of Interest

The authors declare that they have no known competing financial interests or personal relationships that could have appeared to influence the work reported in this paper.

References

  1. World Steel Association. World Steel in Figures. 2022. Available online: https://worldsteel.org/data/world-steel-in-figures/world-steel-in-figures-2022/ (accessed on 21 September 2025).
  2. Ouyang, G.; Chen, X.; Liang, Y.; Macziewski, C.; Cui, J. Review of Fe-6.5 wt% Si high silicon steel—A promising soft magnetic material for sub-kHz application. J. Magn. Magn. Mater. 2019, 481, 234–250. [Google Scholar] [CrossRef]
  3. Krings, A.; Boglietti, A.; Cavagnino, A.; Sprague, S. Soft Magnetic Material Status and Trends in Electric Machines. IEEE Trans. Ind. Electron. 2017, 64, 2405–2414. [Google Scholar] [CrossRef]
  4. Campbell, A. On the Magnetic Properties of Silicon Iron (Stalloy) in Alternating Magnetic Fields of Low Value. Proc. Phys. Soc. Lond. 1919, 32, 232. [Google Scholar] [CrossRef]
  5. Yu, J.H.; Shin, J.S.; Bae, J.S.; Lee, Z.-H.; Lee, T.D.; Lee, H.M.; Lavernia, E.J. The effect of heat treatments and Si contents on B2 ordering reaction in high-silicon steels. Mater. Sci. Eng. A 2001, 307, 29–34. [Google Scholar] [CrossRef]
  6. Lu, X.; Xu, Y.B.; Fang, F.; Zhang, Y.X.; Wang, Y.; Jiao, H.T.; Cao, G.M.; Li, C.G.; Yuan, G.; Wang, G.D. Microstructure. texture and precipitate of grain-oriented 4.5 wt% Si steel by strip casting. J. Magn. Magn. Mater. 2016, 404, 230–237. [Google Scholar] [CrossRef]
  7. Li, H.Z.; Liu, H.T.; Liu, Z.Y.; Lu, H.H.; Song, H.Y.; Wang, G.D. Characterization of microstructure. texture and magnetic properties in twin-roll casting high silicon non-oriented electrical steel. Mater. Charact. 2014, 88, 1–6. [Google Scholar] [CrossRef]
  8. Ouyang, G.; Jensen, B.; Tang, W.; Dennis, K.; Macziewski, C.; Thimmaiah, S.; Liang, Y. Cui Effect of wheel speed on magnetic and mechanical properties of melt spun Fe-6.5 wt.% Si high silicon steel. AIP Adv. 2018, 8, 56111. [Google Scholar] [CrossRef]
  9. Li, H.Z.; Liu, H.T.; Liu, Y.; Liu, Z.Y.; Cao, G.M.; Luo, Z.H.; Zhang, F.Q.; Chen, S.L.; Lyu, L.; Wang, G.D. Effects of warm temper rolling on microstructure. texture and magnetic properties of strip-casting 6.5 wt% Si electrical steel. J. Magn. Magn. Mater. 2014, 370, 6–12. [Google Scholar] [CrossRef]
  10. Oda, Y.; Okubo, T.; Takata, M. Recent development of non-oriented electrical steel in JFE steel. JFE Tech. Report. 2016, 21, 7–13. [Google Scholar]
  11. Kasai, S.; Namikawa, M.; Hiratani, T. Recent progress of high silicon electrical steel in JFE steel. JFE Tech. Report. 2016, 21, 14–19. [Google Scholar]
  12. Daem, A.; Sergeant, P.; Dupré, L.; Chaudhuri, S.; Bliznuk, V.; Kestens, L. Materials Magnetic Properties of Silicon Steel after Plastic Deformation. Materials 2020, 13, 4361. [Google Scholar] [CrossRef]
  13. Koley, S.; Ray, T.; Mohanty, I.; Chatterjee, S.; Shome, M. Prediction of electrical resistivity of steel using artificial neural network. Ironmak. Steelmak. 2019, 46, 383–391. [Google Scholar] [CrossRef]
  14. Shin, J.S.; Bae, J.S.; Kim, H.J.; Lee, H.M.; Lee, T.D.; Lavernia, E.J.; Lee, Z.H. Ordering–disordering phenomena and micro-hardness characteristics of B2 phase in Fe–(5–6.5%)Si alloys. Mater. Sci. Eng. A 2005, 407, 282–290. [Google Scholar] [CrossRef]
  15. Swann, P.R.; Grånäs, L.; Lehtinen, B. The B2 and DO 3 Ordering Reactions in Iron-Silicon Alloys in the Vicinity of the Curie Temperature. Met. Sci. 2013, 9, 90–96. [Google Scholar] [CrossRef]
  16. Cardias, R.; Szilva, A.; Bergman, A.; Di Marco, I.; Katsnelson, M.I.; Lichtenstein, A.I.; Nordström, L.; Klautau, A.B.; Eriksson, O.; Kvashnin, Y.O. The Bethe-Slater curve revisited; new insights from electronic structure theory OPEN. Sci. Rep. 2017, 7, 4058. [Google Scholar] [CrossRef]
  17. IEC 60404-2:1996; Magnetic Materials—Part 2: Methods of Measurement of the Magnetic Properties of Electrical Steel Sheet and Strip by Means of an Epstein Frame. International Electrotechnical Commission (IEC): Geneva, Switzerland, 2018.
  18. ASTM E8/E8M-16a; Standard Test Methods for Tension Testing of Metallic Materials. ASTM International: West Conshohocken, PA, USA, 2016.
  19. Boehm, L.; Hartmann, C.; Gilch, I.; Stoecker, A.; Kawalla, R.; Wei, X.; Hirt, G.; Heller, M.; Korte-Kerzel, S.; Leuning, N.; et al. Grain size influence on the magnetic property deterioration of blanked non-oriented electrical steels. Materials 2021, 14, 7055. [Google Scholar] [CrossRef]
  20. Beyer, E.; Lahn, L.; Schepers, C.; Stucky, T. The influence of compressive stress applied by hard coatings on the power loss of grain oriented electrical steel sheet. J. Magn. Magn. Mater. 2011, 323, 1985–1991. [Google Scholar] [CrossRef]
  21. Zhang, P.; Liao, W.; Lin, B.; Wang, N.; Li, C.; Zhang, J.; Gao, J. Comprehensive magnetic properties of grain-oriented silicon steel sheet considering anisotropy under mechanical stress. J. Magn. Magn. Mater. 2024, 610, 172583. [Google Scholar] [CrossRef]
  22. Slater, J.C. The Ferromagnetism of Nickel. Phys. Rev. 1936, 49, 537. [Google Scholar] [CrossRef]
  23. Wang, Z.; Zhang, J.; Zhang, C.; Ye, F.; Liu, B.; Liang, Y. Effect of initial grain size on microstructure, texture and magnetic properties of non-oriented electrical steel. J. Mater. Res. Technol. 2024, 31, 1607–1615. [Google Scholar] [CrossRef]
  24. Takaki, S. Review on the Hall-Petch Relation in Ferritic Steel. Mater. Sci. Forum 2010, 654–656, 11–16. [Google Scholar] [CrossRef]
  25. De Campos, M.F.; Teixeira, J.C.; Landgraf, F.J.G. The optimum grain size for minimizing energy losses in iron. J. Magn. Magn. Mater. 2006, 301, 94–99. [Google Scholar] [CrossRef]
  26. Gawne, D.T.; Lewis, G.M.H. Strengthening mechanisms in high-strength micro-alloyed steels. Mater. Sci. Technol. 1985, 1, 183–191. [Google Scholar] [CrossRef]
  27. Nyyssönen, T.; Hutchinson, B.; Broddefalk, A. Higher strength steels for magnetic applications in motors. Mater. Sci. Technol. 2021, 37, 883–892. [Google Scholar] [CrossRef]
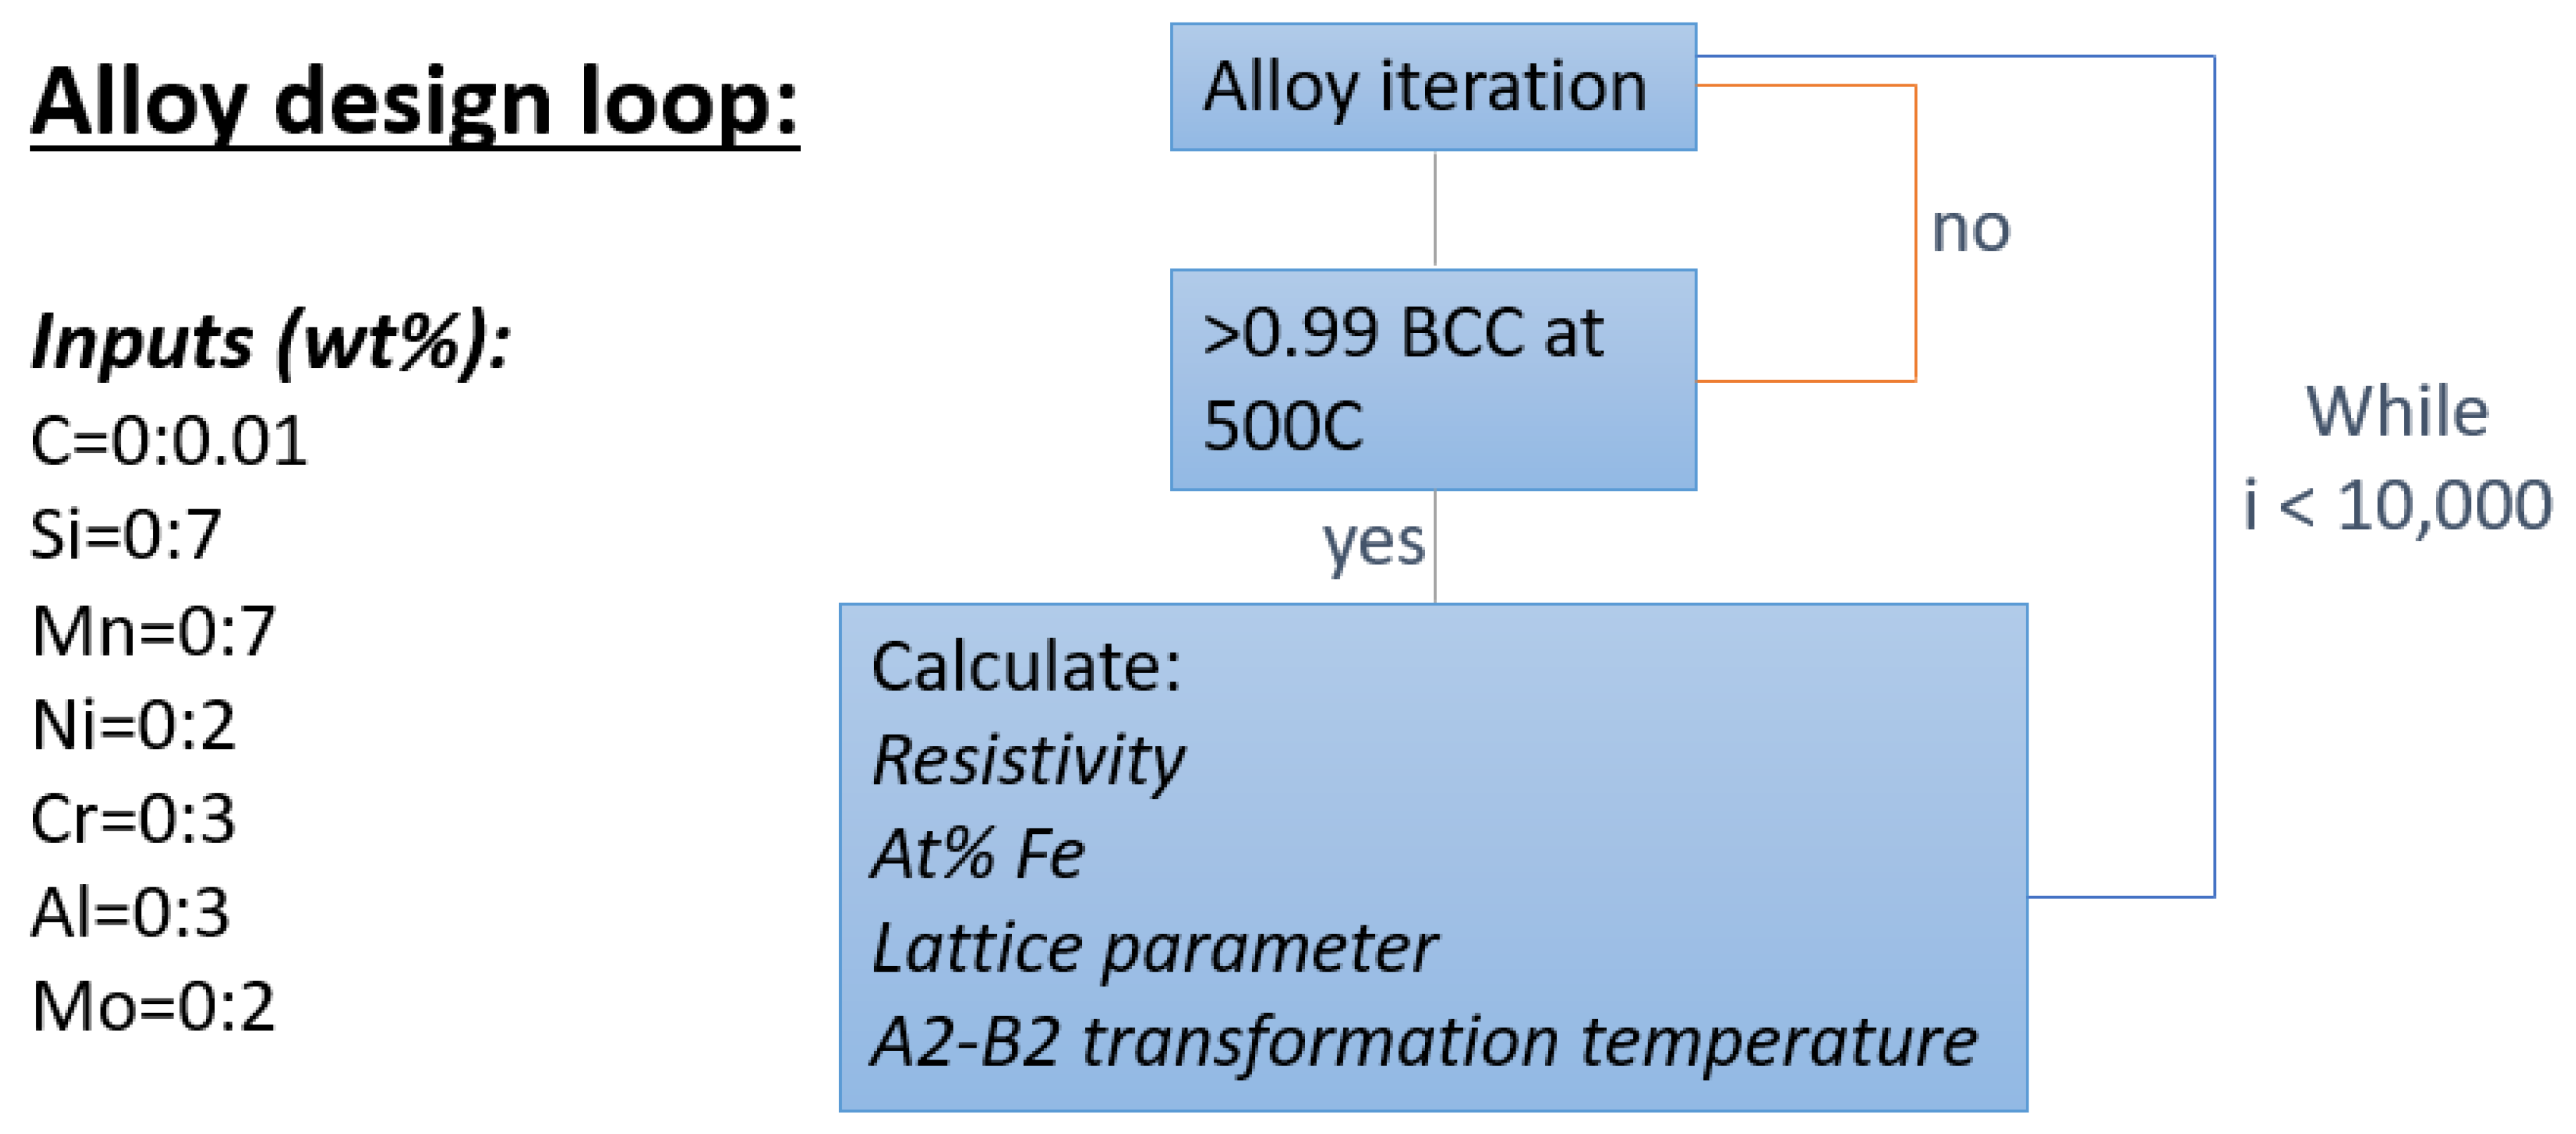
Figure 1. Schematic flow diagram to show the alloy design process, where the range of allowed alloying additions are shown along with the criteria used to assess the alloy performance.
Metals 15 01066 g001
Figure 2. Sublattice Si distribution with increasing Si wt% showing the transition from disordered A2 at low Si wt% to the ordered B2 phase at high Si wt% in an Fe-Si binary at 500 °C.
Metals 15 01066 g002
Figure 3. The predicted relationship between the resistivity (Equation (1)) and the A2-B2 transformation (determined from CALPHAD calculations) for binary Fe-Si compositions.
Metals 15 01066 g003
Figure 4. Resistivity and A2-B2 transformation temperature for a selection of the alloys considered compared to the binary Fe-Si relationship. The results for 3 and 6.5 wt% Si binary alloys have been shown for reference. The two alloys chosen for experimentation have also been highlighted.
Metals 15 01066 g004
Figure 5. Final rolled product of each of the three compositions showing the low ductility of the 6.5 wt% Si alloy (C2). The rolled product width of each strip is 80 mm (± 1 mm).
Metals 15 01066 g005
Figure 6. Predicted and measured electrical resistivity for the four electrical steels produced in this work and commercial M250-35A grade. * As C2 was unable to be cold-rolled, the value quoted here represents the hot-rolled condition.
Metals 15 01066 g006
Figure 7. A typical microstructure of the HiPPES material: (a) an example EBSD image of a cold-rolled annealed sample of grade E1 (the different colors indicates different grains) and (b) the accompanying grain size distribution.
Metals 15 01066 g007
Figure 8. Frequency–magnetic loss plots for alloy E2 compared to 3 wt% Si laboratory electrical steel (C1) and the commercial grade M250-35A using B = 1T.
Metals 15 01066 g008
Figure 9. Influence of 50 MPa compressive and tensile stress on the multifrequency losses for the commercial M250-35A electrical steel and the new alloy E1.
Metals 15 01066 g009
Figure 10. Influence of grain size on the W10 magnetic loss for (a) M250-35A and (b) the new alloy E1.
Metals 15 01066 g010
Figure 11. Stress–strain curves for the 3 wt% Si (C1) and new alloy E2 from this study compared to that of a commercial M250-35A electrical steel.
Metals 15 01066 g011
Table 1. Composition measurements of the casts produced for this study, all wt% *.
FeCMnSiNiCrAlMo
E1Bal.<0.0043.23.610.630.750.150.4
E2Bal.<0.0041.964.530.410.750.09<0.05
C1Bal.<0.004<0.013.02--<0.005-
C2Bal.<0.004<0.016.4--<0.005-
M250-35ABal.<0.0040.53.2--0.06-
* Oxygen, nitrogen, and sulfur were all below 15 ppm for all casts.
Disclaimer/Publisher’s Note: The statements, opinions and data contained in all publications are solely those of the individual author(s) and contributor(s) and not of MDPI and/or the editor(s). MDPI and/or the editor(s) disclaim responsibility for any injury to people or property resulting from any ideas, methods, instructions or products referred to in the content.