Abstract
316L stainless steel is often used as the metal bipolar plate, which is a key component of fuel cells. For the thinner metal bipolar plates, the mechanical properties may be different for different specimen sizes. In this paper, the mechanical properties, metallographic structure, and hardening behavior of 316L stainless steel sheets with different grain sizes and specimen thickness were studied. Several mathematical models were selected to describe the hardening behavior of 316L stainless steel sheet. A correlated hardening model of 316L stainless steel was established, considering the specimen and grain size effect. The results show that the specimen thickness has no effect on the microstructure and grain size, but the austenite grain size increases gradually with an increase in holding time. With a decrease in plate thickness and an increase in grain size, the strength decreases. Compared to the 0.1 mm sheet, the yield strength and tensile strength for the 0.9 mm sheet are increased by 48% and 24%, respectively. The yield strength and tensile strength are decreased by nearly half after 20 min heat treatment due to the grain size growth. The thicker the sample and higher the grain size is, the higher the hardening rate is. The predicted stress–strain by established correlated hardening model has a good agreement with the experiment curves.
1. Introduction
The fuel cell is an energy conversion device that converts chemical energy into electrical energy [1]. Compared to traditional power technology based on combustion and mechanical transmission, the fuel cell is a clean and wide prospect technology with high heat conversion efficiency [2]. Proton exchange membrane fuel cell (PEMFC) has excellent performance in terms of efficiency, power density, emission, and a low temperature start-up, which is considered to be one of the development directions of the next generation of vehicle power [3]. A bipolar plate is a key component of fuel cells. Its main function is to conduct current and separate H2 and O2 [4]. It is not only the flow channel of reaction gas, but also the channel of discharging heat and water. The performance of bipolar plates directly determines the reliability and durability of fuel cells. To make the fuel cell work stably for a long time, the bipolar plate must have good conductivity, gas resistance, strength, and corrosion resistance.
The materials used to make the bipolar plates mainly include graphite, and composite and metal materials [5]. Graphite material has excellent conductivity and good chemical stability, which makes it the earliest material used in electrode plates. However, graphite material has poor mechanical strength, high brittleness, and high processing cost [6]. The thickness of graphite bipolar plate is generally 4~6 mm, which reduces the power density of fuel cell stack. Composite materials are generally composed of conductive fillers and polymers. This material has excellent mechanical properties, and its conductivity and corrosion resistance can meet the performance requirements of electrode plates. However, the manufacturing process of composite materials is complex, the cost is high, and the service life is short, which is not conducive to large-scale mass production [7]. Compared to graphite and composite bipolar plates, metal bipolar plates have a higher strength. The thickness of metal plates used is generally 0.1~0.3 mm, which is conducive to improving the power density of fuel cell stacks [8]. In addition, metal materials also have the advantages of simple runner forming and easy mass production, and have become a research hotspot for plate materials. Both the thickness of the metal bipolar plate and the size of the flow channel section are in the submillimeter scale, which is located between macroscopic and microscopic scale, namely mesoscopic scale [9]. At mesoscopic scale, the size effect of materials is obvious. Materials often present mechanical properties that are different from those at the macro scale [10]. It is necessary to deeply discuss the influence of different sizes on the mechanical properties and strengthening behavior of bipolar plates, which is of great significance to accurately study the mechanical distribution of fuel cells under service conditions.
Up to now, many researchers have investigated the influences of the specimen thickness and grain size on the metal mechanical properties. Keller et al. [11] studied the effect of grain size on the mechanical properties of high a purity nickel plate with a thickness of 0.5 mm, and the results showed that grain size had an impact on both the hardening stage and flow stress of the material. With an increase in grain size, the back stress within the grain decreased, resulting in the decrease in flow stress. Raulea et al. [12] studied the effect of sample thickness on mechanical behavior through uniaxial tensile test on Al2S, and the results showed that the yield strength of the material gradually decreased with the decrease in sample thickness. Chan et al. [13] studied the effects of grain size and sample size on the flow stress of sheet metal microforming through a pure copper tensile test by introducing the ratio of grain size to sample thickness: η = g/t, called the sample size ratio. The results showed that the flow stress gradually decreased with the decrease in the sample size ratio. Liu et al. [14] studied the effects of grain size and geometry size on the mechanical properties of copper materials, and found that the flow stress of sample decreased gradually with the decrease in sample thickness and the increase in grain size. A new constitutive model considering grain boundary strengthening was established to explain the effect of size effect on the flow stress of sample. For the ion-irradiated polycrystals with obvious grain size effects, Liu et al. [15] proposed a new hardening model which separates the grain size effect from the dislocation hardening contribution. The refinement of the grain size and high dislocation densities can enhance the strain-hardening exponent [16]. Gau et al. [17] studied the effect of size on the mechanical properties of aluminum alloy and brass, and found that the yield strength and tensile strength of the sample were reduced with decreases in thickness and increases in average grain diameter. Recently, Firouzjaei et al. [18] proposed a new constitutive model based on the Swift equation to take into account the geometry and grain size effect. The proposed constitutive model can provide a good description of the flow stress by considering the interactive effect of specimen and grain sizes.
From the above research results, the flow stress of materials decreases gradually with decreases in sample thickness at constant grain size. When the sample thickness is close to the grain size, some materials will show greater size effects. The thinner the sample, the greater the strength. Therefore, it is necessary to study the influence of plate thickness and grain size on the mechanical properties and a constitutive model of a 316L stainless steel sheet. The aim of this study is to clarify the effects of thickness and grain size on the hardening behavior and model of the 316L sheet. The mechanical properties, metallographic structure, and hardening behavior of 316L stainless steel sheets with different grain sizes and specimen thicknesses will be discussed. A correlated hardening model of 316L stainless steel will be proposed in this study, considering the specimen and grain size effects.
2. Experiment Details
2.1. Sample Preparation
The material used in this paper is a 316L stainless steel sheet, which is widely used in petroleum, chemical, textile, and other industries. Three types, with thicknesses of 0.1 mm, 0.3 mm, and 0.9 mm were employed. For the three sheets, the material compositions are listed in Table 1. The element contents of the three thicknesses are in line with the composition requirements of 316L stainless steel in GB/T 20878-2007 [19].

Table 1.
Chemical composition of 316L stainless steel (wt.%).
Austenitic stainless steel generally goes through solid solution treatment. Due to the low carbon content of 316L stainless steel, 1050 °C was selected as the solution heat treatment temperature in this paper. The stainless steel is heated to 1050 °C first, and then it is cooled rapidly (within 10 min) to room temperature after heat preservation. The solid solution treatment purpose is to re-dissolve the alloy carbide produced in the process of processing into austenite, so as to obtain the single-phase austenite structure.
In order to study the effect of grain size on uniaxial tensile mechanical properties, different grain sizes were obtained by different heat treatment processes. The thickness of 316L stainless steel sheet is 0.1 mm. The sample was put into a box-type heat treatment furnace (HF-kejing, KSL-1700X-G216, Kejing, Heifei, China), and then argon gas was pumped into the furnace to discharge oxygen in the furnace, so as to prevent excessive oxide formation on the metal surface during heating. The samples were kept at 1050 °C for 10 min and 20 min, respectively, and then taken out for water cooling.
2.2. Metallographic Analysis
All the sheet cutting samples before and after heat treatment were prepared in order to measure the grain size of the sheet. The metallographic structure was observed with a Leica metallographic grinding machine (Axio Scope.A1, Zeiss, Oberkochen, Germany). Before the observation, the sample was ground by sandpaper until there were obvious scratches on the surface of the sample. After polishing, the sample surface should be cleaned with alcohol and keep dry with hot air. Aqua regia was used as corrosion solution to corrode metallographic samples. After corrosion, the sample is washed quickly with water, and then the surface of the sample is cleaned with alcohol and dried with hot air. The etched samples were placed under Leica microscope to observe the metallographic structure.
2.3. Tensile Test
The tensile specimen is shown in Figure 1. The overall length of the tensile sample is 78.5 mm, the length and width of the parallel segment are 25 mm and 5 mm, and the radius of the transition circle of the sample is 7.5 mm. In order to facilitate holding, the length and width of the holding section are 20 mm and 14 mm, respectively. Three tensile tests were conducted to avoid test deviation. The test results for the specimen with middle yield strength were used. The sample was processed by wire cutting. Because the materials used in this paper are thinner, it is easy to distort them when cutting, so that the processing error is large, so the cuttings of multiple plates are placed together when processing. In order to prevent the effect of clamping on the plate, the plate material is placed on the board. The processing marks on the edge of the sample are processed, which can cause stress concentration to affect the results of the test. The tensile sample edges were polished by using 600 # and 800 # sandpaper. Then, the sample surface was rinsed with alcohol. The width and thickness of the sample were measured by a micrometer before the tensile test was performed. The tensile test speed was calculated according to the formula in standard GBT 228.1-2010 [20]:
where vc is the load speed, Lc is the length in parallel length, and is the strain rate of the part of parallel length (here, it is 0.00025 s−1).
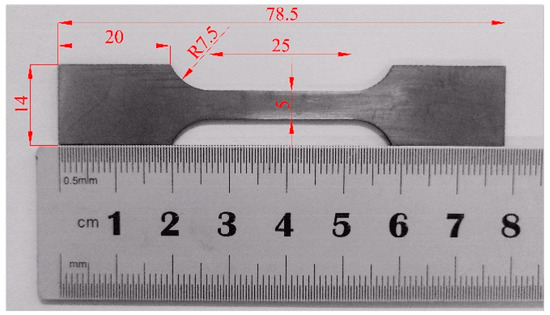
Figure 1.
Size diagram of tensile specimen (Unit: mm).
3. Results and Discussion
3.1. Microstructure
Figure 2 shows the metallographic structure of the etched sheet with different specimen thicknesses. The intercept method [21] is used by counting the number of grain boundaries intersected by a measured line segment of a given length. The measurement error is ±2 μm. The grain sizes for the specimen thicknesses 0.1 mm, 0.3 mm, and 0.9 mm are 22 μm, 23 μm, and 17 μm, respectively. Here, symbols t and g represent the specimen thickness and grain size, respectively. The microstructure and grain size are similar for the different specimen thicknesses. Figure 3 shows the metallographic structure of the 0.1 mm 316L stainless steel sheet metal with different holding times. The grain sizes for the 0.1 mm 316L stainless steel after heating treatment at 1050 °C with holding times of 10 min and 20 min are 31 μm and 39 μm, respectively. The grain size was increased after the solid solution heat treatment. And, the austenite grain size increases gradually with the increase in holding time.
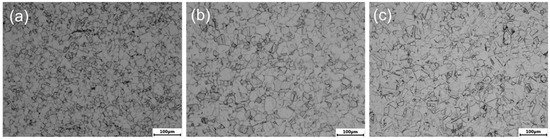
Figure 2.
Metallographic structures for the specimen of thickness t = 0.9 mm (a), t = 0.3 mm (b) and t = 0.1 mm (c).
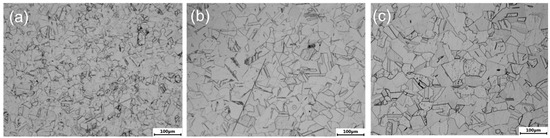
Figure 3.
Metallographic structures for the specimen of thickness 0.1 mm with heat treatment (a), and with holding time 10 min (b) and 20 min (c).
3.2. Tensile Properties
Firstly, the tensile load–displacement curve is obtained by the force sensor and extensometer, and then the engineering stress–strain curve is obtained. The engineering stress-engineering strain curve can be transformed into true stress–true strain curve by Formulas (2) and (3).
where σture and εtrue represent true stress and true strain, respectively, while σeng and εeng represent engineering stress and engineering strain, respectively.
Figure 4 shows the true stress–strain curve of the 316L sheet metal for different thicknesses and grain sizes. As seen from Figure 4a, the yield strength, tensile strength, and elongation were increased with the increases in specimen thickness. It presents that the thinner a specimen thickness is, the weaker its strength is. This may be because the thicker the sheet is, the higher the number of grains in the thickness direction is. The hardening stage is generated by the strengthening mechanism based on the dislocation movement and blocking in the crystal structure. For thicker sheets, the grain number in the thickness direction is larger than that for thinner sheet. There is more dislocation slip and blocking in the active cross-section for the thicker sheet, resulting in a high tensile strength and longer elongation. When the specimen thickness increases from 0.1 mm to 0.9 mm, the yield strength and tensile strength are increased from 201 MPa to 297 MPa and from 832 MPa to 1096 MPa, respectively. The yield strength and tensile strength increase by 48% and 24%, respectively. Seen from Figure 4b, the yield strength, tensile strength, and elongation are increased with decreases in grain size. The solid solution heat treatment can reduce the mechanical properties of 316L stainless steel at room temperature. The yield strength, tensile strength, and elongation are decreased with increases in holding time. When the heat treatment holding time is increased from zero to 20 min, the yield strength and tensile strength are decreased from 201 MPa to 96 MPa and from 832 MPa to 465 MPa, respectively. The yield strength and tensile strength decreased by nearly half after 20 min of heat treatment. The larger the grain size is, the fewer grains are distributed along the thickness direction. Similarly, there is little dislocation slip and blocking in the active cross-section for the large grain size, resulting in a low tensile strength and small elongation.
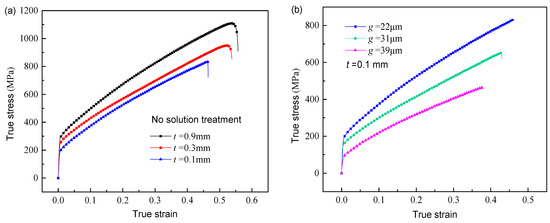
Figure 4.
True stress–true strain curve at different thicknesses (a) and grain sizes (b).
Figure 5 shows the macroscopic fracture morphology of tensile specimens with different thicknesses and grain sizes. The macroscopic fracture of tensile specimens with 0.9 mm and 0.3 mm thickness shows an obvious necking phenomenon. However, the fracture of specimens with 0.1 mm thickness is flat without any necking. This may be due to the small number of grains in the thickness direction of the 0.1 mm plate, which leads to the rapid expansion of microporous defects when the specimen is stretched, resulting in a flush fracture.
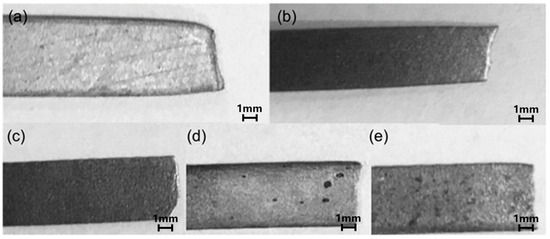
Figure 5.
Macroscopic fracture morphology for different specimen thicknesses and grain sizes: T = 0.9 mm, S = 22 μm (a); T = 0.3 mm, S = 22 μm (b); T = 0.1 mm, S = 22 μm (c); T = 0.1 mm, S = 31 μm (d); and T = 0.1 mm, S = 39 μm (e).
3.3. Hardening Behavior
The hardening rate is an important parameter to evaluate the work hardening ability of materials, which is obtained by taking the derivative of true stress–strain curve. Figure 6 shows the hardening rates with the true strain for different specimen thicknesses and grain sizes. For the same true strain, the hardening rate of 0.9 mm is the highest, while the hardening rate of 0.1 mm is close to that of 0.3 mm. The hardening rate decreases gradually with an increase in grain size. The trend of hardening rate with true strain can be divided into three stages. In the first stage, the hardening rate decreases rapidly with an increase in strain, because the material deformation is mainly dislocation slip at this stage. In the second stage, the hardening rate is still gradually reduced with an increase in strain, but the extent of reduction is far lower than that in the first stage. This is because the twin density increases with an increase in strain, and the generation of twins inhibits the dislocation movement. In the third stage, the hardening rate tends to be stable, because the deformation twins in the material tend to be saturated. There are few new twins, which makes the hardening rate gradually stable.
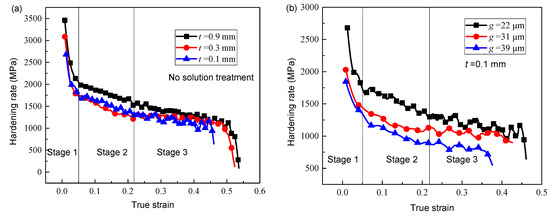
Figure 6.
Hardening rate with true strain for different specimen thicknesses (a) and grain sizes (b).
For metal materials, the Holloman model (full strain extrapolation model) [22,23] is generally adopted to describe the stress–strain relationship in the whole process of material deformation, and the formula is as follows:
where K is hardening coefficient (MPa) and n is hardening exponent (dimensionless).
The true stress and true strain in the Holloman model have a linear relationship in the log–log coordinate diagram. The natural logarithm of the plastic data in Figure 6 is used to obtain the corresponding logarithmic stress and strain curves, as shown in Figure 7. The logarithmic stress–strain curves show the feature of downward convex and a growth trend of slow at first and then sharp. The true stress–strain data does not show a linear relationship in the logarithmic coordinate system. It indicates that Holloman model is not suitable for describing the true stress–strain curve of austenitic stainless steel. Zhu et al. [24] also pointed out that the hardening behavior of the FCC structure could not be described by a simple Holloman model due to its low stacking fault energy.
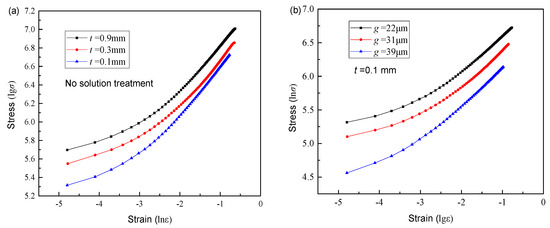
Figure 7.
Logarithmic stress–strain curve for different specimen thicknesses (a) and grain sizes (b).
To address this issue, Swift [25] introduced the parameter ε0 on the basis of the Holloman model, and obtained the stress–strain equation describing the plastic stage:
Ludwigson et al. [26] also proposed a true stress–strain function for FCC metals:
Tian et al. [27] found that the hardening exponent n of austenitic stainless steel had a linear relationship with lnε, and obtained the equation:
Equations (5) and (6) are used to fit the plastic stage in Figure 7. Then, a suitable mathematical model can be selected for describing the hardening behavior of 316L stainless steel for different specimen thickness and grain size. The fitting formula and correlation coefficient are shown in Table 2.
Table 2.
Mathematical model parameters.
It can be seen from Table 2 that the correlation coefficients of the three models are all above 0.999. This shows that the three models can well describe the plastic stage of the 316L stainless steel. However, the fitting parameter n2 obtained by using Ludwigson model is greatly different for different thicknesses and grain sizes. And the Tian model is only applicable to the state of non-zero strain, which is not suitable for the establishment of a flow stress model. Therefore, the Swift model is selected to establish the correlated hardening model 316L stainless steel in the following.
4. Establishment of Correlated Hardening Model
According to the fitting results in Table 2, for different specimen thicknesses and grain sizes, the hardening model is different. The obtained model in Table 2 is unsuitable for specimens with other thicknesses and grain sizes. Therefore, it is an important task to establish a correlated hardening model to describe the hardening behavior for different specimen sizes to for convenient modeling purposes.
4.1. Plastic Deformation Mechanism of 316L Stainless Steel
For a single crystal, the main form of plastic deformation is slip. When the shear stress acting on the slip plane along the slip direction reaches a certain limit, a slip will occur, which is called the critical shear stress [28]. Figure 8 shows the critical resolved shear stress. The angle between the applied load F and the slip direction and the normal line of the slip plane are represented by α and β, respectively. The shear stress τ and working face area A can be obtained:
where A0 is the cross-sectional area of the cylinder in the figure, A is the slip surface area, and τ is the shear stress on the slip surface.
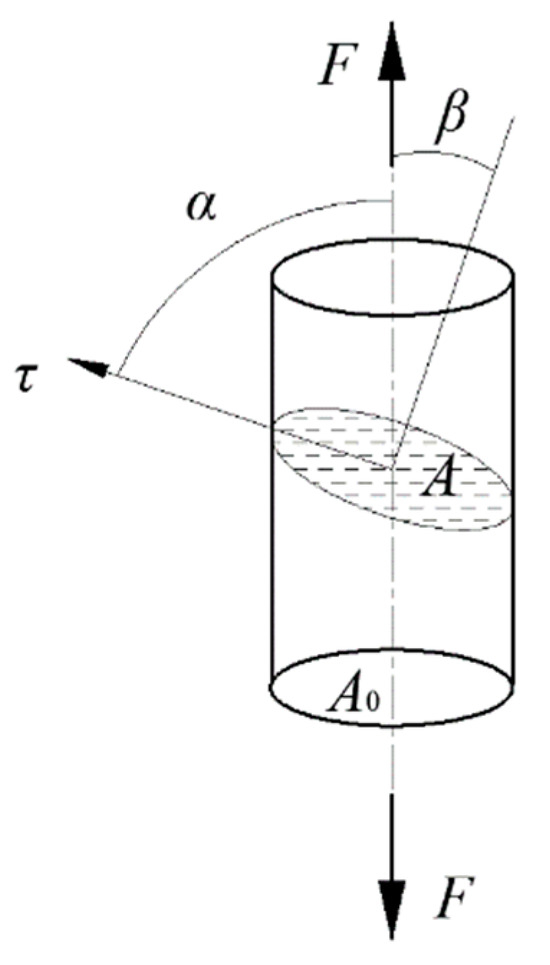
Figure 8.
Critical resolved shear stress.
Substituting Equation (9) into Equation (8), the following can be obtained:
where cos α cos β is the orientation factor. When τ reaches the critical shear stress τc, it is considered that the applied load F makes the material reach the initial yield state:
For polycrystalline materials, slippage in grains must overcome not only lattice resistance and dislocations resistance of impurity atoms on the slip plane, but also grain boundary resistance. When slippage occurs in grains, dislocation slippage cannot directly pass through the grain boundary layer due to different orientations between grains, which results in continuous accumulation of dislocation near the grain boundary. The grain size is small, and the area of the grain boundary in the material is large, which makes the grain boundary more obvious in hindering dislocation slip. The yield strength and grain size of polycrystalline materials conform to the Hall–Petch formula:
where σi (MPa) and k (MPa·μm1/2) are constants related to the material, and g represents the grain size of the material (μm−1/2).
Figure 9 shows the dislocation movement model. Under the action of shear stress τ, the dislocation movement of grain A is blocked to grain boundary Q. And the dislocation continuously slips from dislocation source S to Q, to form dislocation plug group. The stress concentration caused by the dislocation plug group can transfer the deformation from grain A to grain B. The stress at point Q at the top of the dislocation plug group is:
where m is the number of dislocations and τi is the resistance to dislocation movement in the crystal. According to the dislocation plug product group theory, the number of dislocation m is:
where κ is the coefficient, L is the length of the plug product group, and G and b are the shear modulus and the size of the dislocation Bergdahl vector, respectively. If the dislocation source S is in the center of the grain (L = g/2), the following can be obtained:
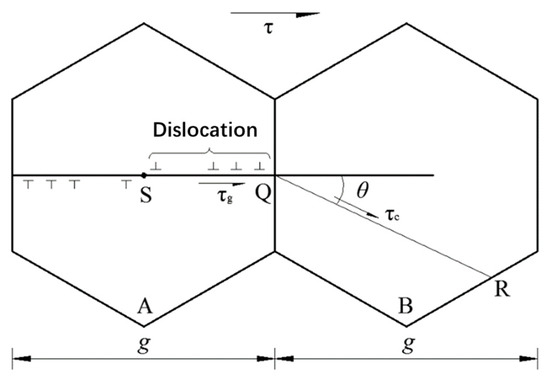
Figure 9.
Dislocation movement model.
The stress on grain B at point Q is:
Assuming that the slip direction of dislocation in grain B is QR, then its critical shear stress in the QR direction is:
The external shear stress τ is equal to the yield shear stress τs when the deformation propagates, due to dislocation motion in grain B:
If M is used to represent the average orientation factor of each grain in polycrystal, it can be concluded that:
Armstrong et al. [29] introduced the work hardening effect into Equation (19), and obtained the Armstrong model to describe stress–strain relationship:
4.2. Correlated Hardening Model Based on Size Effect
Based on above analysis, both the grain size and plate thickness have a certain degree of influence on the mechanical properties of 316L stainless steel. The plastic deformation of materials is mainly realized by the sliding of grains. Compared to the inner grains, the surface grains of materials are less constrained, so it is easier to produce deformation. When the thickness of the sheet is small, the grain size of the surface layer of the material takes up a higher proportion. Because the grain size of the surface layer is less restricted, plastic deformation can occur under the action of a small load, resulting in a reduction in the flow stress of the material as a whole. In order to explain the mechanical behavior of materials affected by the size effect, Lai et al. [30] proposed the surface layer model as shown in Figure 10. Based on the surface layer model, the specimen is divided into two portions: surface layer and inner portions. The grains in the inner portion of specimen contains grain interior and grain boundary. The grains located at the free surfaces have less hardening effects than the inner grains. It is thus assumed that there is no grain boundary strengthening effect in the surface layer portion. The thickness of the surface layer is one grain. The size factor of the sheet is related to two parameters: the sheet width and the sheet thickness. Assume that the austenite grains are hexahedron in the thickness direction, grain diameter is g, and sheet thickness is t, then the proportion of surface layer η can be obtained as:
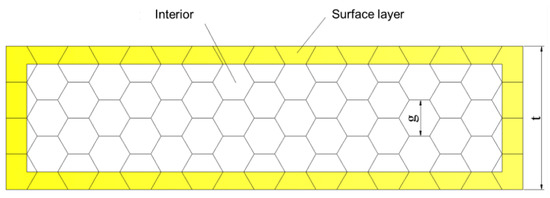
Figure 10.
Surface layer model.
For the materials involved in this paper, the corresponding η values of 0.9 mm, 0.3 mm and 0.1 mm plates without heat treatment are 0.0189, 0.0767 and 0.22, respectively. When 316L stainless steel with 0.1 mm was held for 10 min and 20 min, respectively, the corresponding η of the plate was 0.31 and 0.39.
Since the material parameters used in the finite element simulation are the true stress–plastic strain parameters of the plastic part, the plastic strain can be obtained by following equation:
where εs is the strain value at the yield point.
For the Armstrong model, the first term σi(ε) represents the resistance of dislocation movement inside the grain, and the second term k(ε)g−1/2 represents the resistance of the grain boundary. The finer the grain size, the higher the dislocation density in the grain, so the grain size also affects the dislocation movement in the grain.
In order to comprehensively consider the influence of size effect on flow stress of 316L stainless steel, the influence parameter η of size effect was introduced into Equation (20), and the correlated hardening model of 316L stainless steel based on considering size effect was obtained:
It has been proven that the Swift model has a high degree of fitting to the hardening curve. Therefore, the relationship between σi(εpl) and plastic strain εpl in Equation (23) is described by the Swift model, and it is assumed that f(η) and g(η) are quadratic functions. So, the correlated hardening model Equation (21) can be expressed as:
where a01, b01, c01, ε01, n01, a02, b02, c02, ε02, and n02 are the dimensionless parameters, and the units for K01 and K02 are the MPa and MPa·μm1/2, respectively.
By fitting the true stress–plastic strain data of sheet metal obtained from the test with Equation (22) via 1stopt software (Beijing 7D-Soft High Technology Inc., Beijing, China), which uses the universal global optimization algorithm, the parameters in the correlated hardening model were obtained as shown in Table 3. The correlation coefficients are larger than 0.99.
Table 3.
Parameters in the correlated hardening model.
By substituting the parameters in the table into Equation (23), a correlated hardening model describing the mechanical properties of 316L stainless steel can be obtained:
The predicted values of the true stress–plastic strain curves of different specimens can be obtained by substituting the parameter g and η into Equation (23). The comparison of true stress–plastic strain curves between the predicted results by correlated model and experimental data is shown in Figure 11. It can be seen from the figure that the data are relatively consistent, indicating that the proposed correlated hardening model is very appropriate to describe the hardening behavior of the 316L stainless steel sheet.
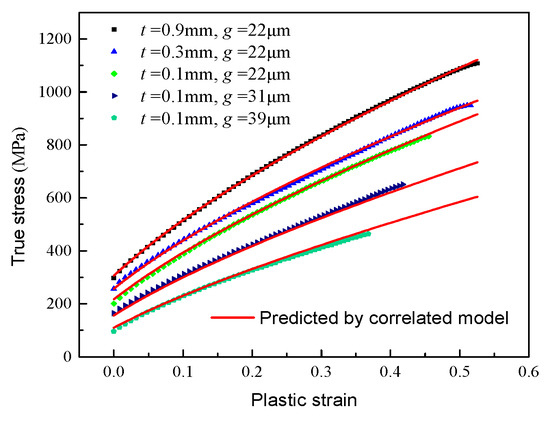
Figure 11.
Comparison of true stress plastic strain curves between the predicted results by correlated model and experimental data.
5. Conclusions
In this paper, 316L stainless steel sheets with different grain sizes were obtained by solid solution heat treatment with different holding times. The uniaxial tensile tests of 316L stainless steel sheets with different specimen thicknesses and grain sizes were conducted to analyze the effect of size on the mechanical properties and hardening behavior of 316L stainless steel, and the main conclusions are as follows:
- (1)
- The specimen thickness has no effect on the microstructure and grain size, but the grain size was increased after solid solution heat treatment. The austenite grain size increases gradually with increases in holding time.
- (2)
- The mechanical properties and hardening behavior of 316L stainless steel sheets are all influenced by the specimen thickness and grain size. With decreases in plate thickness and increases in grain size, the yield strength and tensile strength of 316L stainless steel sheets gradually decrease. The yield strength and tensile strength decreased by nearly half after 20 min of heat treatment, due to the grain size growth.
- (3)
- The hardening rate curve of 316L stainless steel sheets can be divided into three stages: rapidly decreasing, slowly decreasing, and stabilizing. For the samples with the same grain size, the thicker specimen has a higher hardening rate. For the same sample thickness, the hardening rate decreases with an increase in grain size.
- (4)
- Based on Armstrong model, the correlated hardening model of 316L stainless steel was established considering the specimen and grain size effects. The predicted strain–strain by the established correlated hardening model has good agreement with the experiment curves.
Author Contributions
Conceptualization, Q.Z. and Y.L.; methodology, W.M.; validation, W.M. and Q.Z.; investigation, W.M. and Q.Z.; writing—original draft preparation, Q.Z.; writing—review and editing, Y.L. All authors have read and agreed to the published version of the manuscript.
Funding
This research was funded by the Natural Science Foundation of Shandong Province (ZR2021QE099), the National Natural Science Foundation of China (52205175), the Key R&D Program of Shandong Province (2021CXGC011302).
Data Availability Statement
The data presented in this study are available on request from the corresponding author. The data are not publicly available due to their containing information that could compromise the privacy of research participants.
Conflicts of Interest
The authors declare no conflict of interest.
References
- Rashidi, S.; Karimi, N.; Sunden, B.; Kim, K.C.; Olabi, A.G.; Mahian, O. Progress and challenges on the thermal management of electrochemical energy conversion and storage technologies: Fuel cells, electrolysers, and supercapacitors. Prog. Energy Combust. Sci. 2022, 88, 100966. [Google Scholar] [CrossRef]
- Malik, F.R.; Yuan, H.-B.; Moran, J.C.; Tippayawong, N. Overview of hydrogen production technologies for fuel cell utilization. Eng. Sci. Technol. Int. J. 2023, 43, 101452. [Google Scholar]
- Hu, C.; Zhao, Y.; Zhang, Z.; Zhang, H.; Chen, D. Optimization of flow field structure for proton exchange membrane fuel cell stack by multi-physics coupling simulation. Int. J. Electrochem. Sci. 2023, 18, 100195. [Google Scholar] [CrossRef]
- Novalin, T.; Eriksson, B.; Proch, S.; Bexell, U.; Moffatt, C.; Westlinder, J.; Lagergren, C.; Lindbergh, G.; Lindström, R.W. Concepts for preventing metal dissolution from stainless-steel bipolar plates in PEM fuel cells. Energy Convers. Manag. 2022, 253, 115153. [Google Scholar] [CrossRef]
- Meng, W.; Zhu, H.; Wang, X.; Li, G.; Fan, Y.; Sun, D.; Kong, F. Electrochemical Behavior and Surface Conductivity of C/TiC Nanocomposite Coating on Titanium for PEMFC Bipolar Plate. Metals 2022, 12, 771. [Google Scholar] [CrossRef]
- Kuan, Y.-D.; Ciou, C.-W.; Shen, M.-Y.; Wang, C.-K.; Fitriani, R.Z.; Lee, C.-Y. Bipolar plate design and fabrication using graphite reinforced composite laminate for proton exchange membrane fuel cells. Int. J. Hydrogen Energy 2021, 46, 16801–16814. [Google Scholar] [CrossRef]
- Jeong, K.I.; Oh, J.; Song, S.A.; Lee, D.; Lee, D.G.; Kim, S.S. A review of composite bipolar plates in proton exchange membrane fuel cells: Electrical properties and gas permeability. Compos. Struct. 2021, 262, 113617. [Google Scholar] [CrossRef]
- Guo, N.; Zhang, X.; Hou, Z.; Wang, W.; Yang, D.; Min, J.; Ming, P.; Zhang, C. Hot stamping of ultra-thin stainless steel sheets for bipolar plates. J. Mater. Process. Technol. 2023, 317, 117987. [Google Scholar] [CrossRef]
- Huang, P.; Chen, Z.; Zhang, J.; Wu, M.; Liu, Y.; Zhang, F.; Chen, Y.; Chen, X. Stainless steel bipolar plate fuel cell with different flow field structures prepared by laser additive manufacturing. Int. J. Heat Mass Transf. 2022, 183 Pt B, 122186. [Google Scholar] [CrossRef]
- Raja, C.P.; Ramesh, T. Influence of size effects and its key issues during microforming and its associated processes—A review. Eng. Sci. Technol. 2021, 2, 556–570. [Google Scholar]
- Keller, C.; Hug, E.; Chateigner, D. On the origin of the stress decrease for nickel polycrystals with few grains across the thickness. Mater. Sci. Eng. A 2009, 500, 207–215. [Google Scholar] [CrossRef]
- Raulea, L.V.; Goijaerts, A.M.; Govaert, L.E.; Baaijens, F.P.T. Size effects in the processing of thin metal sheets. J. Mater. Process. Technol. 2001, 115, 44–48. [Google Scholar] [CrossRef]
- Chan, W.L.; Fu, M.W. Experimental studies and numerical modeling of the specimen and grain size effects on the flow stress of sheet metal in microforming. Mater. Sci. Eng. A 2011, 528, 7674–7683. [Google Scholar] [CrossRef]
- Liu, J.G.; Fu, M.W.; Chan, W.L. A constitutive model for modeling of the deformation behavior in microforming with a consideration of grain boundary strengthening. Comput. Mater. Sci. 2012, 55, 85–94. [Google Scholar] [CrossRef]
- Liu, K.; Long, X.; Li, B.; Xiao, X.; Jiang, C. A hardening model considering grain size effect for ion-irradiated polycrystals under nanoindentation. Nucl. Eng. Technol. 2021, 53, 2960–2967. [Google Scholar] [CrossRef]
- Silva, R.A.; Pinto, A.L. Precipitation and Grain Size Effects on the Tensile Strain-Hardening Exponents of an API X80 Steel Pipe after High-Frequency Hot-Induction Bending. Metals 2018, 8, 168. [Google Scholar] [CrossRef]
- Gau, J.T.; Principe, C.; Wang, J. An experimental study on size effects on flow stress and formability of aluminm and brass for microforming. J. Mater. Process. Technol. 2007, 184, 42–46. [Google Scholar] [CrossRef]
- Firouzjaei, M.K.; Naeini, H.M.; Kasaei, M.M.; Mirnia, M.J.; da Silva, L.F.M. A microscale constitutive model for thin stainless steel sheets considering size effect. Proc. Inst. Mech. Eng. Part L J. Mater. Des. Appl. 2023, 237, 14644207231169456. [Google Scholar] [CrossRef]
- GB/T 20878-2007; Stainless and Heat-Resisting Steels—Designation and Chemical Composition. Standards Press of China: Beijing, China, 2007.
- GBT 228.1-2010; Metallic Materials—Tensile Testing-Part 1, Method of Test at Room Temperature. Standards Press of China: Beijing, China, 2010.
- GB/T6394-2017; Determination of Estimation the Average Grain Size of Metal. Standards Press of China: Beijing, China, 2017.
- Mikell, P. Groover, Fundamentals of Modern Manufacturing; Materials, Processes, and Systems, 3rd ed.; Wiley: Hoboken, NJ, USA, 2007. [Google Scholar]
- Shin, H.; Ju, Y.; Choi, M.K.; Ha, D.H. Flow stress description characteristic of some constitutive models at wide strain rates and temperatures. Technologies 2022, 10, 52. [Google Scholar] [CrossRef]
- Yu-liang, Z.; Wen-jie, Z.; Zhi-gang, S.; Han, F. A model for relationship between true stress and true strain of stable FCC metals. J. Iron Steel Res. 2014, 26, 47–53. [Google Scholar]
- Zhang, P.; Pereira, M.P.; Abeyrathna, B.; Rolfe, B.F.; Wilkosz, D.E.; Hodgson, P.; Weiss, M. Plastic instability and fracture of ultra-thin stainless-steel sheet. Int. J. Solids Struct. 2020, 202, 699–716. [Google Scholar] [CrossRef]
- Saimoto, S.; Diak, B.J.; Kula, A.; Niewczas, M. Assimilated model of work-hardening in FCC metals and its application to devolution of stored work. Mater. Today Commun. 2023, 34, 105115. [Google Scholar] [CrossRef]
- Isakov, M.; May, M.; Hiermaier, S.; Kuokkala, V.-T. A model for the strain rate dependent plasticity of a metastable austenitic stainless steel. Mater. Des. 2016, 106, 258–272. [Google Scholar] [CrossRef]
- Cui, Z.; Weimin, M.; Guohui, Z.; Li, X. Estimation of critical resolved shear stress of single-phase polycrystallites based on crystallographic model. J. Plast. Eng. 2013, 20, 103–107. [Google Scholar]
- Chandra, S.; Samal, M.K.; Chavan, V.M.; Raghunathan, S. Hierarchical multiscale modeling of plasticity in copper: From single crystals to polycrystalline aggregates. Int. J. Plast. 2018, 101, 188–212. [Google Scholar] [CrossRef]
- Lai, X.; Peng, L.; Hu, P.; Lan, S.; Ni, J. Material behavior modelling in micro/meso-scale forming process with considering size/scale effects. Comput. Mater. Sci. 2008, 43, 1003–1009. [Google Scholar] [CrossRef]
Disclaimer/Publisher’s Note: The statements, opinions and data contained in all publications are solely those of the individual author(s) and contributor(s) and not of MDPI and/or the editor(s). MDPI and/or the editor(s) disclaim responsibility for any injury to people or property resulting from any ideas, methods, instructions or products referred to in the content. |
© 2023 by the authors. Licensee MDPI, Basel, Switzerland. This article is an open access article distributed under the terms and conditions of the Creative Commons Attribution (CC BY) license (https://creativecommons.org/licenses/by/4.0/).