Abstract
The continuous casting process (CCP) is the most vital part of steelmaking. The flow pattern near the submerged entry nozzle (SEN) and mould greatly influence the quality of the slab produced. The present investigation was carried out to gain knowledge regarding the meniscus fluctuation under different nozzle port blockage conditions by water model experiments. The experiments were carried out to study the effect of no blockage, 25% blockage, 50% blockage, and 75% blockage of the nozzle port on mould-level fluctuations. The result shows that when the liquid flow rate increases, the wave amplitude increases. In these experiments, the average and maximum meniscus fluctuations were measured while changing different variables such as the water flow rate, gas flow rate, and one-side percentage blockage of the SEN port while the other side was fully open. The observation shows that when the port size decreases, the fluid steel mixed from the obstructing side to the open side results in asymmetry. The average and maximum wave amplitude increases with decreasing submergence depth. It was observed that the maximum height of the standing waves in the mould continued rising on the non-blocked side of the SEN. Blockage increases from 25% to 75%, and with 75% blockage of the right side of the SEN port, the mould-level fluctuation at the left side of the mould was extreme, while that of the right side was relatively quiet.
1. Introduction
The modern steelmaking industry depends on the continuous casting process for the production of steel. The continuous casting process (CCP) is widely used because of its advantages such as high production yield, flexible operation, and ability to obtain high-quality products [1]. In the CCP of steel, blockage of the submerged entry nozzle (SEN) is one of the significant factors to be considered as it leads to defect generation in the slab. The deposition of solid inclusions is the primary cause of SEN clogging [2]. Control of the flow poorly leads to several defects, which include the entrapment of air argon bubbles, mould slag entrainment, surface defects, and breakouts due to level fluctuations [3].
Fluid flow-related difficulties such as an uneven discharge of fluid from different ports of the SEN lead to unsteady and asymmetric flow in the mould. It is essential to know and understand the behaviour of the fluid inside the mould, as it may lead to quality problems such as slag entrainment. A substantial level of fluctuations is directly proportional to more surface defects in the steel product [4]. Gupta et al. [5] conducted a parametric study for investigating flow asymmetries in the mould by varying the mould dimensions, casting speed, nozzle submersion, and nozzle type. Phenomena that affect the fluid flow in the SEN and mould are clogging of the nozzle, growth of shell, dissipation of heat, entrapment of flux, entrapment of argon gas, distribution of flux, freezing of the meniscus, and turbulence in the surface [6]. The injection of argon gas is necessary to prevent re-oxidation and clogging of the nozzle. From the upper surface of the molten steel liquid pool, mould powder melts into liquid flux, which further helps to avoid oxidation [7]. Chen et al. [8] performed a water modeling experiment by taking a self-braking submerged entry nozzle used in steel continuous casting mould. Saldana-salas et al. [9] conducted research on the effects of the depth of immersion of the submerged entry nozzle on the fluid dynamic structure and found that at a depth of immersion in the range of 150 to 200 mm, lower oscillations were obtained. Takei and Bergman [10] studied the clogging of the SEN and concluded that SEN clogging was a complex problem, which leads to interrupted production, and often requires the replacement of the nozzle. Coatings protected nozzle refractory during preheating, and while the surface obtained was smoother, the inclusions did not stick easily. Rajendra et al. [11] investigated improving the length of the casting, advancement, and usage of a submerged entry nozzle that was created for the continuous casting processes. Sukihashi and Li [12] experimented with visualizing the vortex flow patterns inside the mould, and a snake-shaped Plexiglas mould was designed for simulation. Mizobe et al. [13] observed that the nozzle plays an essential role in controlling the flow rate, which reduces inclusions. The result suggested that the optimal nozzle bore profile was obtained for both tundish and SEN to suppress the turbulence with high kinetic energy. The molten steel mainly contains inclusions with different shapes, which usually stick to the nozzle wall and create nozzle clogging [14]. Evans et al. [15] conducted an experiment on the physical and mathematical modeling of metal flow in the continuous casting of steel. The investigations suggested that flows should be controlled with the help of a new design of SEN by using auxiliary devices such as electromagnetic brakes and stirrers. Chaudhary et al. [16] suggested that the parameters that control the transient flow structure include the nozzle type, port shape, port angle, SEN depth, casting speed, argon gas injection, and electromagnetic control. Morales and Ramos [17] experimented on SEN port shape having a 1:1 scale model. To measure the result, particle image velocimetry and video recording techniques were used. Hernandez et al. [18] designed a submerged entry nozzle with an anchor shape, and the results showed that the chance of formation of Karman’s vortexes and powder entrapment becomes smaller for anchor-shaped SENs. Water is used as the modeling fluid because of its availability, and it is easily handled for the investigation of the flow of liquid steel [19]. Most of the researchers have taken water as the fluid representing the molten steel because a water temperature of 20 °C and steel temperature of 1600 °C have mostly equivalent kinematic viscosity [6].
The novelty of the work described in the paper was to find out through physical modeling the influence of nozzle blockage on meniscus fluctuation considering various other operational parameters. The work also gives a comparative idea about the impact of nozzle blockage, considering no blockage, 25% blockage, 50% blockage, and 75% blockage of one side of the port. Based upon the above operational parameters, the average and maximum surface wave amplitudes were investigated for measuring the meniscus level fluctuation. It took 108 experiments to characterize the effect of nozzle blockage on meniscus fluctuation. Table 1 shows the physical property of water and Steel at 20 °C and 1600 °C respectively.

Table 1.
Physical property of water and steel at 20 °C and 1600 °C, respectively [6].
2. Model Selection Criteria
A working model of the real process plant was constructed in the laboratory. The dynamic similarity is a necessary criterion for modeling. To maintain the selection criteria, a balancing of force ratios between the model and the prototype is required. Water modeling of a system can easily be carried out by constructing a model of a smaller scale. This is done by making use of the scale factor, λ. Froude similarity needs to be satisfied whenever wave phenomena and meniscus behaviour are modeled. If Froude similarity is satisfied, the meniscus motion will be dynamically similar to that of the full-scale water model. A full-scale water model requires no velocity scaling because of the dynamic similarity between fluid steel and water, as they share a roughly similar estimation of kinematic viscosity. In the water model experiment, the top surface of the mould is always opened to the atmosphere [16]. The present study is focussed on a slab caster model, the entire setup consisting of an SEN and mould built with 40% scale-down ratios. The velocities were scaled down using the Froude number (Fr) similarity. Every length dimension in the water model was scaled down and represented in terms of Equation (1):
Since the system is assumed to be Froude number-dominated, the velocity in the model and full-scale system are expressed as [15] shown in Equation (2):
On simplifying,
where Vmodel and Vprototype are the velocities at corresponding points in the model and prototype, respectively. Qmodel and Qprototype are the flow rates at corresponding points in the model and prototype, respectively, and D refers to SEN diameter. Dimensionless numbers obtained by considering a plant casting speed of 1.25 m/min is shown in Table 2.
Table 2.
Dimensionless numbers by considering a plant casting speed of 1.25 m/min.
3. Material and Method: Water Model
A 40% scale down water model of a continuous slab caster mould was designed and constructed from 12-mm thick Perspex glass considering Froude number similarity criteria. The mould has a dimension of 1200 mm × 500 mm × 100 mm and was fixed in a metallic frame. A circular tank was placed over the metallic frame, which acted as a reservoir for liquid. A valve was kept at the bottom of the tundish to regulate the liquid flow. A submerged entry nozzle was inserted at the axis of the tundish to discharge water into the Perspex glass mould. SEN often have a well or recess at the bottom of the nozzle below the level of the nozzle outlet ports. For providing the well depth in the submerged entry nozzle, an end cap was fitted in the lower part of the SEN where the end cap is the closing cap, which acts as the well depth. The submergence depth is defined as the distance from the meniscus to the top edge of the port. As the flow was fully turbulent, Reynolds similarity criteria were considered to be less critical. For some of the experiments, air from the compressor was fed by an air hose into the SEN through a tube. Adjusting water and air flow rates with the help of the two flow meters and the steady-state condition are achieved wherein the water levels in both circular tank and mould are maintained at the desired level. The pictorial view of the experimental setup and constructed experimental setup at BIT Mesra Ranchi used to perform the experiments are shown in Figure 1a,b. The geometrical parameters of fluid for the water model of SEN and mould are shown in Table 3 and in Figure 2a,b.

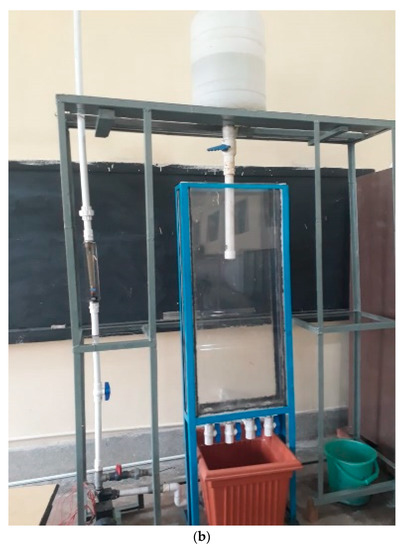
Figure 1.
(a) Pictorial view of the experimental setup. (b) Experimental setup at the Department of Mechanical Engineering, Birla Institute of Technology, Mesra (Ranchi) India.
Table 3.
Geometrical parameters used for the water model. SEN: submerged entry nozzle.
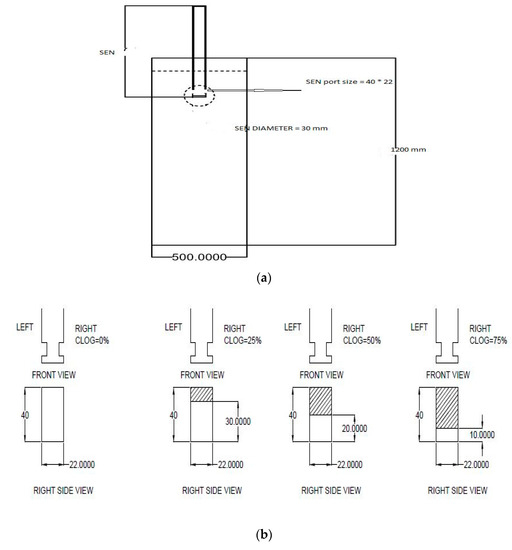
Figure 2.
(a) Geometrical mould and SEN dimension of the experimentation setup. (b) Diagrammatic representation of different port blockages.
In this experiment, the flow rate of liquid and water height in the tundish and mould were retained steady with the help of a valve. The submergence depth considered was 125 and 175 mm, the port angle taken as a parallel port, which is also called the 0° rectangular parallel port. In water modeling, the flow rates of liquid and gas were varied to measure the meniscus level fluctuation. The rotameter used for measuring the flow rates of the liquid has a range of 0–100 L/min. The SEN submergence depth could easily be adjusted by raising or lowering the water level in the mould. In each experiment, it took about 15–20 min to achieve steady-state conditions. Dye was injected into the SEN through a glass tube to make it water-colored. The blue-colored water gave a perfect resolution of the surface waves in the mould. The meniscus fluctuations were recorded by drawing a reference line and nine different points on that reference line by using a digital camera from the front side of the mould. The speed of recording was 25 frames per second. From recording, different photographs were taken out, and by using an image processor (MATLAB, R2012a, Mathworks, Natick, MA. USA), various images of meniscus fluctuation were obtained as shown in Figure 3.
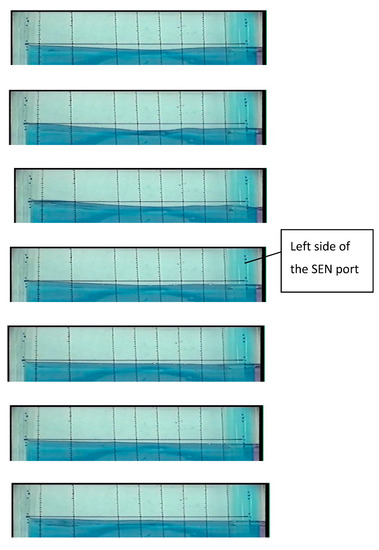
Figure 3.
Images extracted from MATLAB coding.
4. Results and Discussion
Physical modelling was carried out for developing better knowledge of the flow visualization in the mould. At any casting speed, meniscus fluctuation keeps on occurring, and the meniscus profile was not all the time-symmetric on either side of the nozzle [20]. The effect of percentage blockage on one side of the port while another side was fully open on the meniscus fluctuation in the mould were investigated. The average amplitude of meniscus was the sum of displacement of the crest and trough of a standing wave. Flow rates of 40 L/min and 60 L/min (litre per minute) were studied with the left side port fully open and right side port having blockages of 25%, 50%, and 75%, respectively.
4.1. Influence of Nozzle Blockage on Surface Wave Amplitude
Different parameters such as the water flow rate and percentage blockage of the SEN port were studied by considering the left side of the port fully open and the right side having blockages of 25%, 50%, and 75%, respectively at a submergence depth of 125 mm. Figure 4 and Figure 5 show the variation of maximum and average wave amplitude at 40 L/min and 60 L/min, respectively. It was observed from the figure that when the blockage increased from 0% to 75%, the maximum and average wave amplitude increased strongly at the non-blocked side, while the blocked side was relatively quiet. When the flow rate of water increases from 40 L/min to 60 L/min, the maximum and average wave amplitude increased, which results in more turbulence. A higher flow rate leads to a higher surface wave in the mould, which results in higher upward velocities. An increase in momentum of the liquid jet leads to an increase in surface wave amplitude. The average wave amplitude obtained has the same trend as the maximum surface wave, although the average and maximum amplitude values were different. From Figure 4, it was observed that at 40 L/min, the values of maximum wave amplitude increased from 5 to 17 mm with a 75% blockage of SEN. At 60 L/min, the maximum wave amplitude was 10 mm; then, it rose to 30 mm with the blockage of port (non-blocked side) at 75%, whereas the maximum wave amplitude increased to 19 mm on the blocked side of the port. The conclusion from the figure was that with the blockage of the SEN port, chances of the entrapment of mould powder into the liquid steel were very high. The maximum wave amplitude increased nearly four times over with the blockage of ports. Figure 6 and Figure 7 compared the effect of blockage of the SEN on the maximum and average surface wave amplitude at 40 and 60 L/min at a submergence depth of 175 mm. From Figure 6, it was observed that at 40 L/min, the maximum wave amplitude values increased from 3.5 to 15 mm with a 75% blockage of the SEN. At 60 L/min, the maximum wave amplitude was 8 mm; then, it rose to 25 mm with the blockage of port (non-blocked side) at 75%, whereas the maximum wave amplitude increased to 15 mm on the blocked side of the port.
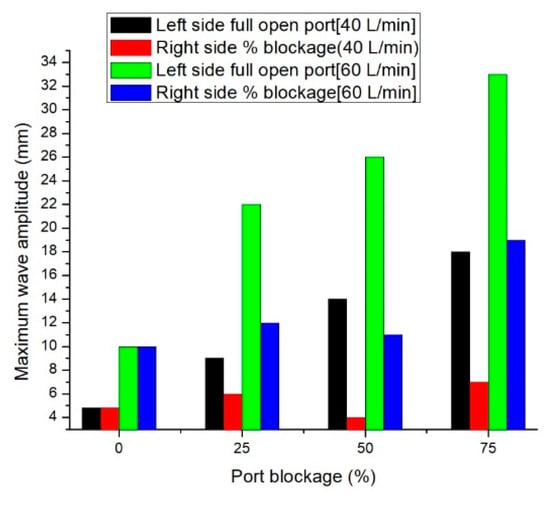
Figure 4.
Comparison of the effect of blockage of SEN (one side only) on the maximum surface amplitude at 40 and 60 L/min water flow rates at a submergence depth of 125 mm.
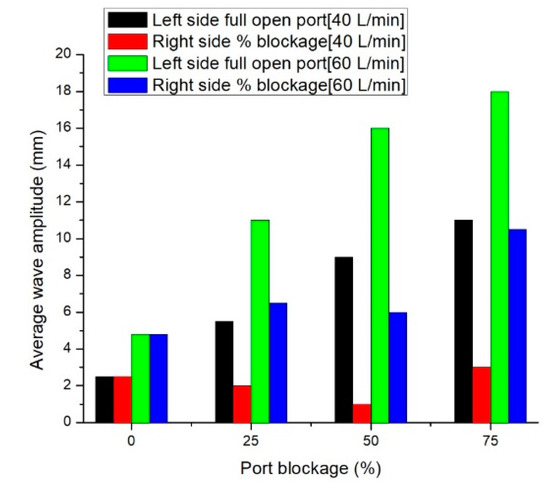
Figure 5.
Comparison of the effect of blockage of SEN (one side only) on the average surface amplitude at 40 and 60 L/min water flow rates at a submergence depth of 125 mm.
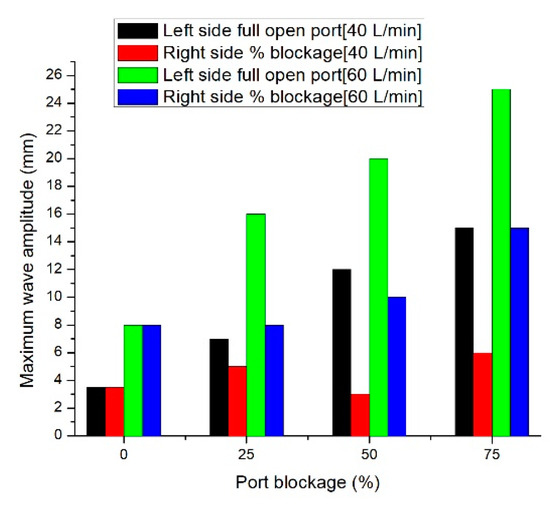
Figure 6.
Comparison of effect of blockage of SEN on the maximum surface wave amplitude at 40 and 60 L/min water flow rates at a submergence depth of 175 mm.
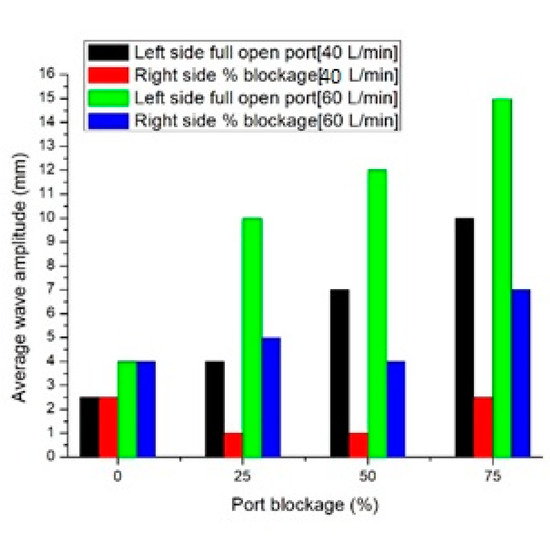
Figure 7.
Comparison of effect of blockage of SEN on the average surface wave amplitude at 40 and 60 L/min at a submergence depth of 175 mm.
4.2. Effect of Port Size
The design of the SEN was crucial to the control and quality of the continuous casting process [21]. Fluid flow through the nozzle and its port depends mainly on the cross-sectional area of the opening. At the clogged side, because of the reduction of the area of the port, the flow rate, turbulence dissipation rate, and average angle of the jet were basically unlike those that originated at the non-clogged side. When clogging takes place, the angles of the jet were different, and the rate of flow was reduced at the non-clogged side. As a result of this phenomenon, the liquid steel always moves from the clogged side to the non-clogged side, which further changed the pattern of flow inside the mould and led to an obvious asymmetry inside the mould. An increase in clogging leads to an increase in the meniscus fluctuations inside the mould. Alam et al. studied the effect of port angle on melt flow. They found that the change in the SEN port angle affects the vertical download velocity and turbulence behavior in the molten steel region [22]. In the present experiment, area reduction occurs at the right-side port of the SEN, and no clogging occurs at the left-side port. Area reduction due to clogging was considered to be 25%, 50%, and 75% of one side of the port. Figure 8, Figure 9, Figure 10 and Figure 11 show the average surface wave profile in the mould for two different water flow rates from SEN with no blockage condition, 25% blockage of the port, 50% blockage of the port, and 75% blockage of the port, respectively. It was observed from the figure that as the port area reduced, the flow rate at the blocked side of the port decreased, whereas the flow rate increased at the non-blocked side. It was also observed that the large-level fluctuations were mostly induced by clogging phenomena. Clogging changed the flow pattern inside the SEN and the jet characteristics exiting near the ports and, hence, it changed the fluid flow pattern in the mould region.
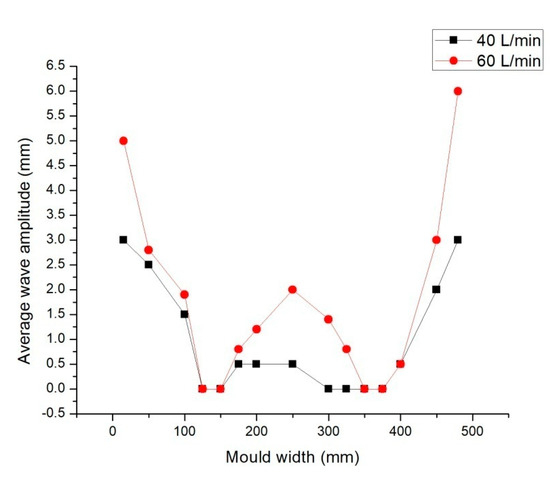
Figure 8.
Average surface wave profile in the mould for two different water flow rates from the SEN with both ports fully open (no blockage condition).
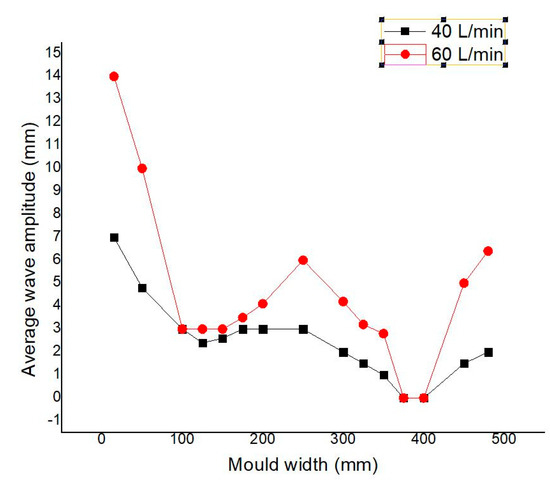
Figure 9.
Average surface wave profiles in the mould for two different water flow rates from the SEN with 25% blockage of one side of the port.

Figure 10.
Average surface wave profiles in the mould for two different water flow rates from the SEN with 50% blockage of one side of the port.
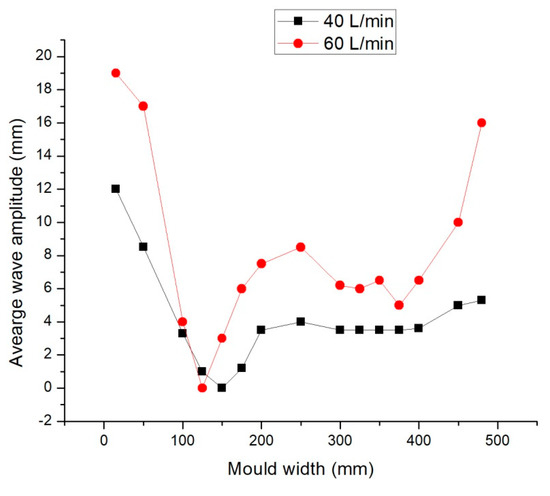
Figure 11.
Average surface wave profiles in the mould for two different water flow rates from the SEN with 75% blockage one side of the port.
Figure 12 and Figure 13 compared the effect of different percentages of blocked SEN at flow rates of 40 L/min and 60 L/min concerning the average wave amplitude. The result suggested that more blockages induce more asymmetrical flow patterns in the mould. It has also been observed that with 75% blockage of the right side of the SEN port, the fluctuation at the non-blocked side of the mould was extreme, while the right side was relatively quiet.
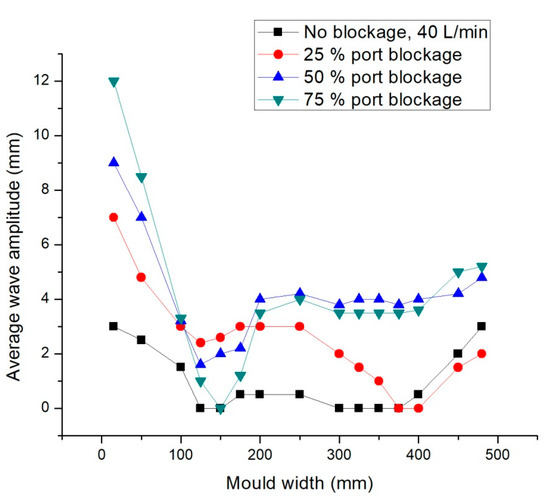
Figure 12.
Average wave profile in the mould at 40 L/min from the SEN at no blockage, 25% blockage, 50% blockage, and 75% blockage of the port, respectively.
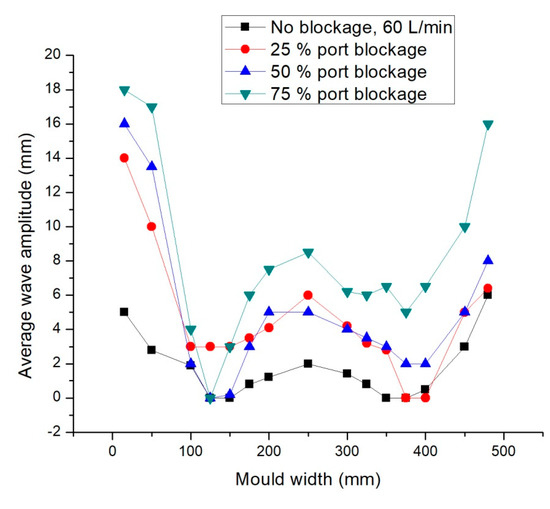
Figure 13.
Average wave profile in the mould at 60 L/min from the SEN at no blockage, 25% blockage, 50% blockage, and 75% blockage of the port, respectively.
4.3. Effect of Air Flow Rate
Experiments were carried out with the injection of air into the flowing water. It was observed that the flow pattern in the SEN was mostly dominated by the air flow rate, liquid flow rate, and nozzle port size. At 40 L/min water and 1 L/min gas, with 25% blockage, the average meniscus fluctuation obtained was 7 mm (non-blocked side) and 2 mm at the blocked side. At 75% blockage, the average meniscus fluctuations obtained were 11 mm (non-blocked side) and 4 mm (blocked side). At 40 L/min water and 4 L/min gas, with 25% blockage, the average meniscus fluctuations obtained were 9 mm (non-blocked side) and 1 mm (blocked side). At 75% blockage, the average meniscus fluctuations obtained were 9.5 mm (non-blocked side) and 4.5 mm (blocked side). Hence, it was observed that the meniscus height in the nozzle was stable enough to measure, and by increasing the air flow rate from 1 to 4 L/min at a constant liquid flow rate of 40 L/min, the average and maximum meniscus fluctuation decreased, as shown in Figure 14 and Figure 15.
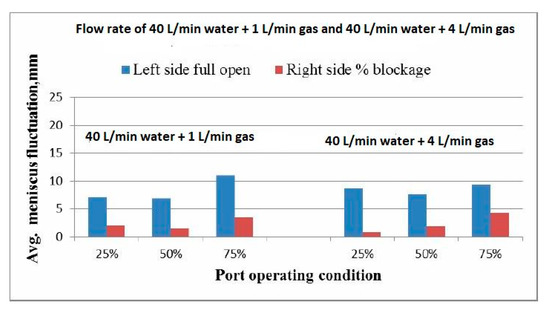
Figure 14.
Average meniscus fluctuations at air injection with an immersion depth of 125 mm.
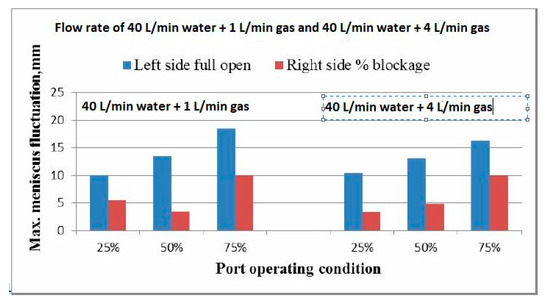
Figure 15.
Maximum meniscus fluctuations at air injection with an immersion depth of 125 mm.
Air from the compressor was fed by an air hose into the SEN through a tube. Adjusting the water and air flow rates with the help of the two flow meters and the steady-state condition are achieved wherein the water levels in both the circular tank and mould are maintained at the desired level.
Liu et al. [23] investigated the bubbles size distribution in continuous casting by using both water and numerical models. According to their findings, the increase in gas flow rate would lead to a rise in the mean diameter of the bubbles. As a result of the larger buoyancy, larger bubbles float up to the meniscus soon after their emergence from the SEN ports, thus reducing the horizontal dispersion of the bubbles. The submergence depths considered for the variation of average and maximum wave amplitude for two different flow rates and parallel port angles were 125 mm and 175 mm. The maximum wave amplitude increase with decreasing submergence depths were from 175 to 125 mm. Near the SEN, the level of water rises and suddenly decreases because the flow of water is directed downwards [24]. Figure 16 shows the relationship between wave amplitude and submergence depth. As the depth of immersion of the SEN decreases, the size of the upper re-circulating zone decreases, which leads to an increase in turbulence at the liquid steel surface. At low submergence, fluid reaches the meniscus with higher momentum, resulting in higher wave amplitude–fluid near to the meniscus flow towards the SEN [24]. Hence, it was observed that at a submergence depth of 125 mm and water flow rate of 40 L/min, the maximum wave amplitude obtained was 8 mm, which was almost equal to water flow rate of 60 L/min at a submergence depth of 175 mm.
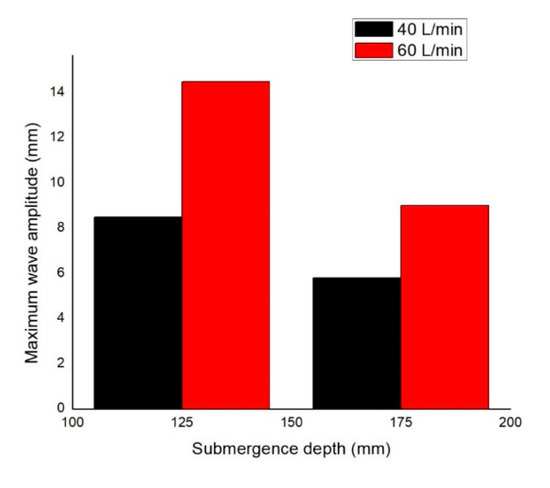
Figure 16.
Effect of submergence depth on the maximum wave amplitude with water flow rates of 40 L/min and 60 L/min, respectively.
5. Conclusions
In the present study, water model experiments were carried out in a model with a scale-down ratio of 0.4. The present research show how nozzle blockage affects meniscus fluctuation and thus provides useful background information for the steel maker. Based on the experimental data and above analysis, the following conclusions had been made:
- The water modelling experiment showed that meniscus fluctuation was a problem at high casting speeds. Parameters such as the SEN port area, liquid flow rate, air flow rate, and submergence depth have an essential effect on the average and maximum meniscus fluctuation. These parameters were studied to measure the meniscus fluctuation in the water modeling experiment.
- When the port size decreases, the liquid steel flow moved preferentially from the clogging side to the normal side, which results in an asymmetry in the mould. The blockage of SEN to any extent on one side of the port increases the liquid flow from the other side of the port, resulting in very high meniscus fluctuation.
- The average and maximum wave amplitude increases with decreasing submergence depth. As the depth of immersion of SEN decreases, the size of the upper re-circulating zone decreases, which leads to an increase in turbulence at the liquid steel surface.
- The results showed that the fluid flow behavior pattern in the SEN is dominated by the air flow rate, liquid flow rate, and nozzle port size. The air bubble size increases with the increasing air flow rate at a constant liquid flow rate. At low submergence, fluid reaches the meniscus with higher momentum, which results in a higher wave amplitude.
- The results suggested that upon having SEN blockage, the entrapment of mould powder into the liquid steel would be high and the maximum wave amplitude increased almost four times over with the blockage of SEN.
- With the blockage of the right side of the port, the cross-sectional area of the port reduces, resulting in an increase in jet velocity, which has resulted in a small increase in amplitude with the blockage of the port.
Author Contributions
Conceptualization, M.K. and P.M.; methodology, M.K.; software, M.K.; validation, M.K., P.M., and A.K.R.; formal analysis, M.K.; investigation, M.K., P.M.; resources, M.K.; data curation, M.K., P.M.; writing—original draft preparation, M.K.; writing—review and editing, M.K., P.M., and A.K.R.; visualization, M.K.; supervision, P.M. and A.K.R. All authors have read and agreed to the published version of the manuscript.
Funding
This research received no external funding.
Acknowledgments
The experimental work was supported by the Department of Mechanical Engineering, Birla Institute of Technology, Mesra (Ranchi), India.
Conflicts of Interest
The authors declare no conflict of interest.
References
- Real-Ramirez, C.A.; Miranda-Tello, R.; Hoyos-Reyes, L.; Reyes, M.; Gonzalez-Trejo, J.I. Numerical evaluation of a submerged entry nozzle for continuous casting of steel. IJEMS 2012, 19, 179–188. [Google Scholar]
- Thomas, B.G.; Bai, H. Tundish nozzle clogging-application of computational models. In Steelmaking Conference Proceedings; Iron and Steel Society: Warrendale, PA, USA, 2001; Volume 84, pp. 895–912. [Google Scholar]
- Li, C.; Thomas, B.G. Thermo mechanical finite-element model of shell behavior in continuous casting of steel. Metall. Mater. Trans. B 2004, 35, 1151–1172. [Google Scholar] [CrossRef]
- Jin, X.; Chen, D.F.; Zhang, D.J.; Xie, X.; Bai, Y.Y. Water model study on fluid flow in slab continuous casting mould with solidified shell. Iron Mak. Steelmak. 2011, 38, 155–159. [Google Scholar] [CrossRef]
- Gupta, D.; Chakra borty, S. Asymmetry and oscillation of the fluid flow pattern in a continuous casting mould: A water model study. ISIJ Int. 1997, 37, 654–658. [Google Scholar] [CrossRef]
- Mishra, P.; Ajmani, S.; Kumar, A.; Shrivastava, K. Numerical modelling of Sen and mould for continuous slab casting. Int. J. Eng. Sci. Technol. 2012, 4, 2234–2242. [Google Scholar]
- Liu, R.; Thomas, B.G.; Sengupta, J. Simulation of transient fluid flow in mold region during steel continuous casting. In IOP Conference Series: Materials Science and Engineering; IOP Publishing: Bristol, UK, 2012; Volume 33, p. 012015. [Google Scholar]
- Chen, Y.; Zhang, L.; Yang, S.; Li, J. Water modeling of self-braking submerged entry nozzle used for steel continuous casting mold. JOM 2012, 64, 1080–1086. [Google Scholar] [CrossRef]
- Saldaña-Salas, F.; Torres-Alonso, E.; Ramos-Banderas, J.A.; Solorio-Díaz, G.; Hernández-Bocanegra, C.A. Analysis of the Depth of Immersion of the Submerged Entry Nozzle on the Oscillations of the Meniscus in a Continuous Casting Mold. Metals 2019, 9, 596. [Google Scholar] [CrossRef]
- Takei, K.; Lindén Bergman, F. Clogging Prevention in Submerged Entry Nozzles Focusing on CaTiO3 as a Coating Material. Bachelor Thesis, Royal Institute of Technology, Stockholm, Sweden, 2012. [Google Scholar]
- Kadli, R.; Kumar, A.S.; Mgr, S.; Engr, A.; Steels, J. Development and implementation of nozzle clogging index at continuous caster to improve length of casting. Int. J. Recent Dev. Eng. Technol. 2016, 5, 10–14. [Google Scholar]
- Li, B.; Tsukihashi, F. Vortexing flow patterns in a water model of slab continuous casting mold. ISIJ Int. 2005, 45, 30–36. [Google Scholar] [CrossRef]
- Mizobe, A.; Kurisu, J.; Ueki, M. Computer analysis of molten steel flow and application to design of nozzles for continuous casting system. Appl. Theory Comput. Technol. 2018, 2, 36–64. [Google Scholar] [CrossRef]
- Mohammadi-Ghaleni, M.; Zaeem, M.A.; Smith, J.D.; O’Malley, R. Computational fluid dynamics study of molten steel flow patterns and particle–wall interactions inside a slide-gate nozzle by a hybrid turbulent model. Metall. Mater. Trans. B 2016, 47, 3056–3065. [Google Scholar] [CrossRef]
- Evans, J.W.; Xu, D.; Jones, W.K. Physical and mathematical modeling of metal flow in the continuous casting of Steel and Aluminum. Met. Mater. 1998, 4, 1111–1118. [Google Scholar] [CrossRef]
- Chaudhary, R.; Rietow, B.T.; Thomas, B.G. Differences between physical water models and steel continuous casters: A theoretical evaluation. In Inclusions and Clean Steels, Materials Science and Technology Conference; AIST/TMS: Pittsburgh, PA, USA, 2009; pp. 1090–1101. [Google Scholar]
- Calderón-Ramos, I.; Morales, R.D. The role of submerged entry nozzle port shape on fluid flow turbulence in a slab mold. Metall. Mater. Trans. B 2015, 46, 1314–1325. [Google Scholar] [CrossRef]
- Hernandez, C.A.; Barron, M.A.; Miranda, R. Anchor-Shaped Design of a Submerged Entry Nozzle for the Continuous Casting of Steel. Open J. Appl. Sci. 2016, 6, 593. [Google Scholar] [CrossRef][Green Version]
- Mishra, P.; Ajmani, S.K.; Kumar, A.; Shrivastava, K.K. Experimental Investigation of Sen and Mould for continuous slab caster by Physical modelling. Int. J. Eng. Sci. Technol. 2012, 4. [Google Scholar]
- Gupta, D.; Lahiri, A.K. Water-modeling study of the surface disturbances in continuous slab caster. Metall. Mater. Trans. B 1994, 25, 227–233. [Google Scholar] [CrossRef]
- Najjar, F.M.; Thomas, B.G.; Hershey, D.E. Numerical study of steady turbulent flow through bifurcated nozzles in continuous casting. Metall. Mater. Trans. B 1995, 26, 749–765. [Google Scholar] [CrossRef]
- Siddiqui, M.I.H. Effect of port angle of Sen on melt flow in a mold. Int. Robot. Autom. J. 2018, 4, 1–3. [Google Scholar] [CrossRef][Green Version]
- Liu, Z.; Li, L.; Qi, F.; Li, B.; Jiang, M.; Tsukihashi, F. Population balance modeling of polydispersed bubbly flow in continuous-casting using multiple-size-group approach. Metall. Mater. Trans. B 2015, 46, 406–420. [Google Scholar] [CrossRef]
- Miranda, R.; Barron, M.A.; Barreto, J.; HOYOS, L.; Gonzalez, J. Experimental and numerical analysis of the free surface in a water model of a slab continuous casting mold. ISIJ Int. 2005, 45, 1626–1635. [Google Scholar] [CrossRef]
© 2020 by the authors. Licensee MDPI, Basel, Switzerland. This article is an open access article distributed under the terms and conditions of the Creative Commons Attribution (CC BY) license (http://creativecommons.org/licenses/by/4.0/).