Abstract
The cold spray deposition technique has been used to produce a new class of solid lubricant coatings using powder feedstocks of the metal disulfides WS2 or MoS2, either pure or mixed with Cu and Ni metal powders. Friction and cycle lives were obtained using ball-on-flat reciprocating tribometry of coated 304 SS flats in dry nitrogen and vacuum at higher Hertzian contact stresses (Smax = 1386 MPa (201 ksi)). The measured friction and thickness of the coatings were much lower than for previous studies (COF = 0.03 ± 0.01 and ≤1 µm, respectively), which is due to their high metal disulfide:metal ratios. Cu-containing metal sulfide coatings exhibited somewhat higher cycle lifetimes than the pure metal sulfide coatings, even though the Cu content was only ~1 wt%. Profiling of wear tracks for coatings tested to 3000 cycles (i.e., pre-failure) yielded specific wear rates in the range 3–7 × 10⁻⁶ mm3N−1m−1, similar to other solid lubricant coatings. When compared to other coating techniques, the cold spray method represents a niche that has heretofore been vacant. In particular, it will be useful in many precision ball-bearing applications that require higher throughput and lower costs than sputter-deposited MoS2-based coatings.
1. Introduction
Solid lubricant coatings used on spacecraft are available in a number of different formulations and are produced by methods including mixing with organic and inorganic binders, air impingement, and sputter deposition [1]. There is no panacea: each type of coating has strengths and weaknesses, among attributes such as coefficient of friction (COF), endurance, adhesion, thickness, load-carrying capability, type of coated device, and cost. For example, both sputter-deposited and air-impinged MoS2-based coatings exhibit very low friction and are thin enough to be used in tolerance-sensitive ball-bearing applications, but sputter-deposited coatings are somewhat expensive, while air-impinged coatings have much lower endurance. Bonded MoS2 coatings exhibit low friction and significant endurance, but the thickness may be too high and load-carrying capability too low for many applications.
Cold spray is a newer technique among thermal spray coatings that is often used for depositing relatively thick, dense metal coatings [2]. It can be performed rapidly, inexpensively, with relatively little surface preparation, and can even be carried out in the field using portable units. Unlike other flame and plasma spray coatings, cold spray uses lower temperatures (typically 0–1100 °C), higher impingement speeds (typically 300–1200 m/s), and inert gases, such as nitrogen and helium, as propellant gases. These attributes protect substrate properties and enable better control over the coating composition because the temperatures are generally below the particles’ melting temperatures [3]. However, methods to improve the tribological (friction and wear) properties of these coatings are in their infancy. Cold spray may be especially attractive for solid lubricants, such as MoS2, since they can decompose at elevated temperatures and in oxidizing environments.
Several groups have investigated the deposition of solid lubricating coatings via cold spray [4,5,6,7,8,9,10]. Metal/solid lubricant composite coatings based on Cu/MoS2 exhibited optimum tribological performance for low MoS2 contents (i.e., ≤5 wt% in the initial powder feedstock) [4,7,8,9]. In studies by Zhang et al., 5 wt% MoS2 in the initial powder mixture resulted in 1–3 wt% in the coating [7]. A separate study by Zhang using separate feeders for Cu and MoS2 resulted in similar MoS2 contents in the coating [9]. Resultant ball-on-flat tribological testing of Cu/MoS2 in dry air showed a COF of 0.14, a considerable drop from that for pure Cu (i.e., 0.7) [7]. Testing of Cu/MoS2 in nitrogen (N2) showed a COF of 0.38, and Cu/MoS2-WC showed a COF of 0.27, compared to 0.5 for pure Cu [9].
More recently, a study was conducted by Dey et al. on cold spray deposition of Inconel/WS2 coatings, augmented by a laser-assisted process [11]. Nominal WS2 content (in the initial powder mixture) was 15 wt%. Ball-on-flat tribological testing of the coatings showed a COF of 0.11, considerably lower than that for Inconel (i.e., 0.51).
In the present study, we studied metal/solid lubricant composite coatings produced by cold spray based on either Cu or Ni mixed with MoS2 or WS2. Pure MoS2 or WS2 coatings were also studied. In contrast to earlier studies, our coatings exhibited much lower COF values of 0.03 ± 0.01. They were also much thinner than previous coatings (≤1 µm compared to >100 µm), which is optimum for precision spacecraft applications, such as ball bearings. Differences in friction and the coating thickness were due in part to high solid lubricant contents (>95 wt% measured in our optimized coatings, compared to ≤5 wt% in the previously studied coatings).
2. Materials and Methods
Most substrates used for coatings were made of polished 304 stainless steel because of the importance of this and similar steels in space mechanisms; other materials were briefly explored, including Al6061, Ti6Al4V, and other stainless steels. All 304 SS substrates used for the final grade coatings were polished to a finish of Ra = 20 µm. Substrates were tested with and without 5-micron alumina grit blasting and were ultrasonically cleaned in acetone prior to coating. Cold spray coatings for pathfinding measurements were obtained from ASB Industries using their Impact Innovations Cold Gas Spray System. Later coatings were produced at Applied Tungstenite using Kinetic Metallization (KM) cold spray equipment purchased from Inovati. The KM equipment was fitted with a particle fluidizer that uses a rotating brush to sweep feedstock powder through holes in a sieve plate, breaking up agglomerated particles and controlling the powder feed rate into the carrier gas [12]. This promoted coating uniformity and minimized sample-to-sample variation. Optimum feed rates were generally low, in the 20–30% range (100% refers to the highest feed rate speed and does not correlate with actual mass feed rates). Optimum carrier gas temperatures were in the range 315–425 °C. Particle impact velocities were in the range 400–500 m/s.
Several types and sizes of powder particle sizes were used. The Cu particle size range was +11/−38 µm and WS2 average particle size was 5 µm. The Cu particle size ranges evaluated were +0.93/−2.81 µm and +11/−38 µm, with an average diameter of 100 nm. Ni particle sizes were +11/−45 µm, with average diameters of 1 and 5 µm. Average particle widths of WS2 were 100 nm and 24 µm. The average particle width of MoS2 was 15 µm. Purities of all powders were ≥99.5%.
Several hundred samples were produced over the course of this project, the majority of which were evaluated tribometrically. Friction measurements were primarily obtained with an Anton Paar TRB3 ball-on-flat tribometer, fitted for conducting reciprocating linear measurements. Testing was conducted as per ASTM G133, with minor differences. The 100Cr6 6 mm-diameter steel balls were used as the counter-faces and were cleaned using IPA prior to testing. They were held stationary and loaded using either a 2N or 10N dead weight load onto a metal flat, onto which a cold spray coating was deposited. The nominal maximum Hertzian contact stress (Smax) varied based on the coating substrate material. For a 100Cr6 ball and 304 SS flat material, Smax was 811 MPa (118 ksi) and 1386 MPa (201 ksi), for 2N and 10N loads, respectively. The track length was 10 mm, and the sliding speed was 5.65 cm/s. Each data point shown in friction scans was averaged from a forward and reverse scan in the middle 6 mm of the track to avoid track edge effects. The failure criterion was COF > 0.5.
Tests using the TRB3 were conducted in flowing dry nitrogen (N2) to remove moisture and oxygen from the testing environment. This approach is often used to model the spacecraft environment, since humidity has a major effect on the performance of MoS2 and WS2 solid lubricants. There are small differences seen in the behavior of these materials between dry N2 and vacuum environments, but this approach is often used because of the difficulty of testing in a vacuum. The tribometer enclosure was purged with N2 until the humidity was measured as 0 ± 2% RH. Even if the actual value was at the top of this uncertainty range, i.e., 2% RH, negligeable effects would be expected: a study of sputtered MoS2 coatings showed that there was no detectable difference in coating endurance over the humidity range of 0.02 to 2.0% RH (higher humidities did result in lower endurance) [13].
Additional ball-on-flat tribometer measurements were obtained at the Aerospace Corporation using an RTEC MVT-2 Vacuum Tribometer operating in the linear reciprocating mode at a vacuum level of 0.047 Pa (3.5 × 10⁻⁴ Torr). Other conditions were set to be close to those for the previous 10N normal load testing on the TRB3 tribometer, achieving a match to the 201 ksi Smax value within 0.5%. The sliding speed was 3 cm/s.
Cross-sections of some of the coatings were obtained using focused ion beam (FIB) techniques at the Aerospace Corporation. The resultant cross-sections could then be analyzed using scanning electron microscopy equipped with energy-dispersive X-ray analysis (SEM/EDX). These provided the thickness, morphology, and composition of the coatings.
X-ray photoelectron spectroscopy (XPS) of some of the coatings was conducted using a Physical Electronics Versaprobe II instrument. Spectral binding energies were calibrated by assigning the adventitious carbon C 1s peak to a binding energy of 284.8 eV.
An EDAX Ametek Orbis PC Micro-XRF X-ray Fluorescence (XRF) Spectrometry instrument was used in conjunction with SEM/EDX measurements to better quantify the coating composition.
To evaluate average wear rates, some coatings were tested using the TRB3, stopping after 3000 cycles (i.e., prior to failure). Estimates of wear depths and volumes were obtained using a Zygo Zegage Plus configured for White Light Interferometry (WLI) imaging, an optical profilometry technique that enables development of a 3D image of a sample surface (conducted at Covalent Metrology). It has a lateral resolution of 2.5 µm and vertical resolution of ~1 nm. The instrument also enabled measurement of the surface roughness of the as-deposited coatings.
Optical images of some of the balls after 3000-cycle testing were obtained using a Dino-Lite Digital Microscope (Model AM7915MZTL).
3. Results
3.1. Tribology
Pathfinding cold spray coatings were grown at ASB Industries. Other early coatings were produced using KM equipment at Applied Tungstenite. With the goal of reproducing results by other researchers, composite coatings with high metal:sulfide ratios in the powder feedstock were studied during this early period. However, XRF showed that the coatings exhibited lower metal:sulfide ratios than those obtained in previous studies [4,7,8,9]. For example, Cu/WS2 coatings nominally containing 8 wt% WS2 grown at ASB, and coatings grown with nominally 5 wt% WS2 using KM equipment, were shown to contain actual Cu contents of 37 and 23 wt%, respectively (compared to, for example, results from [7], which showed that Cu/MoS2 samples with nominally 5 wt% MoS2 were measured to contain 1–3 wt% MoS2). Note that for clarity, the coatings in this study were identified by their nominal composition; that is, the composition of the powder mixture as it was added to the powder feeder. Measurements by XRF were also conducted of the actual composition of some of the coatings, and these will be discussed periodically in the text.
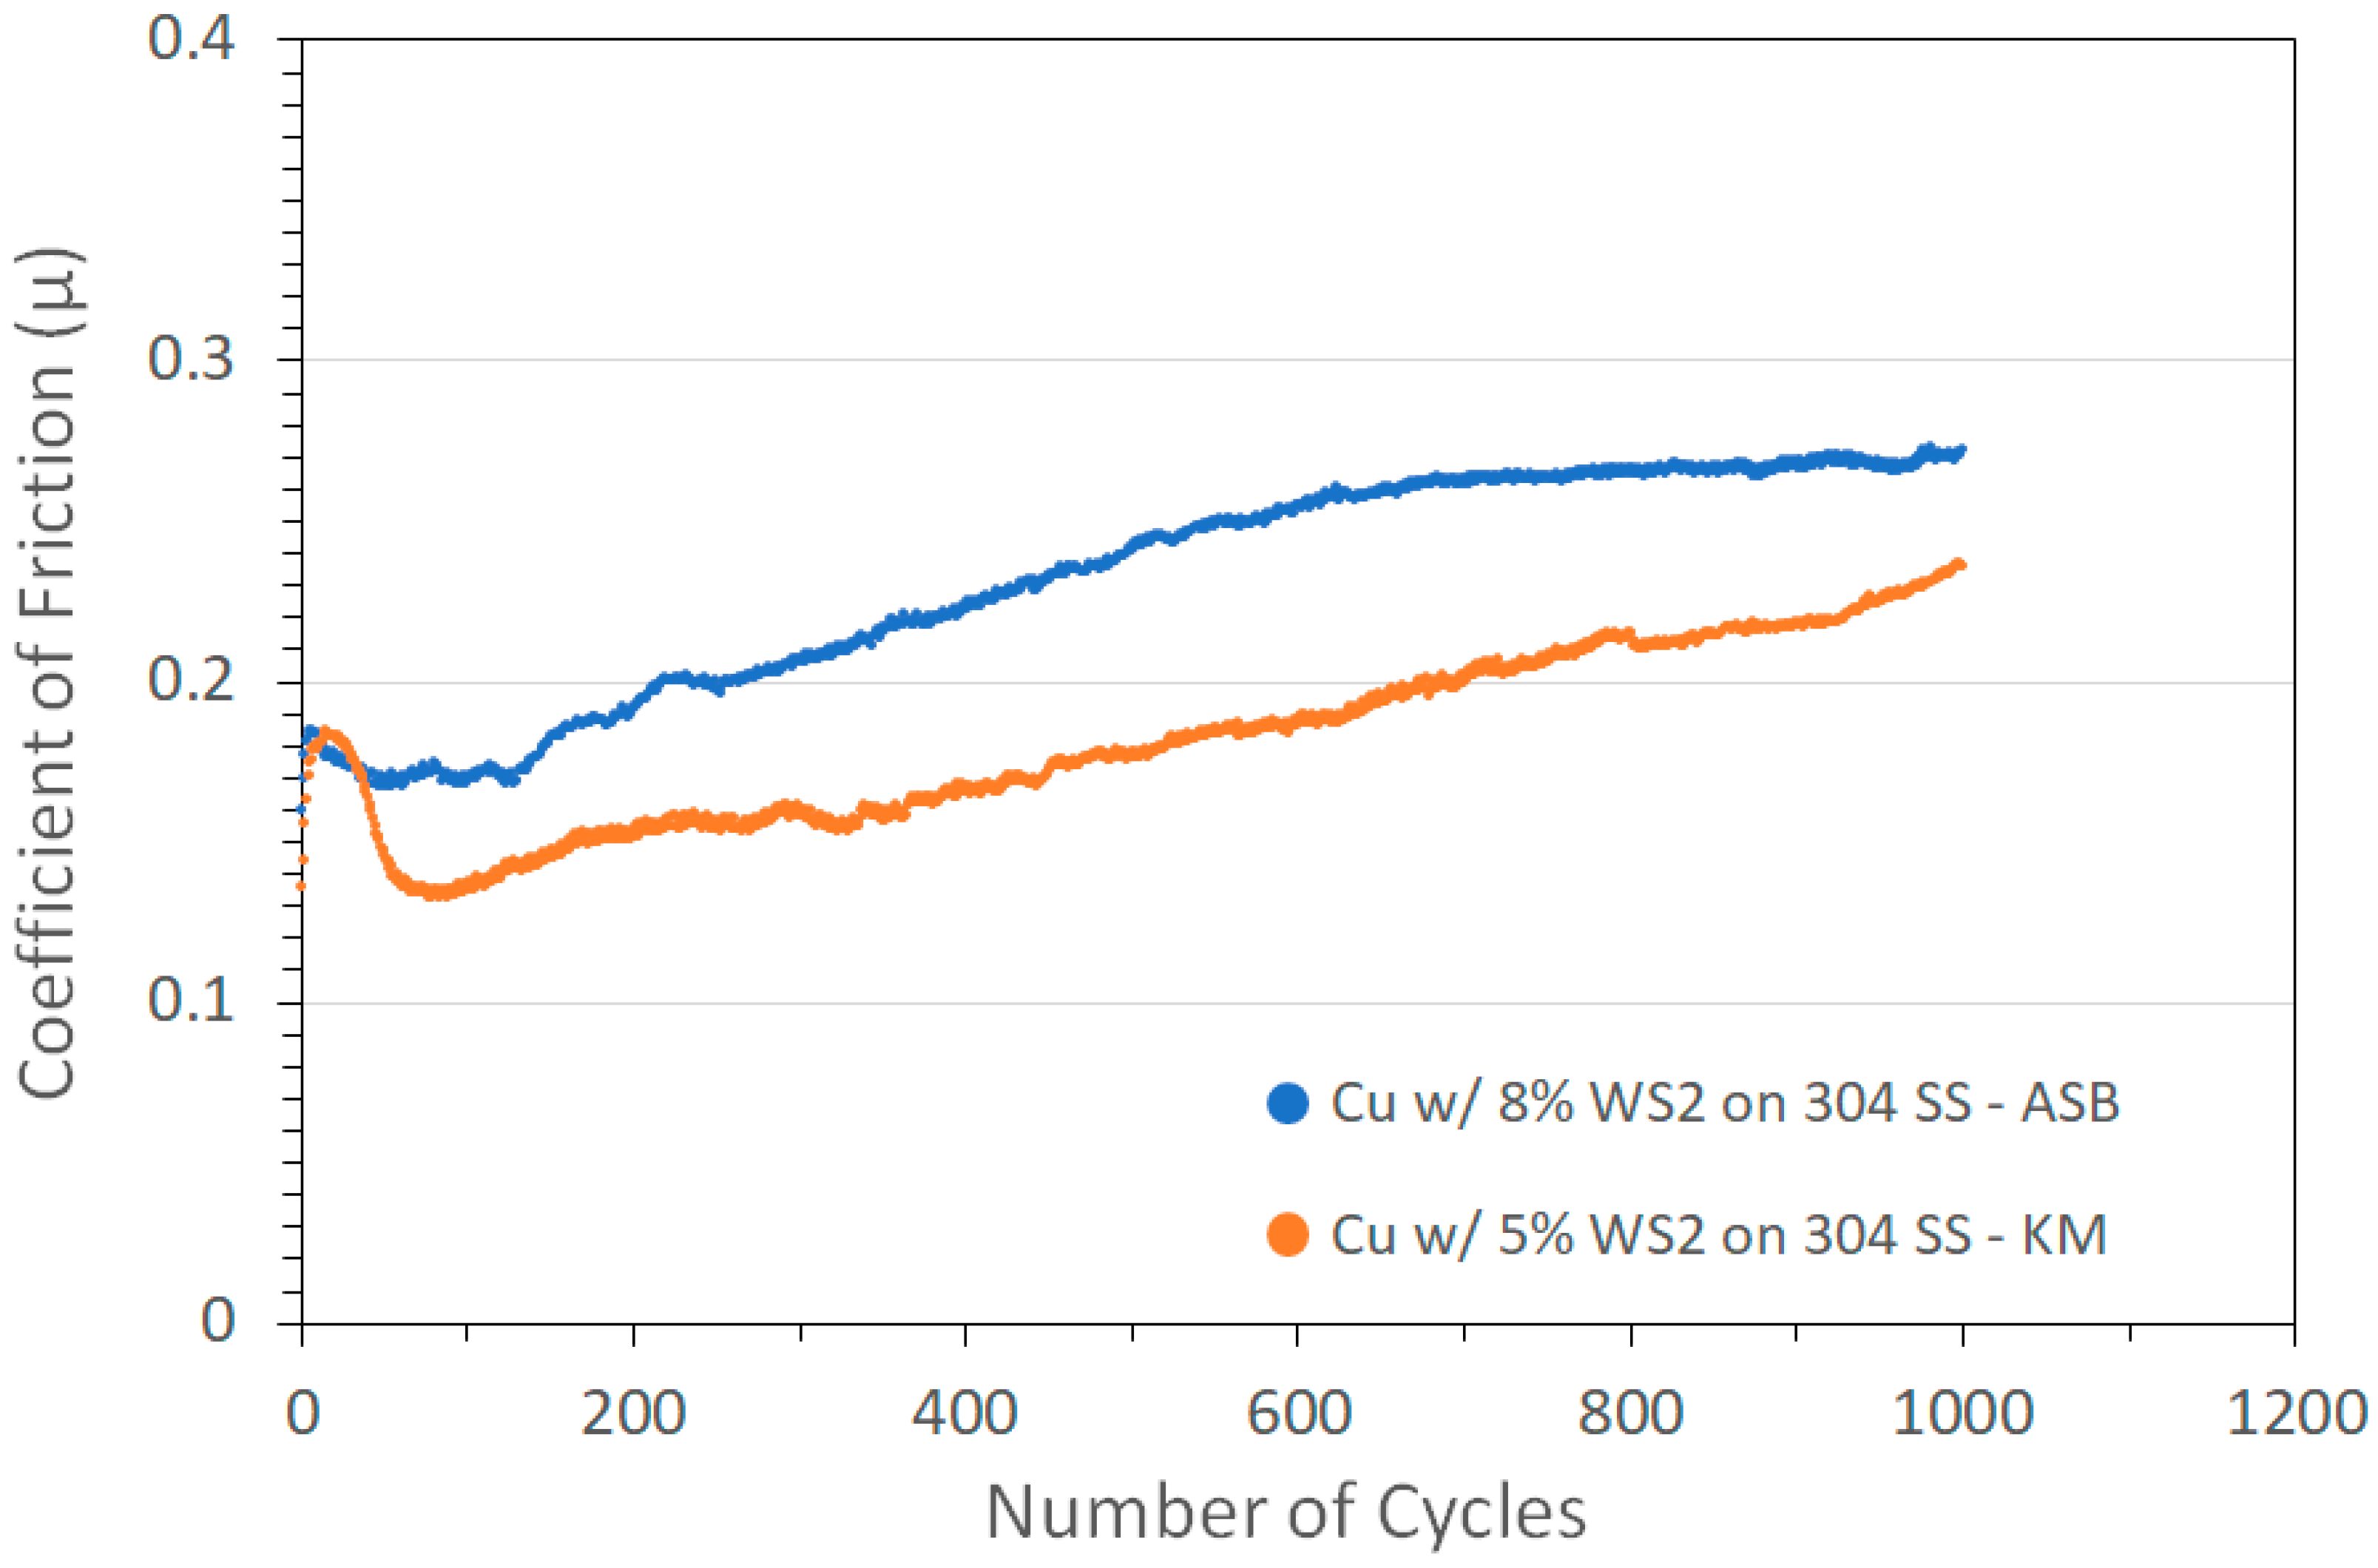
Ball-on-flat tribometry results for two such coatings deposited on 304 SS are shown in Figure 1 (obtained using a 2N normal load and a N2 atmosphere). The coatings showed significant friction reduction of COF~0.15–0.25, compared to that obtained for a pure cold spray Cu coating of 0.6. In addition, the coatings lasted until the end of the 1000-cycle test without failure. The performance was similar to that of previously studied Cu/MoS2 coatings that showed a COF of 0.14 for a test with the same cycle length [7]. This similarity is in spite of the differences in sulfide contents (63 and 77 wt% WS2 compared with 1–3 wt% MoS2).

Figure 1.
Tribometry results from the 1000-cycle tests using a 2N load on Cu/WS2 cold spray coatings on 304 SS substrates. Testing was conducted in dry N2. Shown are coatings produced on ASB equipment (blue; nominally 8 wt% WS2) and Applied Tungstenite equipment (orange; nominally 5 wt% WS2). Cu particle size range was +11/−38 µm and WS2 average particle size was 5 µm. X-ray fluorescence spectrometry (XRF) measurements of the KM coatings showed the actual WS2 contents were 63 and 77 wt% for the ASB and KM coatings, respectively.
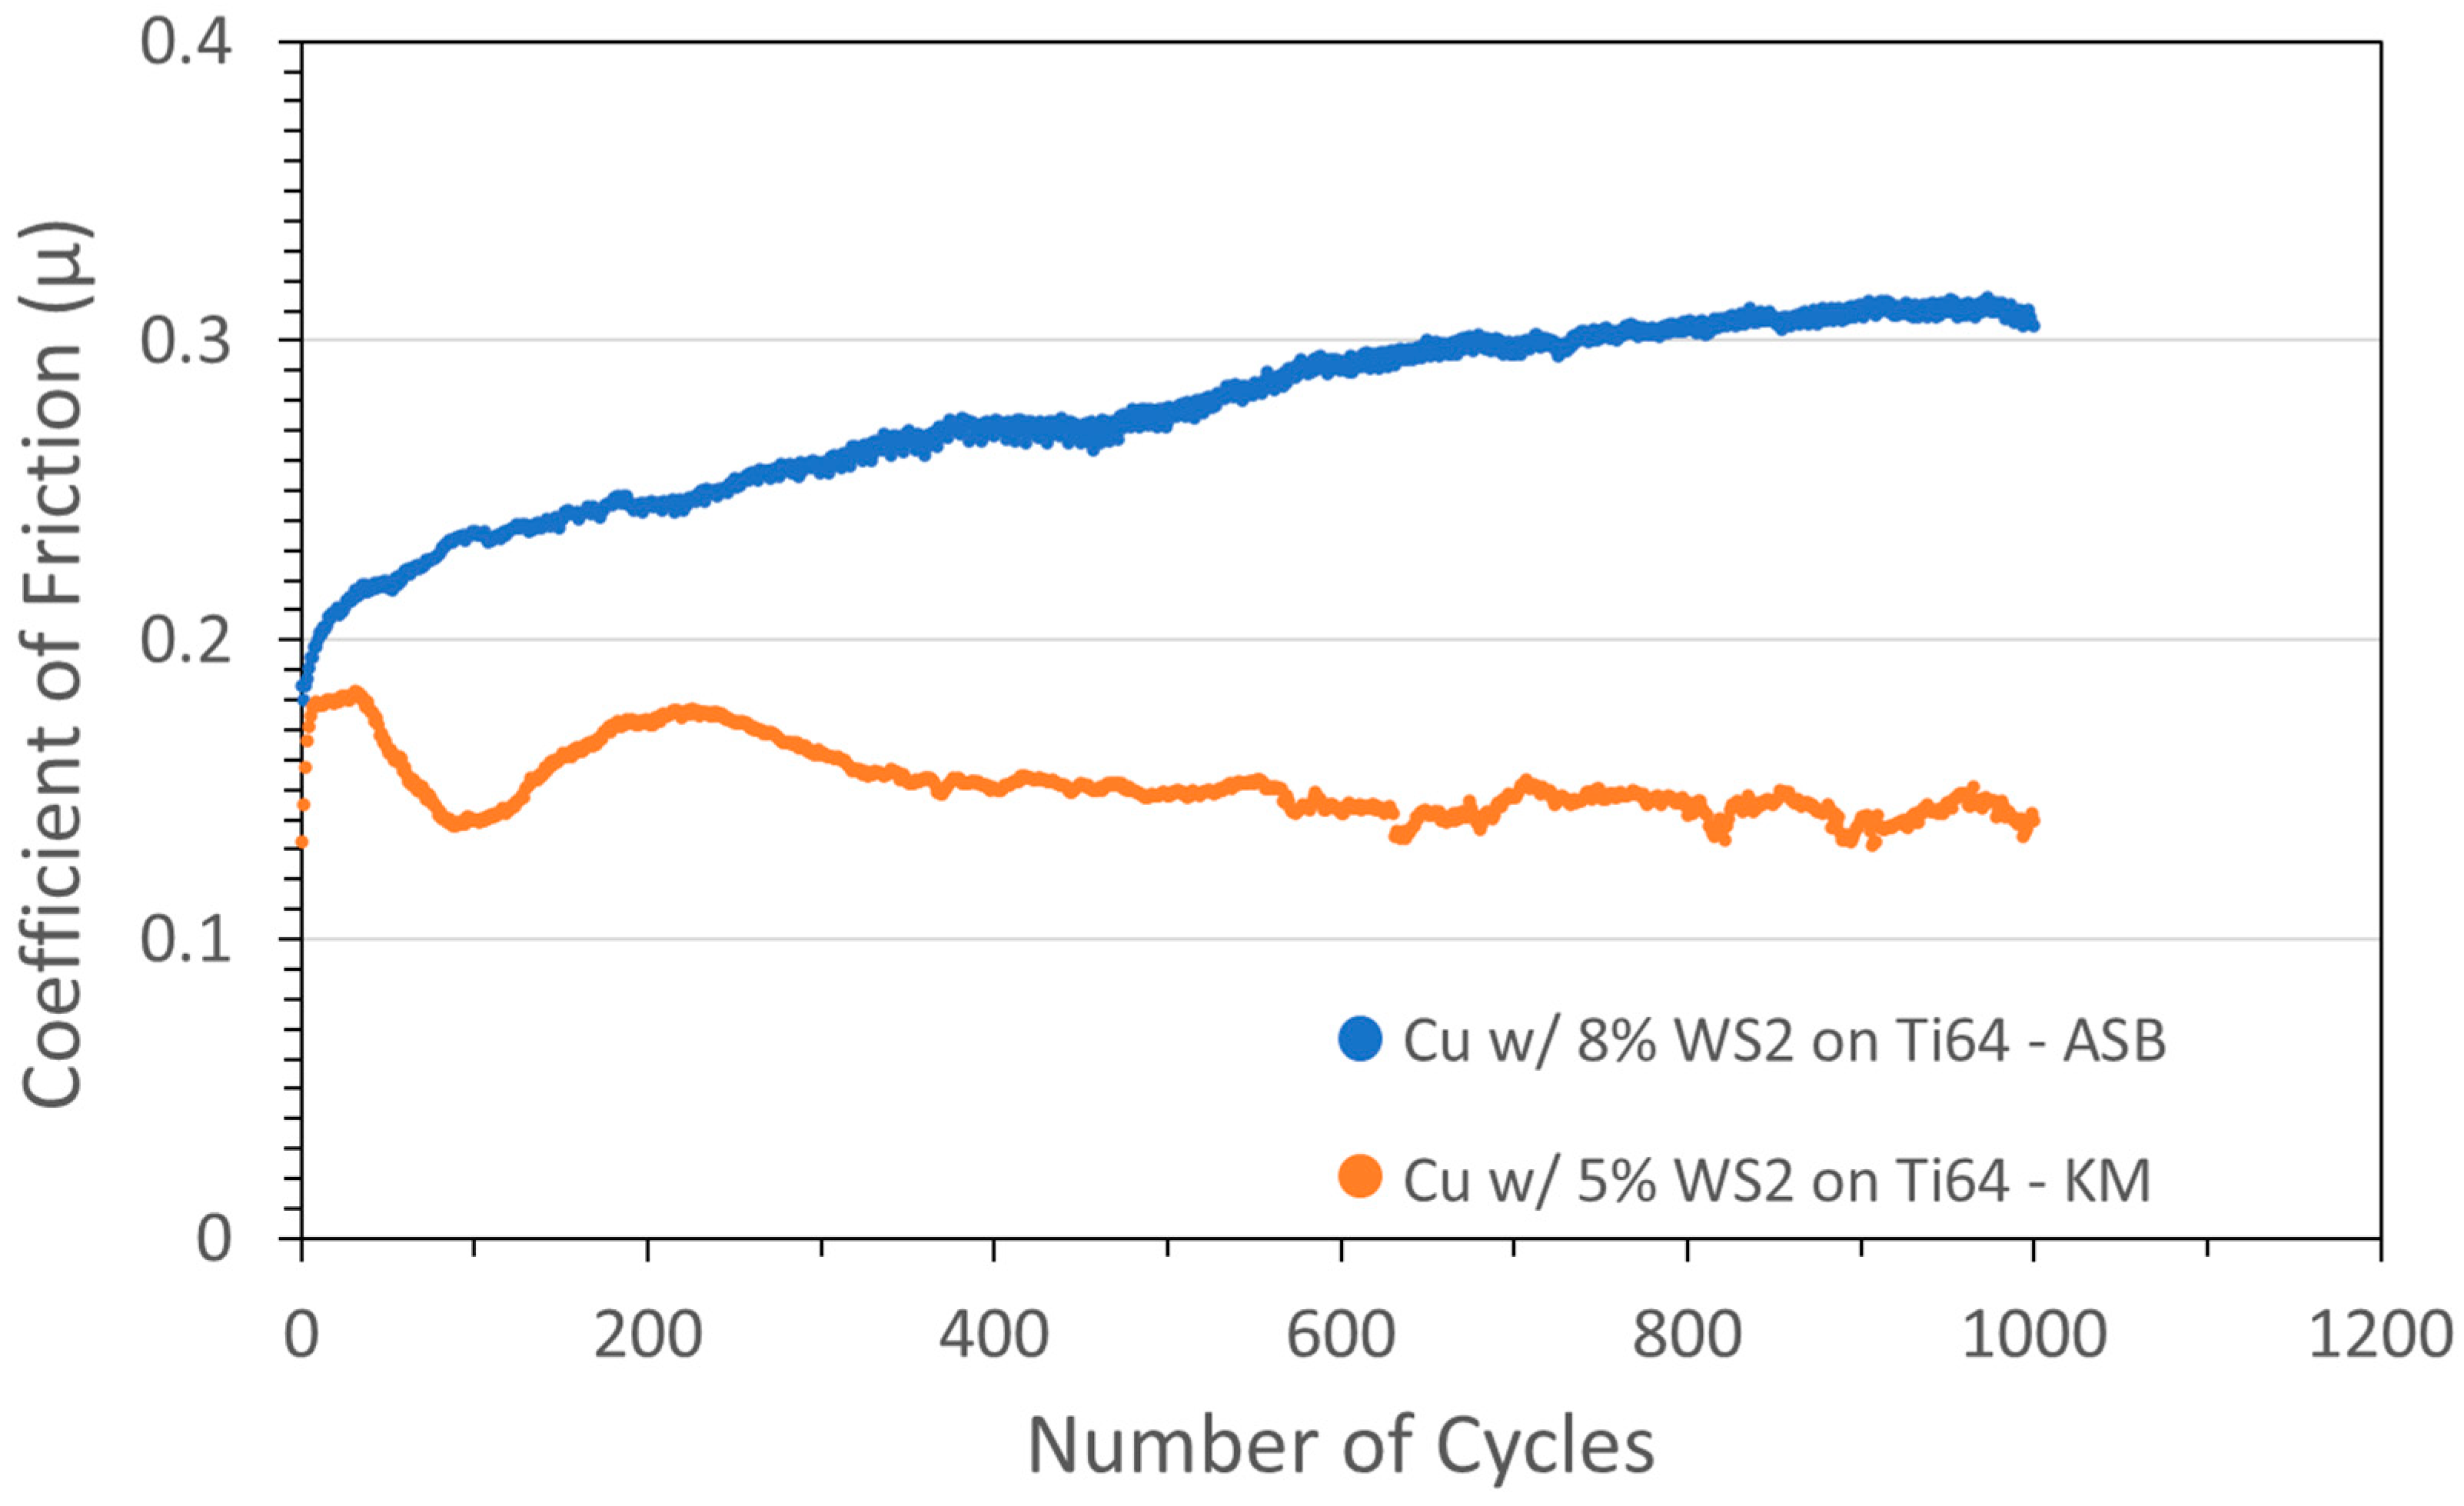
Similar results were obtained when coatings with the same nominal composition were deposited on Ti6Al4V alloy (see Figure 2).

Figure 2.
Tribometry results from the 1000-cycle tests using a 2N load on Cu/WS2 cold spray coatings on Ti-6Al-4V substrates. Testing was conducted in dry N2. Shown are coatings produced on ASB equipment (blue; nominally 8 wt% WS2) and Applied Tungstenite equipment (orange; nominally 5 wt% WS2). Cu particle size range was +11/−38 µm and WS2 average particle size was 5 µm. The XRF measurement of the KM coating showed the actual WS2 content was 81 wt%.
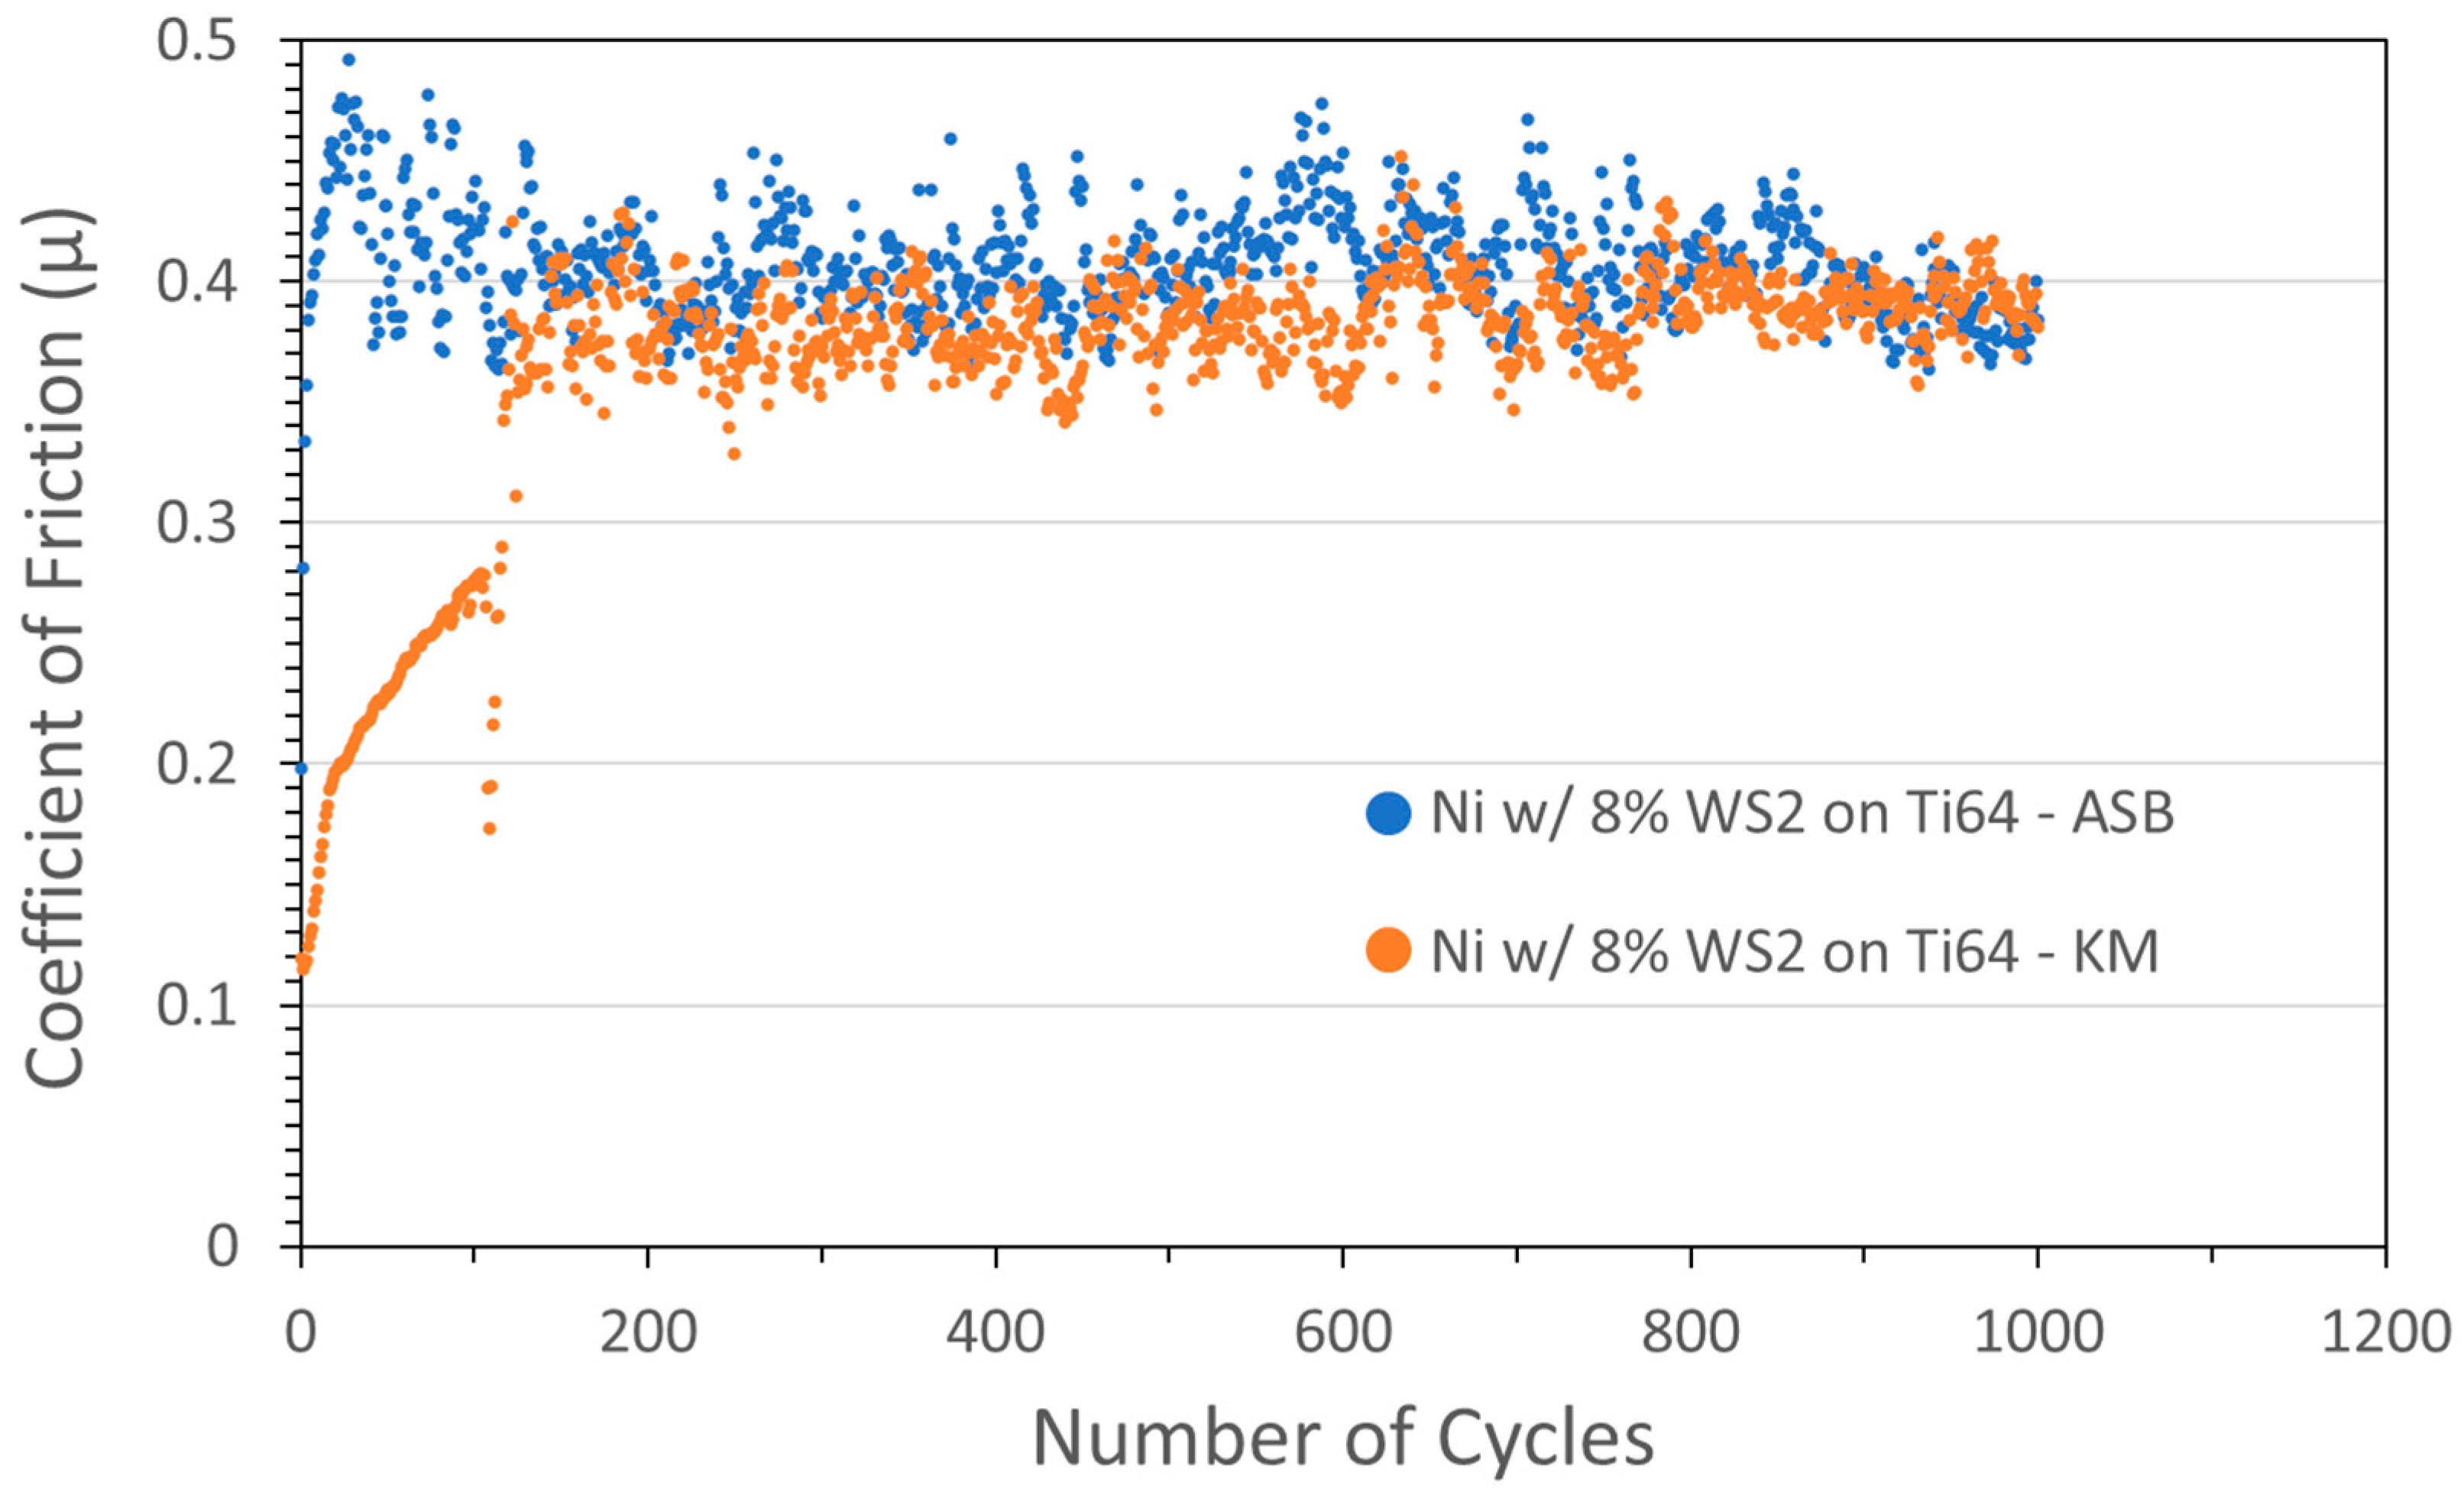
Coatings were also studied using WS2 with Ni metal. Tribometer results for Ni/WS2 cold spray coatings grown using ASB and KM equipment, and both nominally containing 8 wt% WS2, are shown in Figure 3. Although the friction started low in both cases, the coatings failed relatively quickly, with the ASB coating failing after a few cycles, and the KM coating COF slowly rising, followed by failure at 120 cycles.
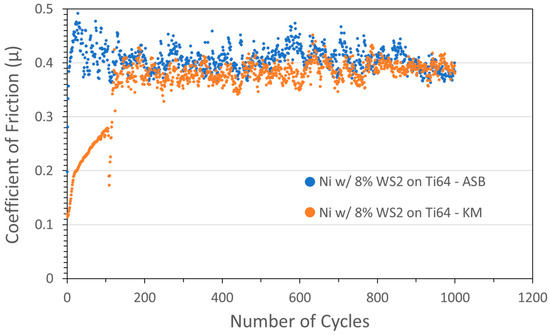
Figure 3.
Tribometry results from the 1000-cycle tests using a 2N load on Ni/WS2 cold spray coatings on Ti-6Al-4V substrates. Testing was conducted in dry N2. Shown are coatings produced on ASB equipment (blue; nominally 8 wt% WS2) and Applied Tungstenite equipment (orange; nominally 8 wt% WS2). Ni particle size range was +11/−45 µm and WS2 average particle size was 5 µm. The XRF measurement of the KM coating showed the actual WS2 content was 59 wt%.
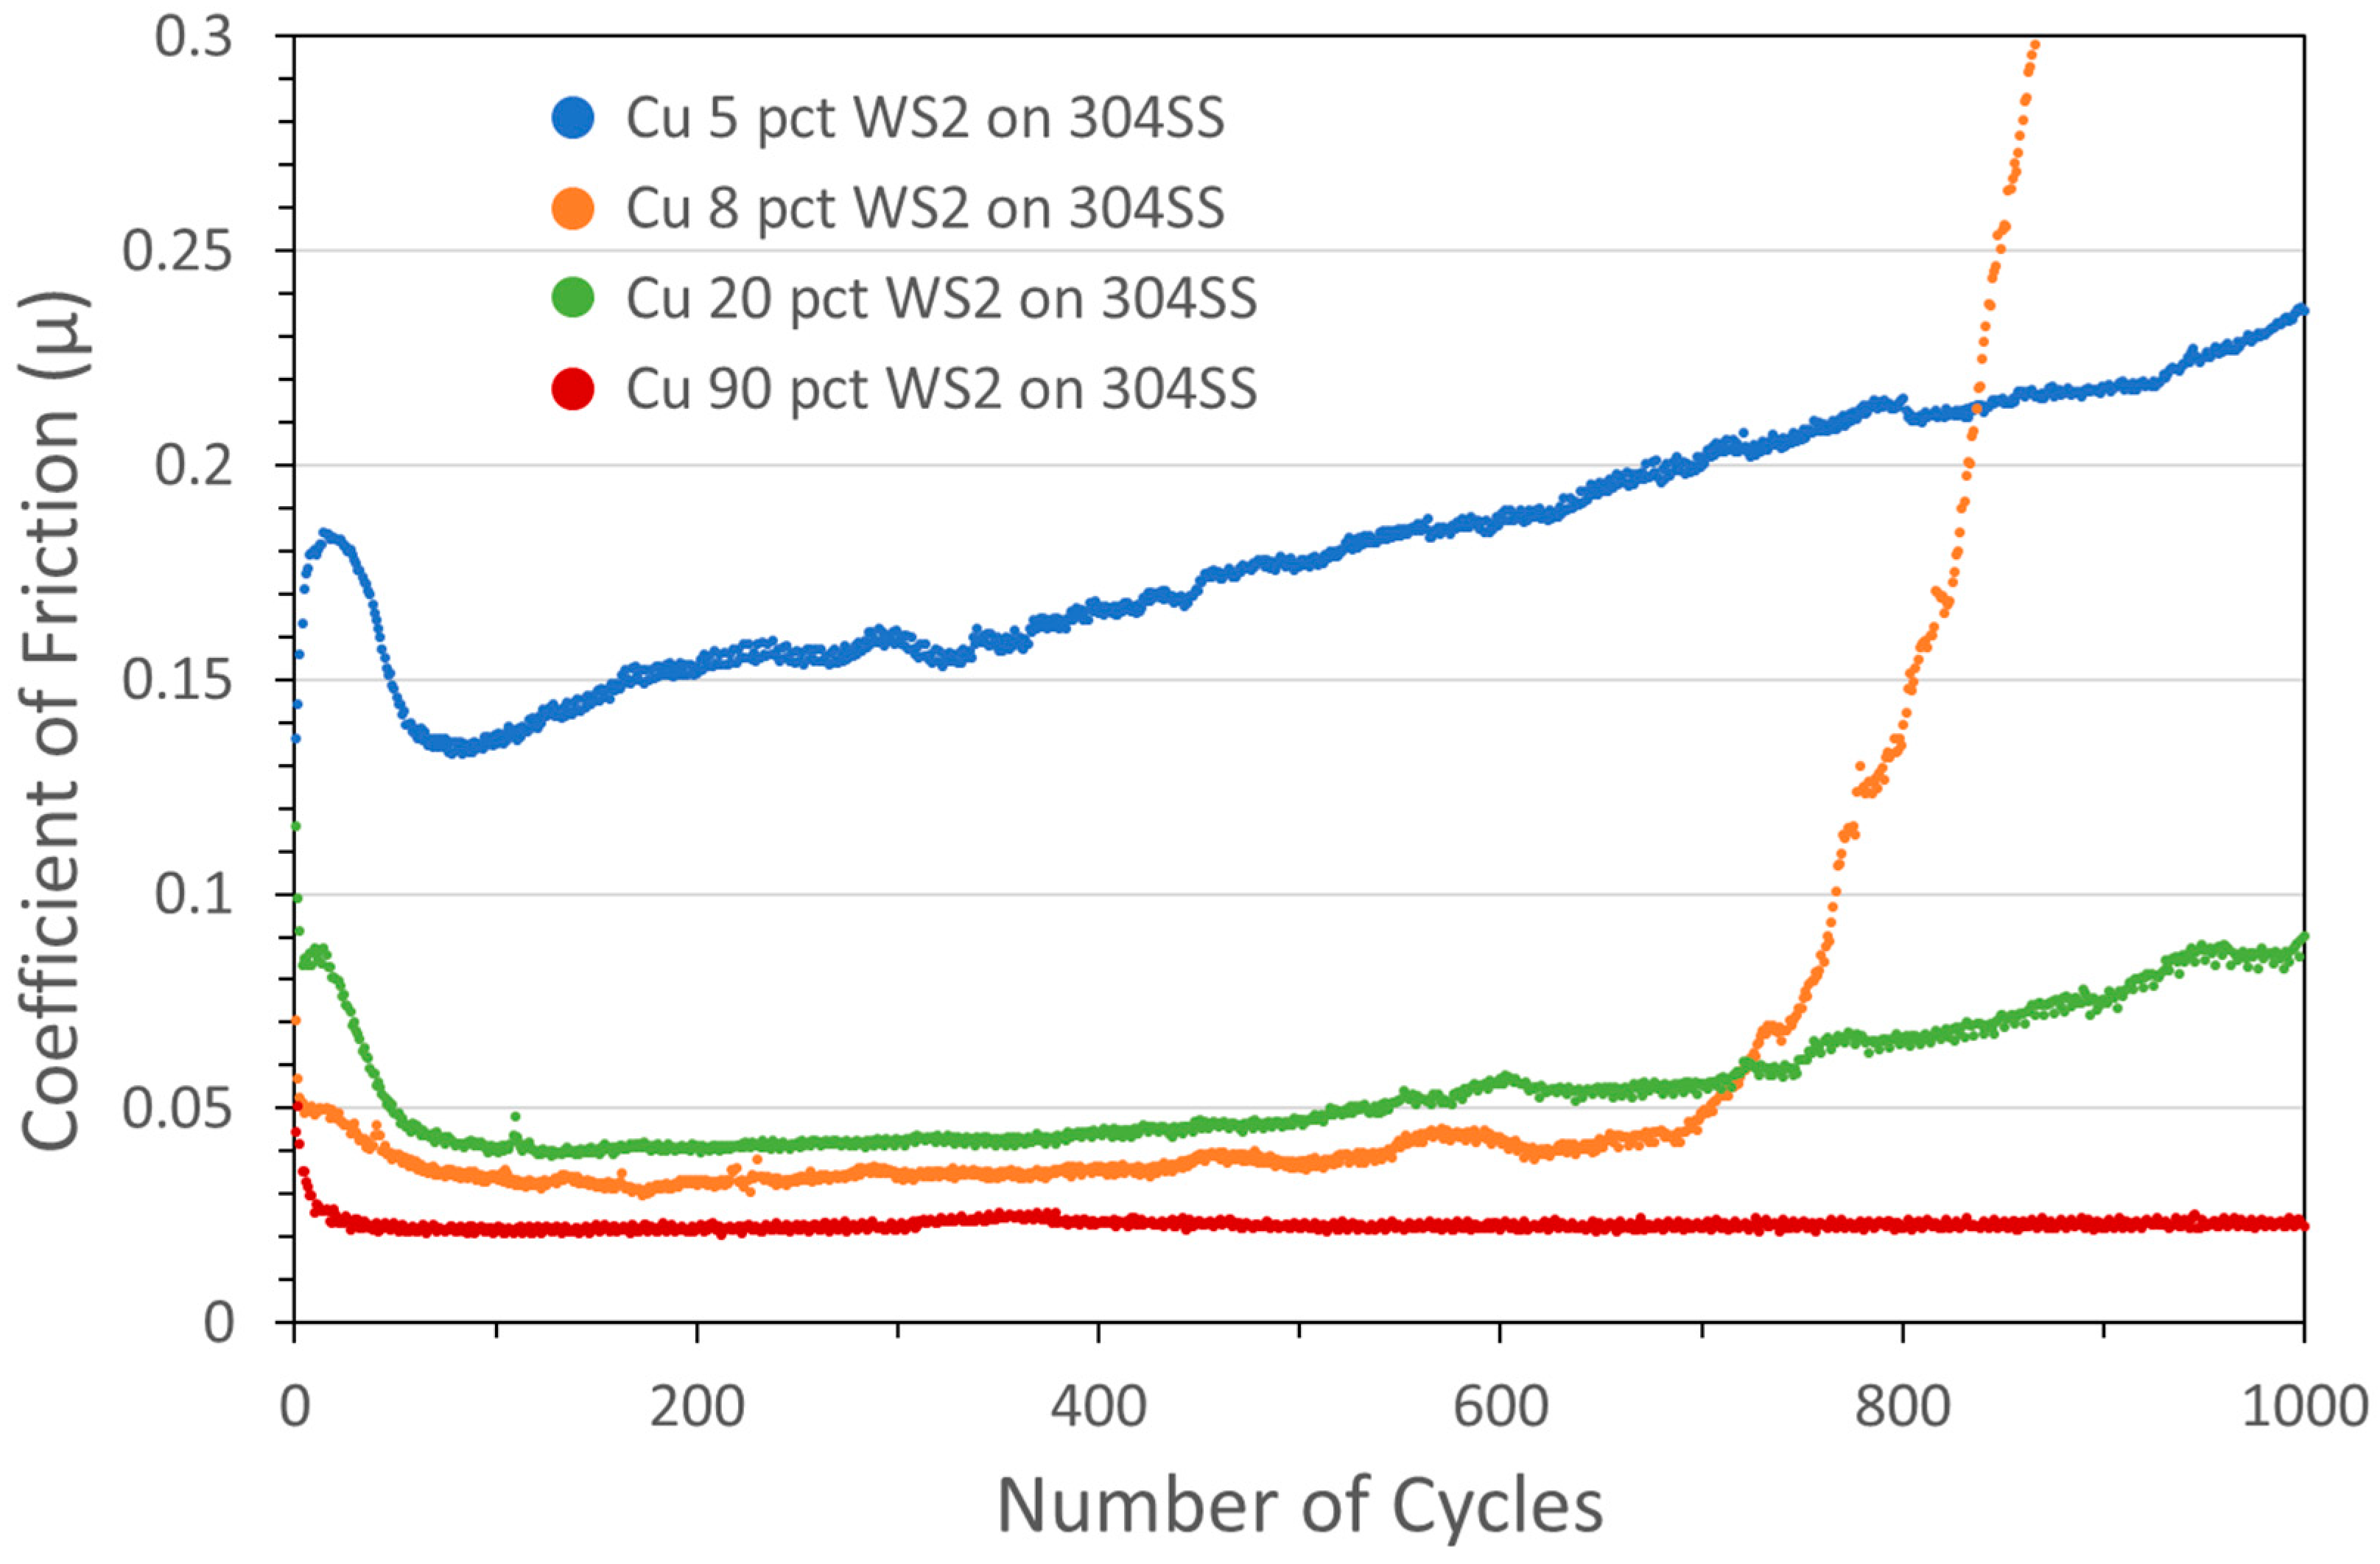
Subsequent to this initial pathfinding period, coatings were all produced using KM equipment at Applied Tungstenite. During the process of obtaining optimized coatings, a number of coating parameters were varied, including the nominal metal:sulfide ratio in the powder feedstock, particle size (of both metal and sulfides), feed gas temperature and pressure, powder feed rate, and substrate material. Although all these affected the tribology and composition of the coatings, the nominal metal:sulfide ratio (i.e., the composition of the powder feedstock) emerged as the critical parameter. In particular, low added metal contents were found to yield the best friction and endurance results. This is illustrated in Figure 4, where tribometry results for a number of Cu/WS2 coatings with different initial Cu:WS2 ratios are shown (at a 2N normal load; the coating with nominally 5 wt% WS2 is also represented in Figure 1). Increasing nominal WS2 content from 5 wt% to 8 wt% resulted in a significant drop in COF, although endurance did not improve, with the 8 wt% coating failing at 700–800 cycles. The coating with 20 wt% WS2 exhibited marginal endurance improvement. However, significantly raising the WS2 content to 90 wt% resulted in an additional drop in COF, with the steady-state friction lasting throughout the 1000-cycle test.

Figure 4.
Tribometry results from the 1000-cycle tests using a 2N load on Cu/WS2 cold spray coatings on 304 SS substrates (deposited at Applied Tungstenite, as were all subsequent coatings in this study). Testing was conducted in dry N2. Shown are coatings produced with nominal contents of 5 wt% WS2 (blue), 8 wt% WS2 (orange), 20 wt% WS2 (green), and 90 wt% WS2 (red). For the first three, the Cu particle size range was +11/−38 µm and WS2 average particle size was 5 µm. For the 90 wt% WS2 coating, the average Cu and WS2 sizes were 1 µm and 24 µm, respectively (as discussed below, a similar performance was obtained for lower WS2 sizes). Actual WS2 contents measured by XRF for these coatings were 77.1, 97.6, 98.7, and 99.1 wt%, respectively (the coating with 5 wt% WS2 is also shown in Figure 1).
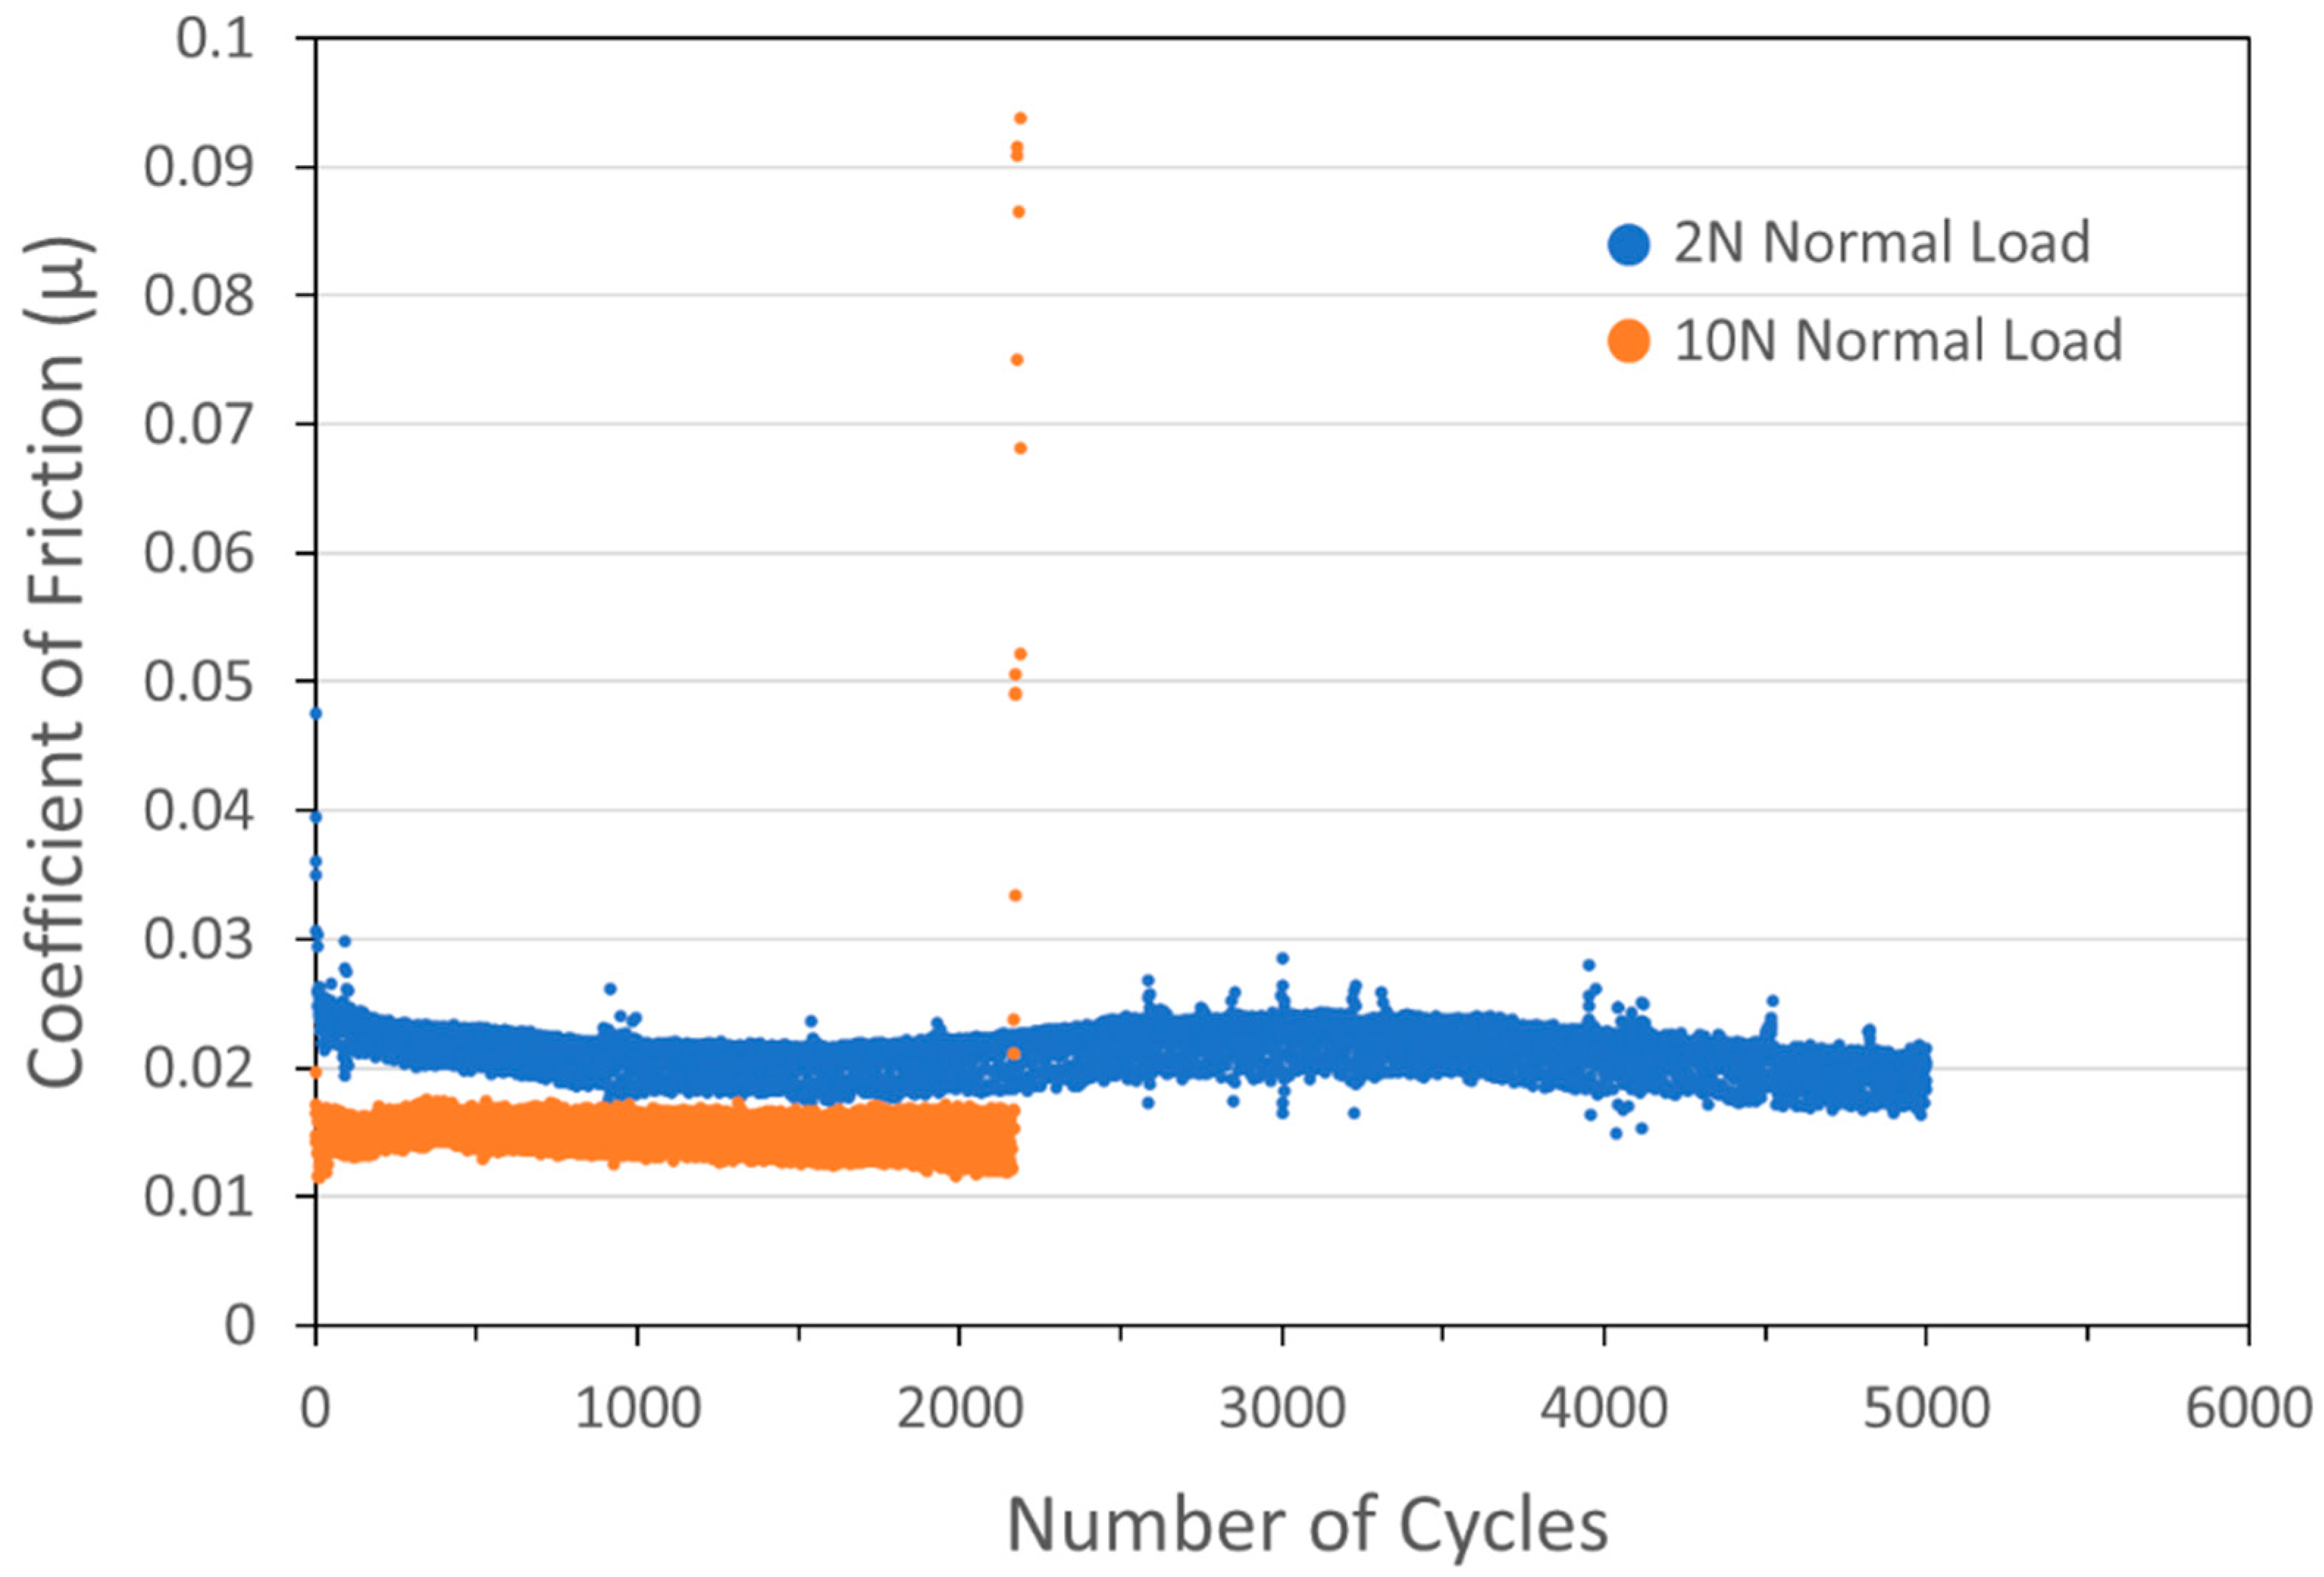
Actual WS2 contents were measured by XRF for these coatings: coatings with nominal concentrations of 5, 8, 20, and 90 wt% actually contained 77.1, 97.6, 98.7, and 99.1 wt% WS2. Based on these results, it was not surprising that pure WS2 coatings (i.e., with no added Cu) also demonstrated excellent performance, exhibiting low COF and lasting for an entire 5000-cycle test without failure (see the blue curve in Figure 5).
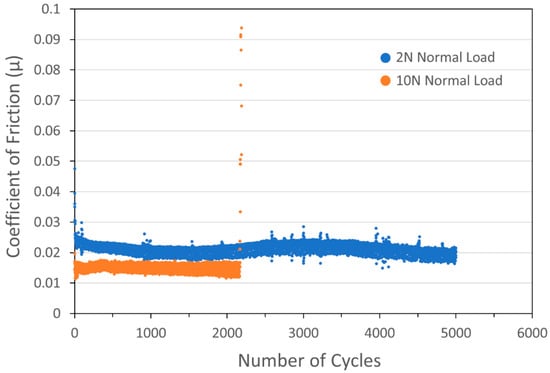
Figure 5.
Tribometry results from the 5000-cycle tests on a pure WS2 cold spray coating on a 303SS substrate. Testing was conducted in dry N2. Shown is data for testing with 2N (blue) and 10N (orange) normal load. The average WS2 particle size was 24 µm. The 2N test lasted the full 5000 cycles, while the 10N test failed after 2200 cycles.
At this point in the investigation, many samples lasted for 5000+ cycles without failure. To better discriminate between the performance of different coatings, further investigation required altering tribometry testing parameters to encourage chances for failure in a reasonable timeframe, in particular by increasing the normal load from 2N to 10N. The concomitant increase in nominal maximum Hertzian contact stress (Smax) from 811 MPa (118 ksi) to 1386 MPa (201 ksi) is shown in Figure 5 for a pure WS2 coating: the higher load result is shown in the orange curve to result in a failure at 2200 cycles.
The increase in load also resulted in the COF of the pure WS2 coating dropping from ~0.022 to ~0.015. Like MoS2, WS2 conforms to the Hertzian Contact Model [14], where the COF decreases as the normal load is increased. Specifically, the COF for such species is inversely proportional to the Hertzian contact stress, unlike solids that follow Amontons’ Law, where the COF is independent of load [15]. This behavior is caused by the low shear strength of metal disulfides, as opposed to harder materials where the COF is related to surface interaction.
While the nominal composition of the feedstock powder had the most significant effect on performance, particle size had a modest effect on performance. This is partly because smaller metal particles exhibited less clogging in the KM cold spray machine. In particular, WS2 showed the best performance when particles had a 100 nm average width. With MoS2, good performance was obtained with average widths of 15 µm (smaller MoS2 sizes were briefly investigated and showed promising performance).
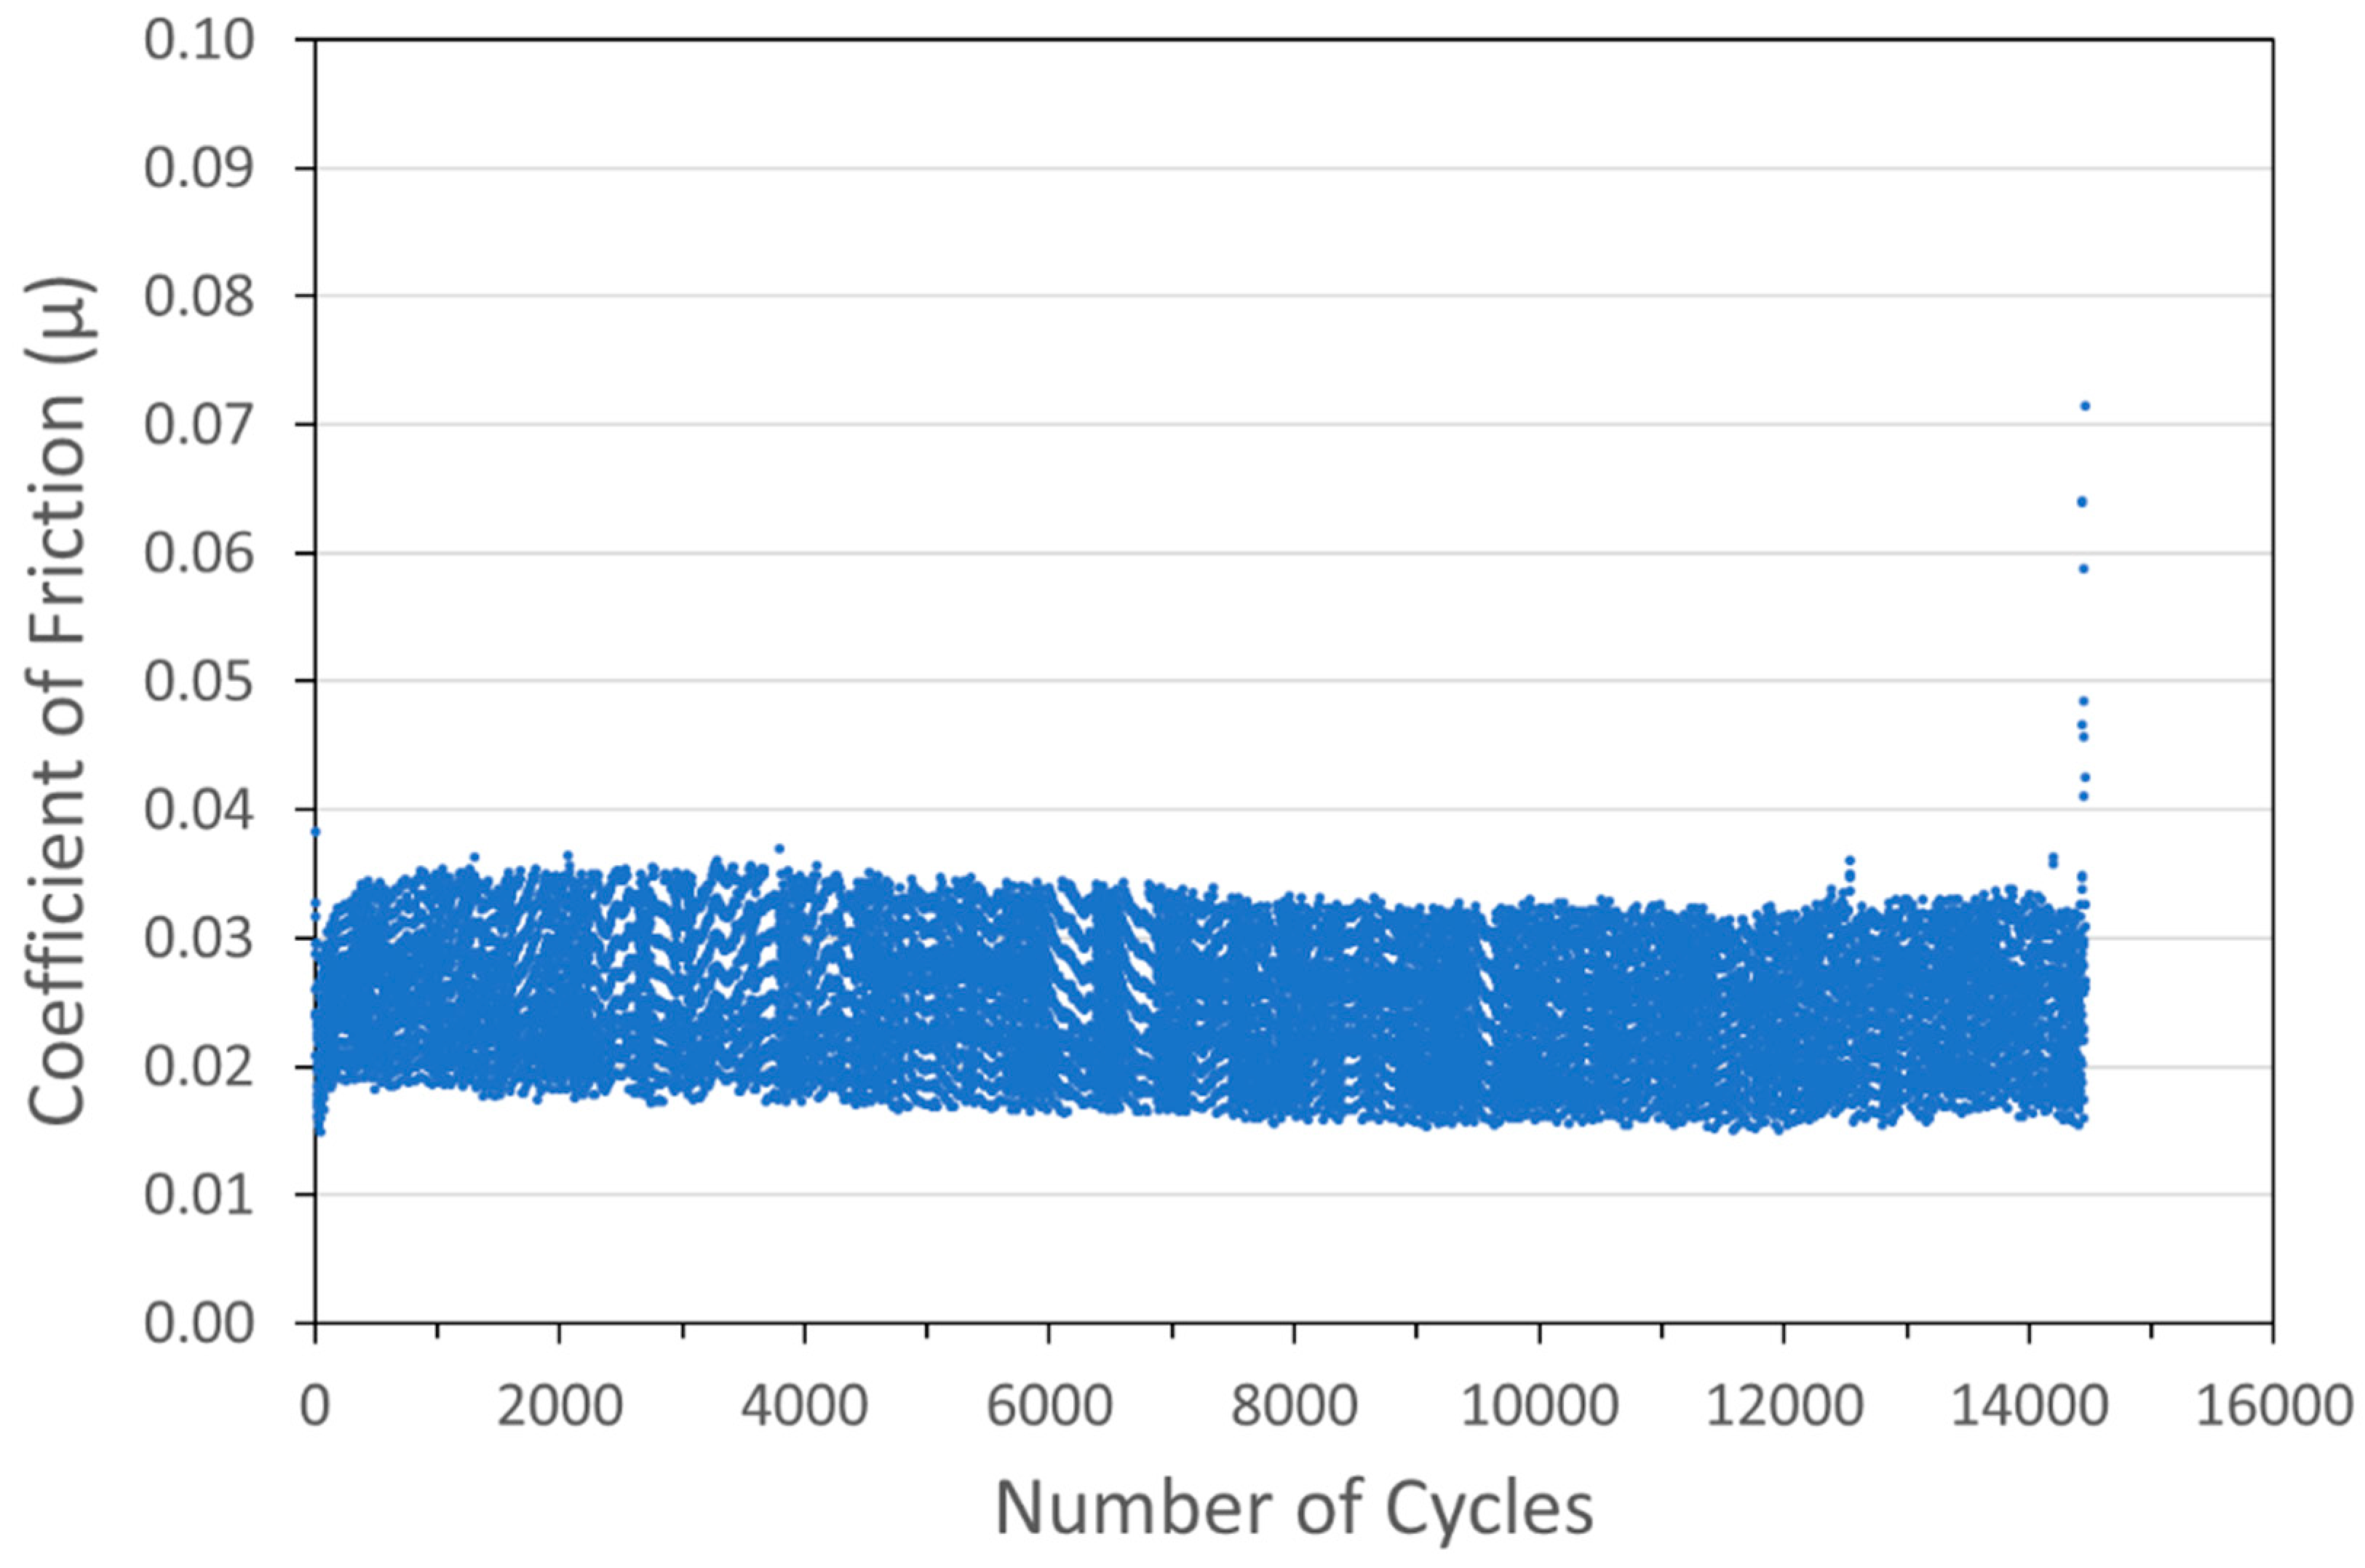
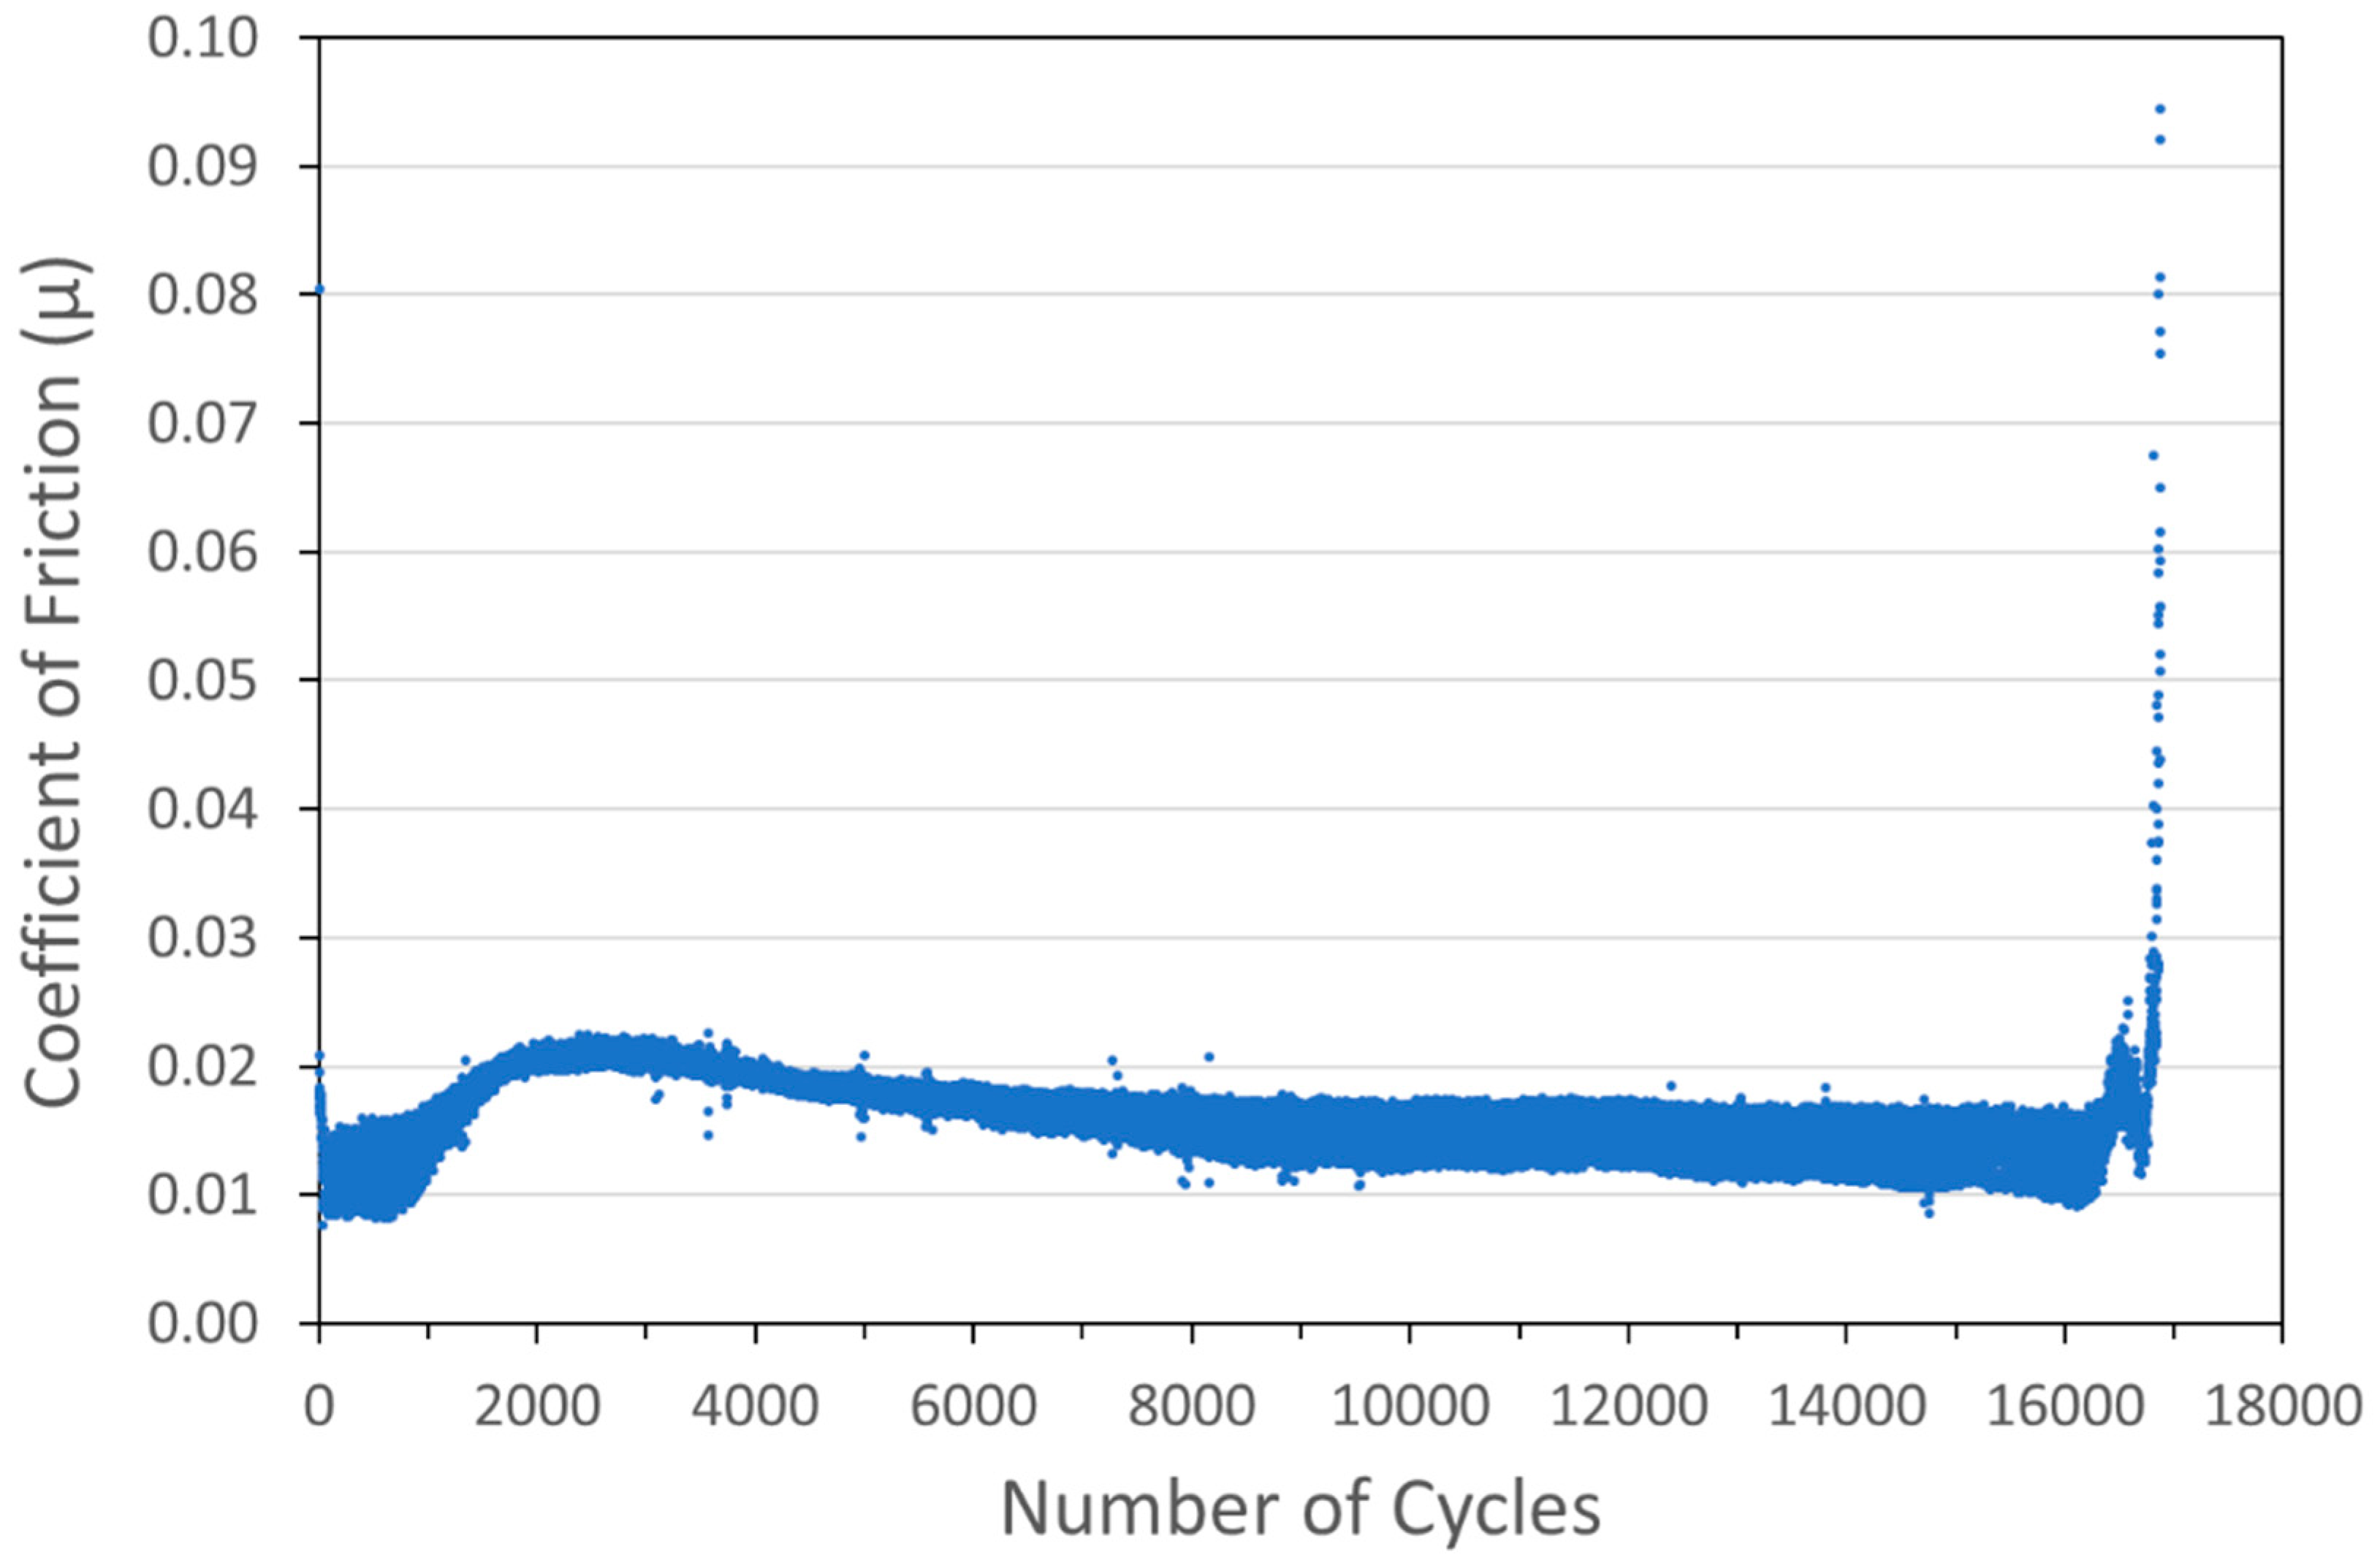
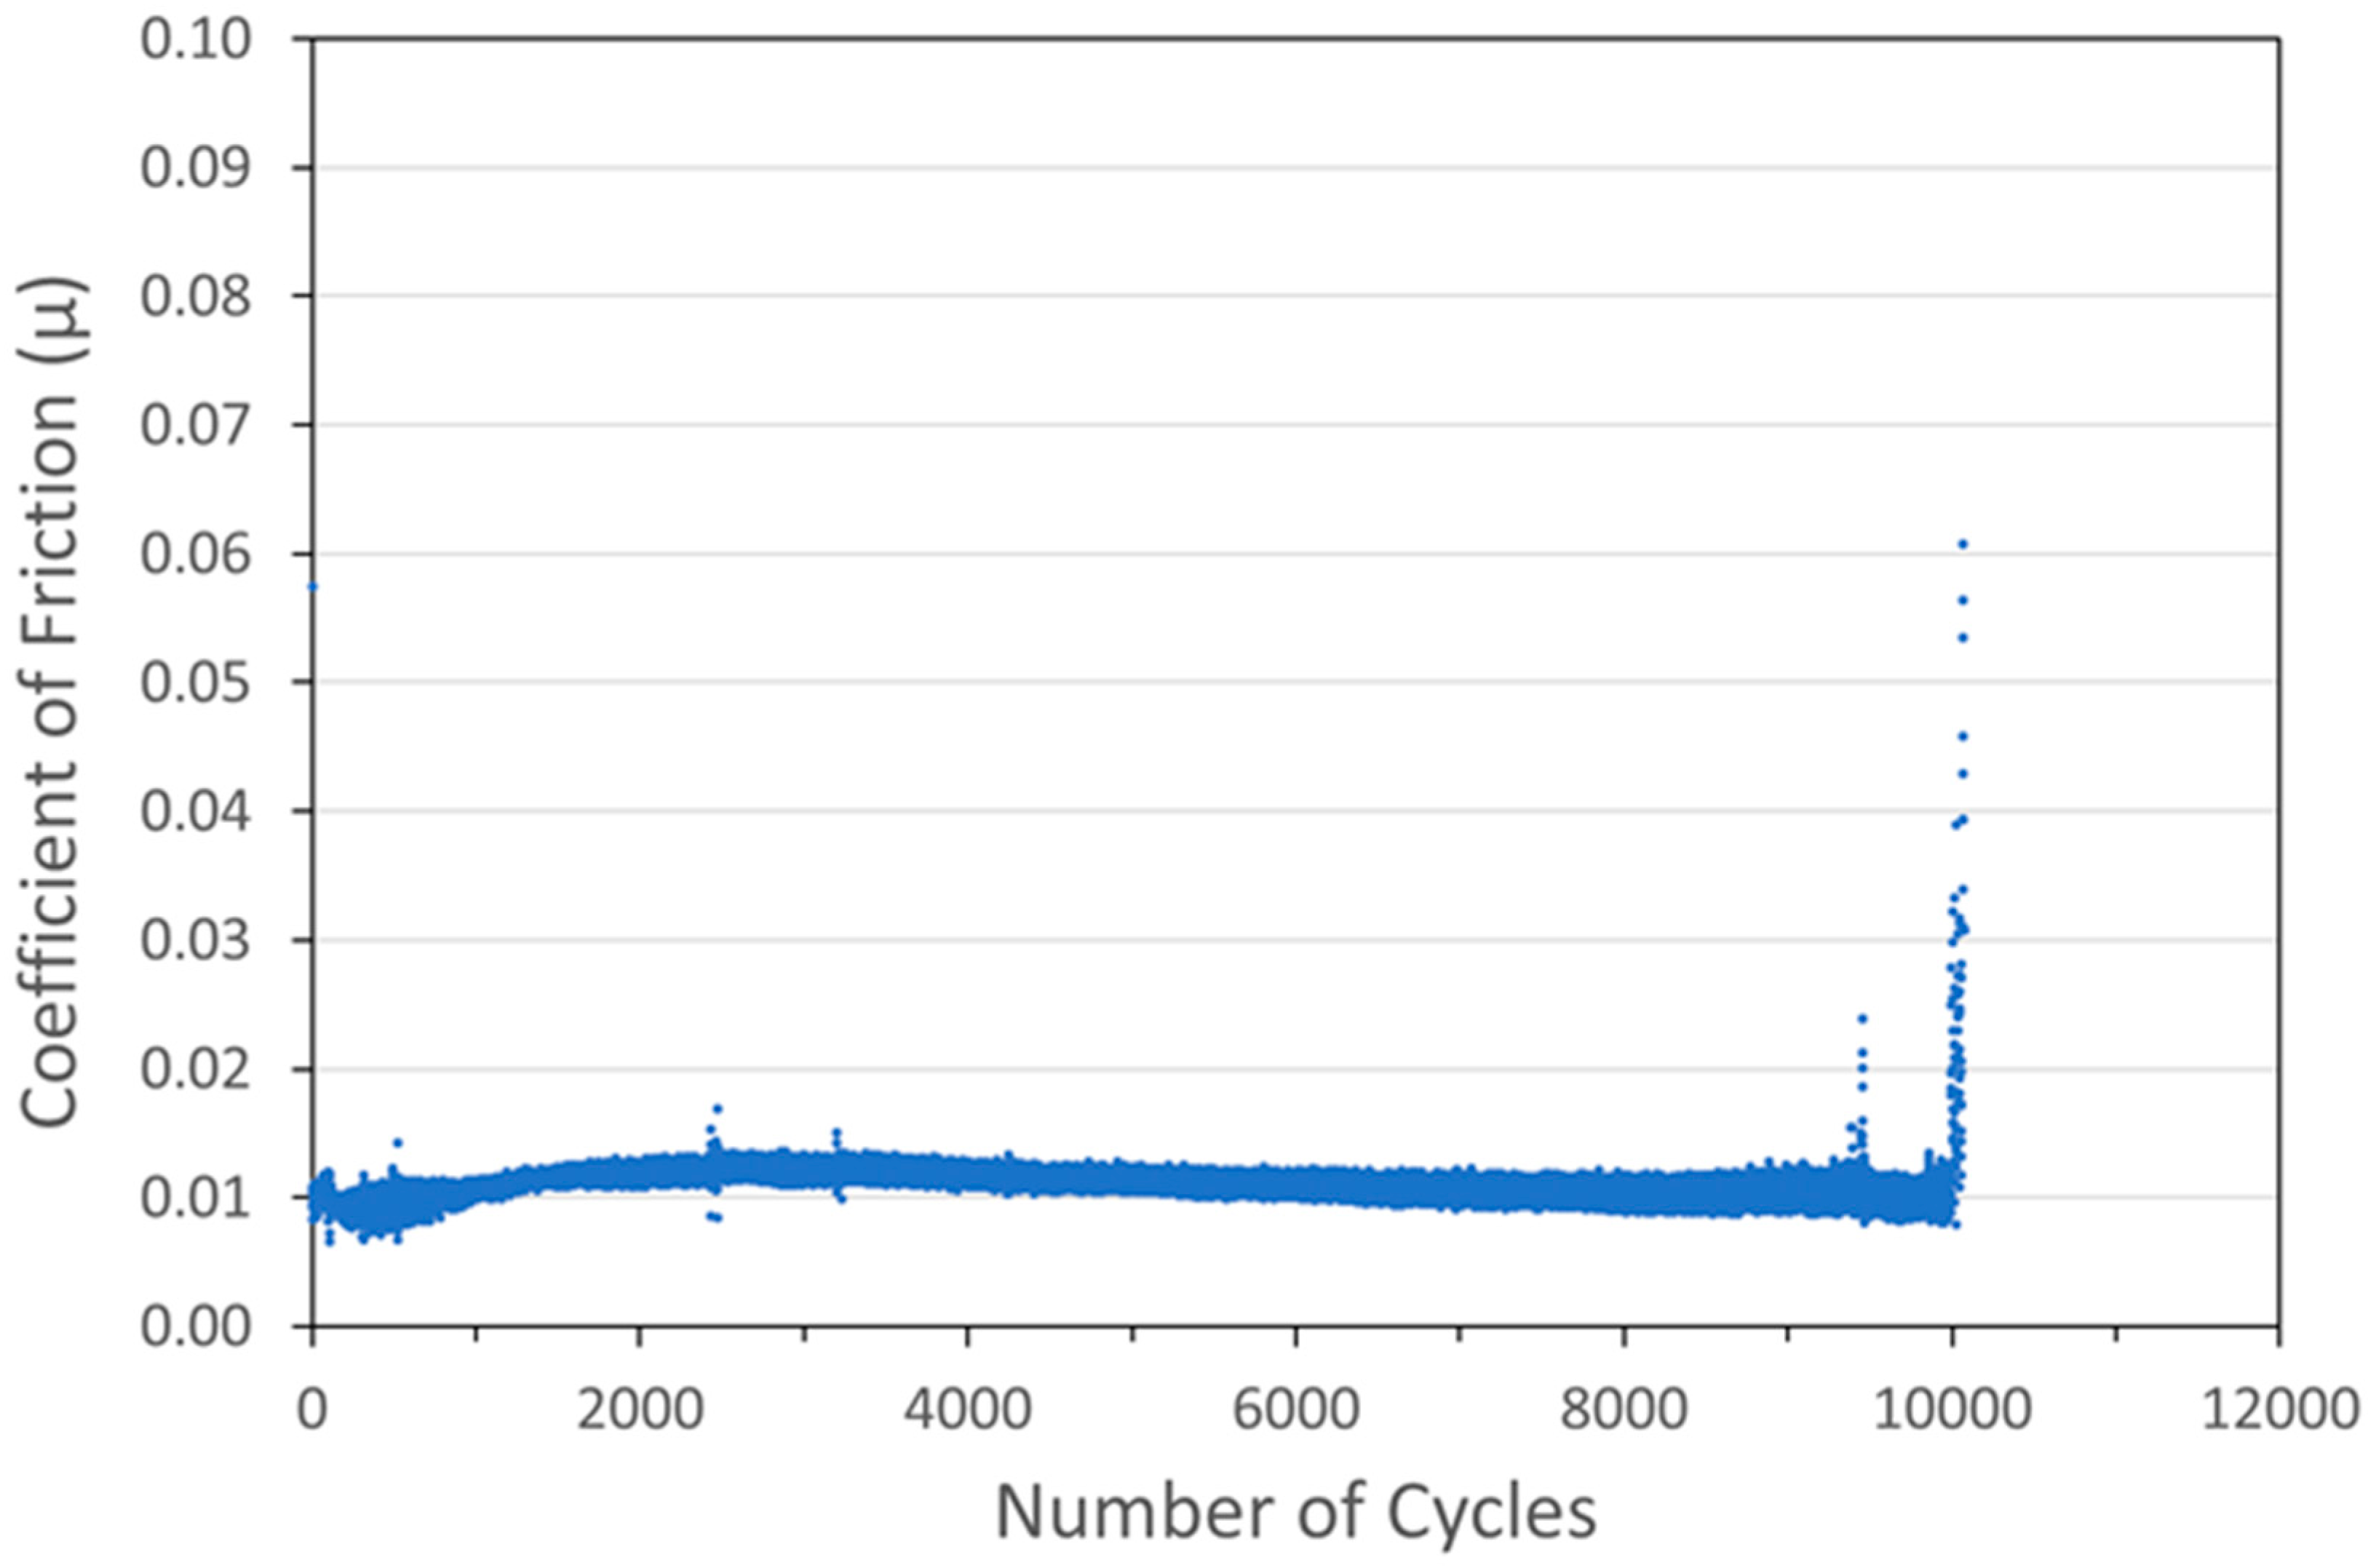
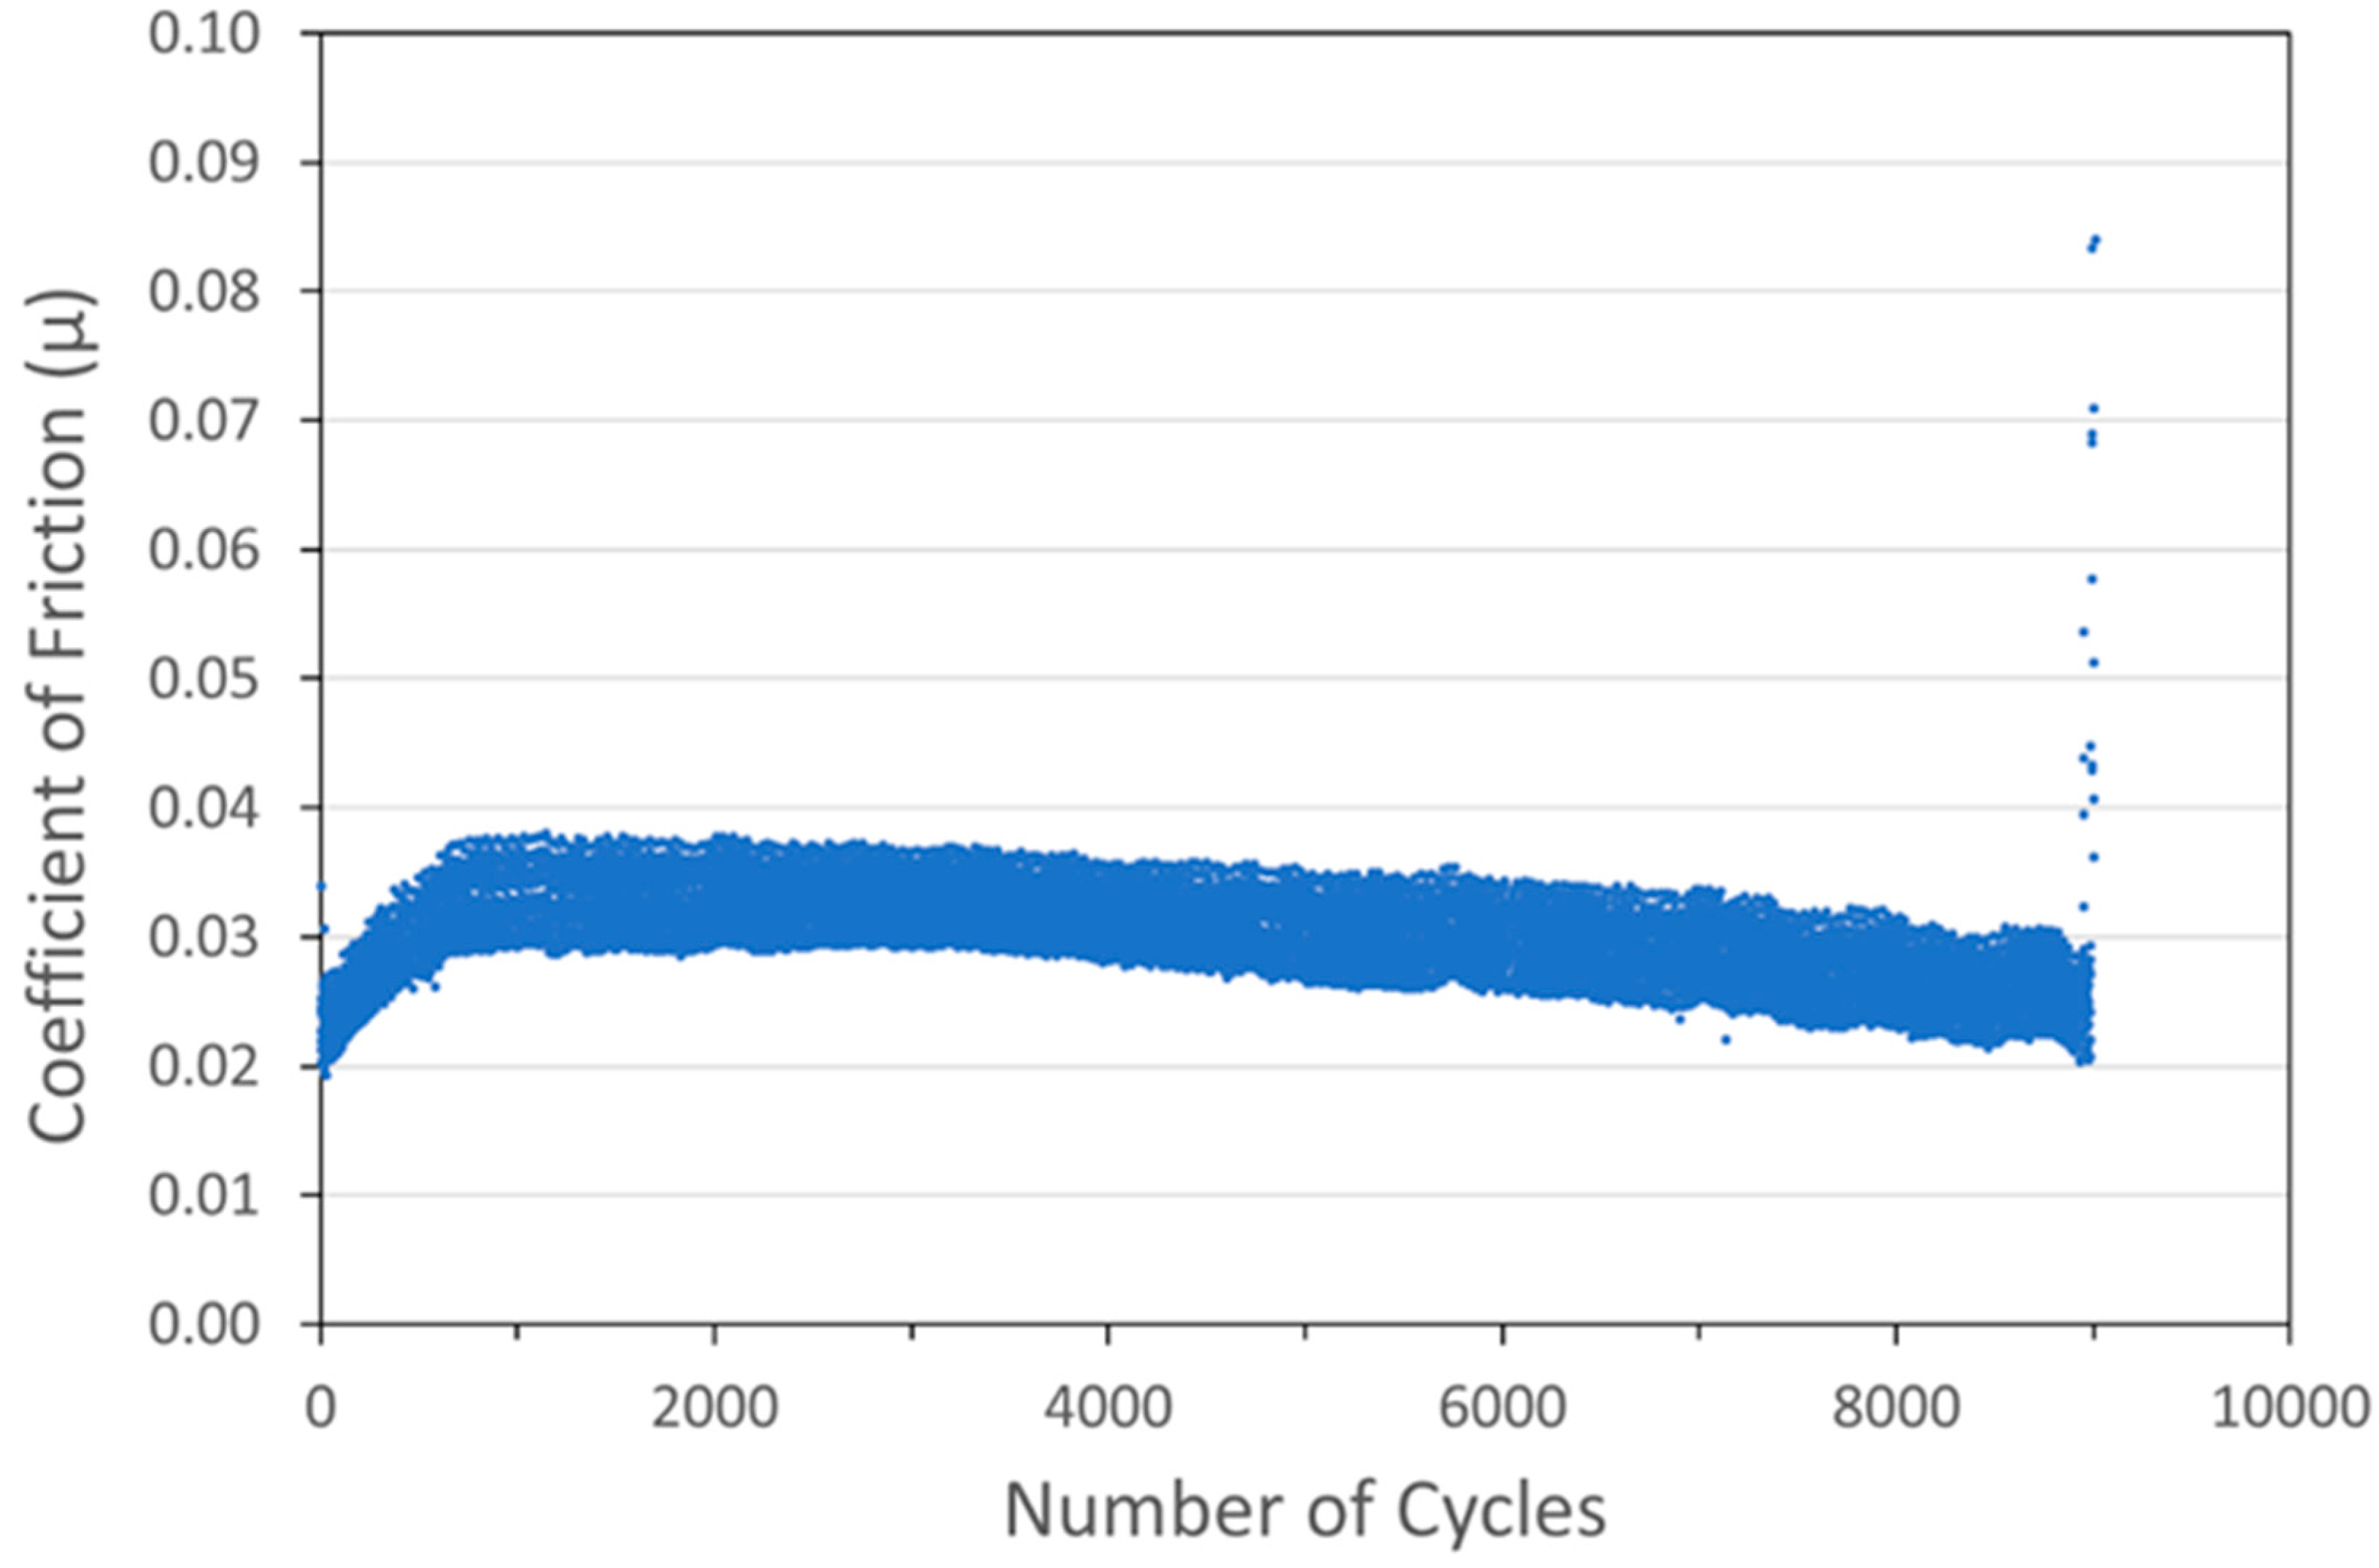
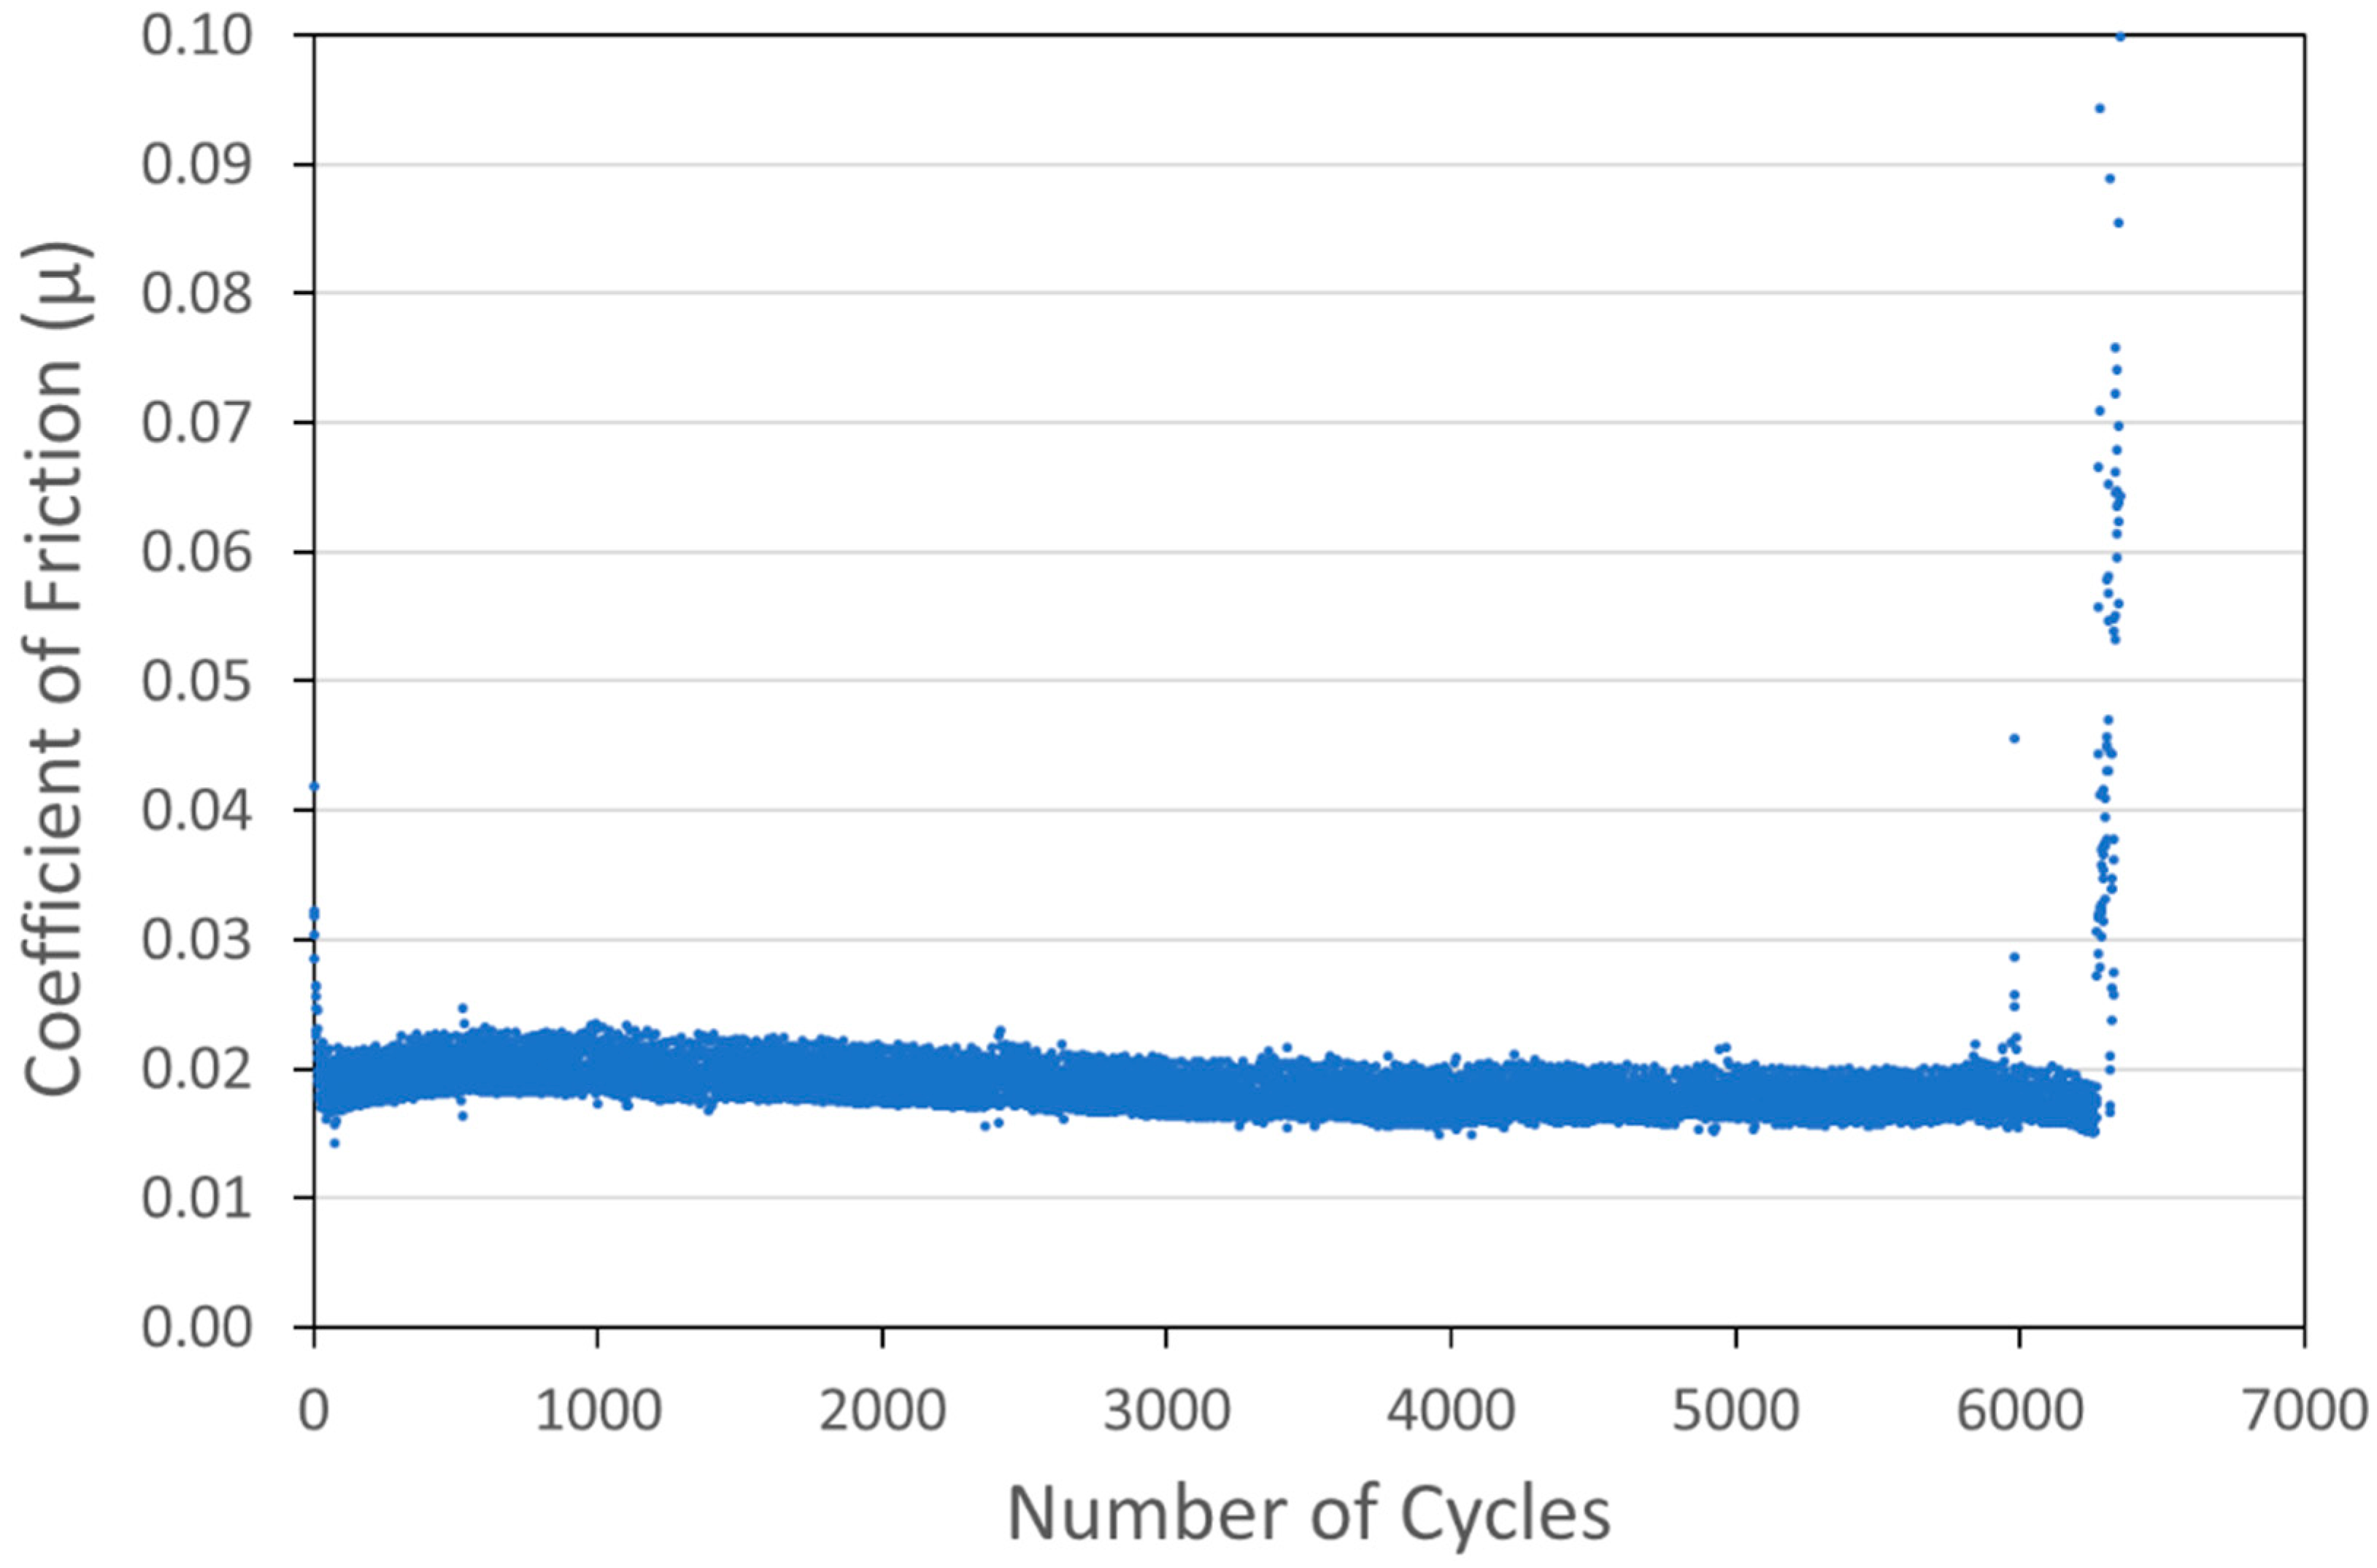
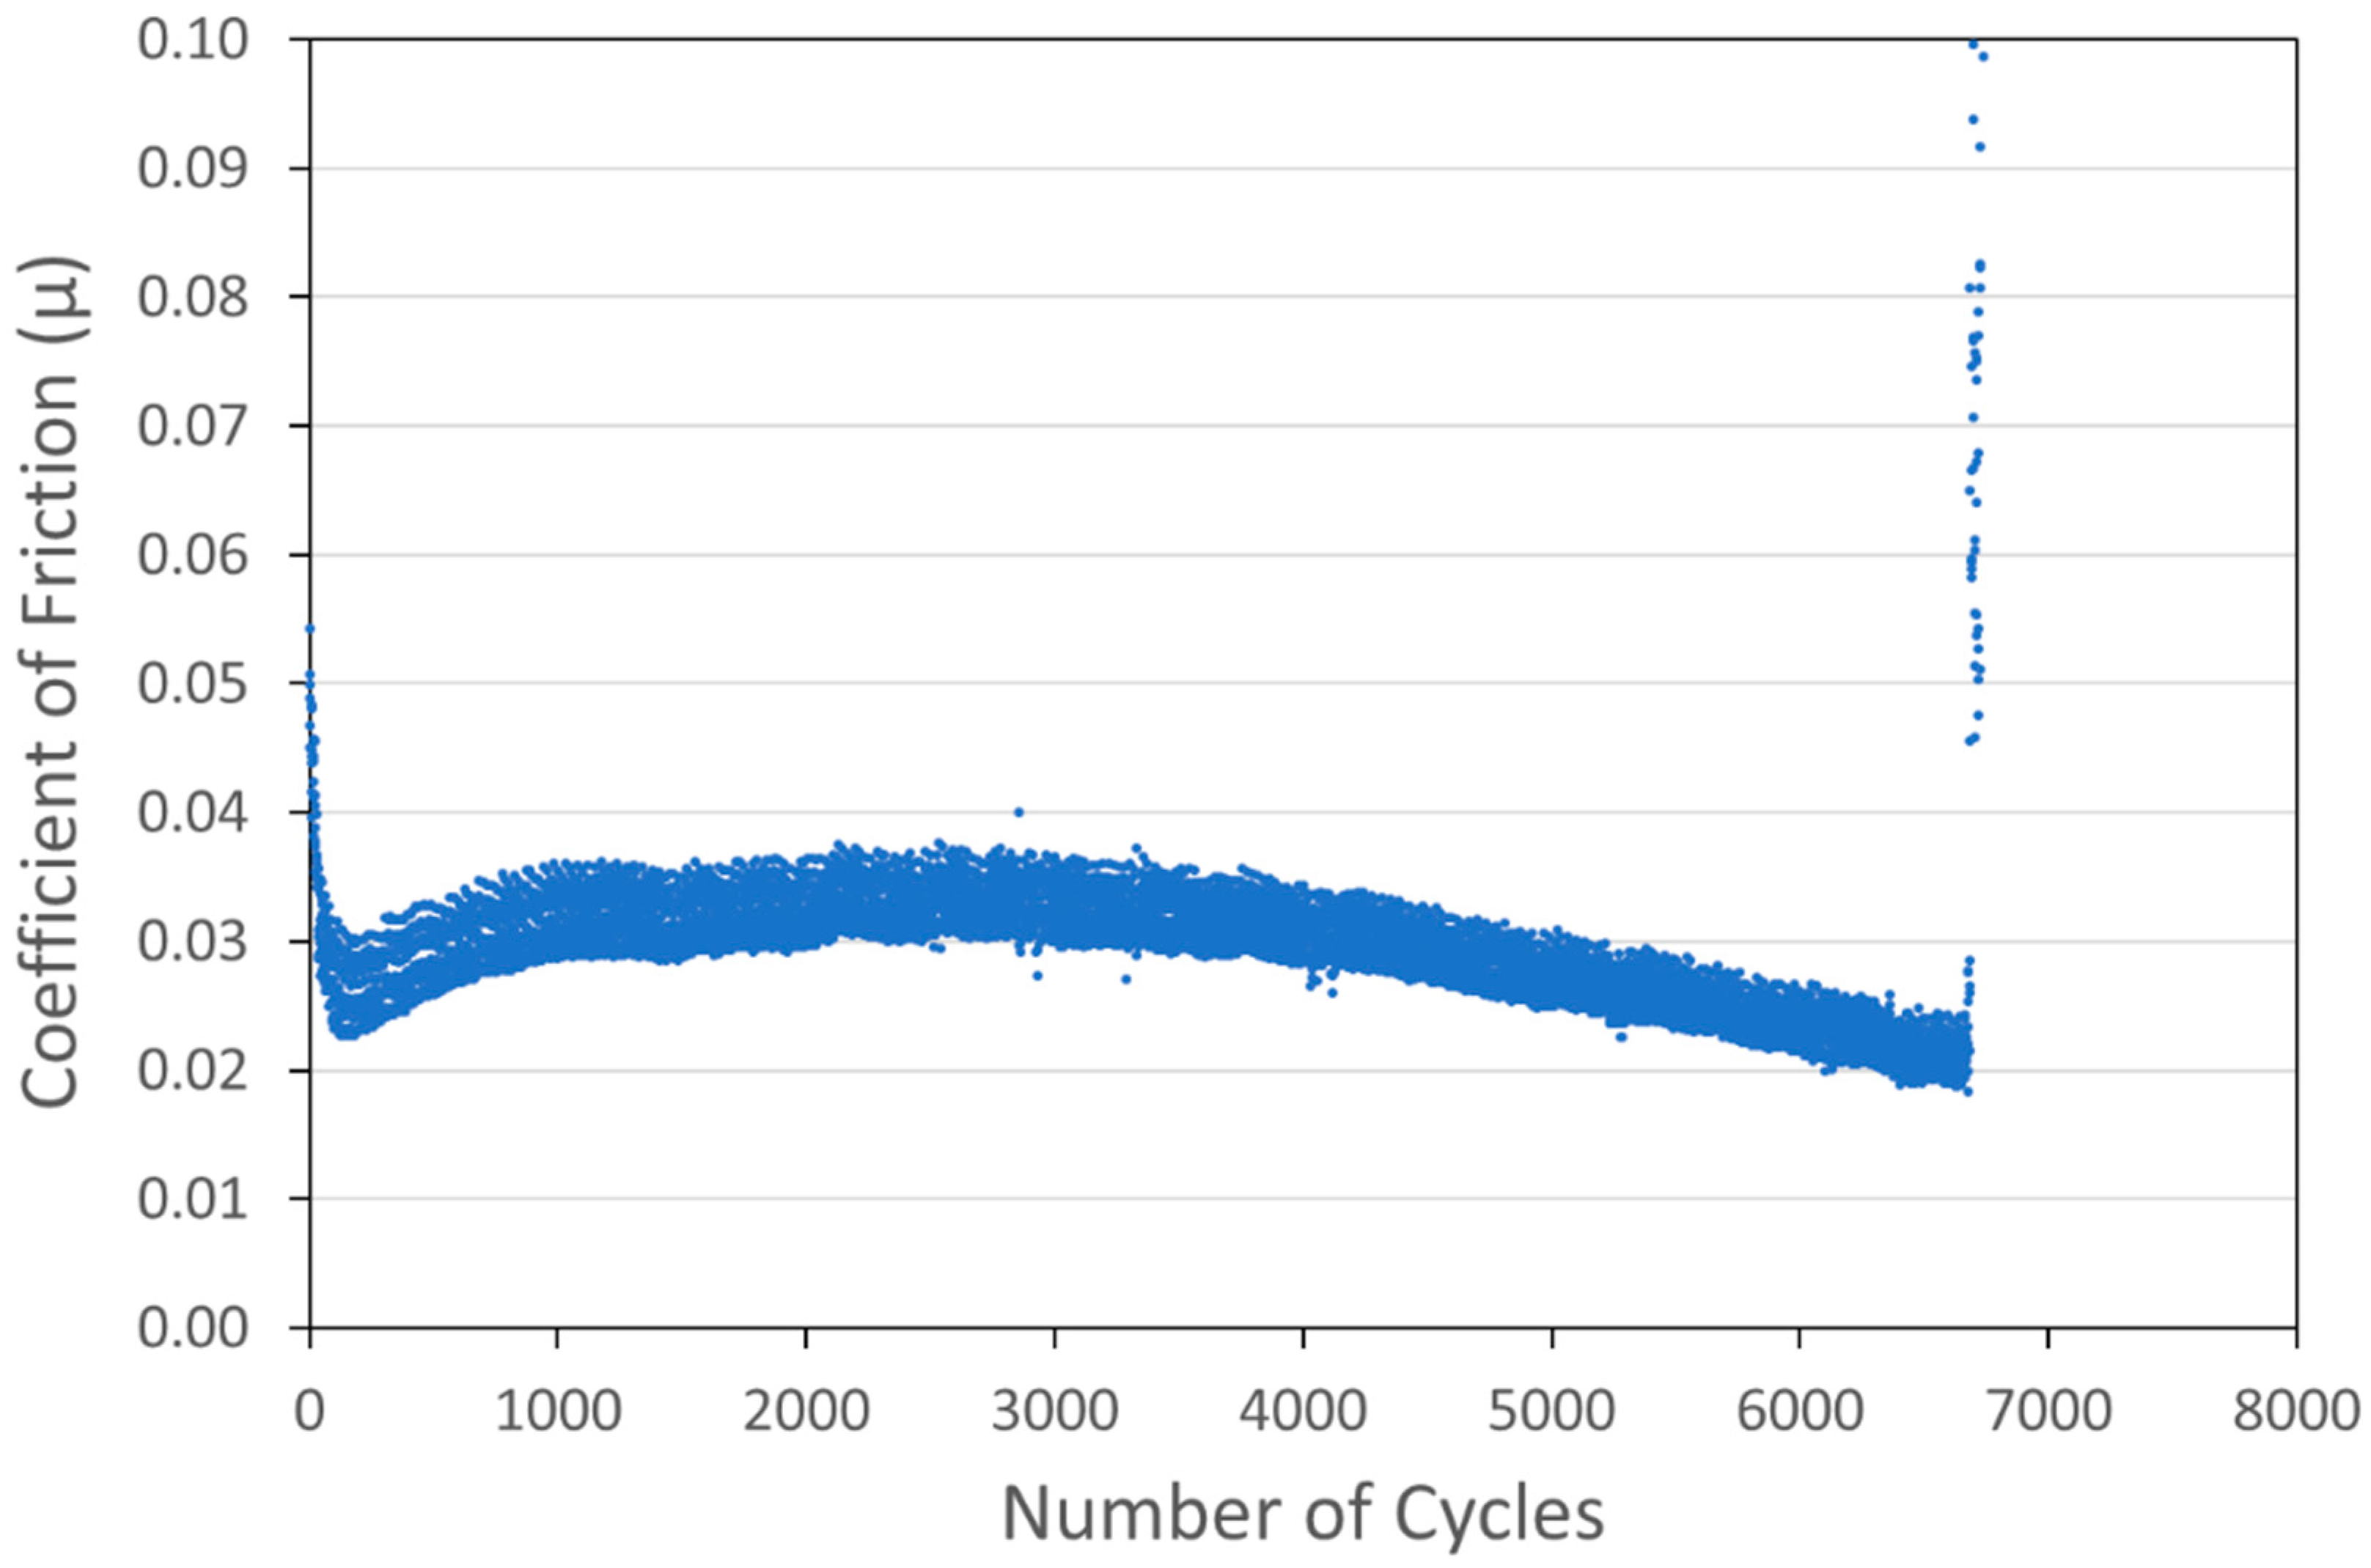
Optimized versions of six coating types were developed and are shown in Figure 6, Figure 7, Figure 8, Figure 9, Figure 10 and Figure 11. Specifically, coatings with the following nominal compositions are shown: 1 µm Cu + 90 wt% 100 nm WS2, 1 µm Cu + 90 wt% 15 µm MoS2, 1 µm Ni + 88wt% 100 nm WS2, 1 µm Ni + 80 wt% 15 µm MoS2, 100 nm WS2, and 15 µm MoS2.
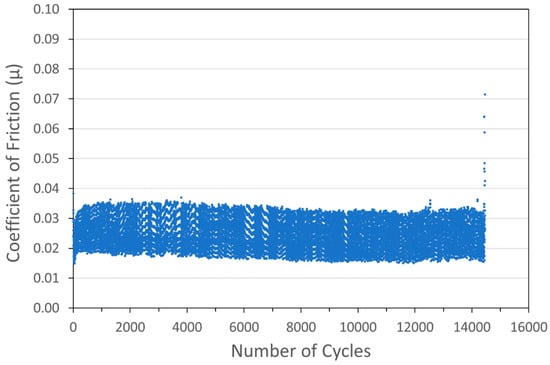
Figure 6.
Tribometry results on a Cu/WS2 cold spray coating (with nominal WS2 content of 90 wt%) on a 304 SS substrate. Testing was conducted in dry N2. A 10N normal load was used and the test was run until failure. The average Cu particle size range was 1 µm and the average WS2 particle size was 100 nm. The larger spread of data for this scan is likely an equipment artifact and not representative of this sample.
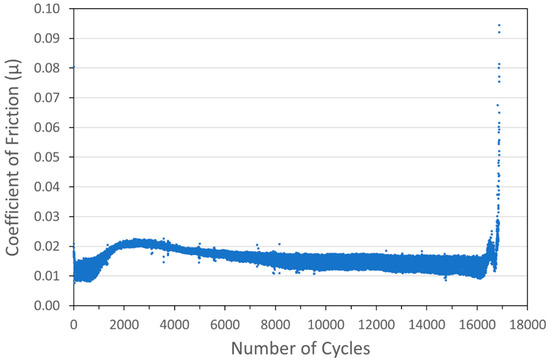
Figure 7.
Tribometry results on a Cu/MoS2 cold spray coating (with nominal MoS2 content of 90 wt%) on a 304 SS substrate. Testing was conducted in dry N2. A 10N normal load was used and the test was run until failure. The average Cu particle size range was 1 µm and the average MoS2 particle size was 15 µm.
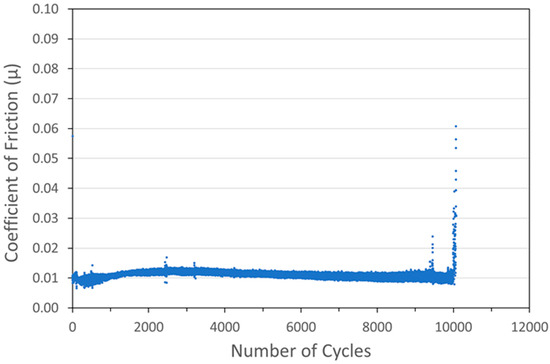
Figure 8.
Tribometry results on a Ni/WS2 cold spray coating (with nominal WS2 content of 88 wt%) on a 304 SS substrate. Testing was conducted in dry N2. A 10N normal load was used and the test was run until failure. The average Ni particle size range was 1 µm and the average WS2 particle size was 100 nm.
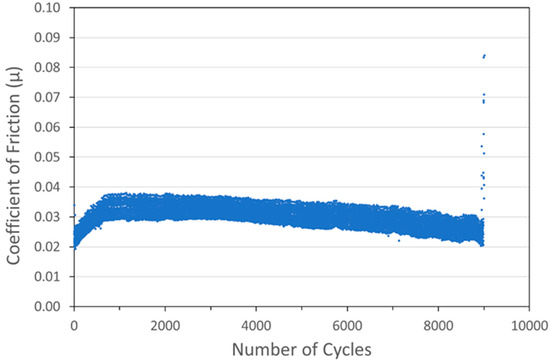
Figure 9.
Tribometry results on a Ni/MoS2 cold spray coating (with nominal MoS2 content of 80 wt%) on a 304 SS substrate. Testing was conducted in dry N2. A 10N normal load was used and the test was run until failure. The average Ni particle size range was 5 µm and the average MoS2 particle size was 15 µm.

Figure 10.
Tribometry results on a pure WS2 cold spray coating on a 304 SS substrate. Testing was conducted in dry N2. A 10N normal load was used and the test was run until failure. The average WS2 particle size was 100 nm.

Figure 11.
Tribometry results on a pure MoS2 cold spray coating on a 304 SS substrate. Testing was conducted in dry N2. A 10N normal load was used and the test was run until failure. The average MoS2 particle size was 15 µm.
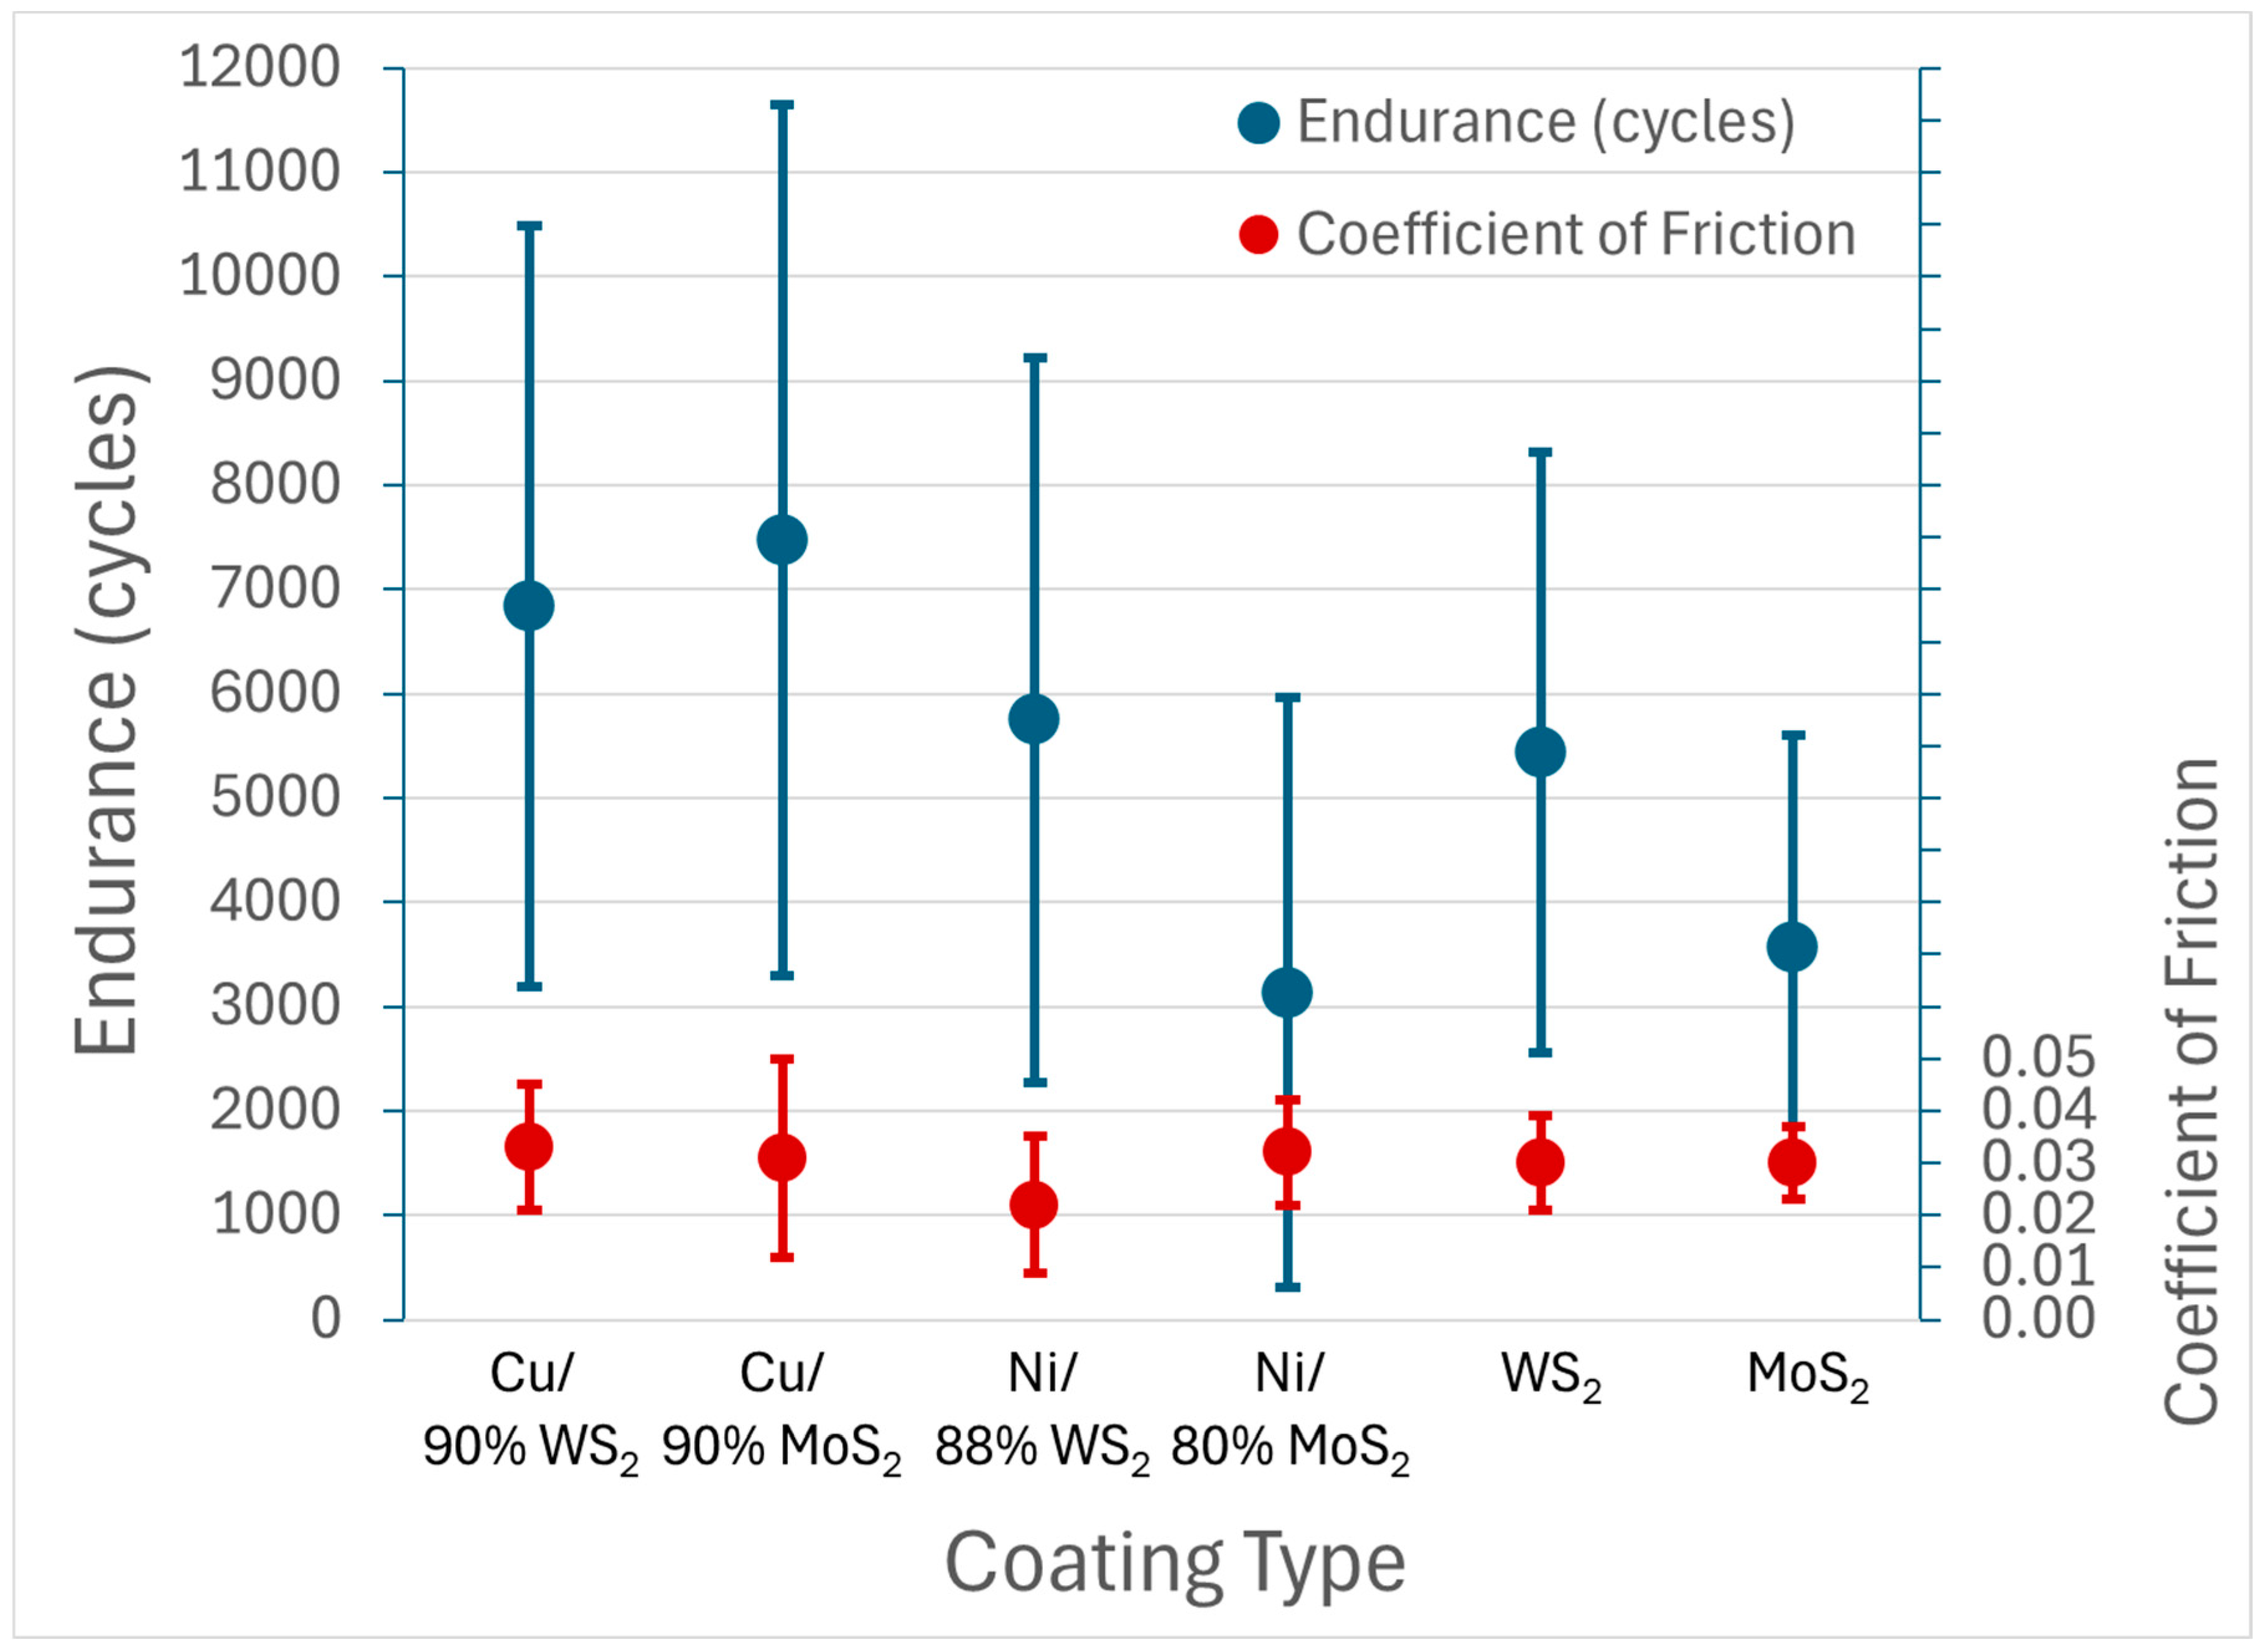
Average performance based on cycle life and steady-state COF for each coating type is summarized in Figure 12. All coatings exhibited average values in the range 0.02–0.03. The cycle life appeared somewhat better for the coatings using Cu or Ni additions than for the pure WS2 and MoS2 coatings, but definitive discrimination was difficult due to the magnitude of the data scatter. In any case, the data represent coatings that are competitive with other dry-film lubricant formulations, with low friction and significant endurance at a high Smax value of 1386 MPa (201 ksi).

Figure 12.
Summary of friction and endurance results for optimized cold spray solid lubricant coatings tested in dry N2 with a 10N normal load on the Anton Paar TRB3 tribometer. Results are based on samples of the same types shown in Figure 6, Figure 7, Figure 8, Figure 9, Figure 10 and Figure 11. Each data point represents 5 to 13 samples. Coating types show nominal composition, i.e., that represented in the initial powder mixture. Actual coating composition differed significantly, as discussed in the text.
To determine the amount of coating wear for each optimized coating formulation, we conducted tests with the Anton Paar tribometer at a fixed duration of 3000 cycles, which was prior to coating failure for all samples. This ensured that the wear calculations were for the coating only, and not for the underlying substrate, the latter of which would have been included if we ran the tests to failure.
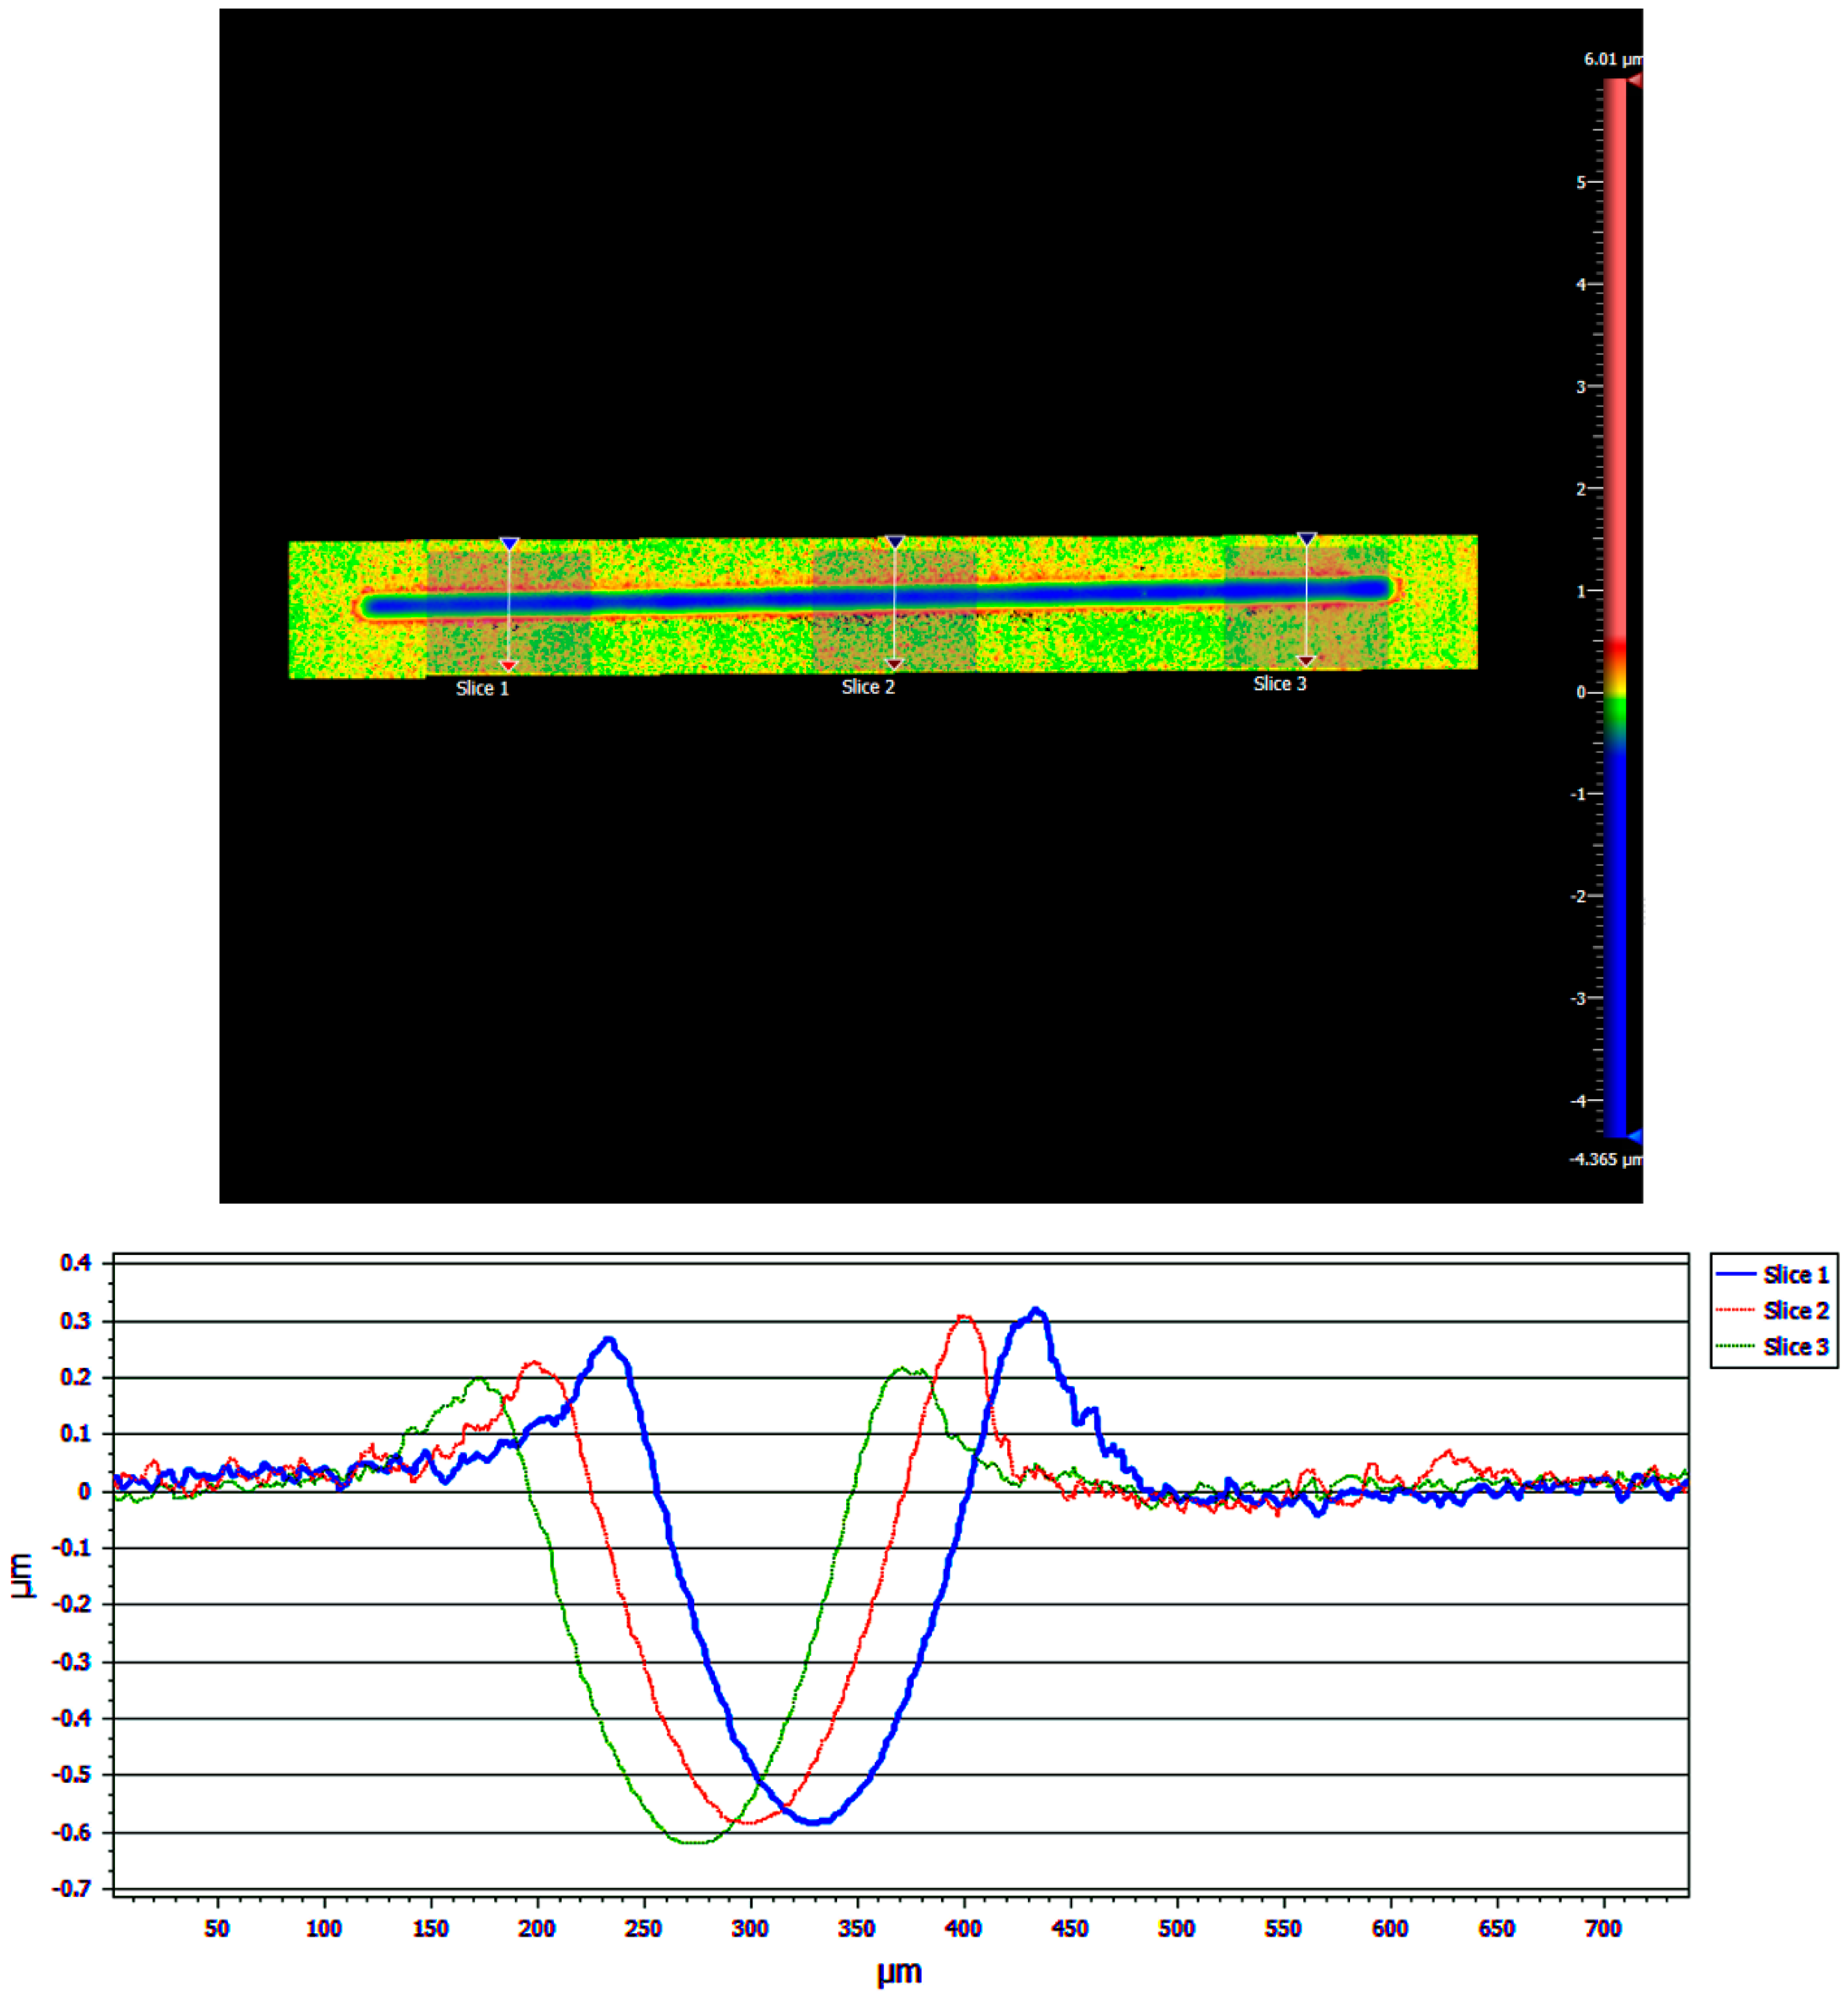
For each of these 3000 tests, profilometry of the wear tracks was obtained using WLI imaging. For each wear track, three scans were obtained at different locations across the wear track. For each, the difference between the depth of the scan in the wear track and the average height of the neighboring unworn areas was determined. The three resulting values were averaged to yield an average wear depth in the wear track. Wear widths were also measured, which averaged ~0.14 ± 0.2 µm for all samples.
Surface roughness values Sa and Sz were also calculated, both inside and outside the wear track. Sa is the standard arithmetic roughness averaged over the area of interest, while Sz is the average of the five largest peaks and valleys. Sz is useful because it provides a sense of the degree of large asperities in the contact region, which can be even more important than Sa in tribological contacts.
Results from the WLI imaging of one of the samples are shown in Figure 13. The blue line in the upper image represents the wear track, where the blue color represents a negative height due to wear, and these are the valleys seen in the three cross-sectional profile traces in the lower part of the figure. The green area is the level of the unworn coating, which was set arbitrarily to zero. The red areas next to the wear track represent positive heights and correspond to the raised “wings” in the profile traces in the lower part of the figure. These wings are likely worn coating material that has built up at the edges of the wear track. This material can act as a lubricant reservoir that can be cycled back into the contact region during sliding.
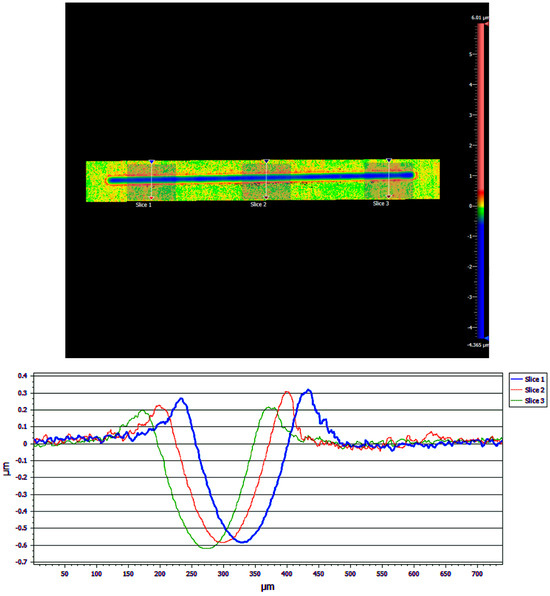
Figure 13.
Raw data are shown from the White Light Interferometry (WLI) Imaging for a 1 µm Cu/90% 100 nm WS2 coating tested for 3000 cycles (i.e., pre-failure). A false-color image (upper) is shown, where the colors represent height, with red the highest, green the level of the unworn coating, and blue within the wear track. Three lines are shown across the wear track where profile traces were obtained. The three traces are shown overlayed (lower). The areas outside the wear track are set to zero height, and the wear depth can be determined from the minimum of the curve.
Roughness and wear results for the samples analyzed by WLI imaging are shown in Table 1. The Sa values were very small in the unworn areas outside the wear track. In contrast, the Sz values were large outside the wear track. These values describe an unworn coating that is very smooth on average but has a few large asperities. Sz was larger for the coatings that contained MoS2, which is consistent with the larger particle size used in the feedstock. Although the coatings were enhanced in the smaller particle sizes, the larger MoS2 size distribution resulted in the presence of a few large particles remaining.

Table 1.
Wear depth and surface roughness results on wear scars obtained using White Light Interferometry (WLI) imaging. Data in this table represent tests limited to 3000 cycles (i.e., pre-failure).
Inside the wear track, the Sa values increased slightly but were still relatively small. In contrast, the Sz values were significantly reduced after wear. The decrease in the Sz values may be explained by burnishing of the few larger lubricant particles during the run-in period. There appeared to be a small average increase in Sa after testing, although it decreased for a few samples. The variation is likely not statistically significant.
In general, the variation of Sa and Sz values for the samples may partially explain the large variation in cycle life seen in Figure 12.
Average wear rates can be determined from the wear depth results. Assuming that the cross-section of each wear track is a circular arc, the cross-sectional area can be estimated, which can be used to find the specific wear rate in units of mm3 N−1 m−1 [16,17]. The results are shown in the last column of Table 1. The assumption of a circular cross-section is supported by the lack of apparent wear of the spherical ball surface, as discussed below. In addition, a circular model provided a good fit to the wear track cross-section data.
The specific wear rates were all in the 10−6 range, which is much smaller than those for non-lubricating materials, such as metals and ceramics, and is typical for solid lubricant coatings [18]. Differences between wear rates of various coatings were relatively small and did not correlate with coating composition.
The contact regions of some of the balls used in the 3000-cycle tests were examined by optical microscopy, since changes in surface quality due to wear would be readily apparent on the surfaces of the highly polished balls. The surfaces appeared shiny, with some additional material that was likely a thin transfer film. No evidence of abrasive or adhesive wear was seen, which would have been observed as a non-reflective surface with multiple parallel lines or a distinctive galling pattern, respectively [19]. A microscope image of the ball used in one of the tests of the 1 µm Cu/90% 100 nm WS2 is shown on the left side of Figure 14. The contact region appeared as one would expect from a solid lubricant ball-on-flat test. There was no apparent wear in the center of the contact region (the darker elliptical area). The material surrounding the center of the contact region is likely transfer material from wear of the coating (the third body, as discussed above). A microscope image of the ball used in the 100 nm WS2 3000-cycle test is shown on the right side of Figure 14. Again, there was no apparent wear in the center of the contact region, and transfer material from wear of the coating surrounded this region. Further analysis using optical profiling techniques, such as WLI, could have provided a more quantitative measure of the presence or absence of wear but was not conducted in this study.

Figure 14.
Optical images of ball counter-faces from a 3000-cycle test of a 1 µm Cu/90% 100 nm WS2 coating (left) and a 100 nm WS2 coating (right). The ball contact region is shown with a blue arrow. The orange and white features are lighting artifacts. WS2 contents refer to nominal composition based on the initial powder feedstock.
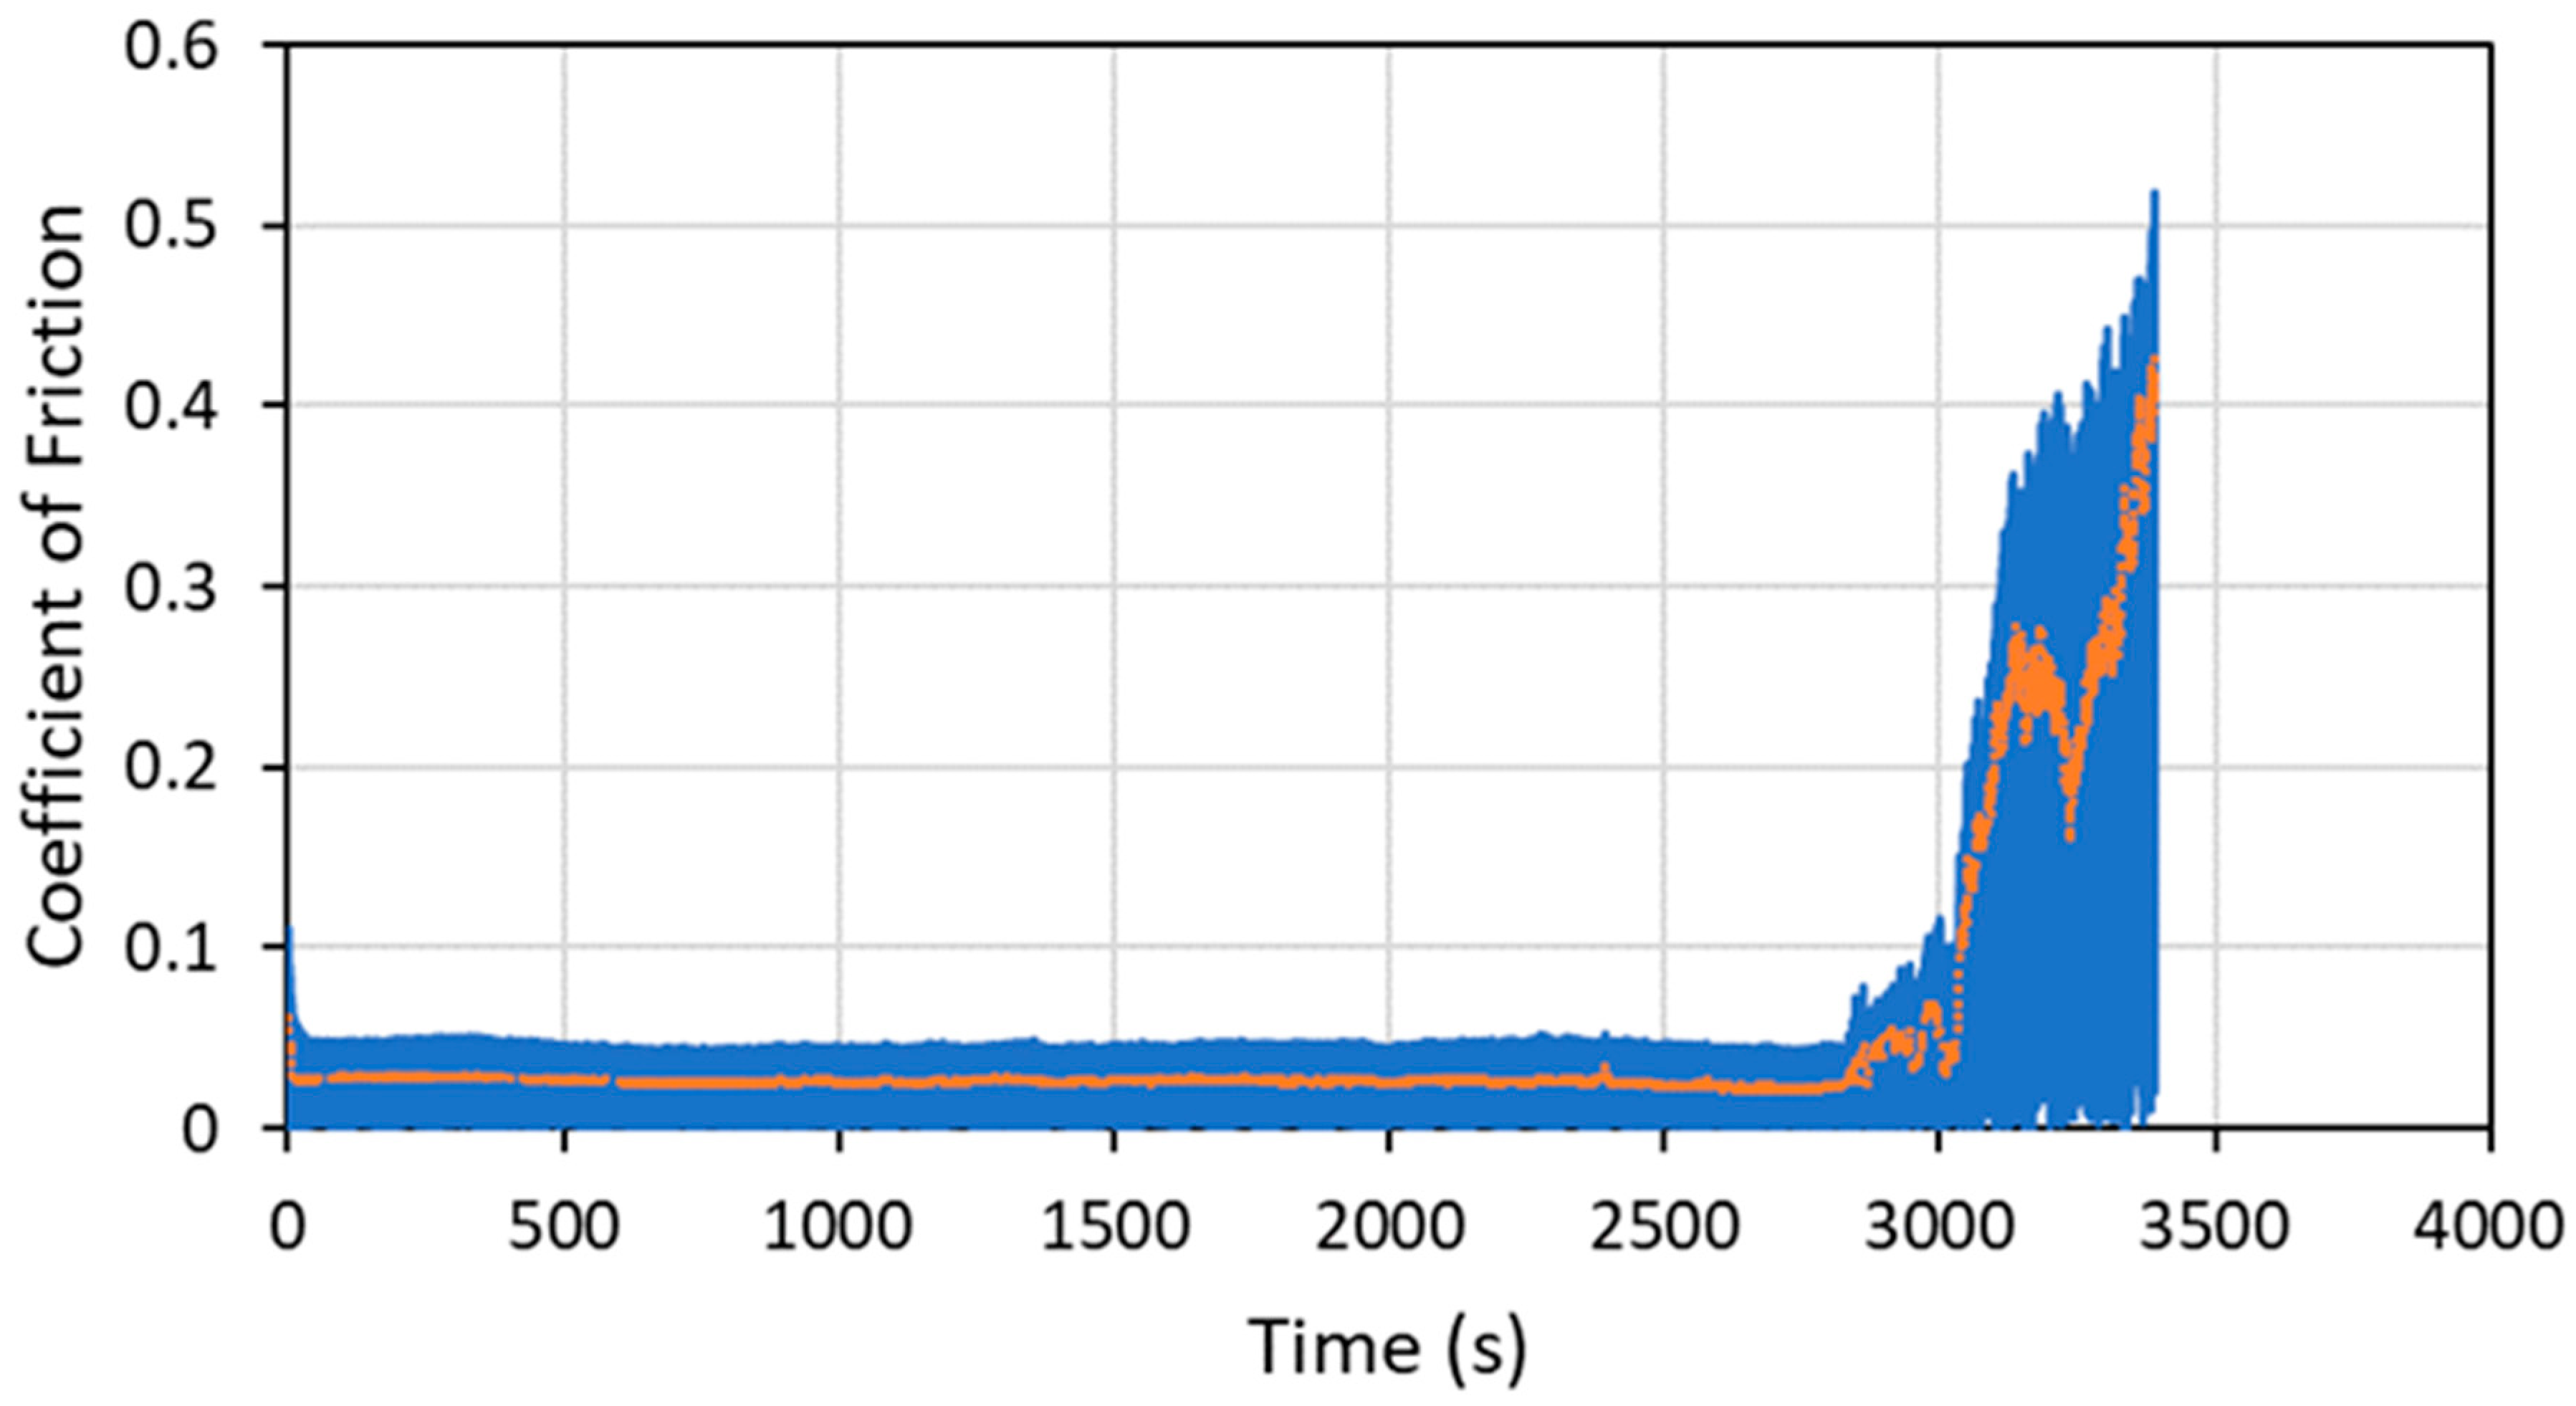
To demonstrate the performance of the coatings in a more space-like environment, ball-on-flat tribometry was conducted on several coating formulations in a vacuum (3.5 × 10⁻⁴ Torr or 0.047 Pa) using an RTEC Vacuum Linear Reciprocating Tribometer. Vacuum testing was designed so that the loads and contact geometry (especially Smax) were close to those used in the N2 testing in the Anton Paar tribometer. Typical vacuum tribometry data are shown in Figure 15 for a pure WS2 cold spray coating on a 304 SS substrate.
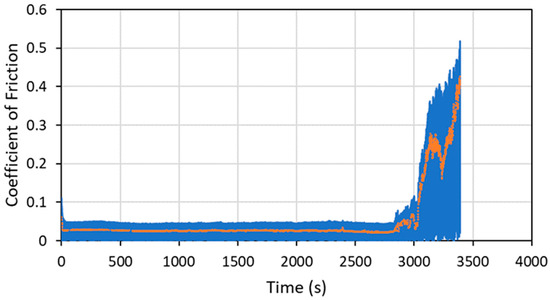
Figure 15.
Tribometry results on a pure WS2 cold spray coating on a 304 SS substrate tested in a vacuum of 0.047 Pa (3.5 × 10⁻⁴ Torr). An 11.2N normal load was used (which matches the Smax value for the N2 testing within 0.5%), and the test was run until failure. The average WS2 particle size was 100 nm. The raw data are shown in blue, and a smoothed average of the data is shown in orange. The ordinate is in time units, and failure occurred at about 2800 cycles.
A summary of the vacuum tribometry results is shown in Table 2, along with previous data obtained in dry N2 for those samples. The average friction values in the vacuum were similar to those for the N2 testing, within the expected data uncertainty for these tests (as shown by the lengths of the error bars in Figure 12). In contrast, the endurance/cycle life for most of the coatings tested in the vacuum was markedly lower than for those tested in N2. This is not surprising, since it is well documented that wear lives of MoS2-based solid lubricants are higher in dry N2 compared to vacuum [20,21]. MoS2 wear particles form a third body that can act as a beneficial reservoir of lubricating material that is cycled back into the contact region. The N2 is thought to be incorporated into MoS2 wear particles—possibly as adsorbed molecules—influencing their plastic and shear properties as a third body so as to increase the wear life. WS2 likely exhibits similar behavior, since WS2 and MoS2 have very similar crystallographic and electronic structures, as well as chemistry [1].

Table 2.
Comparison of results from tribo-testing in a vacuum and dry N2. Vacuum testing was conducted at the Aerospace Corporation, and endurance and COF results were averaged between two tests. N2 testing was conducted at Applied Tungstenite and represents single test results.
3.2. Coating Characterization
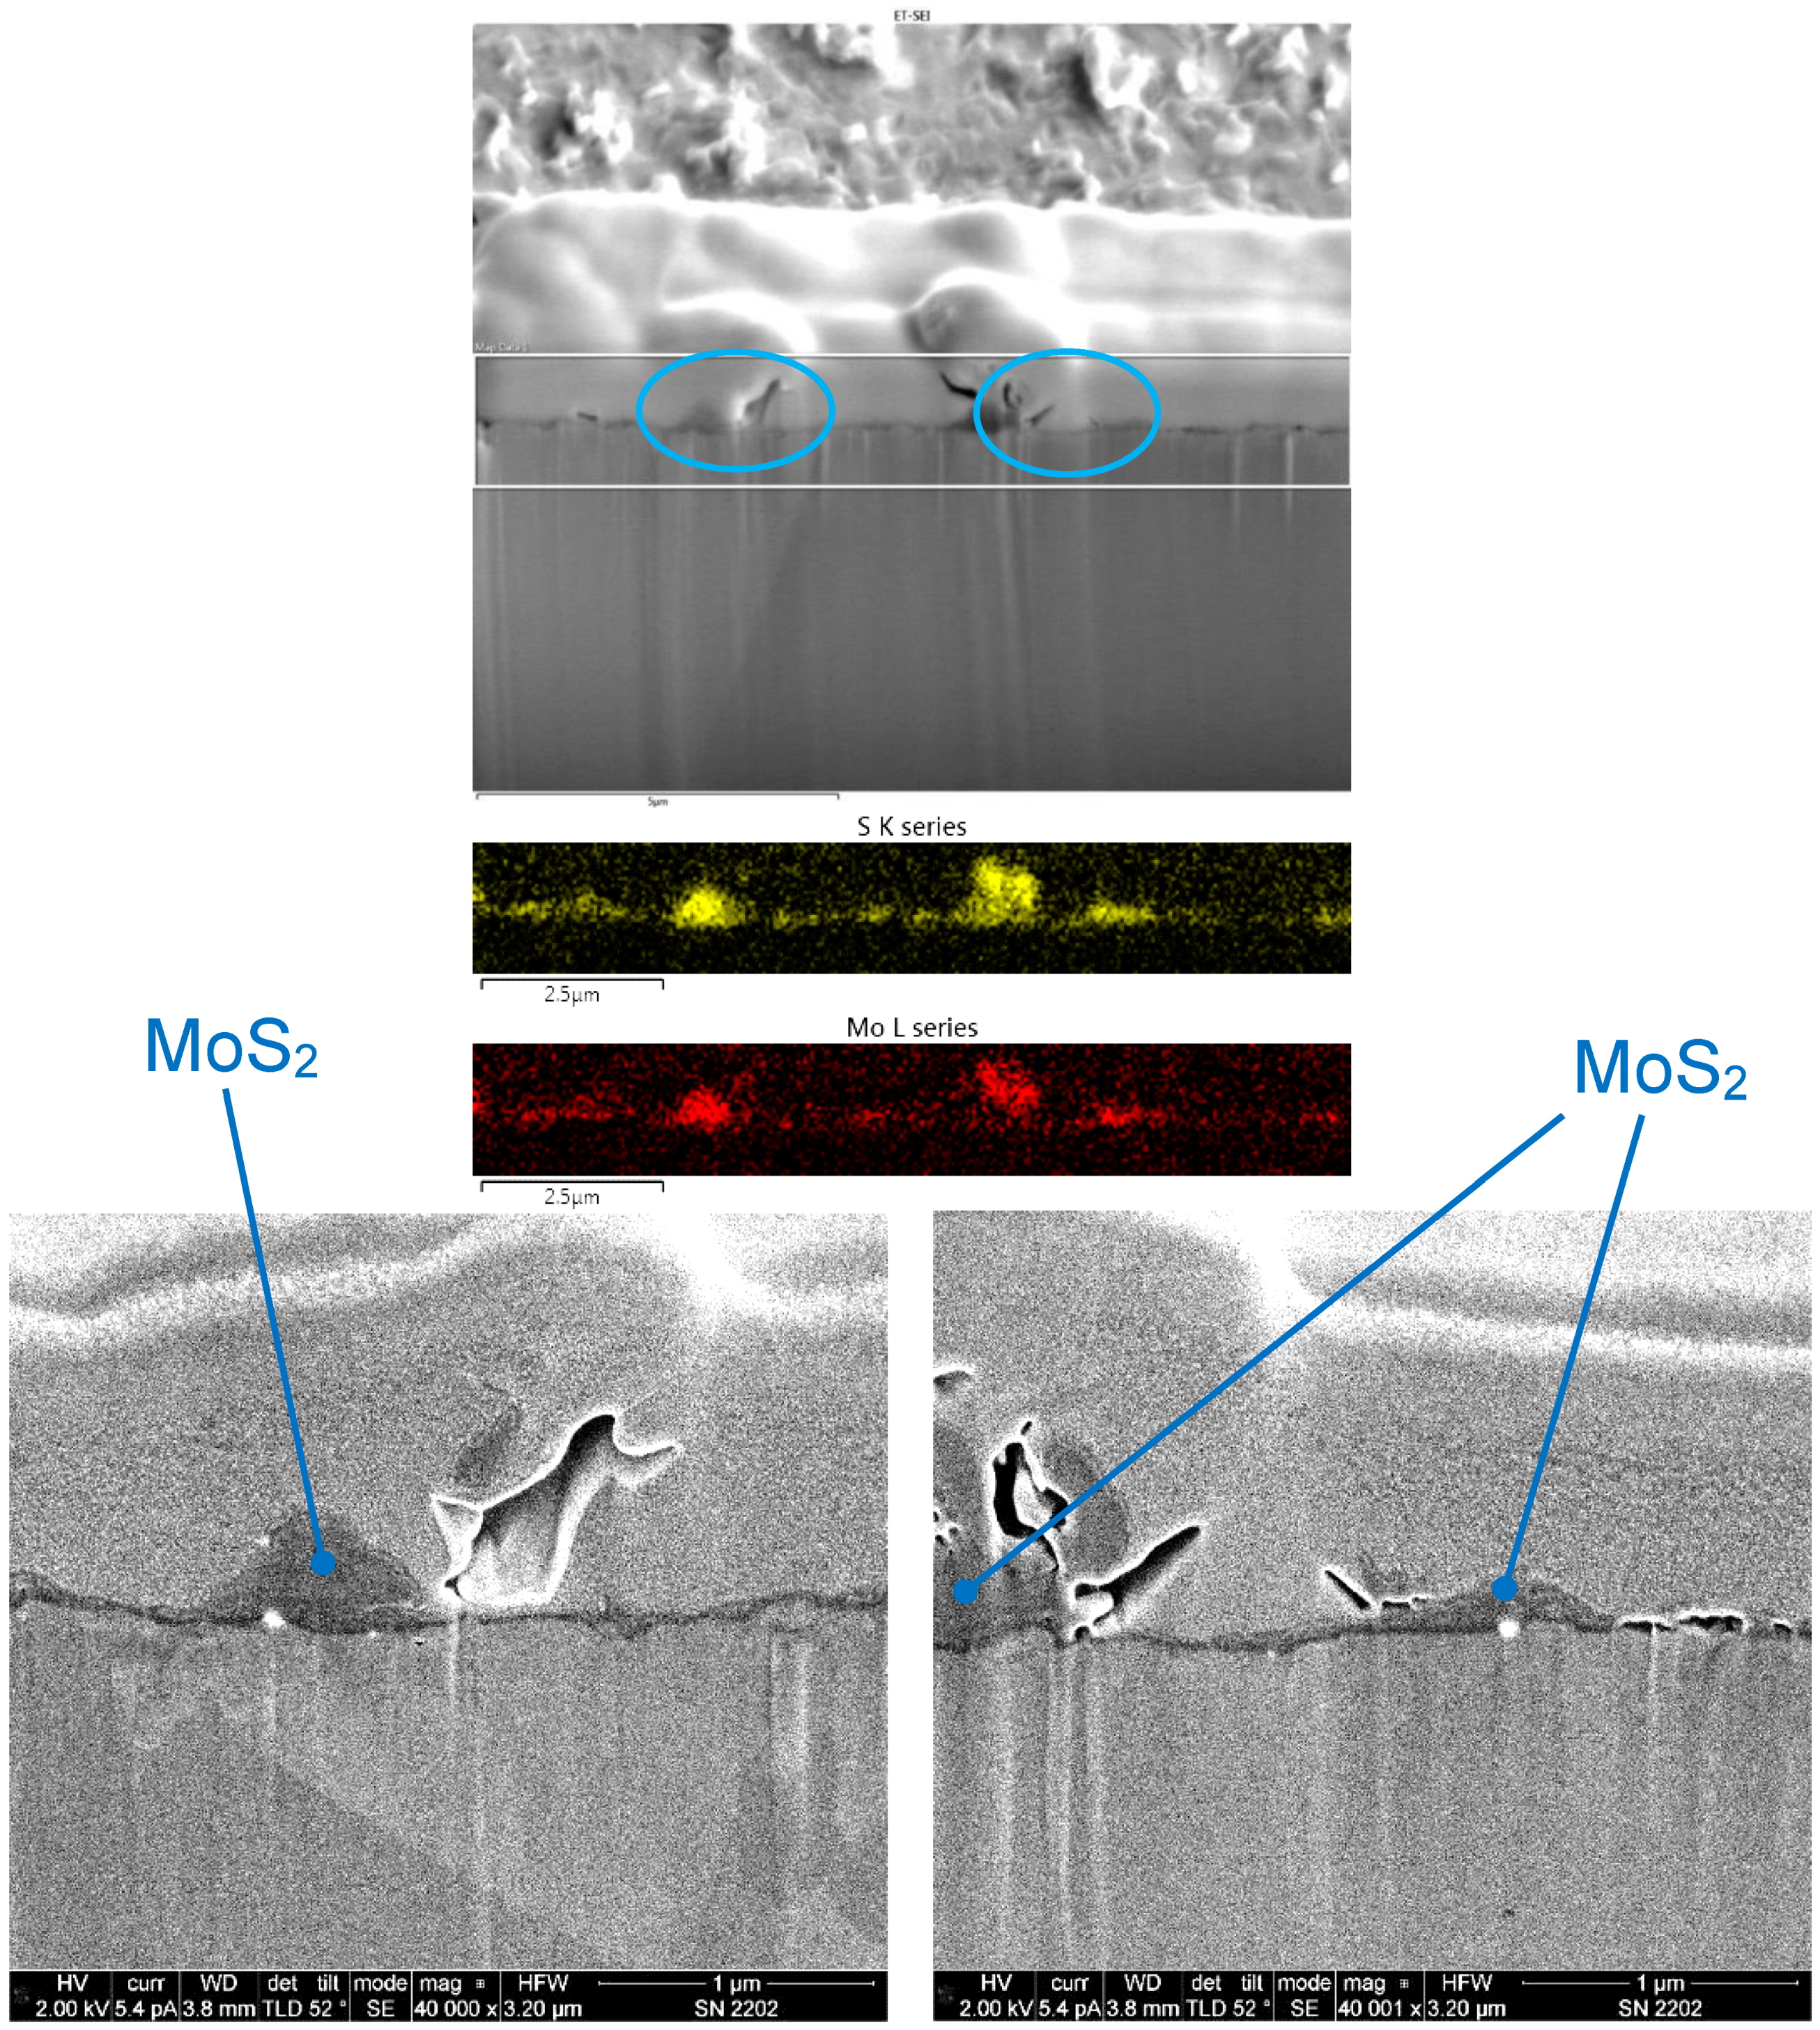
Cross-sections of representative coatings were obtained using the FIB technique. The resultant cross-sections were then analyzed using SEM and EDX, enabling determination of the thickness of the coatings as well as the thickness variation (i.e., morphology) and distribution of elements within the coating.
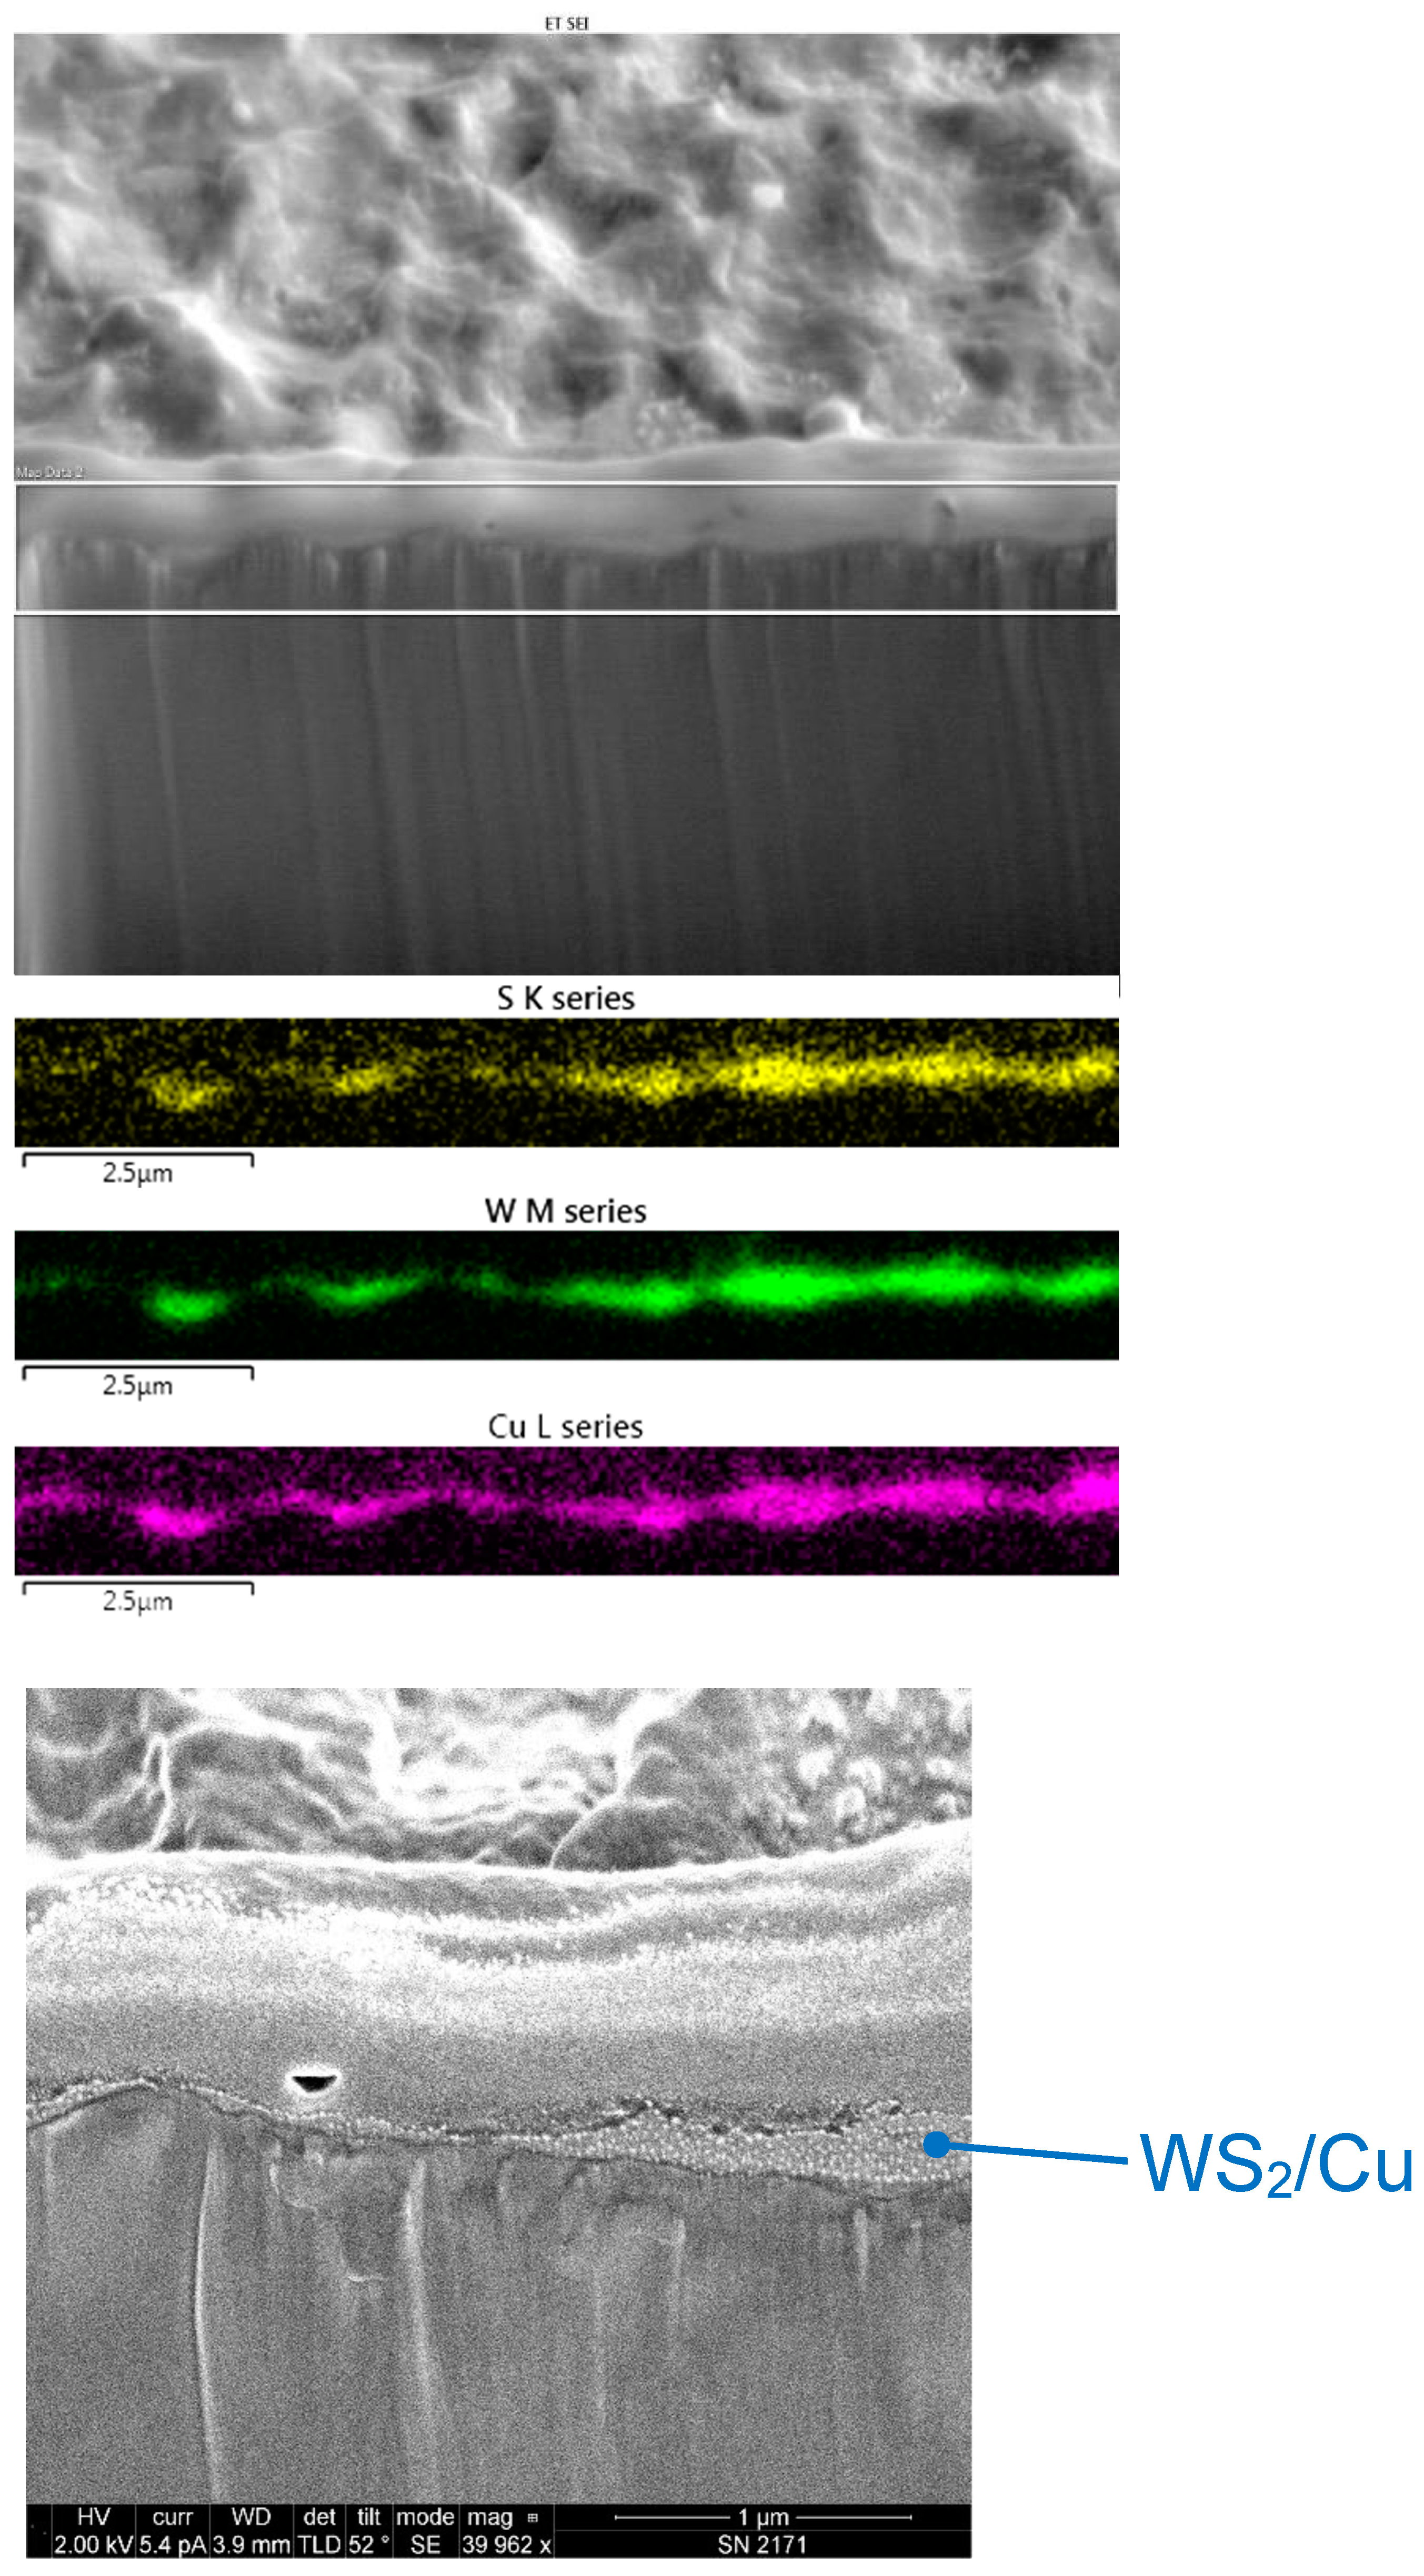
Figure 16 shows an SEM image of a FIB cross-section of Cu/WS2, cold sprayed from a feedstock mixture of 1 μm Cu with 80 wt% of 24 μm WS2. The coating is within the two horizontal white lines on the image, between the lower darker region representing the substrate, and the upper lighter region representing a platinum film that was deposited to protect the surface during the FIB sectioning. Also shown in the figure are EDX false-color maps that each represent different elements, which enables facile visualization of the coating. Specifically seen are S from WS2, W from WS2, and Cu. The color intensity has been enhanced so that the Cu layer is seen clearly, even though XRF showed that it was only present in amounts of a few weight percent.

Figure 16.
Scanning electron microscope (SEM) image of a focused ion beam (FIB) cross-section of a coating made from a nominal mixture of 1 μm Cu with 80 wt% of 24 μm WS2 (top). The region within two horizontal white lines represents the area where energy-dispersive X-ray (EDX) maps were obtained (middle). Yellow represents S from WS2, green is W from WS2, and magenta is Cu. Also shown is a higher-magnification SEM image of the region in the blue oval in the top SEM image, showing the Cu-WS2 coating (bottom).
The coating was shown to be thin, with an average thickness of ≤1 μm. In addition, there was considerable thickness variation. However, based on the map resolution, it cannot be discerned if all areas of the substrate surface were covered with coating species. The surface analysis presented below will help in this regard.
The EDX maps indicated that the Cu appeared to be distributed in the same regions as the WS2, without showing phase separation on the micron scale. This was surprising because the average size of the Cu particles used in the feedstock was 1 μm, which is similar to the coating thickness. This can be explained by the fact that the Cu in the feedstock was present in a size distribution: the cold spray process apparently favored smaller particle sizes to be incorporated in the coating. This was even more striking for the WS2, whose feedstock had a significantly larger average size (24 μm) than the Cu, and much greater than the coating thickness. Here, again, smaller particles sizes were incorporated in the coating from the distribution, impacting the surface. For the WS2, this may not be as dramatic as it seems, because the 24 μm value refers to the width of the particles. Because of their anisotropic crystal structure, particles are generally formed in platelets with a much smaller thickness than width. As a result, films with a thickness much less than the particle width can form if the articles align with their long dimension oriented along the surface.
Using the EDX maps as a guide, the regions within the SEM images corresponding to the coating species could be identified. At the bottom of Figure 16, a higher-magnification SEM image is shown of the surface region obtained from the region in the top image located by a blue oval. The area representing the Cu-WS2 coating in the cross-section appeared homogeneous, in agreement with the distribution seen in the EDX maps.
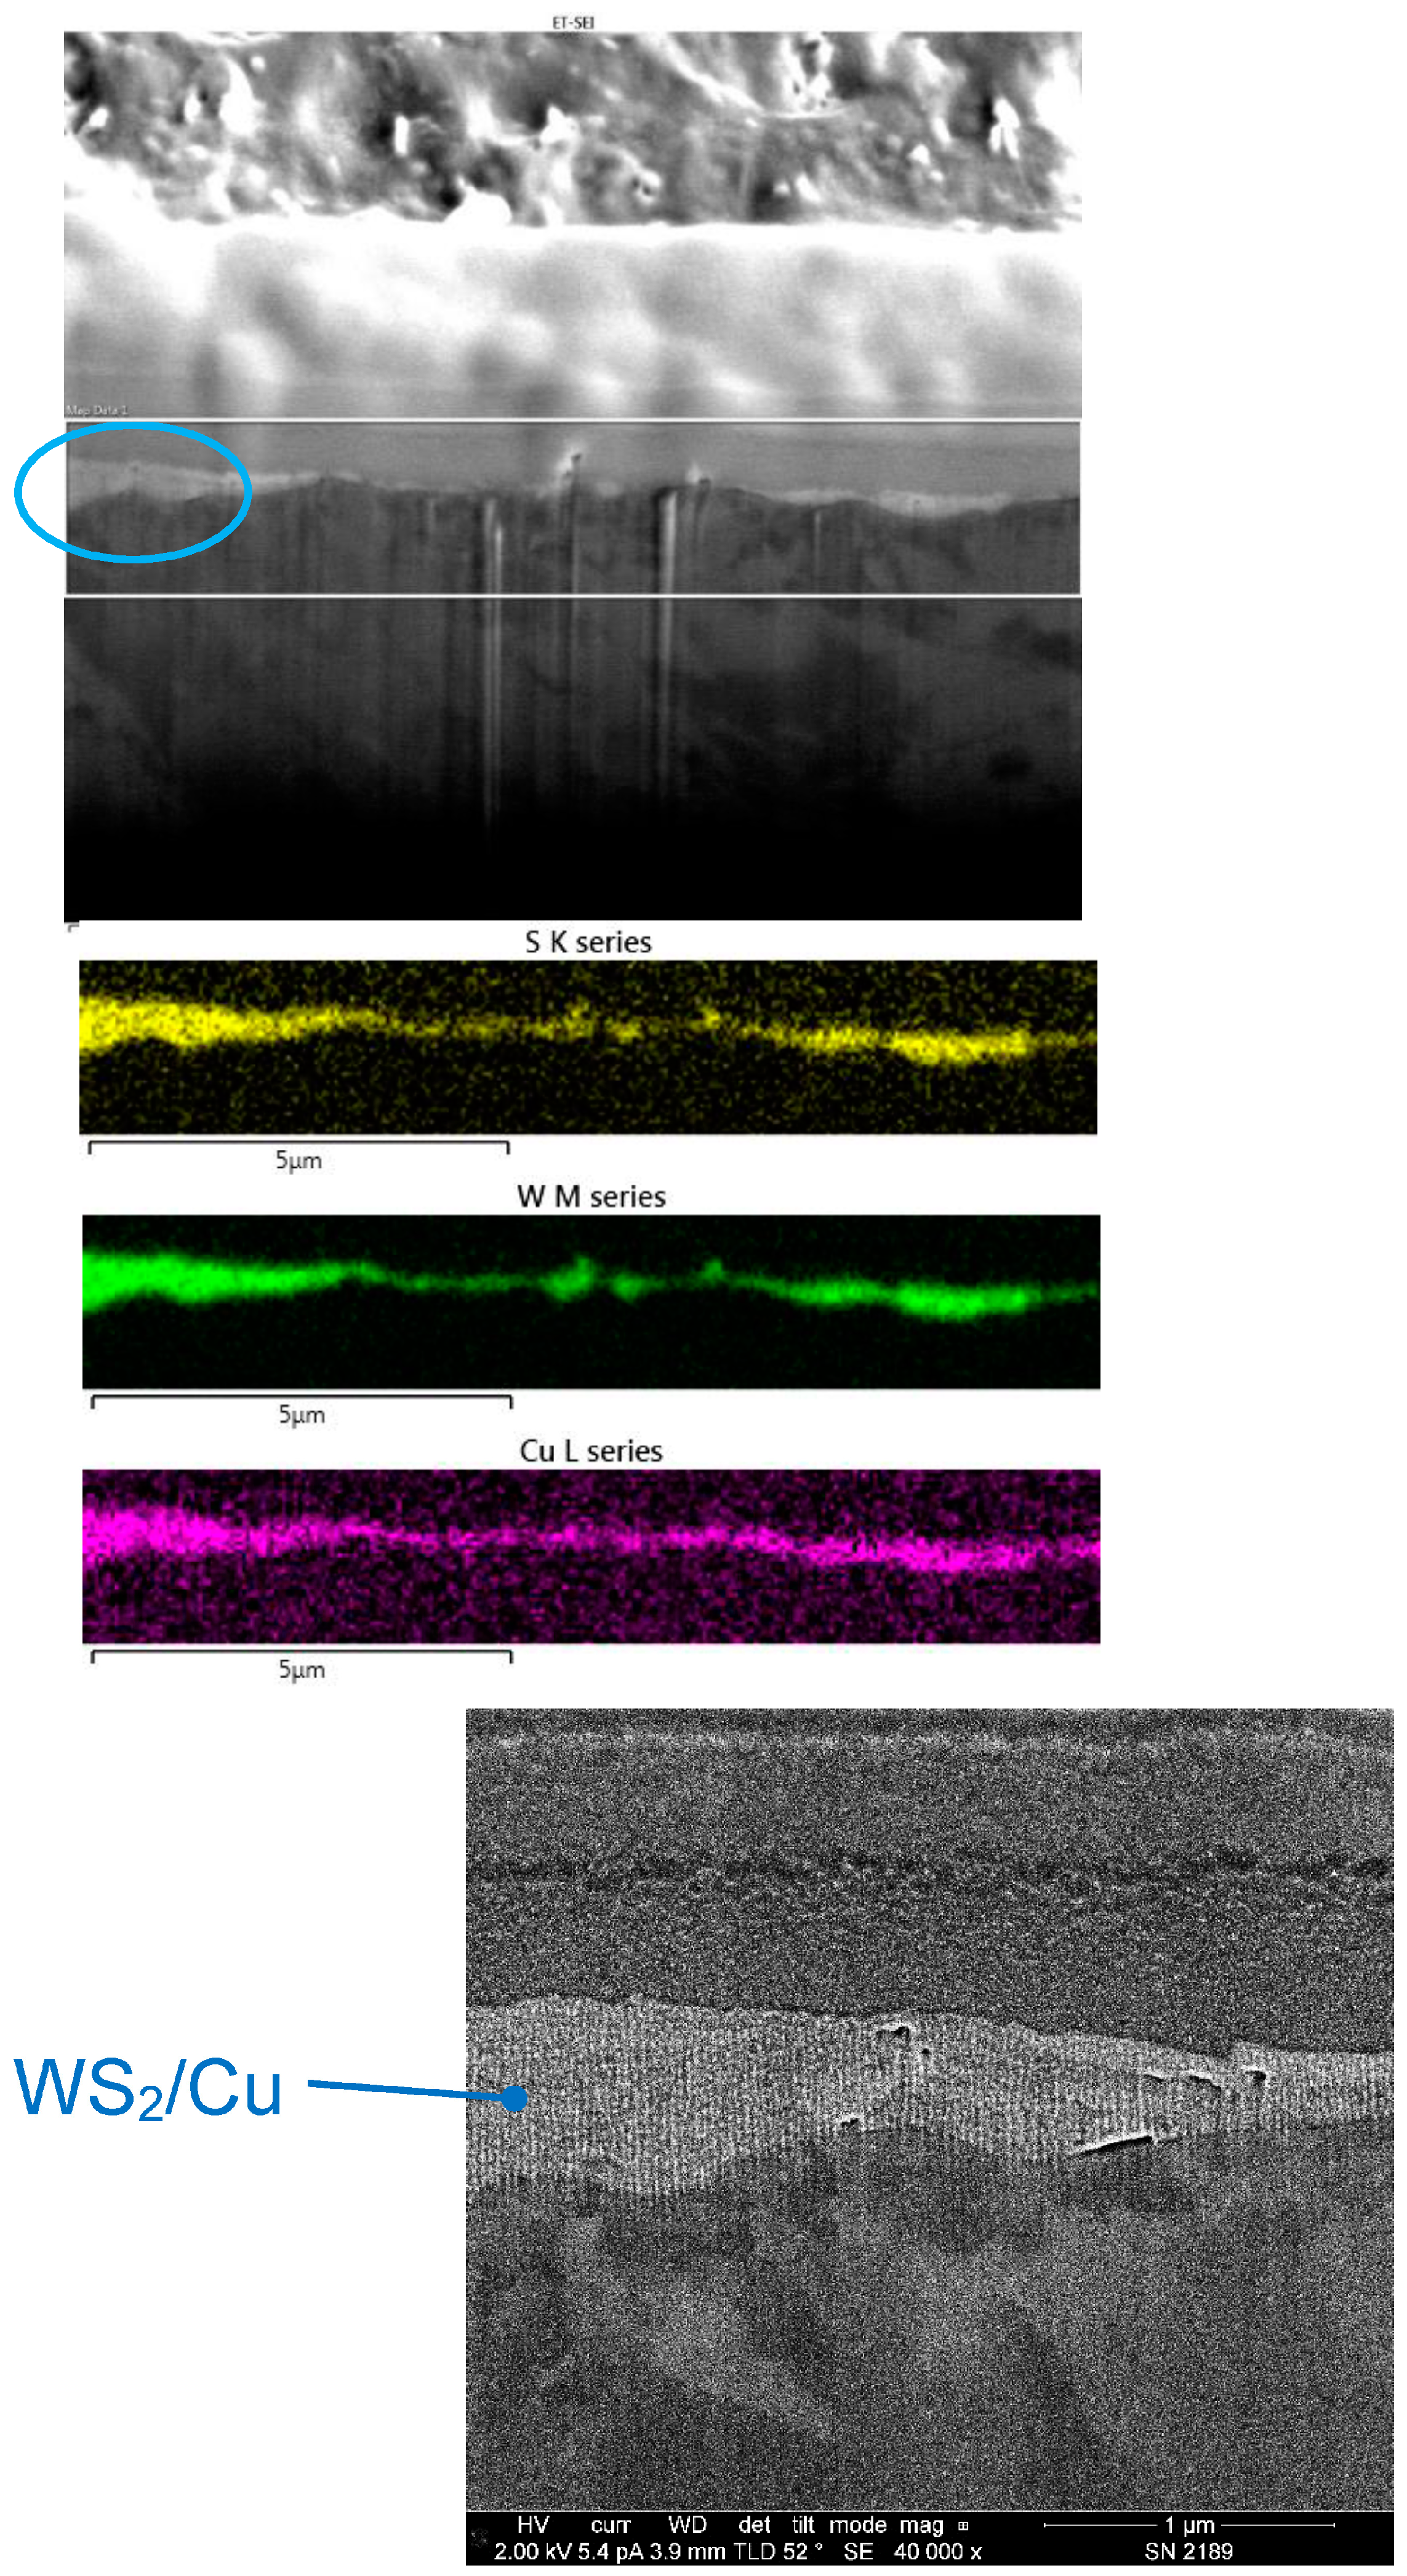
Figure 17 shows an SEM image of a FIB cross-section of a Cu/WS2 coating that was cold sprayed from a feedstock mixture of 1 μm Cu with 90 wt% 100 nm WS2 (i.e., with a greater nominal amount of WS2 than the coating shown in Figure 16, but with much smaller WS2 particles). The EDX maps for this coating showed that it was qualitatively similar to the one in Figure 16, with thickness ≤ 1 μm, significant thickness variation, and homogeneous distribution of Cu with the WS2. A higher-magnification SEM image is shown, which is located within the blue oval in the upper SEM image. Again, the coating material in this image appeared homogeneous, although with a few small inclusions on the right side of the material. These inclusions were not analyzed further, so it is not known if they are due to chemical variations or voids in the coating.

Figure 17.
SEM image of a FIB cross-section of a coating made from a nominal mixture of 1 μm Cu with 90 wt% 100 nm WS2 (top). The region within the two horizontal white lines represents the area where EDX maps were obtained (middle). In the maps, yellow represents S from WS2, green represents W from WS2, and magenta represents Cu. Also shown is a higher-magnification SEM image of the region shown in the blue oval in the top SEM image, showing the Cu-WS2 coating (bottom).
Figure 18 shows an SEM image of a FIB cross-section of an MoS2 coating that was cold sprayed from a feedstock containing 15 μm-diameter MoS2 powder. The EDX maps for this coating showed that it was ≤1 μm in thickness, with greater thickness variation than the Cu/WS2 coatings shown in Figure 16 and Figure 17. In two higher-magnification SEM images, located within the blue ovals in the upper SEM image, regions of greater coating thickness are seen.
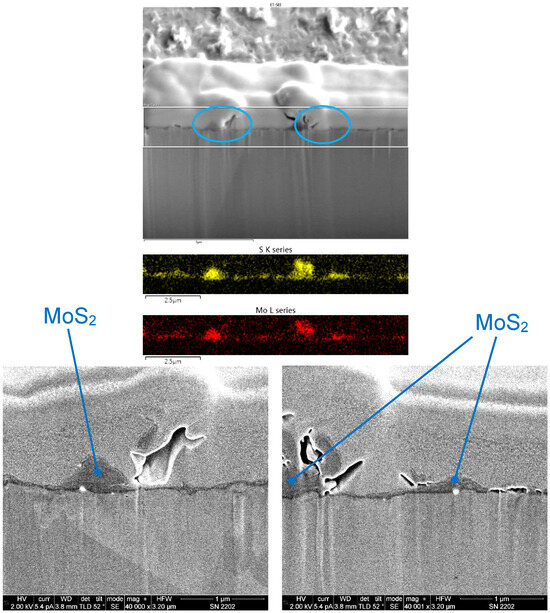
Figure 18.
SEM image of a FIB cross-section of a coating made from a 15 μm-diameter MoS2 powder (top). The region within the two horizontal white lines represents the area where EDX maps were obtained (middle). In the maps, yellow represents S from MoS2 and red represents Mo from MoS2. Also shown are two higher-magnification SEM images of the regions shown in the blue ovals in the top SEM image, showing the MoS2 coating (bottom).
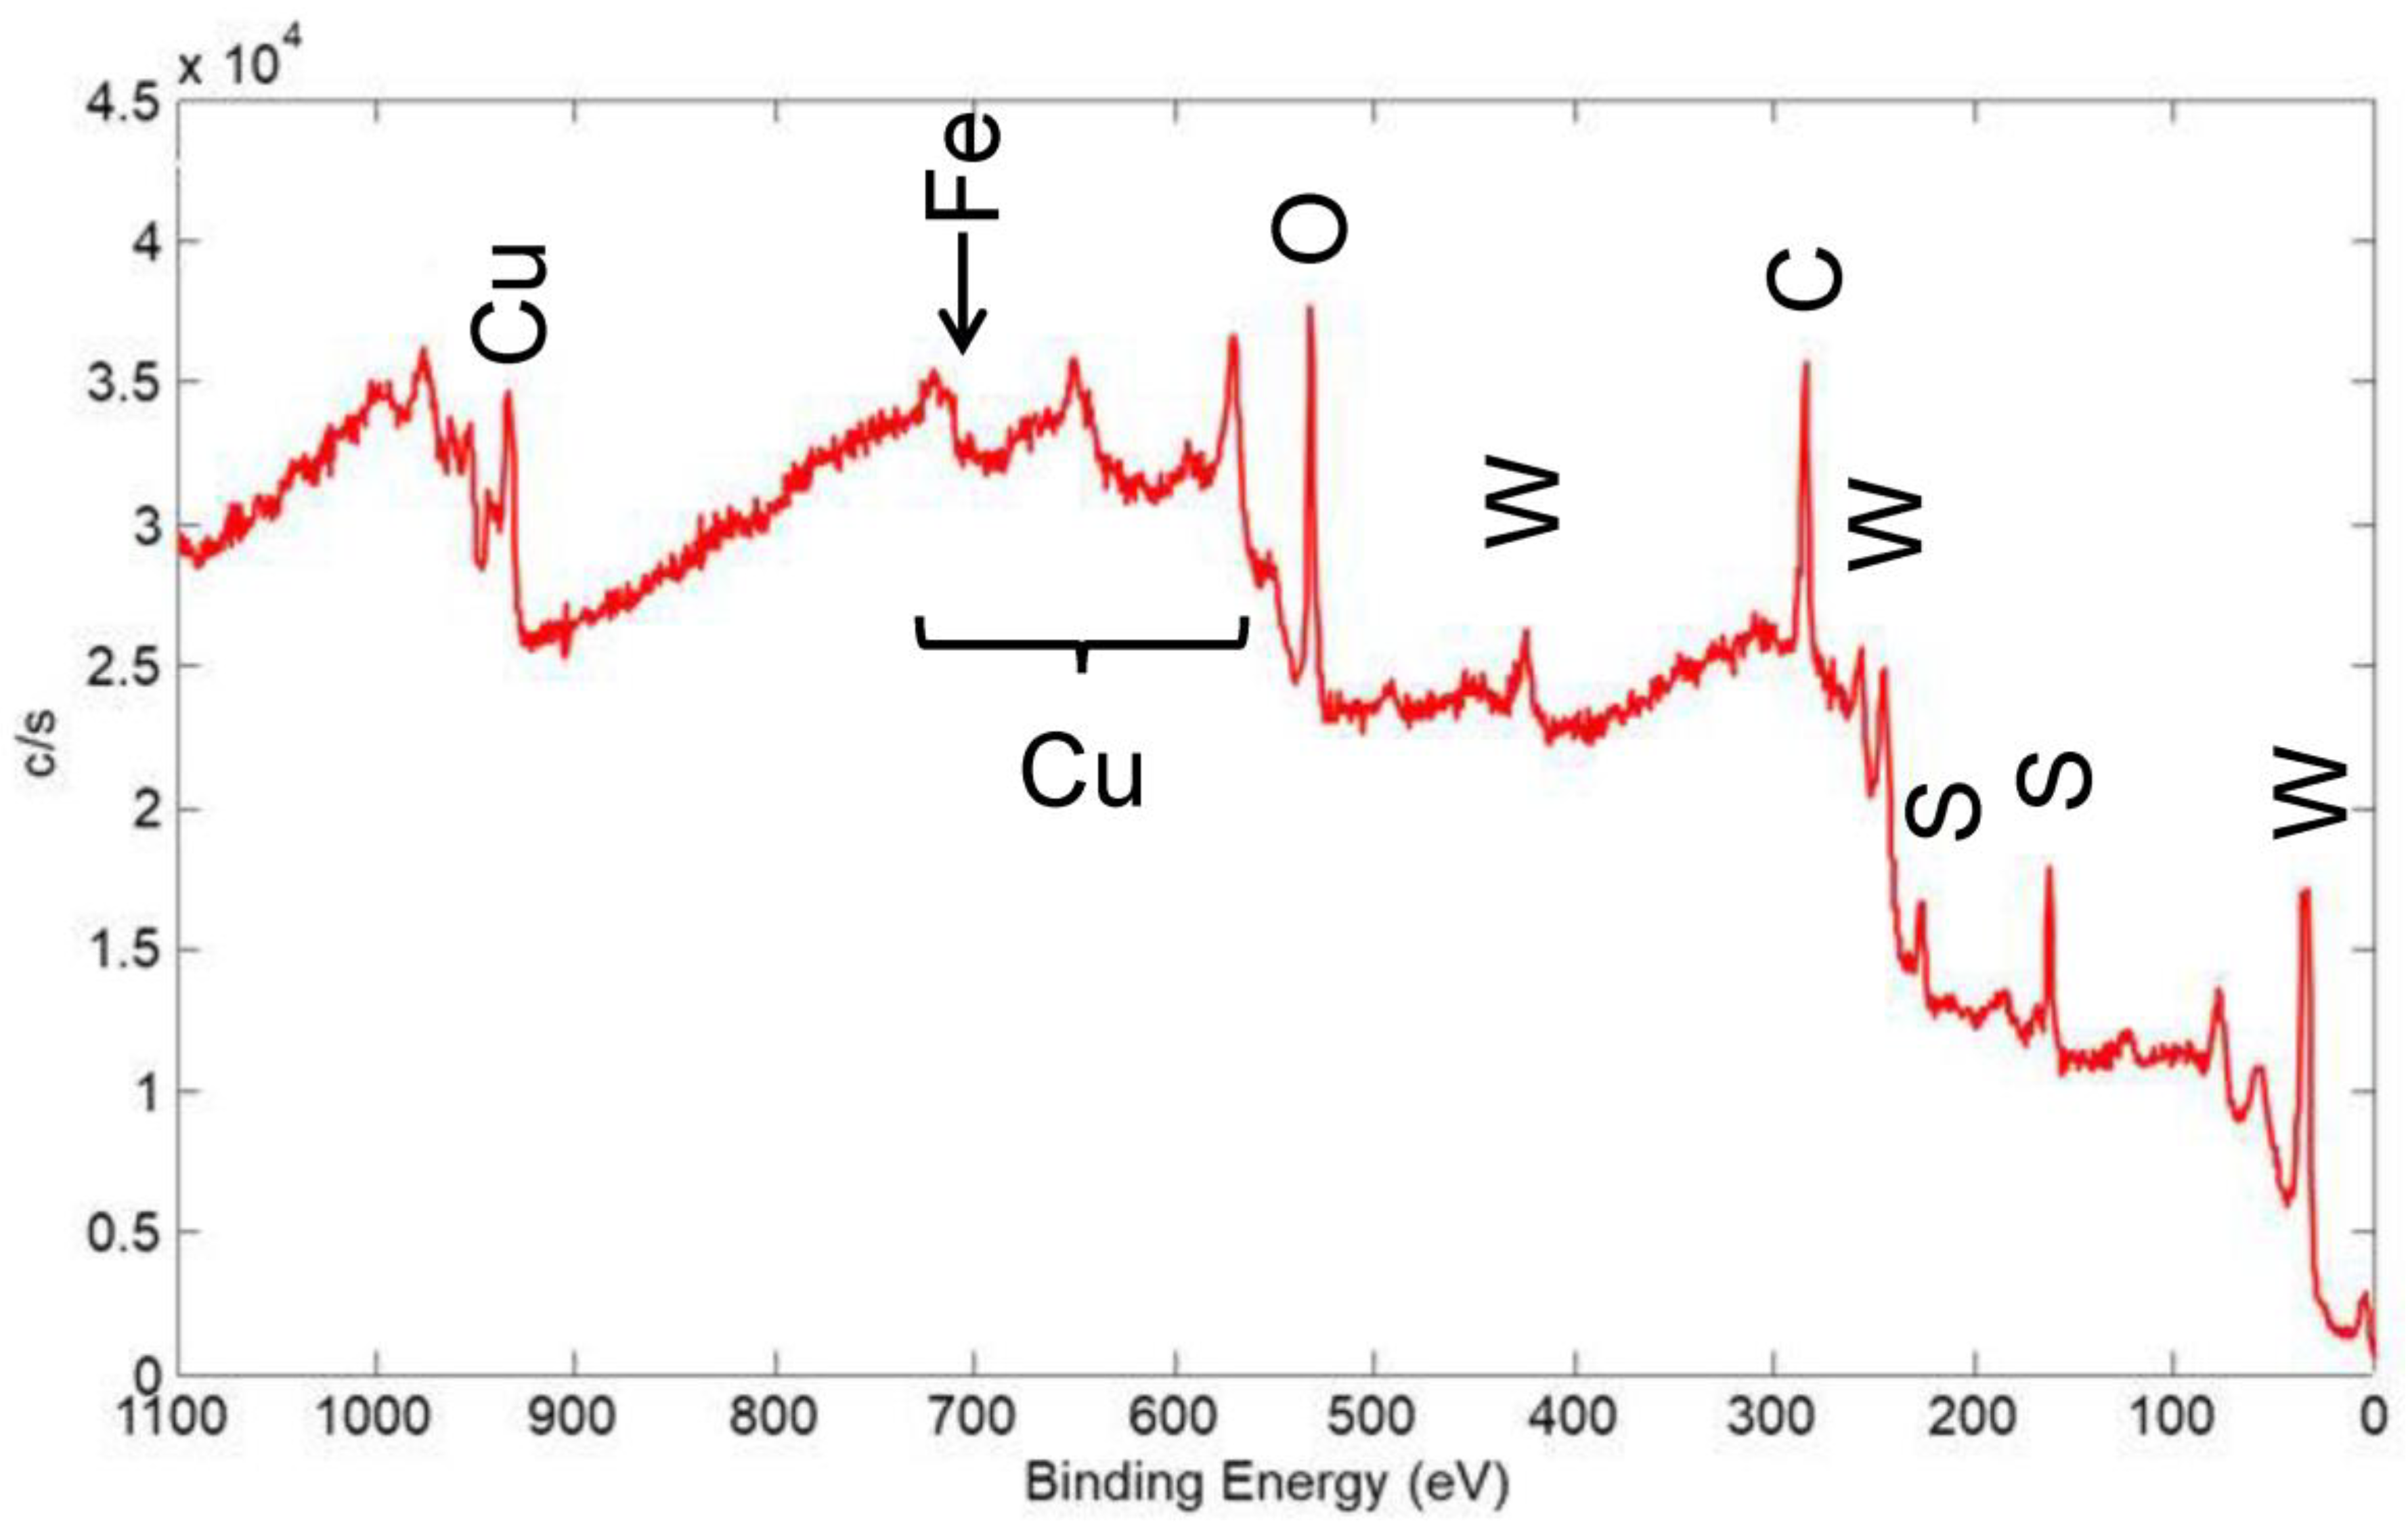
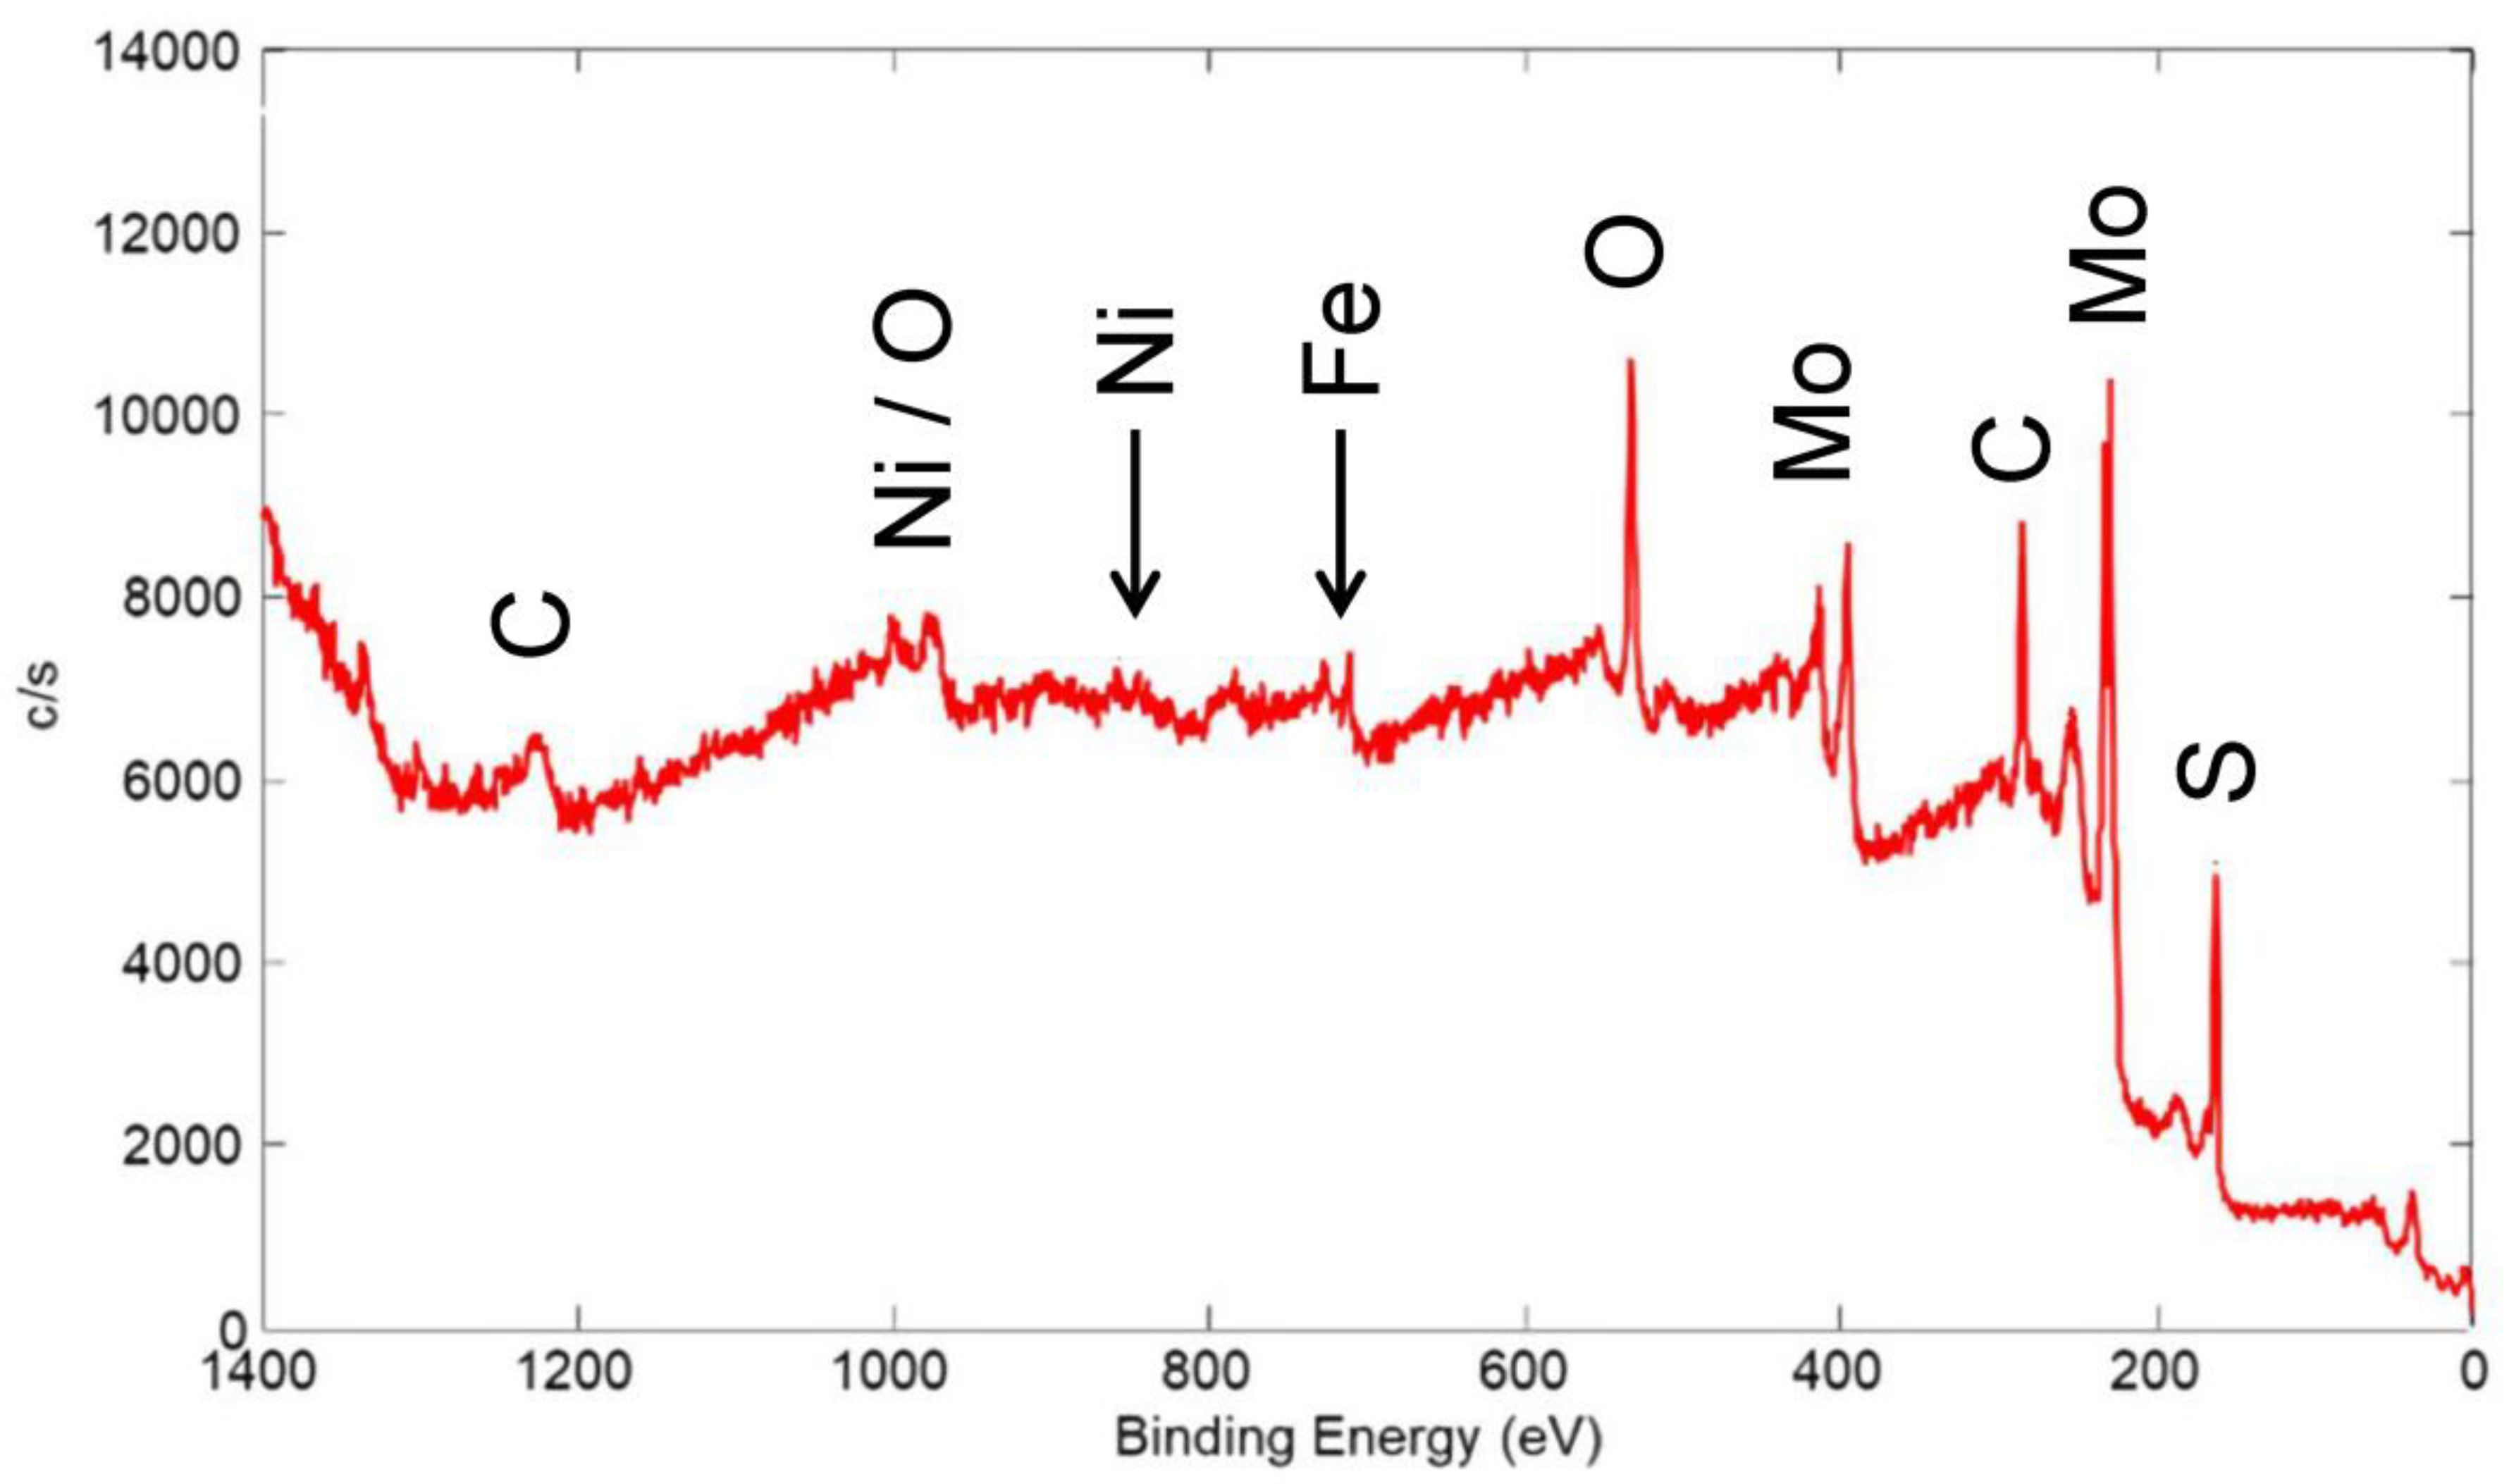
XPS spectra were acquired for several coatings to determine the elements present on the surface and their chemical state. In addition, the surface sensitivity of XPS helped in determining the coating coverage on the substrate surface. In Figure 19, an XPS wide scan of the surface of a coating made from a nominal mixture of 1 μm Cu with 90 wt% 100 nm WS2 is shown, and this coating was similar to the one represented in Figure 17. The spectrum showed the expected presence of the constituents of the coating, including Cu, W, and S. It also showed C and O that were from adsorbed contaminant species usually seen on the surface of air-exposed materials: the C is adventitious carbon, usually due to adsorbed organic species, while the O is from adsorbed H2O and other oxygen-containing molecules, as well as oxidation products of the coating materials.
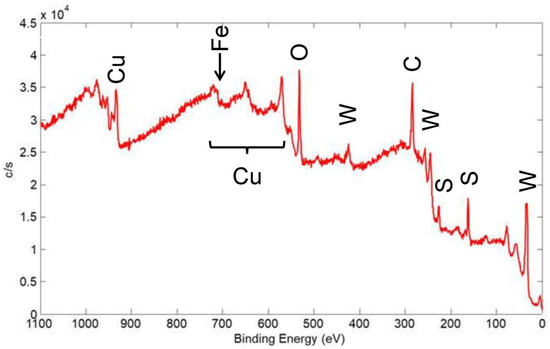
Figure 19.
XPS wide scan of the surface of a coating made from a nominal mixture of 1 μm Cu with 90% 100 nm WS2, similar to the coating shown in Figure 17. Primary photoelectron peaks of the detected species are labeled.
The Cu content (as a percent of the coating constituents Cu, W, and S) was 27 at%, which is equivalent to 22 wt%. This is significantly higher than the bulk value of ~1 wt% that was calculated by XRF. The mean escape depth (MED) calculated for the Versaprobe XPS instrument setup for Cu was 0.7 nm [22], whereas XRF probed the entire thickness of the coating. As such, Cu appeared to be significantly enhanced at the surface of the coating.
In the cold spray technique, the temperature of the powder-laden gas jet and the temperature of the powder material were low enough to prevent a phase change or stress in the deposit or substrate. As such, the surface enhancement of Cu was likely not due to chemical reaction of Cu with WS2 or the steel substrate. Therefore, either Cu particles coated the surface of WS2 particles before they adhered to the surface to form a coating, or Cu particles adhered to the surface of the coating after WS2 particles were deposited. Either possibility is not expected to significantly affect the performance of the coating in terms of cycle life or steady-state COF. Because the COF of Cu was higher than that for WS2, the initial COF (i.e., in the first few cycles) may be increased. However, this was also likely an insignificant effect because initial/pre-run-in COF is higher for most solid lubricating materials anyway.
A small Fe peak was seen on the edge of a Cu Auger transition, whose intensity indicated that Fe only comprised ~3% of the detected surface species. The Fe was detected from the 304 SS substrate. As such, most of the surface was covered by the solid lubricant coating, at least to a thickness of 2–3 nm, i.e., several times the MED for the Fe XPS peak. This helped to further describe the coating morphology: SEM with associated EDX maps of a similar coating implied significant thickness variation (see Figure 17), but the XPS showed that even in the thin regions, sufficient solid lubricant coating was present to provide low friction.
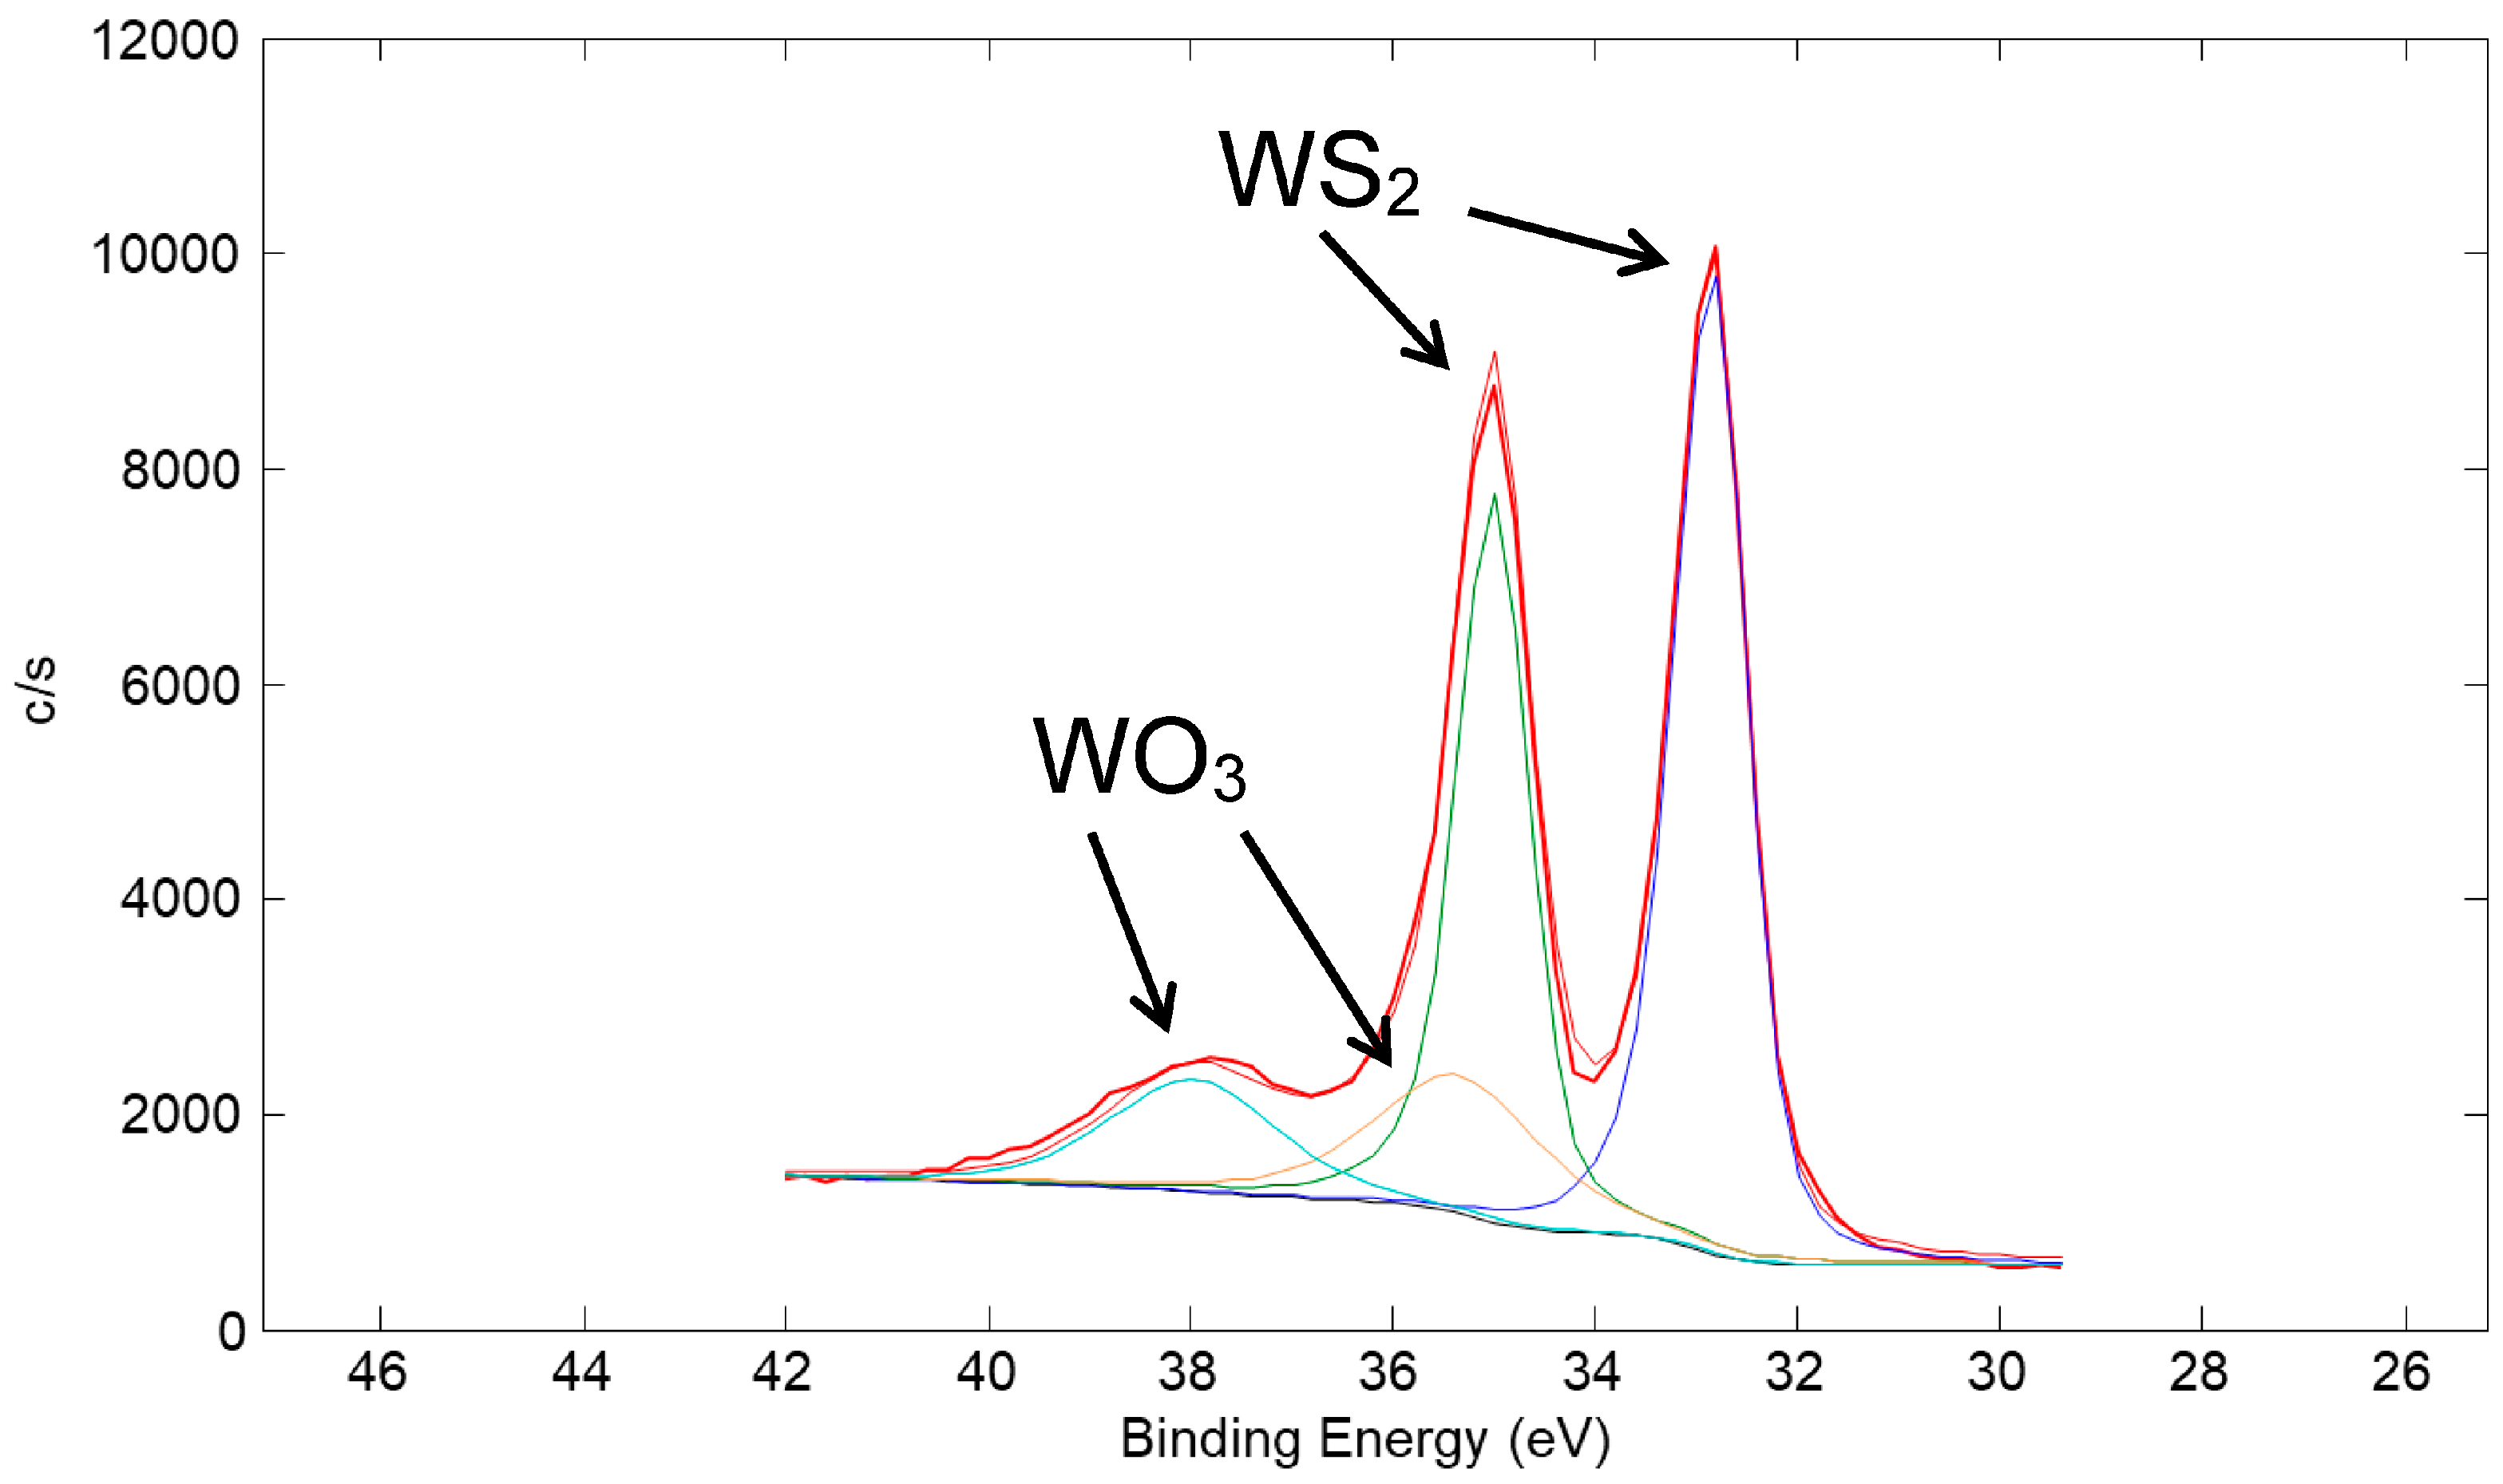
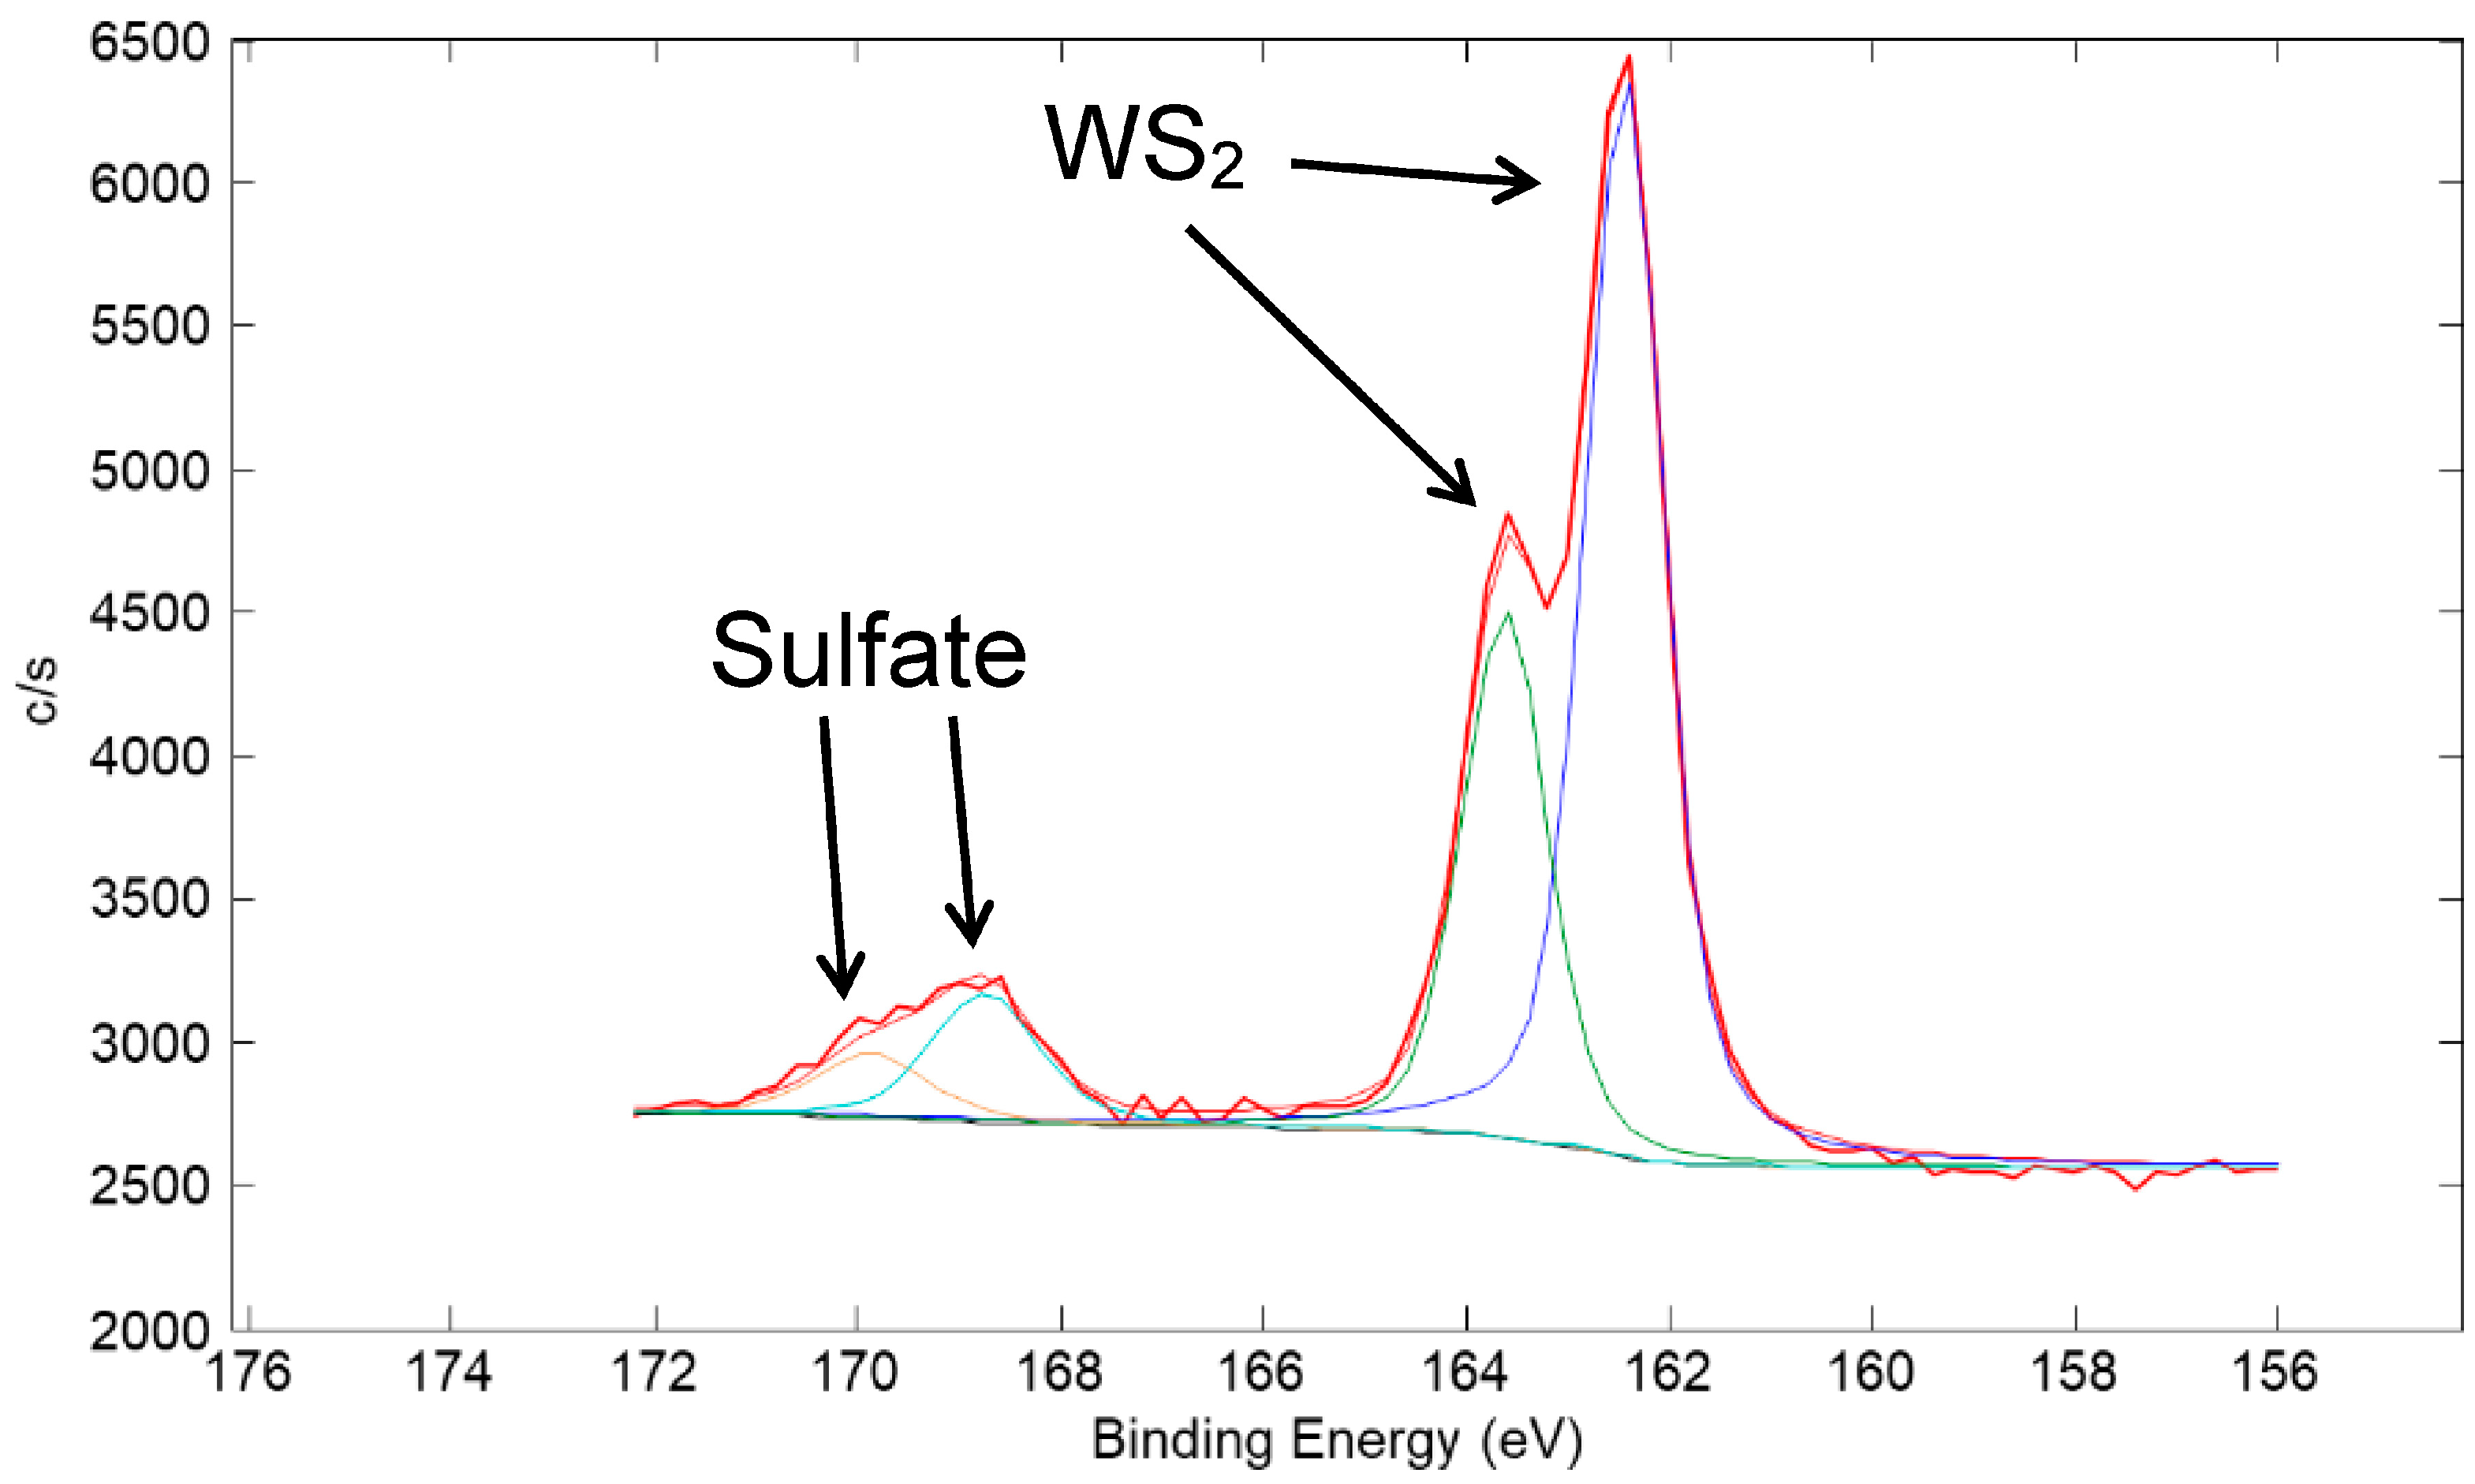
A high-resolution XPS scan of the surface of the Cu/90% WS2 coating taken in the W 4f region is shown in Figure 20. The spectrum is representative of mostly WS2 with a small amount of WO3. A thin, oxidized surface film is typical of metal sulfide powders and coatings due to exposure to humid air in the atmosphere [23]. A high-resolution XPS scan in the S 2p region is shown in Figure 21. The spectrum is representative of predominantly WS2 with a small amount of sulfate species. Such a sulfate species is consistent with the observation of oxidized W because sulfuric acid is a product of the metal sulfide oxidation reaction [23].

Figure 20.
High-resolution XPS scan of the surface of a coating made from a nominal mixture of 1 μm Cu with 90% 100 nm WS2 (same coating as in Figure 19). The scan is of the W 4f region. Typical of metal sulfide coatings, a small amount of the WS2 at the surface of the coating oxidized to WO3.

Figure 21.
High-resolution XPS scan of the surface of a coating made from a nominal mixture of 1 μm Cu with 90% 100 nm WS2 (same coating as in Figure 19). The scan is of the S 2p region. A small amount of sulfate is seen in the spectra, which is expected as an oxidation product of WS2 in addition to WO3.
An XPS wide scan of the surface of a coating made from a nominal mixture of 5 μm Ni with 80 wt% 15 μm MoS2 is shown in Figure 22 (the same coating whose friction scan is seen in Figure 9). As expected, Mo and S from MoS2 were apparent in the spectrum, with only a small peak for Ni (less than 1 wt%). Based on FIB/SEM/EDX results, the bulk Ni content was estimated to be ~1 wt% (XRF could not be used because of the high Ni content in the 304 SS substrate). As such, there was no apparent surface enhancement of the Ni, unlike that for the Cu-containing coating, as discussed above.
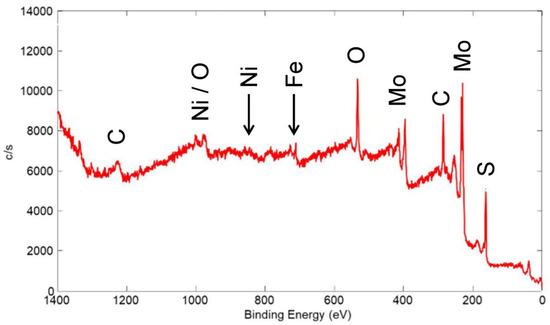
Figure 22.
XPS wide scan of the surface of a coating made from a nominal mixture of 5 μm Ni with 80% 15 μm MoS2. Primary photoelectron peaks of the detected species are labeled.
Similar to the wide scan for the Cu/90% WS2 coating in Figure 19, the Ni/80% MoS2 coating showed a small Fe peak that originated from the 304 SS substrate. As before, Fe only comprised ~3% of the detected surface species. As such, most of the surface was covered by the solid lubricant coating, at least to a thickness of 2–3 nm, i.e., several times the MED for the Fe XPS peak. Again, although we expected significant thickness variation in this coating, XPS showed that even in the thin regions, sufficient solid lubricant coating was present to provide low friction.
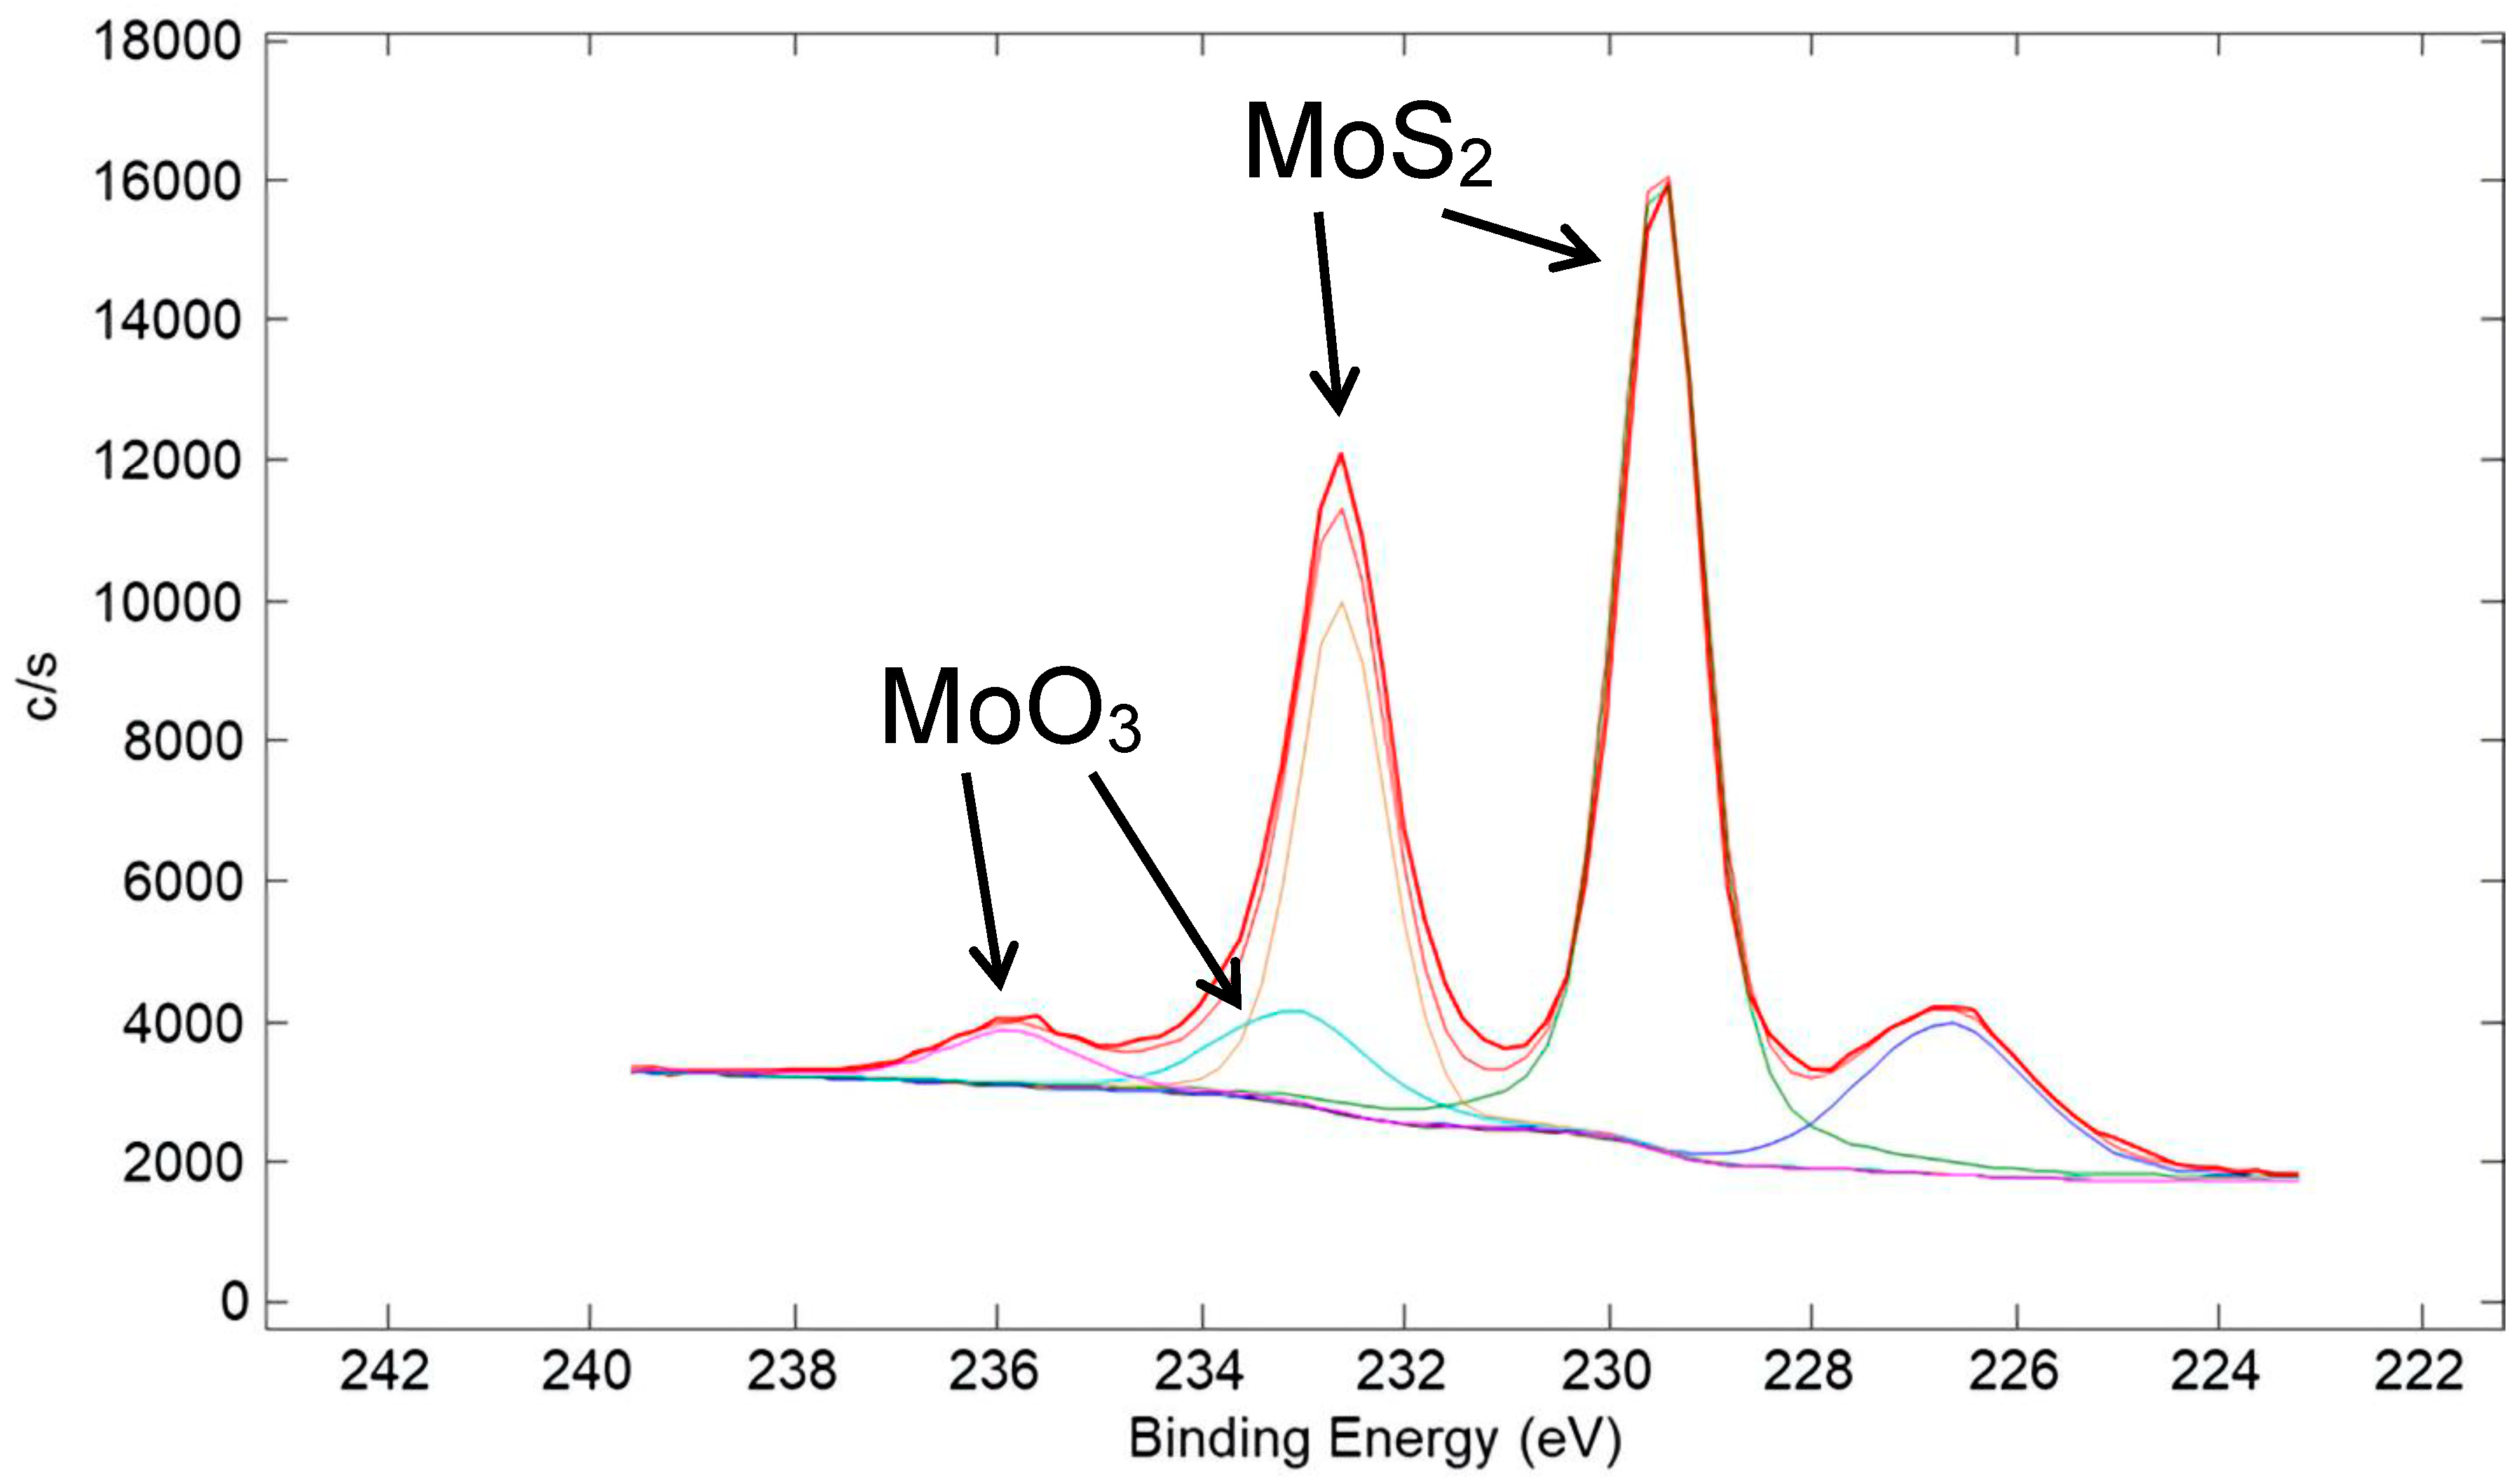
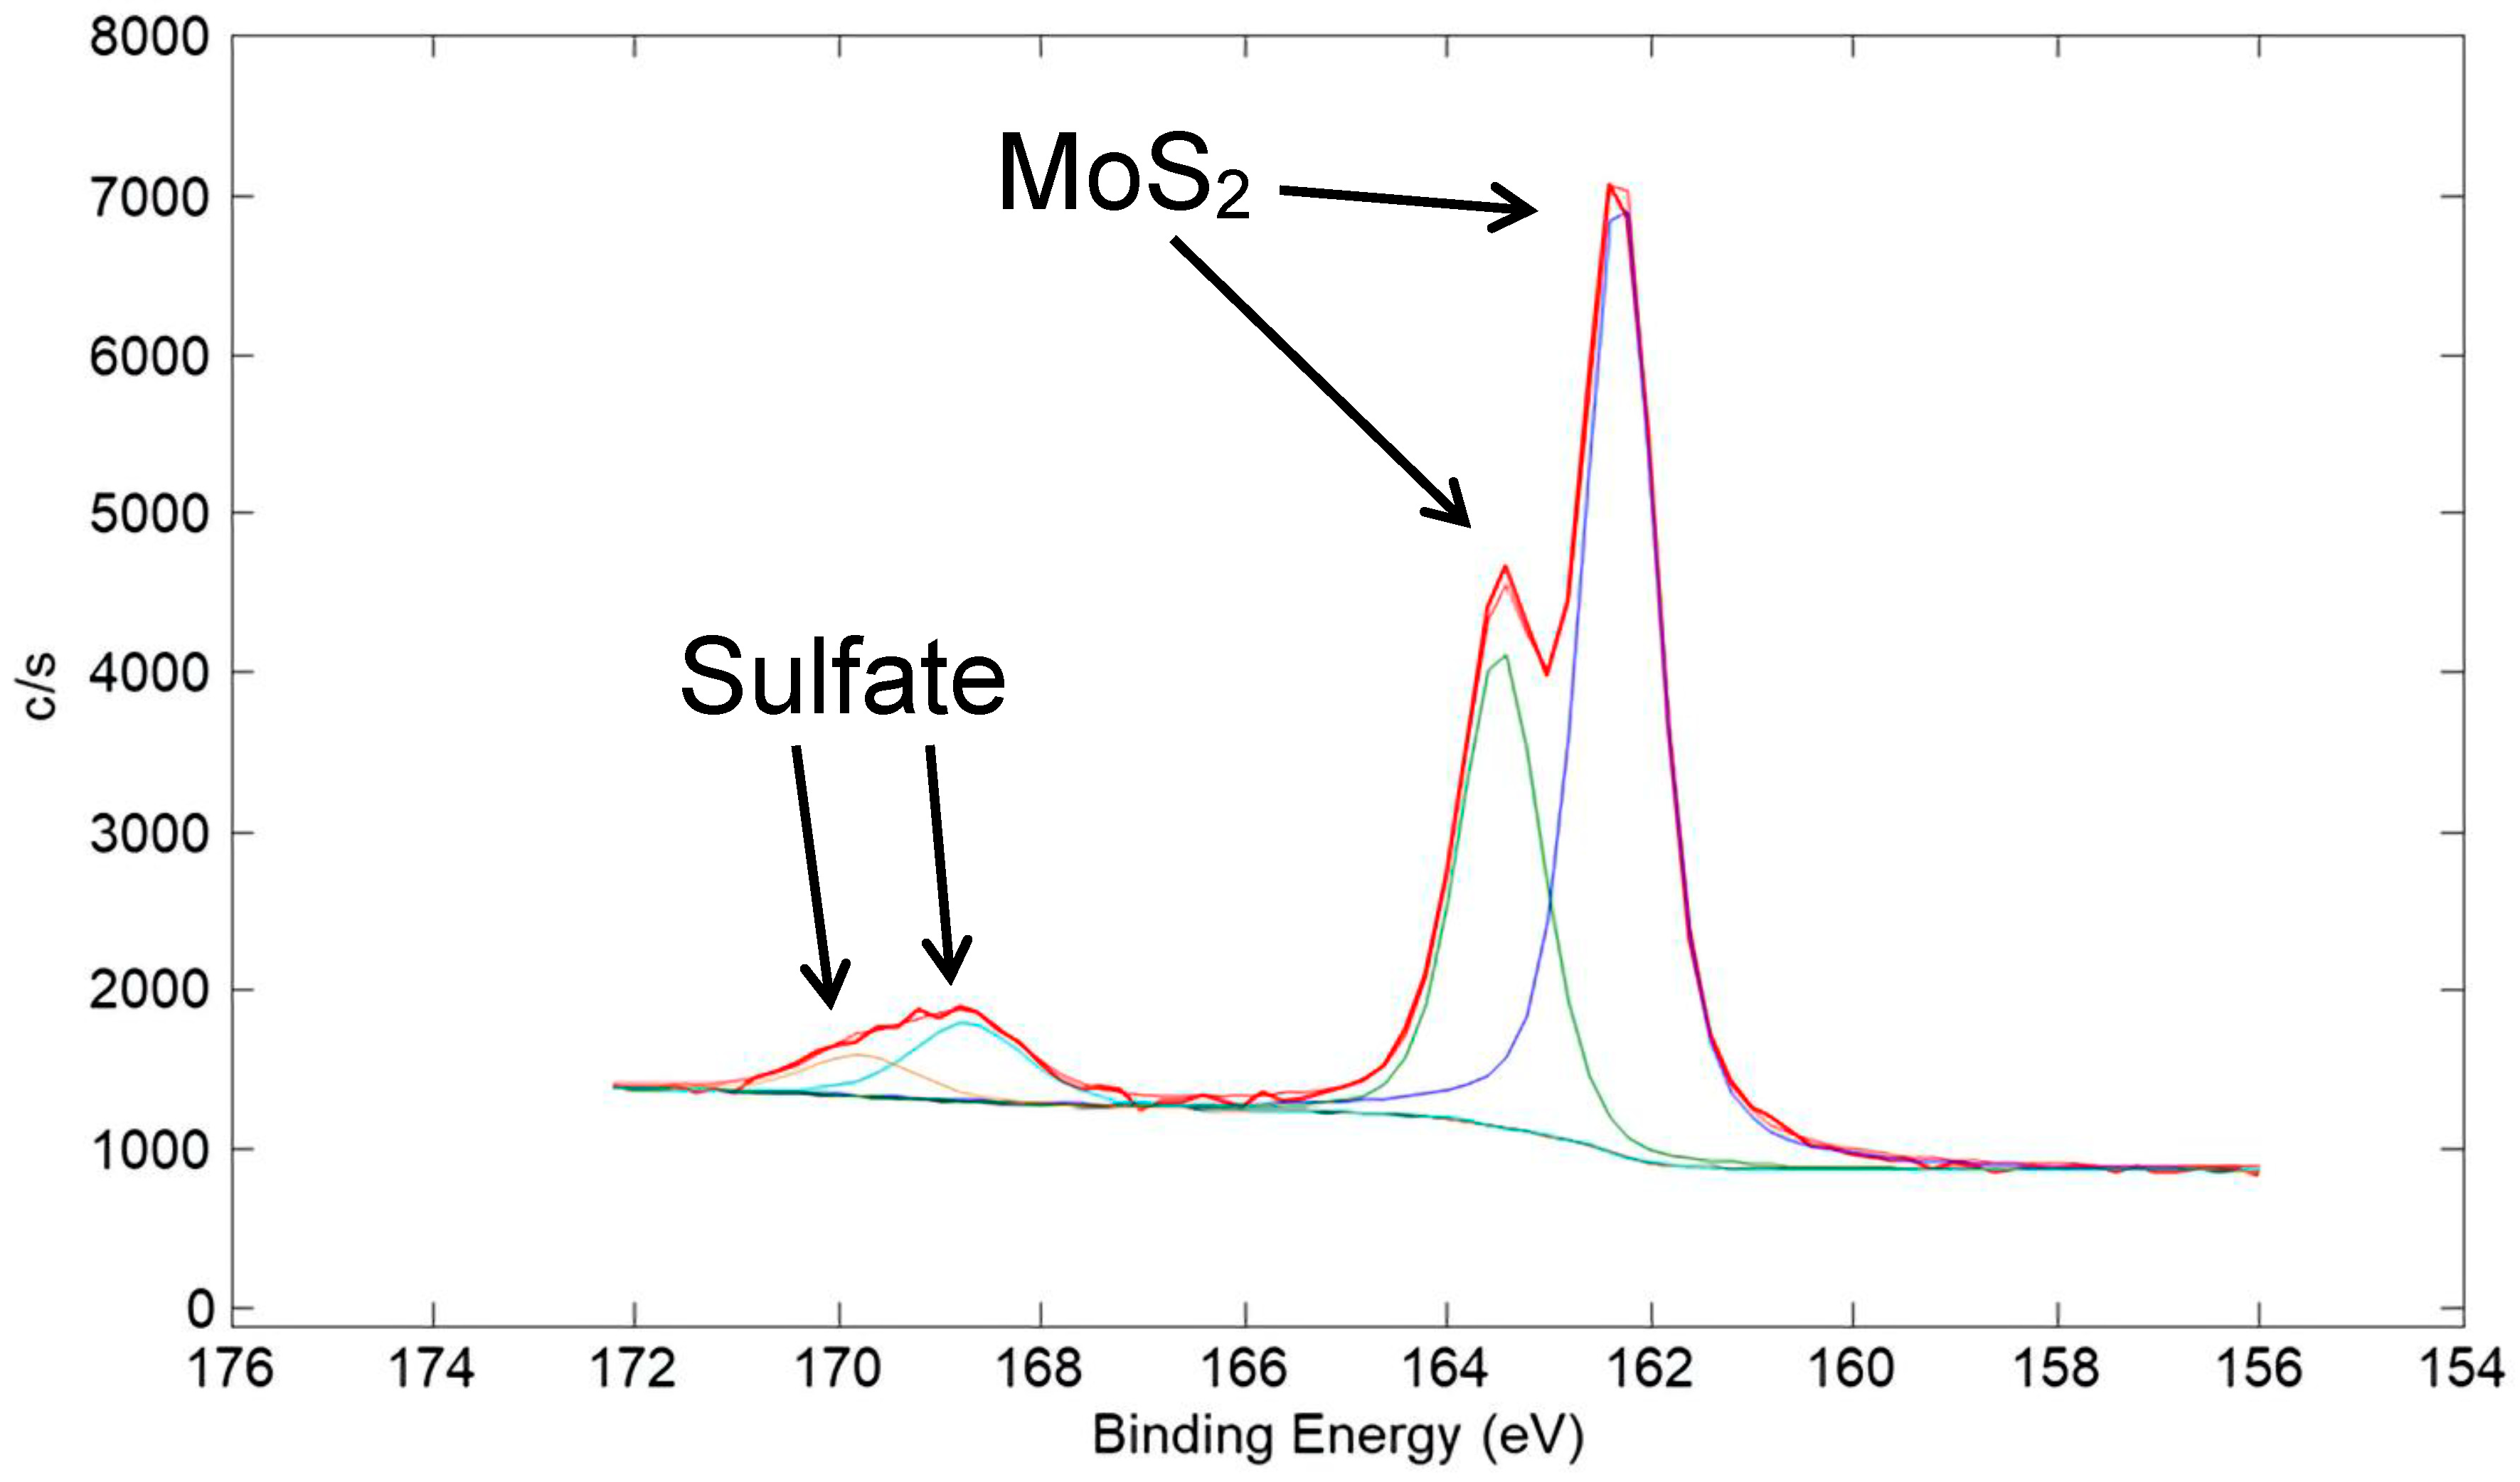
A high-resolution XPS scan of the surface of the Ni/80% MoS2 coating taken in the Mo 3d region is shown in Figure 23. Similar to the corresponding W 4f spectrum for the Cu/90% WS2 coating in Figure 20, it is representative of mostly metal sulfide (MoS2), with a small amount of metal oxide (MoO3). A high-resolution XPS scan in the S 2p region is shown in Figure 24. Similar to that for the corresponding S 2p spectrum for the Cu/90% WS2 in Figure 21, the spectrum is representative of mostly metal sulfide (MoS2), with a small amount of a sulfate species.
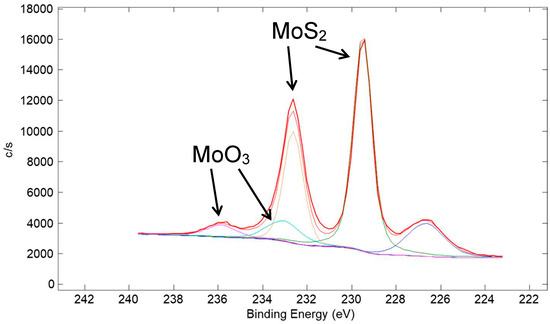
Figure 23.
High-resolution XPS scan of the surface of a coating made from a nominal mixture of 5 μm Ni with 80% 15 μm MoS2 (same coating as in Figure 22). The scan is of the Mo 3d region. Typical of metal sulfide coatings, a small amount of MoS2 at the surface of the coating oxidized to MoO3. The S 2s peak appeared at ~226.5 eV.

Figure 24.
High-resolution XPS scan of the surface of a coating made from a nominal mixture of 5 μm Ni with 80% 15 μm MoS2 (same coating as in Figure 22). The scan is of the S 2p region. A small amount of sulfate was seen in the spectra, which was expected as an oxidation product of MoS2, in addition to MoO3.
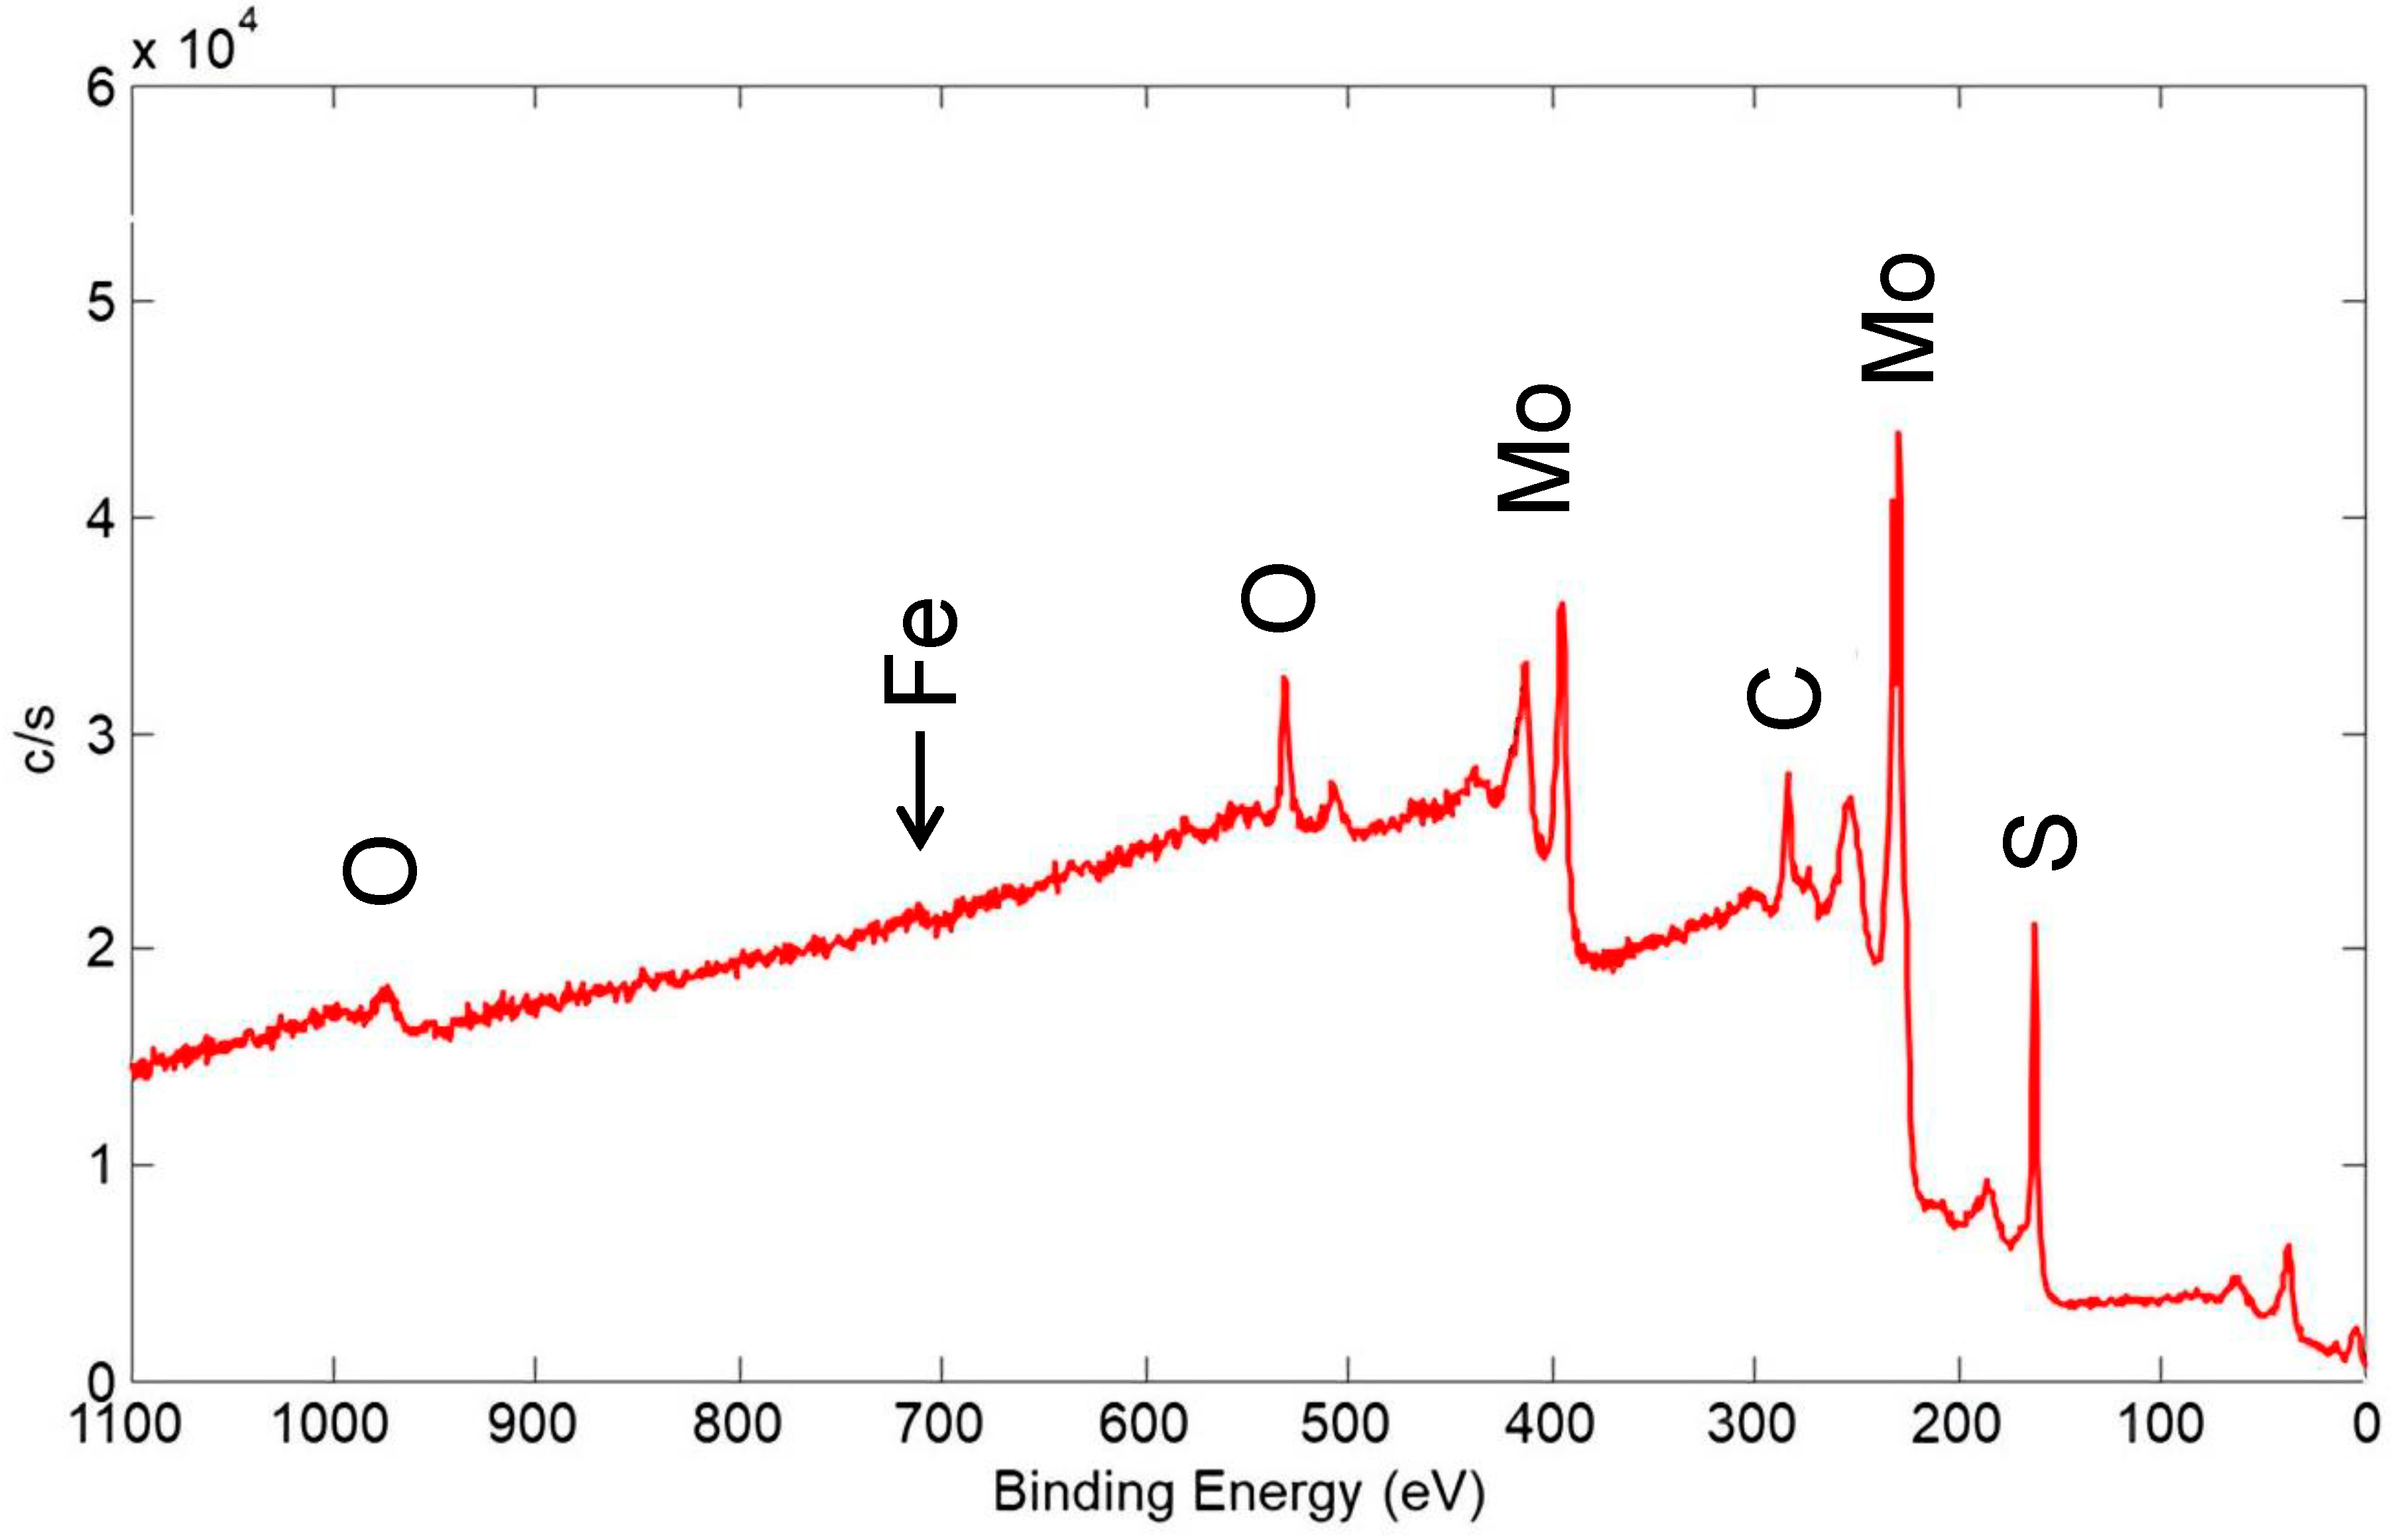
An XPS wide scan of the surface of a coating made from pure 15 μm MoS2 feedstock is shown in Figure 25, which is the same coating whose SEM and cross-section EDX map in Figure 18 showed significant thickness variation. The XPS scan showed an even smaller Fe peak than that for the Ni/MoS2 coating in Figure 22, here comprising only ~1% of the detected surface species. As such, virtually all of the surface was covered by solid lubricant to a thickness of at least 2–3 nm, which explains its good tribological performance, even from the first few cycles of testing (see Figure 11 for a friction scan of a similar pure MoS2 coating).
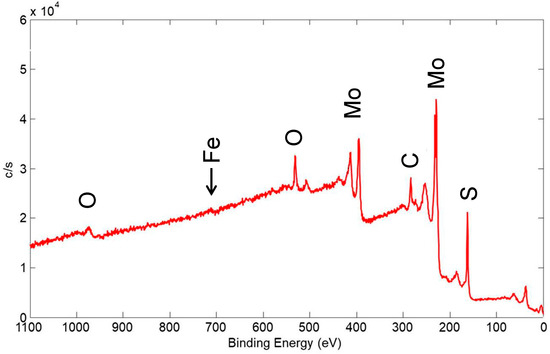
Figure 25.
XPS wide scan of the surface of a coating made from 15 μm MoS2. Primary photoelectron peaks of the detected species are labeled.
4. Discussion of Potential Applications of Cold Spray Solid Lubricant Coatings
Based solely on friction and wear performance, the various types of cold spray solid lubricant coatings we developed behaved similarly, with small differences in cycle life: the Cu-containing WS2 and MoS2 coatings and the Ni/WS2 coatings exhibited modestly higher cycle lives. The pure WS2 and MoS2 coatings exhibited slightly lower cycle lives, but they may be desirable based on the materials’ compatibility: the amounts of Cu and Ni in the metal-containing cold spray coatings may be minimal (a few percent); however, the use of these metals may still be precluded in some applications.
MoS2 is generally superior tribologically to WS2 at ambient temperature in inert and vacuum environments [24,25], but this study did not support that for cold spray coatings fabricated using the KM technique. The choice between WS2- and MoS2-containing coatings may be based on their performance at varying temperatures. In a vacuum, WS2 decomposes at only a slightly lower temperature than MoS2 (1040 and 1090 °C, respectively) [26]. However, for static exposure in air, WS2 is more stable at elevated temperatures: the threshold appears to be 390 °C, below which MoS2 oxidizes more slowly, and above which WS2 oxidizes more slowly [27]. For ball-on-flat testing of MoS2 and WS2 powders in air, the friction of MoS2 began increasing above ~510 °C, while that for WS2 began increasing above ~690 °C [28].
There are several types of metal-disulfide-based solid lubricant coatings in use in spacecraft, including mainly bonded, sputtered, and impinged coatings (these are compared in detail in [1]). There are a few compositions from several vendors available for sputtered MoS2-based coatings, and there are literally hundreds if not thousands of bonded MoS2 coatings available from scores of vendors, and both WS2 and MoS2 impinged coatings can be purchased from several vendors (see [29,30] for research on impinged MoS2 coatings). The question may arise, do we need another method for fabricating solid lubricant coatings? The answer is related to the understanding that there are no panaceas in this field: no coating formulation is ideal for all applications. There are tradeoffs between coatings based on such attributes as coating thickness, friction, cycle life, and even cost.
Table 3 presents the various attributes of the predominant coating techniques, including the newly developed cold spray method. It shows that there are specific application niches for each method. Impinged coatings are generally appropriate only for very low cycle applications. Bonded coatings are the mainstay of spacecraft, being used for many sliding applications, such as latches, release mechanisms, fasteners, actuators, and even for gears that are used at lower loads. But they cannot be used for some precision ball bearings because of their higher thickness and limited load-carrying ability. Sputter-deposited coatings are ideal for such precision applications because of their low thickness, good load-carrying ability, and significant cycle life, especially in rolling applications. However, they are the most expensive coating type in the commercially available solid lubricant coating family.

Table 3.
Attributes and performance of principal cold spray metal disulfide solid lubricant coatings compared to other metal disulfide solid lubricant coating fabrication techniques a.
There is clearly a niche for cold spray solid lubricant coatings. They demonstrated a significantly longer life and reliability than the impinged coatings, and significantly lower thickness than bonded coatings. Although some sputtered coatings have demonstrated significantly higher cycle lives, the cold spray coatings may be appropriate for many precision ball-bearing applications. Solid lubricated bearings are recommended to be used with both self-lubricating cages and coatings for the races. The main purpose of the coating is to provide low friction and wear protection during the run-in phase, as solid lubricant material is slowly transferred from the cage to the ball surface, and then to the race surfaces to provide steady-state lubrication. In addition, our results have only evaluated pure sliding in high contact stress conditions: in rolling applications, such as ball bearings, the coating cycle life may be significantly higher.
Although sputtered coatings may be preferred in some applications due to high cycle requirements, the cold spray coatings have comparative advantages. The cost of the cold spray coatings is expected to be significantly lower: a cold spray coating can be deposited in about one minute in an air environment, even on complex surfaces, while deposition of sputtered coatings may take hours and must be applied in a plasma within a high vacuum chamber. In addition, the sensitivity of sputtered MoS2-based coatings to storage in humid atmospheres is an issue and has been shown to vary with the specific coating composition [23]. Cold spray coatings are based on micron-sized particles, such as bonded and impinged coatings, and they would be expected to exhibit improved storage stability compared to sputtered coatings.
5. Summary
This study presented a new class of solid lubricant coatings that are based on the cold spray technique, using solid lubricant powders of the metal disulfides WS2 or MoS2, either pure or mixed with powdered metals, such as Cu and Ni. Friction and wear results were obtained using ball-on-flat reciprocating tribometry of coated 304 SS flats used with uncoated 100Cr6 steel balls. Coating thickness, morphology, and composition were analyzed using XRF spectrometry and studying FIB-produced cross-sections with SEM and EDX analysis. Specific findings follow:
- By increasing the metal disulfide:metal ratio and optimizing cold spray equipment parameters, coatings can be grown that exhibit much lower friction (COF values of 0.03 ± 0.01) and thickness (≤1 µm) than previous metal/metal disulfide cold spray coatings. Performance was demonstrated in both dry nitrogen and vacuum environments in sliding conditions at high Hertzian contact stresses (i.e., for Smax values up to 1386 MPa (201 ksi)) to achieve failure in a reasonable timeframe.
- Cu-containing metal disulfide coatings exhibited higher cycle lives than the pure metal disulfide coatings, even though the Cu content was only ~1 wt%.
- Cross-sectional analysis of the coatings showed significant thickness variation, although surface analysis using XPS showed that the substrates were virtually covered by solid lubricating material. EDX mapping of cross-sections showed that particle sizes in the coatings were considerably smaller than the average particle size in the initial feedstock, suggesting that the process favored the incorporation of smaller particles into the coating.
- Analysis of wear track profiles for coatings that were run to 3000 cycles (i.e., pre-failure) yielded specific wear rates in the range 3–7 × 10⁻⁶ mm3N−1m−1, which is typical for solid lubricant coatings.
- No wear was apparent on the surfaces of 100Cr6 steel ball counter-faces.
- When compared to other coating techniques, such as impingement, bonded coatings, and sputter deposition, the cold spray method represents a niche that has heretofore been vacant. For example, it may be useful for many precision ball-bearing applications, since cold spray can yield higher throughput and lower costs than sputtered coatings. In addition, because cold spray is a particle-based technology, it may exhibit improved storage stability compared to sputtered coatings.
Author Contributions
Conceptualization, J.R.L., P.W. and E.W.; methodology, J.R.L., P.W. and E.W.; validation, J.R.L. and P.W.; formal analysis, J.R.L.; investigation, J.R.L., P.W., W.H.M., A.J.C. and S.D.S.; resources, P.W.; data curation, J.R.L. and P.W.; writing—original draft preparation, J.R.L.; writing—review and editing, J.R.L., P.W., E.W., W.H.M., A.J.C. and S.D.S.; visualization, J.R.L.; supervision, P.W. and E.W.; project administration, J.R.L. and P.W.; funding acquisition, P.W. and E.W. All authors have read and agreed to the published version of the manuscript.
Funding
This research was funded by NASA under Small Business Innovative Research (SBIR) Contract No. 80NSSC21C0529.
Data Availability Statement
The original contributions presented in the study are included in the article, further inquiries can be directed to the corresponding author/s.
Acknowledgments
The authors gratefully acknowledge the support of Merilee Woods during this project.
Conflicts of Interest
Jeffrey R. Lince is employed by Space Tribology Consulting, Inc. Peter Woods and Eric Woods are employed by Applied Tungstenite, Inc. Wai H. Mak, Andrew J. Clough and Scott D. Sitzman are employed by The Aerospace Corporation. The funding agency had no role in the design of the study; in the collection, analyses, or interpretation of data; in the writing of the manuscript, or in the decision to publish the results.
References
- Lince, J.R. Effective application of solid lubricants in spacecraft mechanisms. Lubricants 2020, 8, 74. [Google Scholar] [CrossRef]
- Papyrin, A. The development of the cold spray process. In The Cold Spray Materials Deposition Process: Fundamentals and Applications, 1st ed.; Champagne, V.K., Ed.; Woodhead: Cambridge, UK, 2007. [Google Scholar]
- Botef, I.; Villafuerte, J. Overview. In Modern Cold Spray: Materials, Process, and Applications; Villafuerte, J., Ed.; Springer: New York, NY, USA, 2015; Chapter 1. [Google Scholar] [CrossRef]
- Yamada, M.; Wakabayashi, J.; Fukumoto, M.; Kitamura, J. Fabrication of Cu-MoS2 composite coating by cold spraying and evaluation of its property. In Proceedings of the ITSC 2009: International Thermal Spray Conference, Las Vegas, NV, USA, 4–7 May 2009. [Google Scholar] [CrossRef]
- Aggarwal, G. Development of Self-Lubricating Coatings via Cold Spray Process: Feedstock Formulation and Deformation Modeling. Ph.D. Thesis, The Pennsylvania State University, University Park, PA, USA, 2007. [Google Scholar]
- Smid, I.; Segall, A.E.; Walia, P.; Aggarwal, G.; Eden, T.J.; Potter, J.K. Cold-sprayed Ni-hBN self-lubricating coatings. Tribol. Trans. 2012, 55, 599. [Google Scholar] [CrossRef]
- Zhang, Y.; Shockley, J.M.; Vo, P.; Chromik, R.R. Tribological behavior of a cold-sprayed Cu–MoS2 composite coating during dry sliding wear. Tribol. Lett. 2016, 62, 1. [Google Scholar] [CrossRef]
- Zhang, Y.; Descartes, S.; Vo, P.; Chromik, R.R. Cold-sprayed Cu-MoS2 and its fretting wear behavior. J. Therm. Spray Technol. 2016, 25, 473. [Google Scholar] [CrossRef]
- Zhang, Y.; Epshteyn, Y.; Chromik, R.R. Dry sliding wear behaviour of cold-sprayed Cu-MoS2 and Cu-MoS2-WC composite coatings: The influence of WC. Tribol. Int. 2018, 123, 296. [Google Scholar] [CrossRef]
- Radhakrishnan, J.; Radhika, N.; Vighneshwar, R. Enhancement of tribological properties of pure copper through cold sprayed MoS2 coating. Mater. Res. Express. 2019, 6, 096448. [Google Scholar] [CrossRef]
- Dey, D.; Sarkar, S.; Mahata, A.; Choudhury, A.R.; Nath, A.K. Microstructural and tribological properties of high-performance Inconel 625 alloy-WS2 self-lubricious composite coating by laser assisted cold spray. J. Alloys Compd. 2024, 983, 173840. [Google Scholar] [CrossRef]
- Tapphorn, R.; Gabel, H. Brush-Sieve Powder-Fluidizing Apparatus for Feeding Nano-Size and Ultra-Fine Powders. U.S. Patent 7,273,075 B2, 25 September 2007. [Google Scholar]
- Buttery, M.; Lewis, S.; Kent, A.; Bingley, R.; Cropper, M. Long-Term Storage Considerations for Spacecraft Lubricants. Lubricants 2020, 8, 32. [Google Scholar] [CrossRef]
- Singer, I.L.; Bolster, R.N.; Wegand, J.; Fayeulle, S.; Stupp, B.C. Hertzian stress contribution to low friction behavior of thin MoS2 coatings. Appl. Phys. Lett. 1990, 57, 995. [Google Scholar] [CrossRef]
- Amontons, G. Memoires de l’Academie Royale des Sciences; Chez Gerard Kyuper: Amsterdam, The Netherlands, 1706; pp. 257–282. [Google Scholar]
- Archard, J.F. Wear theory and mechanisms. In Wear Control Handbook; Peterson, M.B., Winer, W.O., Eds.; ASME: New York, NY, USA, 1980. [Google Scholar]
- ASTM Standard G133-05; Standard Test Method for Linearly Reciprocating Ball-on-Flat Sliding Wear. ASTM International: West Conshohocken, PA, USA, 2016. Available online: www.astm.org (accessed on 6 February 2019). [CrossRef]
- Scharf, T.W.; Prasad, S.V. Solid lubricants: A review. J. Mater. Sci. 2013, 48, 511. [Google Scholar] [CrossRef]
- Wear. Available online: https://en.wikipedia.org/wiki/Wear (accessed on 27 May 2024).
- Gardos, M.N. Anomalous Wear Behaviour of MoS2 Films in Moderate and Dry Nitrogen. Tribol. Lett. 1995, 1, 67–85. [Google Scholar] [CrossRef]
- Colas, G.; Saulot, A.; Bouscharain, N.; Godeau, C.; Michel, Y.; Berthier, Y. How far does contamination help dry lubrication efficiency? Tribol. Int. 2013, 65, 177. [Google Scholar] [CrossRef]
- Powell, C.J.; Jablonski, A. NIST Electron Effective-Attenuation-Length Database–Version 1.3; National Institute of Standards and Technology: Gaithersburg, MD, USA, 2011.
- Lince, J.R.; Loewenthal, S.H.; Clark, C.S. Tribological and Chemical Effects of Long Term Humid Air Exposure on Sputter-Deposited Nanocomposite MoS2 Coatings. Wear 2019, 432, 202935. [Google Scholar] [CrossRef]
- Anderson, M.J.; Cropper, M.; Roberts, E.W. The Tribological Characteristics of Dicronite. In Proceedings of the European Space Mechanisms and Tribology Symposium (ESMATS), Liverpool, UK, 19–21 September 2007; Available online: https://esmats.eu/esmatspapers/pastpapers/pdfs/2007/anderson.pdf (accessed on 25 April 2024).
- Jansson, M.; Koenen, J.; Viviente, J.-L.; Tvaruzka, A.; Merstallinger, A. Development of Dry Lubricated Harmonic Drives for Space Applications (“harmLES”). In Proceedings of the 15th European Space Mechanisms and Tribology Symposium (ESMATS 2013), Noordwijk, The Netherlands, 25–27 September 2013; Available online: https://esmats.eu/esmatspapers/pastpapers/pdfs/2013/jansson.pdf (accessed on 25 April 2024).
- Brainard, W.A. The Thermal Stability and Friction of the Disulfides, Diselenides, and Ditellurides of Molybdenum and Tungsten in Vacuum (10−9 to 10−6 Torr); NASA Technical Note, NASA TN D-5141; National Aeronautics and Space Administration: Washington, DC, USA, 1969.
- Winer, W.O. Molybdenum disulfide as a lubricant: A review of the fundamental knowledge. Wear 1967, 10, 422. [Google Scholar] [CrossRef]
- Higgs, C.F., III; Heshmat, C.A.; Heshmat, H. Comparative Evaluation of MoS2 and WS2 as Powder Lubricants in High Speed, Multi-Pad Journal Bearings. J. Tribol. 1999, 121, 625. [Google Scholar] [CrossRef]
- Scharf, T.W.; Diercks, D.R.; Gorman, B.P.; Prasad, S.V.; Dugger, M.T. Atomic Layer Deposition of Tungsten Disulphide Solid Lubricant Nanocomposite Coatings on Rolling Element Bearings. Tribol. Trans. 2009, 52, 284–292. [Google Scholar] [CrossRef]
- Curry, J.F.; Argibay, N.; Babuska, T.; Nation, B.; Martini, A.; Strandwitz, N.C.; Dugger, M.T.; Krick, B.A. Highly Oriented MoS2 Coatings: Tribology and Environmental Stability. Tribol. Lett. 2016, 64, 11. [Google Scholar] [CrossRef]
Disclaimer/Publisher’s Note: The statements, opinions and data contained in all publications are solely those of the individual author(s) and contributor(s) and not of MDPI and/or the editor(s). MDPI and/or the editor(s) disclaim responsibility for any injury to people or property resulting from any ideas, methods, instructions or products referred to in the content. |
© 2024 by the authors. Licensee MDPI, Basel, Switzerland. This article is an open access article distributed under the terms and conditions of the Creative Commons Attribution (CC BY) license (https://creativecommons.org/licenses/by/4.0/).

