Abstract
The reliable operation of a process plant is critical to the safety, performance, and profitability of a business. Failure Mode and Effects Analysis (FMEA) is a process of reviewing systems, subsystems, and equipment that identify potential failure modes, their root causes, and consequences. FMEA is also a risk assessment tool that has been used successfully in a wide range of process industries as an integral part of reliability-centered maintenance, safety management, and continuous improvement. The method has indeed been criticized, especially in the area of system assessment, but engineers still predominantly use traditional, unmodified FMEA best practices. In this study, a new conceptual model is proposed to improve the traditional technique and make FMEA a more autonomous, data-driven, and accurate method. The conceptual model of improved FMEA uses ANFIS and FIS models in one automated process that aims to solve the defect handling process from failure detection to quantification of risk level and prioritization of dedicated mitigation action.
1. Introduction
The key to improving plant profitability lies in the availability of its assets and the reduction in unplanned shutdowns. An efficient and effective maintenance strategy requires more than machine monitoring. Sometimes equipment sensors cannot detect issues until it is too late to prevent the damage, which results in unexpected and costly repairs. One of the important aspects of reliability is based on the identification of the safety-critical equipment, assessment of the equipment’s condition and the ability to detect impending failure. Failure Mode and Effects Analysis (FMEA) is a method that is used to examine potential failures in production or a process, but it is also a risk assessment tool that quantifies risk levels and analyses the root causes of failure modes.
The traditional RPN approach has been criticized in many of its aspects, especially for calculations of the Risk Priority Number (RPN), uncertainty in estimating variables (Severity (S), Occurrence (O) and Detectability (D)) and considering no difference among risk variables’ weights [1], i.e., the fact that different combinations of O, S and D may produce the same value of RPN. A literature review by H. C. Liu et al. [2] describes in minute detail the shortcomings of the traditional FMEA and the method addressed to solve some of these problems. Generally, the conclusion stemming from that review was that as long as the risk variable selection, weighting method and risk priority method are appropriate and suitable to the specific risk evaluation problems, FMEA can become a more effective and powerful tool for safety and reliability analyses of systems, processes, designs and services in a variety of industries. The following systematic review [3] of papers on this topic, produced in the period between 1998 and 2018, points to a very quick increase in annual publications on FMEA improvement in the past two decades, after the publication of the review article by the above mentioned authors in 2013. The majority of papers selected the fuzzy logic system in an attempt to eliminate the disadvantages of the traditional FMEA based on “if–then” rules formed in fuzzy inference system (FIS) and improve upon calculated fuzzy RPN and risk prioritization, for example, for milling machines [4,5], environmental waste water treatment plant [6], automotive industry [7,8] and other industries [9,10,11,12,13,14,15]. For determining risk levels and prioritizing mitigation action for the risks, some authors have taken into account additional variables, for example, costs based on economic impact [16,17,18] or impact of assets, people, environment and/or reputation [19,20]. Research by W. Zhou et al. [7] presents three new risk factors; maintenance time, maintenance cost, and maintenance benefit through fuzzy logic terms for ranking vehicle failure mode and performance order. The study of authors Fabis–Domagala et al. proposes a modification of the conventional RPN number, where severity and occurrence are valued based on subfactors while the detection number remains unchanged. The severity number in that paper is calculated as a product of component importance, its influence on other components, and failure effects, and the occurrence number is replaced by a failure predictor, which defines the likelihood of failure based on failure rate value and modification factors [21].
Currently, the constant increase in the use of sensors in the production process leads to a large amount of data that is stored, waiting to be interpreted and gain value. Only by working together, i.e., in cooperation with operational, maintenance, production, health, safety and environmental subject-matter experts, is it possible to reach conclusions, find the root causes of the deviations in process parameters, and catch the bad actors contributing to the failure mode. As was pointed out in the review article by H. Webert et al. [22], fault prioritization research about available learning methods and the experts’ opinions are needed when prioritizing faults. In that review, FMEA was presented as a method used to support experts in their decision-making process regarding risk prioritization and the review was concluded with a suggestion to perform more investigation through interviews with experts.
The Adaptive Neuro Fuzzy Inference System (ANFIS) is a powerful artificially intelligent method used to improve risk management, manage uncertainties in risk variables, and predict the risk level [23,24]. ANFIS has also found applications in the process of decision-making [25] and in medicine as a method that deals with the imprecision of diagnostic and decision-making procedures, etc. In the paper by M.T. Nouei et al., ANFIS is presented as being able to accurately predict the outcome of a surgery [26]. Another area where this methodology has been used is the incidence of wildfires in terms of the system of Global Warning. IoT technology has shown exponential growth in recent years, so IoT devices to monitor and collect time-critical data are needed. Research by H. Kaur and S. Sood [27] proposes an effective Fog-IoT centric framework for the timely detection of wildfires. It used ANFIS for assessing the vulnerability of a forest block to forest fires as well as for classifying it into one of the five risk zones, thus providing efficiency in detecting and predicting wildfires via real-time alert generation. The paper by authors Pamučar et al. predicts the rank of consulting companies when applying for public procurement [28]. Neuro fuzzy system has also found application in developing models that provide support in decision-making. It allows people with less experience to make adequate decisions [29]. To sum up, ANFIS has been applied and used in various domains, as it provides accelerated learning capacity and adaptive interpretation capabilities to model complex patterns and apprehend nonlinear relationships [30].
In the literature, one can find papers that describe the new approach for time-series prediction based on the use of intelligent techniques, such as neural networks, type-1 and type-2 fuzzy logic systems and generical algorithms that provide a variety of features for solving real and complex problems. The conjunction of these soft computing techniques reinforces learning, adaptation, explanation, flexibility, discovery and parallel computation in hybrid intelligent architectures, all desirable features in intelligent information processing [31]. The paper by Soto et.al has described methods used for the integration of the ensembles of ANFIS for the prediction of chaotic time series to minimize the prediction error. The method used is type-1 and interval type-2 Mamdani fuzzy inference systems (FIS) and genetic algorithms for the optimization of the membership function parameters of the FIS in each integrator. The authors conclude that the interval type-2 FIS integrator is better than the type-1 FIS integrator, the interval type-2 FIS having provided better prediction errors than the type-1 FIS [32]. The Type-2 fuzzy set is a more powerful tool for characterizing uncertainty in complex problems, therefore the proposal offers the prediction of time series, which can help make decisions and avoid unexpected events in the future. A wide usage of Type-2 fuzzy sets is expected in the future; however, because of their complexity, very few studies can be found in the literature. The examples of application type-2 fuzzy sets in fuzzy multi-criteria decision-making in a real economic evaluation of medical device selection problems are presented in a paper by authors Tolga et al. [33].
The purpose of the article is to address the disadvantages of conventional FMEA, such as subjectivity and reliance on individual judgments. It also aims to overcome the lack of a comprehensive understanding of the broader system and external factors that can influence failure modes. In addition to identifying failure modes and their effects, the article investigates the underlying root causes. This process can be time-consuming, especially for complex systems or large-scale projects. Conventional FMEA does not account for dynamic changes over time and does not provide precise quantitative measurements of risks; instead, it is a risk assessment based on linguistic criteria. By reviewing the literature, many methods for improving FMEA are mentioned, depending on the specific requirements and characteristics of the FMEA process. The choice of method should be based on careful consideration of the problem domain and the available resources.
This research is aimed at improving the conventional FMEA method with sets of fuzzy logic interface systems and adaptive neuro fuzzy systems in such a manner that the key parameters for influencing equipment performance become the criteria for determining the severity of malfunctions. In the absence of available data, input parameters of analysis in combination with linguistic terms, supported by in-depth expert interviews, will maintain the consistency of computation procedures, hence gaining more reliable severity variables. This paper includes the support of subject-matter experts in decision-making regarding the assessment of risks. The fuzzy inference system was chosen for this work because the simplicity of its structure stands out as more intuitive and easier to understand, which makes it more suitable for human expert-based system applications knowledge. Fuzzy logic is commonly used for solving all general-purpose decision-making problems and challenges perfectly suited to its purpose. While ANFI was chosen to create models of the associated input variables of the FMEA analysis where it is difficult to define the associated membership functions for fuzzy sets and rules, with this method, based on expert interviews, the variables of the FMEA analysis were modeled based on process and machines parameters.
Therefore, it is essential to identify process safety critical equipment, including components and systems that pose a high risk for business, failure of which can cause, allow or contribute to a process incident resulting in death or serious injury, significant property damage, and/or unfavorable environmental impact. This research also addressed the benefit of FMEA as the selection methodology to identify process safety critical equipment for refinery units. The criticality of equipment is assessed through the calculation value of the Risk Priority Number (RPN).
The expected contribution of this research lies in implementing the experiential knowledge of subject-matter experts utilizing fuzzy and neuro fuzzy logic systems to improve the FMEA analysis in the part of prioritizing activities and accuracy of estimating input parameters. The aim is to maintain the safety and reliability of process systems by taking into account a set of key process and machine parameters that will indicate the state of assets, also using a combination of linguistic variables in place of unavailable data and most importantly, mimicking human logical reasoning in the process of assessing risks with minor human errors. The results of improved FMEA will be based on a maintenance management strategy that should contain activities prioritizing work in line with risk assessment, monitoring the condition of equipment, as well as planning and scheduling preventive and predictive maintenance activities.
The article is organized in such a way that the methods employed in the research design of the model, data collection procedures, and the explanation of equipment failure using the P-F curve are provided in Section 2. The result section presents the findings of the research on the input variables of the RPN methodology and includes tables, images, and graphs that are supported by statistical analysis. In the discussion section, the results and related research questions and objectives are interpreted. The implications of the findings are analyzed, the limitations of the study are discussed, and future research directions are proposed. The conclusion summarizes the main findings of the study, emphasizes their significance, and provides closure to the article.
2. Materials and Methods
In this work, multiple methods and tools were adopted to improve the implementation of FMEA analysis and remove shortcomings of the conventional approach, such as Fuzzy logic, ANFIS, and P-F curve.
2.1. FMEA
FMEA is a method that is used to examine and collect knowledge on potential failure points in a design, process, product, or service utilizing a step-by-step approach. FMEA is organized as top-down deduction analysis; it is an iterative, systematic, and documented process that has been successfully adopted across a wide range of process industries as an integral part of continuous improvement. It can aid in developing a successful maintenance program, as well as an understanding of asset functions, failures, and consequences in terms of business facilities.
Generally, the purpose and benefits of FMEA analysis include the following:
- Identify potential failure modes which may degrade products, damage assets and property, cause incidents, jeopardize health and safety and lose assets’ performance;
- Improve the design and procedures, as well as set up barriers, in the place where they were missing efficiently and cost-effectively;
- Identify risk as part of risk assessment in the overall risk management process (ISO 31000) [34];
- Calculate risk level, which is the basis for prioritizing risk response action plans;
- Provide the basis for a reliable maintenance program and maintenance strategy.
FMEA analysis uses the Risk Priority Number (RPN) ranking system that quantifies risk levels and prioritizes mitigation actions for each identified failure mode. RPN is a product of the three rating variables: Severity, Occurrence, and Detectability, as seen in Equation (1). Severity (S) is defined as the intensity of each potential effect of failure, where the highest number indicates the worst effect. Occurrence (O) is the likelihood that each potential failure cause will occur, where the highest number indicates the highest probability of occurrence, while detectability (D) presents the likelihood that each potential failure will be detected before it reaches the end-user, where the highest number indicates the lowest probability of early detection.
In the process of conducting an FMEA analysis, a team must assess the variables S, O and D for each potential failure mode. Assessment of these variables is based on the initial set up of linguistic decision criteria for S (Table A1), O (see Table 1), and D (Table A2) using additional available process data, maintenance equipment cards, expert engineers’ knowledge and operation experience in process, process flow diagrams, and available design documentation. These three variables (S, O, and D) are then rated on a scale from 1 to 10, i.e., from low to high. The RPN value is the indicator for prioritization of necessary mitigation action to eliminate risk or reduce the risk level of potential failure mode. The failure modes that have the highest RPN values have to be considered as unacceptable risk levels. Also, hazards must be put under control with top priority or other hazards controls or barriers must be implemented without delay.

Table 1.
ANFIS model variants, seven cases with different types of membership functions, partitioning techniques, and learning methodology.
The traditional calculation of RPN method does not consider the relative importance among variables S, O, and D. In reality, what appears very often are identical RPN values for different sets of risk variables, especially related to the medium risk due to a large number of activities of that rank, so it is difficult to recognize the activity with high priority. Therefore, the goal of this research was to improve FMEA with a fuzzy logic system and neuro fuzzy logic system in a way that eliminates human subjectivity and uncertainty, taking into consideration the importance of individual variables in making the final decision.
2.2. P-F Curve
A P-F Curve is a graph that is used to visually present equipment. It is a very important tool in any reliability-centered maintenance program. It is mainly used to identify potential causes of machine failure in a way that the interval between potential failure and functional failure is identified. Potential failure is the point at which the beginning of equipment deterioration is noticed. Functional failure is the point at which equipment is no longer operational. These two points determine P-F interval, which is important in the maintenance program. Although machines are not built to last forever, their lifespan may be as long as one might not expect, thus having a reliable maintenance program can foster a longer lifespan of equipment and save costs.
Today, many extended versions are pictured as a D-I-P-F Curve (Design-Installation-Potential Failure-Failure) and include design integrity, precision maintenance, preventive maintenance, corrective maintenance, and run-to-failure. The P-F Curve is associated with failures that give a warning or indication of potential failure condition that the failure is ongoing or about to happen and is not associated with design integrity, precision maintenance, age-related failure prevention, or run-to-failure strategies. These are independent strategies for each step of the equipment lifecycle and should be treated as a such, reference from the source [35]. In that sense, the P-F Curve is a very useful tool for understanding how equipment breaks down, yet it can also show the relationship between equipment failures, breakdowns, cost, and failure prevention.
The X-axis of the P-F curve represents time, as shown in Figure 1. The first point is the time when the failure starts to develop, and the last point is the time when the equipment breaks down. During the interval between these two points, there are a lot of instances in which the faults could be detected.
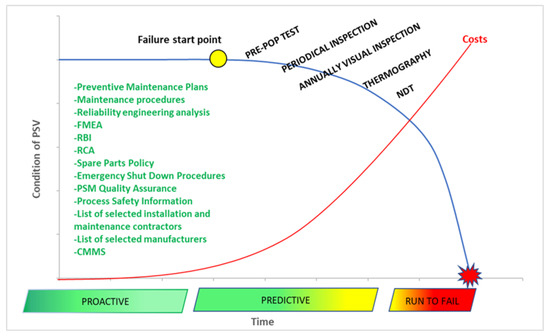
Figure 1.
P-F chart for PSV.
The Y-axis represents equipment conditions. At the top left part of the curve, equipment is at the highest working conditions, and it starts to deteriorate until the point of breakdown, which follows down the y-axis and right x-axis. During this period, one can detect signs of failure and address these issues before the machine breakdown occurs. By using top technology, early signals of failure should be the focus, so one can minimize downtime and optimize equipment lifespan.
In the example of the process safety valve, which is equipment critical to process safety, as identified from other refinery sources, it is demonstrated that proactive and predictive activities have been successfully established and implemented, as visually presented in Figure 1. P-F chart illustrates the health of the equipment from the starting point of degradation to failure. Before the damage begins, imperceptible degradation occurs in the production process and will continue to increase unless the failure is detected.
A pressure safety valve (PSV) is a spring-loaded pressure-relief device, which is designed to open in order to relieve excess pressure and in the same design of construction to reclose and prevent further flow of fluid after normal conditions have been restored. It may be used for either compressible or incompressible fluids, depending on design, adjustment, or application [36]. It has a wide application in the production industry.
PSVs should be pre-pop tested before disassembly to determine the opening point, blowdown, and seat tightness. The purpose of a pre-pop test is to determine if a PSV would have operated on-demand within the set pressure tolerance limits of the code for the entire period it has been in service. A valve should also be visually inspected after the pop test to estimate its condition when removed from service. This inspection should be performed by an engineer to determine corrosion, deposits, and unusual conditions. PSVs that fail the test should be investigated and the root cause has to be determined. All pre-pop test results should be investigated and used for the creation of equipment history. Pretest results assist maintenance planning in determining service schedules and adjusting testing intervals. Considering all the above mentioned, a P-F curve has been created for pressure safety valves with defined proactive and predictive activities to maintain the mechanical integrity of safety critical equipment, Figure 1. Based on the example of PSV for all future process safety critical equipment identified by the FMEA, a risk assessment tool should be created in the form of a P-F curve, defining preventive and predictive maintenance strategies to avoid equipment failure and consequently the high-risk process incident occurrence.
2.3. Fuzzy Logic System and Adaptive Neuro FuzzyInterface Systems
This study is dedicated to improving traditional FMEA by utilizing a combination of fuzzy logic system and adaptive neuro fuzzy interface system approach using experts’ knowledge, process and machine available parameters in addition to the very useful tools listed above. In cases where available data were absent, linguistic terms were applied and established by criteria for variables S, O, and D supported by in-depth expert interviews to improve the consistency of the estimation of input variables for the calculation of fuzzy RPN and to gain more reliable input variables.
A detailed description of the Fuzzy logic system was presented in a previous study [19]. The principles of the method and results obtained in the previous study were also taken into consideration in this research, combined with Adaptive Neuro Fuzzy Interface Systems (ANFIS) to create a final conceptual model design. The benefits of applying fuzzy logic systems in estimating FMEA input variables for RPN calculation and RPN fuzzification itself were addressed by emphasizing the importance of the weight of the variables S, O, and D according to risk response defined by the business matrix and incorporating subject matter expert knowledge in the form of the nonlinear relationship between variables.
The ANFIS is one of the artificial neural networks developed in 1992 by Jung [23] that is based on Takagi–Sugeno fuzzy inference system (FIS). The method competency is for effective learning and reasoning; therefore, it is widely used. In this research, ANFIS method is used to solve the problem of determining the severity variable, for example, pump equipment. Using historical maintenance and process data as well as subject matter expert knowledge, a flexible and adaptive ANFIS severity model has been created.
The structure of the ANFIS network consists of five layers. For the purpose of training, the severity ANFIS model used the existing input data from the Basic Process Control System (BPCS) that had been carefully selected, the database of offline machine monitoring pump vibration, analyzing all possible scenarios with undesirable consequences by subject matter experts.
The first layer of the ANFIS structure is the fuzzifications layer that takes input parameters and determines membership functions that belong to them, as given in (2) and (3).
The second layer is the rule layer based on the Sugeno FIS (Figure 2) and can be presented as the following:
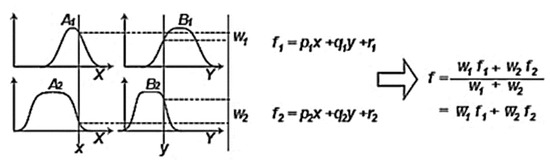
Figure 2.
Fuzzy model.
The third layer is the normalization layer which calculates normalized firing strength belonging to each rule [37]. It is the ratio of the firing strength of the ith rule to the total of all firing strengths as given in (6).
The fourth layer deals with the consequence of rules, weighted values of rules are calculated in each node as given in Equation (7) determined by the first order polynomial. presents normalization firing strength output and {pi, qi, ri} are consequence parameters of each rule.
The last layer is the aggregation that summarizes outputs obtained for each rule in the defuzzification layer, represented by Equation (8). Figure 3 illustrates the reasoning mechanism and corresponding ANFIS architecture of five layers. The basic learning rule of ANFIS is the gradient descent backpropagation, which calculates the error rates recursively from the output to the input nodes [32].
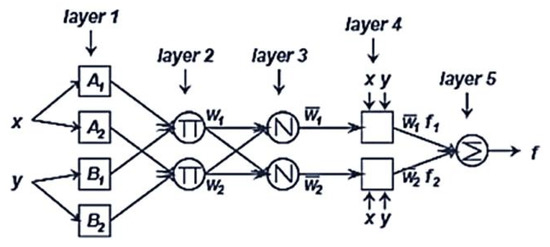
Figure 3.
ANFIS architecture of five layers.
3. Results
The collected data used for creating a conceptual model was based on an example of a pump system from a crude distillation refinery unit. At first, the collected data used for designing the model were gathered via the BPCS, offline vibration measurement, and served as input parameters. Also, it was supported by subject matter experts’ knowledge obtained through structured interviews conducted to determine output severity variables. Structured interviews were conducted to quantify the value of failure severity through a close ended questionnaire, i.e., customized criteria for severity evaluation presented in Table A1. The subject matter experts were interviewed to assess the output variable for the set of input parameters for the pumping system and this was repeated three times (S1, S2, S3, see Table A3). Experts did not see the previous answer for a certain combination of input parameters and in this way, their consistency in the given estimation was examined. Multiple Range Test showed no inconsistency in response between S1–S2, S1–S3, and S2–S3, and there was no significant difference between answers.
The variable occurrence was additionally analyzed and upgraded concerning the previous research published in 2021 [19], as explained in the following Section 3.2. Then, the FIS model for the determination of the detectability variable was customized and the logic of selecting criteria presented further in the paper. The end of the chapter presented the conceptual model of fuzzy RPN calculation utilizing the sets of ANFIS and FIS systems that lead to final results.
3.1. Severity
Adaptive Neuro Fuzzy Inference System (ANFIS) has been selected to determine an accurate severity variable. The ANFIS models predict the severity of pump failure modes. Collected data were very carefully analyzed, and also taken into consideration, besides historical data, as an additional set of data that described potential failure modes for worst case scenarios that had not happened. These data were used for trying out a model. It should be emphasized that subject matter experts had an extremely important role in predicting the responses.
This research is based on the design of the Sugeno type ANFIS system, within is compared variant of GRID partitioning and Sub clustering generation FIS technique. Hybrid learning was the base for learning of ANFIS model and was conducted in MATLAB. An important factor affecting the performance of the ANFIS model was the selection of the training data set. To improve the performance of the ANFIS model, different training data sets from BPCS were used, as additional possible failure mode parameters would lead to failure and unplanned shutdown. Therefore, the performance of the model is affected by the design of the training data sets [25]. Also, it is worth mentioning those failure mode parameters and inputs for the same type of equipment in different surroundings, locations, or environments would indicate different failure modes with different outputs. It generated variants of ANFIS models, the performance of which was analyzed and taken into consideration regarding altering the type of membership functions, partitioning techniques, learning methodology, and type of ANFIS system, Table 1. Appendix B contains sets of training and testing data, Table A3, and results from generated models for severity variable, Table A4. Therefore, the final model with the maximal R-square value of present results (Figure 4) is taken for the final concept fuzzy RPN design; it is model seven (M7) created by sub-clustering generated FIS, Figure 5. The figure presents the sample surface viewer of ANFIS severity model for pump example (M7). Where (a) presents a plot ANFIS severity dependent on the parameters RMS of flow and temperature; (b) a plot ANFIS severity dependent on the parameters temperature and RMS motor; (c) a plot ANFIS severity dependent on the parameters RMS of pump and flow; (d) a plot ANFIS Severity dependent on the parameters RMS of pump and temperature.
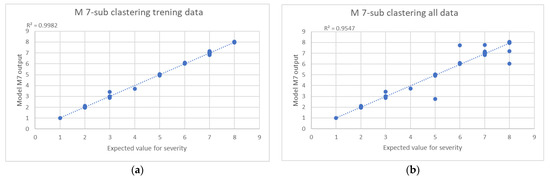
Figure 4.
Interpretation of ANFIS severity for M7: (a) ANFIS severity model deviation results for training data; (b) ANFIS severity model deviation results for all collected data.
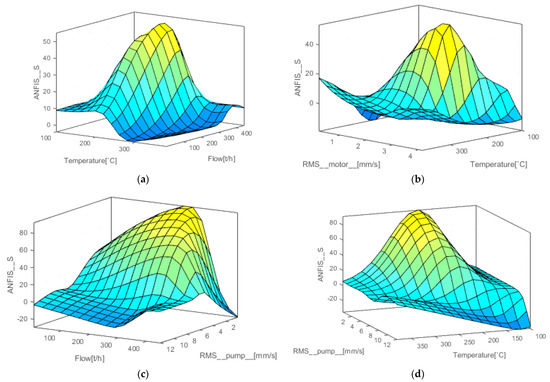
Figure 5.
The sample surface viewer of ANFIS severity model for pump example (M7): (a) Plot ANFIS Severity depending on the parameters RMS of flow and temperature; (b) Plot ANFIS Severity depending on the parameters temperature and RMS motor; (c) Plot ANFIS Severity depending on the parameters RMS of pump and flow; (d) Plot ANFIS Severity depending on the parameters RMS of pump and temperature.
3.2. Occurrence
Occurrence (O) is defined as the likelihood that a potential failure mode will occur, where the highest number indicates the highest probability of occurrence. Criteria for occurrence were customized for the refinery industry process plant based on the five year turnaround cycle presented in Table 2, with the addition of the assigned fuzzy set.
Table 2.
Customized criteria for occurrence based on turnaround cycle and assigned fuzzy sets.
Variable O is described as the frequency of failure mode occurrence, the period between failures in days. Based on the criteria for failure occurrence, three generated models were compared, the application of the Mamdani FIS system, ANFIS (Figure 6) and the logarithmic function defined by Equation (9), as seen in Figure 7. ANOVA analysis shows that there are no significant statistical deviations in each model, as seen in Table 3. For the final conceptual model, the Mamdani FIS model was chosen, and it has a maximal R-square value.
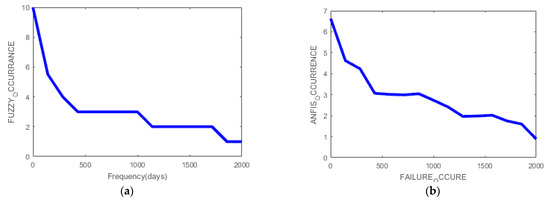
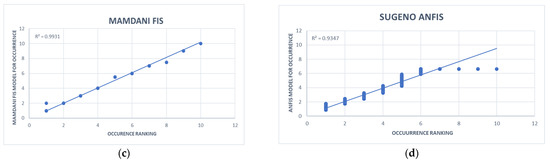
Figure 6.
Occurrence surface viewer and interpreted results for two models Fuzzy Inference System (FIS) and Adaptive Network-based Fuzzy Inference System (ANFIS): (a) FIS model occurrence plot; (b) ANFIS model occurrence plot; (c) FIS model deviation results plot; (d) ANFIS model deviation results plot.
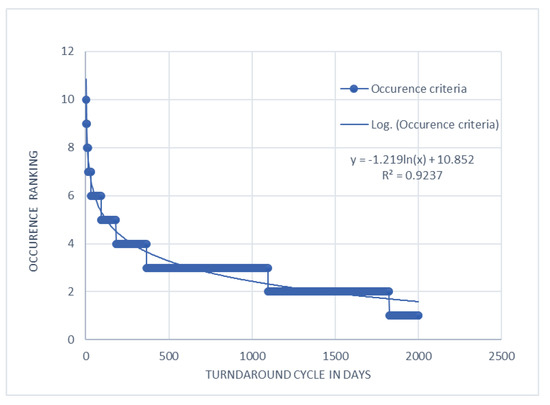
Figure 7.
Logarithms function for the occurrence.
Table 3.
ANOVA: single factor for occurrence models.
3.3. Detectability
The variable D represents the likelihood with which a failure mode is expected to be detected during the process operation before a significant failure impact occurs [38]. Table A2 represents customized criteria for detectability evaluation. The ranking is in reverse order compared to the severity and occurrence variable; the higher value presents less likelihood of detection. Concerning previous work [19], fuzzy logic was also applied in this research, and the fuzzy set is presented in Table 4., but the input factors that affect the determination of detectability were revised in cooperation with domain experts, and the reasoning for these factors was presented in Figure 8. It represents rules and decisions based on expert knowledge used for the design of the Mamdani FIS detectability model, as seen in Figure 9. According to the value of the R-square number, it is a well-defined model of detectability determination for these input factors.
Table 4.
Customized criteria for detectability based on process control systems.
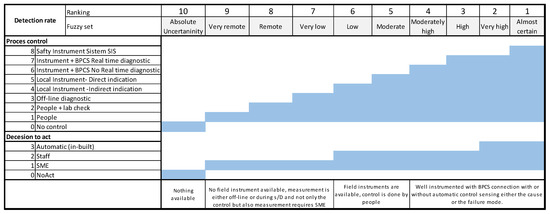
Figure 8.
Presentation of rules decisions based on expert knowledge used for the design of FIS detectability model.
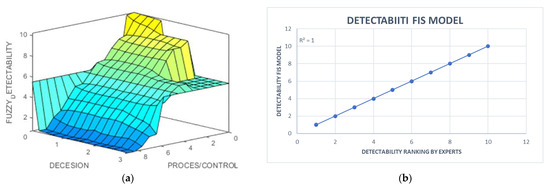
Figure 9.
Detectability surface viewer and interpreted results of FIS model: (a) Fuzzy detectability plot; (b) FIS detectability model deviation results plot.
3.4. Final Calculation of RPN
The Risk Priority Number or RPN is a product of the three variables: Severity, Occurrence, and Detectability. As mentioned previously in the introduction, FMEA analyses were criticized for several shortcomings, especially those that are connected with RPN calculation [2]. This research presents a conceptual model of digitalization of FMEA (Figure 10) utilizing a connected set of ANFIS and FIS models in one automated process directed at resolving the mid-tier fault handling process, mentioned in the paper [19], consisting of fault detection, fault classification, and fault prioritization.
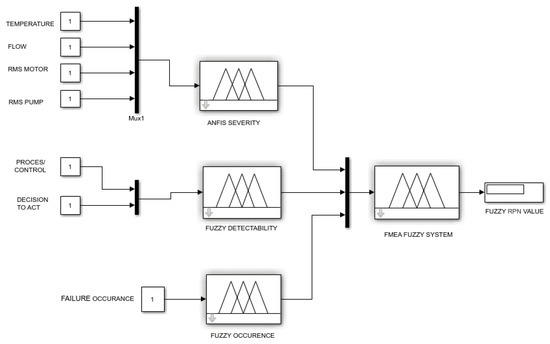
Figure 10.
The hierarchy of the combination of sets fuzzy logic systems and ANFIS for severity variable constructed using Simulink® to assess the quantity of the failure mode risk.
The first layer consists of input parameters, then ANFIS and FIS systems make up the second layer, explained in more detail in the previous sub-chapter, while the FMEA fuzzy system is taken from previous research [17], created by utilizing a business risk matrix and represents the final stage of the process. With pre-assessments of input variables S, O, and D, the problem of reliability and accuracy of input-variable assessment is solved, while with last fuzzy set is dedicated to prioritizing failure. The weight of individual variables is calculated relying on the business risk matrix, risk responses, and human expert knowledge in the form of a non-linear relationship between variables.
4. Discussion
From a safety point of view, the objectives of this research are to turn reactive incident management into a proactive risk prevention/mitigation approach in order to reduce the number of unplanned events and shutdowns, then to ensure that operation and management in the process industry are consistently aware of the risks, understand the risk and context, consciously decide what risk level is acceptable and make appropriate risk-based decisions. It is important to have a risk priority list and actions in one place according to their risk classification, which enables the risk assessment tool, in this case, FMEA. Using these risk lists, entities could prioritize actions and allocate budgets according to initial risk. This would enable the management to allocate the limited resources most effectively and make sure that all high-risk actions are budgeted and, in some cases, reduce unnecessary preventive maintenance. Today, challenges are best resolved with continuous optimization to keep assets performing high on the P-F curve and delivering business profit.
The data collected from sensors monitor the status of equipment, but that is not the diagnostic date. Utilizing machine learning, it is possible to connect deviation of process parameters with potential failure, but it is necessary to possess a large amount of historical data and the opportunity to catch bad actors to create algorithms and predict models. To analyze these data, experts and operational support are needed to interpret deviations and anomalies. To obtain the most precise estimations of the variables S, O, and D, structured closed-ended interviews were conducted so as to obtain the expert knowledge necessary to create the models with minimum bias and with higher reliability and validity. Customized linguistic criteria used in the ranking process of input variables for severity and detectability are presented in Appendix A, Table A1 and Table A2, while the occurrence frame is presented in Table 2.
This paper describes the unique process of identifying potential failure modes, precisely determining variables S, O, and D, then prioritizing failure modes and quantified risk levels through the conceptual model that consists of a combination of sets of fuzzy logic systems and ANFIS. Fuzzy sets for occurrence are present in Table 2, and fuzzy sets for detectability are in Table 4. Table A3 content consists of the sets of training and testing data for ANFIS severity learning model. The model’s variant for severity variable results is presented in Table A4. Therefore, the final models for pre-assessment of the input variable are selected with the maximum R-square value of the present results.
ANFIS and FIS models were based on data-driven principles from machine and process sensors and experts’ subject-matter knowledge in created models. The fuzzy inference system allows for the aggregation of two or more decision criteria that summarize the outcome of the assessment; also, the several decision criteria can be weighted as desired into the FIS [39]. It also presents examples of how using additional tools could help in leading the FMEA process of analysis.
The first step in the process would be to determine key parameters, which need to be measurable and continuously easily available for monitoring, and which also point to possible malfunction mechanisms. What follows is identifying risks, root cause analysis, setting up appropriate barriers and determining consequences. Furthermore, establishing the P-F curve (Figure 11 presented a defined chart for an object pump example) for each piece of equipment is essential. Based on all these tools and activities, it is then possible to develop a preventive and predictive maintenance strategy according to the analyses and described mitigation actions based on risk level. On the other end, overload preventive maintenance is sometimes ineffective, costly, and, most of the time, unnecessary. In practice, situations occur where the whole process unit needs to be stopped to open machines for inspection. This can cause problems which did not previously exist. On the other hand, cutting maintenance procedures to reduce cost can be a recipe for asset integrity degradation and can cause accidents or lead to critical failure. Due to this, it is essential to optimize maintenance plans that reduce unnecessary preventative actions but still in a way that does not jeopardize activities that mitigate or prevent any type of Health, Safety, Environmental (HSE), Process Safety Risk or Incident.
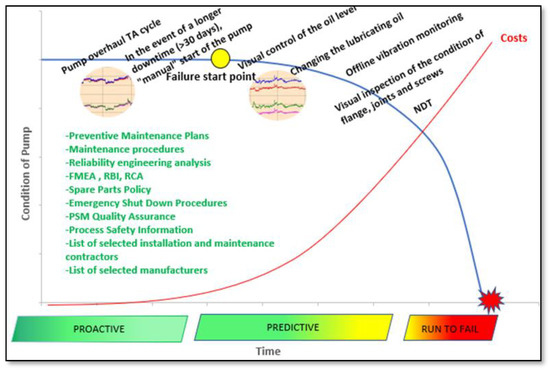
Figure 11.
P-F chart for pump.
Through this research, we have identified opportunities to improve the area of detectability analysis within FMEA. The proposed model for detectability quantified the current detectability; therefore, the idea is to quantify the barrier system, considering more than just the fault detection based on measurements provided by the system, as mentioned in the paper [19]. According to the risk level, further research should be conducted to establish minimum barrier management for each failure mode, which would help to define mitigation action to prevent, reduce, and also mitigate possible major consequences of failure.
Furthermore, a suggestion for improvement and further research is to use type-2 fuzz sets for modeling uncertainty and imprecision more effectively. The basic concepts of interval type-2 fuzzy logic are presented in the paper by Castillo et al. The characterization of type-2 fuzzy sets is a superior membership function and an inferior membership function. The interval between these two membership functions represents the footprint of uncertainty [40].
Also, it would be interesting to compare existing training algorithms used in the literature, such as the BCO algorithm, simulated annealing algorithm, and hybrid algorithm with the implemented algorithm, then find their benefits and/or weaknesses.
5. Conclusions
This paper presents a novel approach to the digitization of FMEA, eliminating the shortcomings of the conventional approach regarding the evaluation of the RPN input parameters. The conceptual model of improved FMEA (Figure 10) utilized ANFIS and FIS models in an automated process directed at resolving the fault handling process of failure detection, risk level quantification, and prioritization of dedicated mitigation action. To create models, parameters were taken that best described or indicated a possible failure for a given example, contrarily to previous research where input parameters were in linguistics form [19]. With the pre-assessments of input variables, S, O, and D solve the problem of reliability and accuracy of assessment of input variables as elaborated in this paper, while the last fuzzy set is dedicated to prioritizing failure, a conclusion proven by the previous work. It calculated the weight of variables relying on the business risk matrix, risk responses, and human expert knowledge in the form of a non-linear relationship between variables.
It is important to emphasize that the results of FMEA analysis are unique for a specific issue or failure mode, and the same type of equipment in different surroundings or locations cannot be generally extended to similar cases. In this context, the model presented is the result of a combination of information delivered by subject matter experts, who delivered their know-how in the form of linguistic variables, introducing processes and machine parameters resulting in a high level of accuracy and reduced subjectivity compared to the conventional approach of FMEA analysis. The presented concept contradicts the statement that an optimization model using fuzzy logic is based on linguistic terms that are challenging to quantify and is not dynamic in time [41]; what is presented is a data-driven principle taking into consideration online measurement parameters.
The proposed model standardizes the FMEA process, making it more reliable and objective. It identifies and prioritizes risks that need to be mitigated or eliminated, taking into account actual data in risk assessment and quantification. Implementing mitigation action often requires substantial financial and human resources. This clear representation of actual critical points enables management to make decisions more easily and allocate resources effectively so as to support the realization of mitigation action.
Author Contributions
Conceptualization and methodology, D.L.; software, J.I.; validation, J.I. and INA experts.; writing—original draft preparation, J.I.; writing—review and editing, D.L., D.P. and D.K.; investigation current state of the research field J.I. All authors have read and agreed to the published version of the manuscript.
Funding
The Article Processing Charges (APCs) is funded by the European Regional Development Fund, grant number KK.01.1.1.07.0031.
Data Availability Statement
All data generated or analyzed during this study are included in this study.
Acknowledgments
The authors are grateful to INA refinery experts for validating the model on onsite failure modes and supporting research with their knowledge and skills.
Conflicts of Interest
The authors declare no conflict of interest.
Appendix A
Appendix A contains customized RPN criteria for refinery process units and it is crucial during the ranking process of input variables S and D.
Table A1.
Customized criteria for severity evaluation.
Table A1.
Customized criteria for severity evaluation.
| Ranking | Linguistic Ranking | Business | Health | Legal and Environment | Reputation |
|---|---|---|---|---|---|
| 10 | Dangerous without warning | Extensive damage Unit is out of operation for more than 30 days. Impact on other unit and other production site operation. Permanent/medium term effect on market supply of several products. | Multiple fatalities through an Accident or Occupational Illness. | Massive effect persistent severe environmental damage. Severe disruption extending over a large area. Effect on recreational use or nature conservancy. Constant breaching of statutory or prescribed limits. | International impact International public attention. Attracting extensive adverse attention in international media. National/international policies with potentially severe impact on access to new areas, granting of licenses, and/or tax legislation. |
| 9 | Dangerous with warning | Extensive damage Unit is out of operation for 2 to 4 weeks. Impact on other unit and other production site operation. Effect on market supply of several products. | Multiple fatalities through an Accident or Occupational Illness. | Massive effect persistent severe environmental damage. Severe disruption extending over a large area. Effect on recreational use or nature conservancy. Constant breaching of statutory or prescribed limits. | International impact International public attention. Attracting extensive adverse attention in international media. National/international policies with potentially severe impact on access to new areas, granting of licenses, and/or tax legislation. |
| 8 | Very high | Major damage Unit is out of operation for 3 to 14 days or circulation for more than 2 days. Impact on other unit and other production site operation. Temporary effect on market supply of some products. | Single fatality or Permanent Total Disability Through an Accident or Occupational Illness. Multiple major injuries. | Major effect Severe environmental damage. The company is required to take extensive measures to restore the contaminated environment to its original state. Extended breaches of statutory or prescribed limits. | National impact National public concern. Attracting extensive adverse attention in the national media. Regional/national policies with potentially restrictive measures and/or impact on granting of licenses. Mobilization of action groups. |
| 7 | High | Serious damage Circulation (no feed in, no products out) for max 2 days. Impact on other unit operation and on other production site. Depending on actual season it could have effect on the market supply. | Serious injury or health effects including Permanent Partial Disability. Affecting work performance in the longer term, such as prolonged absences from work. Irreversible health damage without loss of life, e.g., noise-induced hearing loss, chronic back injuries. | Local effect Limited discharges of known toxicity. Repeated breaches of statutory or prescribed limits. Affecting neighborhood. | Considerable impact Regional public concern. Attracting extensive adverse attention in local media and slight national media and/or local/regional political attention. Adverse stance of local government and/or action groups. |
| 6 | Medium | Serious damage Unit is running with more than 25% reduced throughput vs. daily plan and/or off-spec product quality. Impact on other unit operation but no impact on other production site. No transfer required. No effect on market supply. | Serious injury or health effects including Permanent Partial Disability. Affecting work performance in the longer term, such as prolonged absences from work. Irreversible health damage without loss of life, e.g., noise-induced hearing loss, chronic back injuries. | Local effect Limited discharges of known toxicity. Repeated breaches of statutory or prescribed limits. Affecting neighborhood. | Considerable impact Regional public concern. Attracting extensive adverse attention in local media and slight national media and/or local/regional political attention. Adverse stance of local government and/or action groups. |
| 5 | Low | Unit is running with less than 25% reduced throughput vs. daily plan and/or off-spec product quality. Impact on other unit operation but no impact on other production site. No transfer required. No effect on market supply. | Minor injury or health effect (Lost Time Injury) -Affecting work performance, such as restrictions on activities (Restricted Work Cases) -Need to take a few days off to fully recover (Lost Workday Cases) -Limited health effects which are reversible, e.g., skin irritation, food poisoning. | Minor effect -Contamination. Damage sufficiently large to attack the environment. -Single breach of statutory or prescribed criteria. -Single complaint. -No permanent effect on the environment. | Limited impact -Some local public concern. -Attracting some local media and/or local political attention with potentially adverse aspects for company operations. |
| 4 | Very low | Slight damageSpared machine failure (e.g., paired pump, control valve with by-pass, level transmitter with level gauge). No impact on other unit operation. No effect on market supply. | Slight injury or health effect -including first aid case and medical treatment case -Not affecting work performance or causing disability. | Slight effect -Local environmental damage within Company premises and systems. | Slight impact—Public awareness may exist, but there is no concern among the general public. |
| 3 | Weak | Fit&Finish/Squeak&Rattle item does not conform. Defect noticed by average operators. | |||
| 2 | Very weak | Fit&Finish/Squeak&Rattle item does not conform. Defect noticed by discriminating operators. | |||
| 1 | None | No effect |
Table A2.
Customized criteria for detectability evaluation.
Table A2.
Customized criteria for detectability evaluation.
| Ranking | Linguistic Ranking | Detectability Description |
|---|---|---|
| 10 | Absoluteuncertainty | Neither Process control nor Diagnostic system nor operator will and/or can detect a potential cause/mechanism and subsequent failure mode; or the reason process control, no supervisory staff. (e.g., underground (buried) system) |
| 9 | Very remote | Neither Process control nor Diagnostic system nor operator will and/or can detect a potential cause/mechanism and subsequent failure mode. Operator staff provide supervision only. No diagnostic is available or feasible even when the system is out of operation. (Leaks, lab checks, destructive inspection techniques needed, strange noises, etc.) Master operator, engineer, is needed to observe fault. |
| 8 | Remote | Process control will not and/or cannot detect a potential cause/mechanism and subsequent failure mode. Supervision by operators exists. Diagnostics and inspection are possible only in out of operation mode. (Due to high temperature, intrusive inspection needed, etc.) Lab check is possible. Master operator, engineer, is needed to observe fault. |
| 7 | Very low | Process control will not and/or cannot detect a potential cause/mechanism and subsequent failure mode. Supervision by operators exists. Off-line diagnostics and condition monitoring exists during operation. Lab checks available. Experienced operator, engineer, is needed to observe fault. |
| 6 | Low | Based on data analysis from Process control and/or diagnostic systems (trends, lab check results) the potential cause/mechanism can be identified. (No direct sign of failure, it can only be derived from other system parameters.) Supervision by operators exists. Diagnostics and condition monitoring exists during operation. Less experience is enough to observe deviation. |
| 5 | Moderate | Based on data from Process control and/or diagnostic systems (trends, lab checks) the signs of a potential cause/mechanism can be identified. Supervision by operators exists. Real-time diagnostics and condition monitoring exists during operation. Less experience is enough to observe deviation. |
| 4 | Moderately high | The process control system and/or the real time diagnostic will detect a potential cause/mechanism and subsequent failure mode and send signal to the staff. The intervention is taken by the staff. Does not need personnel observation to detect deviation. |
| 3 | High | The process control system and/or real-time diagnostics will detect a potential cause/mechanism and subsequent failure mode and send signals to the staff. Parallelly make intervention automatically (e.g., interlock, autostart). Does not need personnel observation to detect deviation. |
| 2 | Very high | The process control system and/or real-time diagnostics will detect the signs of a potential cause/mechanism and send signals to the staff. The intervention is taken by the staff. Does not need personnel observation to detect deviation. |
| 1 | Almost certain | The process control system and/or real-time diagnostics will detect the sign of a potential cause/mechanism and send signal to the staff. Parallel make intervention automatically (e.g., interlock, autostart, CCC antisurge). |
Appendix B
Appendix B covers a set of training and testing data, and results from generated models for severity variable.
Table A3.
Set of training and testing data for ANFIS severity learning model.
Table A3.
Set of training and testing data for ANFIS severity learning model.
| Exp.no. | Temp. [°C] | Flow [t/h] | RMS Motor [mm/s] | RMS Pump [mm/s] | Failure | S1 | S2 | S3 | Mean Value (Round) | Data Sets |
|---|---|---|---|---|---|---|---|---|---|---|
| 1 | 327 | 450 | 4.16 | 12 | f1 | 8 | 8 | 8 | 8 | Training Data SETS |
| 2 | 380 | 80 | 4.16 | 0.1 | f2 | 7 | 5 | 8 | 7 | |
| 3 | 327 | 203 | 4.16 | 0.1 | f3 | 2 | 2 | 1 | 2 | |
| 4 | 380 | 203 | 4.16 | 12 | f4 | 8 | 8 | 8 | 8 | |
| 5 | 380 | 203 | 4.16 | 4.07 | f5 | 7 | 4 | 4 | 5 | |
| 6 | 353 | 327 | 0.19 | 0.1 | f6 | 1 | 4 | 4 | 3 | |
| 7 | 380 | 450 | 2.84 | 4.07 | f7 | 7 | 4 | 4 | 5 | |
| 8 | 300 | 80 | 0.19 | 0.1 | f8 | 5 | 5 | 6 | 5 | |
| 9 | 300 | 80 | 1.51 | 12 | f9 | 8 | 8 | 8 | 8 | |
| 10 | 380 | 80 | 0.19 | 0.1 | f10 | 7 | 3 | 8 | 6 | |
| 11 | 353 | 450 | 4.16 | 0.1 | f11 | 2 | 4 | 4 | 3 | |
| 12 | 353 | 327 | 0.19 | 8.03 | f12 | 8 | 8 | 8 | 8 | |
| 13 | 300 | 450 | 4.16 | 0.1 | f13 | 1 | 5 | 4 | 3 | |
| 14 | 300 | 203 | 0.19 | 12 | f14 | 8 | 8 | 8 | 8 | |
| 15 | 380 | 450 | 0.19 | 12 | f15 | 9 | 8 | 8 | 8 | |
| 16 | 300 | 450 | 2.84 | 8.03 | f16 | 8 | 8 | 8 | 8 | |
| 17 | 353 | 80 | 2.84 | 4.07 | f17 | 1 | 1 | 1 | 1 | |
| 18 | 353 | 450 | 0.19 | 4.07 | f18 | 2 | 4 | 4 | 3 | |
| 19 | 353 | 80 | 2.84 | 12 | f19 | 8 | 8 | 8 | 8 | |
| 20 | 300 | 450 | 2.84 | 12 | f20 | 8 | 8 | 8 | 8 | |
| 21 | 300 | 80 | 4.16 | 12 | f21 | 8 | 8 | 8 | 8 | |
| 22 | 356 | 89 | 0.58 | 4.55 | f22 | 7 | 4 | 4 | 5 | |
| 23 | 355 | 90 | 0.58 | 4.55 | f23 | 7 | 4 | 4 | 5 | |
| 24 | 355 | 92 | 0.58 | 4.55 | f24 | 7 | 4 | 4 | 5 | |
| 25 | 355 | 130 | 0.58 | 4.55 | f25 | 7 | 4 | 4 | 5 | |
| 26 | 277 | 119 | 0.58 | 4.55 | f26 | 7 | 7 | 7 | 7 | |
| 27 | 227 | 146 | 0.58 | 4.55 | f27 | 7 | 7 | 7 | 7 | |
| 28 | 162 | 139 | 0.58 | 4.55 | f28 | 7 | 7 | 7 | 7 | |
| 29 | 116 | 167 | 0.58 | 4.55 | f29 | 7 | 7 | 7 | 7 | |
| 30 | 99 | 81 | 0.58 | 4.55 | f30 | 7 | 8 | 8 | 8 | |
| 31 | 323 | 95 | 0.58 | 4.55 | f31 | 7 | 4 | 4 | 5 | |
| 32 | 296 | 116 | 0.58 | 4.55 | f32 | 7 | 4 | 7 | 6 | |
| 33 | 252 | 131 | 0.58 | 4.55 | f33 | 7 | 7 | 7 | 7 | |
| 34 | 185 | 121 | 0.58 | 4.55 | f34 | 7 | 7 | 7 | 7 | |
| 35 | 141 | 18 | 0.58 | 4.55 | f35 | 7 | 8 | 8 | 8 | |
| 36 | 128 | 4 | 0.58 | 4.55 | f36 | 7 | 8 | 8 | 8 | |
| 37 | 124 | 1 | 0.58 | 4.55 | f37 | 7 | 8 | 8 | 8 | |
| 38 | 356 | 89 | 0.39 | 3.2 | f38 | 4 | 2 | 1 | 2 | |
| 39 | 355 | 90 | 0.39 | 3.2 | f39 | 4 | 2 | 1 | 2 | |
| 40 | 355 | 92 | 0.39 | 3.2 | f40 | 4 | 2 | 1 | 2 | |
| 41 | 277 | 119 | 0.39 | 3.2 | f41 | 7 | 7 | 7 | 7 | |
| 42 | 227 | 146 | 0.39 | 3.2 | f42 | 7 | 7 | 7 | 7 | |
| 43 | 162 | 139 | 0.39 | 3.2 | f43 | 7 | 7 | 7 | 7 | |
| 44 | 116 | 167 | 0.39 | 3.2 | f44 | 7 | 7 | 8 | 7 | |
| 45 | 99 | 81 | 0.39 | 3.2 | f45 | 7 | 8 | 8 | 8 | |
| 46 | 323 | 95 | 0.39 | 3.2 | f46 | 4 | 2 | 1 | 2 | |
| 47 | 296 | 116 | 0.39 | 3.2 | f47 | 7 | 3 | 4 | 5 | |
| 48 | 185 | 121 | 0.39 | 3.2 | f48 | 7 | 7 | 7 | 7 | |
| 49 | 141 | 18 | 0.39 | 3.2 | f49 | 7 | 8 | 8 | 8 | |
| 50 | 128 | 4 | 0.39 | 3.2 | f50 | 7 | 8 | 8 | 8 | |
| 51 | 124 | 1 | 0.39 | 3.2 | f51 | 7 | 8 | 8 | 8 | |
| 52 | 380 | 450 | 4.16 | 0.1 | f52 | 4 | 4 | 5 | 4 | |
| 53 | 290 | 75 | 4.16 | 0.1 | f53 | 5 | 4 | 5 | 5 | |
| 54 | 380 | 450 | 4.16 | 12.1 | f54 | 8 | 8 | 8 | 8 | |
| 55 | 380 | 75 | 4.16 | 12.1 | f55 | 8 | 8 | 8 | 8 | |
| 1 | 120 | 1 | 0.39 | 3.2 | f56 | 7 | 8 | 8 | 8 | Testing Dana Sets |
| 2 | 252 | 131 | 0.39 | 3.2 | f57 | 7 | 7 | 7 | 7 | |
| 3 | 355 | 130 | 0.39 | 3.2 | f58 | 4 | 2 | 1 | 2 | |
| 4 | 120 | 1 | 0.58 | 4.55 | f59 | 7 | 8 | 8 | 8 | |
| 5 | 290 | 450 | 4.16 | 12.1 | f60 | 8 | 8 | 8 | 8 | |
| 6 | 380 | 75 | 0.19 | 0.1 | f61 | 8 | 7 | 8 | 8 | |
| 7 | 380 | 75 | 4.16 | 0.1 | f62 | 8 | 7 | 8 | 8 | |
| 8 | 290 | 75 | 4.16 | 12.1 | f63 | 8 | 8 | 8 | 8 | |
| 9 | 290 | 75 | 0.19 | 0.1 | f64 | 7 | 5 | 6 | 6 | |
| 10 | 380 | 450 | 0.19 | 12.1 | f65 | 8 | 8 | 8 | 8 | |
| 11 | 290 | 450 | 4.16 | 0.1 | f66 | 5 | 4 | 5 | 5 |
Table A4.
Models variant for severity variable results.
Table A4.
Models variant for severity variable results.
| Data Sets | Failure | M1 | M2 | M3 | M4 | M5 | M6 | M7 |
|---|---|---|---|---|---|---|---|---|
| Training Data Sets | f1 | 7.999989067 | 7.999651393 | 7.999988701 | 7.99995429 | 7.999983784 | 7.999755957 | 8.000184974 |
| f2 | 6.999988065 | 7.000106491 | 6.999987365 | 7.000042491 | 6.999980369 | 7.000102306 | 6.999752825 | |
| f3 | 1.999998799 | 2.00002253 | 1.999998311 | 1.999901552 | 2.000016019 | 1.999990333 | 2.000055382 | |
| f4 | 7.999990325 | 8.000098341 | 7.999989991 | 7.999651548 | 7.999991407 | 7.999633554 | 7.999723766 | |
| f5 | 4.99998697 | 4.999984263 | 4.999992413 | 5.000019081 | 4.999988727 | 4.999786769 | 4.999967374 | |
| f6 | 2.999993113 | 2.999964972 | 2.999993305 | 2.999926361 | 2.999949991 | 2.999694009 | 3.001887862 | |
| f7 | 4.999984696 | 5.000011033 | 4.999994006 | 4.999732608 | 4.999991683 | 5.000004912 | 5.000091361 | |
| f8 | 4.999988742 | 4.999981866 | 4.999988064 | 4.999916726 | 4.999986839 | 4.999989191 | 4.996664961 | |
| f9 | 7.999970955 | 7.999946709 | 7.999979605 | 7.999995398 | 7.999975146 | 7.999704862 | 8.00013682 | |
| f10 | 5.99998971 | 6.000158415 | 5.999989317 | 5.999643317 | 5.999991196 | 5.999918854 | 6.000134233 | |
| f11 | 3.000207021 | 3.000006045 | 3.000341299 | 3.000030048 | 3.034899942 | 3.000096687 | 3.426682421 | |
| f12 | 7.99996597 | 7.999868173 | 7.999981975 | 7.99978235 | 7.999966847 | 8.000604343 | 7.999971198 | |
| f13 | 2.999906087 | 3.000061955 | 2.999879053 | 3.000013441 | 2.992229858 | 3.000089092 | 2.855980364 | |
| f14 | 7.999984149 | 7.999995982 | 7.999983663 | 8.000507964 | 7.999979149 | 7.999715976 | 7.999995796 | |
| f15 | 7.999991788 | 8.000116339 | 7.99999042 | 8.000086068 | 7.999989271 | 8.00025871 | 8.000000075 | |
| f16 | 7.999966831 | 8.000011738 | 7.999987038 | 7.999642613 | 7.999985315 | 7.99989108 | 7.999991987 | |
| f17 | 0.999990036 | 0.999998764 | 0.99999688 | 0.999988903 | 0.999996681 | 1.000007097 | 1.000076509 | |
| f18 | 2.999989916 | 3.000025731 | 2.999994077 | 2.999931749 | 2.999983416 | 3.000009117 | 2.99928059 | |
| f19 | 7.999956683 | 8.000023883 | 7.999975048 | 7.999746806 | 7.999969999 | 7.999992864 | 7.999998749 | |
| f20 | 7.999981653 | 7.999895314 | 7.99998714 | 7.999816507 | 7.999987065 | 7.999676006 | 8.000000068 | |
| f21 | 7.99998151 | 7.999974236 | 7.9999807 | 8.000310525 | 7.999979522 | 8.00027594 | 7.999998003 | |
| f22 | 4.997205648 | 5.00000111 | 5.002665289 | 4.999997065 | 5.029261776 | 5.000009725 | 5.046233923 | |
| f23 | 4.995340507 | 5.000014243 | 4.995072721 | 4.999983126 | 5.002543323 | 5.000078794 | 4.998585025 | |
| f24 | 5.008291113 | 5.00000794 | 5.002206988 | 4.999978774 | 4.964074288 | 4.999987713 | 4.997886878 | |
| f25 | 4.999100926 | 5.000009005 | 4.99992063 | 4.999979545 | 4.985958324 | 5.000006645 | 4.989612699 | |
| f26 | 6.96392433 | 7.000018266 | 6.994200759 | 7.000008928 | 6.640920719 | 7.000016088 | 6.886794895 | |
| f27 | 6.987907694 | 6.99999929 | 6.998368466 | 6.999991982 | 6.979669884 | 6.999980236 | 6.827191871 | |
| f28 | 7.003203101 | 6.999998125 | 7.00035879 | 6.99997972 | 7.01226368 | 7.000015676 | 7.071260248 | |
| f29 | 6.999762392 | 6.999997915 | 6.999970474 | 6.9999614 | 6.998777954 | 7.000008395 | 6.972207497 | |
| f30 | 7.999787478 | 7.999997873 | 7.999966773 | 7.999999369 | 7.995750788 | 8.000007859 | 7.963422567 | |
| f31 | 4.999789938 | 5.000007383 | 4.999986995 | 4.999997565 | 4.980579377 | 5.000004062 | 4.905196618 | |
| f32 | 6.017804172 | 6.00000505 | 6.002827899 | 6.000000005 | 6.318278986 | 6.000006472 | 6.113630939 | |
| f33 | 7.028556762 | 7.000000305 | 7.004521553 | 6.999994463 | 7.088801878 | 7.000008032 | 7.16473149 | |
| f34 | 6.999543505 | 7.000000678 | 6.999767257 | 7.000001738 | 7.000223725 | 7.000009877 | 7.068797882 | |
| f35 | 7.99325016 | 7.999998504 | 8.000851415 | 7.999995605 | 8.001595948 | 8.000062728 | 7.972711516 | |
| f36 | 8.024514849 | 7.999999821 | 7.996362743 | 7.999998317 | 8.00289024 | 8.000022382 | 8.005525083 | |
| f37 | 7.981895305 | 7.999999841 | 8.002810888 | 7.999998641 | 7.998268724 | 7.999987388 | 8.013239193 | |
| f38 | 2.004514646 | 2.000019021 | 2.007134207 | 1.999956556 | 2.212324526 | 2.000071623 | 2.027584684 | |
| f39 | 1.993075785 | 1.999994924 | 1.98842483 | 1.99999298 | 2.039823732 | 1.999887111 | 1.958246677 | |
| f40 | 2.002217229 | 2.000001727 | 2.004152531 | 2.000002552 | 1.726009168 | 2.000035516 | 1.959815995 | |
| f41 | 6.999454266 | 7.000002476 | 6.999970005 | 6.99999505 | 6.555826323 | 6.999997931 | 6.921736613 | |
| f42 | 7.000055631 | 6.999999656 | 7.000034421 | 7.000001453 | 7.046512094 | 7.000001037 | 7.098674021 | |
| f43 | 6.999738207 | 6.999999815 | 6.999839334 | 7.000020052 | 6.923194269 | 6.999999529 | 6.945323633 | |
| f44 | 7.000022023 | 7.000000526 | 6.999992177 | 7.000001396 | 7.007221511 | 6.999999858 | 7.023418169 | |
| f45 | 8.000047891 | 7.999999937 | 8.000013843 | 8.000000837 | 8.017949393 | 8.000000084 | 8.028826756 | |
| f46 | 2.000362627 | 2.00000033 | 2.000546799 | 2.000000988 | 1.950034163 | 2.000002586 | 2.116738534 | |
| f47 | 5.000179724 | 5.000000165 | 4.999699543 | 5.000000476 | 5.47159183 | 5.000002303 | 4.979234171 | |
| f48 | 7.000809029 | 7.000000073 | 7.00021984 | 6.999999719 | 7.058343475 | 6.999999038 | 6.945171327 | |
| f49 | 7.99170088 | 7.999999453 | 7.998151132 | 7.99999884 | 8.002310648 | 8.000003881 | 7.966838702 | |
| f50 | 8.03083664 | 8.000000017 | 8.007726772 | 7.999999966 | 7.997843975 | 7.999983022 | 8.011512999 | |
| f51 | 7.977016937 | 8.000000009 | 7.994032983 | 8.000000012 | 7.991180928 | 8.00001343 | 8.021993044 | |
| f52 | 3.999868509 | 3.999974539 | 3.999756293 | 3.999991868 | 3.972688688 | 4.000004666 | 3.717334404 | |
| f53 | 4.999985047 | 4.999987478 | 4.99998441 | 5.000020785 | 4.999981597 | 4.999982546 | 5.00002159 | |
| f54 | 7.999994651 | 7.999892179 | 7.999992941 | 7.999973573 | 7.99999663 | 7.999995601 | 7.99999981 | |
| f55 | 7.999987765 | 8.000086762 | 7.999987123 | 7.999950408 | 7.999990936 | 7.99996105 | 8.000001979 | |
| Testing Dana Sets | f56 | 7.883699303 | 7.988041227 | 7.977005623 | 7.979612408 | 7.984127519 | 8.289646734 | 8.035697248 |
| f57 | 7.713050858 | 7.551198462 | 8.149253454 | 7.556692548 | 7.584457266 | 8.179188946 | 7.761410804 | |
| f58 | 2.638067778 | 3.629625103 | 2.117475983 | 3.576437191 | 3.745496258 | 1.631037575 | 1.998904615 | |
| f59 | 7.907930283 | 7.984396245 | 8.008376836 | 7.978873927 | 7.9926925 | 8.359863144 | 8.022374128 | |
| f60 | 5.85898468 | 5.871803405 | 5.739332778 | 6.240054657 | 7.778465255 | 7.728993255 | 8.003131572 | |
| f61 | 5.813177534 | 5.797911204 | 5.82252024 | 5.735630026 | 6.238863869 | 5.494827714 | 6.024048229 | |
| f62 | 6.780702484 | 6.763367006 | 6.793731899 | 6.722898753 | 7.124383799 | 7.110573848 | 7.203624214 | |
| f63 | 6.794233305 | 6.682533226 | 6.677880756 | 6.731826717 | 7.82254437 | 7.655578373 | 8.005303185 | |
| f64 | 4.191618331 | 4.041865156 | 4.162423686 | 4.371713753 | 4.549963976 | 4.076169004 | 7.742776761 | |
| f65 | 8.104538866 | 8.266181523 | 8.00061357 | 8.070323522 | 8.025620331 | 8.077698425 | 8.051998386 | |
| f66 | 4.643670645 | 4.015833861 | 5.312580977 | 4.080856774 | 5.775450348 | 3.22594546 | 2.74824902 |
References
- Liu, H.; Deng, X.; Jiang, W. Risk Evaluation in Failure Mode and Effects Analysis Using Fuzzy Measure and Fuzzy Integral. Symmetry 2017, 9, 162. Available online: http://www.mdpi.com/2073-8994/9/8/162 (accessed on 24 June 2022). [CrossRef]
- Liu, H.C.; Liu, L.; Liu, N. Risk evaluation approaches in failure mode and effects analysis: A literature review. Expert Syst. Appl. 2013, 40, 828–838. Available online: https://linkinghub.elsevier.com/retrieve/pii/S0957417412009712 (accessed on 8 March 2020). [CrossRef]
- Huang, J. Failure mode and effect analysis improvement—A systematic literature review and future research agenda. Reliab. Eng. Syst. Saf. 2020, 199, 12. [Google Scholar] [CrossRef]
- Srivastava, P.; Khanduja, D.; Agrawal, V.P. Mitigation of Risk Using Rule Based Fuzzy FMEA Approach. In Proceedings of the 2018 8th International Conference on Cloud Computing, Data Science & Engineering (Confluence), Noida, India, 11–12 January 2018; pp. 26–30. Available online: https://ieeexplore.ieee.org/document/8442498/ (accessed on 24 June 2022).
- Gupta, G.; Mishra, R.P. A Failure Mode Effect and Criticality Analysis of Conventional Milling Machine Using Fuzzy Logic: Case Study of RCM: A FMECA of Conventional Milling Machine Using Fuzzy Logic. Qual. Reliab. Eng. Int. 2017, 33, 347–356. [Google Scholar] [CrossRef]
- Erdem, F. Risk Assessment with The Fuzzy Logic Method for Ankara OIZ Environmental Waste Water Treatment Plant. Turk. J. Eng. 2022, 6, 268–275. [Google Scholar] [CrossRef]
- Zhou, W.; Qiu, Z.; Tian, S.; Liu, Y.; Wei, L.; Langari, R. A Novel Hybrid Approach for Risk Evaluation of Vehicle Failure Modes. Sensors 2021, 21, 661. Available online: https://www.mdpi.com/1424-8220/21/2/661 (accessed on 16 July 2022). [CrossRef]
- Godina, R.; Silva, B.G.R.; Espadinha-Cruz, P. A DMAIC Integrated Fuzzy FMEA Model: A Case Study in the Automotive Industry. Appl. Sci. 2021, 11, 3726. Available online: https://www.mdpi.com/2076-3417/11/8/3726 (accessed on 21 September 2021). [CrossRef]
- de Aguiar, J.; Scalice, R.K.; Bond, D. Using fuzzy logic to reduce risk uncertainty in failure modes and effects analysis. J. Braz. Soc. Mech. Sci. Eng. 2018, 40, 516. Available online: http://link.springer.com/10.1007/s40430-018-1437-5 (accessed on 24 June 2022). [CrossRef]
- Calache, L.D.D.R.; Zanon, L.G.; Arantes, R.F.M.; Osiro, L.; Carpinetti, L.C.R. Risk Prioritization Based on the Combination of FMEA and Dual Hesitant Fuzzy Sets Method. Production 2021, 31, e20200081. Available online: http://www.scielo.br/scielo.php?script=sci_arttext&pid=S0103-65132021000100208&tlng=en (accessed on 24 June 2022). [CrossRef]
- Tubis, A.; Werbińska-Wojciechowska, S.; Sliwinski, P.; Zimroz, R. Fuzzy Risk-Based Maintenance Strategy with Safety Considerations for the Mining Industry. Sensors 2022, 22, 441. Available online: https://www.mdpi.com/1424-8220/22/2/441 (accessed on 24 June 2022). [CrossRef]
- Geramian, A.; Abraham, A.; Ahmadi Nozari, M. Fuzzy logic-based FMEA robust design: A quantitative approach for robustness against groupthink in group/team decision-making. Int. J. Prod. Res. 2019, 57, 1331–1344. Available online: https://www.tandfonline.com/doi/full/10.1080/00207543.2018.1471236 (accessed on 8 March 2020). [CrossRef]
- Gallab, M.; Bouloiz, H.; Alaoui, Y.L.; Tkiouat, M. Risk Assessment of Maintenance activities using Fuzzy Logic. Procedia Comput. Sci. 2019, 148, 226–235. Available online: https://linkinghub.elsevier.com/retrieve/pii/S1877050919300687 (accessed on 8 March 2020). [CrossRef]
- Kadena, E.; Koçak, S.; Takács-György, K.; Keszthelyi, A. FMEA in Smartphones: A Fuzzy Approach. Mathematics 2022, 10, 513. Available online: https://www.mdpi.com/2227-7390/10/3/513 (accessed on 24 June 2022). [CrossRef]
- Cruz-Rivero, L.; Méndez-Hernández, M.L.; Mar-Orozco, C.E.; Aguilar-Lasserre, A.A.; Barbosa-Moreno, A.; Sánchez-Escobar, J. Functional Evaluation Using Fuzzy FMEA for a Non-Invasive Measurer for Methane and Carbone Dioxide. Symmetry 2022, 14, 421. Available online: https://www.mdpi.com/2073-8994/14/2/421 (accessed on 10 April 2023). [CrossRef]
- Vykydal, D.; Plura, J.; Halfarova, P.; Klaput, P. Advance Aproaches to Failure Mode and Effect Analysis (FMEA) Application. Metalurgija 2015, 54, 675–678. [Google Scholar]
- Di Bona, G.; Silvestri, A.; Forcina, A.; Petrillo, A. Total efficient risk priority number (TERPN): A new method for risk assessment. J. Risk Res. 2018, 21, 1384–1408. [Google Scholar] [CrossRef]
- Şimşek, B.; İç, Y.T. Fuzzy failure mode and effect analysis application to reduce risk level in a ready-mixed concrete plant: A fuzzy rule based system modelling approach. Math. Comput. Simul. 2020, 178, 549–587. Available online: https://linkinghub.elsevier.com/retrieve/pii/S0378475420302287 (accessed on 23 October 2020). [CrossRef]
- Ivančan, J.; Lisjak, D. New FMEA Risks Ranking Approach Utilizing Four Fuzzy Logic Systems. Machines 2021, 9, 292. Available online: https://www.mdpi.com/2075-1702/9/11/292 (accessed on 26 June 2022). [CrossRef]
- Jozi, S.A.; Saffarian, S.; Shafiee, M. Environmental Risk Assessment of a Gas Power Plant Exploitation Unit Using Integrated TOP-EFMEA Method. Pol. J. Environ. Stud. 2012, 21, 95–105. [Google Scholar]
- Fabis-Domagala, J.; Domagala, M.; Momeni, H. A Concept of Risk Prioritization in FMEA Analysis for Fluid Power Systems. Energies 2021, 14, 6482. Available online: https://www.mdpi.com/1996-1073/14/20/6482 (accessed on 10 April 2023). [CrossRef]
- Webert, H.; Döß, T.; Kaupp, L.; Simons, S. Fault Handling in Industry 4.0: Definition, Process and Applications. Sensors 2022, 22, 2205. Available online: https://www.mdpi.com/1424-8220/22/6/2205 (accessed on 25 May 2022). [CrossRef]
- Alawad, H.; An, M.; Kaewunruen, S. Utilizing an Adaptive Neuro-Fuzzy Inference System (ANFIS) for Overcrowding Level Risk Assessment in Railway Stations. Appl. Sci. 2020, 10, 5156. Available online: https://www.mdpi.com/2076-3417/10/15/5156 (accessed on 26 June 2022). [CrossRef]
- Boran, S.; Gökler, S.H. A Novel FMEA Model Using Hybrid ANFIS–Taguchi Method. Arab. J. Sci. Eng. 2020, 45, 2131–2144. Available online: http://link.springer.com/10.1007/s13369-019-04071-7 (accessed on 26 June 2022). [CrossRef]
- Vaidhehi, V. The role of Dataset in training ANFIS System for Course Advisor. Int. J. Innov. Res. Adv. Eng. 2014, 1, 5. [Google Scholar]
- Nouei, M.T.; Kamyad, A.V.; Sarzaeem, M.; Ghazalbash, S. Fuzzy risk assessment of mortality after coronary surgery using combination of adaptive neuro-fuzzy inference system and K-means clustering. Expert Syst. 2016, 33, 230–238. [Google Scholar] [CrossRef]
- Kaur, H.; Sood, S.K. Adaptive Neuro Fuzzy Inference System (ANFIS) based wildfire risk assessment. J. Exp. Theor. Artif. Intell. 2019, 31, 599–619. Available online: https://www.tandfonline.com/doi/full/10.1080/0952813X.2019.1591523 (accessed on 26 June 2022). [CrossRef]
- Pamučar, D.; Bozanic, D.; Puška, A.; Marinković, D. Application of neuro-fuzzy system for predicting the success of a company in public procurement. Decis. Mak. Appl. Manag. Eng. 2022, 5, 135–153. Available online: https://dmame-journal.org/index.php/dmame/article/view/400/97 (accessed on 18 September 2022). [CrossRef]
- Bozanic, D.; Tešić, D.; Marinković, D.; Milić, A. Modeling of neuro-fuzzy system as a support in decision-making processes. Rep. Mech. Eng. 2021, 2, 222–234. Available online: https://www.rme-journal.org/index.php/asd/article/view/58/41 (accessed on 18 September 2022). [CrossRef]
- Chopra, S.; Dhiman, G.; Sharma, A.; Shabaz, M.; Shukla, P.; Arora, M. Taxonomy of Adaptive Neuro-Fuzzy Inference System in Modern Engineering Sciences. Ahmed SH, editor. Comput. Intell. Neurosci. 2021, 2021, 1–14. Available online: https://www.hindawi.com/journals/cin/2021/6455592/ (accessed on 26 June 2022). [CrossRef]
- Soto, J.; Melin, P.; Castillo, O. A New Approach for Time Series Prediction Using Ensembles of IT2FNN Models with Optimization of Fuzzy Integrators. Int. J. Fuzzy Syst. 2018, 20, 701–728. Available online: http://link.springer.com/10.1007/s40815-017-0443-6 (accessed on 18 September 2022). [CrossRef]
- Soto, J.; Melin, P.; Castillo, O. Time series prediction using ensembles of ANFIS models with genetic optimization of interval type-2 and type-1 fuzzy integrators. Int. J. Hybrid Intell. Syst. 2014, 11, 211–226. Available online: https://www.medra.org/servlet/aliasResolver?alias=iospress&doi=10.3233/HIS-140196 (accessed on 18 September 2022). [CrossRef]
- Tolga, A.C.; Parlak, I.B.; Castillo, O. Finite-interval-valued Type-2 Gaussian fuzzy numbers applied to fuzzy TODIM in a healthcare problem. Eng. Appl. Artif. Intell. 2020, 87, 103352. Available online: https://linkinghub.elsevier.com/retrieve/pii/S095219761930288X (accessed on 18 September 2022). [CrossRef]
- ISO 31000:2018; Risk Management—Principles and Guidelines. ISO: Geneva, Switzerland, 2018.
- Wmargolin. Why the Original Model of the P-F Curve Is the Correct Model. Aladon. 2020. Available online: https://www.aladon.com/why-the-original-model-of-the-p-f-curve-is-the-correct-model/ (accessed on 16 July 2022).
- Malek, M.A. Pressure Relief Valves: ASME and API Code Simplified; McGraw-Hill Mechanical Engineering Series; McGraw-Hill: New York, NY, USA, 2006; p. 475. [Google Scholar]
- Karaboga, D.; Kaya, E. Adaptive network based fuzzy inference system (ANFIS) training approaches: A comprehensive survey. Artif. Intell. Rev. 2019, 52, 2263–2293. Available online: http://link.springer.com/10.1007/s10462-017-9610-2 (accessed on 26 June 2022). [CrossRef]
- IEC 60812:2018; BSI Failure Modes and Effects Analysis (FMEA and FMECA). BSI Standards Limited: London, UK, 2018.
- Vilela, M.; Oluyemi, G.; Petrovski, A. A holistic approach to assessment of value of information (VOI) with fuzzy data and decision criteria. Decis. Mak. Appl. Manag. Eng. 2020, 3, 97–118. Available online: https://dmame-journal.org/index.php/dmame/article/view/116/57 (accessed on 18 September 2022). [CrossRef]
- Castillo, O.; Melin, P.; Kacprzyk, J.; Pedrycz, W. Type-2 Fuzzy Logic: Theory and Applications. In Proceedings of the 2007 IEEE International Conference on Granular Computing (GRC 2007), Fremont, CA, USA; 2007; p. 145. Available online: http://ieeexplore.ieee.org/document/4403084/ (accessed on 8 March 2020).
- Di Nardo, M.; Murino, T.; Osteria, G.; Santillo, L.C. A New Hybrid Dynamic FMECA with Decision-Making Methodology: A Case Study in an Agri-Food Company. Appl. Syst. Innov. 2022, 5, 45. Available online: https://www.mdpi.com/2571-5577/5/3/45 (accessed on 13 May 2023). [CrossRef]
Disclaimer/Publisher’s Note: The statements, opinions and data contained in all publications are solely those of the individual author(s) and contributor(s) and not of MDPI and/or the editor(s). MDPI and/or the editor(s) disclaim responsibility for any injury to people or property resulting from any ideas, methods, instructions or products referred to in the content. |
© 2023 by the authors. Licensee MDPI, Basel, Switzerland. This article is an open access article distributed under the terms and conditions of the Creative Commons Attribution (CC BY) license (https://creativecommons.org/licenses/by/4.0/).