Article

Functional Evaluation Using Fuzzy FMEA for a Non-Invasive Measurer for Methane and Carbone Dioxide

by
Lidilia Cruz-Rivero
1,*,
María Leonor Méndez-Hernández
1,
Carlos Eusebio Mar-Orozco
2,
Alberto A. Aguilar-Lasserre
3,
Alfonso Barbosa-Moreno
2 and
Josué Sánchez-Escobar
1
1
Instituto Tecnológico Superior de Tantoyuca, National Technological Institute of Mexico, Veracruz 92100, Mexico
2
Instituto Tecnológico de Ciudad Madero, National Technological Institute of Mexico, Veracruz 92100, Mexico
3
Instituto Tecnológico de Orizaba, National Technological Institute of Mexico, Veracruz 92100, Mexico
*
Author to whom correspondence should be addressed.
Symmetry 2022, 14(2), 421; https://doi.org/10.3390/sym14020421
Submission received: 25 December 2021 / Revised: 8 February 2022 / Accepted: 16 February 2022 / Published: 20 February 2022
(This article belongs to the Special Issue Computational Intelligence and Soft Computing: Recent Applications)

Abstract

:
This paper combines the use of two tools: Failure Mode and Effect Analysis (FMEA) and Fuzzy Logic (FL), to evaluate the functionality of a quantifier prototype of Methane gas (CH4) and Carbon Dioxide (CO2), developed specifically to measure the emissions generated by cattle. Unlike previously reported models for the same purpose, this device reduces damage to the integrity of the animal and does not interfere with the activities of livestock in their development medium. FMEA and FL are used to validate the device’s functionality, which involves identifying possible failure modes that represent a more significant impact on the operation and prevent the prototype from fulfilling the function for which it was created. As a result, this document presents the development of an intelligent fuzzy system type Mamdani, supported in the Fuzzy Inference System Toolbox of MatLabR2018b®, for generating a risk priority index. A Fuzzy FMEA model was obtained to validate the prototype for measuring Methane and Carbon Dioxide emissions, which allows considering this prototype as a reliable alternative for the reliable measurement of these gases. This study was necessary as a complementary part in the validation of the design of the prototype quantifier of CH4 and CO2 emissions. The methods used (classic FMEA and Fuzzy FMEA) to evaluate the RPN show asymmetric graphs due to data disparity. Values in the classical method are mostly lower than the Mamdani model results due to the description of the criteria with which it is evaluated.

1. Introduction

There are methodologies applied to security and reliability engineering, which include fuzzy FMEA, fuzzy Bayesian networks, fuzzy Markov chains, to name a few. When developing prototypes, it is not always possible to obtain fully reliable data due to the unavailability of primary observations and the consequent scarcity of data on the failure of their components [1]. To handle such situations, fuzzy set theory has been used successfully in approaches to security and reliability evaluation under conditions of uncertainty.
The use of Fuzzy Logic to help decision-making was applied in health in conjunction with the Failure Mode and Effects Analysis (FMEA) to improve decision-making. This was achieved by improving the way patients were processed before the study, the assessment, and treatment assignment; the use of Fuzzy Logic in the application of the FMEA was considered better than its conventional use [2]. The use of software to manage the risks of failure in medical equipment was developed around the use of the FMEA; it is described that the classic use of the FMEA is not enough to achieve an accurate analysis, so, in this case, additionally the use of the Fuzzy Logic was made to replace how the three main parameters of the FMEA are evaluated [3]. FMEA has been applied extensively in the reliability engineering domain. Risk Priority Number (RPN), which is the product of Occurrence (O), Severity (S), and Detection (D) of a failure, is the most important measure used in FMEA for prioritizing risk, and they integrate fuzzy belief structure and grey relational projection method (GRPM) to avoid the use of traditional RPN [4].
According to work “An extension to fuzzy developed failure mode and effect analysis FDFMEA application for aircraft landing system,” the use of FMEA methodology and Fuzzy Logic was implemented for the evaluation of commercial aircraft in Iran, as described in this work; the main focus of the study was the analysis of the components of the landing systems since a large number of failures were recorded annually, in addition to the results of the Fuzzy Logic model also evaluated by the conventional method to offer a comparison of the results, the defuzzification method applied to the Fuzzy Logic model was Center of Gravity and for the construction of the model five participating experts to describe according to their knowledge the elements of evaluation of Severity, Occurrence, and Detection, and with the results, it was possible to establish measures and prioritize failures [5].
In the analysis of a lathe-type polishing machine, the fuzzy approach with the FMEA was also used, in this case, to improve reliability, because one of the most important parts of the entire polishing system presented a series of failures, and it was considered to individually evaluate the components of this part of the machine. As in other works, a model of Fuzzy Logic was used, and some of the important data that are mentioned in work around the use of the FMEA are that conventional use considers the evaluation of RPN almost equally in the evaluation criteria of Severity, Occurrence, and Detection; since these are pre-established, the assessment of the RPN is inadequate, instead they consider that each criterion should be based around the context of this problem with different weights and that these should also be established at the discretion of the experts in the field, so the use of Fuzzy Logic was chosen to improve this part of the methodology [6].
Greenhouse Gas (GHG) emissions are an important factor contributing to current climate change; it is said that of the sources that contribute to the increase in emissions due to livestock activities [7], the breeding of cattle is pointed out as one of the activities of this sector that contributes the most in emissions, although in the absence of reliable monitoring methods there is imprecision in terms of the data reported worldwide, and due to this different works have been done to quantify the emissions of livestock, through the creation of measurement devices to determine more precisely to what extent livestock influences emissions; however, according to this work reporting on this type of device, these have not been suitable for: the comfort and integrity of the animal and neither to measure in the natural conditions where cattle usually develop.
A device capable of belching CO2 and CH4 gas emissions from cattle was developed since, at the time in Mexico, there were no reports about the development of this type of device, and due to the cattle ranching activity present in several of the states, one of them was the state of Veracruz. The only countries that documented the development of this type of device were the United States, Colombia, and Argentina [8].
The prototype was statistically analyzed to verify that the proposed design is functional [9]. This device presents an alternative to measure GHG without harming the animal; however, it is necessary to carry out functionality studies, so an FMEA is used to evaluate the possibilities of failures, to explain the possible causes and the effects they can represent.
The application of the FMEA in conjunction with the Artificial Intelligence technique called Fuzzy Logic (FL), is proposed to ensure the correct functioning of the prototype through a functional evaluation, which implies identifying possible failure modes that represent a more significant impact on the operation and prevent the prototype from fulfilling the function for which it was created. The FL, in this case, is used to address the imprecision of the evaluation criteria of the classic FMEA and adapt them to the specific problem and facilitate the evaluation process commonly used in this tool. In this case, the prototype quantifier of gas emissions was put into operation in a group of cows previously selected to carry out a series of measurement tests; during the realization of these tests, different failures were observed in the equipment, and possible failure modes were considered, creating uncertainty about the correct functioning of the other elements that make up the device and the possibility that these may fail at a certain time and affect the measurements.
Due to the behaviors that cattle perform, especially in natural development conditions, several parts of the device are exposed to situations that represent a certain degree of risk for the proper functioning of the device, and the possibility of risk to failure in some elements was unknown before the performance of the tests of the quantifier. During the trials carried out, they resulted in damage: sensors, connectors, and the support structure that holds the device to the cow; these failures caused mostly inaccuracy in the measurements as verified after repairing some of these failures.
This work aims to know and assess the risk of possible failure modes, causes, and effects of a device that quantifies carbon dioxide (CO2) and methane (CH4) emissions from cattle; through the use of the Failure Mode and Effect Analysis (FMEA) and Fuzzy Logic (LD) methodology.
Currently, the application of the FMEA methodology has been extended in different areas and adapted to specific needs. However, it is generally recognized that there are four types of FMEA: system, design, process, and service [10]. Failure mode and effects analysis (FMEA) is a typical prevention reliability analysis method that has an inherent advantage in improving systems and processes. However, traditional FMEA also contains some deficiencies in rating risks, weighing risk factors, and ranking failure modes [11].
To overcome the inherent drawbacks of the conventional FMEA method and the uncertainty regarding the experts’ evaluation, fuzzy methods, for example, triangular/trapezoidal and fuzzy sets, have been developed [12].
As mentioned by [2,13], combining the FMEA method with fuzzy theory provides a more efficient tool than the classic FMEA method in the presence of imprecise information and uncertainty. Fuzzy Logic could be used to reduce the drawback in assessing and prioritizing failures of traditional FMEA with more certainty.
Fuzzy Logic is a technique that allows us to represent and manipulate some variables’ imprecise and uncertain nature. However, its use is not limited only to these variables but also to those that are known and precise to a certain degree; the technique allows us to make these types of variables coexist mainly in cases of decision making and the development of intelligent systems, cases where imprecision and uncertainty modeling is necessary and also the inclusion of known variables for a joint analysis.
In a work related to fuzzy FMEA assessment of hydroelectric earth dam failure modes, the rule bases for the two stages and the membership functions were obtained through in-depth interviews with a focus group composed of experts. The fuzzification process assured more consistency to the RPN calculation, treated the imprecision, and provided fair management value to prioritize actions and improve monitoring processes [14], which is the goal of this proposed work.
The use of analysis methods such as classic FMEA to assess the safety and reliability of a system relies heavily on knowledge of component failure. Any uncertainty that arises in the probability of component failure will impact the results [1]. On the other hand, the lack of availability of failure data would introduce uncertainty in the analysis results in this sense. To reduce this uncertainty, it is proposed to use fuzzy FMEA.

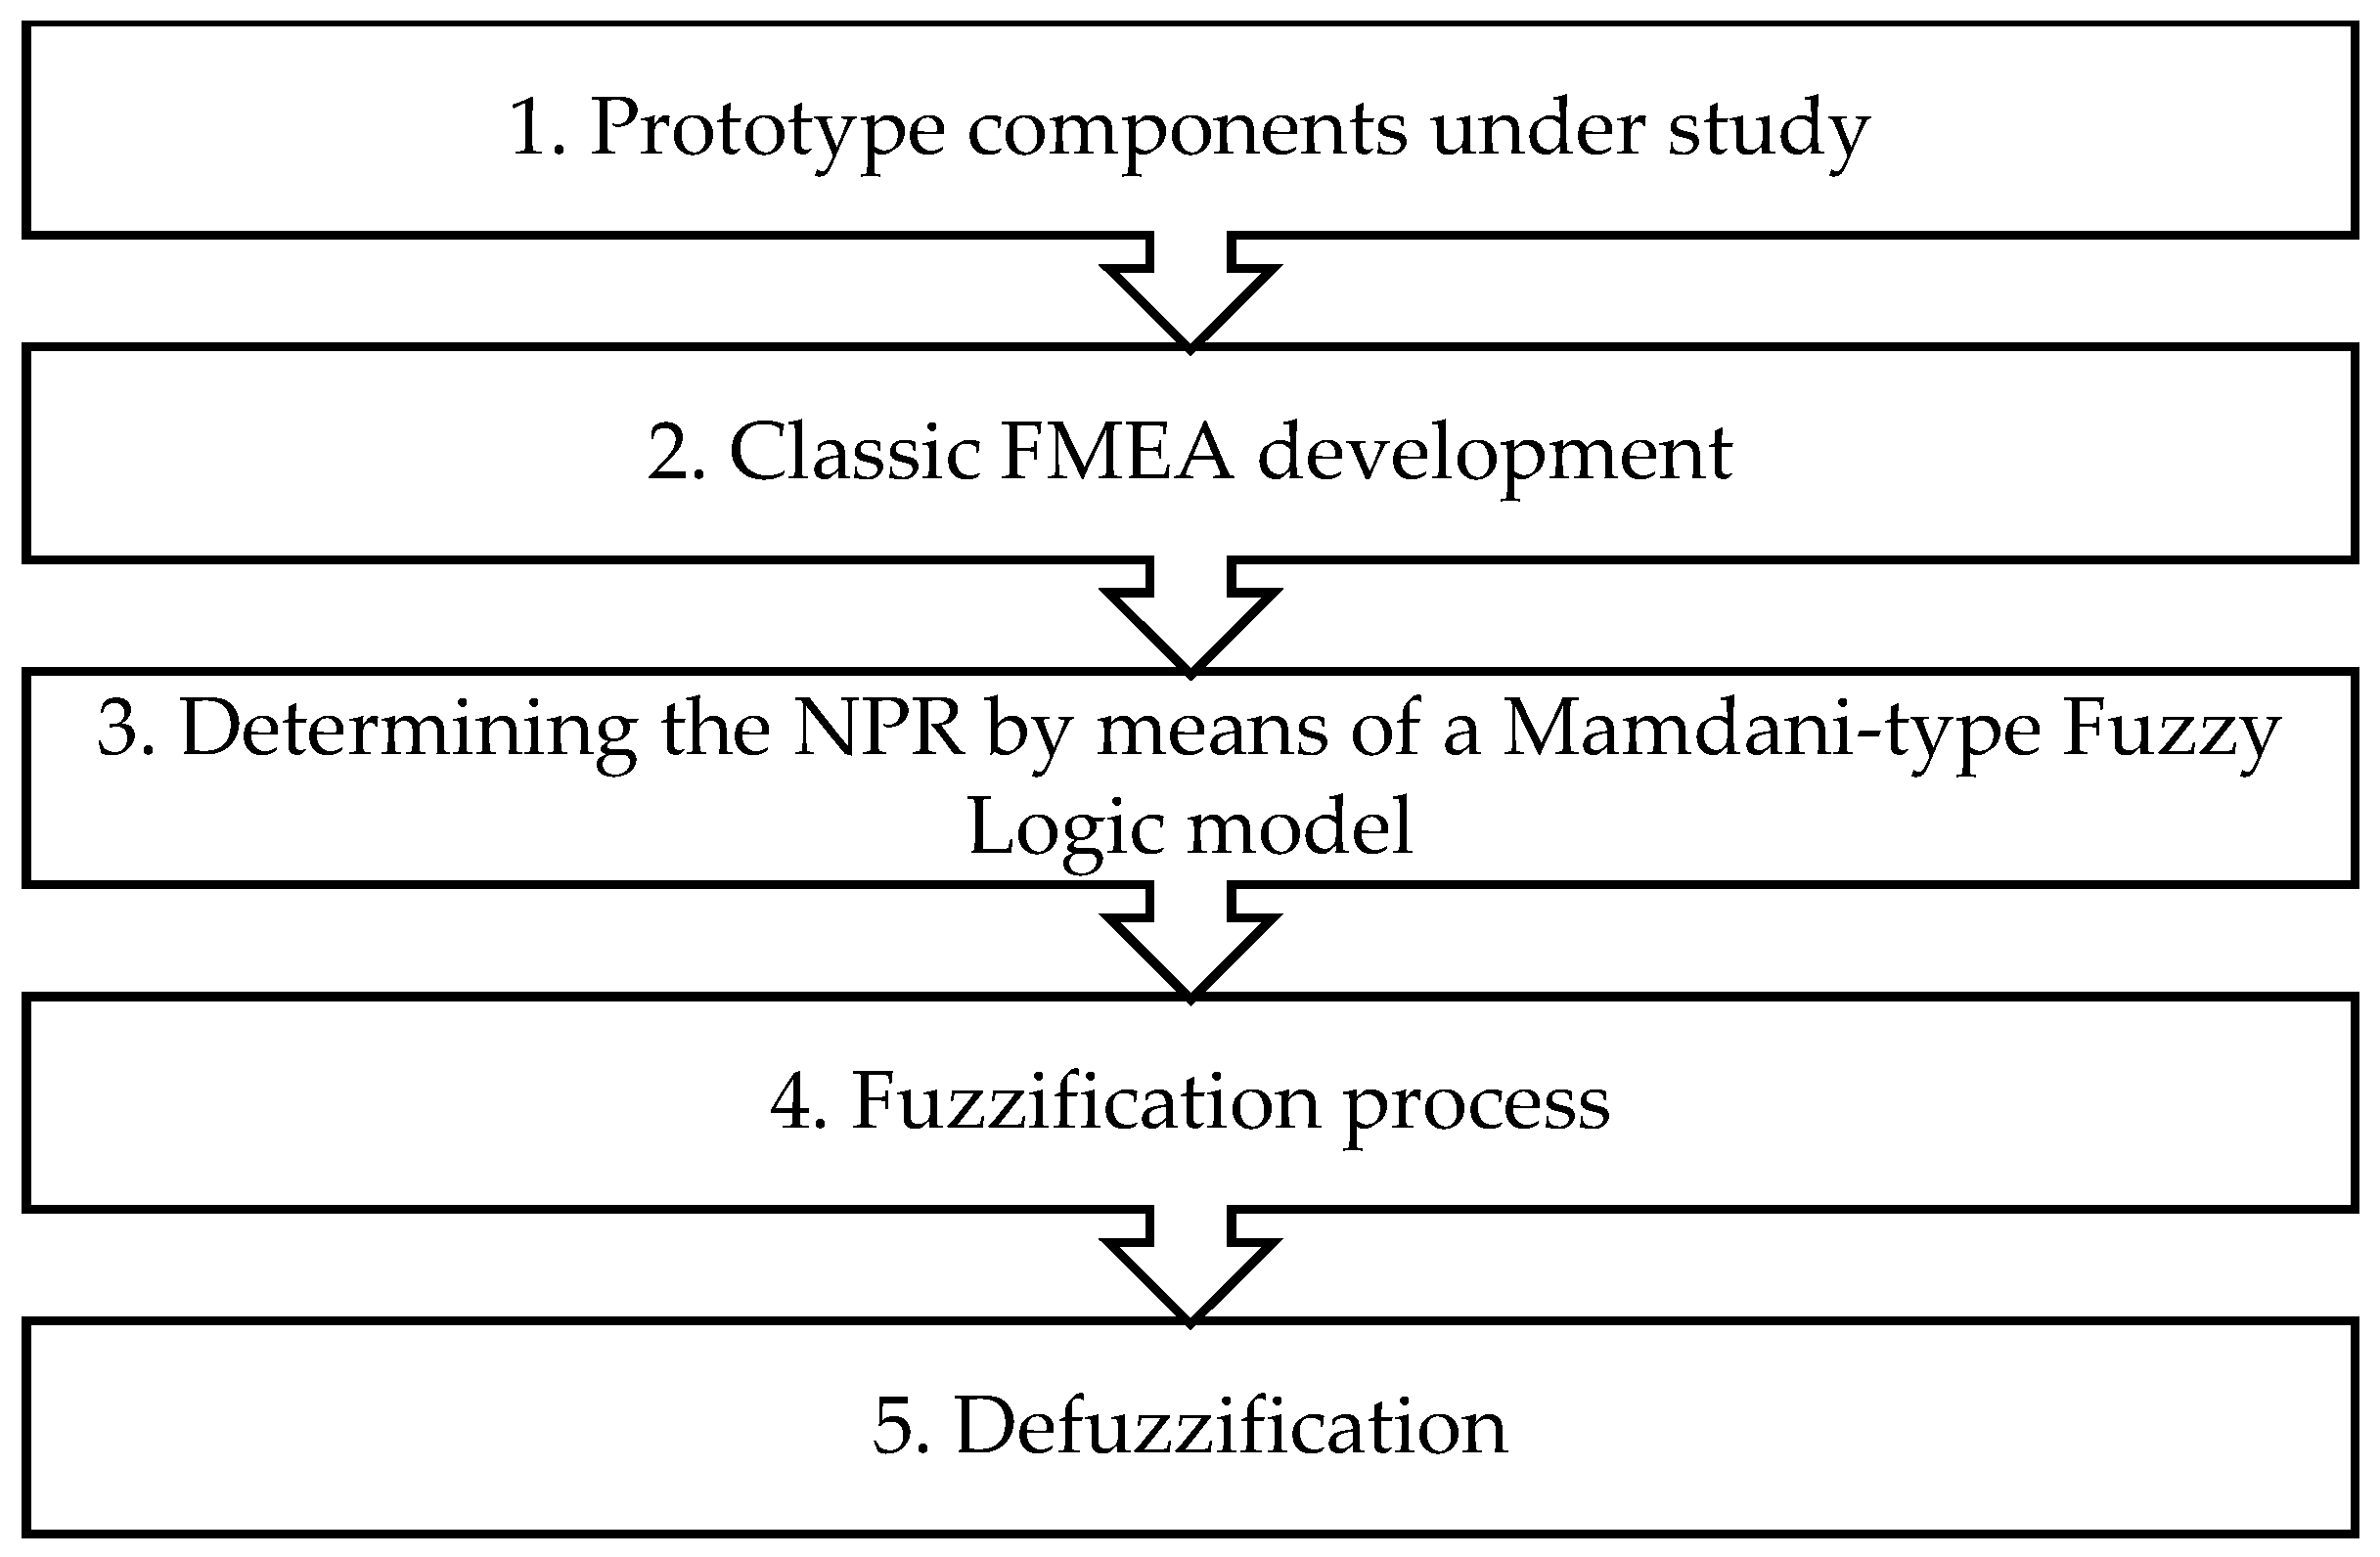
2. Materials and Methods

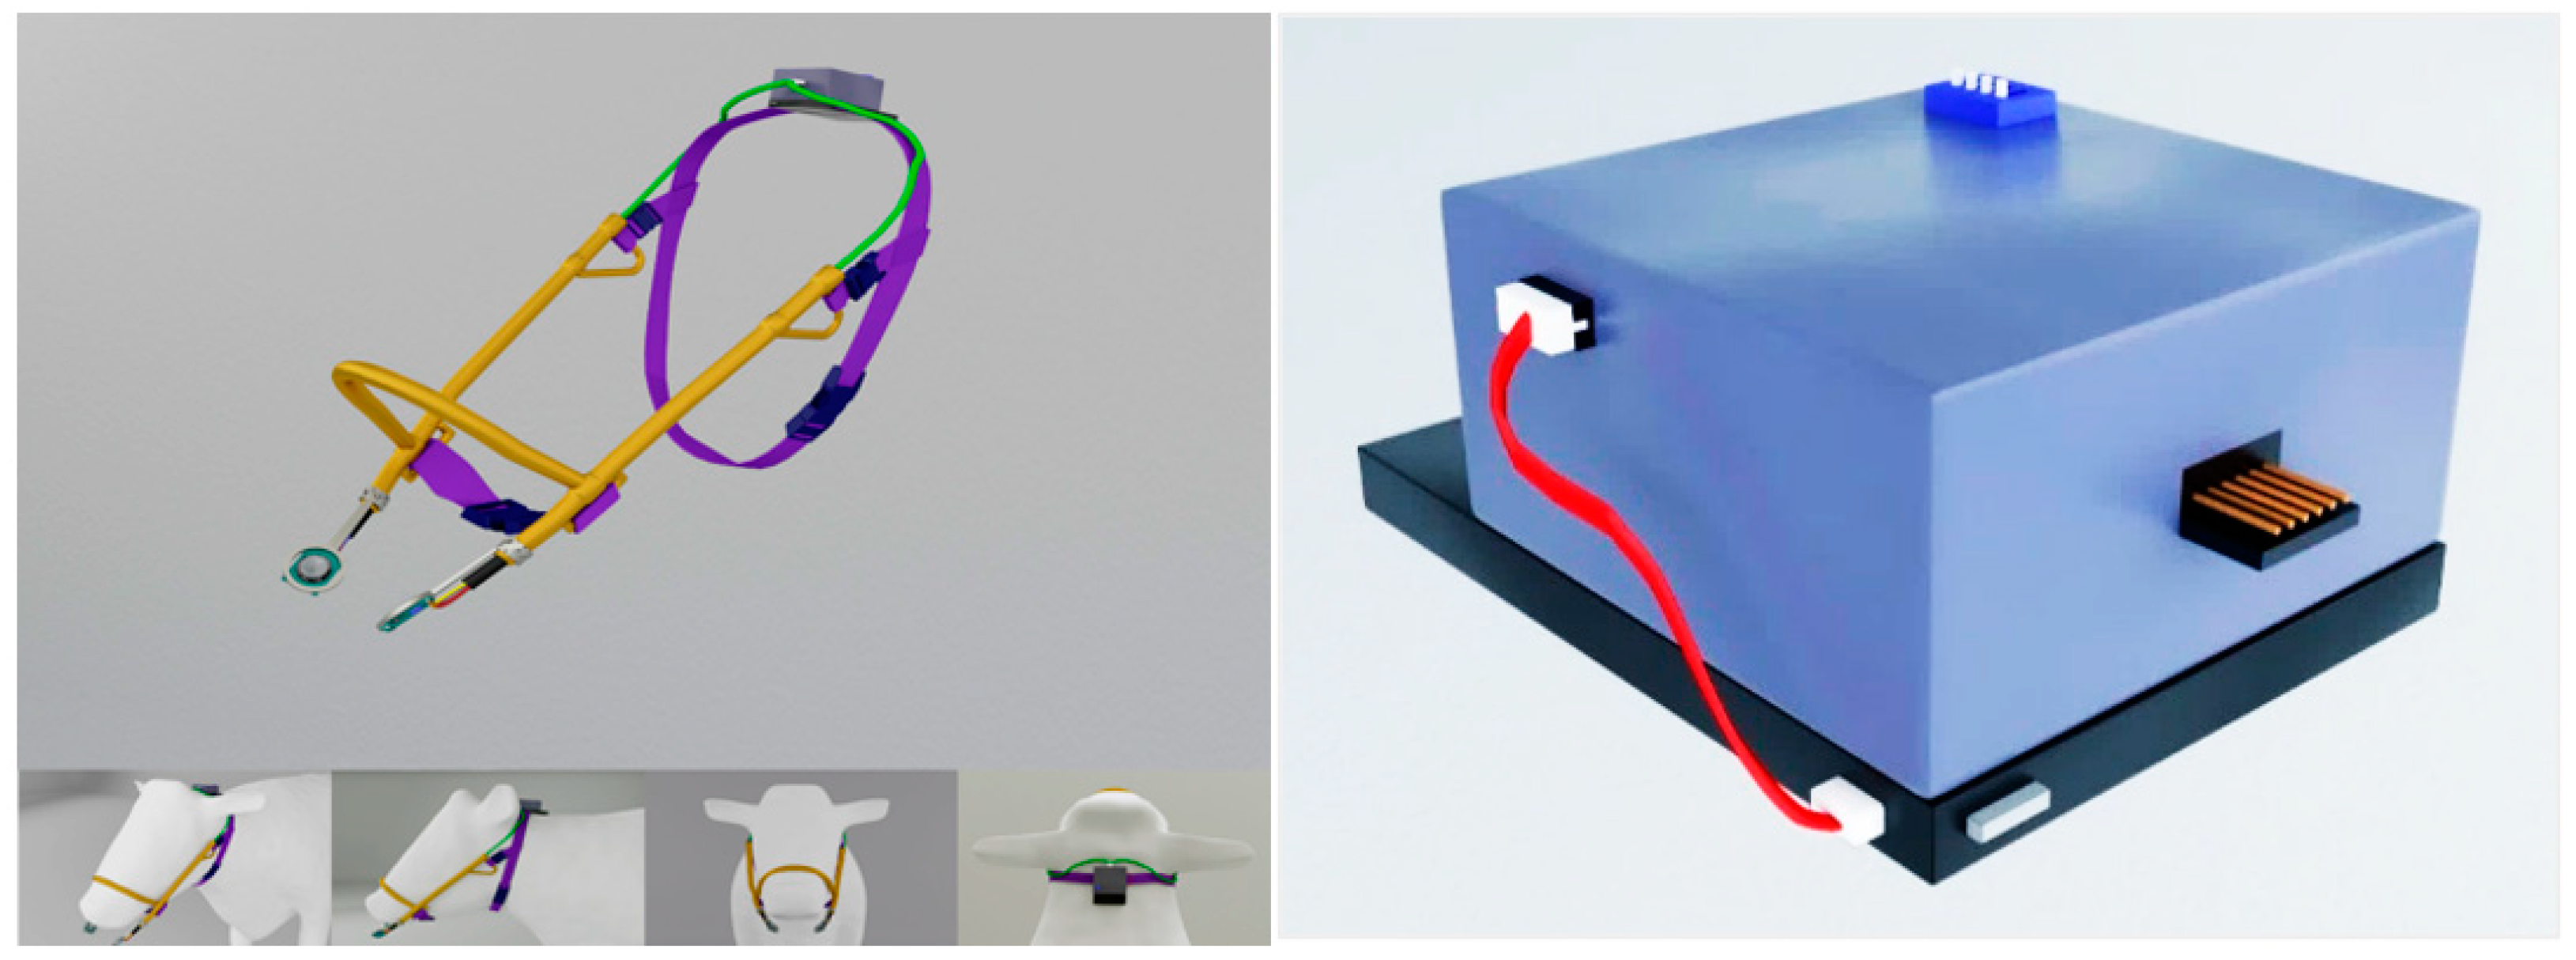
2.1. Prototype Description

The prototype to be evaluated fulfills the primary function of estimating the emissions of gases that cattle generate and exhale, specifically those of CO2 and CH4 gas, the main components in this device are: an emitter and a receiver; in turn, the subcomponents are: a battery, a support structure that adjusts to the characteristics of the bovine tube, two sensors that quantify gas emissions, straps that attach the support structure and other components to the head of the animal and the receiver which is connected to the computer to record the information of the measurements. The following image shows the device as well as the installation in cattle (Figure 1).
Components associated with major failures and representing a negative impact on the operation of the quantifier were strategically selected (Table 1).
The proposed framework for dealing with fuzzy FMEA is illustrated in Figure 2. The framework comprises three main phases, including (1) prototype components under study; (2) classic FMEA development; (3) determining the NPR through a Mamdani-type Fuzzy Logic model; (4) fuzzification process; and (5) defuzzification.

2.2. Classic FMEA Development

For the development of the FMEA, those components associated with important faults and that represent a great negative impact on the operation of the quantifier was selected. For the selection of the necessary elements to carry out the prototype failure risk study, first, a group of specialists participating in the design of the device was the ones who, through brainstorming, managed to generate a list of both potential components and subcomponents for the study, after an analysis based on the relationship of components and their importance in the operation, it was possible to prioritize the said list, the resulting elements that will be used for the development of the study are shown below (Table 2).

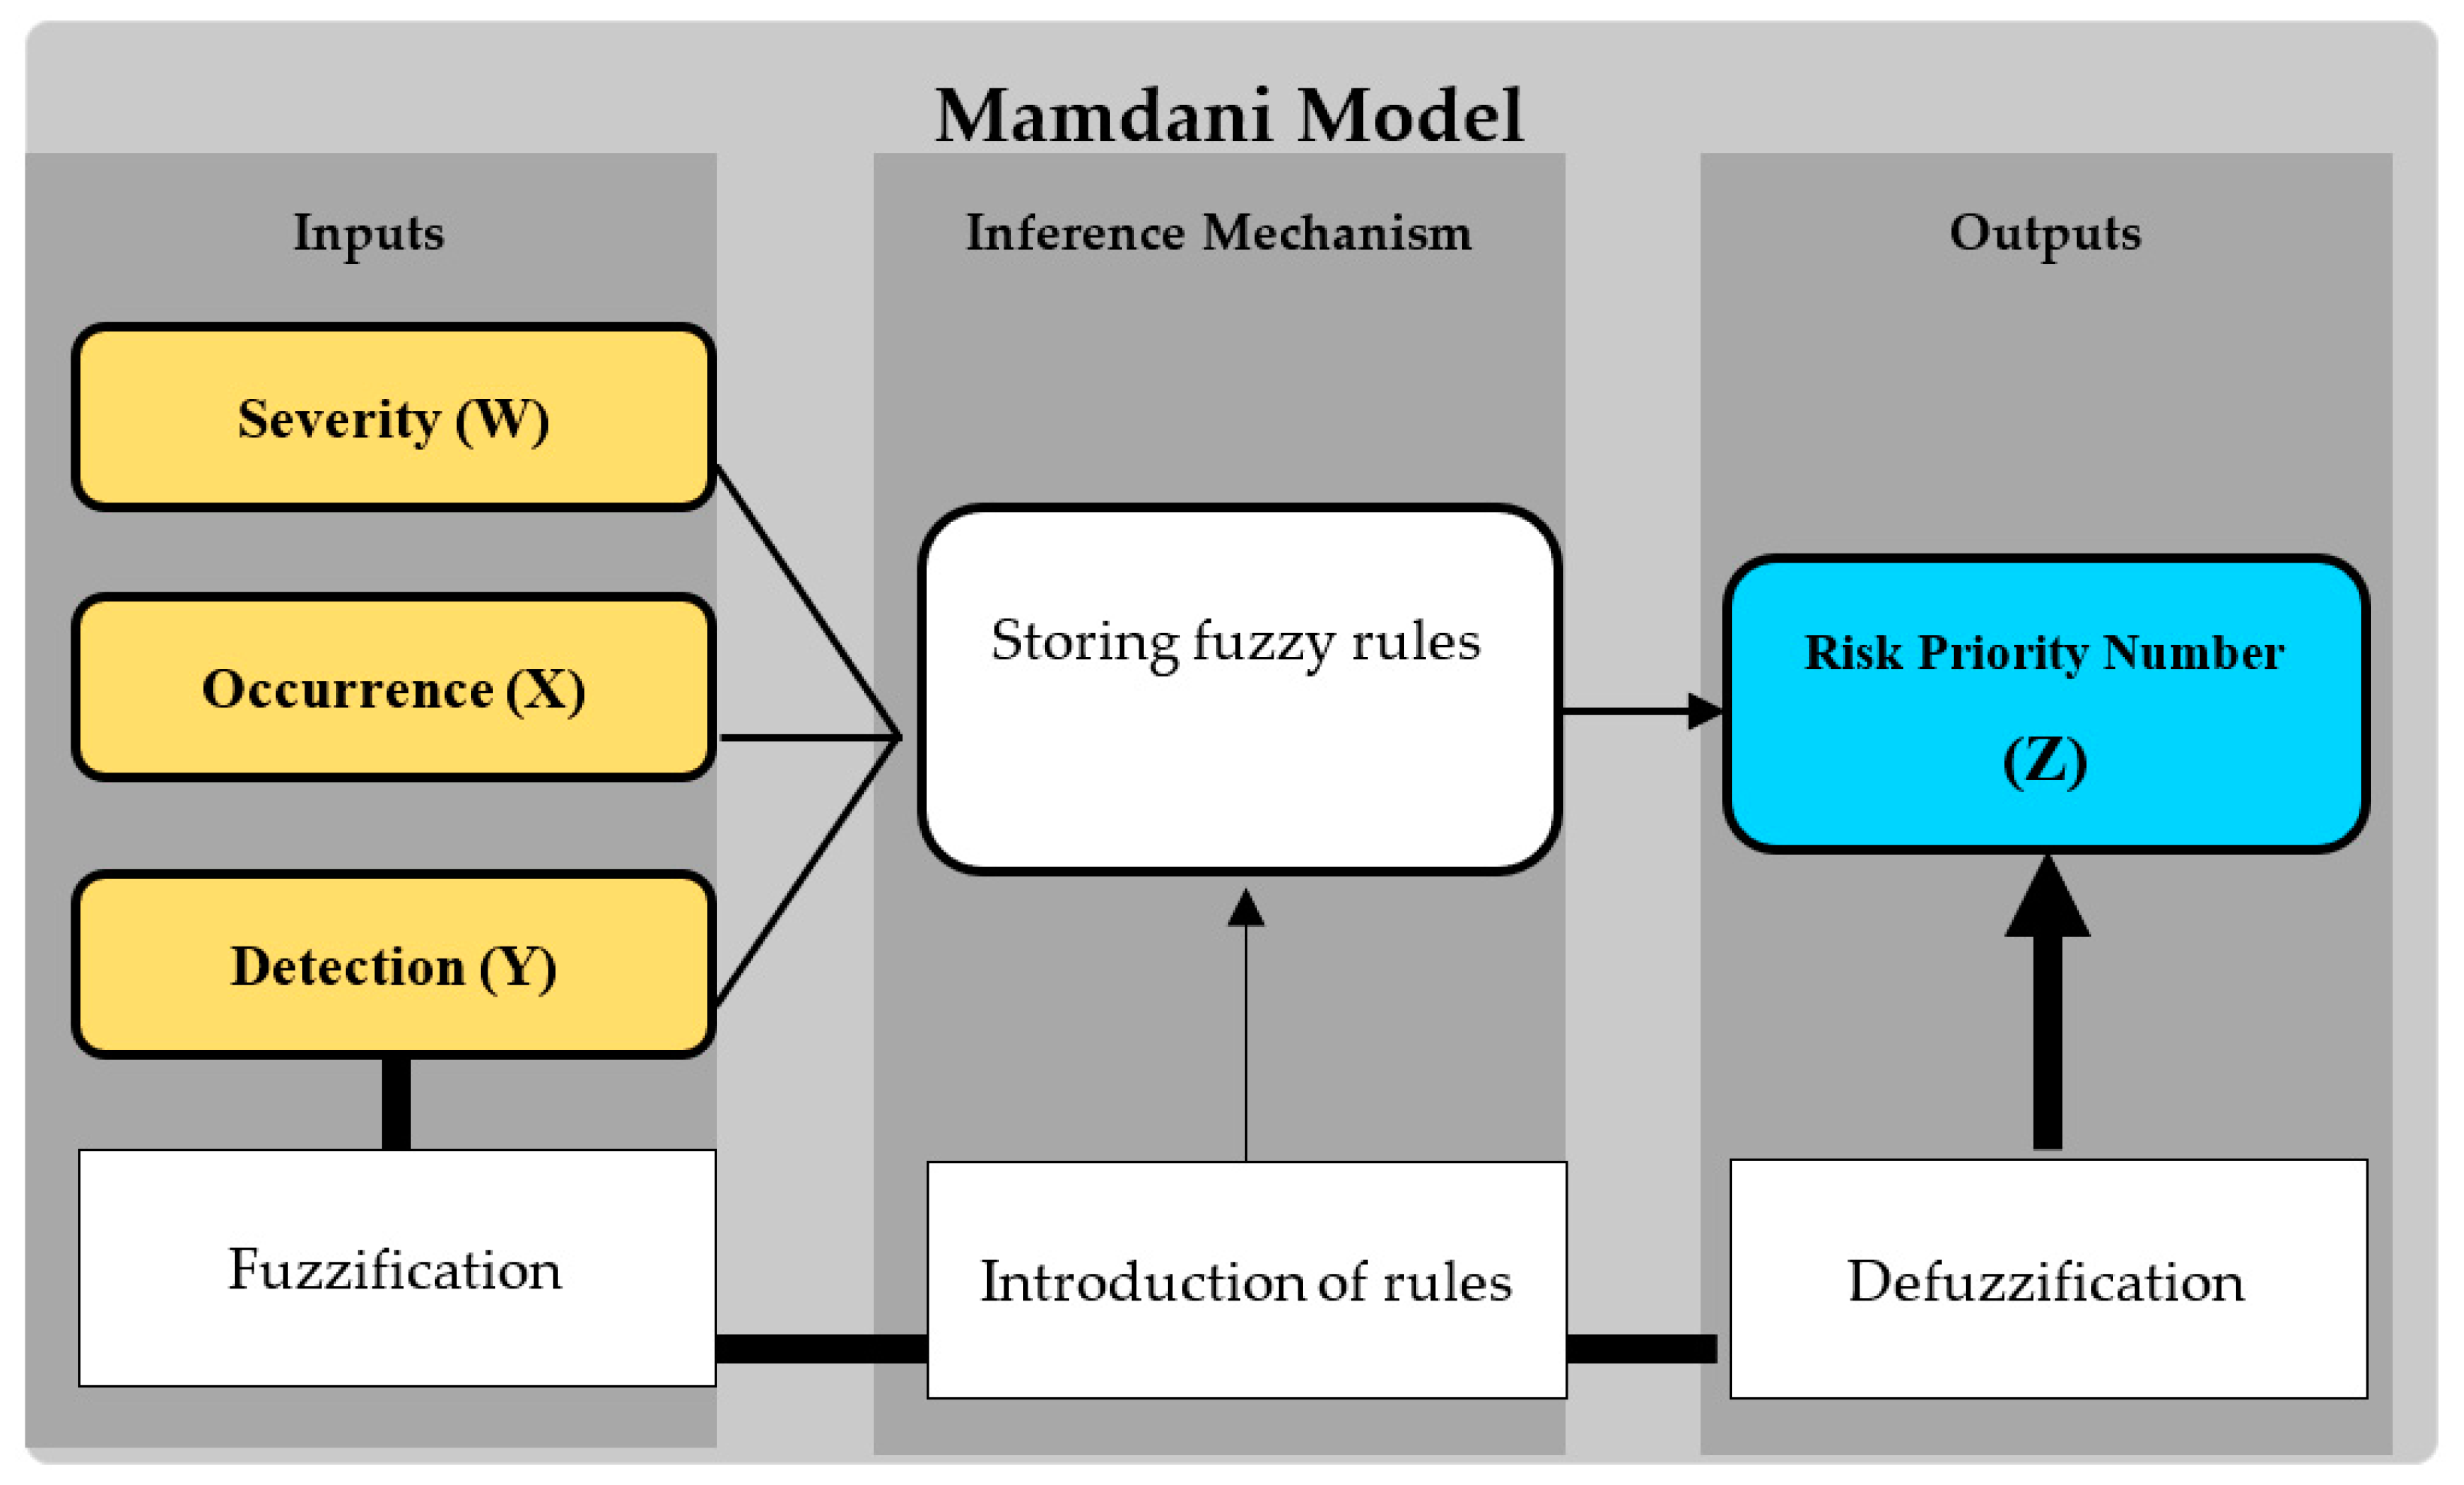
2.3. NPR through a Mamdani-Type Fuzzy Logic Model3

For the elaboration of the fuzzy FMEA model, the MatLabR2018b® LD toolbox was used. This toolbox made it possible to define a fuzzy system through dialogs and windows that facilitated data entry. A set of functions was available to analyze the behavior of these systems.
In the adaptation of the criteria and the RPN, it is also necessary to provide the linguistic or categorical values that serve as a reference to use as values that allow the Mamdani type model to assess rules; it is based on these values that the ranges of values will be considered representative by the specialists, which in fuzzification is where the categorical criteria will be modeled with these scales, geometric figures, and the criteria proposed for evaluation by specialists are those shown in the following table (Table 3).
The Fuzzy Logic model is proposed to evaluate the risk of possible failures in the prototype; the construction is done around the variables used by the FMEA. The process for obtaining the risk or RPN is carried out through inference rules based on human knowledge.

Model Architecture

For this case study, the general architecture of the Pure Type Fuzzy System or Mamdani was used [15]. Mamdani fuzzy models do not require mathematical models of the system to control and are obtained from fuzzy rules or fuzzy conditional statements [16], like the one presented in this work. The structure of the fuzzy model poses input and output variables, with the inputs for this model being the evaluation criteria Severity, Occurrence, and Detection and output being the RPN indicator.
The development of the Mamdani model consists of three important processes [15]: fuzzification, the introduction of inference rules, and the defuzzification of the outputs. The following diagram represents the structure of this type of model applied to the case (Figure 3).

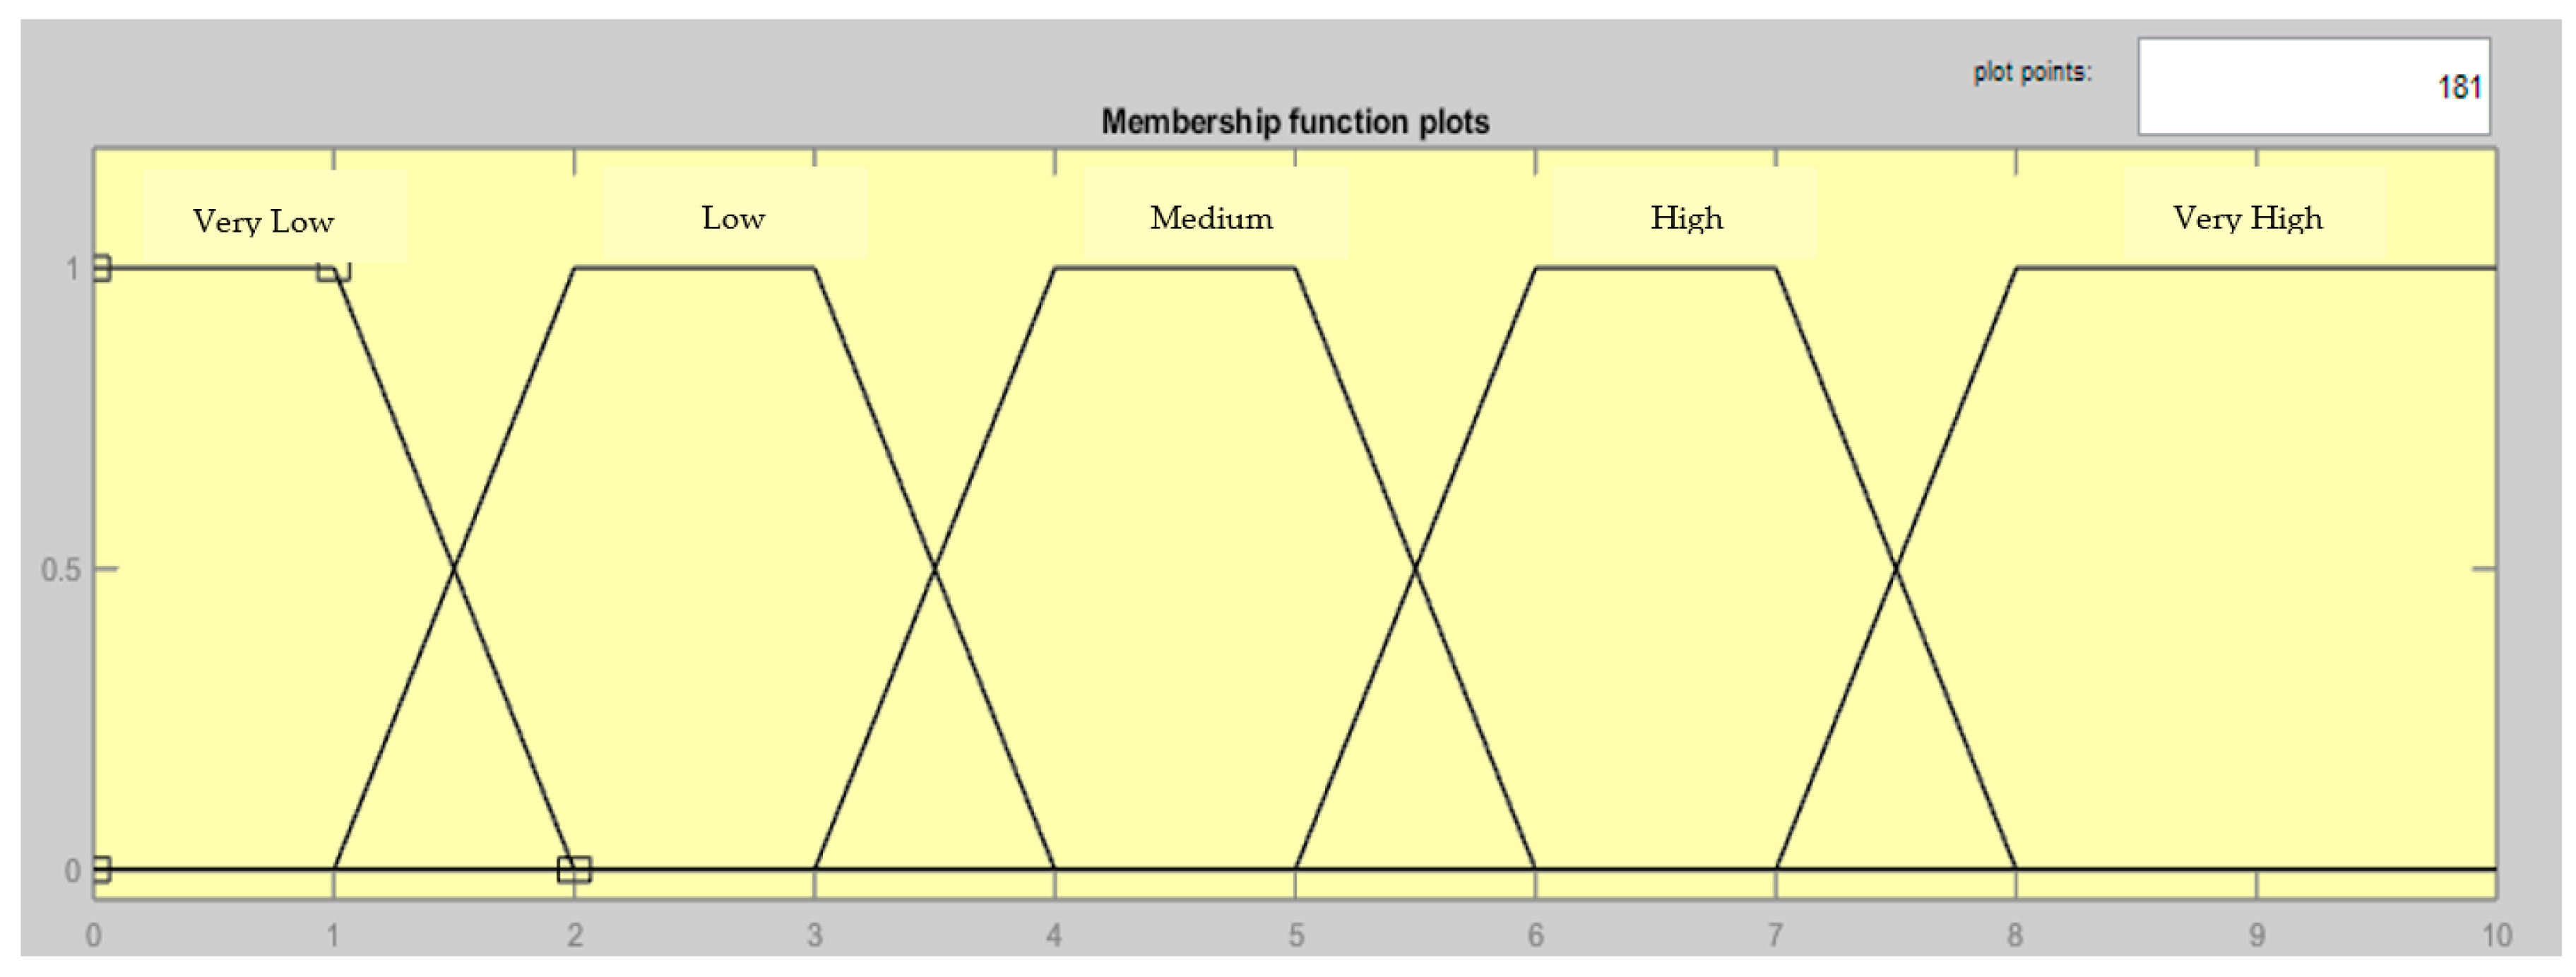
2.4. Fuzzification Process

The fuzzification process is carried out for the input and output variables of the model, these being those of the FMEA: Severity, Occurrence, Detection and the RPN, for each variable, the geometric figures that best fit the membership function to the type of variable that is modeled are assigned, the approximate ranges of the variables are also established and are associated with linguistic values, being those that will represent the fuzzy sets of the Mamdani model.
The input variables for this model are Severity (W) (Table 4, Figure 4), Occurrence (X), and Detection (Y). Based on these and from the resulting fuzzy sets, the inference rules that determine the corresponding output scenarios will be established; these variables in the model represent the evaluation parameters with which it is sought to analyze the risk or RPN (Z) of each of the rulings raised in the FMEA.
Equation (1). Severity Fuzzy Set “Very Low” (W).
μ V e r y   L o w ( S e v e r i t y ) = { 1 1 ;         W 1 W 1 2 1 ;     1 < W < 2 0 ;           2 W
Equation (2). Severity Fuzzy Set “Low” (W).
μ L o w ( S e v e r i t y ) = { 0 ;         W 1 1 2 W 2 1 ;     1 < W < 2           1 ;       2 W 3 1 W 3 4 3 ;     3 < W < 4 0 ;           4 W
Equation (3). Severity Fuzzy Set “Medium” (W).
μ M e d i u m ( S e v e r i t y ) = { 0 ;         W 3 1 4 W 4 3 ;     3 < W < 4           1 ;       4 W 5 1 W 5 6 5 ;     5 < W < 6 0 ;           6 W
Equation (4). Severity Fuzzy Set “High” (W).
μ H i g h ( S e v e r i t y ) = { 0 ;         W 5 1 6 W 6 5 ;     5 < W < 6           1 ;       6 W 7 1 W 7 8 7 ;     7 < W < 8 0 ;           8 W
Equation (5). Severity Fuzzy Set “Very High” (W).
μ V e r y   H i g h ( S e v e r i d a d ) = { 1 0 ;         W 7 8 W 8 7 ;     7 < W < 8 1 ;           8 W
In this model, the Occurrence was raised in considering the measurement periods, that is, to establish a reference metric on how often failures may occur in the prototype. The time in which it was used for the gas measurement studies in the cattle was taken into account, which in this case was per week: 5 days of measurement and two days of rest, and for each day of measurement, two tests were taken so that in a measurement period the prototype was used on ten occasions, in this context it is that the scale was established regarding the failures that occurred and from this, it was possible to relate the frequency to categorical values that qualify the occurrence. As a result, the following fuzzy sets are proposed with the representative ranges of each geometric figure (Table 5).
The detection variable represents the ease with which the prototype operator can identify the failure modes during the tests and/or after the tests, the scale established as in the conventional way reaches up to 10, for this case the sets associated with such a scale are the following (Table 6).

3. Results

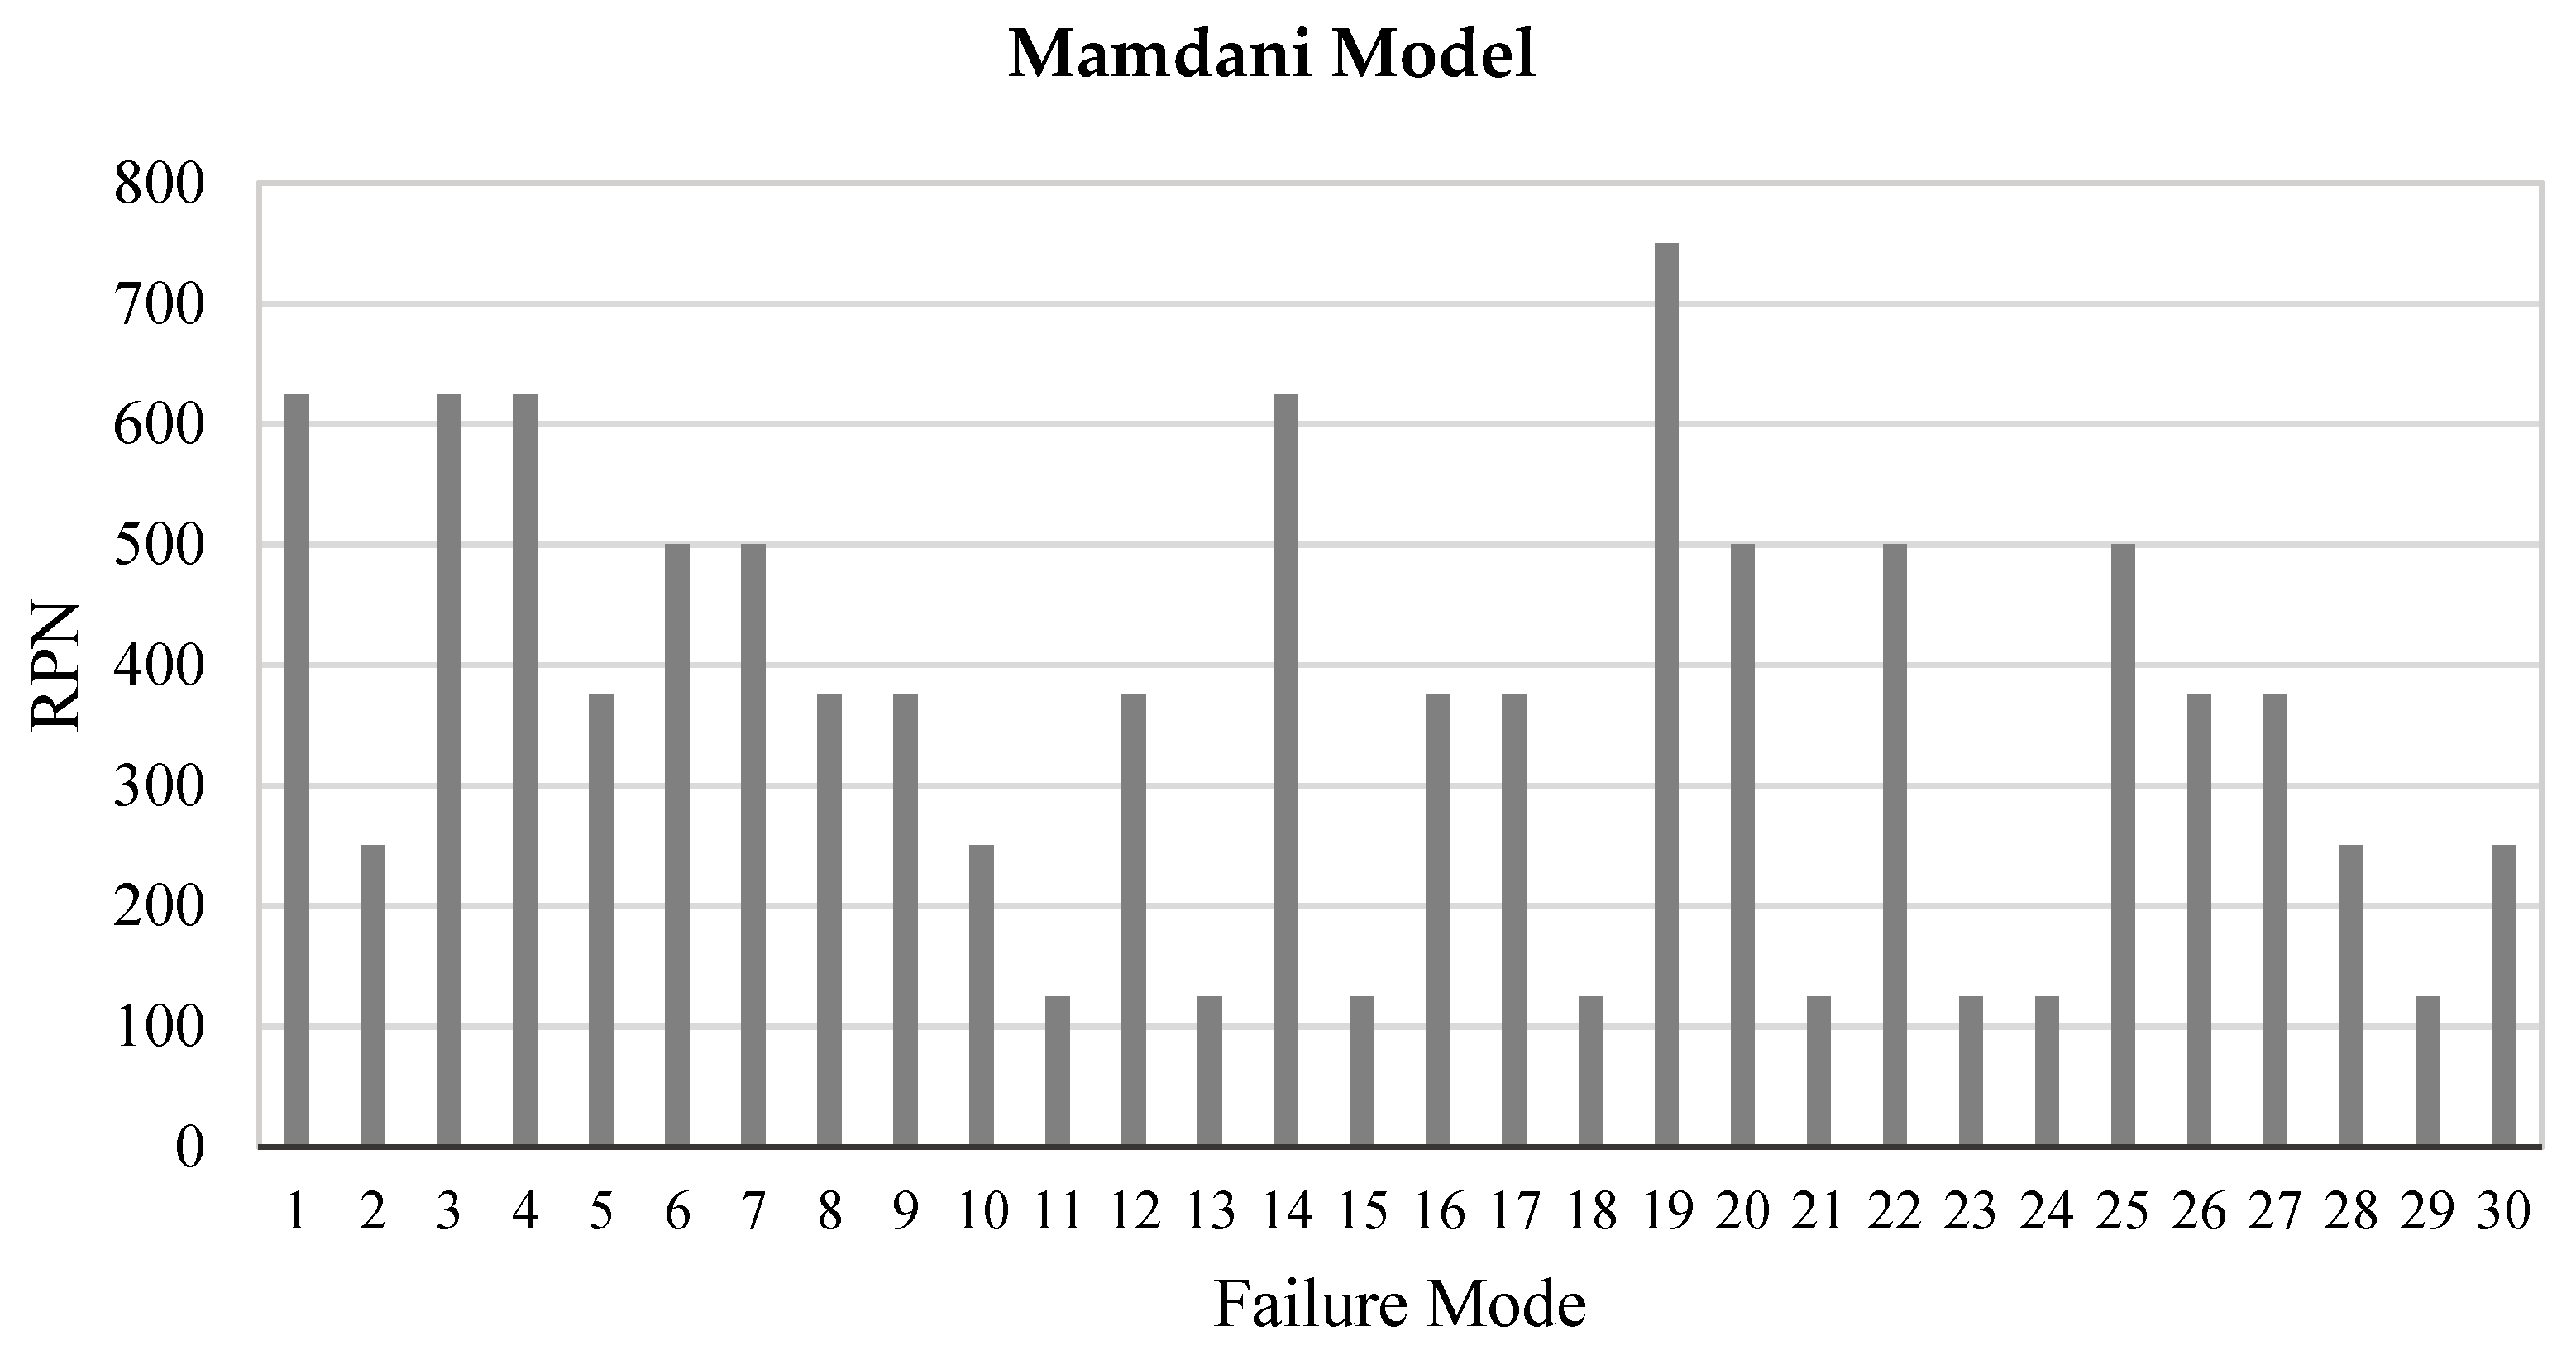
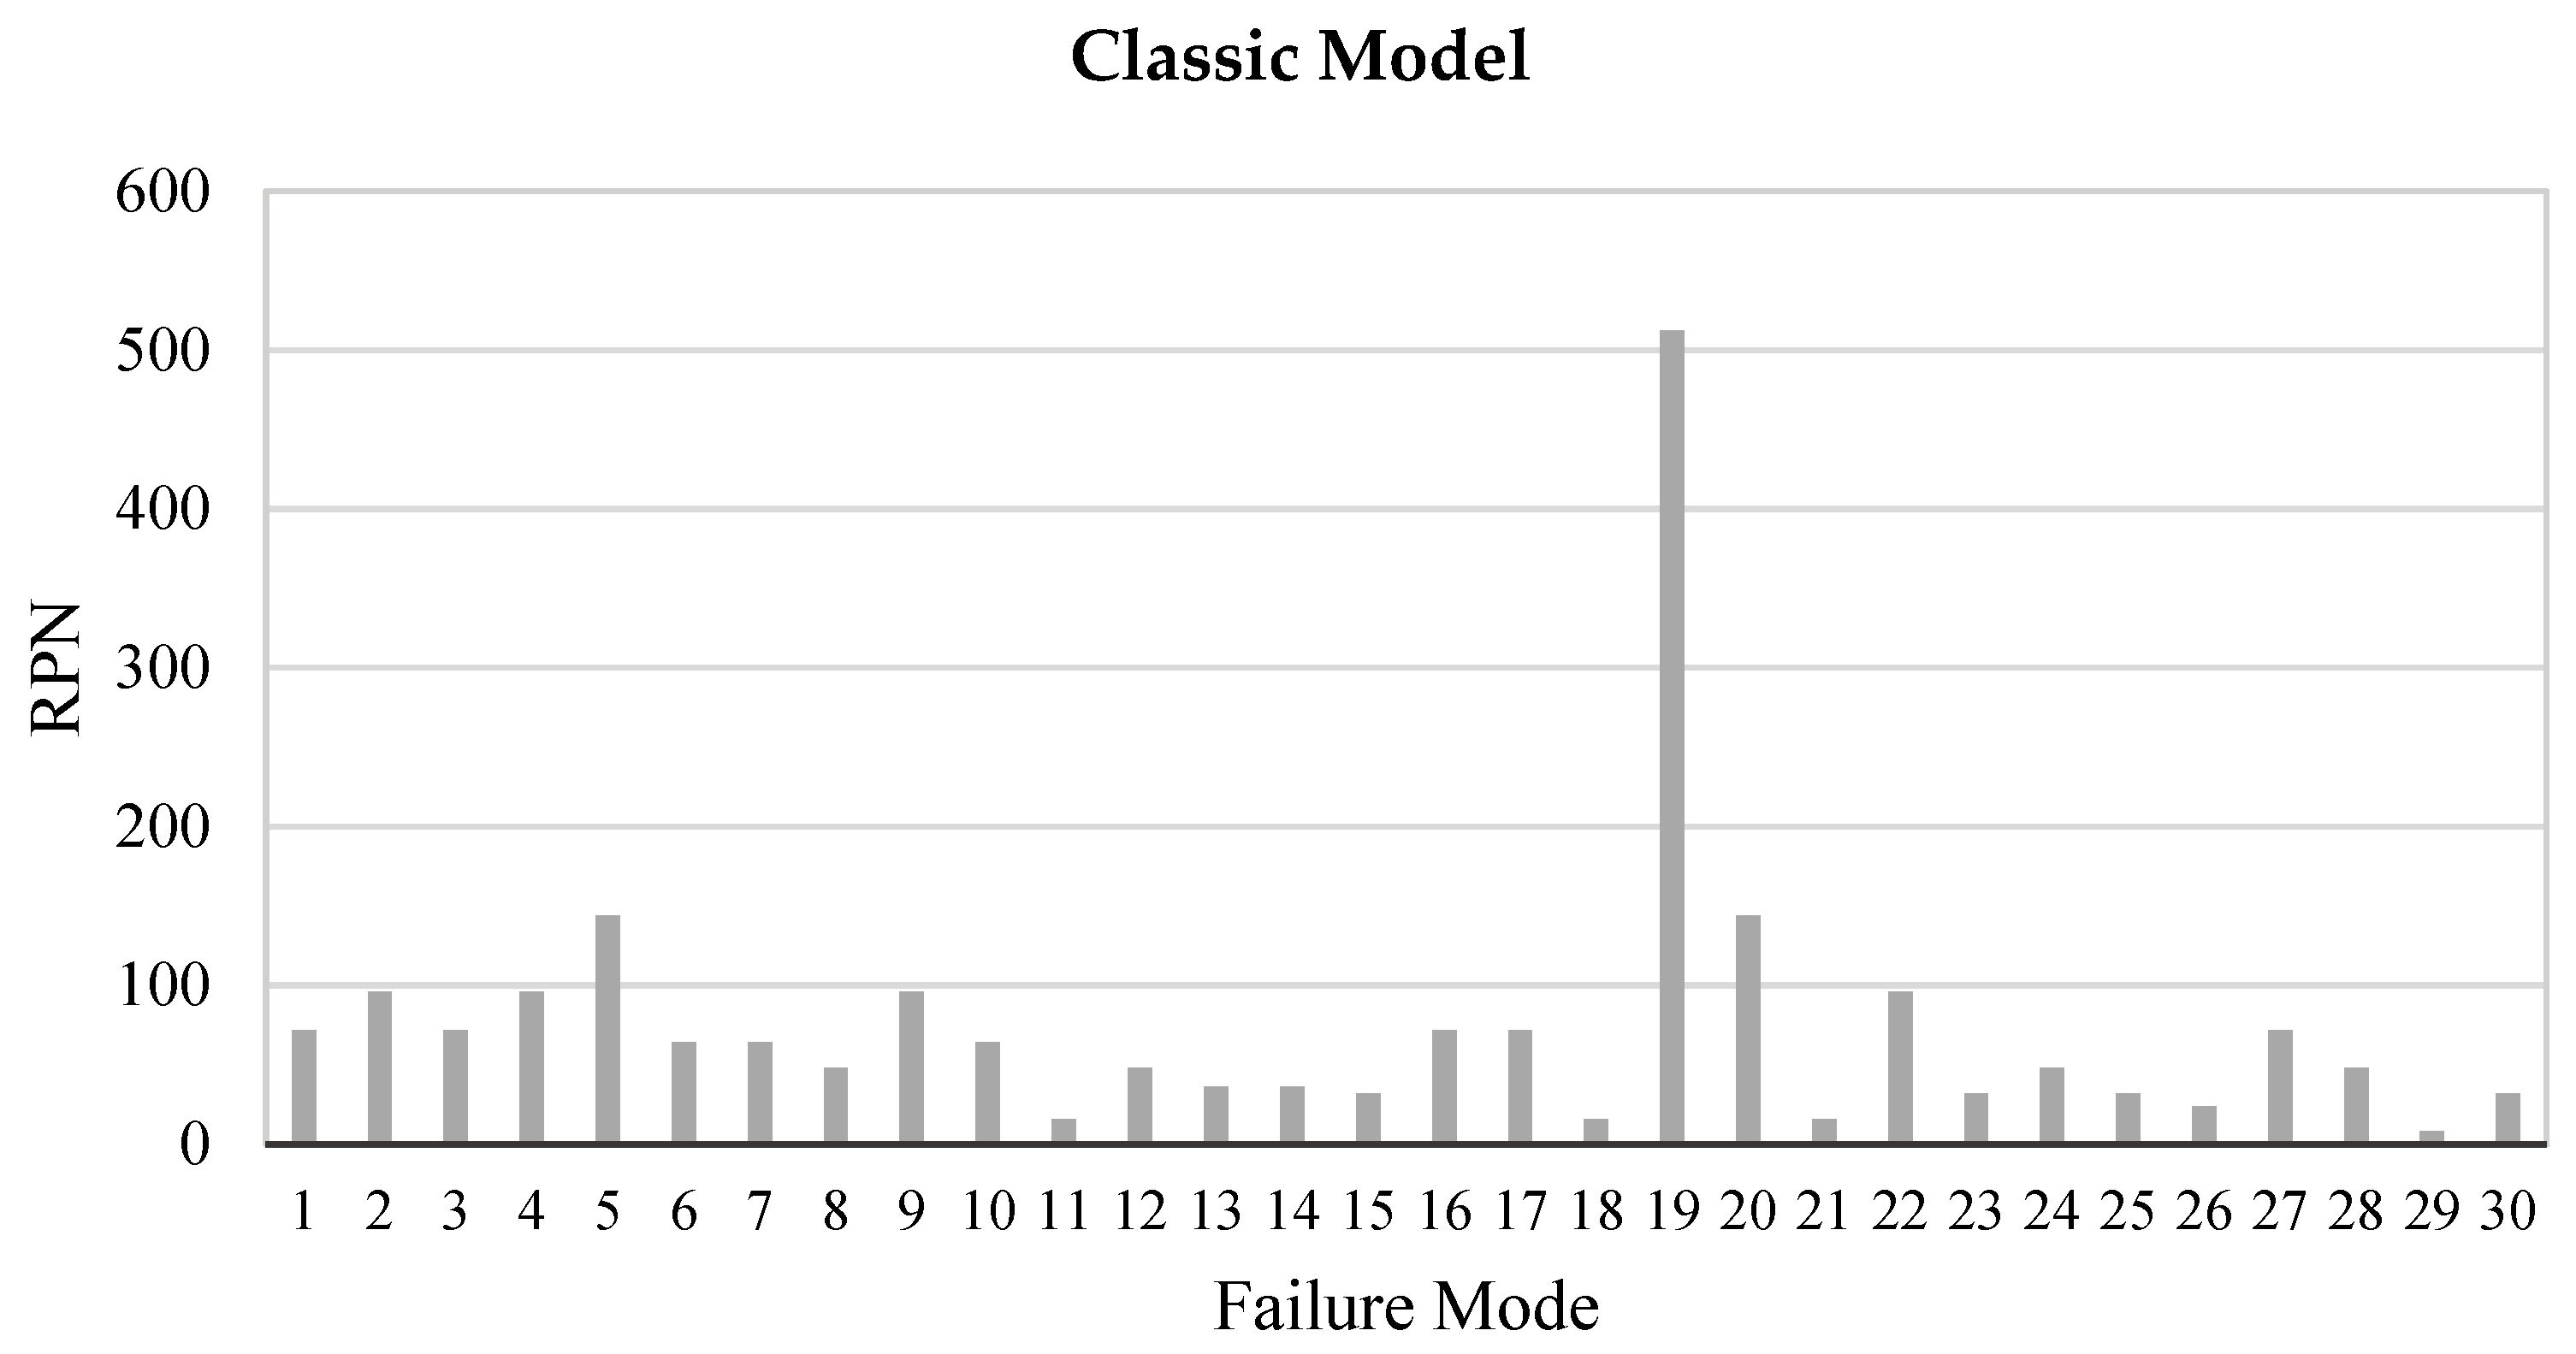
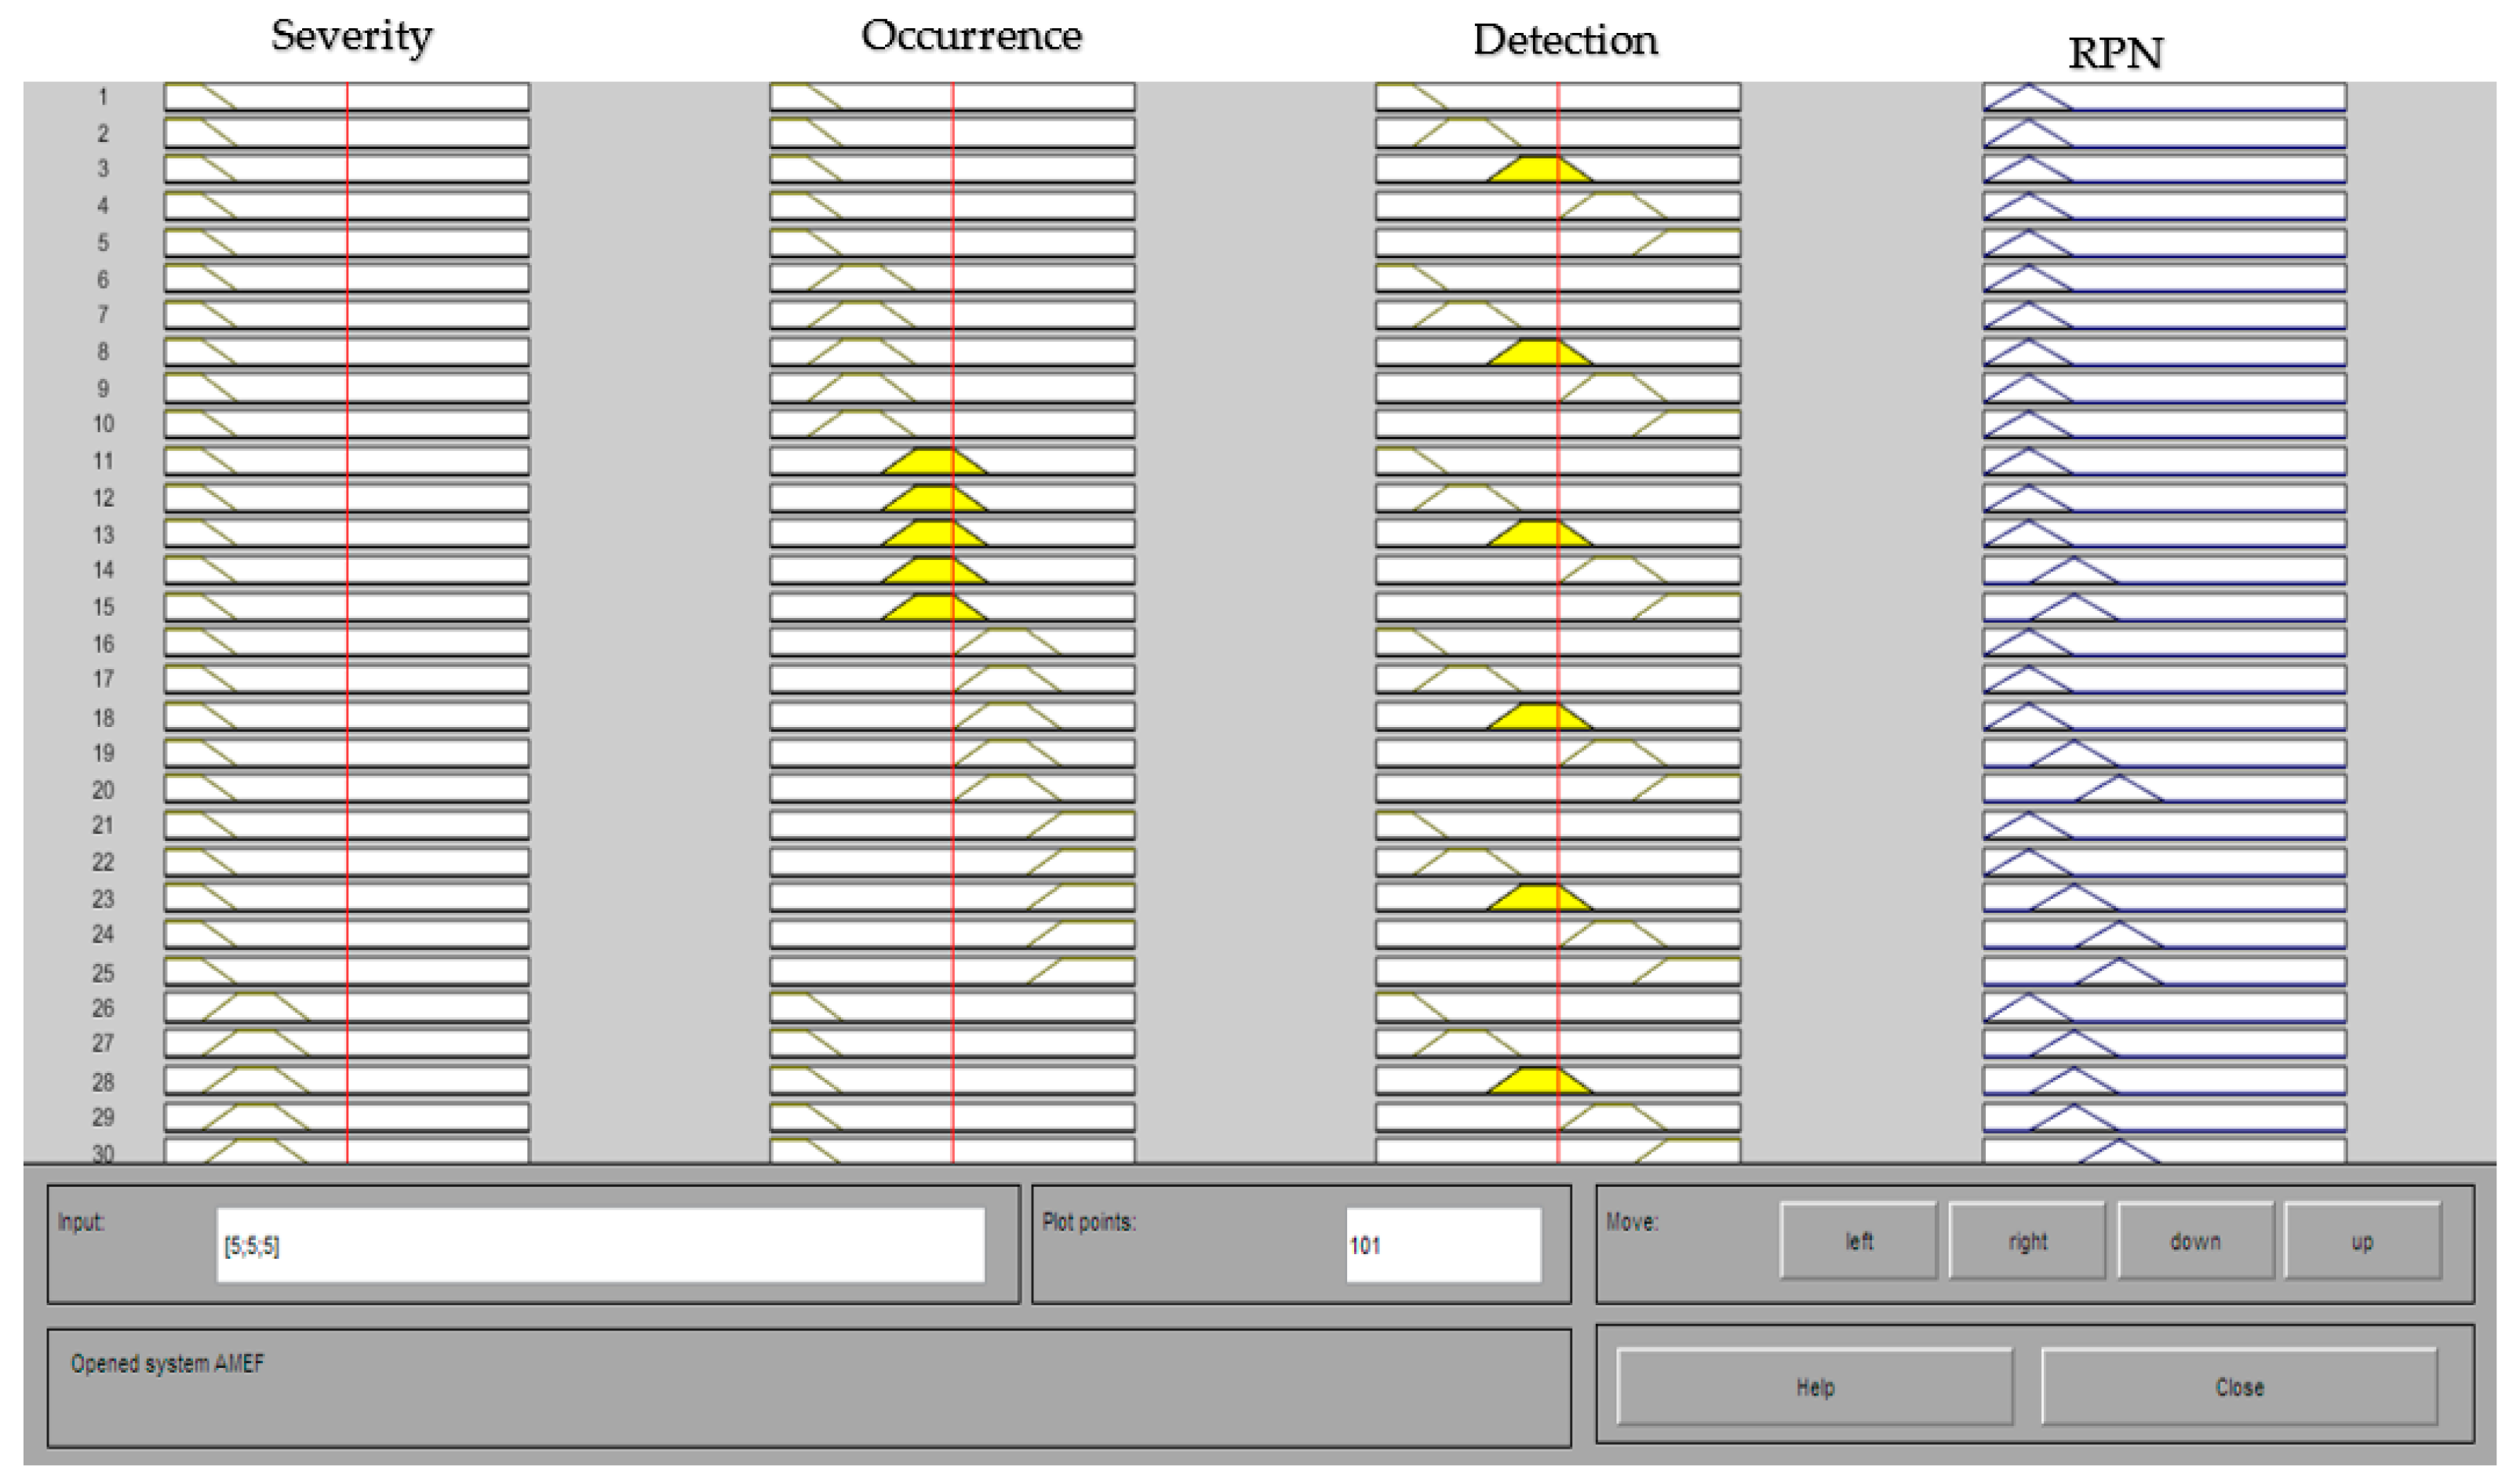
3.1. Risk Priority Number

For the RPN output variable, it was considered appropriate to use seven fuzzy sets associated with linguistic terms and denoting a category that allows evaluating the intensity of the variable (Table 7), the scale that is used for the sets, as well as that used in the classic FMEA, is up to 1000, to make a comparison or make symmetry analysis between the results of the Mamdani model and those of the conventional method (Figure 5).
Equation (6). RPN Fuzzy Set “Very Low” (Z).
μ V e r y   L o w ( R P N ) = { 0 ;         Z 0 1 125 Z 125 0 ;     0 < Z 125 1 Z 125 250 125 ;     125 < Z < 250       0 ;           250 Z
Equation (7). RPN Fuzzy Set “Low” (Z).
μ L o w ( R P N ) = { 0 ;         Z 125 1 250 Z 250 125 ;     125 < Z 250 1 Z 250 375 250 ;     250 < Z < 375 0 ;           375 Z
Equation (8). RPN Fuzzy Set “Significant” (Z).
μ S i g n i f i c a n t ( R P N ) = { 0 ;         Z 250 1 375 Z 375 250 ;     250 < Z 375 1 Z 375 250 375 ;     375 < Z < 500 0 ;           500 Z
Equation (9). RPN Fuzzy Set “Middle” (Z).
μ M i d d l e ( N P R ) = { 0 ;         Z 375 1 375 Z 375 250 ;     375 < Z 500 1 Z 375 250 375 ;     500 < Z < 625 0 ;           625 Z
Equation (10). RPN Fuzzy Set “Predominant” (Z).
μ P r e d o m i n a n t ( N P R ) = { 0 ;         Z 500 1 625 Z 625 500 ;     500 < Z 625 1 Z 625 750 625 ;     625 < Z < 750 0 ;           750 Z
Equation (11). RPN Fuzzy Set “High” (Z).
μ A l t o ( R P N ) = { 0 ;         Z 625 1 750 Z 750 625 ;     625 < Z 750 1 Z 750 875 750 ;     750 < Z < 875 0 ;           875 Z
Equation (12). RPN Fuzzy Set “Very High” (Z).
μ V e r y   H i g h ( N P R ) = { 0 ;         Z 750 1 875 Z 875 750 ;     750 < Z 875 1 Z 875 1000 875 ;     875 < Z < 1000 0 ;           1000 Z
The inference rules used for this Mamdani type model were considered according to the number of input variables and their sets, all possible combinations that represent the scenarios that can be presented given the conditions that are established were considered; as a result, 125 inference rules were formulated, the outputs were defined by specialists, to assign in each case the corresponding categorical rating of the RPN. These rules were introduced into the MATLAB model, as shown in the following figure (Figure 6).

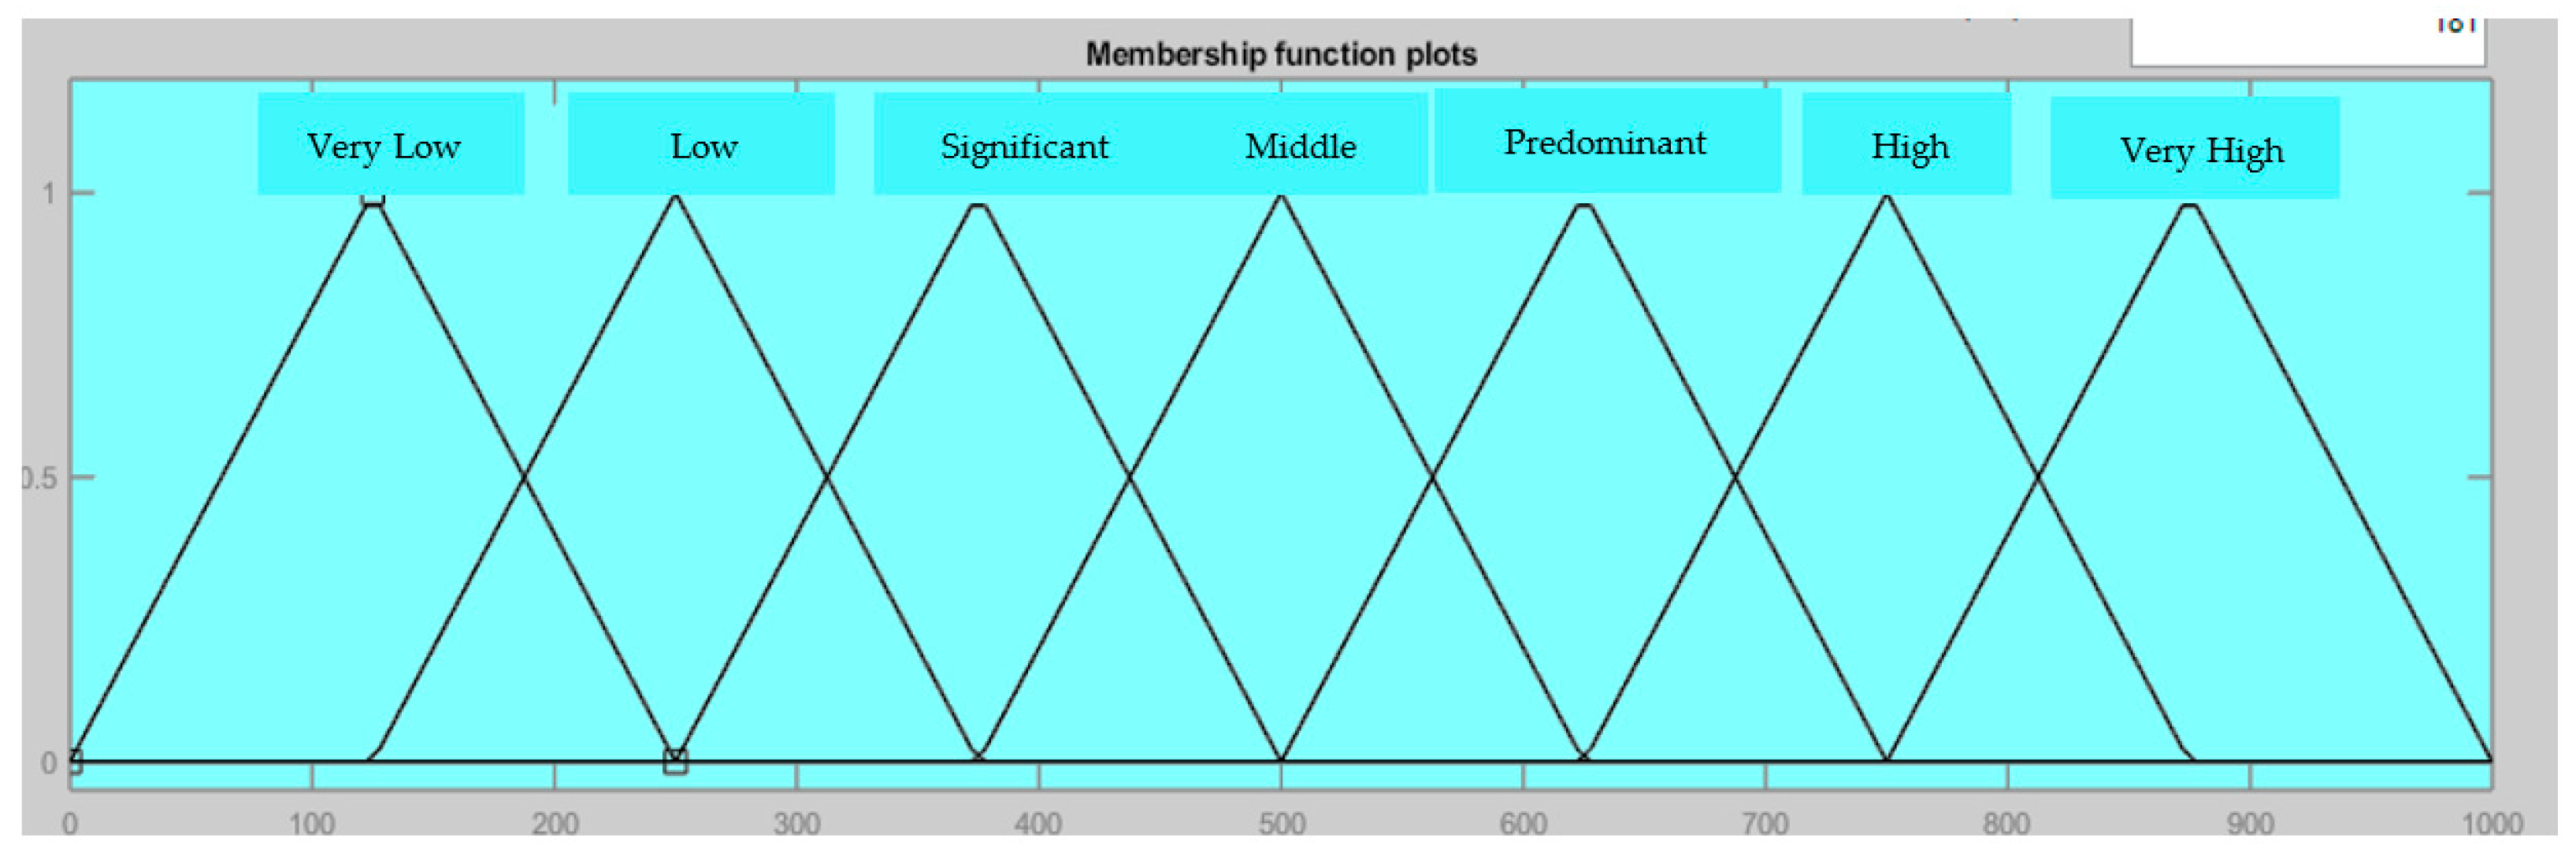
3.2. Defuzzification Process

The values that correspond to the sets of the RPN output variable are obtained numerically, according to the case of the rule activated in the Mamdani model when evaluating the different failure modes of the FMEA. The potential failure modes that were identified in the prototype were 30. Each failure mode was assessed using the defuzzification method above, and the values obtained from RPN are as shown below (Table 8).
As shown in the table above, the RPN values obtained from the Mamdani model are repeated between some failure modes. This is because the values provided by the “Center of Gravity” defuzzification method have not been manipulated, but left by default in the Mamdani model, and in this way only one rule is activated per failure mode as the case may be, and although the sets that make up the rules are several of these coincide since in the output variable you only have seven sets, but if instead of leaving the default values that allow only one rule to be activated when the input sets are provided and the input values of each variable will be manipulated, more rules could be activated at the same time so that the value in the output may be different from the seven that are repeated. This would occur when the provided values enter the regions of intersection between sets, and what this causes is that other rules are activated and the result is different depending on these rules and the method of defuzzification used.
For this case, the default values have been left since the evaluation was intended to be carried out around using the linguistic terms of input so that only the necessary rule will be activated.

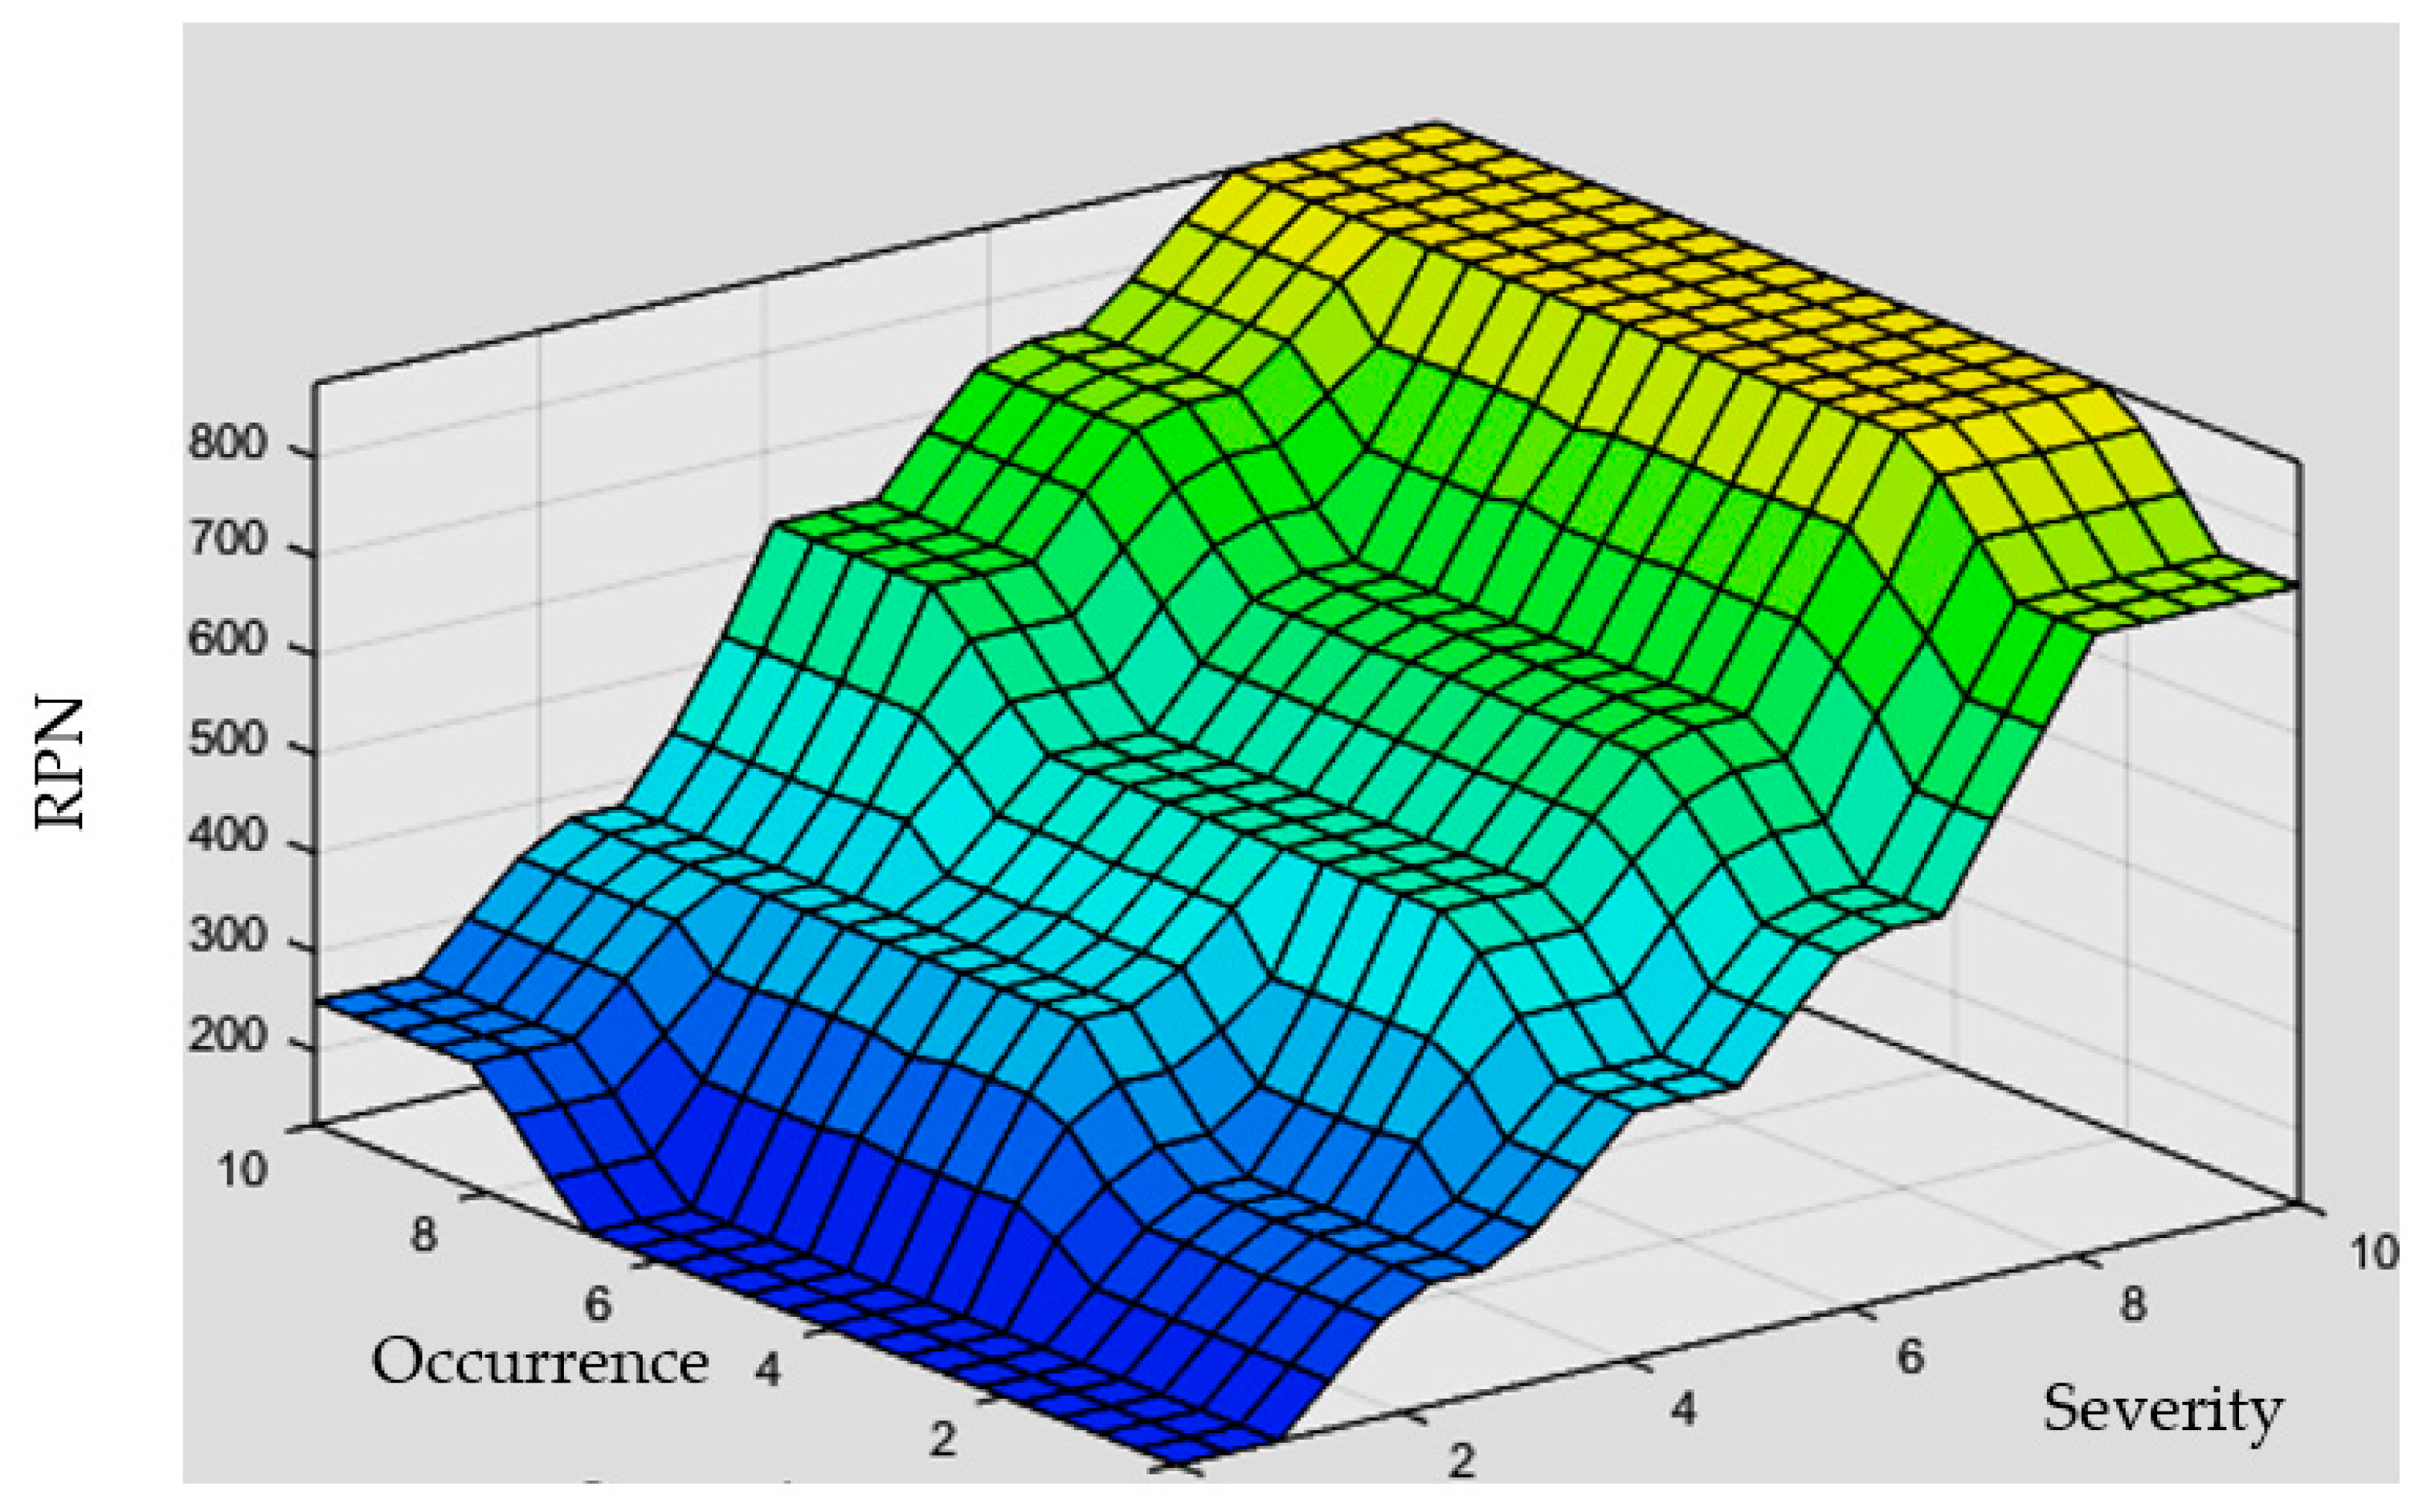
3.3. Response Surfaces

In this type of application, the use of the response surfaces that result from the Mamdani model of MATLAB are not a direct resource to obtain the type of result that is sought, which is to obtain the level of risk in a particular way in the sets of the output variable. However, these surfaces allow us to visualize and understand the logic that exists in the graphical representation of the RPN. That means the risk assessment is possible once the fuzzy rules have been established as a precedent in the inference base of the system. Therefore, a detailed analysis of the surfaces is not necessary in this model as in other application cases.

4. Discussion

With the defuzzification method “Center of Gravity”, it was possible to obtain the RPN results for each mode of failure of the FMEA, as shown in the following figure (Figure 7). The numbering of the “failure modes” corresponds to that presented in the format of Table 7.
The response surfaces generated from the model are shown in Figure 8 and Figure 9. In them, you can see how the level of risk increases or decreases depending on the input criteria Severity, Occurrence, and Detection, when these tend to take a certain value on the lower axes of the three-dimensional plane.
The results obtained from the methods used (classic FMEA and Fuzzy FMEA) to evaluate the RPN show asymmetric graphs. In the classical method, the values are mostly lower compared to the results of the Mamdani model; this is due to the description of the criteria with which it is evaluated.
There are two main reasons why the results vary significantly. The evaluation criteria in the Fuzzy Logic model for the FMEA have been appropriate to the context of the problem so that both linguistic and numerical values have a very different meaning in the evaluation.
In the classical method, the criteria used do not fit or comprehensively represent the context of what is being evaluated; obtaining the RPN is given through the multiplication of the evaluation criteria (Severity x Occurrence x Detection) in this method, not always the failures with greater severity are the priority.
It sometimes happens that failures with less severity but with higher value of occurrence or detection when multiplied, give a higher RPN value and take higher priority; that is, the priority depends in the first instance on the highest RPN value based on the evaluation parameters, without considering their relevance and only when the values are repeated, then the individual criteria assessment is deemed to be determined according to their significance which should go first.
Severity is addressed first because it relates to the effects of failures; Detection is used over the Occurrence because it depends on the client, which is more important than just failure frequencies (Stamatis, 2003); however, due to this classic method of obtaining, priority is given to failures with a higher number of RPN than to those with greater Severity.
The method used in the Mamdani model to obtain the RPN is inference through rules, and these are established according to the knowledge and reasoning of specialists about the level or intensity of the evaluation criteria; in this method, the highest RPN is assigned based on the relevance suggested in the literature of the evaluation criteria, in the order: Severity, Detection, and Occurrence, therefore the values obtained from the Mamdani model are considered with greater validity, and because the description of each criterion has been appropriate to the specific situation of the problem, therefore the results are more representative than in a conventional way.
The relevant fundamentals of the classic FMEA are described and later the use of fuzzy set theory is proposed as an alternative to reduce the uncertainty that can be generated by the NPR calculated with the traditional method, hence the disparity of data mentioned is made between Figure 8 and Figure 9. The review shows the context in which the technique may be more appropriate and highlights the potential usefulness of fuzzy set theory to address uncertainty specifically in this case study, in software engineering, security and reliability.
There are methodologies applied to security and reliability engineering, which include fuzzy FMEA [1]. When prototypes are developed, it is not always possible to obtain reliable data; this is because they are recently created and, in most cases, due to the lack of availability of primary observations and the scarcity of data on the failure of their components. It is also difficult to establish risk parameters. To handle such situations, fuzzy set theory is an alternative for the evaluation of security and reliability under conditions of uncertainty, such as what is presented in this work.

5. Conclusions

The description of recommended actions for this case was established for failure modes whose RPN values were equivalent to those of the fuzzy “Significant” set, whose value was equal to or greater than 250. The FMEA methodology aims at continuous improvement, so it is necessary to carry it out periodically to identify failures and establish actions, in this case being a prototype, and it is essential to develop improvement actions for most failures to ensure operation, so it was determined to establish as a reference a low RPN for the context of the problem, to address most of the prototype’s shortcomings and then re-evaluate the results.
It can be seen that in the classical method, the values are mostly lower compared to the results of the Mamdani model; this is due to the description of the criteria with which it is evaluated, and it can be said that there are two main reasons why the results vary significantly. One is that the evaluation criteria in the Fuzzy Logic model have been appropriate to the context of the problem so that both linguistic and numerical values have a very different meaning in the evaluation, while in the classical method the criteria used do not fit or represent in their entirety the context of what is evaluated.
The implementation of the Fuzzy FMEA allowed us to collect, order, and evaluate the information of the prototype concerning the operational failures of the different components; it can be said that the design of the studied quantifier is better in some important characteristics compared to other prototypes designed for the same purpose, however; the operating uncertainty conditions to which the quantifier is subjected affect the precision. Specifically, they are the characteristics related to the configuration or arrangement of the sensors to the tube of the animal that needs to be modified so that the sensors are no longer affected since, by their design and location, they suffer rubbing with solid surfaces that damage them. In general terms, these are the aspects that need to be improved to achieve greater accuracy.

Author Contributions

L.C.-R.: conceptualization, writing—original draft preparation, methodology and research; A.A.A.-L.: software and research; C.E.M.-O.: formal analysis and investigation; J.S.-E.: writing—original draft preparation; A.B.-M.: review and editing; M.L.M.-H.: supervision and project administration. All authors have read and agreed to the published version of the manuscript.

Funding

This research received no external funding

Institutional Review Board Statement

Not applicable

Informed Consent Statement

Not applicable

Acknowledgments

To TECNM/ Instituto Tecnológico Superior de Tantoyuca, Francisco Osorio, and Michelle Castillo for the support.

Conflicts of Interest

The authors declare no conflict of interest.

References

  1. Kabir, S.; Papadopoulos, Y. A Review of Applications of Fuzzy Sets to Safety and Reliability Engineering. Int. J. Approx. Reason. 2018, 100, 29–55. [Google Scholar] [CrossRef]
  2. Chanamool, N.; Naenna, T. Fuzzy FMEA Application to Improve Decision-Making Process in an Emergency Department. Appl. Soft Comput. 2016, 43, 441–453. [Google Scholar] [CrossRef]
  3. Batbayar, K.; Takacs, M.; Kozlovszky, M. Medical Device Software Risk Assessment Using FMEA and Fuzzy Linguistic Approach: Case Study; Institute of Electrical and Electronics Engineers (IEEE): Piscataway, NJ, USA, 2016; pp. 197–202. [Google Scholar] [CrossRef]
  4. Li, Z.; Chen, L. A Novel Evidential FMEA Method by Integrating Fuzzy Belief Structure and Grey Relational Projection Method. Eng. Appl. Artif. Intell. 2019, 77, 136–147. [Google Scholar] [CrossRef]
  5. Yazdi, M.; Daneshvar, S.; Setareh, H. An Extension to Fuzzy Developed Failure Mode and Effects Analysis (FDFMEA) Application for Aircraft Landing System. Saf. Sci. 2017, 98, 113–123. [Google Scholar] [CrossRef]
  6. Zhou, Y.; Xia, J.; Zhong, Y.; Pang, J. An Improved FMEA Method Based on the Linguistic Weighted Geometric Operator and Fuzzy Priority. Qual. Eng. 2016, 28, 491–498. [Google Scholar] [CrossRef]
  7. Grossi, G.; Goglio, P.; Vitali, A.; Williams, A. Livestock and Climate Change: Impact of Livestock on Climate and Mitigation Strategies. Anim. Front. 2019, 9, 69–76. [Google Scholar] [CrossRef] [PubMed] [Green Version]
  8. Silva-Martínez, K.L.; Cruz-Rivero, L.; Arrieta-González, A.; Purroy-Vasquez, R. Non-Invasive Measurer for Methane and Carbone Dioxide Emissions in Bovine Cattle through TRIZ. Agron. Res. 2020, 18, 1018–1026. [Google Scholar] [CrossRef]
  9. Cruz-Rivero, L.; Mateo-Diaz, N.F.; Purroy-Vasquez, R.; Angeles-Herrera, D.; Osorio-Cruz, F. Statistical Analysis for a Non-Invasive Methane Gas and Carbon Dioxide Measurer for Ruminants. In Proceedings of the 2020 IEEE International Conference on Engineering Veracruz (ICEV), Boca del Rio, Mexico, 26–29 October 2020; Institute of Electrical and Electronics Engineers (IEEE): Piscataway, NJ, USA, 2020; pp. 1–7. [Google Scholar] [CrossRef]
  10. Stamatis, D. Failure Mode and Effect Analysis: FMEA from Theory to Execution; American Society for Quality: Milwaukee, WI, USA, 2003. [Google Scholar]
  11. Jin, C.; Ran, Y.; Zhang, G. Interval-Valued Q-Rung Orthopair Fuzzy FMEA Application to Improve Risk Evaluation Process of Tool Changing Manipulator. Appl. Soft Comput. 2021, 104, 107192. [Google Scholar] [CrossRef]
  12. Boral, S.; Howard, I.; Chaturvedi, S.K.; McKee, K.; Naikan, V. An Integrated Approach for Fuzzy Failure Modes and Effects Analysis Using Fuzzy AHP and Fuzzy MAIRCA. Eng. Fail. Anal. 2020, 108, 104195. [Google Scholar] [CrossRef]
  13. Yeganeh, A.; Heravi, M.Y.; Razavian, S.B.; Behzadian, K.; Shariatmadar, H. Applying a New Systematic Fuzzy FMEA Technique for Risk Management in Light Steel Frame Systems. J. Asian Arch. Build. Eng. 2021, 20, 1–22. [Google Scholar] [CrossRef]
  14. Ribas, J.R.; Severo, J.C.R.; Guimarães, L.F.; Perpetuo, K.P.C. A Fuzzy FMEA Assessment of Hydroelectric Earth Dam Failure Modes: A Case Study in Central Brazil. Energy Rep. 2021, 7, 4412–4424. [Google Scholar] [CrossRef]
  15. Mamdani, E.H. Application of Fuzzy Logic to Approximate Reasoning Using Linguistic Synthesis. IEEE Trans. Comput. 1977, C-26, 1182–1191. [Google Scholar] [CrossRef]
  16. Castillo, O.; Aguilar, L.T. Fuzzy Control Synthesis for Systems with Discontinuous Friction. In Type-2 Fuzzy Logic in Control of Nonsmooth Systems: Studies in Fuzziness and Soft Computing; Springer Science and Business Media: Cham, Switzerland, 2018; Volume 373, pp. 73–83. [Google Scholar] [CrossRef]
Figure 1. Gas emission quantifier for cattle. Source: Retrieved from Autodesk 3ds Max, self-made content.
Symmetry 14 00421 g001
Figure 2. The methodology flowchart.
Symmetry 14 00421 g002
Figure 3. General diagram of the Mamdani Type Fuzzy Logic model for evaluating the quantifying prototype Source: Own elaboration.
Symmetry 14 00421 g003
Figure 4. Fuzzy Sets Severity Variable (Retrieved from MATLAB R2018b, Screenshot of Membership Function Editor window, self-made content).
Symmetry 14 00421 g004
Figure 5. Fuzzy sets of the Risk Priority Number variable; Source: Retrieved from MATLAB R2018b, Screenshot of Membership Function Editor window, self-made content.
Symmetry 14 00421 g005
Figure 6. Mamdani Type Fuzzy Logic Model Inference Rules for Evaluating the Quantifying Prototype Source: Retrieved from MATLAB R2018b, Rule Viewer window screenshot, self-made content.
Symmetry 14 00421 g006
Figure 7. Response Surface Occurrence vs. Severity of the Risk Assessment Model to Failure Source: MATLAB R2018b software capture, self-developed content.
Symmetry 14 00421 g007
Figure 8. Representation of the Risk Priority Number by the Fuzzy Logic model.
Symmetry 14 00421 g008
Figure 9. Representation of the Risk Priority Number by the classic model.
Symmetry 14 00421 g009
Table 1. Elements selected for the development of the fault study Receiver Sender.
ReceiverSender
Emitter-battery connectionReceiver-computer connection
Emitter-sensor connectionReceiver DIP
Issuer’s DIPOn-screen light trimmer potentiometer
BatteryXBee Coordinator Module
Straps
Support structure
Sensors
Sensor holder
XBee Router Module
Table 2. Classic FMEA.
Main ComponentSubcomponentNoFailure ModeCauses of FailureFailure Effects
EmitterBattery-emitter line1Unplugging connectorsLine exposed to the outside of the emitter stuck with objects in the environment.Emitter and sensors out of operation due to lack of electrical power supply, interruption of measurements.
2False in connectorsNon-fixed plug-type connectors, contact of the line with the animal’s body or objects in the environment.Electric current and intermittent emitter operation, uncalibrated sensor, discontinuous and incorrect data sending.
3Short circuitConnectors discovered outdoors, the humidity of the environment, or animal fluids.Partial or total damage to internal components of the emitter and/or battery.
EmitterEmitter-sensor line4Unplugging connectorsLine exposed to the outside of the emitter, inadequate line length, line stuck with objects in the environment.Sensors out of operation due to lack of electrical power supply.
5False in connectorsNon-fixed plug-type connectors, contact of the line with the animal’s body or objects in the environment.Electric current and intermittent sensor operation, sensor uncalibrated, incorrect and discontinuous measurements.
6Short circuitConnectors discovered outdoors, ambient humidity, or animal fluids.Partial or total damage to the sensors and/or internal controllers of the emitter.
EmitterEmitter DIP7Inactive electric current functionSwitch exposed to the elements, deactivated by contact with the animal’s body or objects in the environment.The passage of electric current from the emitter to each of the sensors is not allowed; the sensors will not make measurements.
8Inactive ground current functionSwitch exposed to the elements, deactivated by contact with the animal’s body or objects in the environment.Emitter components and sensors are vulnerable to damage from electrical surges.
9Inactive TX radio frequency functionSwitch exposed to the elements, deactivated by contact with the animal’s body or objects in the environment.The sensors perform measurements, but the XBee Coordinator module does not transmit the data to the receiver for data recording.
Emitter 10Inactive TX radio frequency functionSwitch exposed to the elements, deactivated by contact with the animal’s body or objects in the environment.The signal of the measurements is transmitted from the XBee Coordinator module, but communication with the XBee Router module of the receiver is not achieved.
11Fractured switchesExposed switch location, sudden movements of the animal, or improper handling of the operator.Difficulty manipulating the functions of the switches in the emitter.
12Short circuitConnectors discovered outdoors, ambient humidity, or animal fluids.Instability of functions, damage of emitter components.
EmitterBattery13Thermal leakageThe inadequate protective case against high or low temperatures.Poor battery performance, interruption of measurements, incomplete measurement periods.
14Short circuitLack of tightness, broken protective sheath, moisture filtration from the environment, or animal fluids.Damage to emitter box components and/or sensors.
EmitterStraps15Loose safety claspsAnimal struggle, poor operator fit, or poorly resistant plastic material.Instability of the structure at the animal head or loose structure of the animal head.
16Breaking of security bandsFriction wear, moisture deterioration, sudden movement of the animal, or low resistance of the material.Instability of the structure at the head of the animal or loose structure of the head of the animal.
EmitterSupport structure17Folded metal armsFlexible material, animal struggle, or operator mismanagement.Improper position of the sensor to the animal’s tube, low sensor measurement range, unreliable gas estimates with a high level of variation.
18Desoldered arm jointsPoor welding work, poorly resistant welding, or overexertion of the structure.Instability of the structure at the head of the animal or loose structure of the head of the animal.
EmitterSensors19Low measurement sensitivityObstruction of the sensor by food debris or mucus from the animal, poor posture, and strong wind currents.Unreliable gas estimates with a high level of variation.
20Short circuitThe printed circuit of the discovered sensor, ambient humidity, animal mucus, or food debris.Instability of electric current in sensors, discontinuous measurement lapses, the partial or total damage to the sensor.
21Led measurement indicator without operating.Led desoldering of the printed circuit, damaged by moisture or melted by shocks.Difficulty identifying sensor malfunction in real-time.
EmitterSensor holder22Bent structureSlightly rigid structural material, sudden movements of the animal’s tube, and/or the wrong fit in the animal’s tube.Improper position of the sensor to the animal’s tube, low sensor measurement range, unreliable gas estimates with a high level of variation.
23Loose Assembly SnapsSudden movements of the animal’s trunk and obstruction with objects in the environment.Instability of sensors to the animal’s trunk.
ReceiverXBee Modules (Router and Coordinator)24Communication signal lossUnfavorable topographical conditions, interference from other signals, or low range capability of the modules.Gas measurement data loss during signal interruption between XBee modules.
ReceiverReceiver DIP25Inactive electric current functionOperator mishandling or fractured switch.The passage of electric current from the computer is not allowed, difficulty manipulating the functions of the switches.
26Inactive grounding functionOperator mishandling or fractured switch.In case of short circuit damage of the receiver components, difficulty manipulating the functions of the switches.
27Inactive TX radio frequency functionOperator mishandling or fractured switch.The receiver does not send back the communication signal to the transmitter, having difficulty manipulating the switches’ functions.
28Inactive TX radio frequency functionOperator mishandling or fractured switch.The receiver does not receive the signal from the transmitter, difficulty manipulating the functions of the switches on the receiver.
ReceiverTrimmer LCD Screen Potentiometer29Incorrect light regulationThe sweeping regulator, presence of moisture or internal dirt.Difficulty manipulating the lighting intensity on the receiver screen.
ReceiverReceiver-computer connection30Incorrect light regulationError in software drivers, operator mishandling.Interruption in the transfer of information, loss of data in the logger software.
Table 3. Adequacy of parameters for the assessment of the Risk Priority Number.
Linguistic ValueSeverityLinguistic ValueOccurrenceLinguistic ValueDetection
Very LowIt does not represent significant affectation; the operation of the prototype will be almost normal.RemoteJust once for each measurement period. Very HighIn most tests are identified, detailed inspections are not necessary.
LowIt represents minimal affectation; the prototype will work with slight affectations.LowApproximately up to three times for each measurement period.HighThey are almost always detected in tests; no detailed inspections are necessary.
MediumThe affectations are significant; the device will work, the information generated will be unreliable.RegularApproximately up to five times per measurement period.MediumSometimes they are detected during testing; basic inspection is necessary.
HighThe affectations are severe; sometimes, it will not work, the information generated will not be reliable.HighApproximately up to seven times for each measurement period.LowHardly detected during testing, a detailed inspection is necessary.
Very HighThe affectations will not allow the operation of the prototype.Very HighMore than seven for each measurement period.Very LowThey are seldom detected during testing; inspection with special methods is necessary.
Table 4. Characteristics of the fuzzy sets of the input variable Severity (W).
Fuzzy SetsFuzzy RangeGeometric Figures Values
Very Low0–2[0, 0, 1, 2]
Low1–4[1, 2, 3, 4]
Medium3–6[3, 4, 5, 6]
High5–8[5, 6, 7, 8]
Very High7–10[7, 8, 10, 10]
Table 5. Characteristics of the fuzzy sets of the input variable Occurrence (X).
Fuzzy SetsFuzzy RangeGeometric Figures Values
Remote0–2[0, 0, 1, 2]
Low1–4[1, 2, 3, 4]
Regular3–6[3, 4, 5, 6]
High5–8[5, 6, 7, 8]
Very High7–10[7, 8, 10, 10]
Table 6. Characteristics of the fuzzy sets of the input variable Detection (Y).
Fuzzy SetsFuzzy RangeGeometric Figures Values
Very High 0–2[0, 0, 1, 2]
High 1–4[1, 2, 3, 4]
Medium3–6[3, 4, 5, 6]
Low5–8[5, 6, 7, 8]
Remote7–10[7, 8, 10, 10]
Table 7. Characteristics of the fuzzy sets of the output variable Risk Priority Number (Z).
Fuzzy SetsFuzzy RangeGeometric Figures Values
Very Low0–250[0, 125, 250]
Low125–375[125, 250, 375]
Significant250–500[250, 375, 500]
Middle
Predominant
375–625
500–750
[375, 500, 625]
[500, 625, 750]
High
Very high
625–875
750–1000
[625, 750, 875]
[750, 875, 1000]
Table 8. Defuzzification of the RPN variable from the Mamdani model was applied to the quantifying prototype.
Failure ModeRPN Fuzzy Model
1625
2250
3625
4625
5375
6500
7500
8375
9375
10250
11125
12375
13125
14625
15125
16375
17375
18125
19750
20500
21125
22500
23125
24125
25500
26375
27375
28250
29125
30250
Publisher’s Note: MDPI stays neutral with regard to jurisdictional claims in published maps and institutional affiliations.

