
New FMEA Risks Ranking Approach Utilizing Four Fuzzy Logic Systems

Abstract
1. Introduction
2. Materials and Methods
2.1. FMEA and RPN
- Failure mode. Failure modes are, in essence, categories of failure. A failure mode describes how some product or process would not be able to perform its desired function (in terms of design or requirements), based on what the end-users or end-customers need and expect from it. Examples of failure modes include fatigue, collapse, performance deterioration, deformation, obsolescence, corroded, binding, seizure, buckling, sagging, looseness, misalignment, leaking, vibrations, burning, etc.
- Potential cause(s) of failure. Every failure mode has a potential cause of failure that is linked to it. Some of the most common causes of failure are the use of the wrong material, poor welding, corrosion, error in assembly or dimension, exposure to too much stress, overheating, overcooling, poor maintenance, damage, error in heat treatment, material impurity, formation of cracks, imbalance, tooling marks, eccentricity, etc.
- Effect. An effect is a negative consequence that the end-customer or end-user sees or feels.
- Severity. Severity is an assessment of the seriousness of the consequences of the potential failure mode on the customer/user.
- Occurrence. Occurrence is how frequently a cause arises and causes failure modes. In a best-case scenario, past occurrence data is used to determine occurrence.
- Detection. The ability of the existing control to detect and consequently prevent a certain cause.
2.2. Fuzzy Logic
- Step 1: Fuzzify the input.The linguistic variable is defined by Equation (2) in which
- ■
- x is the name of the variable.
- ■
- T(x) is a set of terms, the set of names of linguistic values of x with each value being a fuzzy number defined on U.
- ■
- U is the universe of discourse.
- ■
- σ is a syntax rule for generating the names of the values of x.
- ■
- M is the semantic rule for associating with each value its meaning.
The fuzzy set contains elements that satisfy imprecise properties for a membership function. Membership function quantifies the degree of belongingness of x to set A, Equation (3), where x represents input, y is output and A and B are fuzzy sets of it.
- Step 2: Find and evaluate the antecedent and consequence of each rule
- Step 3: Aggregate the consequents.
- Step 4: Defuzzify the results with the centroid method, where the defuzzified value yCOG is given by Equation (10).
3. Results
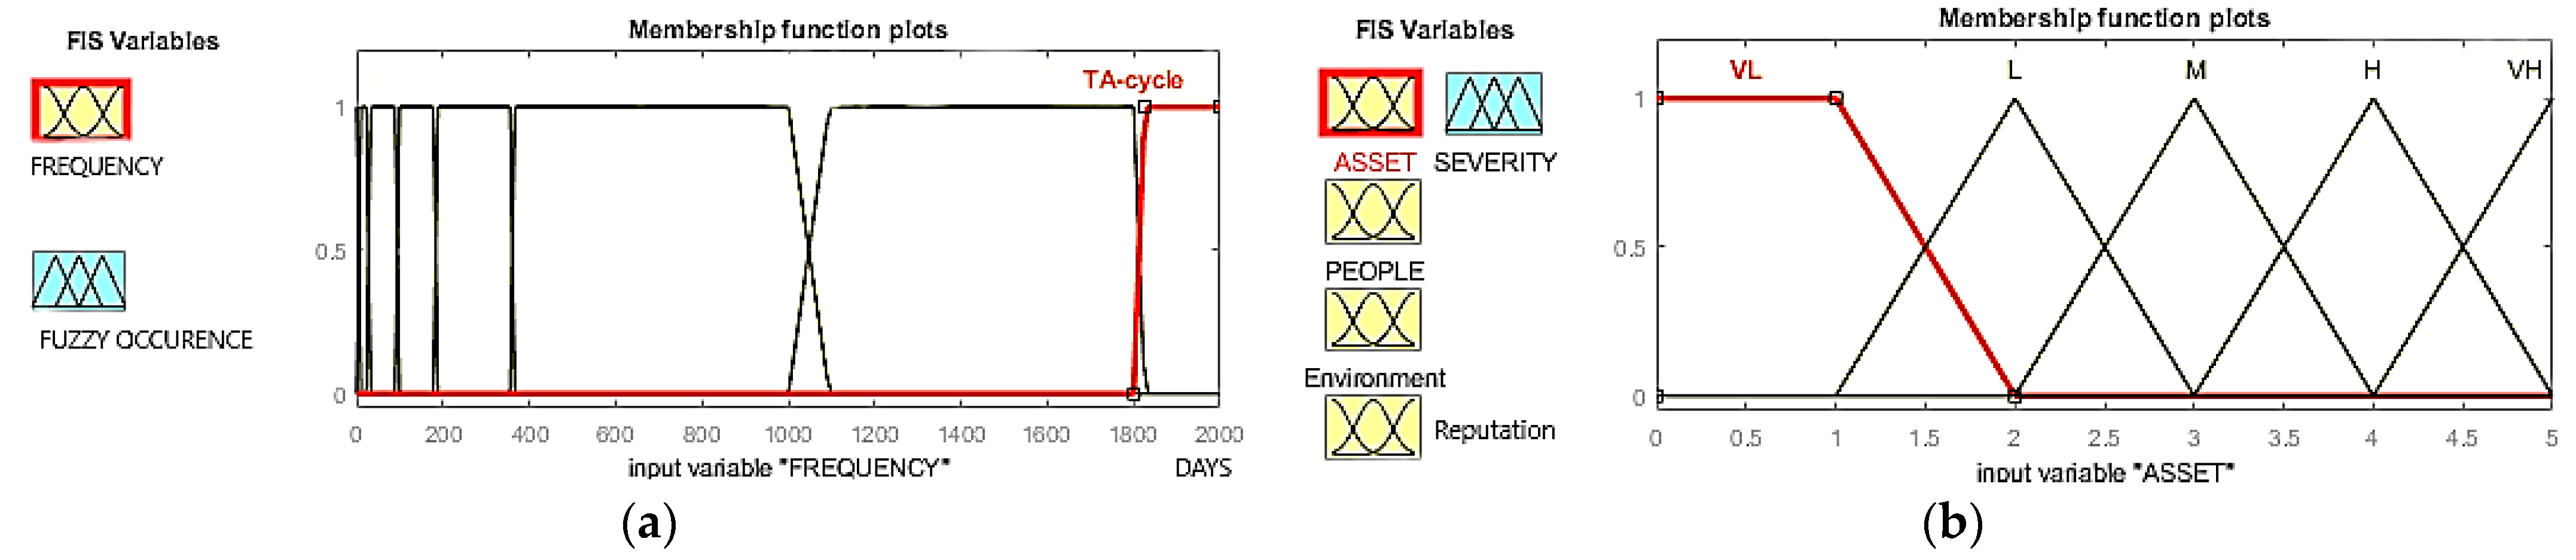
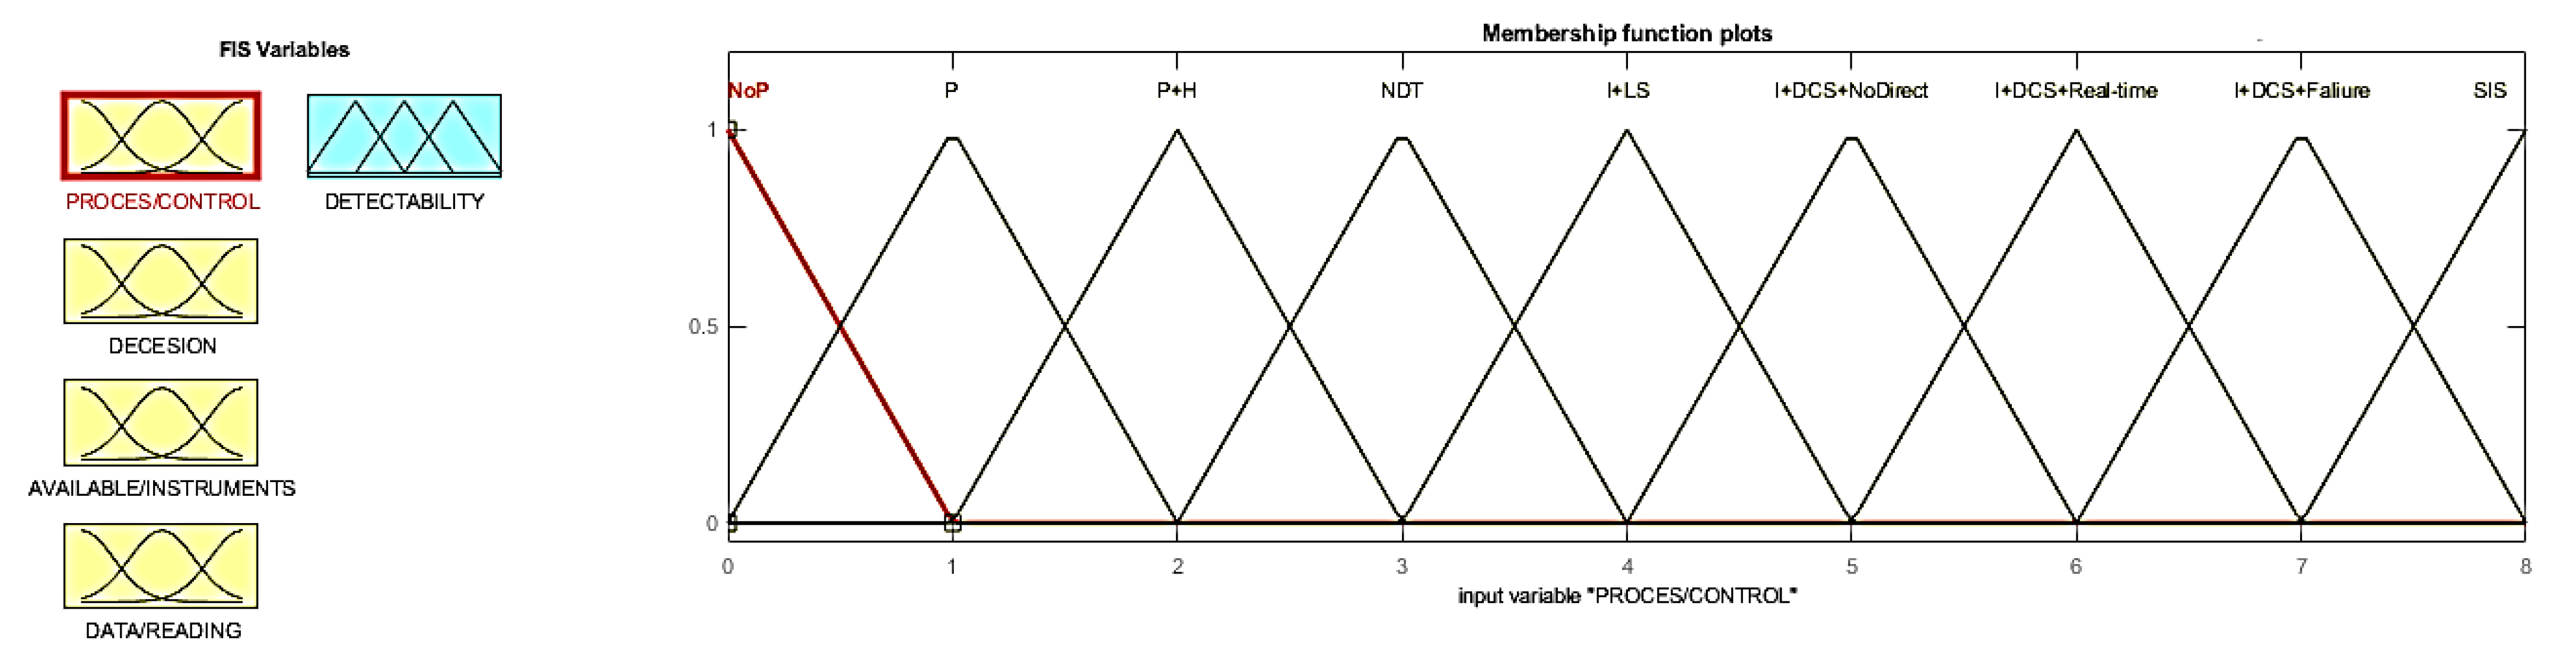
3.1. Fuzzification of Model
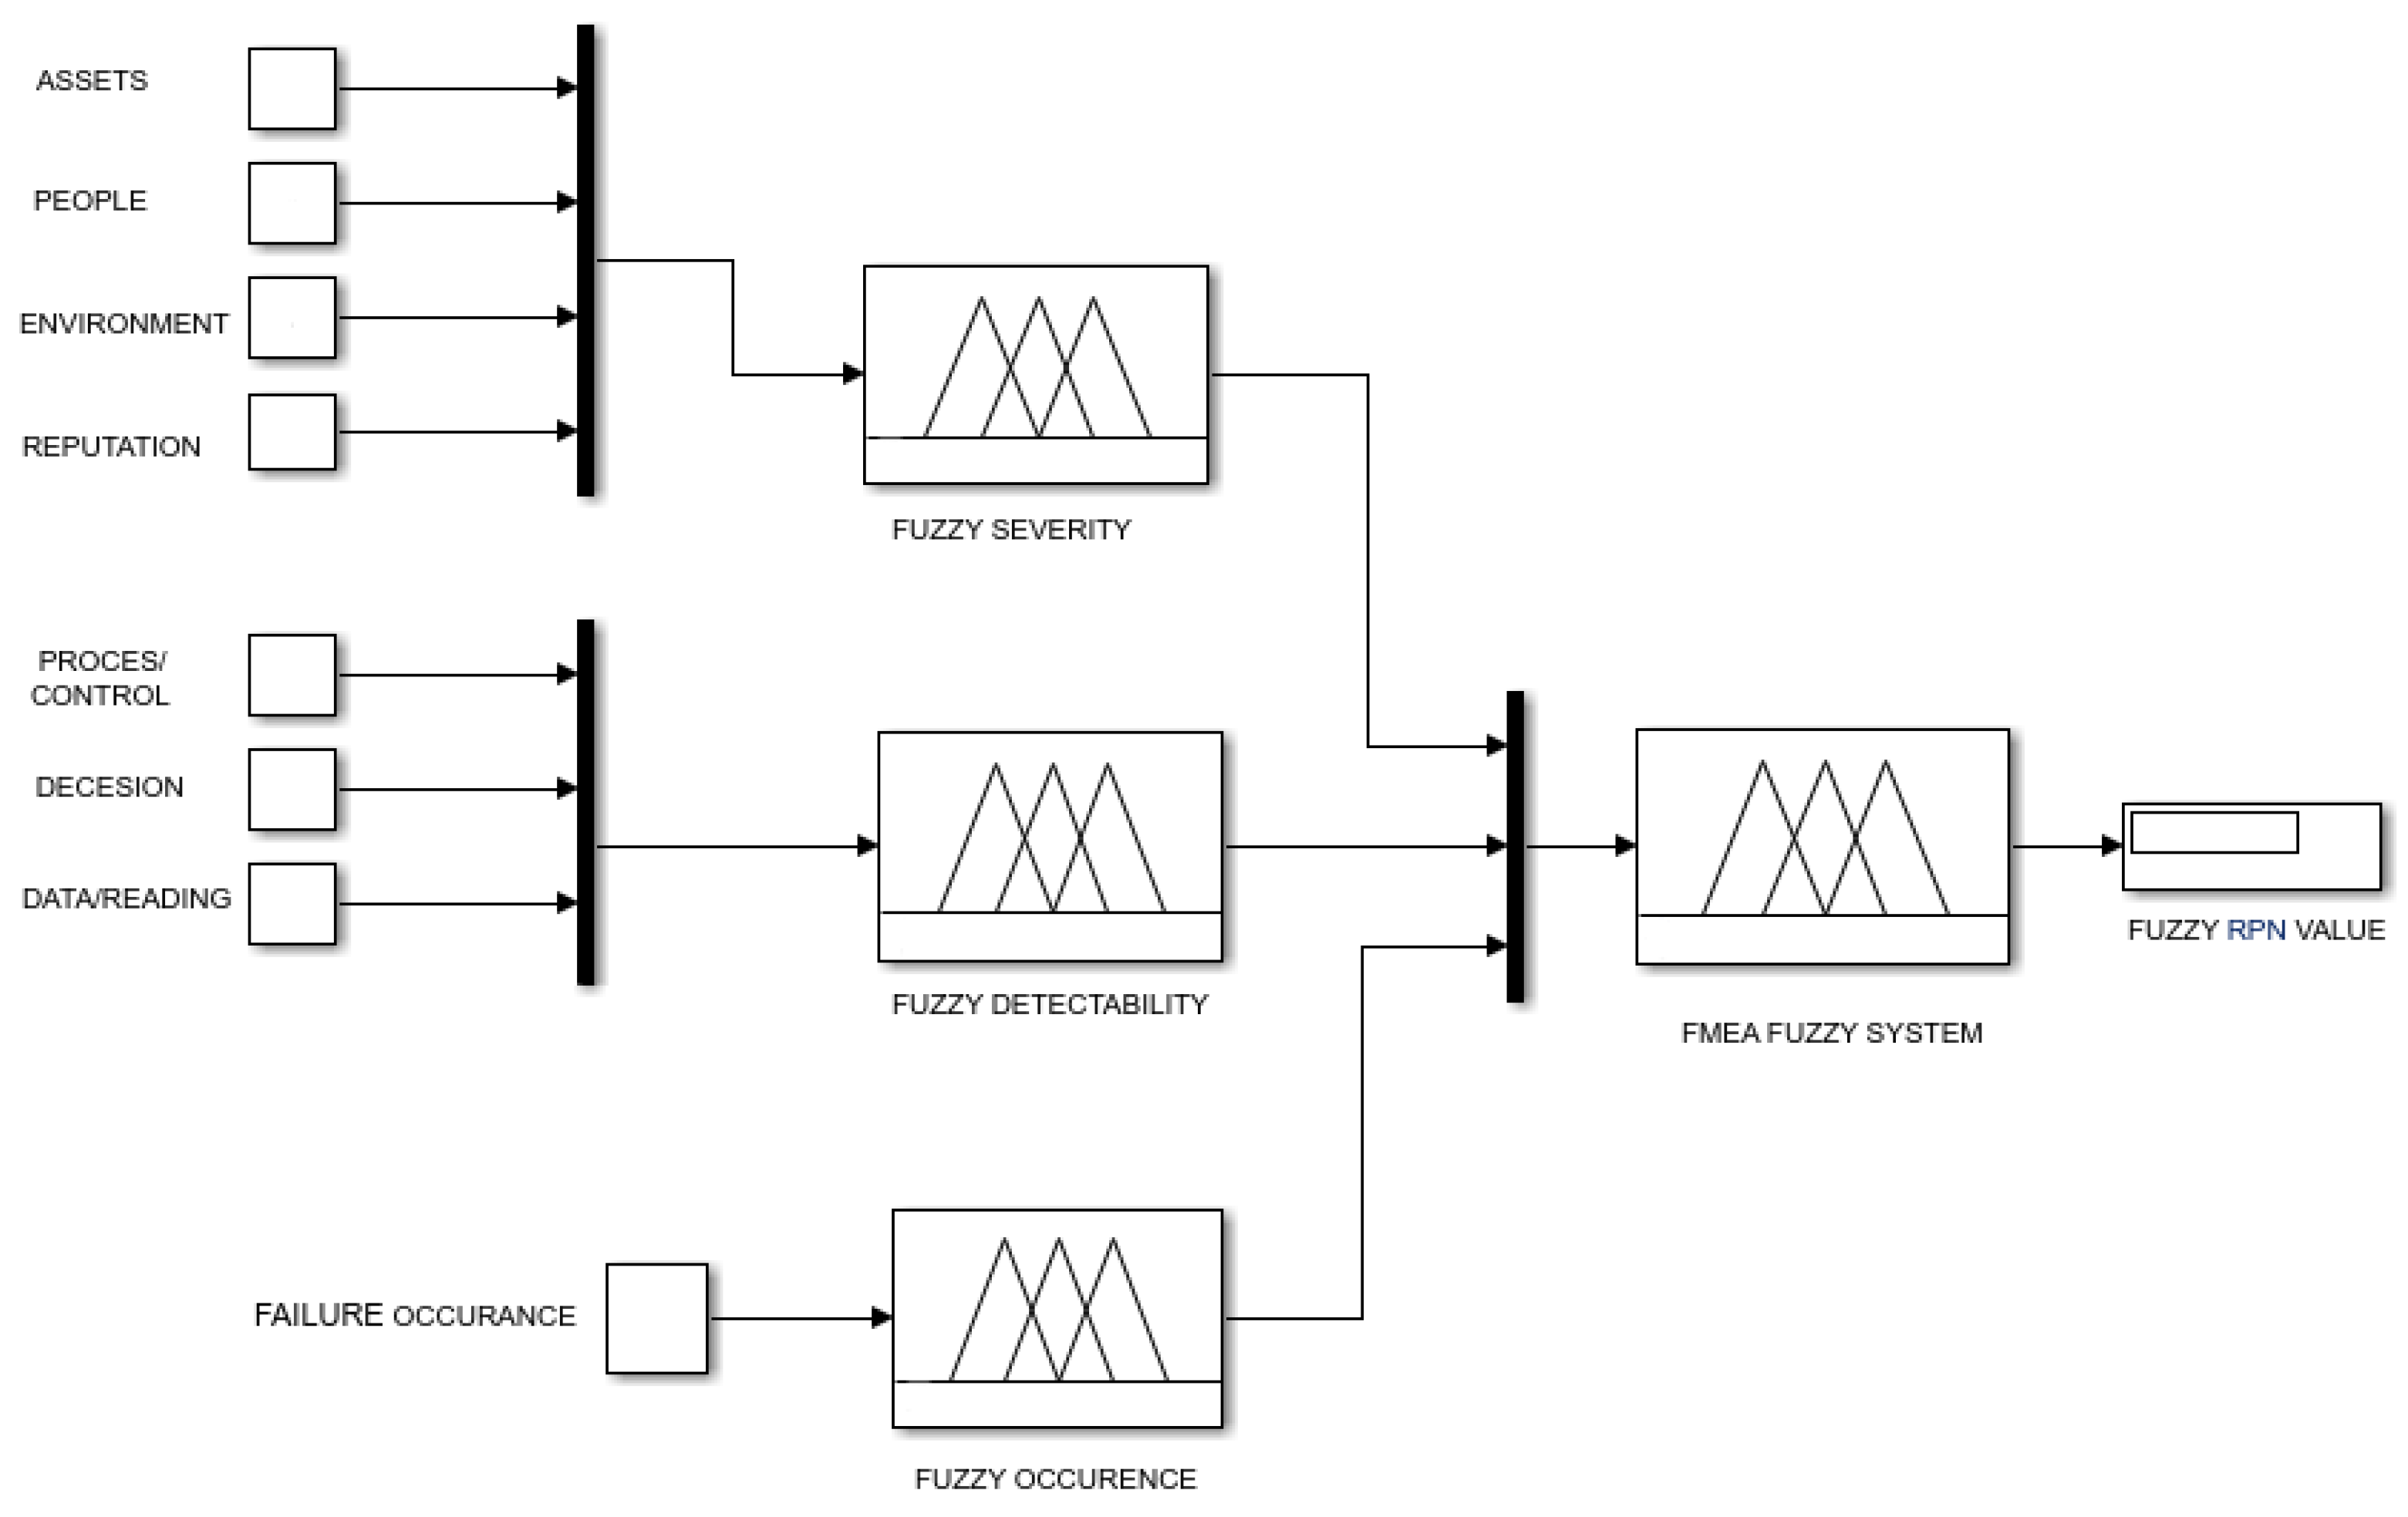
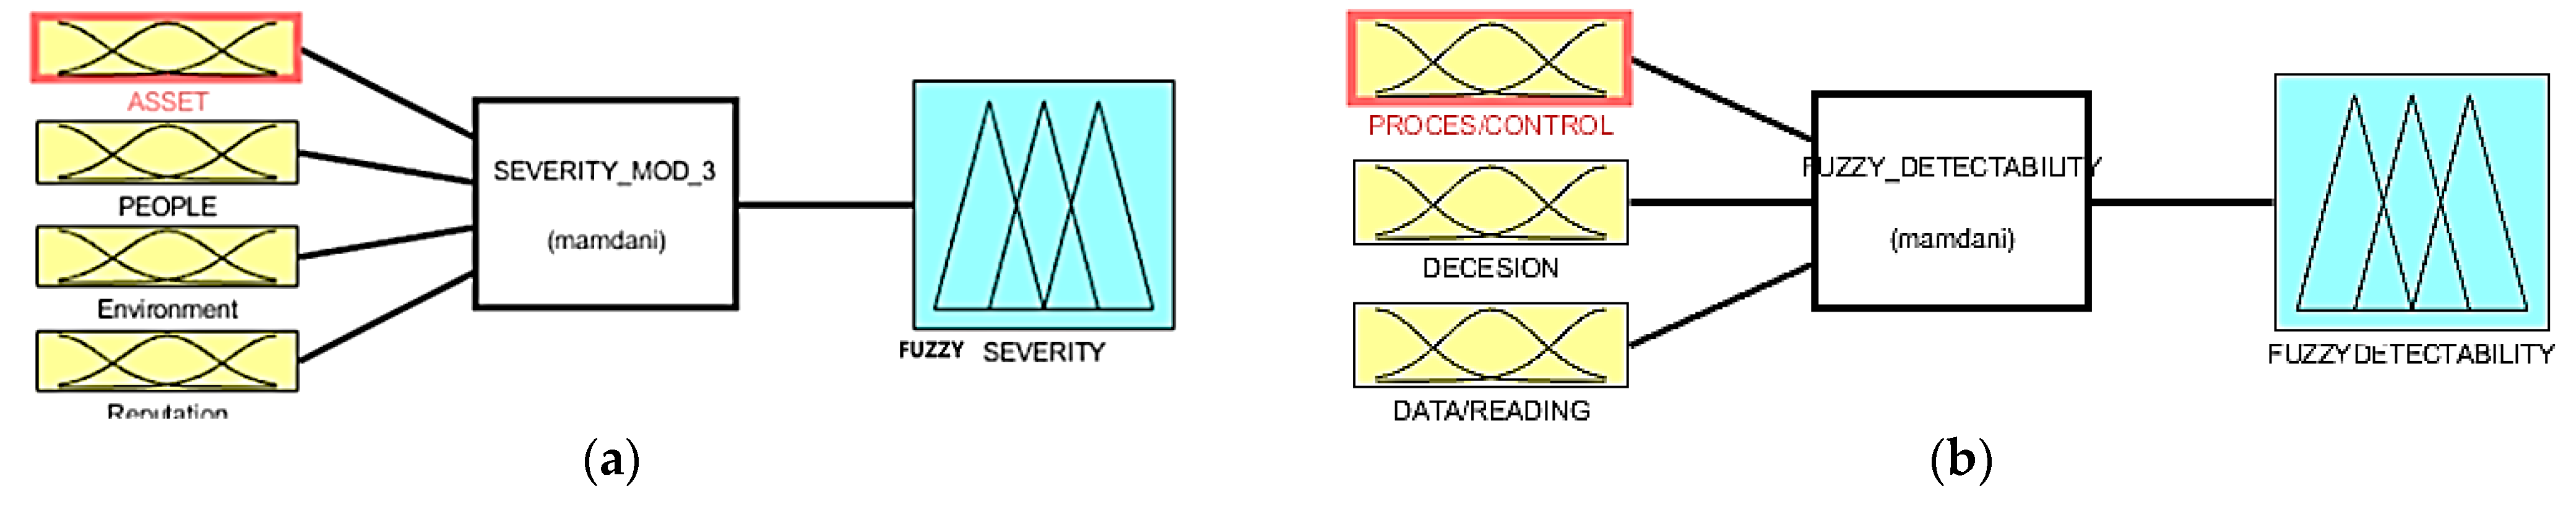
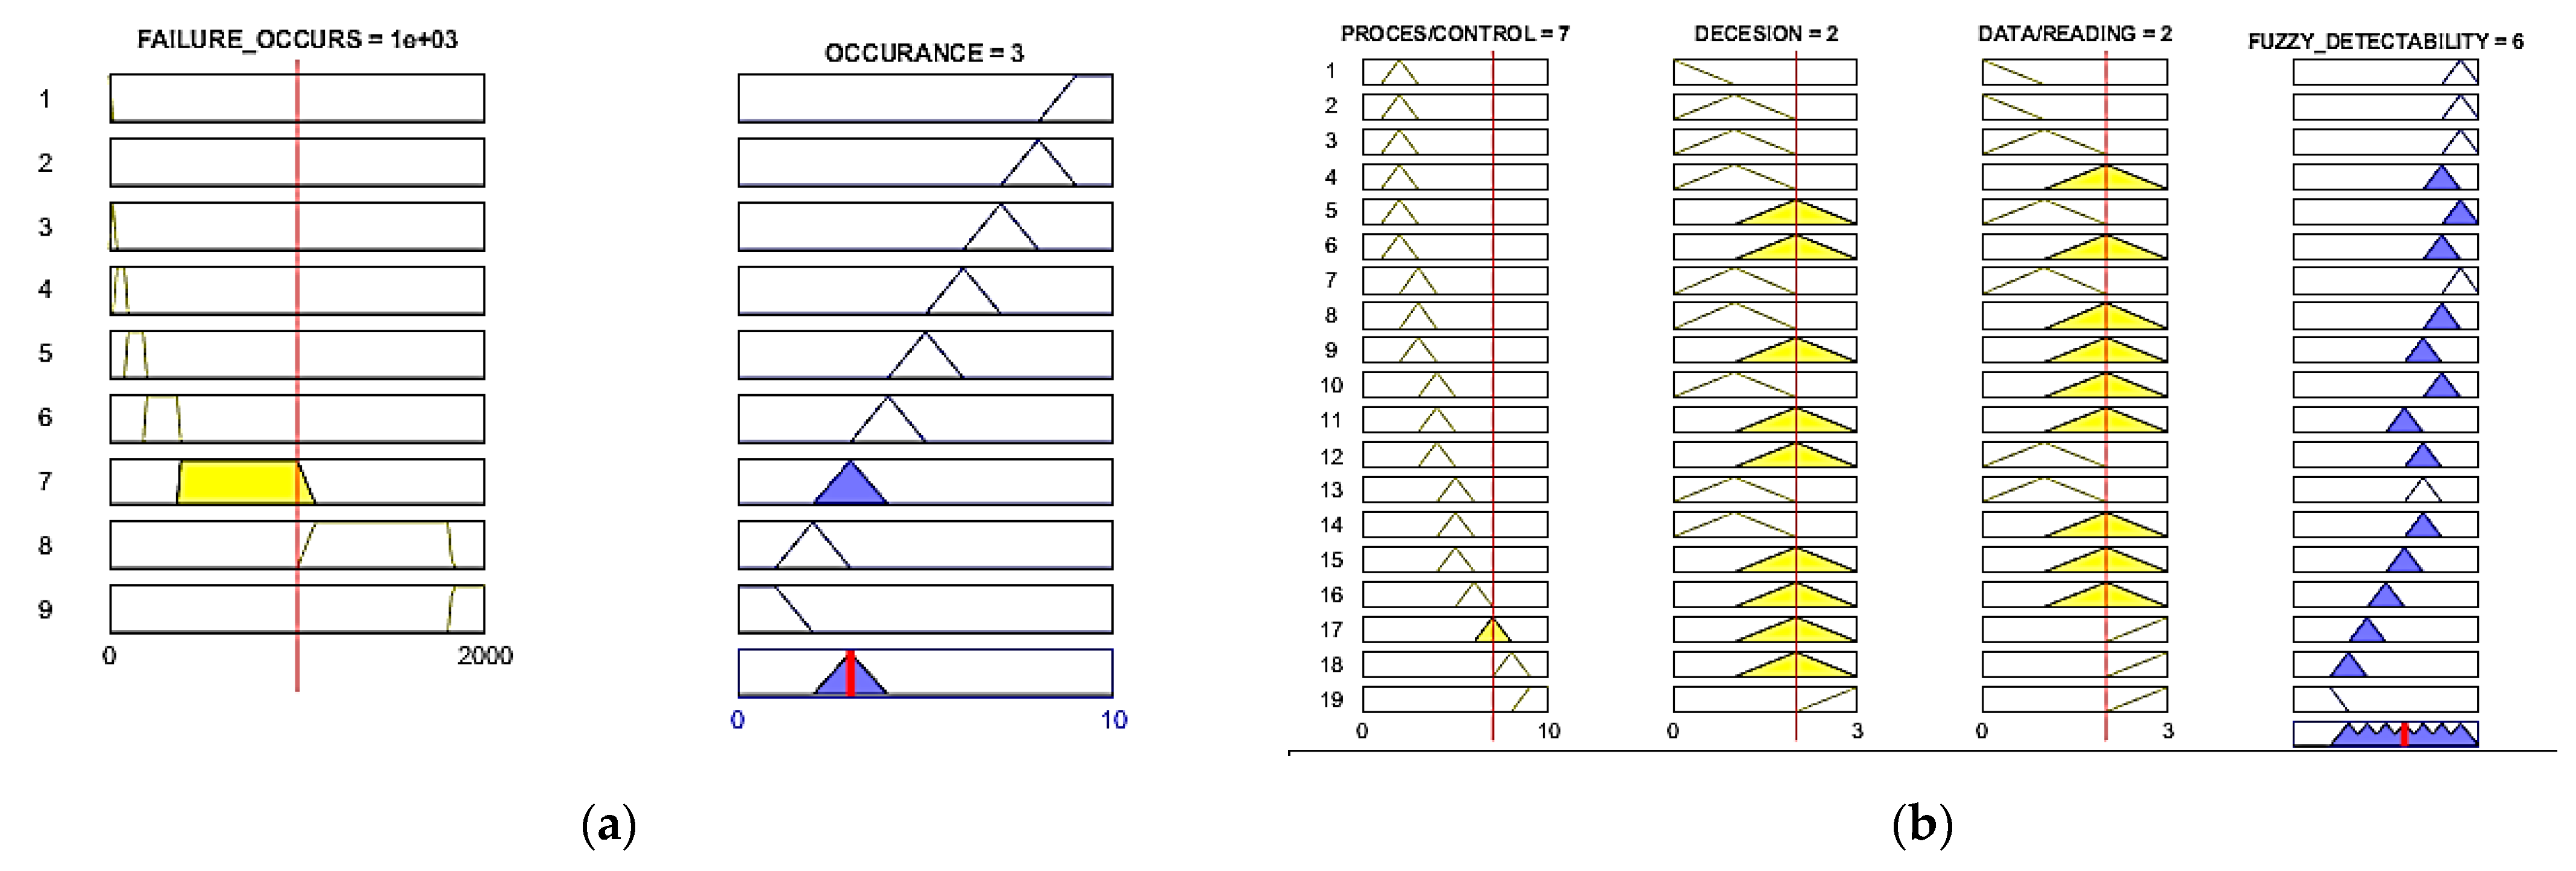
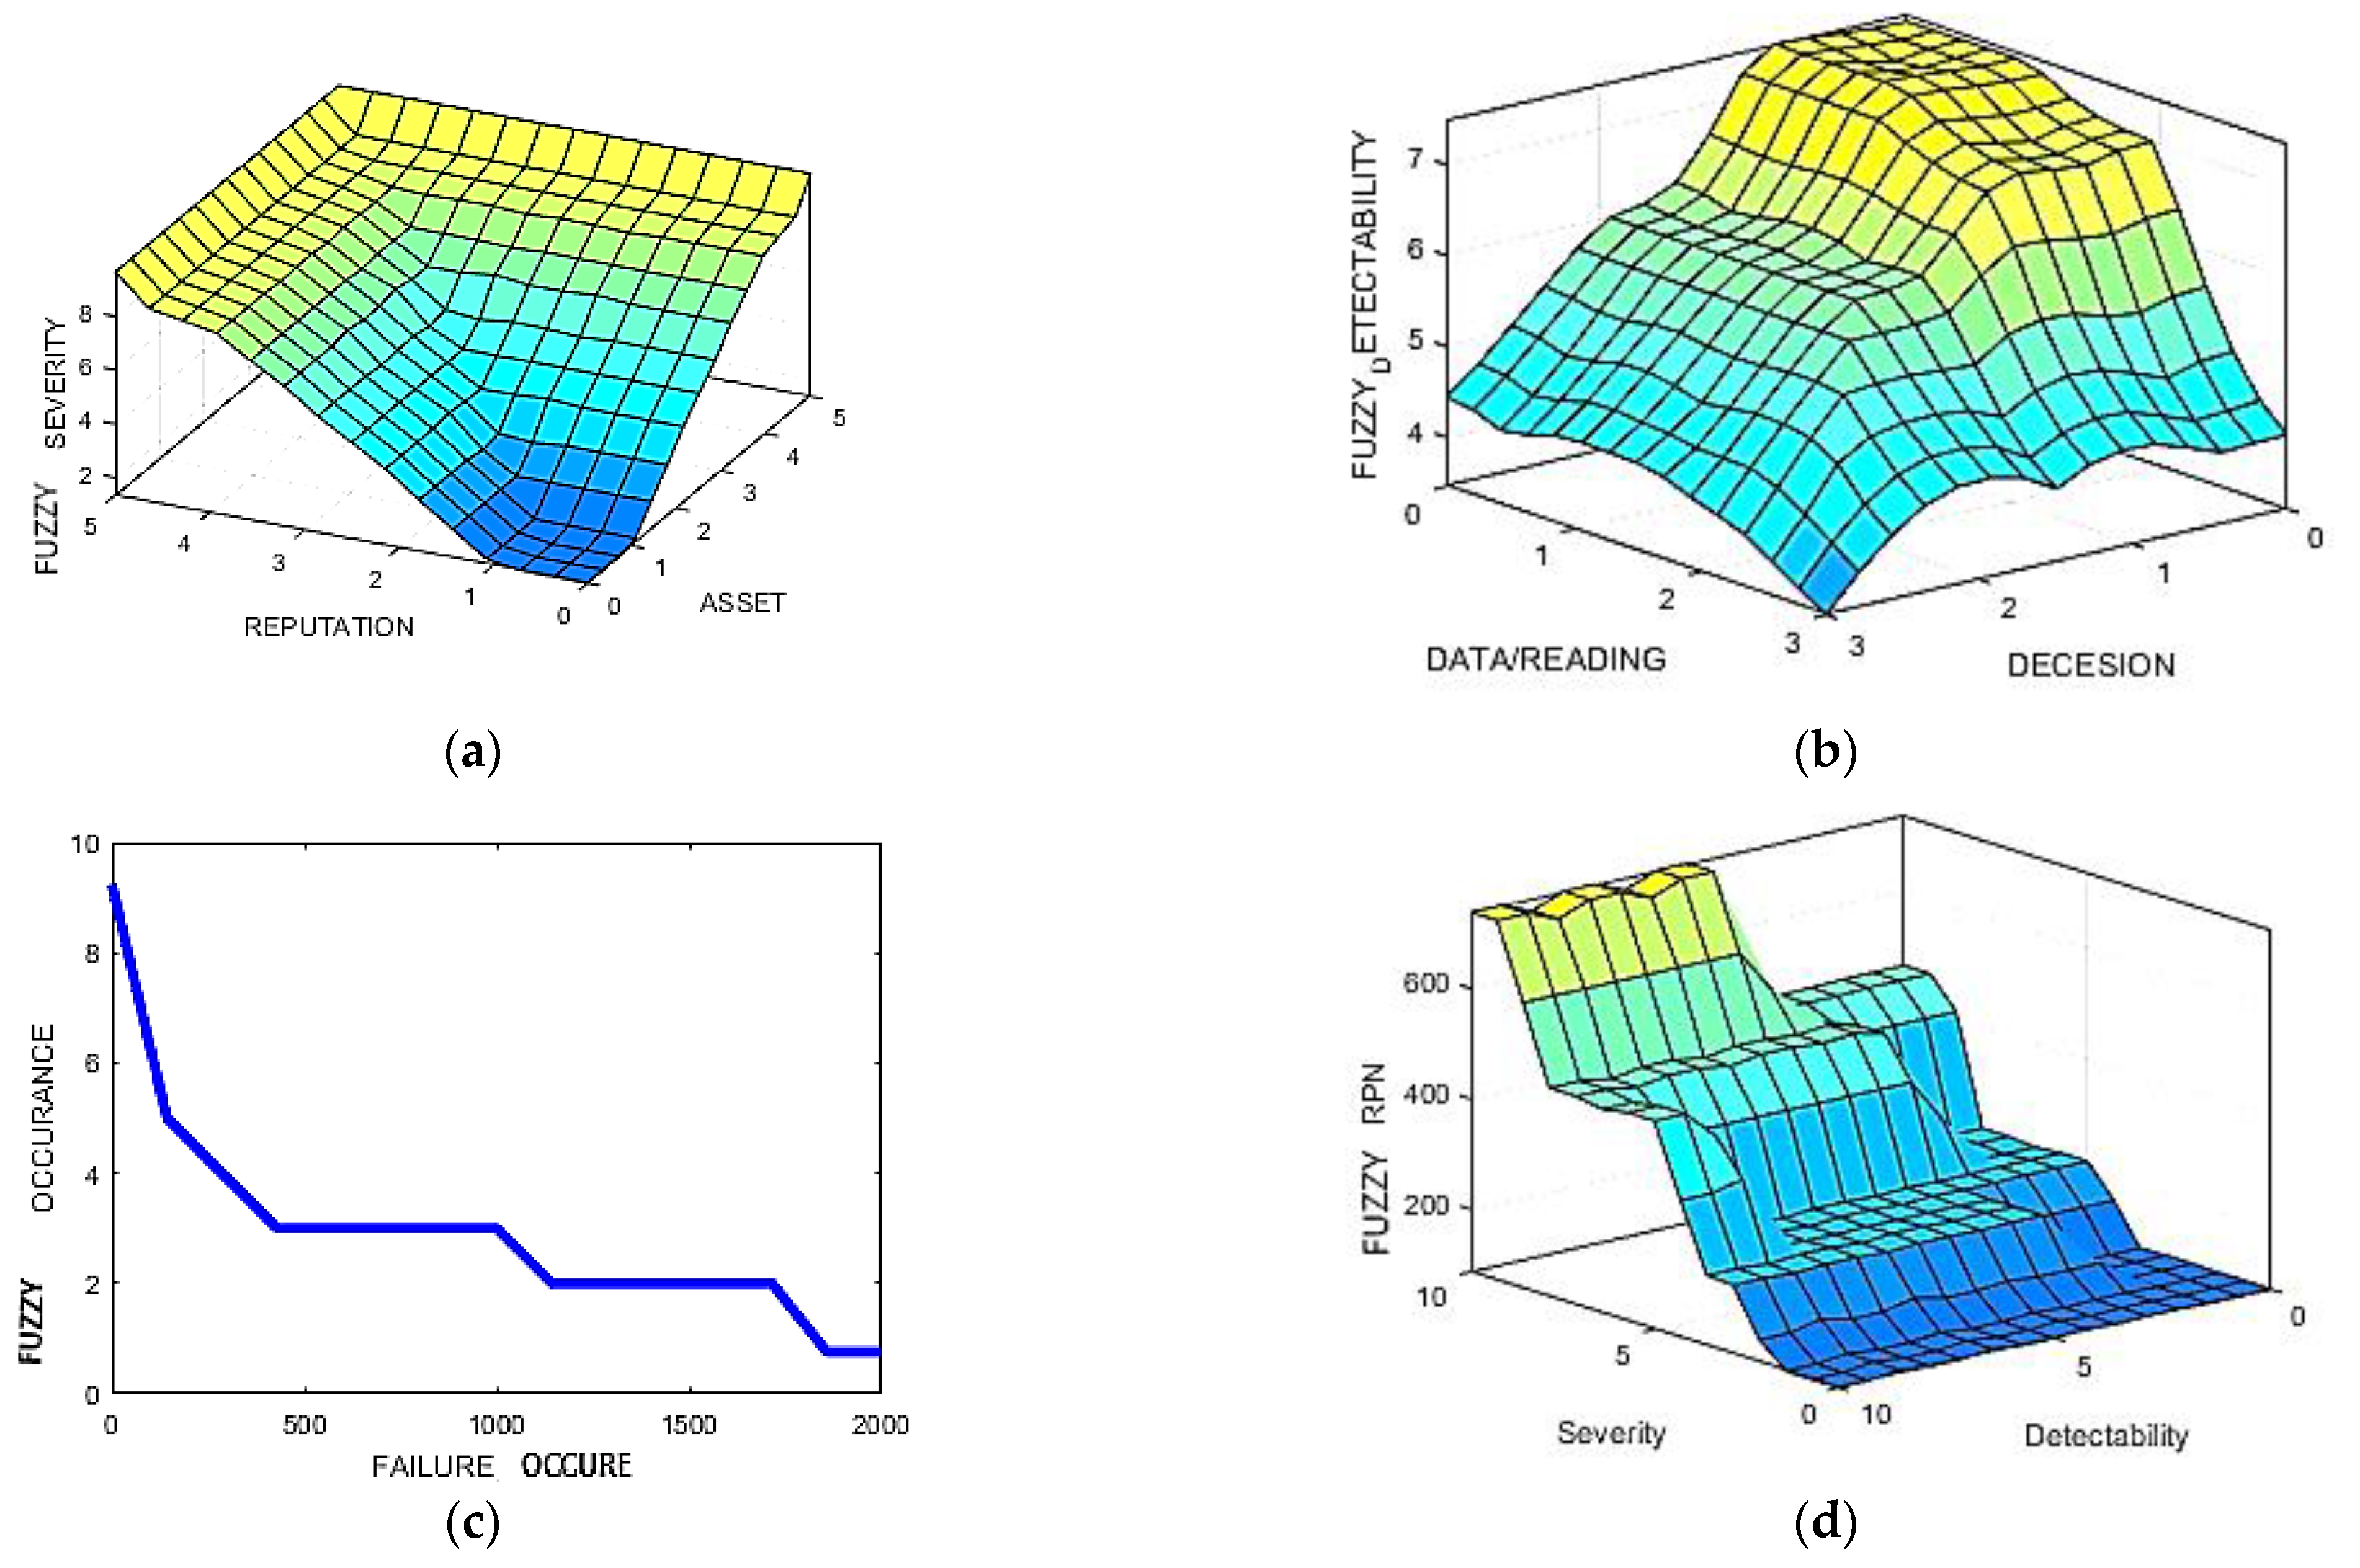
3.2. Fuzzy Inference Systems
3.3. Aggregation of Fuzzy Logic Systems
3.4. Defuzzification of Fuzzy Logic Systems
3.5. Analysis of Variance (ANOVA)
4. Discussion
- Modification/ capital expenditures (new equipment installation to increase redundancy or detectability, replacement of existing equipment, new material used in the construction of any part, new by-pass line, etc.);
- Modification/ operative expenditures (new material used in the construction of any part, new by-pass line, etc.);
- Safety spare parts;
- Operation (start-up and shut-down instructions, monitoring, checking routes, cleaning, etc.);
- Preventive maintenance (maintenance instructions, autonomous works, diagnostics, time-based maintenance, usage-based maintenance, inspection, etc.);
- Maintenance execution (assembly instruction, contractor competencies, and capabilities, tools, etc.);
- Quality assurance (receiving goods, technical supervision, manufacturing checks, technical standard compliance, etc.).
5. Conclusions
Author Contributions
Funding
Institutional Review Board Statement
Informed Consent Statement
Data Availability Statement
Acknowledgments
Conflicts of Interest
Appendix A

| 1 | If Severity is Very low and Occcrence is Rare and Detectability is Very high then RPN is Very low |
| 2 | If Severity is Very low and Occcrence is Unlikely and Detectability is Very high then RPN is Low |
| 3 | If Severity is Very low and Occcrence is Possible and Detectability is Very high then RPN is Low |
| 4 | If Severity is Very low and Occcrence is Likely and Detectability is Very high then RPN is Low |
| 5 | If Severity is Very low and Occcrence is Frequent and Detectability is Very high then RPN is Low |
| 6 | If Severity is Very low and Occcrence is Rare and Detectability is High then RPN is Low |
| 7 | If Severity is Very low and Occcrence is Unlikely and Detectability is High then RPN is Low |
| 8 | If Severity is Very low and Occcrence is Possible and Detectability is High then RPN is Low |
| 9 | If Severity is Very low and Occcrence is Likely and Detectability is High then RPN is Low |
| 10 | If Severity is Very low and Occcrence is Frequent and Detectability is High then RPN is Low |
| 11 | If Severity is Very low and Occcrence is Rare and Detectability is Medium then RPN is Low |
| 12 | If Severity is Very low and Occcrence is Unlikely and Detectability is Medium then RPN is Low |
| 13 | If Severity is Very low and Occcrence is Possible and Detectability is Medium then RPN is Low |
| 14 | If Severity is Very low and Occcrence is Likely and Detectability is Medium then RPN is Low |
| 15 | If Severity is Very low and Occcrence is Frequent and Detectability is Medium then RPN is Low |
| 16 | If Severity is Very low and Occcrence is Rare and Detectability is Low then RPN is Low |
| 17 | If Severity is Very low and Occcrence is Unlikely and Detectability is Low then RPN is Low |
| 18 | If Severity is Very low and Occcrence is Possible and Detectability is Low then RPN is Low |
| 19 | If Severity is Very low and Occcrence is Likely and Detectability is Low then RPN is Low |
| 20 | If Severity is Very low and Occcrence is Frequent and Detectability is Low then RPN is Low |
| 21 | If Severity is Very low and Occcrence is Rare and Detectability is Very low then RPN is Low |
| 22 | If Severity is Very low and Occcrence is Unlikely and Detectability is Very low then RPN is Low |
| 23 | If Severity is Very low and Occcrence is Possible and Detectability is Very low then RPN is Low |
| 24 | If Severity is Very low and Occcrence is Likely and Detectability is Very low then RPN is Low |
| 25 | If Severity is Very low and Occcrence is Frequent and Detectability is Very low then RPN is Low |
| 26 | If Severity is Low and Occcrence is Rare and Detectability is Very high then RPN is Low |
| 27 | If Severity is Low and Occcrence is Unlikely and Detectability is Very high then RPN is Low |
| 28 | If Severity is Low and Occcrence is Possible and Detectability is Very high then RPN is Low |
| 29 | If Severity is Low and Occcrence is Likely and Detectability is Very high then RPN is Low |
| 30 | If Severity is Low and Occcrence is Frequent and Detectability is Very high then RPN is Medium |
| 31 | If Severity is Low and Occcrence is Rare and Detectability is High then RPN is Medium |
| 32 | If Severity is Low and Occcrence is Unlikely and Detectability is High then RPN is Medium |
| 33 | If Severity is Low and Occcrence is Possible and Detectability is High then RPN is Medium |
| 34 | If Severity is Low and Occcrence is Likely and Detectability is High then RPN is Medium |
| 35 | If Severity is Low and Occcrence is Frequent and Detectability is High then RPN is Medium |
| 36 | If Severity is Low and Occcrence is Rare and Detectability is Medium then RPN is Medium |
| 37 | If Severity is Low and Occcrence is Unlikely and Detectability is Medium then RPN is Medium |
| 38 | If Severity is Low and Occcrence is Possible and Detectability is Medium then RPN is Medium |
| 39 | If Severity is Low and Occcrence is Likely and Detectability is Medium then RPN is Medium |
| 40 | If Severity is Low and Occcrence is Frequent and Detectability is Medium then RPN is Medium |
| 41 | If Severity is Low and Occcrence is Rare and Detectability is Low then RPN is Medium |
| 42 | If Severity is Low and Occcrence is Unlikely and Detectability is Low then RPN is Medium |
| 43 | If Severity is Low and Occcrence is Possible and Detectability is Low then RPN is Medium |
| 44 | If Severity is Low and Occcrence is Likely and Detectability is Low then RPN is Medium |
| 45 | If Severity is Low and Occcrence is Frequent and Detectability is Low then RPN is Medium |
| 46 | If Severity is Low and Occcrence is Rare and Detectability is Very low then RPN is Medium |
| 47 | If Severity is Low and Occcrence is Unlikely and Detectability is Very low then RPN is Medium |
| 48 | If Severity is Low and Occcrence is Possible and Detectability is Very low then RPN is Medium |
| 49 | If Severity is Low and Occcrence is Likely and Detectability is Very low then RPN is Medium |
| 50 | If Severity is Low and Occcrence is Frequent and Detectability is Very low then RPN is Medium |
| 51 | If Severity is Medium and Occcrence is Rare and Detectability is Very high then RPN is Medium |
| 52 | If Severity is Medium and Occcrence is Unlikely and Detectability is Very high then RPN is Medium |
| 53 | If Severity is Medium and Occcrence is Possible and Detectability is Very high then RPN is Medium |
| 54 | If Severity is Medium and Occcrence is Likely and Detectability is Very high then RPN is Medium |
| 55 | If Severity is Medium and Occcrence is Frequent and Detectability is Very high then RPN is Medium |
| 56 | If Severity is Medium and Occcrence is Rare and Detectability is High then RPN is Medium |
| 57 | If Severity is Medium and Occcrence is Unlikely and Detectability is High then RPN is Medium |
| 58 | If Severity is Medium and Occcrence is Possible and Detectability is High then RPN is Medium |
| 59 | If Severity is Medium and Occcrence is Likely and Detectability is High then RPN is Medium |
| 60 | If Severity is Medium and Occcrence is Frequent and Detectability is High then RPN is Medium |
| 61 | If Severity is Medium and Occcrence is Rare and Detectability is Medium then RPN is Medium |
| 62 | If Severity is Medium and Occcrence is Unlikely and Detectability is Medium then RPN is Medium |
| 63 | If Severity is Medium and Occcrence is Possible and Detectability is Medium then RPN is Medium |
| 64 | If Severity is Medium and Occcrence is Likely and Detectability is Medium then RPN is Medium |
| 65 | If Severity is Medium and Occcrence is Frequent and Detectability is Medium then RPN is Medium |
| 66 | If Severity is Medium and Occcrence is Rare and Detectability is Low then RPN is Medium |
| 67 | If Severity is Medium and Occcrence is Unlikely and Detectability is Low then RPN is Medium |
| 68 | If Severity is Medium and Occcrence is Possible and Detectability is Low then RPN is Medium |
| 69 | If Severity is Medium and Occcrence is Likely and Detectability is Low then RPN is Medium |
| 70 | If Severity is Medium and Occcrence is Frequent and Detectability is Low then RPN is Medium |
| 71 | If Severity is Medium and Occcrence is Rare and Detectability is Very low then RPN is Medium |
| 72 | If Severity is Medium and Occcrence is Unlikely and Detectability is Very low then RPN is Medium |
| 73 | If Severity is Medium and Occcrence is Possible and Detectability is Very low then RPN is Medium |
| 74 | If Severity is Medium and Occcrence is Likely and Detectability is Very low then RPN is High |
| 75 | If Severity is Medium and Occcrence is Frequent and Detectability is Very low then RPN is High |
| 76 | If Severity is High and Occcrence is Rare and Detectability is Very high then RPN is Medium |
| 77 | If Severity is High and Occcrence is Unlikely and Detectability is Very high then RPN is Medium |
| 78 | If Severity is High and Occcrence is Possible and Detectability is Very high then RPN is Medium |
| 79 | If Severity is High and Occcrence is Likely and Detectability is Very high then RPN is Medium |
| 80 | If Severity is High and Occcrence is Frequent and Detectability is Very high then RPN is High |
| 81 | If Severity is High and Occcrence is Rare and Detectability is High then RPN is Medium |
| 82 | If Severity is High and Occcrence is Unlikely and Detectability is High then RPN is Medium |
| 83 | If Severity is High and Occcrence is Possible and Detectability is High then RPN is High |
| 84 | If Severity is High and Occcrence is Likely and Detectability is High then RPN is High |
| 85 | If Severity is High and Occcrence is Frequent and Detectability is High then RPN is High |
| 86 | If Severity is High and Occcrence is Rare and Detectability is Medium then RPN is Medium |
| 87 | If Severity is High and Occcrence is Unlikely and Detectability is Medium then RPN is High |
| 88 | If Severity is High and Occcrence is Possible and Detectability is Medium then RPN is High |
| 89 | If Severity is High and Occcrence is Likely and Detectability is Medium then RPN is High |
| 90 | If Severity is High and Occcrence is Frequent and Detectability is Medium then RPN is High |
| 91 | If Severity is High and Occcrence is Rare and Detectability is Low then RPN is Medium |
| 92 | If Severity is High and Occcrence is Unlikely and Detectability is Low then RPN is High |
| 93 | If Severity is High and Occcrence is Possible and Detectability is Low then RPN is High |
| 94 | If Severity is High and Occcrence is Likely and Detectability is Low then RPN is High |
| 95 | If Severity is High and Occcrence is Frequent and Detectability is Low then RPN is High |
| 96 | If Severity is High and Occcrence is Rare and Detectability is Very low then RPN is Medium |
| 97 | If Severity is High and Occcrence is Unlikely and Detectability is Very low then RPN is High |
| 98 | If Severity is High and Occcrence is Possible and Detectability is Very low then RPN is High |
| 99 | If Severity is High and Occcrence is Likely and Detectability is Very low then RPN is High |
| 100 | If Severity is High and Occcrence is Frequent and Detectability is Very low then RPN is High |
| 101 | If Severity is Very high and Occcrence is Rare and Detectability is Very high then RPN is Medium |
| 102 | If Severity is Very high and Occcrence is Unlikely and Detectability is Very high then RPN is High |
| 103 | If Severity is Very high and Occcrence is Possible and Detectability is Very high then RPN is High |
| 104 | If Severity is Very high and Occcrence is Likely and Detectability is Very high then RPN is High |
| 105 | If Severity is Very high and Occcrence is Frequent and Detectability is Very high then RPN is High |
| 106 | If Severity is Very high and Occcrence is Rare and Detectability is High then RPN is High |
| 107 | If Severity is Very high and Occcrence is Unlikely and Detectability is High then RPN is High |
| 108 | If Severity is Very high and Occcrence is Possible and Detectability is High then RPN is High |
| 109 | If Severity is Very high and Occcrence is Likely and Detectability is High then RPN is High |
| 110 | If Severity is Very high and Occcrence is Frequent and Detectability is High then RPN is Very high |
| 111 | If Severity is Very high and Occcrence is Rare and Detectability is Medium then RPN is High |
| 112 | If Severity is Very high and Occcrence is Unlikely and Detectability is Medium then RPN is High |
| 113 | If Severity is Very high and Occcrence is Possible and Detectability is Medium then RPN is High |
| 114 | If Severity is Very high and Occcrence is Likely and Detectability is Medium then RPN is High |
| 115 | If Severity is Very high and Occcrence is Frequent and Detectability is Medium then RPN is Very high |
| 116 | If Severity is Very high and Occcrence is Rare and Detectability is Low then RPN is High |
| 117 | If Severity is Very high and Occcrence is Unlikely and Detectability is Low then RPN is High |
| 118 | If Severity is Very high and Occcrence is Possible and Detectability is Low then RPN is Very high |
| 119 | If Severity is Very high and Occcrence is Likely and Detectability is Low then RPN is Very high |
| 120 | If Severity is Very high and Occcrence is Frequent and Detectability is Low then RPN is Very high |
| 121 | If Severity is Very high and Occcrence is Rare and Detectability is Very low then RPN is High |
| 122 | If Severity is Very high and Occcrence is Unlikely and Detectability is Very low then RPN is High |
| 123 | If Severity is Very high and Occcrence is Possible and Detectability is Very low then RPN is Very high |
| 124 | If Severity is Very high and Occcrence is Likely and Detectability is Very low then RPN is Very high |
| 125 | If Severity is Very high and Occcrence is Frequent and Detectability is Very low then RPN is Very high |
Appendix B
| Failure Mode | Possible Consequence, Severity ”S” | Process Controls, Detectability “D” | Experts | Fuzzy Variable | |||
|---|---|---|---|---|---|---|---|
| 1st | 2nd | 3th | |||||
| The level in D-101 increases, liquid gets to the BD system thru PV-101B valve or safety valves PSV-101A/B, possible catalyst degradation, S/D. | FI-104, LIC-102, LSLH-101 IS-01 interlock | S | 7 | 7 | 6 | 7.5 |
| D | 1 | 1 | 1 | 2.14 | |||
| The level in D-101 rising further, liquid gets to safety valves PSV-101A/B. Feed must be stopped manually before the D-007 flare k.o. drum overfilling, S/D | FI-104, LIC-102, LSLH-101, D-007, LIS-013, I-102 Measurement is done manually by staff | S | 7 | 7 | 6 | 7.5 |
| D | 4 | 4 | 4 | 4.56 | |||
| The level in D-101 decreasing, if D-101 emptying P-101A/B pumps dry running may cause damage. Combustible gas discharging at the pump sealing, fire hazard, S/D. | FI-104, LIC-102, LSLH-101 IS-02 interlock Storage tank level indicators and alarm Asset management system | S | 7 | 7 | 7 | 7.5 |
| D | 3 | 3 | 3 | 2.14 | |||
| The temperature of feed may increase above 80°C, the feed line and/or F-101 filter may be damaged. The quality of the product is out of specification. S/D of feed unit. | TI-101 (TAH) TI-102 Debutanizer shutdown Alarm signal on DCS | S | 4 | 4 | 5 | 3.5 |
| D | 4 | 4 | 4 | 4.56 | |||
| Leakage in E-101 heat exchanger, light hydrogen excess will cause an increase in reactor temperature, the temperature may reach a hazardous level, the reactor may be damaged, fire hazard, S/D | TI-108, TI-125, TSHH-108, TSHH-125, TI-126, TSHH-126 IS-04 interlock Lab analysis. | S | 8 | 8 | 8 | 7.5 |
| D | 7 | 7 | 8 | 8 | |||
| R-101 pressure may decrease below the vapor pressure of the medium, feed must be stopped manually before the D-007 flare k.o. drum overfilling. S/D there is no pressure. | PIC-107 (PAL) Measurement required S/D to switch PSV | S | 5 | 6 | 6 | 5.5 |
| D | 7 | 7 | 7 | 7.5 | |||
| IS-03 interlock closes, UV-104 as well, the feed stops. Temperature increasing near to the oil temperature may cause lighter damage. | TI-108, TI-125, TSHH-108, TSHH-125, TI-126 TSHH-126 | S | 4 | 4 | 4 | 3.5 |
| D | 3 | 3 | 2 | 2.14 | |||
| SHU reactor overheating protection (IS-04) does not close HC feed to the reactor, hot CH feeding may continue. The temperature in the reactor cannot be maintained, an exothermic reaction occurs, overheating in the reactor, fire hazard, S/D. | TI-108, TI-125, TSHH-108, TSHH-125, TI-126 TSHH-126 | S | 8 | 9 | 9 | 7.5 |
| D | 1 | 1 | 1 | 2.14 | |||
| High fluctuations and foaming at the reboiler return nozzle. Lower trays may be submerged and the separation declining. Without intervention temp reach the hazardous level, the reactor may be damaged, fire hazard, S/D | LIC-108 FIC-112 IS-09 interlock LG-112 (local) | S | 9 | 8 | 9 | 7.5 |
| D | 1 | 1 | 2 | 2.14 | |||
| D-102 reflux drum level increasing, tray 5 level decreasing. Blowdown to the flare through PSV-104A/B. The product is out of specification. | Tray 26: TI-133 Tray 33: TI-136 Tray 2: TI-135 Tray 17: TIC-137 FIC-114 (FAL) LIC-110 (LAH) | S | 4 | 4 | 5 | 3.5 |
| D | 4 | 4 | 4 | 4.56 | |||
| No | Equipment | Risk | Unmitigated Risk | Mitigation Action Proposed | Fuzzy | |||
|---|---|---|---|---|---|---|---|---|
| S | O | D | RPN | RPN | ||||
| 1. | D-101, D-102 | Steam explosion | 8 | 9 | 10 | 720 | Change feed introduction. | 464 |
| 2. | SP1AB, SP2AB, SP3, SP4AB, SP5, SP6AB, SP7AB, SP8AB, | Cannot switch drum because critical valves sensors, switch fault | 9 | 7 | 6 | 378 | Review the logic system(s). | 738 |
| 3. | P-118AB | Too short cycle time (EDC loss) | 6 | 8 | 7 | 336 | Anti-foaming agent dosing instrumental control (DCS). | 214 |
| 4. | P113ABC-P106AB | Too high outlet temperature | 8 | 6 | 6 | 288 | Review nozzle capacity. | 464 |
| 5. | SP1AB | Too low skin temperature. (<150 °C) | 9 | 6 | 5 | 270 | Improved, more reliable replacement type. | 464 |
| 6. | Tk-101 | Coke cutting impossible | 7 | 7 | 5 | 245 | Regular review. | 464 |
| 7. | Coke cutting system | Coke cutting impossible | 7 | 5 | 7 | 245 | Improved, more reliable replacement type (drilling system) | 464 |
| 8. | SP6AB | H-101 plugging with coke. | 9 | 5 | 5 | 225 | Improved, more reliable replacement type. | 464 |
| 9. | Coke handling system Crane(1),Conveyor(7),Crusher(1) | PIT filled up. | 7 | 4 | 7 | 196 | Associated organization (Logistics) maintenance (UPTIME) improvement: crane bucket, crane rope, crane rail wheels, crane electric cable, crushers, conveyors, folding rollers and guide rollers. | 464 |
| 10. | Drums overhead line D101-2 to T-101 | Pipe plug. | 9 | 5 | 4 | 180 | Evan Hyde: restore the HCGO quench; | 464 |
| 11. | H-101 to D101-2 inlet line | Pipe block. | 9 | 5 | 4 | 180 | Analyst (heat) camera used from drum roof. | 465 |
| 12. | V101A | Cannot open/close the drum. | 7 | 6 | 4 | 168 | Review the logic system (s). | 465 |
| 13. | MPS supply line | MPS supply fault /leaks, block | 7 | 6 | 4 | 168 | Review MPS supply reliability, and improve if possible. | 465 |
| 14. | D-101/D-102, SP3 | Too low skin temperature (<150 °C) | 6 | 7 | 4 | 168 | Improved, more reliable replacement type. | 214 |
| 15. | SP1AB, SP2AB,11AB | Critical valves fault /block/ | 8 | 3 | 5 | 120 | Instructions: regular cleaning and inspection cycle maximum 2 years. | 464 |
| 16. | CFC101 A/B | Quench water into drums controller | 8 | 3 | 5 | 120 | Instructions: Alternative steam stripping and water cooling beside local management; | 464 |
| 17. | 12AB, 14AB, SP7AB CXV128/129 | Critical valves fault /PITCH formed in drums/ | 9 | 1 | 10 | 90 | Inspection: according industry experience create action plan for inspection. | 464 |
| 18. | P116-D107, pipeline | Coke Condensate system leaks | 9 | 1 | 7 | 63 | No recommendation | 464 |
| 19. | E-102 | Plugged by coke “explosion” | 8 | 1 | 6 | 48 | Outlet line connect to flare | 214 |
| 20. | P-110 AB | Quench water supply pump | 8 | 1 | 5 | 40 | No recommendation | 214 |
References
- ISO. 14:00–17:00, “ISO Guide 73:2009 Risk Management—Vocabulary. Available online: https://www.iso.org/cms/render/live/en/sites/isoorg/contents/data/standard/04/46/44651.html (accessed on 14 November 2020).
- Deighton, M.G. Facility Integrity Management: Effective Principles and Practices for the Oil, Gas, and Petrochemical Industries; Elsevier Inc.: Amsterdam, The Netherlands, 2016; Available online: https://ina.percipio.com/books/cd304330-f3f8-11e6-bb2f-0242c0a80b05 (accessed on 11 September 2021).
- ISO. ISO 31000:2009 Risk Management—Principles and Guidelines; ISO: Geneva, Switzerland, 15 November 2009. [Google Scholar]
- Carlson, C.S. Effective FMEAs: Achieving Safe, Reliable, and Economical Products and Processes Using Failure Mode and Effects Analysis; John Wiley & Sons, Inc.: Hoboken, NJ, USA, 2012; Available online: https://ina.percipio.com/books/a7188ab0-f12b-11e6-9684-0242c0a80902 (accessed on 11 September 2021).
- Okwuobi, S.; Ishola, F.; Ajayi, O.O.; Enesi, S.; Kehinde, A.; Olatunji, O.; Akinlabi, S.A. A Reliability-Centered Maintenance Study for an Individual Section-Forming Machine. Machines 2018, 6, 50. [Google Scholar] [CrossRef]
- Liu, H.-C.; Liu, L.; Liu, N. Risk evaluation approaches in failure mode and effects analysis: A literature review. Expert Syst. Appl. 2013, 40, 828–838. [Google Scholar] [CrossRef]
- Liu, H.-C.; Wang, L.-E.; You, X.-Y.; Wu, S.-M. Failure mode and effect analysis with extended grey relational analysis method in cloud setting. Total Qual. Manag. Bus. Excell. 2019, 30, 745–767. [Google Scholar] [CrossRef]
- Supsomboon, S.; Hongthanapach, K. A Simulation Model for Machine Efficiency Improvement Using Reliability Centered Maintenance: Case Study of Semiconductor Factory. Model. Simul. Eng. 2014, 2014, 1–9. [Google Scholar] [CrossRef]
- Razi, F.F.; Danaei, A.; Ehsani, A.; Dolati, C. An FMEA analysis using grey theory and grey rough sets. Decis. Sci. Lett. 2013, 2, 299–304. [Google Scholar] [CrossRef]
- Chang, C.; Liu, P.; Wei, C. Failure mode and effects analysis using grey theory. Integr. Manuf. Syst. 2001, 12, 211–216. [Google Scholar] [CrossRef]
- Khamseh, A.A.; Mahmoodi, M. A New Fuzzy TOPSIS-TODIM Hybrid Method for Green Supplier Selection Using Fuzzy Time Function. Adv. Fuzzy Syst. 2014, 2014, 1–10. [Google Scholar] [CrossRef]
- Chang, K.-H. Generalized multi-attribute failure mode analysis. Neurocomputing 2016, 175, 90–100. [Google Scholar] [CrossRef]
- Wang, L.; Hu, Y.; Liu, H.; Shi, H. A linguistic risk prioritization approach for failure mode and effects analysis: A case study of medical product development. Qual. Reliab. Eng. Int. 2019, 35, 1735–1752. [Google Scholar] [CrossRef]
- Geramian, A.; Abraham, A.; Nozari, M.A. Fuzzy logic-based FMEA robust design: A quantitative approach for robustness against groupthink in group/team decision-making. Int. J. Prod. Res. 2019, 57, 1331–1344. [Google Scholar] [CrossRef]
- Gallab, M.; Bouloiz, H.; Alaoui, Y.L.; Tkiouat, M. Risk Assessment of Maintenance activities using Fuzzy Logic. Procedia Comput. Sci. 2019, 148, 226–235. [Google Scholar] [CrossRef]
- Baghbani, M.; Iranzadeh, S.; Khajeh, M.B. Investigating the relationship between RPN parameters in fuzzy PFMEA and OEE in a sugar factory. J. Loss Prev. Process Ind. 2019, 60, 221–232. [Google Scholar] [CrossRef]
- Anes, V.; Henriques, E.; Freitas, M.; Reis, L. A new risk prioritization model for failure mode and effects analysis. Qual. Reliab. Eng. Int. 2018, 34, 516–528. [Google Scholar] [CrossRef]
- Gupta, G.; Mishra, R.P. A Failure Mode Effect and Criticality Analysis of Conventional Milling Machine Using Fuzzy Logic: Case Study of RCM: A FMECA of Conventional Milling Machine Using Fuzzy Logic. Qual. Reliab. Eng. Int. 2017, 33, 347–356. [Google Scholar] [CrossRef]
- Yang, Z.; Wang, J. Use of fuzzy risk assessment in FMEA of offshore engineering systems. Ocean Eng. 2015, 95, 195–204. [Google Scholar] [CrossRef]
- Petrović, D.V.; Tanasijević, M.; Milić, V.; Lilić, N.; Stojadinović, S.; Svrkota, I. Risk assessment model of mining equipment failure based on fuzzy logic. Expert Syst. Appl. 2014, 41, 8157–8164. [Google Scholar] [CrossRef]
- Bonato, J.; Badurina, M.; Dobrinić, J. Parameters Assessment of the FMEA Method by Means of Fuzzy Logic. J. Marit. Transp. Sci. 2018, 2, 123–132. [Google Scholar] [CrossRef]
- Liu, H.-C.; You, J.-X.; Shan, M.-M.; Su, Q. Systematic failure mode and effect analysis using a hybrid multiple criteria decision-making approach. Total Qual. Manag. Bus. Excell. 2019, 30, 537–564. [Google Scholar] [CrossRef]
- Liu, H.-C.; You, J.-X.; You, X.-Y.; Shan, M.-M. A novel approach for failure mode and effects analysis using combination weighting and fuzzy VIKOR method. Appl. Soft Comput. 2015, 28, 579–588. [Google Scholar] [CrossRef]
- di Bona, G.; Silvestri, A.; Forcina, A.; Petrillo, A. Total efficient risk priority number (TERPN): A new method for risk assessment. J. Risk Res. 2018, 21, 1384–1408. [Google Scholar] [CrossRef]
- Şimşek, B.; İç, Y.T. Fuzzy failure mode and effect analysis application to reduce risk level in a ready-mixed concrete plant: A fuzzy rule based system modelling approach. Math. Comput. Simul. 2020, 178, 549–587. [Google Scholar] [CrossRef]
- Shi, H.; Wang, L.; Li, X.-Y.; Liu, H.-C. A novel method for failure mode and effects analysis using fuzzy evidential reasoning and fuzzy Petri nets. J. Ambient Intell. Humaniz. Comput. 2020, 11, 2381–2395. [Google Scholar] [CrossRef]
- Pillay, A.; Wang, J. Modified failure mode and effects analysis using approximate reasoning. Reliab. Eng. Syst. Saf. 2003, 79, 69–85. [Google Scholar] [CrossRef]
- Hernandez-Aguila, A.; García-Valdez, M.; Merelo-Guervós, J.-J.; Castañón-Puga, M.; López, O.C. Using Fuzzy Inference Systems for the Creation of Forex Market Predictive Models. IEEE Access 2021, 9, 69391–69404. [Google Scholar] [CrossRef]
- Xu, M.; Peng, D. Fire Safety Assessment of High-Rise Buildings Based on Fuzzy Theory and Radial Basis Function Neural Network. Ingénierie Systèmes Inf. 2020, 25, 267–274. [Google Scholar] [CrossRef]
- Kaur, J.; Khehra, B.S. Fuzzy Logic and Hybrid based Approaches for the Risk of Heart Disease Detection: State-of-the-Art Review. J. Inst. Eng. India Ser. B 2021, 1–17. [Google Scholar] [CrossRef]
- Pecht, M.; Kapur, K.C. Percipio Book Reliability Engineering; John Wiley & Sons (US): Hoboken, NJ, USA, 2014; Available online: https://ina.percipio.com/books/d8509830-f2e2-11e6-bb29-0242c0a80506 (accessed on 7 November 2021).
- Todinov, M. Percipio Book Reliability and Risk Models: Setting Reliability Requirements, 2nd ed.; John Wiley & Sons, Ltd.: Chichester, UK, 2015; Available online: https://ina.percipio.com/books/52bbf460-f3f7-11e6-ad5d-0242c0a80607 (accessed on 7 November 2021).
- McDermott, R.E.; Mikulak, R.J.; Beauregard, M.R. The Basics of FMEA, 2nd ed.; Taylor & Francis Group: Danvers, CO, USA, 2009; Available online: https://ina.percipio.com/books/27a15b30-f01e-11e6-93a6-0242c0a80a09 (accessed on 11 September 2021).
- Vasant, P. Handbook of Research on Artificial Intelligence Techniques and Algorithms; IGI Global: Hershey PA, USA, 2015; Available online: https://ina.percipio.com/books/ec656ed0-f3a6-11e6-b0e2-0242c0a80804 (accessed on 18 September 2021).
- Singh, H. Deep Neuro-Fuzzy Systems with Python: With Case Studies and Applications from the Industry; Apress, Springer Science+Business Media: New York, NY, USA, 2020; Available online: https://ina.percipio.com/books/3e5bcb2d-3a2d-497a-aea3-045213c88e4e/chapter/ch03 (accessed on 12 September 2021).
- Aven, T. Risk Analysis, 2nd ed.; John Wiley & Sons (UK): Hoboken, NJ, USA, 2015; Available online: https://ina.percipio.com/books/54d65f00-f3ee-11e6-bb2f-0242c0a80b05 (accessed on 11 September 2021).
- Godina, R.; Silva, B.G.R.; Espadinha-Cruz, P. A DMAIC Integrated Fuzzy FMEA Model: A Case Study in the Automotive Industry. Appl. Sci. 2021, 11, 3726. [Google Scholar] [CrossRef]


| Criteria | Fuzzy Set | Description | Fuzzy Numbers |
|---|---|---|---|
| Assets | VL | Slight damage (<10 kUSD) | (0 0 2 3) |
| L | Minor damage (10–100 kUSD) | (2 3 4 5) | |
| M | Local damage (0.1–1 mUSD) | (4 5 6 7) | |
| H | Major damage (1–10 mUSD) | (6 7 9 10) | |
| VH | Extensive damage (>10 mUSD) | (9 10 10) | |
| People | VL | Slight injury or health effect | (0 0 2 3) |
| L | Minor injury or health effect | (2 3 4 5) | |
| M | Serious injury or health effect | (4 5 6 7) | |
| H | Single fatality or disability | (6 7 9 10) | |
| VH | Multiple fatalities | (9 10 10) | |
| Environment | VL | Slight effect | (0 0 2 3) |
| L | Minor effect | (2 3 4 5) | |
| M | Local effect | (4 5 6 7) | |
| H | Major effect | (6 7 9 10) | |
| VH | Massive effect | (9 10 10) | |
| Reputation | VL | Slight impact | (0 0 2 3) |
| L | Limited impact | (2 3 4 5) | |
| M | Considerable impact | (4 5 6 7) | |
| H | National impact | (6 7 9 10) | |
| VH | International impact | (9 10 10) |
| Ranking | Fuzzy Severity | Fuzzy Detectability | Fuzzy Occurrence |
|---|---|---|---|
| 10 | Dangerous without warning | Absolute uncertainty | Extremely high |
| 9 | Dangerous with warning | Very remote | Very high |
| 8 | Very high | Remote | High |
| 7 | High | Very low | Frequent |
| 6 | Medium | Low | Moderately frequent |
| 5 | Low | Moderate | Randomly |
| 4 | Very low | Moderately high | Not frequently |
| 3 | Weak | High | Rarely |
| 2 | Very weak | Very high | Very rarely |
| 1 | None | Almost certain | None |
| Criteria | Ranking | Fuzzy Set | Description | Fuzzy Numbers |
|---|---|---|---|---|
| PROCES/CONTROL | 1 | No | Nothing available. | (0 0 1 2) |
| 2 | Experts | No diagnostic is available or feasible, controlled by experts. | (1 2 3) | |
| 3 | OS | Operator staff provides the supervision. | (2 3 4) | |
| 4 | OS + LAB | Operator staff and/or diagnostic systems (trends, lab checks). | (3 4 5) | |
| 5 | I + LS | Field instruments are available. | (4 5 6) | |
| 6 | I + LS + Signal | Field instruments are available and/or diagnostic systems (trends, lab checks) | (5 6 7) | |
| 7 | I + DCS | The process control system and/or the real-time diagnostic. | (6 7 8) | |
| 8 | I + DCS + Failure | The process control system and/or the real-time diagnostic will detect the signs of a potential cause/mechanism (e.g., inter lock, AutoStart). | (7 8 9) | |
| 9 | SIS | Safety Instrumented System. | (8 9 9 10) | |
| DECESION | 0 | No Act | No mitigation action | (0 0 1) |
| 1 | SME | Measurement requires an SME engineer to observe. | (0 1 2) | |
| 2 | STAFF | The intervention is made by the staff. | (1 2 3) | |
| 3 | AUTO | The intervention is made automatically. | (2 3 3) | |
| DATA/READING | 0 | No Data | Nothing available | (0 0 1) |
| 1 | S/D | Measurement is conducted during shutdown (S/D). | (0 1 2) | |
| 2 | OFFLINE | Off-line diagnostics and condition monitoring conducted during operation. | (1 2 3) | |
| 3 | ON LINE | Real-time diagnostics and condition monitoring conducted during operation | (2 3 3) |
| Frequency | Ranking | Linguistic Ranking | Description | Fuzzy Numbers |
|---|---|---|---|---|
| Daily | 10 | Extremely high | The failure is almost inevitable. Occurs every day (even more than once). | (0 0 3 4) |
| 9 | Very high | Happens (almost) every day. | (3 4 7 8) | |
| Weekly | 8 | High | Repeated failures. Occurs (sometimes more than) once per week. | (7 8 31 32) |
| 7 | Frequent | It takes more time than a week for one occurrence, but it happens every month. | ||
| Monthly | 6 | Moderately frequent | Failures occur relatively frequently. Occur every three months at least. | (30 32 90 93) |
| 5 | Randomly | Failures appear infrequently. Occur once per six months. | (90 93 180 186) | |
| 4 | Not frequently | Failure happens once per 12 months. | (180 186 365 366) | |
| Yearly | 3 | Rarely | One occurrence per 1–3 years. (e.g., two failures per TA cycle) | (360 365 1000 1095) |
| 2 | Very rarely | One occurrence per 3–5 years. (e.g., one failure per TA cycle) | (1000 1095 1800 1825) | |
| TA cycle | 1 | None | One occurrence in more than 5 years. (e.g., one failure per more than one TA cycle) | (1800 1825 2000 2025) |
| Fuzzy Variables | 2nd Fuzzy Set | Fuzzy Numbers |
|---|---|---|
| Severity | Very low | (0 0 2 3) |
| Low | (1 2 4 5) | |
| Medium | (4 5 6 7) | |
| High | (6 7 8 9) | |
| Very high | (8 9 10 10) | |
| Occurrence | Rare | (0 0 1 2) |
| Unlikely | (1 2 4 5) | |
| Possible | (4 5 6 7) | |
| Likely | (6 7 8 9) | |
| Frequent | (8 9 10 10) | |
| Detectability | Very low | (8 9 10 10) |
| Low | (6 7 8 9) | |
| Medium | (4 5 6 7) | |
| High | (2 3 4 5) | |
| Very high | (0 0 2 3) | |
| RPN | Very low | (0 0 2 4) |
| Low | (6 30 100 200) | |
| Medium | (6 160 300 400) | |
| High | (80 400 600 800) | |
| Very high | (360 600 1000 1000) |
| SUMMARY | ||||||
|---|---|---|---|---|---|---|
| Groups | Count | Sum | Average | Variance | ||
| Expert 1 | 10 | 63 | 6.3 | 3.566667 | ||
| Expert 2 | 10 | 64 | 6.4 | 3.377778 | ||
| Expert 3 | 10 | 65 | 6.5 | 2.944444 | ||
| FUZZY “S” | 10 | 61 | 6.1 | 3.6 | ||
| ANOVA | ||||||
| Source of Variation | SS | df | MS | F | p-value | F crit |
| Between Groups | 0.875 | 3 | 0.291667 | 0.086491 | 0.966993 | 2.866266 |
| Within Groups | 121.4 | 36 | 3.372222 | |||
| Total | 122.275 | 39 |
| SUMMARY | ||||||
|---|---|---|---|---|---|---|
| Groups | Count | Sum | Average | Variance | ||
| Expert 1 | 10 | 35 | 3.5 | 4.944444 | ||
| Expert 2 | 10 | 35 | 3.5 | 4.944444 | ||
| Expert 3 | 10 | 36 | 3.6 | 5.6 | ||
| FUZZY “D” | 10 | 39.88 | 3.988 | 5.165262 | ||
| ANOVA | ||||||
| Source of Variation | SS | df | MS | F | p-value | F crit |
| Between Groups | 1.61708 | 3 | 0.539027 | 0.104391 | 0.956973 | 2.866266 |
| Within Groups | 185.8874 | 36 | 5.163538 | |||
| Total | 187.5044 | 39 |
| No | Equipment | Risk | Unmitigated Risk | Mitigation Action Proposed | Fuzzy | |||
|---|---|---|---|---|---|---|---|---|
| S | O | D | RPN | RPN | ||||
| 1 | P-001 F101 A/B | Loss of T-101 Bottom pump around line capacity | 8 | 9 | 4 | 288 | Installation of larger/capacity/filters | 464 |
| 2 | CLC001 CFC003 | Loss of Heavy Coker Gas Oil stripper bottom level control | 9 | 4 | 7 | 252 | More reliable measurement. | 464 |
| 3 | CLC020 CFC040 | Loss of Heavy Coker Gas Oil stripper bottom level control | 9 | 4 | 6 | 216 | More reliable measurement. Continuous monitoring the transmitter/controller with self-diagnostic status in control room. | 464 |
| 4 | P1 draw-off pan | Loss of Heavy Coker Gas Oil product draw-off pan level | 9 | 2 | 6 | 108 | Review inspection plan and repair/assembly instruction with hydrotest. | 464 |
| 5 | P2 draw-off pan | Loss of Heavy Coker Gas Oil product draw-off pan level | 9 | 2 | 6 | 108 | Review inspection plan, WPS and repair/assembly instruction with hydrotest. | 464 |
| 6 | E-002 A/B/C | Loss of Heavy Coker Gas Oil -Fresh feed exchanger capacity | 8 | 2 | 7 | 112 | Check and clean at turnaround the tube bundle. | 464 |
| 7 | T-102 Pipeline T101-T102 Pipeline T102-T101 | Loss of Heavy Coker Gas Oil product stripper integrity | 8 | 2 | 7 | 112 | Turnaround: Replace to new one. | 464 |
| 8 | CTC000 | Loss of Light Catalytic Gas Oil air cooler (EA100) temperature control | 5 | 4 | 6 | 120 | More reliable measurement. | 214 |
| 9 | CLC002 | Loss of D-006 sump level control | 5 | 3 | 7 | 105 | More reliable measurement. Continuous monitoring the transmitter/controller with self-diagnostic status in control room. | 214 |
| 10 | C-101 | Loss of Wet Gas compressor | 6 | 6 | 4 | 144 | C-101 alternative (electric) drive. | 214 |
| 11 | E-101 | High Fractionator overhead condensator outlet temperature | 5 | 5 | 6 | 150 | Define: external cleaning cycle and the corresponding regular cleaning. | 214 |
| 12 | P-015 F101 A/B | Loss of anti-sediment additive dosing. | 8 | 2 | 7 | 112 | Expert have to investigate need for application the anti-sediment agent. | 464 |
| 13 | P-104 | Loss of Heavy Coker Gas Oil product pump capacity | 8 | 2 | 6 | 96 | P-104 New type more reliable pump. | 464 |
| 14 | P-105 | Loss of Light Catalytic Gas Oil product pump capacity | 8 | 2 | 6 | 96 | P-105 New type more reliable pump | 464 |
| 15 | Pipeline T101-P106 Pipeline P106-E109 Pipeline E109-T101 | Loss of Heavy Coker Gas Oil pump around integrity | 9 | 1 | 8 | 72 | Review the extinguishing system. | 464 |
| No | Examples of Failure Mode | S | O | D | RPN | Fuzzy RPN | Priority |
|---|---|---|---|---|---|---|---|
| 1 | Break of feed pump P1 cause of the unit shutdown | 8 | 2 | 5 | 80 | 464 | 1 |
| 2 | Fouling and plug of heat exchanger cause the decreasing the temperature in the vessel (referent temp 100 °C) | 2 | 5 | 8 | 80 | 86.7 | 3 |
| 3 | Operation issue, gasoline in water causes environmental pollution, constantly product flow to the acid torch, not to the sulfur production plant. | 5 | 8 | 2 | 80 | 214 | 2 |
Publisher’s Note: MDPI stays neutral with regard to jurisdictional claims in published maps and institutional affiliations. |
© 2021 by the authors. Licensee MDPI, Basel, Switzerland. This article is an open access article distributed under the terms and conditions of the Creative Commons Attribution (CC BY) license (https://creativecommons.org/licenses/by/4.0/).
Share and Cite
Ivančan, J.; Lisjak, D. New FMEA Risks Ranking Approach Utilizing Four Fuzzy Logic Systems. Machines 2021, 9, 292. https://doi.org/10.3390/machines9110292
Ivančan J, Lisjak D. New FMEA Risks Ranking Approach Utilizing Four Fuzzy Logic Systems. Machines. 2021; 9(11):292. https://doi.org/10.3390/machines9110292
Chicago/Turabian StyleIvančan, Jelena, and Dragutin Lisjak. 2021. "New FMEA Risks Ranking Approach Utilizing Four Fuzzy Logic Systems" Machines 9, no. 11: 292. https://doi.org/10.3390/machines9110292
APA StyleIvančan, J., & Lisjak, D. (2021). New FMEA Risks Ranking Approach Utilizing Four Fuzzy Logic Systems. Machines, 9(11), 292. https://doi.org/10.3390/machines9110292