Abstract
Smartphones are attracting increasing interest due to how they are revolutionizing our lives. On the other hand, hardware and software failures that occur in them are continually present. This work aims to investigate these failures in a typical smartphone by collecting data from a class of people. Concerns have been raised that call into question the efficiency of applied methods for identifying and prioritizing the potential defects. The widely used hybridized engineering method, Fuzzy Failure Mode and Effect Analysis (F-FMEA), is an excellent approach to solving these problems. The F-FMEA method was applied to prioritize the potential failures based on their Severity (S), expected Occurrence (O), and the likelihood of Detectability (D). After collecting failure data from different users on a selected smartphone, two well-known defuzzification methods facing the Risk Priority Number (RPN) in F-FMEA were applied. Despite this interest, to the best of our knowledge, no one has studied smartphone failures with a technique that combines the results of different fuzzy applications. Thus, to combine the results of the derived fuzzy subsystems for the average value, we suggest a summative defuzzification method. Our findings indicate that F-FMEA with a summative defuzzification procedure is a clear improvement on the F-FMEA method. Even though the summation method modifies close results of the defuzzification one, it was shown that it provides more accurate results.
1. Introduction
Revolutionary technology is continuously changing humans and organizational behaviors. Currently, smartphones significantly impact social, business, education, and healthy life. The impacts can be perceived both positively and negatively [1]. Although technology offers several benefits, concerns have grown over the problematic nature of smartphones. Like any system, they are comprised of a combination of interacting elements that can be prone to failures. Thus, any of these elements can contribute to the likelihood of defects and error occurrence. Some of the defensive “layers” in such systems are automated and engineered, while others rely on humans [2].
One of the most critical arguments in market competition for production companies is quality management, monitoring, control, and assurance. The focus of innovative smartphone companies has been the quality of their products as a powerful management strategy. Due to the technological era we live in, quality cannot be related only to the production process, but to many processes and measures from creation to possession of the product. Consequently, the prevention of errors and defects in processes has an essential role in the quality of the final product. These companies aim to offer long-lasting and user-friendly devices to meet the customers′ expectations. Thus, implementing quality assessment methods is considered a strategic tool that leads to better products [3].
Researchers state that it is necessary to constantly undertake measures to prevent the causes of failures [4]. Moreover, it is believed that planning each action gives better results in terms of quality [5]. Hence, for the primary purpose of this study (identifying and evaluating the hardware and software failures in a smartphone), we have introduced first Failure Mode and Effect Analysis (FMEA) and Fuzzy-FMEA (F-FMEA) risk assessment methods.
FMEA has been an effective systematic tool for examining how a system, product, or process can fail. Generally, it is performed by specialists of respective fields during product development cycles [6]. It can be applied to new or existing systems, products, or processes for quality improvement. In addition, studies indicate that successful FMEA application can increase the ability of production companies to compete globally [7,8]. Sometimes this technique is seen as straightforward, and there are some weaknesses in getting appropriate measures against evaluations. Therefore, many authors have proposed another risk evaluation framework that relies on the fuzzy set and rule-based hypothesis [9,10,11]. In addition, they have pointed out that the F-FMEA approach is a great foundation for obtaining accurate results. Unlike the linguistic terms used in FMEA, in the fuzzy set theory, the vulnerability of hypothetical relations is changed into numerical systems.
Fuzzy logic has been reflected in several domains like automobile speed control [10], control of robotic manipulators [11], water filter automation [12], and operating systems of automatic trains [13]. Aamir et al. proposed a fuzzy rule-based model for the classification of diabetics, and their accurate results indicated that the logic could be further utilized in the healthcare sector [14]. Furthermore, a comprehensive review by Mittal et al. has highlighted the importance and potential of fuzzy logic in hardware implementations, medical diagnosis, big data, and robotics applications [15].
Pokorádi and other authors have focused on risk assessment methods and have contributed many investigations in the literature [16,17,18]. They have proposed several Summative Defuzzification (SMDF) methods such as centroid, bisector, and summarized weighted mean of maxima. Inspired by their works, this study aims to optimize the F-FMEA hybrid method by working with different phone users on the same model.
The fourth section of this work represents our case study—a typical smartphone. We have applied both the FMEA and F-FMEA to achieve comparative results and to answer the question that drove our research: “Which risk assessment method performs better?”.
2. Smartphones’ Failures—Related Work
The replacement of smartphones is associated with consumers’ satisfaction and depends on socio-economic factors and technical ones. Improvements in their durability (hardware and software parts) can reduce premature replacements. This can be achieved from the engineering viewpoint by improving reliability and repairability [19]. Related work has shown that both have been significant characteristics for consumers [20]. It means that reducing the likelihood of failures (reliability) and simplifying the device restoration in case of failures (repairability) can contribute to smartphones′ durability, bringing consumer satisfaction. Emphasizing the critical failures, improving their durability, and consumers’ decisions should not be seen separately but as interconnected options that reciprocally affect one another [21]. Critical analyses would help decision makers (regulators, designers, and consumers) to make savvy decisions.
Authors have found that consumers replace smartphones based on the functions that are becoming obsolete, driven by the new offered models in the market [22]. Nonetheless, others have proven that causes are mostly related to technical issues due to the lack of software support due to performance loss, failures, and operational matters [23]. Compared to other products of importance for consumers, the frequency of failures in smartphones has been higher [24]. The most problematic failures were battery and Operating System (OS). Additionally, it was pointed out that consumers experience more dissatisfaction with batteries and touchscreens failures. Other significant failures are associated with the physical damage of the devices and smartphone misuse by consumers [23]. Around one-third of them in the European Union (EU) experience physical damage to their smartphones. Statistics indicate that failures in newer and older smartphone models are associated with displays and their components [25] and the device shell in the latest models [26]. Battery and charging ports are considered problematic failure modes, especially after two or three years of device use [22].
To identify and prioritize the potential failures, FMEA has been applied by several authors. Marques analyzed the failure modes by emphasizing the hardware part [27]. Results pointed out that the device shell was the most critical failure. Other investigations consisted of performing tests in different conditions for the physical resistance of the device [28]. The results showed that the device shell and screen were more prone to failures. According to FMEA by Tay et al., the effects of component changes, metallic coating, materials parameters, and interconnections affect the performance of Radio Frequency (RF) distribution [29]. They concluded that it is essential to know the device′s reliability to obtain proper behavior of the device′s performance. FMEA by Cinque et al. showed that the most frequent failures were related to software parts such as freeze, self-shutdown, unstable device behavior, output failure, and input failure [30].
Vijayalakshmi’s analysis was conducted in two directions: one due to an accident and the other due to hardware or software malfunction [31]. According to his findings, top priority should be given to the device’s shell (in the hardware part), while in the software part, the most critical failure was the device self-shutdown as it can cause data loss. Consequently, software failures can lead to loss of security or make the installed applications unresponsive. Another study considered the application of FMEA in mobile devices where battery and freeze were regarded with high priority [32]. In addition, it was proposed that extensions of the FMEA method that take into account weighting factors can be further explored for more accurate results.
3. Failure Mode Effect Analysis (FMEA) and Beyond
This section begins by introducing the features and benefits of the classical FMEA. Then, it provides explanations for the F-FMEA and F-FMEA using the summative defuzzification method.
3.1. The Classical FMEA
FMEA is used to identify and analyze all failure modes of various parts of the system, the effects of these failure modes, and how to avert or decrease the impact of the failure system. FMEA is a step-by-step tactic and tends to identify all possible failures throughout the processes and study the consequences of these failures [33]. FMEA continuously develops products and processes consistent with consumers’ satisfaction [3].
FMEA was developed and implemented for the first time in 1949 by the United States (US) Army and later executed in the Apollo space program to temperate the risk [5]. Its object is to find links between causes and effects/defects, searching and solving and drawing the decisions based on the requirement of applicable action. As a powerful method for engineering design, production process, and product planning, companies should engage it. The FMEA method is used at [34]:
- The formation of the product concept to check if the customer prospects are taken into consideration.
- The product-defining to check if projects, services, and supplies are appropriate and controlled at the right time.
- The production process to check if documentation primed by engineers is thoroughly carried out.
- The assembly to check whether the process is compatible with documentation.
- The service organization to check whether the product or service satisfies recognized criteria.
The indicator used for determining the proper corrective action on the failure modes is the Risk Priority Number (RPN).
After calculation of the RPN by engineering teams, it is easy to identify the most significant problem areas. Then, the focus shifts to the solution of failure modes [35].
FMEA is beneficial for all stages of the systems’ lifecycle, from requirements to design, implementation, operation, and maintenance [36]. The primary benefit from FMEA can be achieved at the early design phases because the weakest point in the system’s structure can be revealed and addressed before doing expensive design changes in later stages. As shown in Figure 1 [31], the process of FMEA starts from identifying the scope of the system and its functions. Later, the effects and the causes of potential failures are determined. Risk analysis is done after detecting these possible causes and impacts. The final phase consists of documenting the process and reducing the risks.
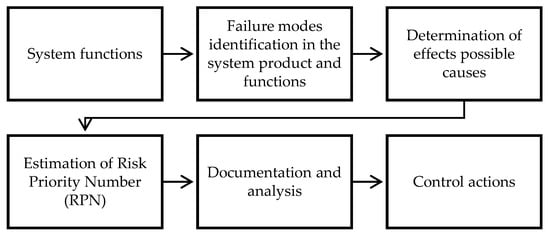
Figure 1.
Phases of FMEA [31].
Thus, the classical FMEA considers the failure modes according to their Severity (S), Occurrence (O), and Detectability (D) with rating scales. Then, the failure modes are rated based on their RPN, which uses the following formula:
while the Relative RPN () is determined as
The following section gives more details.
3.2. Fuzzy Approach
In classical logic, linguistically, “true” and “false” or mathematically “1” and “0” are expressed, whereas in fuzzy logic, propositions and statements are allowed somewhere in between. In engineering problems, remarks are frequently assessed as partially reliable or reliable with a reasonable degree of certainty. Therefore, the fuzzy logic approach is needed because of the situations where classical logic is not satisfactory for the engineering problems.
The conventional Mamdani type fuzzy decision-making process is divided into four sub-processes: fuzzification, inference (firing strength and implication), composition, and defuzzification [16]. Occasionally, the composition and defuzzification subprocesses can be combined under appropriate circumstances (Figure 2).
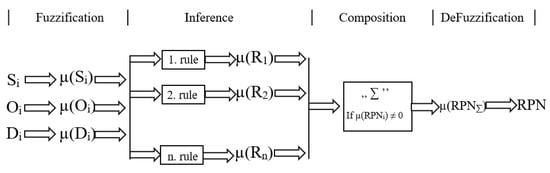
Figure 2.
Flow chart of the fuzzy logic process for FMEA.
The fuzzification subprocess estimates the input information from the system, which is linguistic qualifiers, and converts it into numerical values [37]. The value of input variables is determined corresponding to the interval [0, 1] of the membership function for crisp value [38]. This study uses trapezoidal membership functions as represented below (3):
where four parameters, a, b, c, and d, define the membership function .
The most popular approach to human thinking uses natural language statements such as the IF premise (antecedent) and THEN conclusion (consequent). For example, the rule premises (Equation (3)) can be determined from all the possible combinations from the trapezoidal shape input membership functions specified in Figure 3 and Equation (4):
where is premise set of input , is the number of input premise, and is the fuzzy conclusion sets of the rules.
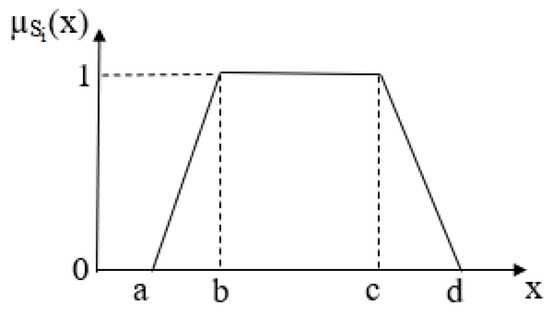
Figure 3.
Fuzzification for trapezoidal membership function.
In the inference subprocess, rules are constructed to determine the output value after the input and output values have been defined. The rules are developed through the firing strength and implication calculation process. The firing strength calculation uses a conjunction (Equation (5)) or disjunction (Equation (6)) operator to combine the membership values of the different input parameters:
where is the fuzzified value of the premise of input .
After determining the firing strength, the result in each rule line should be projected via implication calculation (Equation (7)):
where represents the firing strength of rule , and is the conclusion set that is part of rule .
In the composition subprocess, the aggregation process calculation is done by combining the obtained values from the implication of each rule and determining the system’s output (Equation (8)).
where is the sub-conclusion of rule .
The defuzzification subprocess is the final one, used to generate a crisp value that best characterizes the fuzzy set output obtained from the composition process.
The meaning of a fuzzy set can be different according to the application, and hence, it can be chosen from different defuzzification methods to obtain the precise result [39]. There are numerous types of advanced defuzzification methods; centroid, bisector, mean of maxima, smallest of maxima, and largest of maxima are well-known. The centroid and bisector defuzzification techniques are discussed in terms of their applicability for this investigation.
The centroid method is also known as the Center of Gravity (CoG) method, and it can be determined as follows:
where is the truth value of the ith sub-conclusion, and n denotes the number of sub-conclusions.
The bisector method is also known as the Center of Area (CoA) method, and it can be determined as follows:
where is the height of the conjunct set of sub-conclusions at its maximum.
The selected operators in the inference and composition process and the methods for the defuzzification process are critical in terms of their fit for the purpose of the task. Therefore, the most frequently used Center of Gravity (COG) and Center of Area (COG) defuzzification methods are represented (Figure 4). Thus, these methods are implemented in the next step of the proposed summative defuzzification approach.
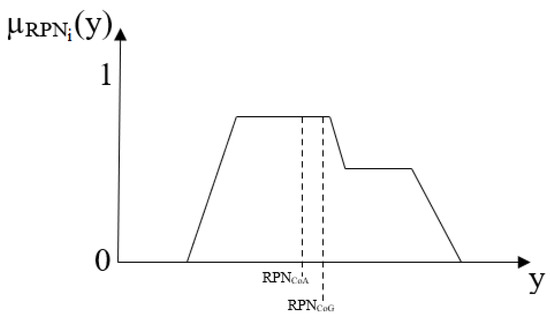
Figure 4.
Defuzzification methods.
3.3. Fuzzy FMEA with Summative Defuzzification Method
It is critical to consider numerous perspectives of the risk assessment method to offer a more reliable analysis. However, when experience-based outcomes give contradicting statements, an average calculation can provide an optimized solution by combining the different defuzzified crisp values [17].
Figure 5 shows the Summative Defuzzification Fuzzy (SDF) inference process, where the typical process model is modified based on two aggregations. The CoA and CoG defuzzification methods are considered during the SDF process.
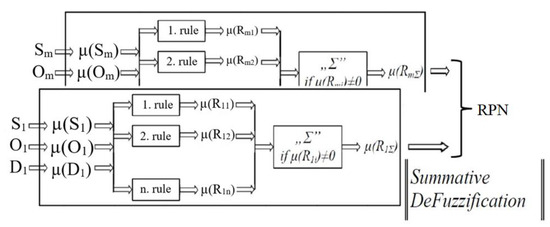
Figure 5.
Flow chart of summative defuzzification process.
The aggregated fuzzy sets reflecting the expert evaluations should first be determined using the CoA method by examining only the overlapping areas. Then, the produced fuzzy sets should be combined using the COG method, which measures overlapped areas of sub-conclusions multiple times (Figure 6) [18].
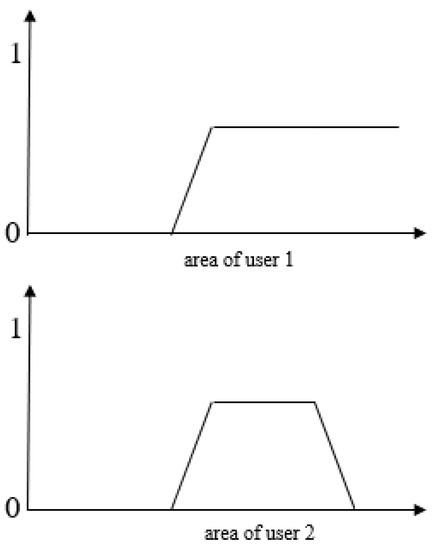
Figure 6.
Areas of the users of the failure ‘P4′ in the smartphone cases.
The summative combination CoA and CoG (SCoAG) defuzzification method can be calculated as follows:
where m is the number of assertions that contradict one another (input data).
4. The Smartphones’ Case
This section elaborates on the application of FMEA in iPhone 11 smartphones. At first, the Delphi technique was used according to a basic design [40]. Two expert panels were assembled without concern for geography. We ensured participants′ anonymity, which is critical before executing the chosen technique [41]. Each team consisted of five people who were users of iPhone 11 for 10–12 months. The members of each group had expertise in the business and IT fields. After each round of questions regarding issues experienced with their smartphones, participants received feedback for the most frequent failures in the smartphones. They could reach an agreement regarding the potential failure modes, but each group had different opinions regarding their risk prioritization numbers.
As a result, we collected two data sets for the same smartphone model. The identified failures and respective analyses are elaborated in the following subsections.
4.1. FMEA in Smartphones
After applying the Delphi technique, both teams identified the 12 most frequent failures. The nine most frequent failure modes were related to hardware and three to software. The FMEA method was conducted based on the following steps.
- Identification of potential failures and effect.The most problematic elements found out in the considered smartphones were:
- Hardware failure modes: touchscreen, battery, device shell, front camera, rear camera, microphones, power buttons, volume control buttons, charger port.
- Software failure modes: freeze, self-shutdown, output failure.
- 2.
- Determining Severity (S)
Severity (S) assesses the seriousness of the effect of a failure on the system [36]. Severity rates on a scale of 1 to 10, where 1 is the lowest and 10 is the highest.
- 3.
- Estimating Occurrence (O)
Occurrence (O) is a rating associated with the presence of the failure mode likelihood and its cause. In other words, it is related to the cumulative number of failures that could occur over the design life of a system or component [36].
- 4.
- Failure Detection
Detectability (D) is a ranking number detecting a potential failure mode or occurrence [36]. Detectability is associated with failure control.
- 5.
- Calculating Risk Priority Number (RPN).The Risk Priority Number (RPN) is calculated based on the explained criteria (Equation (1)). To summarize, it takes into account:
- The severity of the effect on the user and smartphone itself.
- How frequently the problem is likely to occur.
- How easily the problem can be detected.
4.2. FMEA Results
Firstly, the FMEA was filled by taking the abovementioned steps into account. Then, the potential causes of occurrence for each failure mode and effects are specified based on the component alone and the whole system of the smartphone. Finally, recommended actions are given to eliminate/reduce the potential causes of failures. The application of FMEA on hardware and software components on mobile devices is presented in the following table (Table 1):

Table 1.
Application of FMEA in smartphones.
Following FMEA steps, severity, occurrence, and detectability values have been determined, and based on Equation (1), the RPN is then calculated. Table 2 indicates the findings from the first team.
Table 2.
Collection of S, O, D, and RPN values from the 1st team.
Table 3 represents the findings from the second team.
Table 3.
Collection of S, O, D, and RPN values from the 2nd team.
4.3. Fuzzy Rule-Based FMEA in Smartphones
To include fuzzy logic in an FMEA, analysts must first define the input (S, O, D) and output (RPN) membership functions and create the fuzzy rule base. The parameters for the membership functions are specified in Table 4 and illustrated in Figure 7, Figure 8, Figure 9 and Figure 10. The interval [0, 10] is selected because it approximates natural human thought—thus, the analysts chose this range for the fuzzy method.
Table 4.
Membership functions of F-FMEA.
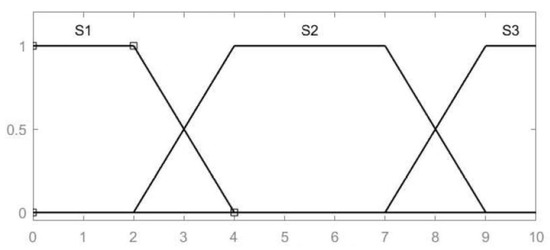
Figure 7.
Membership function of severity.

Figure 8.
Membership function of occurrence.
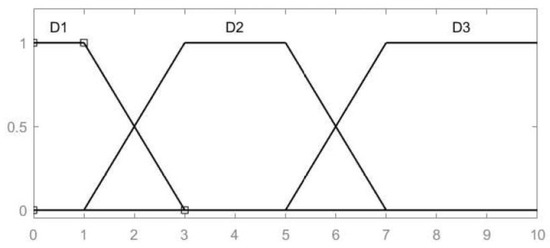
Figure 9.
Membership function of detection.
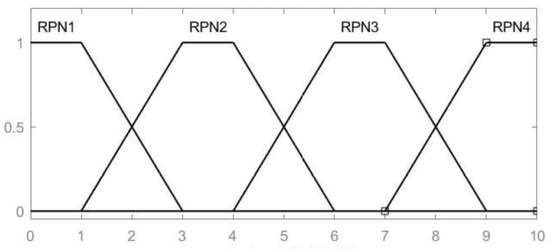
Figure 10.
Membership function of risk priority number.
Table 5 describes the logical rule basis of F-FMEA, which outlines the analysts′ experience using the IF-THEN structure. For example, if the failure function of the front camera (P4) of user 1 is evaluated, the operators (Equation (3) to (6)) described in the fuzzy approach are applied, respectively.
Table 5.
Rule base for the composition process.
The can be obtained using the maximum operator (Equation (6)), following:
The final subprocess is defuzzification. Results are obtained using the CoA method (Equation (8)) and CoG method (Equation (7)), following:
4.4. Comparative Results
Since this study was conducted with two different groups of users, it considered two different results: the average FMEA and summative defuzzification. Possible failures of a smartphone model iPhone 11 were independently evaluated from different users′ perspectives (Table 6).
Table 6.
Input data of two different cases in smartphones.
Table 7 represents the comparative results obtained from the traditional RPN, F-RPN, and summative defuzzification methods. The results from the classical FMEA are shown as the RPN for the average of the user data of the evaluations. The F-FMEA results are given in the CoA and CoG columns. Moreover, the column SCoAG displays the F-RPN of the F-FMEA that is optimized with the summative defuzzification approach.
Table 7.
Comparative findings.
From the obtained results, the following conclusions can be drawn:
- Failure P10 (freeze) has the highest number in the case of RPN and relative RPN.
- Failure P8 (volume control buttons) has the smallest following P7 (charger port) in the case of RPN and relative RPN.
- Failures P1 (touchscreen), P2 (battery), P3 (device shell), P9 (charger port), and P10 (freeze) have higher values in the case of RPN and relative RPN than F-RPN and relative F-RPN—vice versa in other failure cases.
- Failure P3 gives a close relative RPN result in all cases.
- All the defuzzification methods give close relative F-RPN results.
- It can be observed that P1, P2, P6 (microphones), P7, P9, P10, P11 (self-shutdown), and P12 (output failure) in both CoA and SCoAG gives the same outcome. This situation occurs because this failure is assessed equally by the two different users.
The summation method modifies close results of defuzzification methods. However, according to our analysis, the F-FMEA with summative defuzzification provides more significant results (Figure 11).
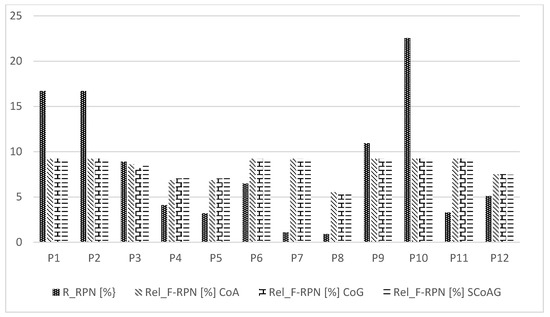
Figure 11.
Effect of the methods.
5. Conclusions
In this work, we examined the hardware and software failures of a randomly chosen smartphone only for the purpose of our risk assessment analyses. At first, we introduced in detail the use of FMEA and F-FMEA. Two data sets were collected for the same smartphone model. The nine most problematic elements found in the considered smartphone were related to the hardware (touchscreen, battery, device shell, front camera, rear camera, microphones, power buttons, volume control buttons, charger port) and three failure modes in the software part (freeze, self-shutdown, output failure). The FMEA results indicated that touchscreen, followed by freeze and battery failure, had the highest RPN values for the first group of users. The second group, RPN results, showed that battery, microphone, and touchscreen have a higher risk.
Consistently with our aims, and for more accurate results, we applied the F-FMEA summative defuzzification method. The results highlighted that the freeze failure has the highest risk in the case of RPN and relative RPN. Volume control buttons failure has the lowest risk, followed by power buttons in the case of RPN and relative RPN. Touchscreen, battery, device shell, charger port, and freeze failures have a higher risk in the case of RPN and relative RPN than F-RPN, contrary to other failure modes. Device shell failure, in all cases, showed a close relative RPN result.
The obtained results conclude that the defuzzification methods give close relative F-RPN values but are more significant and accurate in detail. Our work has some limitations. Given that only two small datasets were considered, caution must be taken on the identification of potential failure modes. Nonetheless, the obtained findings support our approach of applying the summative defuzzification method for more significant results. Future work will investigate and analyze the failures of different types of smartphones more in depth. We hope that further tests and comparative analysis of different fuzzy applications will confirm our approach.
Author Contributions
Conceptualization, E.K. and S.K; methodology, E.K. and S.K.; software, S.K.; formal analysis, E.K. and S.K.; investigation, E.K. and S.K.; resources, E.K.; writing—original draft preparation, E.K. and S.K.; writing—review and editing, E.K., S.K., K.T.-G. and A.K.; supervision, K.T.-G. and A.K. All authors have read and agreed to the published version of the manuscript.
Funding
This research received no external funding.
Institutional Review Board Statement
Not applicable.
Informed Consent Statement
Informed consent was obtained from all subjects involved in the study.
Data Availability Statement
All data generated or analyzed during this study are included in this study.
Acknowledgments
All authors of this study would like to express their thanks to Óbuda University, Budapest, (Hungary) which supported the publication of this article.
Conflicts of Interest
The authors declare no conflict of interest.
References
- Sarwar, M.; Soomro, T. Impact of Smartphone’s on Society. Eur. J. Sci. Res. 2013, 98, 216–226. [Google Scholar]
- Kadena, E. Human error and latent conditions in mobile devices. Reducing risks through FMEA. In Proceedings of the III. International Rating Academy Congress on Applied Sciences, Lviv, Ukraine, 6–7 September 2018; pp. 8–13. [Google Scholar]
- Johnson, K.G.; Khan, M.K. A study into the use of the process failure mode and effects analysis (PFMEA) in the automotive industry in the UK. J. Mater. Process. Technol. 2003, 139, 348–356. [Google Scholar] [CrossRef]
- Dudek-Burlikowska, M.; Szewieczek, D. Quality estimation of sale process with usage of quality methods in chosen company. J. Achiev. Mater. Manuf. Eng. 2007, 20, 531–534. [Google Scholar]
- Dudek-Burlikowska, M. The concept of Total Quality Management and the contemporary entrepreneurship in practice. J. Achiev. Mater. Manuf. Eng. 2015, 37, 236. [Google Scholar]
- Carlson, C.S. Understanding and Applying the Fundamentals of FMEAs. In Proceedings of the 2014 Annual Reliability and Maintainability Symposium (RAMS), Colorado Springs, CO, USA, 27–30 January 2014; p. 12. [Google Scholar]
- Kamble, S.M.; Quazi, T. Shell moulding process using the combination of failure mode effect analysis and ahp approach. Glob. J. Eng. Scs. and Res. Man. 2014, 1, 1–10. [Google Scholar]
- Doshi, J.; Desai, D. Application of failure mode & effect analysis (FMEA) for continuous quality improvement—Multiple case studies in automobile SMEs. Int. J. Qual. Res. 2017, 11, 345–360. [Google Scholar] [CrossRef]
- Keskin, G.A.; Özkan, C. An alternative evaluation of FMEA: Fuzzy ART algorithm. Qual. Reliab. Eng. Int. 2009, 25, 647–661. [Google Scholar] [CrossRef]
- Murakami, S.; Maeda, M. Automobile speed control system using a fuzzy logic controller. In Industrial Applications of Fuzzy Control; Sugeno, M., Ed.; Elsevier Science B.V.: Amsterdam, The Netherlands, 1985. [Google Scholar]
- De Silva, C.W. Applications of fuzzy logic in the control of robotic manipulators. Fuzzy Sets Syst. 1995, 70, 223–234. [Google Scholar] [CrossRef]
- Erfianto, B.; Putrada, A.G. Water Filter Automation System Using Fuzzy Logic Controller. In Proceedings of the 2019 7th International Conference on Information and Communication Technology (ICoICT); 2019; pp. 1–6. [Google Scholar]
- Yasunobu, S.; Miyamoto, S. Automatic train operation system predictive fuzzy control. In Industrial Applications of Fuzzy Control; Sugeno, M., Ed.; North-Holland Publishing: North Holland, The Netherlands, 1985. [Google Scholar]
- Aamir, K.M.; Sarfraz, L.; Ramzan, M.; Bilal, M.; Shafi, J.; Attique, M. A Fuzzy Rule-Based System for Classification of Diabetes. Sensors 2021, 21, 8095. [Google Scholar] [CrossRef] [PubMed]
- Mittal, K.; Jain, A.; Vaisla, K.S.; Castillo, O.; Kacprzyk, J. A comprehensive review on type 2 fuzzy logic applications: Past, present and future. Eng. Appl. Artif. Intell. 2020, 95, 103916. [Google Scholar] [CrossRef]
- Portik, T.; Pokorádi, L. The summarized weighted mean of maxima Defuzzification and its application at the end of the risk assessment process. Acta Polytech. Hung. 2014, 11, 167–180. [Google Scholar] [CrossRef]
- Pokorádi, L.; Szamosi, B. Fuzzy failure modes and effects analysis with summarized center of gravity defuzzification. In Proceedings of the 2015 16th IEEE International Symposium on Computational Intelligence and Informatics (CINTI), Budapest, Hungary, 19–21 November 2015; pp. 147–150. [Google Scholar] [CrossRef]
- Pokorádi, L.; Tóth-laufer, E.; Koçak, S. Fuzzy Failure Modes and Effects Analysis Using Summative Defuzzification Methods. Acta Polytech. Hung. 2020, 18, 111–126. [Google Scholar] [CrossRef]
- Sanfelix, J.; Cordella, M.; Alfieri, F.; European Commission Joint Research Centre. Guidance for the Assessment of Material Efficiency: Application to Smartphones; Publications Office: Luxembourg, 2020. [Google Scholar]
- Duke, C.; Thorun, C.; Dekeulenaer, F.; Svatikova, K.; Smit, T.; Lucica, E.; Kettner, S.; Landzaat, W.; Suter, J.; Rodriguez Diaz, A.; et al. Behavioural Study on Consumers’ Engagement in the Circular Economy: Final Report; CEU: Budapest, Hungary, 2018. [Google Scholar]
- Sanfelix, J.; Cordella, M.; Alfieri, F.; European Commission Joint Research Centre. Analysis and Development of a Scoring System for Repair and Upgrade of Products: Final Report; Publications Office: Luxembourg, 2019. [Google Scholar]
- Prakash, S.; Dehoust, G.; Gsell, M.; Schleicher, T.; Stamminger, R. Influence of the Service Life of Products in Terms of Their Environmental Impact: Establishing an Information Base and Developing Strategies Against “Obsolescence”. 2020. Available online: https://www.umweltbundesamt.de/publikationen/influence-of-the-service-life-of-products-in-terms (accessed on 29 December 2021).
- Watson, D.; Gylling, A.C.; Tojo, N.; Throne-Holst, H.; Bauer, B.; Milios, L. Circular Business Models in the Mobile Phone Industry; Nordic Council of Ministers: Copenhagen, Denmark, 2017; Volume 2017560. [Google Scholar]
- OCU. Los Móviles Acumulan el 51% de las Quejas de Obsolescencia Prematura. 2018. Available online: https://www.ocu.org/consumo-familia/derechos-consumidor/noticias/obsolescencia-prematura (accessed on 29 December 2021).
- Phonerepaircompare. Smartphone Repair—Affordable Repair of iPhone/Smartphone. 2020. Available online: https://www.phonerepaircompare.co.uk/ (accessed on 29 December 2021).
- Stevens, A.; Frick, J.-C. Smartphone Studie. 2020. Available online: https://www.comparis.ch/downloadcenter/smartphone-report-2020 (accessed on 29 December 2021).
- Marques, L.M.C. FMEA—Mobile Phone; University of Ljubljana, Faculty of Computer and Information Science: Slovenia, Ljubljana, 26 May 2010; pp. 1–14. Available online: http://lrss.fri.uni-lj.si/sl/teaching/zzrs/lectures/2010_Marques.pdf (accessed on 29 December 2021).
- Liu, W.; Li, H. Impact Analysis of a cellular phone. In Proceedings of the 4th ANSA and µETA International Conference, Thessaloniki, Greece, 1–3 June 2011. [Google Scholar]
- Tay, R.S.; Chavannes, N.; Futter, P. Failure Modes and Effects Analysis (FMEA) on the RF Performance of Mobile Device Terminals. In Proceedings of the European Conference on Antennas and Propagation: EuCAP 2006, Nice, France, 31 October 2006. [Google Scholar]
- Cinque, M.; Cotroneo, D.; Kalbarczyk, Z.; Iyer, R.K. How Do Mobile Phones Fail? A Failure Data Analysis of Symbian OS Smart Phones. In Proceedings of the 37th Annual IEEE/IFIP International Conference on Dependable Systems and Networks (DSN’07), Edinburgh, Scotland, 25–28 June 2007; pp. 585–594. [Google Scholar]
- Vijayalakshmi, K. Analysis of Android OS Smart Phones Using Failure Mode and Effect Analysis. Int. J. Latest Trends Eng. Technol. 2014, 4, 11–18. [Google Scholar]
- Kadena, E. Assesing risks in mobile devices by using fmea. In Rajnai Zoltán Kiberbiztonság—Cybersecurity 2; Biztonságtudományi Doktori Iskola: Budapest, Hungary, 2019; pp. 184–194. ISBN 978-963-449-185-9. [Google Scholar]
- Mhetre, R.S.; Dhake, R.J. Using Failure Mode Effect Analysis in a Precision Sheet Metal Parts Manufacturing Company. Int. J. Appl. Sci. Eng. Res. 2012, 1, 302–311. [Google Scholar] [CrossRef][Green Version]
- Bartosz, P.; Dudek-Burlikowska, M.; Roszak, M. The application of the FMEA method in the selected production process of a company. Prod. Eng. Arch. 2018, 18, 35–41. [Google Scholar] [CrossRef]
- Mikulak, R.J.; McDermott, R.; Beauregard, M. The Basics of FMEA, 2nd ed.; CRC Press: Boca Raton, FL, USA, 2011; ISBN 9781563273773. [Google Scholar]
- Stamatis, D.H. Failure Mode and Effect Analysis: FMEA From Theory to Execution, 2nd ed.; ASQ Quality Press: Milwaukee, WI, USA, 2003; ISBN 9780873895989. [Google Scholar]
- Demetgul, M. Washing Machine Using Fuzzy Logic. Autom. Control Intell. Syst. 2014, 2, 27. [Google Scholar] [CrossRef]
- Shamshiden, N.; Koçak, S. Anti-lock Braking System Control Based on Fuzzy Logic Fuzzy logika alapú blokkolásgátló fékrendszer vezérlése. Bánki Közlemények 2021, 4, 1–6. [Google Scholar]
- Varga, T.; Pokorádi, L. Possibilities of Use of Fuzzy Logic in the Quality Planning in the Automotive Industry. In Proceedings of the Mini Conference on Vehicle System Dynamics, Identification and Anomalies, Budapest, Hungary, 8–10 November 2010; pp. 311–318. [Google Scholar]
- Aichholzer, G. The Delphi Method: Eliciting Experts’ Knowledge in Technology Foresight. In Interviewing Experts; Bogner, A., Littig, B., Menz, W., Eds.; Research Methods Series; Palgrave Macmillan: London, UK, 2009; pp. 252–274. [Google Scholar]
- Yousuf, M.I. Using Experts’ Opinions Through Delphi Technique. Pract. Assess. Res. Eval. 2019, 12, 1–8. [Google Scholar] [CrossRef]
Publisher’s Note: MDPI stays neutral with regard to jurisdictional claims in published maps and institutional affiliations. |
© 2022 by the authors. Licensee MDPI, Basel, Switzerland. This article is an open access article distributed under the terms and conditions of the Creative Commons Attribution (CC BY) license (https://creativecommons.org/licenses/by/4.0/).