Article

Evolution of Molecular and Optical Characterization of Dissolved Organic Matter (DOM) in Deep Groundwater After Ecological Water Supplementation: Implications for Fluoride Migration

1
College of Resource Environment and Tourism, Capital Normal University, Beijing 100048, China
2
Hebei Cangzhou Groundwater and Land Subsidence National Observation and Research Station, Cangzhou 061000, China
3
College of Chemical Safety, University of Emergency Management, Langfang 065201, China
4
Key Laboratory of Land Subsidence Mechanism and Mitigation, Ministry of Education, Capital Normal University, Beijing 100048, China
5
Beijing Laboratory of Water Resources Security, Capital Normal University, Beijing 100048, China
*
Authors to whom correspondence should be addressed.
Minerals 2026, 16(6), 596; https://doi.org/10.3390/min16060596
Submission received: 10 April 2026 / Revised: 26 May 2026 / Accepted: 29 May 2026 / Published: 3 June 2026

Abstract

Ecological Water Supplementation (EWS) promotes the reduction in both fluoride (F) and dissolved organic matter (DOM) concentration in deep groundwater. However, investigations on the optical properties and molecular signatures of DOM associated with F concentration variation have rarely been carried out. In our study, deep groundwater samples before and after EWS were collected form Nanpi County, North China, to evaluate the implications for F migration. The results showed that the decrease in F concentration was closely related to the variation in molecular and optical signatures of deep groundwater DOM during the EWS process. Priority degradation of unsaturated and biodegradable compounds with higher H/C ratio resulted in aromatic DOM with higher HIX and SUVA254 value enrichment in deep groundwater after EWS. Weaker competitive effects, calcite and dolomite precipitate, and enhancing F-bearing minerals dissolution under decreasing microbial metabolic activity contributed to F depletion in deep groundwater. The findings establish an association between the variation in DOM molecular and optical signatures and F concentration, and provide a new mechanism for investigating DOM cycling under the influence of F in deep groundwater.

1. Introduction

Dissolved organic matter (DOM) comprises a heterogeneous mixture of organic compounds including carbohydrates, aromatic substances, amino acids, aliphatic compounds, and structurally diverse organic molecules in aquatic systems [1,2,3,4,5,6]. Aquatic DOM is generally derived from both natural processes and anthropogenic activities, encompassing autochthonous production and external inputs [1,7]. As a nutrient and energy source for microbial activities, biodegradable DOM undergoes initial degradation by microorganisms in aquatic systems, thereby substantially influencing inorganic carbon (bicarbonate and carbonate) and organic carbon concentrations, consequently decreasing organic carbon concentration and promoting inorganic carbon enrichment in groundwater [8,9]. Terrestrial sources, including humic substances and nutrients from soils, sediments, algae, and vegetation, constitute the predominant external inputs of DOM [9,10,11]. Anthropogenic activities such as agricultural practices, industrial operations, and wastewater discharge further elevate DOM concentrations and modify its compositional profiles [12,13]. Owing to abundant functional groups, DOM is regarded as a crucial adsorption carrier for various pollutants, such as heavy metals, organic pollutants, and colloids, thereby altering their environmental behavior [6,10,14,15,16,17]. Moreover, DOM can complex with these pollutants, compete for adsorption sites on mineral surfaces, and act as an electron shuttle to promote their solubility [6,15,16]. Therefore, characterizing variations in DOM properties enhances our comprehension of pollutant reactivity and environmental fate within aquatic systems.
Recent advances have demonstrated the efficacy of combining three-dimensional excitation–emission matrix (EEM) fluorescence spectroscopy with parallel factor analysis (PARAFAC) for identifying DOM sources and components [2,8,18]. Correspondingly, the Fourier transform ion cyclotron resonance mass spectrometry (FT-ICR MS) technique was further employed to conduct a quantitative characterization of molecular compositions and to elucidate molecular transformations of DOM in aquatic environments [19,20,21,22,23]. Therefore, these techniques can assist us in systematically comprehending the evolution of the molecular and optical characterization of DOM to improve the monitoring and protection capabilities for alterations in the aquatic environment.
High fluoride (F) groundwater (>1.00 mg/L) is widely distributed across multiple regions in China, including the Yuncheng Basin [24], Yellow River basin [15], North China plain [25], middle Loess Plateau [26], Hetao Plain [27], Yuncheng Basin [28], Huaibei mining area [29], Tarim Basin [30], Tumochuan Plain [31], and Yanchi endorheic region [32], threatening the health and drinking water safety of over 41 million people [25]. Consuming groundwater with fluoride concentrations exceeding 1.50 mg/L may result in dental fluorosis and skeletal fluorosis. Consequently, the World Health Organization (WHO) and China set the permissible fluoride concentration in drinking groundwater at 1.50 mg/L and 1.00 mg/L, respectively. Geogenic F sources in groundwater are associated with the dissolution of fluoride-bearing minerals, ion exchange processes, evaporation, and competitive adsorption [32,33,34,35]. Furthermore, anthropogenic contributors to elevated fluoride levels include coal combustion, industrial activities, and fertilizer application [29,36,37].
In the North China Plain, Ecological Water Supplementation (EWS) had been carried out in 2017 to mitigate land subsidence, resulting in deep groundwater level recovery at a mean rate of 0.52 m/a [38,39,40]. Groundwater level rise through EWS enhances direct evaporation and water–rock interactions, thereby accelerating F and DOM evolution [25,40,41]. On one hand, an increase in groundwater levels enhances fluorite dissolution, thereby raising fluoride concentrations in groundwater [25]. Nevertheless, the fluoride ion (F) concentration was lower compared to that in the pore water released during sediment compaction, leading to a decrease after EWS [25,40]. Moreover, the dilution effect and stronger cation exchange also contribute to the decrease in F concentration [40]. On the other hand, there is a close association between DOM characterization and anthropogenic activities, which results in a variation in the molecular and optical characterization of DOM after EWS compared with that before EWS [1,7]. Therefore, the interrelationship between DOM and F warrants high attention. Positive correlations between DOM and heavy metal concentrations in groundwater have been extensively documented, primarily attributed to competitive effects on sedimentary adsorption sites [14,40,42,43,44,45,46]. Notably, similar to negatively charged heavy metals, F has been observed to compete with DOM for adsorption sites [47,48]. Concurrently, microbial activities facilitated by DOM may promote F enrichment in groundwater [49]. Thus, DOM presence significantly influences F release and transport in groundwater. However, the mechanisms governing fluoride fate in relation to DOM characteristics in deep groundwater remain poorly understood.
Therefore, the aims of this study are as follows: (1) to evaluate variations in optical and molecular signatures of deep groundwater DOM before and after EWS, and (2) to elucidate the mechanisms of fluoride migration associated with these DOM alterations.

2. Materials and Methods

2.1. Study Area

Nanpi County with a total area of 800 km2 is situated in the southeast region of Cangzhou City, Hebei Province, China, and is positioned geographically between 116°32′–117°02′ E longitude and 37°50′–38°11′ N latitude. Climatically, the region experiences a warm temperate subhumid continental monsoon climate, exhibiting a mean annual precipitation of approximately 550 mm, potential evaporation of 1918.90 mm, and mean annual air temperature of 12.30 °C.
Quaternary sediments in this region reach thicknesses of 400–500 m, and comprise four distinct aquifer systems (designated I through IV) from top to bottom [25,50]. The shallow aquifer complex comprises Aquifers I and II: the former (20–30 m depth) consists of fine sands, whereas the latter (120–170 m depth) comprises medium sands accompanied with powdered clay. The deep confined aquifer system encompasses Aquifers III (250–380 m) and IV (380–500 m), characterized by powdered clay with sand and gravel. Regional groundwater flows naturally from the southwest to the northeast, with hydraulic gradients ranging from 0.8 to 1 m/a. Precipitation, irrigation, and surface water are the primary recharging water sources for Aquifers I and II, while the deep groundwater is recharged by compaction-released pore water from the clayey sediments. Aquifers III and IV serve as critical water sources for agricultural irrigation and potable water supply. Land use is predominantly agricultural, involving wheat, maize, and vegetable cultivation, with limited industrial activities.
Long-term groundwater overexploitation has induced groundwater system depression and severe land subsidence, evidenced by a 100 m head decline from 1960 to 2005 [50,51]. To address land subsidence, the local government has implemented the EWS Project since 2017, with cumulative water supply reaching 49.4 billion m3 [25]. Consequently, groundwater levels recovered rapidly, yielding a head rise of approximately 13.5 m in the Cangzhou zone by 2022 [50] Additional geographic information is available in Sun [25] and Liu [52].

2.2. Groundwater Sampling and Analyses

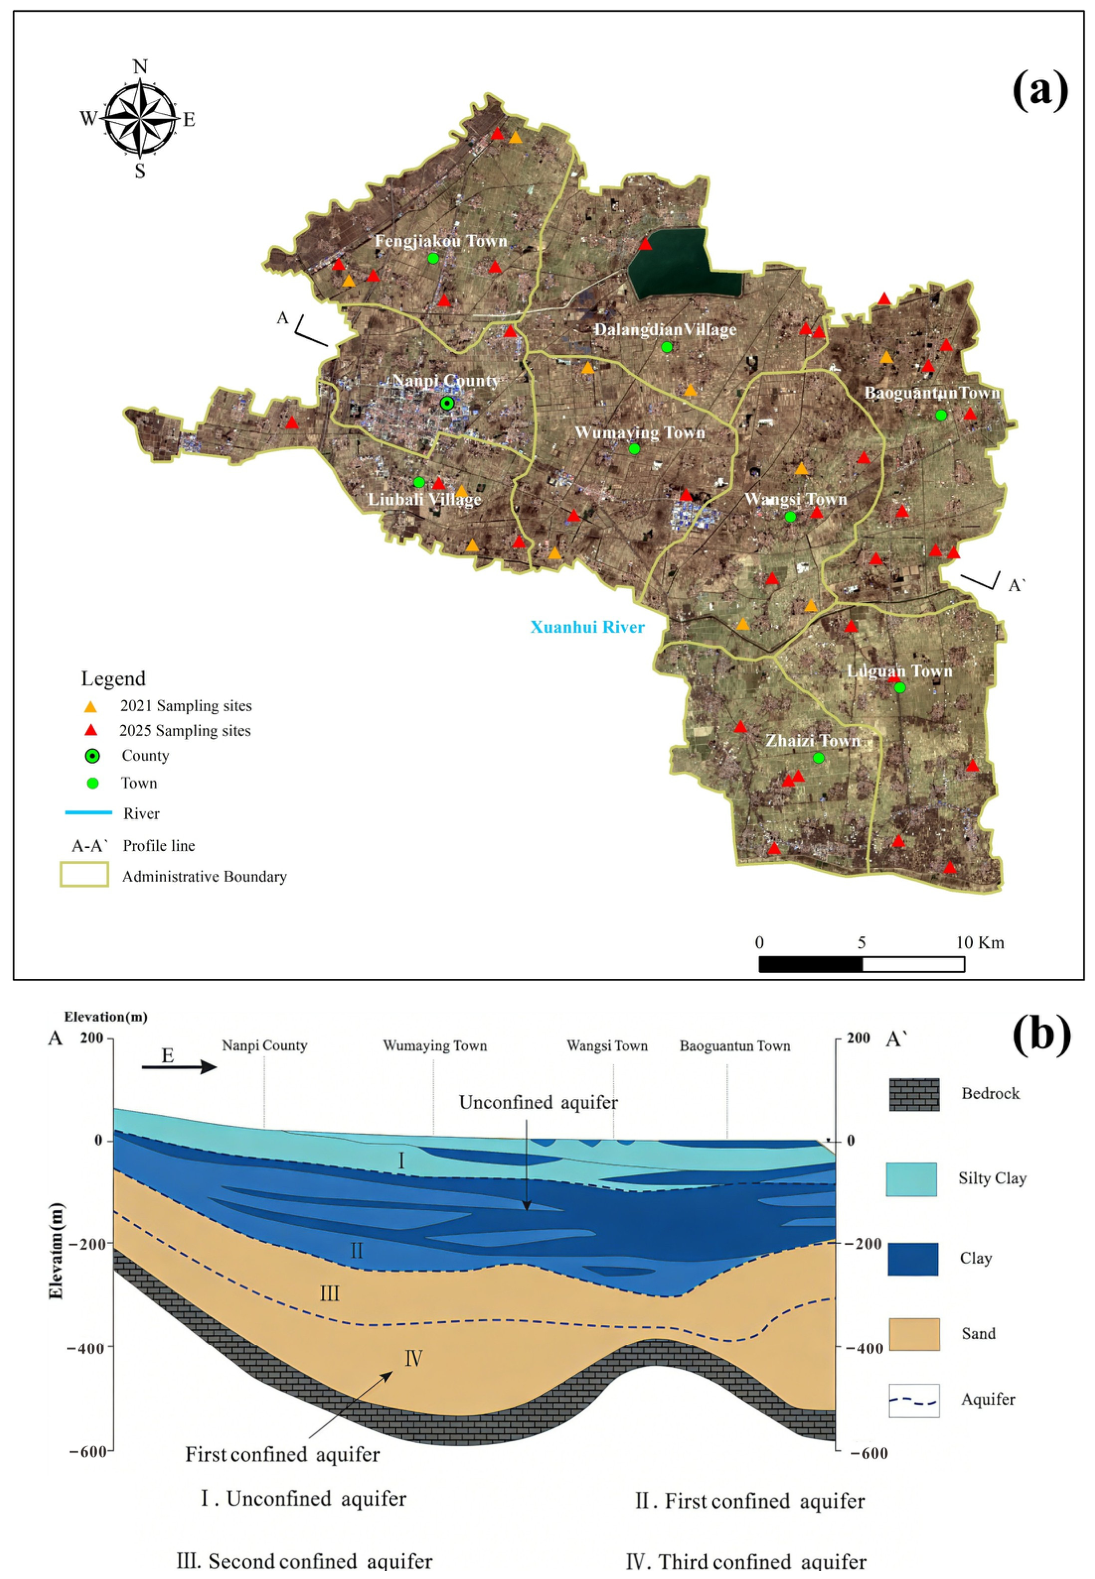
Thirty-one and twenty-eight deep groundwater samples from deep groundwater wells at 130 and 360 m depths were collected in October 2025 and August 2021, respectively (Figure 1). Prior to sample collection, brown polyethylene bottles were rinsed with deionized water followed by water samples to ensure representativeness. Each sample was filtered through 0.45-μm membranes and subdivided for specific analyses: (1) 500 mL for cation analyses, acidified with 1:1 (v/v) HNO3 to pH < 2; (2) 2000 mL for anion analyses, added to 5 mL of F standard solution (1.00 mg/L) to enhance the analytical accuracy; (3) 500 mL for DOM and FT-ICR MS analyses, acidified with ultrapure H3PO4 to pH < 2; and (4) 500 mL for fluorescence spectroscopy analyses, left unacidified. To prevent air exposure, the bottles were completely filled, sealed with paraffin film, and stored at 4 °C until the laboratory analysis.
Major anions including F, nitrate (NO3), sulfate (SO42−), and chloride (Cl) were determined by ion chromatography (Dionex Integrion IC, Thermo Fisher Scientific, Waltham, MA, USA), whereas major cations, namely sodium (Na+), potassium (K+), calcium (Ca2+), and magnesium (Mg2+), were analyzed by inductively coupled plasma atomic emission spectrometry (ICP-AES; Agilent 5100, Agilent Technologies, Santa Clara, CA, USA) with a precision of 0.01 mg/L. Bicarbonate (HCO3) concentration was determined by acid–base titration with 1:1 (v/v) hydrochloric acid with a precision of 0.1 mg/L. DOM concentration was determined as dissolved organic carbon using a total organic carbon analyzer (Shimadzu TOC-5000, Kyoto, Japan) with a precision of 0.01 mg/L. Total nitrogen (TN) was measured at 420 nm using a UV–visible spectrophotometer (I6s INESA, Shanghai, China) with a precision of 0.01 mg/L. Field measurements of pH and total dissolved solids (TDS) were conducted using a handheld pH meter (HANNA HI8424, Padua, Italy) and a portable conductivity meter (HANNA HI833, Italy), respectively.

2.3. Fluorescence Characteristics and PARAFAC Analyses

The EEM fluorescence spectra of DOM were obtained using a fluorescence spectrometer (Aqualog Horiba, Piscataway, NJ, USA). Excitation wavelengths (Ex) ranging from 250 to 400 nm were utilized (step size: 2 nm), and emission wavelengths (Em) were recorded from 245 to 500 nm at 2 nm increments, with an integration time of 2.0 s per data point [18,53]. The silt widths for Ex and Em were set to 2 nm, with a scanning rate of 2400 nm min−1. Prior to PARAFAC analysis, instrumental blanks were subtracted from the EEM of each sample, and matrices were normalized to Raman units [16,19,54]. Ultimately, three distinct components (C1–C3) were carried out for the 2025 and 2021 samples. For more detailed analysis, DOM components were categorized into two distinct groups based on the protein:humic substance ratio, defined as the proportion of component C3 relative to the combined contributions of components C1 and C2 [4,10].
Fluorescence indices including the humification index (HIX), biological index (BIX), and fluorescence index (FI), along with optical parameters such as specific UV absorbance at 254 nm (SUVA254), were employed to characterize the biological origin, terrestrial versus microbial sources, and aromaticity of DOM [7,8,55,56,57].

2.4. FT-ICR MS Analysis

All the samples were analyzed using a Fourier transform ion cyclotron resonance mass spectrometer (Bruker SolariX, 15 Tesla (Bruker Corporation, Billerica, MA, USA)) operating in negative-ion electrospray ionization mode, with the m/z range of 200–800 Da. In-depth details for sample preparation, instrumental analysis, and calibration procedures for FT-ICR-MS are provided by [16,28,54]. The modified aromaticity index (AImod), an indicator of the aromaticity of DOM molecules [18]; double bond equivalent (DBE), reflecting the unsaturation degree of DOM molecules [19]; and nominal oxidation state of carbon (NOSC), indicating the energetic potential of molecular complexes [57], were calculated for each assigned molecular formula composed of C, H, O, N, and S elements.
DOM compounds were classified on the van Krevelen diagram using H/C and O/C ratios: lipids (H/C: 1.50–2.20; O/C: 0–0.30), protein/aliphatic (H/C: 1.50–2.20; O/C: 0.30–0.67), unsaturated hydrocarbons (H/C: 0.70–1.50; O/C: 0–0.10), carbohydrates (H/C: 1.50–2.50; O/C: 0.67–1.20), lignin-like (H/C: 0.70–1.50; O/C: 0.10–0.67), tannin-like (H/C: 0.50–1.50; O/C: 0.67–1.20), and condensed aromatics (H/C: 0.20–0.70; O/C: 0–0.67).

2.5. Statistical Analysis

Statistical analyses and graphics were generated using Origin 2025. PARAFAC modeling was implemented in MATLAB 7.0 (MathWorks, Natick, MA, USA) utilizing the DOM Fluor v.1.7 software package. Saturation indices (SI) for calcite and dolomite were calculated using PHREEQC Version 3 software with the wateq4f.dat thermodynamic database [15]. Molecular formula assignments from FT-ICR MS data were performed using Bruker Daltonics’ Data Analysis 4.4 software. Spearman’s rank correlation analysis and principal component analysis (PCA) were applied to explore the relationships among optical properties, FT-ICR MS-derived molecular features, and geochemical parameters. Descriptive statistics including maximum, minimum, mean, and standard deviation were summarized in Table 1. Table 2 provided a comparative overview of DOM composition, optical spectroscopic, and FT-ICR MS properties before and after EWS.

3. Results

3.1. General Deep Groundwater Quality Before and After EWS

Deep groundwater pH ranged from 6.98 to 8.48 (mean: 7.73) before EWS and from 7.30 to 8.50 (mean: 8.01) after EWS, indicating a shift from weakly alkaline to strongly alkaline conditions. TDS ranged from 911 to 5441 mg/L before EWS and from 273 to 2247 mg/L after EWS, with 37.93% and 67.74% of samples, respectively, exceeding China’s national drinking water quality standard (TDS ≤ 1000 mg/L). Overall, the mean TDS values of deep groundwater after EWS were weaker than that before EWS, indicating the EWS process attenuated water–rock interaction intensity through dilution effects [25].
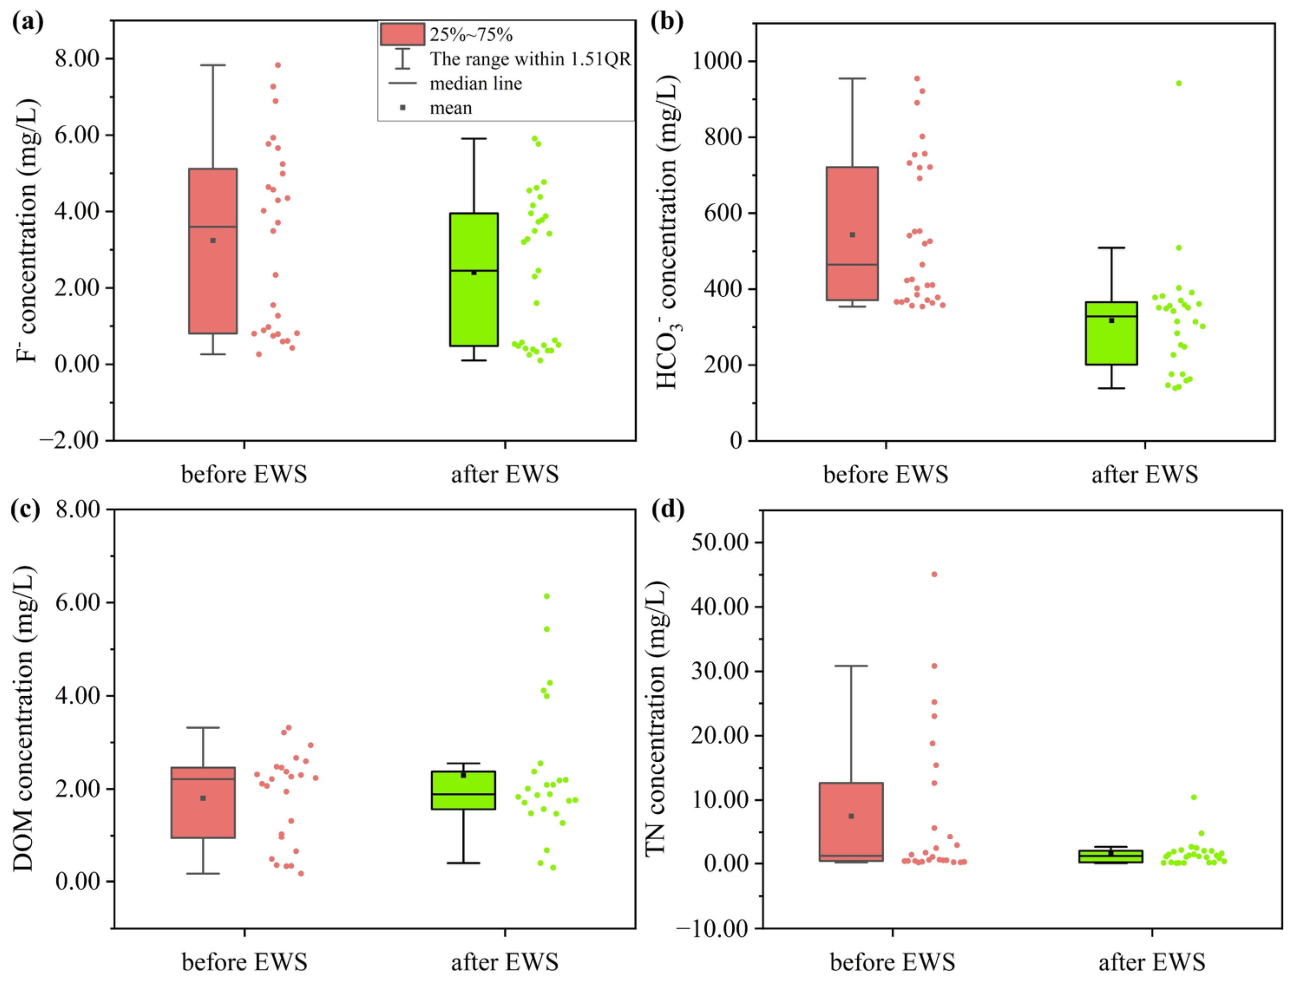
As shown in Figure 2a,b, the F and HCO3 concentrations in deep groundwater before EWS were in the range of 0.26 to 7.83 mg/L (mean: 3.24 mg/L) and 354.2 to 921.3 mg/L (mean: 539.2 mg/L), respectively. After EWS, deep groundwater samples exhibited an F concentration ranging from 0.10 to 5.91 mg/L (mean: 2.41 mg/L) and a HCO3 concentration ranging from 139 to 942 mg/L (mean: 323.7 mg/L). The fluoride concentration measured after EWS is significantly lower compared to the values documented in studies by Sun [25] (0.60 to 6.28 mg/L) and Hao [40] (0.10 to 7.83 mg/L), indicating that the F concentration in deep groundwater continued to decrease during the EWS process. Notably, 66.67% and 58.07% of the samples exceeded the maximum acceptable F concentration of China’s national drinking water quality guidelines (1.0 mg/L) before and after EWS, respectively. Similarly to those before EWS, the F concentrations in deep groundwater samples were elevated at depths between 150 m and 360 m after EWS. Conversely, low-F deep groundwater samples were observed at depths lower than 200 m. Simultaneously, DOM concentrations in deep groundwater after EWS were slightly higher compared to those in deep groundwater before EWS (Figure 2c), whereas TN concentrations were substantially greater in deep groundwater before EWS than those in deep groundwater after EWS (Figure 2d). F concentrations and their relationships with other geochemical elements in the study aligned closely with previous studies by Sun [25] and Hao [40], revealing that lower DOM and higher TN and HCO3 concentrations facilitated F enrichment in deep groundwater.
HCO3-Na·Mg and HCO3·Cl-Na types were the primary hydrochemical facies in deep groundwater before EWS, while more complex and diverse types including HCO3-Na, Cl-Na⋅Mg, HCO3-Na·Mg and HCO3·Cl-Na emerged in deep groundwater after EWS (Figure S1). Correspondingly, the concentrations of Ca2+, Na+, Mg2+, Cl, NO3 and SO42− were enriched, whereas those of HCO3, K+, and F were depleted in groundwater with higher DOM content after EWS, indicating increasing DOM content had altered the groundwater geochemical quality during the EWS process.

3.2. Optical Properties of DOM Before and After EWS

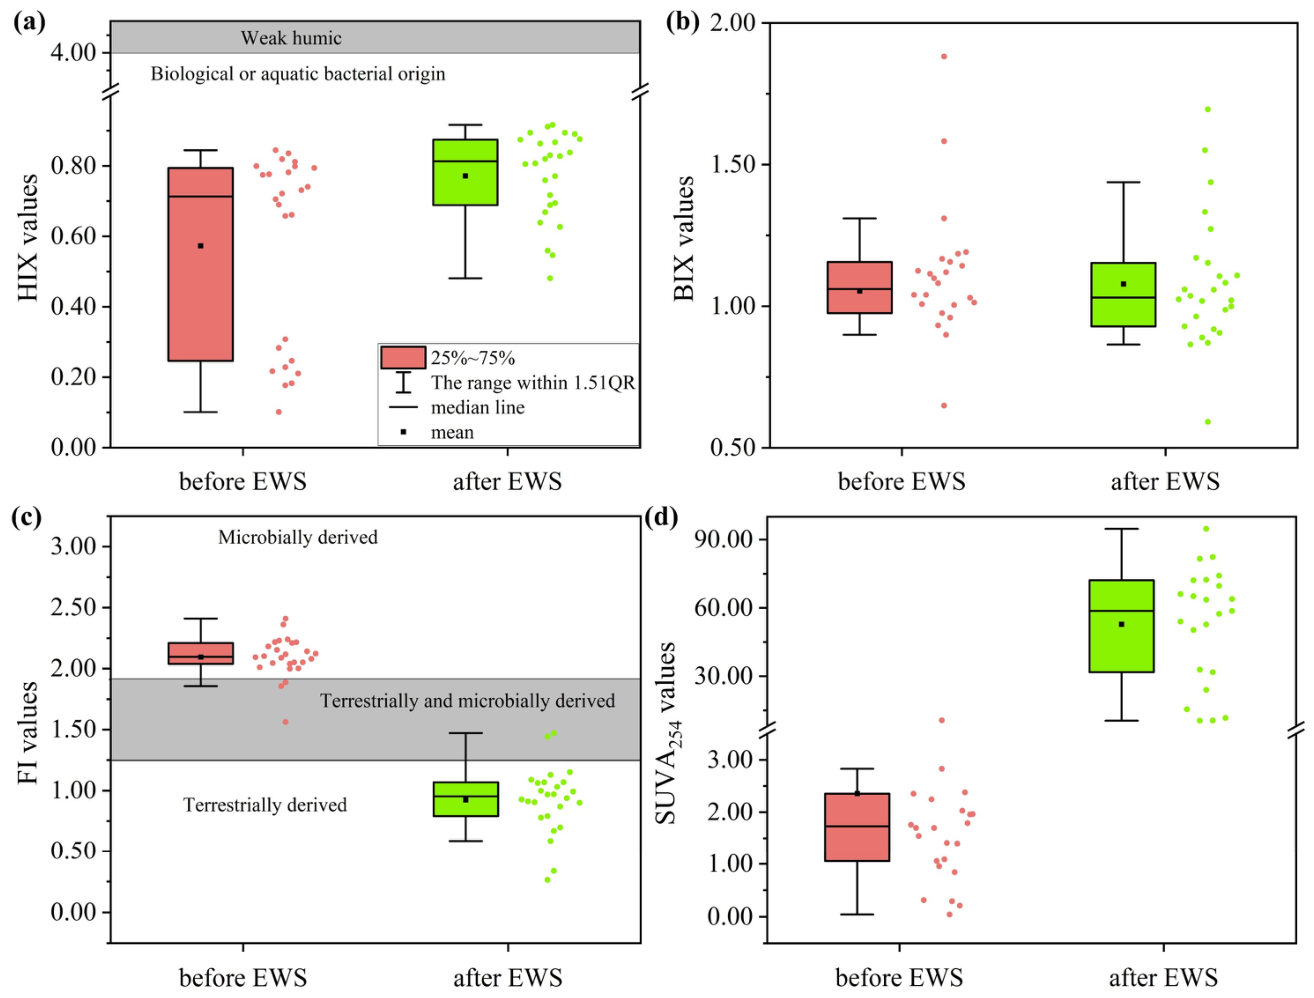
Compared to deep groundwater samples after EWS, deep groundwater DOM before EWS exhibited comparable BIX, lower FI values, and higher HIX and SUVA254 values (Figure 3), indicating deep groundwater DOM showed more humic components during the EWS process, which may be ascribed to the increase in aromatic DOM [4,19,58]. The mean SUVA254 values in deep groundwater after EWS were approximately 25 times those in deep groundwater before EWS, indicating a more pronounced humic nature and fewer degradable components in deep groundwater DOM after EWS [4,19,58]. This phenomenon could potentially be attributed to the newly generated terrestrial DOM during the EWS process [4]. Notably, the HIX values in the deep groundwater samples both before and after EWS were below 4.0, representing a strong biological or aquatic bacterial origin characteristic, indicating that biological or aquatic bacterial DOM was the predominate component of DOM in the deep groundwater. Meanwhile, the deep groundwater samples obviously shifted from predominantly microbially derived zones (FI > 1.9) to mixed terrestrial and microbially derived zones (1.4 < FI < 1.9), further confirming that terrestrial DOM input modified the native DOM components in deep groundwater after the EWS process [4,12,14,58].
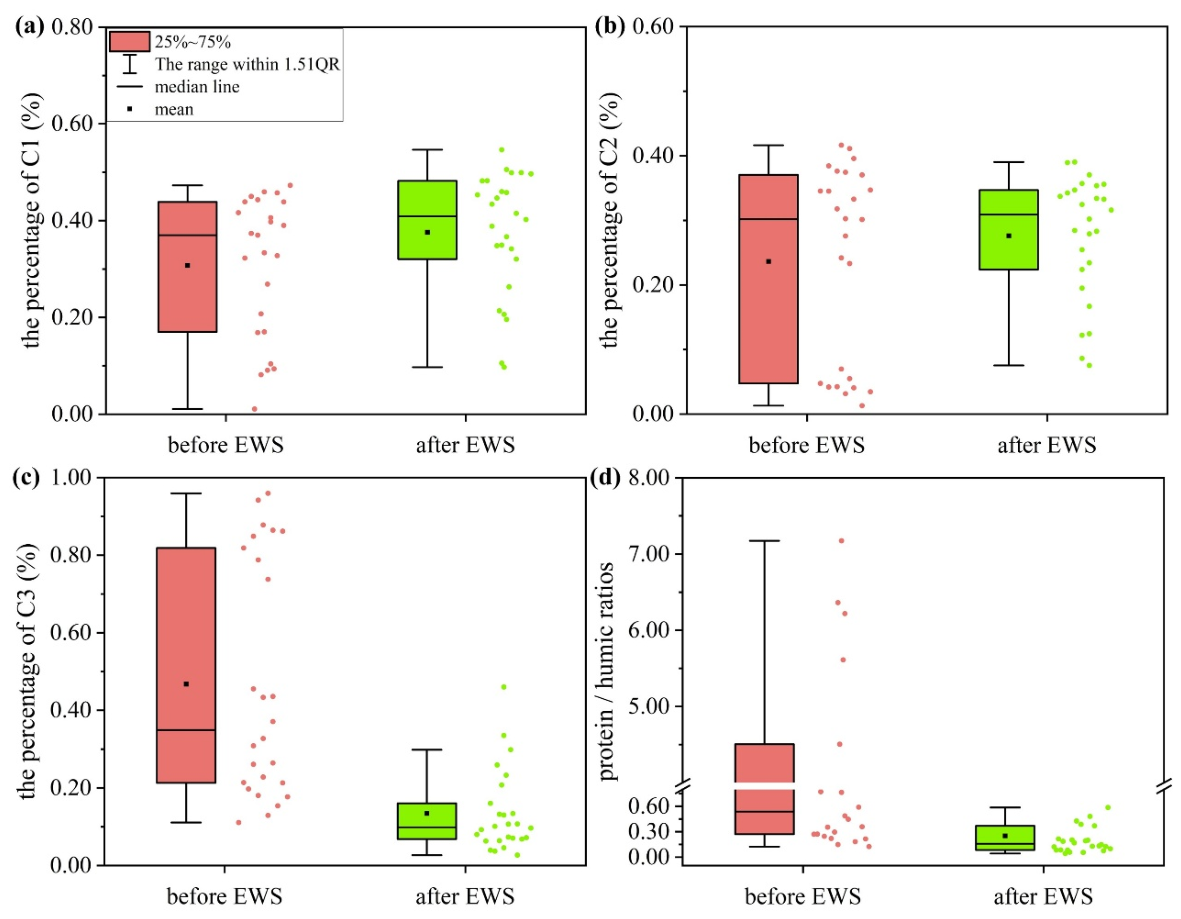
Five peak positions including Peak A (Ex/Em = 255–275/390–454 nm), Peak W (Ex/Em = 320–350/430–454 nm), Peak T (Ex/Em = 270–280/440–460 nm), Peak M (Ex/Em = 340–365/440–460 nm) and Peak C (Ex/Em = 280–290/325–340 nm) were identified by three-dimensional excitation–emission matrix (3DEEM) fluorescence spectroscopy in deep groundwater DOM both before and after EWS, respectively (Figure S2). Meanwhile, based on the PARAFAC analysis results (Figure S2; Table 2), fluorescent components C1, C2 and C3 were identified as humic-like substances from agriculture sources, terrestrially derived humic-like substances from soils, and protein-like substances from microorganisms. As shown in Figure 4, deep groundwater DOM after EWS exhibited higher relative abundances of C1 components, similar abundances of C2 components, lower abundances of C3 components, and reduced protein:humic ratios relative to deep groundwater DOM before EWS, confirming that an increased proportion of humic-like components occurred during the EWS process [25,59]. Deep groundwater DOM after EWS showed comparable abundances of C2 components compared with deep groundwater DOM before EWS, indicating an identical source for terrestrially derived humic-like substances from soils.

3.3. Molecular Signatures of DOM Before and After EWS

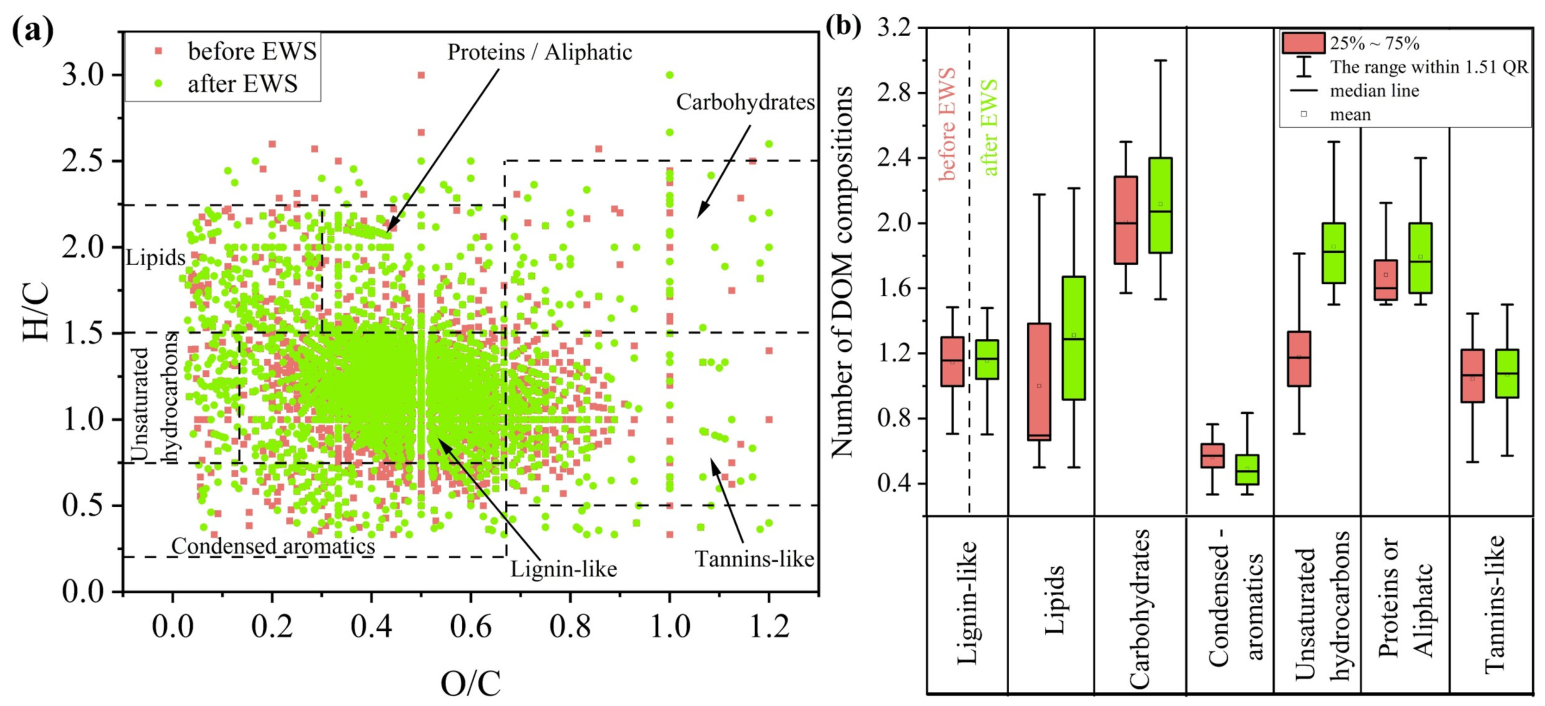
As shown in Figure 5a, FT-ICR MS analysis detected approximately 3590 and 1928 molecular formulas in deep groundwater DOM before and after EWS, respectively. Compared with previous studies, a significantly larger number of DOM formulas were observed in the shallow groundwater of the Hetao Basin [14,19] and the Xikuangshan mine area [54], indicating that deep groundwater DOM was less affected anthropogenic activities and terrestrial inputs. The reduced molecular abundance in deep groundwater DOM after EWS may be attributed to weaker microbial decomposition under dilution conditions. The identified formulas of deep groundwater DOM before and after EWS including lipid-like, protein-like, amino sugar-like, carbohydrate-like, lignin-like, tannin-like, and dissolved black carbon-like substances were observed in the van Krevelen diagram (Figure 5a), indicating that no significant changes in the molecular characteristics of DOM occurred during EWS process [18,21].
Interestingly, deep groundwater DOM after EWS exhibited comparable formula abundances for lignin-like, tannin-like, and condensed aromatics compounds (Figure 5b). Conversely, reduced abundances were observed for lipids, protein/aliphatic, unsaturated hydrocarbons, and carbohydrates compared to deep groundwater DOM before EWS. The phenomenon indicated that deep groundwater DOM showed a decrease in the proportion of unsaturated and biodegradable compounds, while the characteristics of recalcitrant compounds remained stable during the EWS process [21,22].
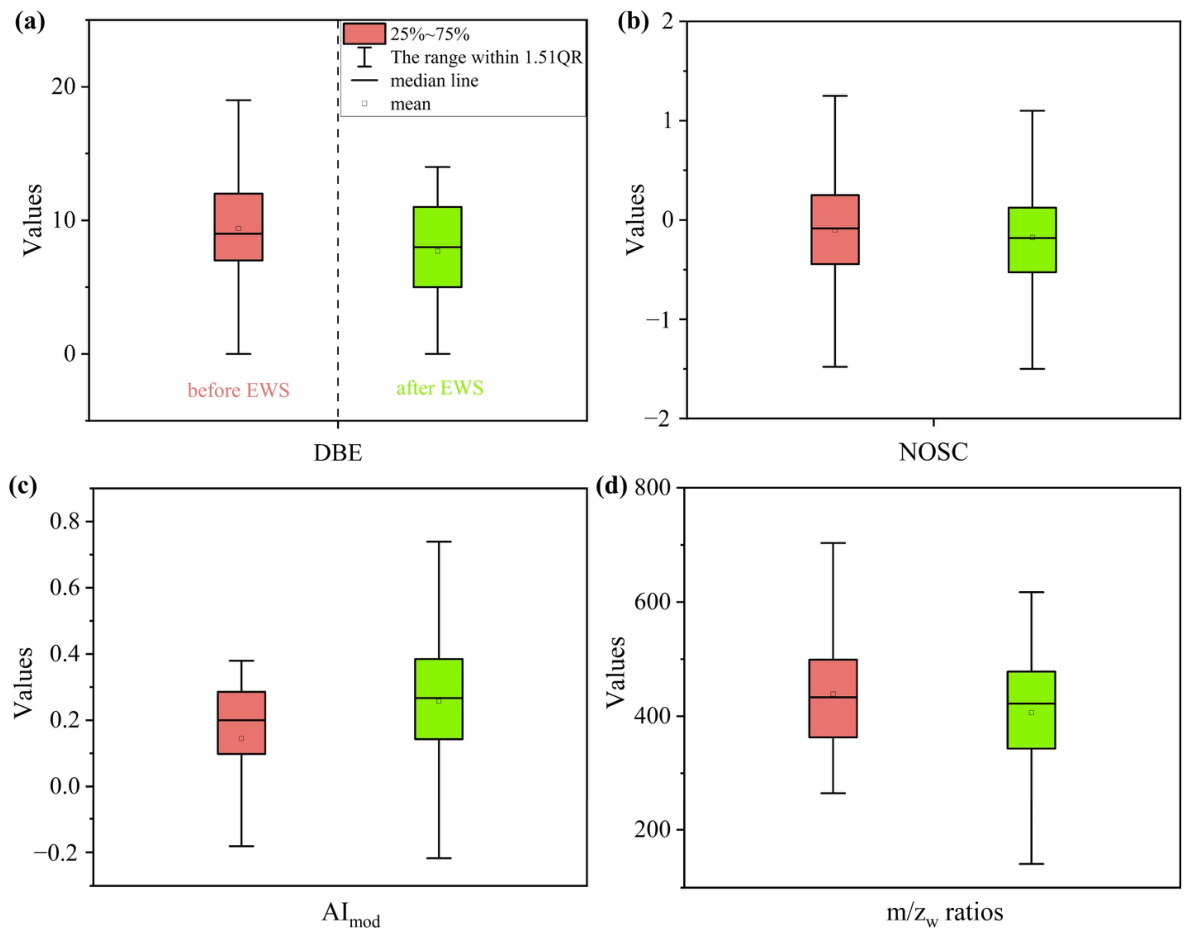
Lower molecular weights (m/zw) and DBE values, along with relatively higher AImod values, were found in deep groundwater DOM after EWS, supporting the increased presence of compounds with reduced unsaturation and lower lability during EWS [8,21,23,60]. Deep groundwater DOM demonstrated comparable NOSC values, suggesting that the oxidation states were identical, which could be attributable to the stable deep anaerobic environment during the EWS process [8,54,61].

4. Discussion

4.1. Variations in Optical Properties with Molecular Characteristics of DOM

As shown in Figure 6, positive correlations between BIX and DBE, and between BIX and H/C, were observed, indicating that DOM characterized by higher O/C ratios and BIX values tended toward greater biological lability [19,21,22]. Compared to those before EWS, deep groundwater DOM after EWS exhibited less DOM formulas with relatively higher H/C and lower O/C ratios, suggesting the EWS process enhanced the aromatic character in deep groundwater DOM. This finding corresponds with the elevated HIX and SUVA254 values (Figure 3), and may be explained by aromatic compound accumulation during the EWS process, potentially resulting from sustained organic carbon addition. In the study area, excessive groundwater extraction induced land subsidence, prompting governmental restrictions on deep-well pumping [39,51]. Abandoned extraction wells connected shallow and deep aquifers, enabling direct recharge of deep groundwater by enriched humic DOM. In addition, elevated HIX values indicate potential terrestrial sources, while reduced FI values signify diminished microbially derived autochthonous DOM [8,21]. Deep groundwater DOM after EWS exhibited stronger humic character indicated by higher HIX and lower FI values than those in deep groundwater before EWS, further confirming that the DOM transitioned from predominantly autochthonous sources to both terrestrial and autochthonous contributions. Consequently, in the context of compounds, reduced relative abundances of lipids, protein/aliphatic, unsaturated hydrocarbons, and carbohydrates characterized by higher terrestrial DOM levels were observed in Figure 5b.
Figure S3 illustrates DBE and carbon chain length (C#) variations in DOM structural composition at the molecular level. Deep groundwater DOM before and after EWS exhibited comparable distributions and intensities of hydrocarbons with carbon chain lengths spanning C3 to C50. Notably, compared to deep groundwater DOM before EWS, the fluorescence intensities of compounds with C# > 25 and DBE values > 15 were significantly enhanced in deep groundwater DOM after EWS, suggesting a broader range of compounds containing increased double bonds and aromatic rings [21,54,59,62]. The results may be attributed to the occurrence of larger-sized compounds with higher DBE and more unsaturated structures, which were difficult to degrade during the EWS process. Generally, increased DBE indicates greater carboxyl and carbonyl group abundance, reducing biodegradability [19]. Here, deep groundwater DOM after EWS exhibited lower protein:humic substance ratios than those in deep groundwater before EWS, confirming that EWS activities had contributed to an increase in the aromatic and unsaturated larger molecular size present in deep groundwater [14,54]. This is consistent with the observation that elevated HIX and SUVA254 values, and reduced DOM and HCO3 concentrations, were observed in deep groundwater DOM after EWS.

4.2. Implications for Fluoride Concentration Variations

Deep groundwater F generally originates from the dissolution of F-bearing minerals including fluorite, diorite and phosphorite, as shown in Equations (1)–(3), respectively [35,63,64]. Previous studies have found fluorite (CaF2), phosphorite (Ca5(PO4)3F), and diorite (NaCa2(Mg,Fe,Al)5(Al,Si)8O22F2) in the deep clay layers [40,51], with total fluoride content ranging from 440 to 792 mg/kg and porewater F concentration ranging from 0.77 to 4.18 mg/L. Simultaneously, water–rock interactions such as calcite and dolomite precipitation, along with competitive adsorption, may elevate the F concentration [61,65,66]. DOM and TN served as key nutrient substances for microbial activities driven by local precipitation and soil leaching in the study area [67,68,69]. Here, following the implementation of EWS, the DOM and TN concentrations in deep groundwater decreased compared to pre-EWS levels (Table 1 and Figure 2), exhibiting a reduction in microbial metabolic activity. Notably, slightly reduced DOM concentration can enhance the availability of adsorption sites on sediment surfaces, thereby promoting more F adsorption and subsequently lowering F concentrations in deep groundwater [35,36].
CaF2 → Ca2+ + 2F
NaCa2(Mg,Fe,Al)5(Al,Si)8O22F2 + 2OH → NaCa2(Mg,Fe,Al)5(Al,Si)8O22(OH)2 + 2F
Ca5(PO4)3F + OH → Ca5(PO4)3(OH) + F
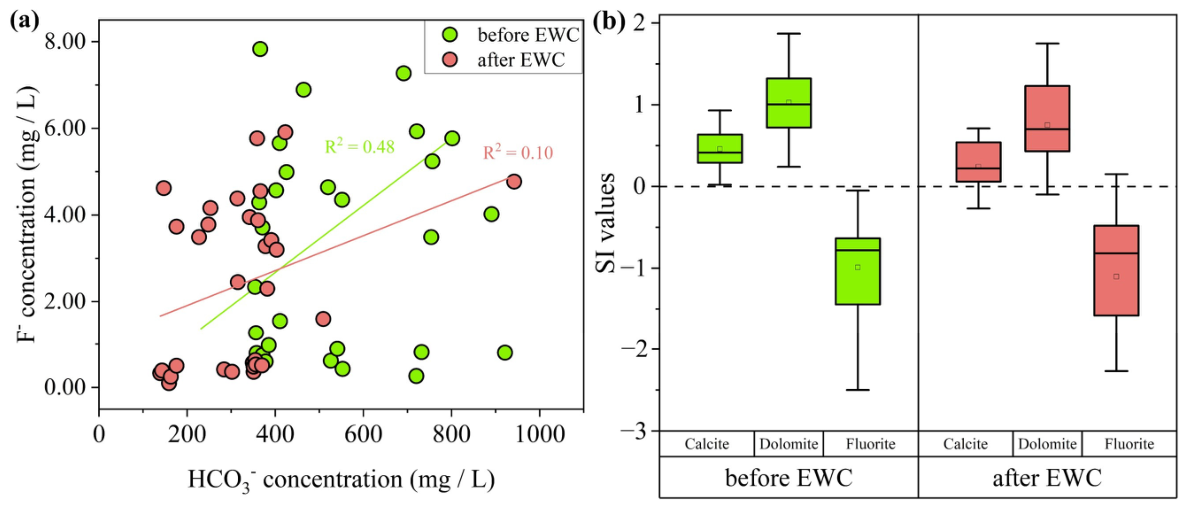
Interestingly, the concentrations of HCO3 and DOM decreased concurrently in Figure 2b,c, indicating that DOM reduction induced decreased HCO3 concentration through microbial activity during the EWS process [13,70,71]. Firstly, decreasing the HCO3 concentration may reduce competitive effects with F, thereby decreasing F concentration in deep groundwater. Here, a notably weaker positive correlation between HCO3 and F was observed in deep groundwater after EWS compared to that in deep groundwater before EWS (Figure 7a), supporting the occurrence of diminished competitive effects between HCO3 and F on sediment surfaces. Second, a reduction in HCO3 concentration derived the reactions described in Equations (4) and (5) toward the right products, enhancing calcite and dolomite dissolution, and thereby increasing Ca2+ concentration in deep groundwater.
Meanwhile, a weaker correlation between F and pH after EWS was observed in Figure S4, indicating that the promoted alkaline environmental conditions had a minor contribution to F leaching through desorption. Unfortunately, diminished microbial activity induced pH increase and promoted alkaline conditions, shifting Equations (2) and (3) rightward and increasing the diorite and phosphorite dissolution, ultimately elevating the F concentration in deep groundwater after EWS [15,61].
CaCO3 + H+ → Ca2+ + HCO3
CaMg(CO3)2 + 2H+ → Ca2+ + Mg2+ + 2HCO3
As shown in Figure 7b, deep groundwater samples after EWS exhibited stronger unsaturated dissolution of calcite and dolomite, characterized by lower SI values relative to those before EWS, indicating that the calcite and dolomite dissolution significantly contributed to F depletion. Consequently, the increasing Ca2+ concentration potentially prevented Equation (1) from occurring, which subsequently inhibited CaF2 dissolution, thereby decreasing F concentration in deep groundwater during the EWS process.

5. Conclusions

This study compared molecular and optical signatures of deep groundwater DOM before and after EWS, and evaluated the implications of associated alterations for fluoride migration. DOM, HCO3 and F exhibited the same variation, with their concentrations significantly higher in deep groundwater before EWS than those in deep groundwater after EWS. Meanwhile, aromatic DOM with higher HIX and SUVA254 values, and lower protein:humic ratios (the sum proportion of C1 and C2 to C3), was enriched in deep groundwater during the EWS process. Deep groundwater DOM after EWS exhibited reduced levels of unsaturated and biodegradable compounds including lipids, protein/aliphatic, unsaturated hydrocarbons, and carbohydrates with higher H/C ratio, while the recalcitrant compounds such as lignin-like, tannin-like, and condensed aromatic compounds with a higher O/C ratio remained stable relative to those before EWS. Reduced microbial metabolic activity decreased DOM and TN concentrations, thereby promoting more F adsorption and F-bearing minerals such as diorite and phosphorite dissolution, and subsequently lowering F concentrations in deep groundwater after EWS. Simultaneously, decreasing HCO3 concentration also decreased F concentration by weakening the competitive effects and enhancing calcite and dolomite dissolution.
Despite F concentration in deep groundwater decreasing after EWS, 58.07% of the samples exceeded the maximum acceptable F concentration of China’s national drinking water quality guidelines (1.0 mg/L). Moreover, microorganisms’ types and enzyme activities varied along with the optical and molecular characteristics of DOM in deep groundwater during EWS, thereby influencing F migration. The variation process and transfer mechanism affected by the F concentrations are crucial to analyze in the future. Hence, our findings are limited in that variations in the health risk of fluoride in drinking deep groundwater were unexamined before and after EWS, which would assist the informed management of groundwater resources to improve public safety.

Supplementary Materials

The following supporting information can be downloaded at: https://www.mdpi.com/article/10.3390/min16060596/s1, Figure S1: Piper diagrams of deep groundwater: (a) before EWS; and (b) after EWS; Figure S2: Representative three-dimensional excitation-emission matrix (3DEEM) spectra of deep groundwater samples; Figure S3: The relationship between DBE and c# in deep groundwater DOM: (a) before EWS; and (b) after EWS; Figure S4: The relationship between pH and F concentration in deep groundwater before and after EWS.

Author Contributions

H.W.: Data curation, visualization, and writing—original draft. C.H.: Data curation, investigation. R.H.: Investigation, data curation. P.L.: Data curation, investigation. B.C.: Investigation. L.Z.: Investigation. C.Z.: Investigation. H.G.: Writing—original draft, and project administration. H.L.: Project administration. All authors have read and agreed to the published version of the manuscript.

Funding

This work was supported by Special Funds for the Groundwater and Land Subsidence (National Field Scientific Observation and Research Station) in the Plain of Cangzhou, Hebei Province (grant. WT2025107B), Talent Special Funds of the Ministry of Science and Technology (Grant No. JDRC20250001), National Natural Science Foundation of China (number 42371081, 42371089, and U24A20433), Major Science and Technology Innovation Demonstration Special Project of the Inner Mongolia Autonomous Region (No. 2025ZDSF001702), and Central funds for guiding local science and technology development (No. 2024ZY0165).

Data Availability Statement

Data will be made available on request.

Conflicts of Interest

The authors declare no conflicts of interest or personal relationships in the paper.

References

  1. Chen, W.; Yu, H.-Q. Advances in the characterization and monitoring of natural organic matter using spectroscopic approaches. Water Res. 2021, 190, 116759. [Google Scholar] [CrossRef]
  2. Xu, X.; Kang, J.; Shen, J.; Zhao, S.; Wang, B.; Zhang, X.; Chen, Z. EEM–PARAFAC characterization of dissolved organic matter and its relationship with disinfection by-products formation potential in drinking water sources of northeastern China. Sci. Total Environ. 2021, 774, 145297. [Google Scholar] [CrossRef]
  3. Zhou, X.; Wang, Q.; Guo, Y.; Sun, X.; Li, T.; Yang, C. Spectroscopic characterization of dissolved organic matter from macroalgae Ulva pertusa decomposition and its binding behaviors with Cu(II). Ecotoxicol. Environ. Saf. 2021, 225, 112811. [Google Scholar] [CrossRef] [PubMed]
  4. Hao, C.; Sun, X.; Peng, Y.; Xie, B.; He, K.; Wang, Y.; Liu, M.; Fan, X. Geochemical impact of dissolved organic matter on antimony mobilization in shallow groundwater of the Xikuangshan antimony mine, Hunan Province, China. Sci. Total Environ. 2022, 860, 160292. [Google Scholar] [CrossRef] [PubMed]
  5. Li, K.; Chen, J.; Sun, W.; Zhou, H.; Zhang, Y.; Yuan, H.; Hu, A.; Wang, D.; Zhang, W. Coupling effect of DOM and microbe on arsenic speciation and bioavailability in tailings soil after the addition of different biologically stabilized sludges. J. Hazard. Mater. 2023, 458, 132048. [Google Scholar] [CrossRef]
  6. Tan, M.; Hong, C.; Zheng, X.; Chen, B.; Chu, C. Natural Organic Matter Association Modulates Pyrite Surface Electron Transfer Kinetics and Path for Reactive Oxygen Species Generation. Environ. Sci. Technol. 2026, 60, 3280–3288. [Google Scholar] [CrossRef] [PubMed]
  7. Liu, J.; Wang, C.; Hao, Z.; Kondo, G.; Fujii, M.; Fu, Q.-L.; Wei, Y. Comprehensive understanding of DOM reactivity in anaerobic fermentation of persulfate-pretreated sewage sludge via FT-ICR mass spectrometry and reactomics analysis. Water Res. 2023, 229, 119488. [Google Scholar] [CrossRef]
  8. Liu, D.; Gao, H.; Yu, H.; Song, Y. Applying EEM-PARAFAC combined with moving-window 2DCOS and structural equation modeling to characterize binding properties of Cu (II) with DOM from different sources in an urbanized river. Water Res. 2022, 227, 119317. [Google Scholar] [CrossRef]
  9. Li, S.; Meng, L.; Zhao, C.; Gu, Y.; Spencer, R.G.; Álvarez–Salgado, X.A.; Kellerman, A.M.; McKenna, A.M.; Huang, T.; Yang, H.; et al. Spatiotemporal response of dissolved organic matter diversity to natural and anthropogenic forces along the whole mainstream of the Yangtze River. Water Res. 2023, 234, 119812. [Google Scholar] [CrossRef]
  10. Guo, X.; Xie, X.; Liu, Y.; Wang, C.; Yang, M.; Huang, Y. Effects of digestate DOM on chemical behavior of soil heavy metals in an abandoned copper mining areas. J. Hazard. Mater. 2020, 393, 122436. [Google Scholar] [CrossRef]
  11. Husain, M.A.; Scheinost, A.C.; Biswas, A. Dissolved organic matter oxidizes ferrous iron and forms colloidal ternary complexes with arsenic via ferric iron bridging in water under anoxic conditions. Geochim. Cosmochim. Acta 2026, 413, 122–137. [Google Scholar] [CrossRef]
  12. Lyu, L.; Liu, G.; Shang, Y.; Wen, Z.; Hou, J.; Song, K. Characterization of dissolved organic matter (DOM) in an urbanized watershed using spectroscopic analysis. Chemosphere 2021, 277, 130210. [Google Scholar] [CrossRef]
  13. Meilleur, C.; Kamula, M.; Kuzyk, Z.; Guéguen, C. Insights into surface circulation and mixing in James Bay and Hudson Bay from dissolved organic matter optical properties. J. Mar. Syst. 2023, 238, 103841. [Google Scholar] [CrossRef]
  14. Gao, Z.; Guo, H.; Qiao, W.; He, C.; Shi, Q.; Ke, T.; Cao, Y. Dissolved Organic Matter Sources in High Arsenic Groundwater from a Sand-Gravel Confined Aquifer. J. Geophys. Res. Biogeosci. 2023, 128, e2022JG007178. [Google Scholar] [CrossRef]
  15. Qiao, W.; Cao, W.; Gao, Z.; Pan, D.; Ren, Y.; Li, Z.; Zhang, Z. Contrasting behaviors of groundwater arsenic and fluoride in the lower reaches of the Yellow River basin, China: Geochemical and modeling evidences. Sci. Total Environ. 2022, 851, 158134. [Google Scholar] [CrossRef]
  16. Xue, J.; Deng, Y.; Fu, Q.-L.; Du, Y.; Shi, J.; Wang, Y. Unveiling Molecular Constraints on the Formation and Fate of Organoiodine Compounds under Aquifer Conditions. Environ. Sci. Technol. 2025, 59, 18283–18293. [Google Scholar] [CrossRef] [PubMed]
  17. Xu, J.; Sun, W.; Ding, J.; Huang, Y.; Chen, X.; Li, L.; Peng, C.; Lian, L.; Guan, X. DOM-mediated inhibition of ciprofloxacin photodegradation: Dual roles of antioxidant quenching and triplet-state interactions. Water Res. 2026, 295, 125571. [Google Scholar] [CrossRef]
  18. Du, L.; Liu, Y.; Hao, Z.; Chen, M.; Li, L.; Ren, D.; Wang, J. Fertilization regime shifts the molecular diversity and chlorine reactivity of soil dissolved organic matter from tropical croplands. Water Res. 2022, 225, 119106. [Google Scholar] [CrossRef] [PubMed]
  19. Qiao, W.; Guo, H.; He, C.; Shi, Q.; Zhao, B. Unraveling roles of dissolved organic matter in high arsenic groundwater based on molecular and optical signatures. J. Hazard. Mater. 2021, 406, 124702. [Google Scholar] [CrossRef]
  20. Ge, J.; Qi, Y.; Li, C.; Ma, J.; Yi, Y.; Hu, Q.; Mostofa, K.M.; Volmer, D.A.; Li, S.-L. Fluorescence and molecular signatures of dissolved organic matter to monitor and assess its multiple sources from a polluted river in the farming-pastoral ecotone of northern China. Sci. Total Environ. 2022, 837, 154575. [Google Scholar] [CrossRef] [PubMed]
  21. Maqbool, T.; Sun, M.; Chen, L.; Zhang, Z. Molecular-level characterization of natural organic matter in the reactive electrochemical ceramic membrane system for drinking water treatment using FT-ICR MS. Sci. Total Environ. 2022, 846, 157531. [Google Scholar] [CrossRef] [PubMed]
  22. Ning, C.; Gao, Y.; Zhang, H.; Wang, L.; Yu, H.; Zou, L.; Cao, R.; Chen, J. Molecular chemodiversity of water-soluble organic matter in atmospheric particulate matter and their associations with atmospheric conditions. Sci. Total Environ. 2022, 809, 151171. [Google Scholar] [CrossRef]
  23. Pi, K.; Li, Y.; Zhang, C.; Xie, X.; Liang, Q.; Wang, Y. Energetic organic matter-facilitated transformation of zero-valent sulfur constrains geogenic thioarsenic enrichment in groundwater. Water Res. 2026, 292, 125362. [Google Scholar] [CrossRef]
  24. Currell, M.; Cartwright, I.; Raveggi, M.; Han, D. Controls on elevated fluoride and arsenic concentrations in groundwater from the Yuncheng Basin, China. Appl. Geochem. 2011, 26, 540–552. [Google Scholar] [CrossRef]
  25. Sun, D.; Li, J.; Li, H.; Liu, Q.; Zhao, S.; Huang, Y.; Wu, Q.; Xie, X. Evolution of groundwater salinity and fluoride in the deep confined aquifers of Cangzhou in the North China plain after the South-to-North Water Diversion Project. Appl. Geochem. 2022, 147, 105485. [Google Scholar] [CrossRef]
  26. Xiao, J.; Jin, Z.; Zhang, F. Geochemical controls on fluoride concentrations in natural waters from the middle Loess Plateau, China. J. Geochem. Explor. 2015, 159, 252–261. [Google Scholar] [CrossRef]
  27. He, X.; Ma, T.; Wang, Y.; Shan, H.; Deng, Y. Hydrogeochemistry of high fluoride groundwater in shallow aquifers, Hangjinhouqi, Hetao Plain. J. Geochem. Explor. 2013, 135, 63–70. [Google Scholar] [CrossRef]
  28. Li, C.; Gao, X.; Wang, Y. Hydrogeochemistry of high-fluoride groundwater at Yuncheng Basin, northern China. Sci. Total Environ. 2015, 508, 155–165. [Google Scholar] [CrossRef]
  29. Qiu, H.; Gui, H.; Xu, H.; Cui, L.; Yu, H. Occurrence, controlling factors and noncarcinogenic risk assessment based on Monte Carlo simulation of fluoride in mid-layer groundwater of Huaibei mining area, North China. Sci. Total Environ. 2023, 856, 159112. [Google Scholar] [CrossRef] [PubMed]
  30. Huang, L.; Sun, Z.; Zhou, A.; Bi, J.; Liu, Y. Source and enrichment mechanism of fluoride in groundwater of the Hotan Oasis within the Tarim Basin, Northwestern China. Environ. Pollut. 2022, 300, 118962. [Google Scholar] [CrossRef]
  31. Dong, S.; Liu, B.; Chen, Y.; Ma, M.; Liu, X.; Wang, C. Hydro-geochemical control of high arsenic and fluoride groundwater in arid and semi-arid areas: A case study of Tumochuan Plain, China. Chemosphere 2022, 301, 134657. [Google Scholar] [CrossRef]
  32. Wu, C.; Wu, X.; Qian, C.; Zhu, G. Hydrogeochemistry and groundwater quality assessment of high fluoride levels in the Yanchi endorheic region, northwest China. Appl. Geochem. 2018, 98, 404–417. [Google Scholar] [CrossRef]
  33. Li, J.; Wang, Y.; Zhu, C.; Xue, X.; Qian, K.; Xie, X.; Wang, Y. Hydrogeochemical processes controlling the mobilization and enrichment of fluoride in groundwater of the North China Plain. Sci. Total Environ. 2020, 730, 138877. [Google Scholar] [CrossRef] [PubMed]
  34. Ayub, M.; Javed, H.; Rashid, A.; Khan, W.H.; Javed, A.; Sardar, T.; Shah, G.M.; Ahmad, A.; Rinklebe, J.; Ahmad, P. Hydrogeochemical properties, source provenance, distribution, and health risk of high fluoride groundwater: Geochemical control, and source apportionment. Environ. Pollut. 2024, 362, 125000. [Google Scholar] [CrossRef] [PubMed]
  35. Su, C.; Ge, W.; Xie, X.; Guo, Z.; Luo, Z.; Gan, Y.; Xiao, Z.; Gao, Y.; Yang, Y. Prediction and controlling factors of high-fluoride groundwater in the Yellow River Basin based on machine learning model. Groundw. Sustain. Dev. 2025, 30, 101458. [Google Scholar] [CrossRef]
  36. Sunkari, E.D.; Ambushe, A.A. Groundwater fluoride contamination, sources, hotspots, health hazards, and sustainable containment measures: A systematic review of the Ghanaian context. Groundw. Sustain. Dev. 2024, 27, 101352. [Google Scholar] [CrossRef]
  37. Jiang, W.; Xu, G.; Yuan, C.; Ren, Z.; Gui, X.; Gong, X.; Xu, X.; Cao, X. Hydrodynamics primarily drive fluoride migration in coastal aquifers under seawater intrusion. J. Hazard. Mater. 2025, 499, 140058. [Google Scholar] [CrossRef]
  38. Chen, B.; Gong, H.; Chen, Y.; Li, X.; Zhou, C.; Lei, K.; Zhu, L.; Duan, L.; Zhao, X. Land subsidence and its relation with groundwater aquifers in Beijing Plain of China. Sci. Total Environ. 2020, 735, 139111. [Google Scholar] [CrossRef]
  39. Long, D.; Yang, W.; Scanlon, B.R.; Zhao, J.; Liu, D.; Burek, P.; Pan, Y.; You, L.; Wada, Y. South-to-North Water Diversion stabilizing Beijing’s groundwater levels. Nat. Commun. 2020, 11, 3665. [Google Scholar] [CrossRef]
  40. Hao, C.; Wei, Q.; Dong, H.; Ma, T.; Liu, X.; Li, D.; Dong, J. Geochemical evidence for annual variability of fluoride levels in deep groundwater on land subsidence plain in Cangzhou, Hebei Province, China. Geochemistry 2023, 83, 125985. [Google Scholar] [CrossRef]
  41. Ali, S.; Shekhar, S.; Bhattacharya, P.; Verma, G.; Chandrasekhar, T.; Chandrashekhar, A. Elevated fluoride in groundwater of Siwani Block, Western Haryana, India: A potential concern for sustainable water supplies for drinking and irrigation. Groundw. Sustain. Dev. 2018, 7, 410–420. [Google Scholar] [CrossRef]
  42. Jiang, T.; Skyllberg, U.; Björn, E.; Green, N.W.; Tang, J.; Wang, D.; Gao, J.; Li, C. Characteristics of dissolved organic matter (DOM) and relationship with dissolved mercury in Xiaoqing River-Laizhou Bay estuary, Bohai Sea, China. Environ. Pollut. 2017, 223, 19–30. [Google Scholar] [CrossRef] [PubMed]
  43. Du, Y.; Zhang, Q.; Liu, Z.; He, H.; Lürling, M.; Chen, M.; Zhang, Y. Composition of dissolved organic matter controls interactions with La and Al ions: Implications for phosphorus immobilization in eutrophic lakes. Environ. Pollut. 2019, 248, 36–47. [Google Scholar] [CrossRef]
  44. Xing, J.; Xu, G.; Li, G. Analysis of the complexation behaviors of Cu(II) with DOM from sludge-based biochars and agricultural soil: Effect of pyrolysis temperature. Chemosphere 2020, 250, 126184. [Google Scholar] [CrossRef]
  45. Jia, L.; Wu, W.; Zhang, J.; Wu, H. Insight into heavy metals (Cr and Pb) complexation by dissolved organic matters from biochar: Impact of zero-valent iron. Sci. Total Environ. 2021, 793, 148469. [Google Scholar] [CrossRef]
  46. Jia, X.; Majzlan, J.; Ma, L.; Liu, P.; Fan, P.; Li, W.; Zhou, J.; Wen, B. Novel insights into the mechanisms for Sb mobilization in groundwater in a mining area: A colloid field study. J. Hazard. Mater. 2023, 459, 132212. [Google Scholar] [CrossRef]
  47. Aschermann, G.; Jeihanipour, A.; Shen, J.; Mkongo, G.; Dramas, L.; Croué, J.-P.; Schäfer, A. Seasonal variation of organic matter concentration and characteristics in the Maji ya Chai River (Tanzania): Impact on treatability by ultrafiltration. Water Res. 2016, 101, 370–381. [Google Scholar] [CrossRef][Green Version]
  48. Owusu-Agyeman, I.; Shen, J.; Schäfer, A.I. Renewable energy powered membrane technology: Impact of pH and ionic strength on fluoride and natural organic matter removal. Sci. Total Environ. 2018, 621, 138–147. [Google Scholar] [CrossRef]
  49. Zhu, X.; Wang, Z.; Luo, Y.; Ma, Y.; Xu, Z.; Wang, L.; Peng, F.; Pang, Q.; Li, Y.; He, F.; et al. Overlying water fluoride concentrations influence dissolved organic matter composition and migration from pore water in sediment via bacterial mechanisms. Environ. Sci. Ecotechnol. 2022, 10, 100163. [Google Scholar] [CrossRef] [PubMed]
  50. Bai, L.; Jiang, L.; Zhao, Y.; Li, Z.; Cao, G.; Zhao, C.; Liu, R.; Wang, H. Quantifying the influence of long-term overexploitation on deep groundwater resources across Cangzhou in the North China Plain using InSAR measurements. J. Hydrol. 2022, 605, 127368. [Google Scholar] [CrossRef]
  51. Guo, H.; Zhang, Z.; Cheng, G.; Li, W.; Li, T.; Jiao, J.J. Groundwater-derived land subsidence in the North China Plain. Environ. Earth Sci. 2015, 74, 1415–1427. [Google Scholar] [CrossRef]
  52. Liu, X.; Wang, Y.; Yan, S. Ground deformation associated with exploitation of deep groundwater in Cangzhou City measured by multi-sensor synthetic aperture radar images. Environ. Earth Sci. 2016, 76, 6. [Google Scholar] [CrossRef]
  53. Huang, D.; Ding, L.; Qiu, X.; Zhang, B.; Liang, X.; Guo, X.; Dong, H. Molecular transformation and photochemical reactivity of microplastic-derived dissolved organic matter on goethite: Implications for persistence and reactive oxygen species dynamics. Water Res. 2026, 288, 124568. [Google Scholar] [CrossRef]
  54. Hao, C.; Sun, Q.; Sun, X.; Li, Q. Novel insights into antimony mobilization in different high-antimony aquifers from the molecular signatures of dissolved organic matter. Ecotoxicol. Environ. Saf. 2024, 277, 116377. [Google Scholar] [CrossRef]
  55. Richards, L.A.; Lapworth, D.J.; Magnone, D.; Gooddy, D.C.; Chambers, L.; Williams, P.J.; van Dongen, B.E.; Polya, D.A. Dissolved organic matter tracers reveal contrasting characteristics across high arsenic aquifers in Cambodia: A fluorescence spectroscopy study. Geosci. Front. 2019, 10, 1653–1667. [Google Scholar] [CrossRef]
  56. Liu, C.; Li, R.; Zhang, Y.; Zhang, L.; Liu, Z.; Li, P.; Fan, G.; Zhu, Y.; Zuo, Y.; Liu, X.; et al. Spatiotemporal changes in dissolved organic matter chemodiversity and its interaction with microbial composition in heavy-metal polluted river. Water Res. 2026, 288, 124738. [Google Scholar] [CrossRef]
  57. Yang, P.; Jiang, T.; Cao, D.; Sun, T.; Liu, G.; Guo, Y.; Liu, Y.; Yin, Y.; Cai, Y.; Jiang, G. Unraveling Multiple Pathways of Electron Donation from Phenolic Moieties in Natural Organic Matter. Environ. Sci. Technol. 2023, 57, 16895–16905. [Google Scholar] [CrossRef]
  58. Xu, H.; Li, X.; Guo, M.; Li, F.; Yang, K.; Liu, X. Dissolved organic matters with low molecular weight fractions exhibit high photochemical potential for reactive oxygen formation. Chemosphere 2022, 305, 135542. [Google Scholar] [CrossRef] [PubMed]
  59. Jiang, Y.; Zheng, T.; Li, H.; Jiang, H.; Deng, Y.; Yuan, J.; Du, X.; Pei, X. Effect of DOM transformation on As enrichment from an Alpine river basin in the Western Tibetan Plateau. J. Environ. Sci. 2025, 156, 385–398. [Google Scholar] [CrossRef] [PubMed]
  60. Xie, X.; Li, E.; Jiang, H.; Pi, K.; Yan, L.; Shen, S. Methane biogeochemical turnover constrains arsenic transformation in groundwater systems: Organic molecular signatures and microbial functional networks. Water Res. 2026, 290, 125083. [Google Scholar] [CrossRef] [PubMed]
  61. Li, D.; Gao, X.; Wang, Y.; Luo, W. Diverse mechanisms drive fluoride enrichment in groundwater in two neighboring sites in northern China. Environ. Pollut. 2018, 237, 430–441. [Google Scholar] [CrossRef]
  62. Pracht, L.E.; Tfaily, M.M.; Ardissono, R.J.; Neumann, R.B. Molecular characterization of organic matter mobilized from Bangladeshi aquifer sediment: Tracking carbon compositional change during microbial utilization. Biogeosciences 2018, 15, 1733–1747. [Google Scholar] [CrossRef]
  63. Xu, P.; Bian, J.; Li, Y.; Wu, J.; Sun, X.; Wang, Y. Characteristics of fluoride migration and enrichment in groundwater under the influence of natural background and anthropogenic activities. Environ. Pollut. 2022, 314, 120208. [Google Scholar] [CrossRef]
  64. Xu, J.; Si, W.; Wang, J.; Chen, B.; Liu, G. Fluoride sources, hydrogeochemical dynamics, and probabilistic risk evaluation in deep groundwater of the Bozhou Plain, Eastern China. Appl. Geochem. 2025, 194, 106607. [Google Scholar] [CrossRef]
  65. Rafique, T.; Naseem, S.; Ozsvath, D.; Hussain, R.; Bhanger, M.I.; Usmani, T.H. Geochemical controls of high fluoride groundwater in Umarkot Sub-District, Thar Desert, Pakistan. Sci. Total Environ. 2015, 530–531, 271–278. [Google Scholar] [CrossRef] [PubMed]
  66. Ali, W.; Aslam, M.W.; Junaid, M.; Ali, K.; Guo, Y.; Rasool, A.; Zhang, H. Elucidating various geochemical mechanisms drive fluoride contamination in unconfined aquifers along the major rivers in Sindh and Punjab, Pakistan. Environ. Pollut. 2019, 249, 535–549. [Google Scholar] [CrossRef] [PubMed]
  67. Huan, H.; Hu, L.; Yang, Y.; Jia, Y.; Lian, X.; Ma, X.; Jiang, Y.; Xi, B. Groundwater nitrate pollution risk assessment of the groundwater source field based on the integrated numerical simulations in the unsaturated zone and saturated aquifer. Environ. Int. 2020, 137, 105532. [Google Scholar] [CrossRef]
  68. Qu, S.; Wang, C.; Liang, X.; Luo, A.; Shi, Z.; Wang, G.; Yu, R. Regional characteristics of groundwater sulfate source and evolution in the multi-layer aquifer system of the northern Shaanxi coal mine base, northwestern China: Evidence from geochemical and isotopic fingerprints. J. Hazard. Mater. 2024, 480, 135866. [Google Scholar] [CrossRef]
  69. Chen, Y.; Zhao, Z.; Wang, F.; Ye, C.; Zhang, M.; Li, C.; Wang, Y. Deciphering anthropogenic nutrient impacts on aquatic eutrophication through coupled nitrate isotope tracers and hydrogeochemical fingerprints. Sci. Total Environ. 2025, 1001, 180473. [Google Scholar] [CrossRef]
  70. Mao, R.; Guo, H.; Xiu, W.; Yang, Y.; Huang, X.; Zhou, Y.; Li, X.; Jin, J. Characteristics and compound-specific carbon isotope compositions of sedimentary lipids in high arsenic aquifers in the Hetao basin, Inner Mongolia. Environ. Pollut. 2018, 241, 85–95. [Google Scholar] [CrossRef]
  71. Yang, B.; Xu, W.; Zhao, W. Multi-scale mechanisms and environmental implications of dissolved organic matter-metal ions interactions in aquatic environments: A review. Water Res. 2026, 288, 124563. [Google Scholar] [CrossRef]
Figure 1. Plots of (a) location of sampling sites and (b) schematic hydrogeological cross-section.
Minerals 16 00596 g001
Figure 2. Boxplots of: (a) F concentration; (b) HCO3 concentration; (c) DOM concentration; (d) TN concentration in deep groundwater before and after EWS.
Minerals 16 00596 g002
Figure 3. Boxplots of: (a) HIX; (b) BIX; (c) FI; (d) SUVA254 values in deep groundwater before and after EWS.
Minerals 16 00596 g003
Figure 4. Boxplots of: (a) the percentage of C1; (b) the percentage of C2; (c) the percentage of C3; (d) protein/humic ratios in deep groundwater before and after EWS.
Minerals 16 00596 g004
Figure 5. Comparison plots: (a) Van Krevelen diagram; and (b) a comparison of deep groundwater DOM before and after EWS.
Minerals 16 00596 g005
Figure 6. Boxplots of: (a) DBE; (b) NOSC; (c) AImod; (d) m/zw ratios in deep groundwater before and after EWS.
Minerals 16 00596 g006
Figure 7. The relationship between HCO3 and F concentration in deep groundwater DOM: (a) before EWS; and (b) after EWS.
Minerals 16 00596 g007
Table 1. Geochemistry data in deep groundwater before and after EWS.
Typesmg/LpH
Ca2+K+Mg2+Na+ClNO3HCO3SO42−FTDS
Deep groundwater before EWC
(n = 28)
Max152.0011.10112.00993.00555.0013.10921.30568.007.832247.318.48
Min6.900.485.35189.0414.000.05354.2036.500.26273.036.83
Mean37.652.3621.11416.48137.012.39539.16174.803.24924.157.73
Std40.482.6827.80214.46114.423.99182.29108.732.41489.320.57
Deep groundwater after EWC
(n = 31)
Max306.102.50371.30442.001517.30188.85942.001574.405.911801.818.50
Min8.100.352.4012.40106.400.00139.00141.200.10256.437.30
Mean119.550.79119.86236.86464.9031.41323.67521.082.41720.128.01
Std103.450.51121.09130.40413.0452.81149.62444.191.91371.100.29
Table 2. Optical properties and molecular signatures of deep groundwater DOM before and after EWS.
Typesmg/LDBEAImodNOSCm/zwFIBIXHIXSUVA254%
DOMTNp (C1)p (C2)p (C3)
Deep groundwater before EWC
(n = 28)
Max10.4410.4419.500.381.36721.311.471.880.8410.610.470.420.96
Min0.100.100.10−0.18−1.47278.060.260.300.100.040.000.010.11
Mean7.601.609.330.21−0.10421.110.921.080.572.360.300.240.47
Std2.093.703.700.320.53112.990.270.310.272.410.160.150.30
Deep groundwater after EWC
(n = 31)
Max45.0745.0714.900.721.11609.492.411.690.9294.770.550.390.46
Min0.200.200.10−2.10−1.46106.051.560.590.4810.470.100.080.03
Mean7.507.508.850.28−0.18412.082.101.050.7753.770.380.280.13
Std11.844.014.010.680.63108.160.170.230.127.280.130.090.11
Disclaimer/Publisher’s Note: The statements, opinions and data contained in all publications are solely those of the individual author(s) and contributor(s) and not of MDPI and/or the editor(s). MDPI and/or the editor(s) disclaim responsibility for any injury to people or property resulting from any ideas, methods, instructions or products referred to in the content.