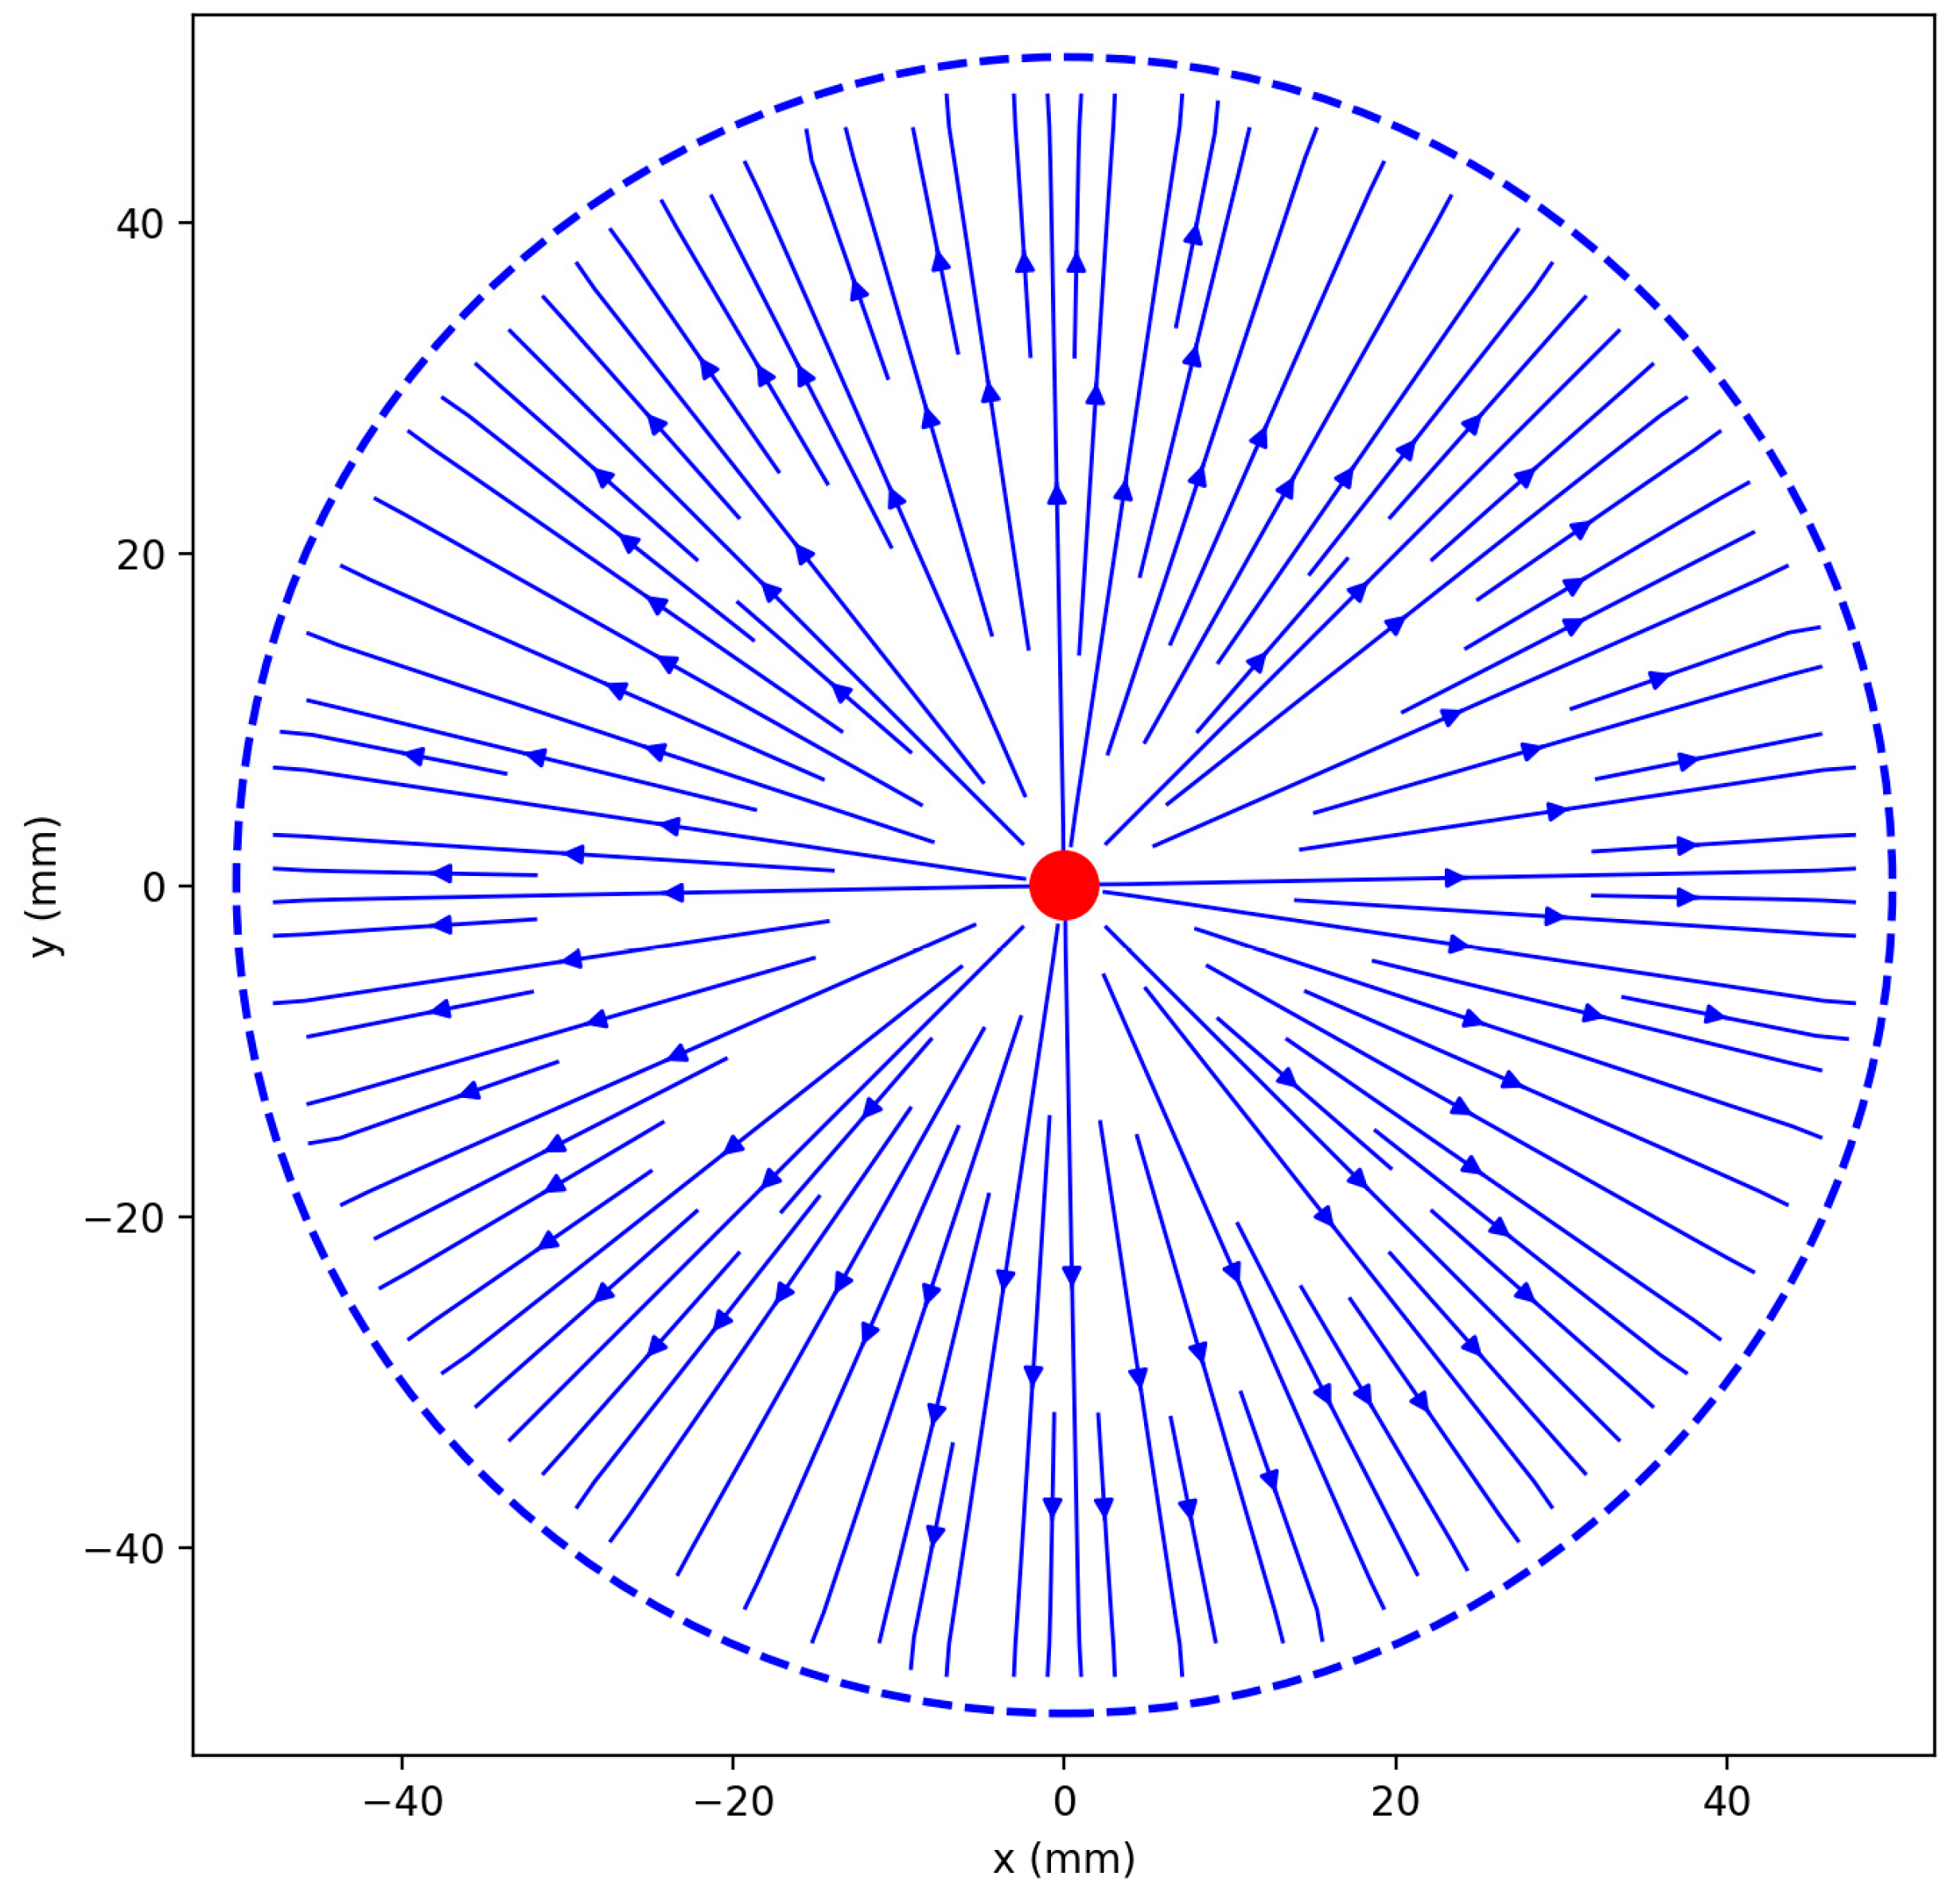
Article

Mathematical Modelling of Electrode Geometries in Electrostatic Fog Harvesters

by
Egils Ginters
1,* and
Patriks Voldemars Ginters
2
1
Information Technology Institute, Riga Technical University, LV-1048 Riga, Latvia
2
Riga State Gymnasium No.1, LV-1050 Riga, Latvia
*
Author to whom correspondence should be addressed.
Symmetry 2025, 17(9), 1578; https://doi.org/10.3390/sym17091578
Submission received: 9 August 2025 / Revised: 10 September 2025 / Accepted: 17 September 2025 / Published: 21 September 2025
(This article belongs to the Special Issue Mathematics: Feature Papers 2025)

Abstract

This paper presents a comparative mathematical analysis of electrode configurations used in active fog water harvesting systems based on electrostatic ionization. The study begins with a brief overview of fog formation and typology. It also addresses the global relevance of fog as a decentralized water resource. It also outlines the main methods and collector designs currently employed for fog water capture, both passive and active. The core of the work involves solving the Laplace equation for various electrode geometries to compute electrostatic field distributions and analyze field line density patterns as a proxy for potential water collection efficiency. The evaluated configurations include centered rod–cylinder, symmetric parallel multi-rod, and asymmetric wire–plate layouts, with emphasis on identifying spatial regions of high field line convergence. These regions are interpreted as likely trajectories of charged droplets under Coulombic force influence. The modeling approach enables preliminary assessment of design efficiency without relying on time-consuming droplet-level simulations. The results serve as a theoretical foundation prior to the construction of electrode layouts in the portable HygroCatch experimental harvester and provide insight into how field structure correlates with fog water harvesting performance.

1. Introduction

1.1. Water Availability and Human Needs

Water availability in arid regions and coastal areas is a major challenge in the context of climate change and sustainable development. According to a report by the United Nations [1], more than 2 billion people worldwide suffer from a lack of access to safe drinking water. The World Health Organization (WHO) and United Nations Children’s Fund (UNICEF) [2] report that this problem is particularly acute in sub-Saharan Africa, where more than 40% of the population does not have access to clean water. In addition, water sources in coastal areas are often contaminated with salt and industrial waste, making freshwater extraction even more difficult. Climate change further exacerbates water shortages in these regions, creating a need for new, sustainable water extraction solutions.
Under normal conditions, a person needs 3–5 L of water per day, depending on their biological sex, age, the environmental conditions and their activity level [3]. Otherwise, dehydration can have serious consequences. Dehydration is a gradual process. Initial symptoms are mild, such as thirst and headaches. In the absence of adequate hydration, it can advance to serious complications, including organ failure or loss of consciousness [3]. Dehydration can impair cognitive performance and mood. Negative effects are observed at body weight losses of 1% or more but are more consistent at 2% or more [4]. Even a modest loss of body mass—2% fluid loss (~1.4 L in a 70 kg individual)—impairs physical performance. At this level, thermoregulation is disrupted and physical capacity declines due to reduced cardiovascular efficiency. When body mass loss reaches 4% or more (~2.8 L), blood volume decreases by over 10%, which significantly limits aerobic work capacity and increases the risk of heat-induced exhaustion [5].
On average, a person can survive without water for about 100 h at approximately 24 °C with minimal physical activity. At 32 °C, however, this time may be halved [6]. Thus, on average, a person can survive without water for about three to five days. This problem is important not only for the general population, but also for travelers and military personnel on missions [7].
One possible solution would be to extract water from the air, especially from fog.

1.2. Fog

Air is a mixture of gases that contains water vapor, which is an invisible gaseous form of water. Water vapor enters the atmosphere when liquid water evaporates from wet surfaces such as soil, bodies of water or plants. When water molecules receive enough heat energy from their surroundings, they gain the kinetic energy required to overcome their mutual attraction and leave the surface of the liquid. Evaporation does not require the surrounding environment to be warmer than the water. It can also occur when temperatures are equal, but evaporation is more intense at higher temperatures. The ability of air to hold water vapor depends on temperature—the warmer the air, the more vapor it can hold. When the air cools, its capacity decreases and, at a certain temperature known as the dew point, the vapor becomes excessive and begins to condense. However, condensation only occurs when there are condensation nuclei in the air—microscopic particles to which water molecules can attach themselves when transitioning to the liquid phase. Under natural conditions, such nuclei are almost always present in the air and can be dust, soil microparticles, sea salt crystals, organic aerosols from plants, bacteria, fungal spores or residues from previous condensation and evaporation cycles. Around these nuclei, vapor forms tiny water droplets with an average diameter of approximately 4–22 µm [8]. Each fog droplet is a condensation nucleus surrounded by a layer of water. The droplets are light enough to remain suspended in the air because the force of gravity is not strong enough to make them fall to the ground immediately. These tiny water droplets can move through the air for a long time, creating a visible phenomenon called fog. The study by Toth et al. [9] provides detailed analytical material justifying the classification types of fog. The most common types of fog are advection fog, also known as sea fog, and radiation fog, which is more prevalent in plains and marshes. Other types of fog include orographic fog or upside fog, which are found in mountainous regions.
However, the definition of ‘fog’ is not clear-cut. So, what is fog, and from which of these can we extract water more or less effectively?
Traditionally, fog is associated with reduced visibility in the surrounding environment. According to Britannica [10], fog is defined as a cloud of small water droplets located close to the ground, dense enough to reduce horizontal visibility to 1000 m or less. The term ‘fog’ also applies to clouds of smoke particles, ice particles, or mixtures of these components. If visibility exceeds 1000 m, the phenomenon is referred to as light fog (mist) or haze. In public meteorological data communications, a visibility threshold of 180 m is considered to be fog [11].
The density of fog determines the liquid water content (LWC) in the air, forming the initial conditions for calculating the operating range of fog water harvesting devices. Gutelpe et al. [12] developed a formula linking LWC to horizontal visibility. However, the included constants are subject to random variation, making experimental measurements a more reliable basis for calculation. Measurements taken by Sanders-Reed and Fenley [13] and Uyeda and Yagi [14] make it possible to establish experimental relationships between visibility distance (in meters) and fog density represented by Liquid Water Content (LWC) (in grams per cubic meter) (see Figure 1).
Based on empirical parameters formulated in maritime navigation [15] and measurements taken by Sanders-Reed and Fenley [13] and Uyeda and Yagi [14], it is possible to determine the fog density classification included in Table 1.
The area highlighted in green in Table 1 can be considered suitable for both passive and active fog water collection methods.

1.3. Fog Water Harvesting Methods

Water in the air can exist in two forms—as vapor (a gas) or as fog (tiny liquid water droplets). Vapor can be condensed on cool surfaces whose temperature is lower than or equal to the dew point to obtain water. This type of atmospheric water generation (AWG) requires a lot of external energy, but the equipment is usually stationary [16]. Today, there are also miniature AWGs that work based on the difference in temperature between night and day. These allow a small amount of water to be stored in a special material at night, which is then released during the day. One gram of the metal–organic framework (MOF) MOF-303 can absorb up to ~0.25 g of water, even at relative humidities of 20–30%. MOF-303 consists of aluminum ions (Al3+) (nodes) and 2,5-pyridinedicarboxylic acid (links) [17,18]. For now, the result is just a few cups or less, as no additional water is stored during the day. The purpose of these devices is not to provide a full water supply, but rather to demonstrate technology that can be scaled up or used in emergency situations in the future.
Fog can be collected mechanically using nets of various sizes (passive method) or via ionization and electrostatic fields (active method) [19].
Passive fog water collection methods do not require any external energy. The design is usually made up of a mesh of different sizes, with a surface area ranging from about 1–4 m2 to 40–54 m2. This is mounted on a frame at a height of 2–4 m [19,20]. Right now, this is the cheapest way to obtain larger quantities of fog water.
Water droplets in the fog collide with the threads of the mesh, merge to form larger droplets, and drain into collection containers. The mesh is usually made of a durable polymer, such as high-density polyethylene. The efficiency of the device depends on the surface structure, manufacturing material and mesh density, as well as the humidity and wind speed conditions. Fog water collection efficiency (1–10%) refers to the proportion of the liquid water contained in fog droplets (LWC) that can be captured by the harvesting device. In practice, reported collection rates are typically in the range of 0.06–0.5 kg/m2/h [19]. Similar productivity data are reported in the study by Azeem et al. [20]. In thick fog and moderate winds, a single 40 m2 collector can provide up to 20 L of water per hour. Smaller collectors can also be used as portable solutions. To improve water runoff, the screens can be coated with water-repellent (hydrophobic or superhydrophobic) materials, or biomimetic materials that mimic natural flora and fauna. While such coatings significantly increase efficiency by promoting faster droplet coalescence and drainage, they also significantly increase the cost of the device. Fog harvesting efficiency can then increase by up to 30%, with a water collection rate of 0.95–1.5 kg/m2/h [19].
A significant problem with passive fog water collection devices is their size, which can cause issues during hikes, expeditions and military missions as they expose the user’s location in nature. Larger structures require stable anchoring and are more difficult to transport. Passive systems are generally simple, sustainable and environmentally friendly, but their effectiveness depends on climatic conditions, the properties of the mesh covering and regular cleaning. The successful operation of passive fog water collection devices depends critically on meteorological conditions. The above yield data are for dense fog, but under mist and moderate fog conditions (see Table 1), the yield will be at least two or more times lower [21] and negligible in calm conditions. This is where the main problem arises, as thick fog and even moderate wind are incompatible.
However, there are also alternative designs. Traditionally, passive fog water collection nets use both vertical and horizontal threads. However, horizontal threads can interfere with the natural gravity-driven flow of collected fog water, and cleaning these nets can be complicated. Passive fog water collection devices can be constructed using vertical collector threads arranged in a harp shape [22]. An experimental harp-type design by Virginia Tech [22,23] at Kentland Farm (Blacksburg, VA, USA) outperformed passive mesh devices by at least 30% in thick fog, and also collected water from thin and moderate fog, which mesh designs cannot do. While the harp-shaped design clearly provides higher water collection efficiency, the main problem is securing the larger mesh and ensuring the durability of the structure.
Active fog water collection methods are based on ionizing fog droplets in an electrostatic field. Atoms and molecules are usually electrically neutral. However, when this balance is disrupted, a charged particle called an ion is created. Ions are formed naturally in the atmosphere, for instance when ultraviolet or cosmic radiation ionizes air molecules, or as a result of friction or radioactive processes. Consequently, many fog droplets carry a slight charge, enabling them to be guided by an electrostatic field. However, natural ionization is not sufficient for effective fog water collection, so the droplets must undergo forced ionization. In an electrostatic field, electrons move towards the positively charged electrode, knocking electrons out of neutral atoms along the way and forming positively charged fog droplets. These positively charged droplets are then drawn along the field lines towards the collector electrode. For current to flow in an electrostatic field, the dielectric resistance of the air gap must be overcome.
Active fog water collection in an electrostatic field can be 50–90% efficient, with a water collection rate of 3.2–5.6 kg/m2/h [19].
The efficiency of an active fog water harvester, as well as the amount of water collected, is determined by a variety of factors, including the geometry of the electrodes. The geometry of the electrodes ensures the transfer of ionized fog droplets from the discharge electrodes to the collectors, where the water accumulates. The authors are working on a prototype of a portable fog water harvesting device HygroCatch. This device is based on the ionization of fog droplets in an electrostatic field, which makes the correct placement of the electrodes fundamentally important. Correctness in this context refers to a configuration where the electrostatic field is densest in the collection zone, where unnecessary symmetries or weak-field regions are avoided, and where the geometry ensures maximum water collection at minimal energy input. Furthermore, electrode geometry should provide compact and modular dimensions, acceptable device weight, and low noise level. In this way, the geometry of the electrodes determines not only the volume of water collected, but also the overall efficiency and practicality of the device.
This article aims to identify and compare the most common electrode configurations in fog harvesters by modeling and analyzing the topology of electrostatic field lines. This study provides insight into the mathematical modeling of electrostatic fields, serving as a reference for developers of active fog water harvesters.

1.4. Configurations of Electrodes in Fog Water Harvesters

Cruzat and Jerez-Hanckes [24] described an active fog water collection device prototype consisting of two concentric cylindrical electrodes. The inner discharge electrode was a 14 mm radius copper tube to which a 40 kV DC voltage is applied. The outer collector electrode was a grounded, air-permeable metal mesh with an 85 mm radius. The device was 50 cm high (see Figure 2). In the field conditions at Campo Aldea in Chile, the device’s fog water collection rate was 1.368 kg/m2/h. This was 60% more effective than a passive fog collector with a 1 × 1 m Raschel screen installed at a height of 2 m [24].
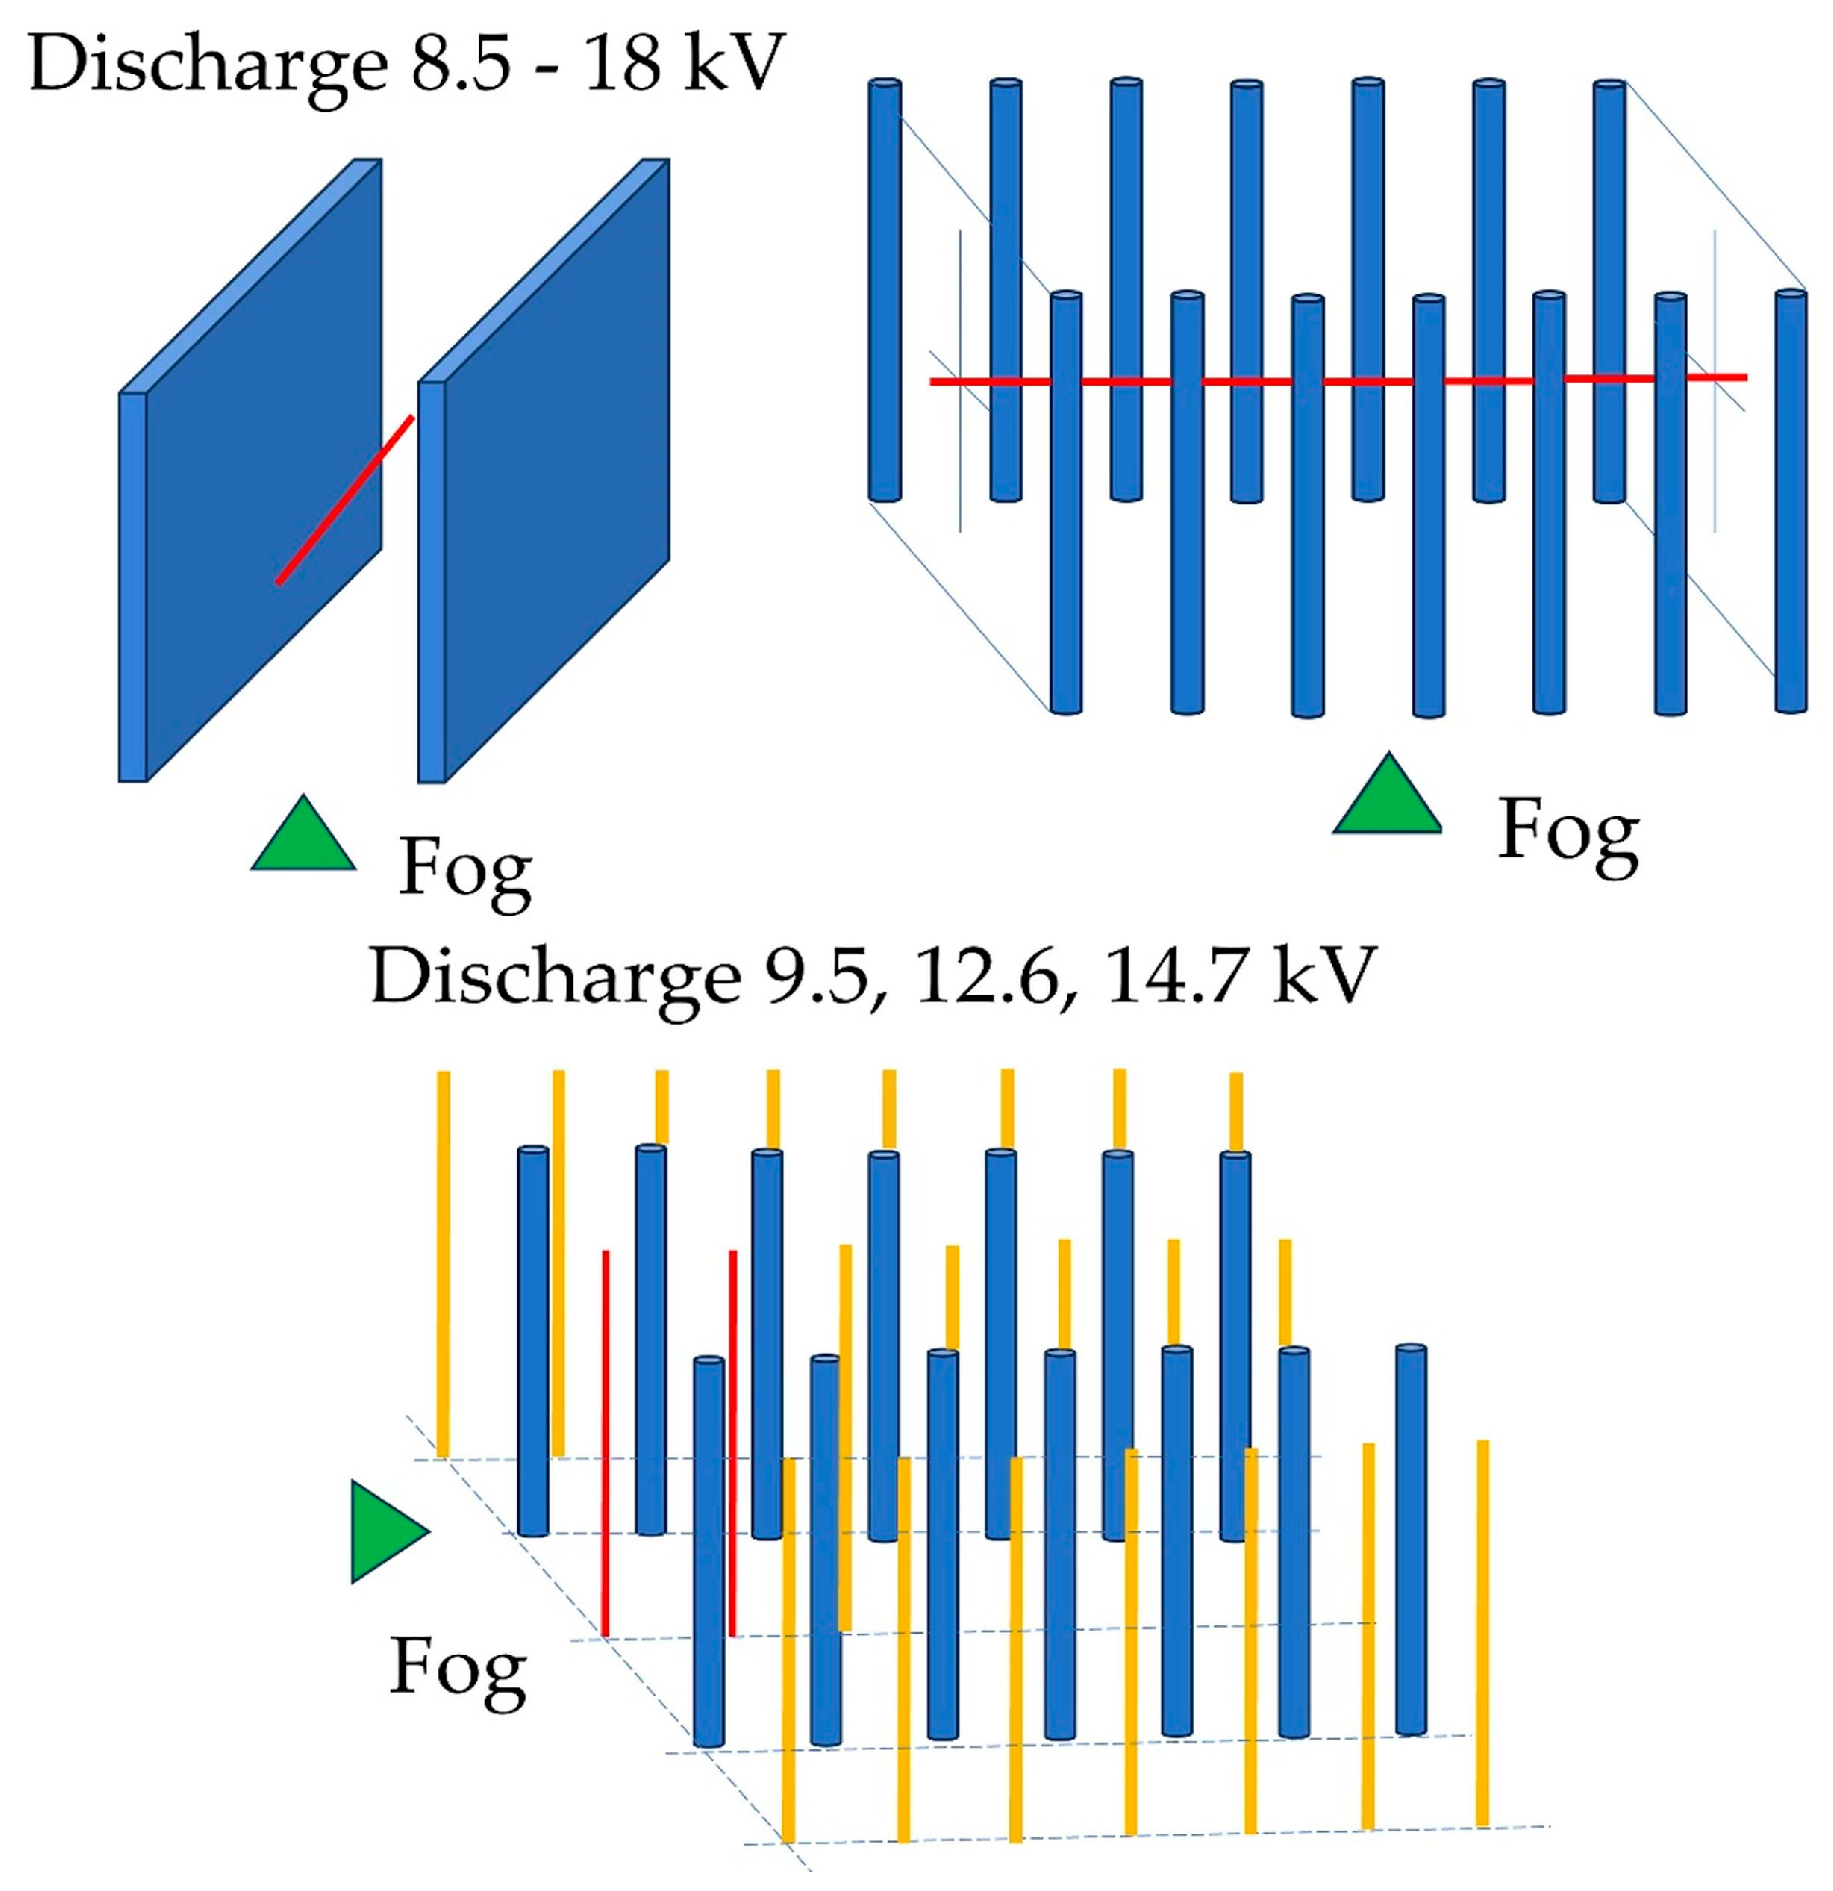
Jiang et al. [25] conducted a multi-stage experiment involving various electrode configurations and fog flow orientations, aiming to identify the most effective solution based on fog water collection efficiency. The fog flow velocity was 1.5 m/s, with an average droplet diameter of 7.5 μm. The discharge electrodes had a diameter of 0.2 mm. Initially, they considered a 100 × 100 mm symmetry planes collector with a horizontal wire discharge electrode, into which the fog flowed from below (see Figure 3). The distance between the planes was 54 mm. Discharge voltages of 8.5–18 kV DC were used. This solution could in fact be transformed into a row of collector rods to reduce the surface area. Further transformation of the solution resulted in a complex, difficult-to-adapt, two-stage electrostatic fog harvester design using vertically discharging, repelling and collector rods of various diameters (see Figure 3). The 2 mm repelling electrodes (orange) did not perform ionization, but rather steered the fog water droplets in the electrostatic field. The collector rods had a diameter of 7 mm and a length of 440 mm. The distance between the five rows of different types of electrodes, as well as between adjacent electrodes, was 25 mm. Discharge voltages of 9.5 kV DC, 12.6 kV DC and 14.7 kV DC were used. Under laboratory conditions, the efficiency of the fog harvester was approximately 88% at 12.6 kV DC and 92.4% at 14.7 kV DC. However, no data is provided on the amount of water collected. In this case, the efficiency of the equipment is not analyzed in terms of external energy consumption. Doubts arise due to the fog flow speed of 1.5 m/s because fog cannot be concentrated or sustained at this wind speed in a real environment.
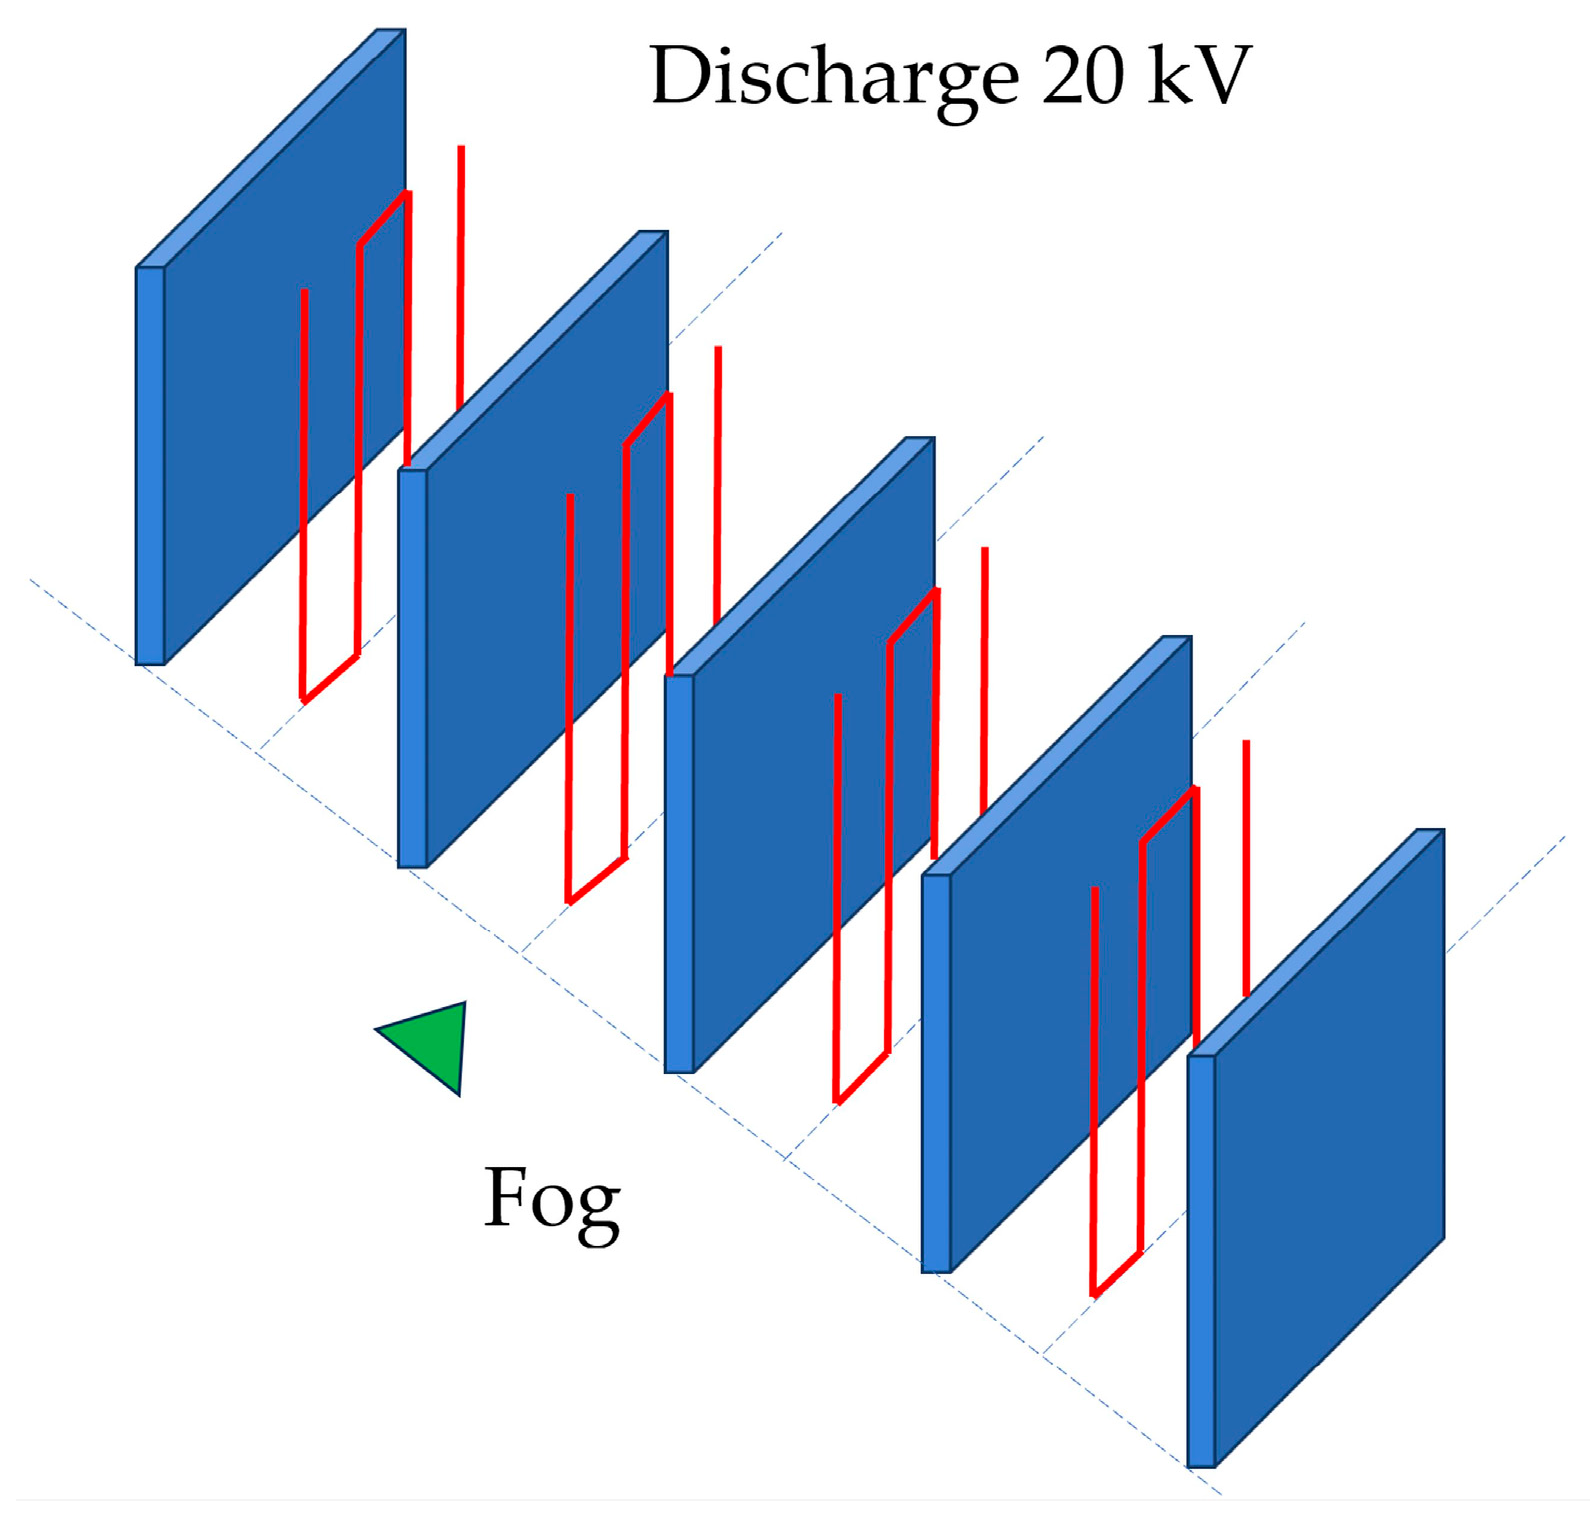
Zeng et al. [26] described an electrostatic fog collection device with a ‘multiwire-to-plate’ electrode structure. Each of the four discharge electrodes is made of stainless-steel rods (wires), while the collector consists of five aluminum alloy plates (see Figure 4). The three plates are used to collect mist water on both sides, while the two collector plates are only used on their inner surfaces. The discharge rod had a diameter of 0.2 mm, whereas the collector plate was 60 cm long and 60 cm high, positioned 75 mm away from the discharge electrode. The distance between the discharge electrode rods varied from 6 to 15 cm. The discharge voltage was 20 kV DC and the achieved water collection rate was 131.9 g/min or 7.914 kg/h. According to the effective collection surface used in the experiment (2.88 m2), this corresponds to a water collection intensity of ~2.75 kg/m2/h. Four ultrasonic nozzles generated the mist, consuming 212.4 g of water per minute and ensuring a mist flow velocity of 1.06 m/s. Such a fog flow velocity could be true. This means that ~62% of all generated fog water was collected on the collector surfaces.
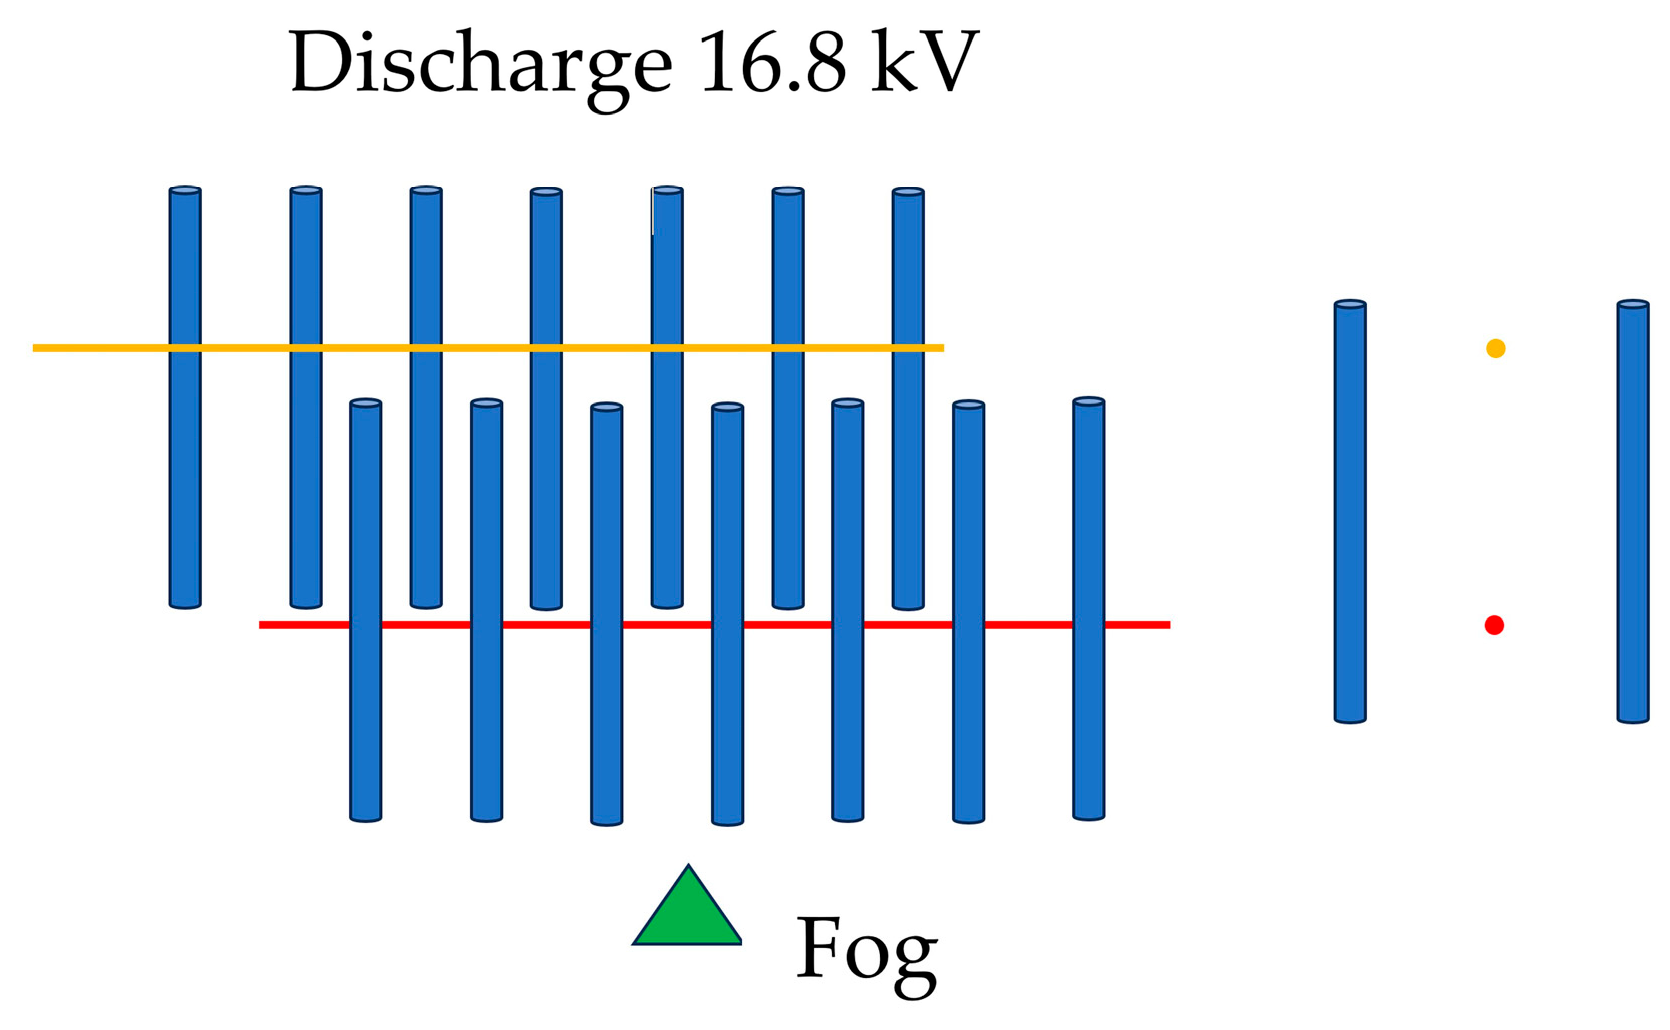
Jiang et al. [27] have described a similar solution with a horizontal discharge electrode rod and two vertical rod-shaped collector planes (see Figure 5). The device employed a multi-stage electrode configuration, featuring a discharge electrode with a diameter of 0.2 mm and a vertical collector rod with a diameter of 7 mm. The collector electrodes were arranged in two rows, with an inter-rod distance of 25 mm. The collector electrodes were 30 cm long. The distance between the discharge electrode and the collector rows was 40 mm. The discharge voltage was 16.8 kV DC. The fog flow velocity was approximately 1.3 m/s. The system is characterized by a bottom-entry configuration for incoming fog. Unfortunately, no quantitative data on the amount of collected fog water is provided.
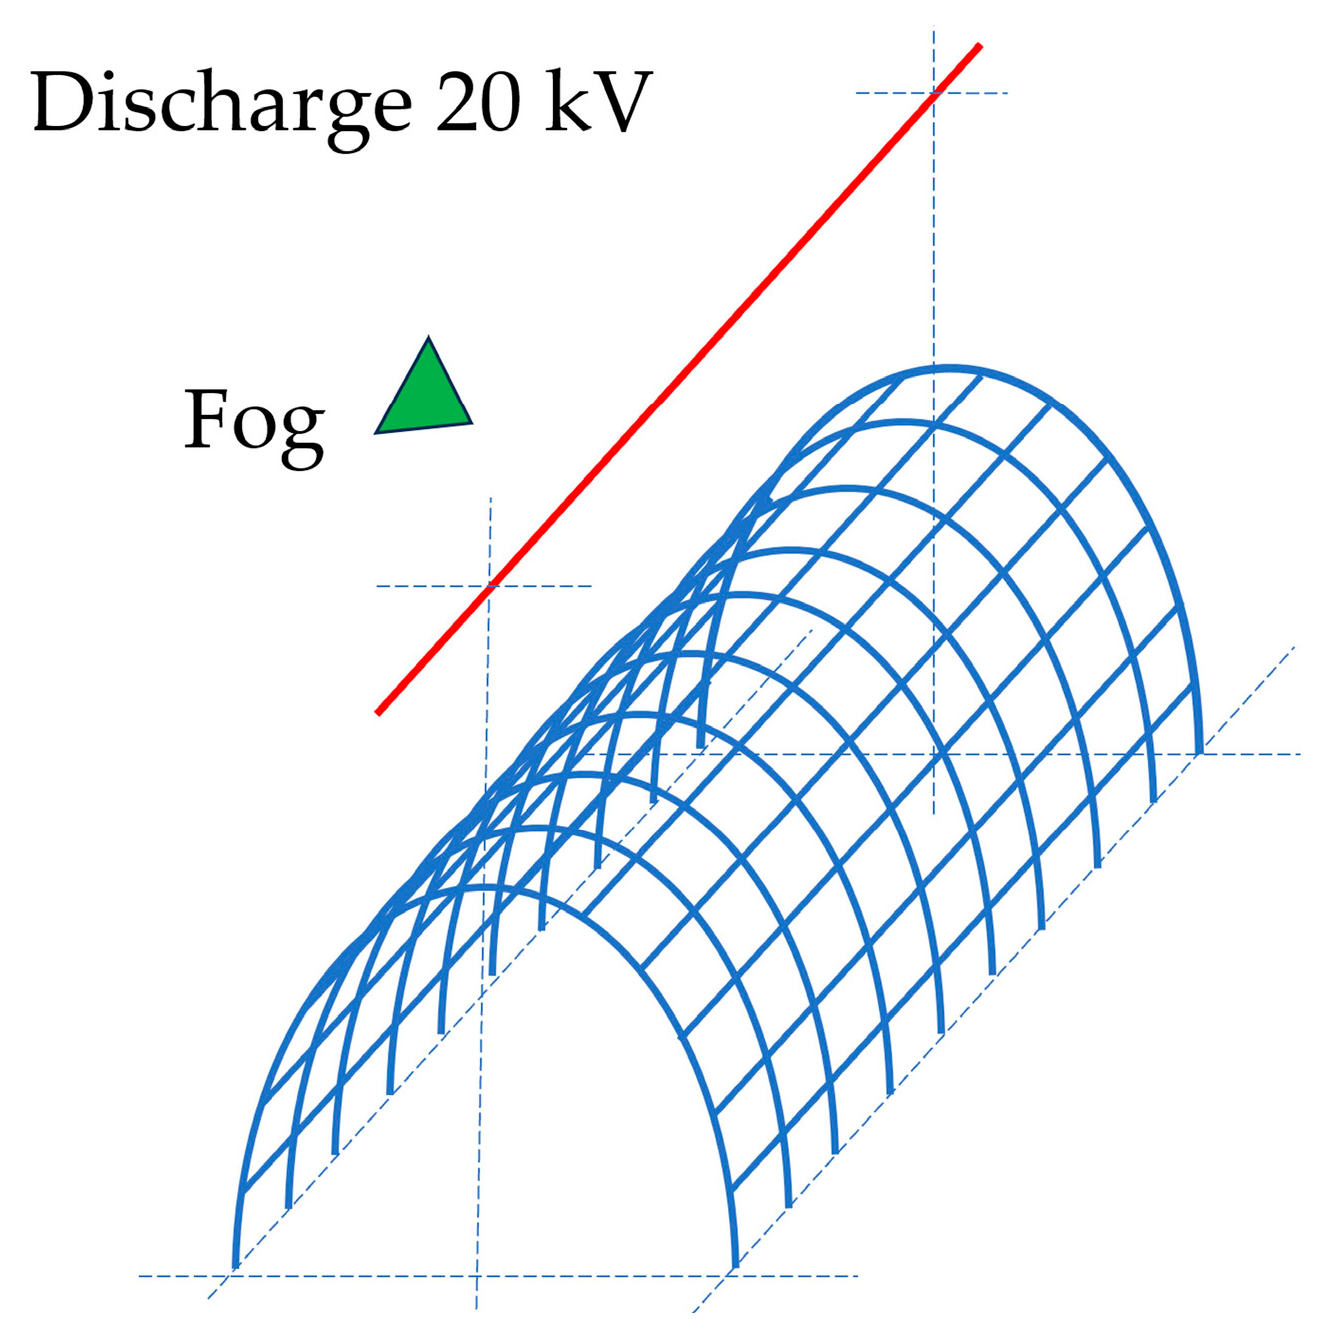
In the experiments described by Damak and Varanasi [28] and illustrated with video footage from the Plasma Channel [29], the performance of various fog water harvester electrode configurations was evaluated. One of the electrode geometries described and demonstrated in the video consists of one or two horizontal, rod-shaped (wire) discharge electrodes and a horizontal, halved pipe collector made of steel mesh, placed underneath them (see Figure 6).
The diameter of the discharge electrode was approximately 1 mm. The distance from the discharge electrode to the collector was 20 mm. At a discharge voltage of 20 kV DC, the water collection rate was 540 g/h. Assuming the collector layout is approximately 58 cm long and 23 cm wide, the fog water collection intensity could be ~4.05 kg/m2/h. Additionally, the authors maintained a reliable fog flow speed of no more than 1 m/s.
Li et al. [19] examine similar solutions based on grid-type collectors, maintaining the analogy with passive fog collection devices.
Based on the above analysis, three main types of electrode configurations can be identified:
  • A vertical concentric cylindrical mesh collector with a central vertical rod-type discharge electrode;
  • A collector comprising two or more vertical rows of rods with a vertical or horizontal discharge electrode row positioned between the collector rows;
  • A horizontal mesh collector in the form of a pipe or halved pipe with horizontal wire-type discharge electrodes positioned above.
It can be expected that the efficiency with which water droplets are collected is determined by the density and orientation of the electrostatic field lines corresponding to the electrode configuration, as well as by the number and design of the electrodes, which define the active fog water collection area.

2. Methodology

According to Smythe [30] (p. 2), electric field lines characterize the direction of the Coulomb force acting on a positive charge:
F = 1 4 π ε 0 · q 1 q 2 r 2 · r ^
where F —The Coulomb force vector (directed from q 1 to q 2 ); q 1 , q 2 —point charges (where q 1 produces the field); r —distance between the charges; r ^ —unit vector from q 1 to q 2 (indicates the direction of the force); ε 0 —vacuum permittivity ~ 8.854 × 10⁻¹² F/m.
On the other hand, the electrostatic field strength E [31] (p. 60; (2.3), Section 2.1.3 “The Electric Field”) characterizes the Coulomb force F acting on a positive point charge and indicates its direction:
F = q 2 · E
From Equation (2), it follows that
E = F q 2 = 1 4 π ε 0 · q 1 r 2 · r ^
and E is the electric field strength at the given point.
Equation (3) describes a situation with point charges in simple distributions, in vacuum and over an infinite plane, where boundary effects are absent. In a fog harvester, the electrostatic field operates in a finite domain, and the electrodes are not points but polygons.
When computing the electric field distribution across a larger domain with specified boundary conditions, the potential V x , y is evaluated at every point in the XY-plane, referenced to a fixed potential value at a designated point.
The electric field strength E x , y is related to the potential V x , y by the gradient formula [30] (p. 5):
E x , y = V x , y
where V = V x , V y .
The electric field is assumed to be stationary, i.e., time-invariant, while its strength and direction vary across different points in the XY-plane.
Equation (4) is sufficiently universal and defines the electric field strength as the negative vector gradient of the potential, indicating the direction of the maximum rate of decrease in the potential.
If the representation of the electric field in the fog harvester is simplified and reduced to a projection onto the XY plane, then
E x , y = E x x , y , E y x , y
where E x x , y —the projection of the field onto the X-axis at point x , y (hereafter denoted as E x ), but E y x , y —the projection of the field onto the Y-axis at point x , y (hereafter denoted as E y ), and E x , y = E x , E y , then hereafter E x = V x and E y = V y , but the field strength at point x , y is E x , y = E x 2 + E y 2 .
The angle θ of the field direction relative to the X-axis can be calculated in radians using the two-argument arctangent function a t a n 2 , which ensures the correct sign of the angle in all four quadrants of the XY plane [32]:
θ = a t a n 2 E y , E x
where θ ° = a t a n 2 E y , E x · 180 / π , and
a t a n 2 E y , E x = arctan E y E x ,   E x > 0 arctan E y E x + π , E x < 0 , E y 0 arctan E y E x π , E x < 0 , E y < 0 π 2 , E x = 0 , E y > 0 π 2 , E x = 0 , E y < 0 0 , E x = 0 , E y = 0
If the space contains no free charges, the potential function V x , y satisfies the Laplace equation [33] (p. 34; (1.29), Section 1.7 “Poisson and Laplace Equations”):
2 V x , y = 0
where 2 —the scalar differential operator known as the Laplacian. In two dimensions, it is given explicitly as
2 V x , y = 2 V x 2 + 2 V y 2 = 0
where 2 V x 2 —the curvature of the potential field along the X direction, and 2 V y 2 —the curvature of the potential field along the Y direction.
Equation (7) applies in situations where the field is determined by boundary conditions, and no free charges are present within the field to alter it from the inside. The charge density at any point (x, y) between the electrodes is zero. This corresponds to the pre-ionization state, that is, before the air gap between the electrodes breaks down. The field lines indicate the direction in which ionized free charges (fog water droplets) will move. The presence of corona may distort the lines, but it does not significantly alter the overall field structure.
The XY grid of the fog harvester’s electrode coordinate space is too coarse. To visualize the electrostatic field lines more clearly, the XY coordinates are transformed to a finer grid, increasing the number of computation points, specifically
x i = x 0 + i · h ,   i = 0 , 1 , , N x 1
y j = y 0 + j · h ,   j = 0 , 1 , , N y 1
where x 0 , y 0 —reference origin, but i , j —indices, h —grid spacing and grid dimensions N x   ×   N y define the resolution.
To approximate the electrode potential function V i , j as an infinite series using its derivatives at a single point, the Taylor series are employed [34] (p. 82; (B4.1.1), Section 4.1 “The Taylor Series”).
Then, for the potential grid, the point to the right along the X-axis is as follows:
V i + 1 = V i + h V i + h 2 2 V i + h 3 6 V i 3 +
and the point to the left along the X-axis is
V i 1 = V i h V i + h 2 2 V i h 3 6 V i 3 +
The corresponding series sum is
V i + 1 + V i 1 = 2 V i + h 2 V i +
It can be assumed that V i 2 V x 2 and V j 2 V y 2 . Then 2 V x 2 V i + 1 , j 2 V i , j + V i 1 , j h 2 at j = c o n s t , but 2 V y 2 V i , j + 1 2 V i , j + V i , j 1 h 2 at i = c o n s t .
Substituting the second-order derivatives into the Laplace Equation (8) V i + 1 , j 2 V i , j + V i 1 , j h 2 + V i , j + 1 2 V i , j + V i , j 1 h 2 = 0 and multiplying both sides by h 2 yields the update formula for V i , j , which is the arithmetic mean of its four neighbours (above, below, left, and right):
V i , j = 1 4 V i + 1 , j + V i 1 , j + V i , j + 1 + V i , j 1
Based on this result, all grid points are updated iteratively to compute the potential values V i , j . The potential remains fixed for the set of points defining the electrode geometry and the boundaries of the two-dimensional space.
From the field gradient Equation (4), it follows that E x = V x and E y = V y . The first derivative of the potential function from the Taylor series (10)–(11) is approximated as V x V i + 1 , j V i 1 , j 2 h and V y V i , j + 1 V i , j 1 2 h . According to Equation (4), these derivatives approximate the field strength projections along the XY axes at point (i, j):
E x i , j V i + 1 , j V i 1 , j 2 h   and   E y i , j V i , j + 1 V i , j 1 2 h
The vector field is then constructed accordingly:
E i , j = E x i , j ,   E y i , j
where the field strength is the magnitude of the vector E i , j = E x i , j 2 + E y i , j 2 .
After computing the field strength matrix, the (i, j) coordinate grid is transformed back to the (x, y) plane, and the field lines E x , y can be plotted.
Python 3.13.7 libraries are used to plot the electric field strength E lines. These field lines represent the value and direction of the Coulomb force acting on a charge in the electrostatic field.
The algorithm of the modeling software by Ginters and Ginters [35] includes several basic steps.
1.
Libraries.
The following Python libraries are loaded for calculation and visualization:
  • numpy—for mathematical and matrix operations;
  • matplotlib.pyplot—for plotting graphs;
  • scipy.sparse.lil_matrix—to construct the difference operator matrix A for solving the Laplace equation;
  • scipy.sparse.spsolve—to compute the potential distribution V i , j by solving A · V = b , where b represents boundary conditions;
  • matplotlib.patches and matplotlib.lines—for customizing the plot legend.
2.
Generating the coordinate grid of electrode field potentials.
A regular N × N grid is created, with each side measuring L , and the distance between two adjacent points on the X and Y axes, h , is calculated. An array of coordinates is then created along the X and Y axes, with a reference point located at the centre of the array and defined as ( x 0 = 0 , y 0 = 0 ).
3.
Formulation of initial conditions.
The initial conditions of the task have been determined, including the position and geometric contours of the discharge electrode and collector in the grid, and the magnitude of the positive potential on the discharge electrode and the potential on the grounded collector.
4.
Definition of electrode masks.
Electrode polygon masks are created by defining point sets within the grid that represent the geometric contours of the electrodes. Each mask consists of a collection of small circular elements.
5.
Grid and boundary initialization.
The previously defined N × N potential grid is initialized by assigning zero potential to all points. The next step sets the potentials for the electrode points, assigning fixed values according to the Dirichlet boundary conditions, where the potential on the boundary is held constant [33] (p. 37; Section 1.9 “Uniqueness of the Solution with Dirichlet or Neumann Boundary Conditions”).
6.
Definition of a sparse matrix and Laplacian representation on the grid.
A sparse square matrix A of size N 2 × N 2 is created. A boundary condition vector b of length N 2 is defined and initialized to represent the electrode and edge potentials. Each point in matrix A is examined to determine whether it belongs to an electrode or lies outside. Points corresponding to electrodes and grid edges are assigned fixed potential values. The discrete form of the Laplacian, derived from Equation (13), is implemented on the grid:
4 V i , j + V i + 1 , j + V i 1 , j + V i , j + 1 + V i , j 1 = 0
7.
Computation of grid potential values.
The previously defined system of equations A · V = b is solved using the spsolve function, which is equivalent to solving the Laplace equation. This yields N 2 potential values V i , j . The potential remains fixed for the point sets representing the electrodes and grid boundaries.
8.
Calculation of field strength projections onto the X and Y axes at grid points.
Using the numpy.gradient function, the values E x i , j and E y i , j are computed from the potential matrix V i , j . A transition from the i , j coordinate grid to the x , y grid is performed to determine the field vector E x , y .
9.
The visualization of the electrode region projection and the field lines.
The electrodes are marked on the coordinate grid: the discharge electrode is shown in red and the collector in blue. Unit normalization is applied, and the field lines E x , y are visualized using streamplot, based on the E x and E y arrays.
The algorithm is explained in terms of a software that provides field line modeling of a horizontal mesh collector in the form of a pipe or halved pipe with horizontal wire-type discharge electrodes positioned above (third configuration).

3. Results and Discussion

The aim of modeling is to perform a qualitative analysis of the geometry of the electrode space. Determining quantitative parameters is not the primary objective, so specific electrode dimensions are not significant in this case.
In a concentric cylinder configuration (see Figure 7), the electric field is directed radially from the central discharge electrode to the surrounding collector cylinder at an angle of 360°. The field concentration is dispersed. The collector walls create a fog barrier. While the efficiency of a single device is low, a combination of several devices is neither compact nor portable.
In a multi-row electrode configuration (see Figure 8), the electric field is utilized effectively. Field lines from the discharge electrode act on both rows of collector electrodes simultaneously. The field is sensitive to the precise positioning of the electrodes along the axis. The fog flow path is open. Collected water flows down under the influence of natural gravity and encounters no resistance. This configuration can easily be expanded, and it is possible to create a compact device design.
When using a horizontal wire discharge electrode and a half-tube grid collector below (see Figure 9), only vertically downward-pointing electrostatic field lines are effectively used.
While a better fog flow path is provided than in the concentric cylinder variant, the ionization space is narrow. The design is simple to construct.
A summary of the evaluation of electrode geometries is presented in Table 2 (the green color is to mark the object of our further research).
When evaluating the three electrode space configurations mentioned above, it can be seen that Damak and Varanasi [28] fog water collection results (~4.05 kg/m2/h) are significantly higher than those reported by Zeng et al. [26] (~2.75 kg/m2/h). However, these results are not comparable because Zeng et al. [26] use planes for water collection, which increase the calculated area of the water collection collector surface. When evaluating the efficiency of the configuration, the amount of collected fog water should be treated with caution, as the vast majority of experiments are conducted under laboratory conditions, which are characterized by artificial fog and increased fog flow velocity.
Artificial fog is extremely homogeneous, with smaller droplets than real fog. This makes it easier for them to move in an electrostatic field, resulting in significantly better fog water collection than in a real environment. One debatable issue is the speed of the fog flow used in the experiments. Increasing the speed allows a larger amount of fog to pass through the electrode space, which can increase the amount of water collected several times over. However, fog flow speeds exceeding 1 m/s are rare in nature, because wind and, for example, radiation fog are incompatible phenomena. In this case, it is important not to equate fog with clouds, which can be found in mountainous environments in fairly strong winds but are not fog. Clouds have a significantly higher LWC, typically in the range of 0.5–2.5 g/m3, and saturation resembles light rain more than fog. This means that these fog water harvesters, which perform well in windy conditions, will only work well in clouds.
Active harvesters can be made compact and portable, which is important for both expeditions and military applications. However, they require energy to operate, so it is important to minimize energy consumption per unit of water obtained, while keeping the size and weight of the equipment as small as possible. The higher the discharge voltage, the greater the power consumption. The different ionization voltages used in experiments by authors such as Jiang et al. [25] and others give rise to debate. These differences are determined by objective factors, specifically the geometry of the electrode space.
For example, Cruzat and Jerez-Hanckes [24] used a concentric cylinder variant with a discharge voltage of 40 kV DC. However, in this case, they had to overcome an air gap of around 70 mm. Reducing this distance would reduce the already limited fog ionization space, which is defined by the cylindrical collector, and result in negligible fog water collection. As a result, the field lines are scattered and their density at the collector decreases, which does not promote the successful pulling of fog droplets towards the collector. On the other hand, the aforementioned design is one of the few that has actually been tested in real conditions. It is believed that in a laboratory, where the artificial fog flow would be purposefully directed in the desired direction, the device would provide significantly better fog water collection results.
When the discharge voltage reaches the air gap breakdown threshold, air ionization begins and fog droplets are drawn towards the collector. Does increasing the discharge voltage also increase the amount of water collected? Yes and No.
On the one hand, a higher discharge voltage provides a stronger field, creating a more convincing movement of fog droplets towards the collector. A higher discharge voltage gives free electrons greater kinetic energy, producing better ionisation results. In other words, the volume of well-ionised fog droplets increases and they are drawn along the field lines to the collector. However, strong ionisation can cause charged fog droplets to repel each other and even create an ion wind that will deflect the fog droplets from their field line trajectories, i.e., away from the collector. To address this issue, repelling electrodes [25] can be employed to steer the electrostatic field. However, this makes the design more specific, sophisticated and complex.
Experiments conducted by Zeng et al. [26] have shown that by increasing the discharge voltage by 100% from a minimum of 10 kV DC to 20 kV DC, the amount of fog water obtained can be increased to a useful maximum, i.e., to a point where additional energy consumption no longer significantly increases the amount of water collected. Damak and Varanasi [28] and Plasma Channel [29] also use a discharge voltage of 20 kV without any specific explanation, but it is possible that the aim of their experiments was not to find the most energy-efficient solution.
However, Jiang et al. [25] experimentally found that increasing the discharge voltage by approximately 30% from 9.5 kV DC to 12.6 kV DC can increase the amount of water obtained by 24%. However, the usefulness of the next step, which increases the amount of water obtained by only 4% but increases the voltage to 14.7 kV DC, is debatable. The simulation results obtained by Jiang et al. [25] do not correspond well with their experimental results, i.e., the simulation shows only a general trend.
Each electrode configuration has its advantages and disadvantages, but field line modeling proves the experimental studies discussed earlier and confirms that a fog harvester comprising vertical rows of rods with a vertical discharge electrode row positioned between the collector rows is one of the most effective and portable solutions for collecting fog water.
However, analysis of experiments and simulations conducted by various authors reveals some uncertainties in the understanding of physical processes and stochasticity in the interval from the onset of ionization to saturation, as these processes are influenced by both the geometry of the electrode space and environmental conditions. This currently hinders the development of universal analytical models.

Author Contributions

Conceptualization, E.G. and P.V.G.; methodology, E.G.; software, E.G. and P.V.G.; validation, P.V.G.; investigation, P.V.G.; writing—original draft preparation, E.G. and P.V.G.; writing—review and editing, E.G.; supervision, E.G.; project administration and funding, E.G. All authors have read and agreed to the published version of the manuscript.

Funding

This research received no external funding.

Data Availability Statement

The modeling software in Python is located in the Zenodo repository and can be found at https://doi.org/10.5281/zenodo.16729796, accessed on 18 September 2025.

Conflicts of Interest

The authors declare no conflicts of interest.

Abbreviations

The following abbreviations are used in this manuscript:
WHOWorld Health Organization
UNICEFUnited Nations Children’s Fund
LWCLiquid water content
AWGAtmospheric water generation
MOFMetal–organic framework
DCDirect current

References

  1. United Nations. The United Nations World Water Development Report 2023: Partnerships and Cooperation for Water; UNESCO: Paris, France, 2023; Available online: https://unesdoc.unesco.org/ark:/48223/pf0000384655 (accessed on 8 August 2025).
  2. World Health Organization (WHO); United Nations Children’s Fund (UNICEF). Progress on Household Drinking Water, Sanitation and Hygiene 2000–2020: Five Years into the SDGs; WHO and UNICEF: Geneva, Switzerland, 2021; Available online: https://data.unicef.org/resources/progress-on-household-drinking-water-sanitation-and-hygiene-2000-2020/ (accessed on 8 August 2025).
  3. Yamada, Y.; Zhang, X.; Henderson, M.E.T.; Sagayama, H.; Sekine, Y.; Tanaka, H.; Sagayama, R.; Fudge, B.W.; McCurry, K.; Speakman, J.R.; et al. Variation in Human Water Turnover Associated with Environmental and Lifestyle Factors. Science 2022, 378, 909–915. [Google Scholar] [CrossRef] [PubMed]
  4. Lieberman, H.R. Hydration and Cognition: A Critical Review and Recommendations for Future Research. J. Am. Coll. Nutr. 2007, 26 (Suppl. S5), 555S–561S. [Google Scholar] [CrossRef] [PubMed]
  5. Cheuvront, S.N.; Kenefick, R.W.; Charkoudian, N.; Sawka, M.N. Physiologic Basis for Understanding Quantitative Dehydration Assessment. Am. J. Clin. Nutr. 2013, 97, 455–462. [Google Scholar] [CrossRef] [PubMed]
  6. Piantadosi, C.A. The Biology of Human Survival: Life and Death in Extreme Environments; Oxford University Press: New York, NY, USA, 2003; ISBN 9780195165012. [Google Scholar]
  7. Montain, S.J.; Ely, M. Water Requirements and Soldier Hydration; Borden Institute, Walter Reed Army Medical Center, US Army Medical Department Center & School: Washington, DC, USA, 2010; Available online: https://medcoeckapwstorprd01.blob.core.usgovcloudapi.net/pfw-images/borden/HydrationPDF.pdf (accessed on 8 August 2025).
  8. Niu, S.; Lu, C.; Yu, H.; Zhao, L.; Lü, J. Fog Research in China: An Overview. Adv. Atmos. Sci. 2010, 27, 639–662. [Google Scholar] [CrossRef]
  9. Toth, G.; Gultepe, I.; Hansen, B.; Milbrandt, J.; Pearson, G.; Fogarty, C.; Burrows, W. The Environment Canada Handbook on Fog and Fog Forecasting; Technical Report No. En56-231/2010E; Environment Canada, Meteorological Service of Canada: Toronto, ON, Canada, 2010; Available online: https://publications.gc.ca/collections/collection_2011/ec/En56-231-2010-eng.pdf (accessed on 8 August 2025).
  10. Encyclopedia Britannica. Fog. 2025. Available online: https://www.britannica.com/science/fog (accessed on 8 August 2025).
  11. Met Office. What Is the Difference Between Mist, Fog and Haze? Met Office. Available online: https://weather.metoffice.gov.uk/learn-about/weather/types-of-weather/fog/difference-mist-and-fog (accessed on 8 August 2025).
  12. Gultepe, I.; Tardif, R.; Michaelides, S.C.; Cermak, J.; Bott, A.; Bendix, J.; Müller, M.D.; Pagowski, M.; Hansen, B.; Ellrod, G.; et al. Fog Research: A Review of Past Achievements and Future Perspectives. Pure Appl. Geophys. 2007, 164, 1121–1159. [Google Scholar] [CrossRef]
  13. Sanders-Reed, J.N.; Fenley, S.J. Visibility in Degraded Visual Environments (DVE). In Proceedings of the SPIE, 10642, Degraded Environments: Sensing, Processing, and Display 2018, Orlando, FL, USA, 17–18 April 2018; International Society for Optics and Photonics: Bellingham, WA, USA, 2018; p. 106420S. [Google Scholar] [CrossRef]
  14. Uyeda, H.; Yagi, T. The Character of Sea Fog in the Urban Area of Kushiro City, Eastern Hokkaido. J. Meteorol. Soc. Jpn. 1984, 62, 917–928. [Google Scholar] [CrossRef]
  15. Turkish Straits Information. Visibility Table. Available online: https://www.turkishstraits.com/info/visibilitytable (accessed on 14 April 2025).
  16. Luta Air. Atmospheric Water Generator LT-AWG80G (1330 W, 50 kg). Available online: https://www.lutaair.com/lt-awg80g/ (accessed on 8 August 2025).
  17. Kim, H.; Yang, S.; Rao, S.R.; Narayanan, S.; Kapustin, E.A.; Furukawa, H.; Umans, A.S.; Yaghi, O.M.; Wang, E.N. Water Harvesting from Air with Metal-Organic Frameworks Powered by Natural Sunlight. Science 2017, 356, 430–434. [Google Scholar] [CrossRef] [PubMed]
  18. Leven, R. Hand-Held Water Harvester Powered by Sunlight Could Combat Water Scarcity; UC Berkeley College of Computing, Data Science, and Society: Berkeley, CA, USA, 2023; Available online: https://cdss.berkeley.edu/news/hand-held-water-harvester-powered-sunlight-could-combat-water-scarcity (accessed on 8 August 2025).
  19. Li, D.; Li, C.; Xiao, M.; Zhang, M.; Li, J.; Yang, Z.; Fu, Q.; Yu, K.; Yang, Y.; Pan, Y.; et al. Sustainable Solutions for Water Scarcity: A Review of Electrostatic Fog Harvesting Technology. Commun. Eng. 2025, 4, 34. [Google Scholar] [CrossRef] [PubMed]
  20. Azeem, M.; Noman, M.T.; Wiener, J.; Petru, M.; Louda, P. Structural Design of Efficient Fog Collectors: A Review. Environ. Technol. Innov. 2020, 20, 101169. [Google Scholar] [CrossRef]
  21. Verbrugghe, N.; Khan, A.Z. Water Harvesting through Fog Collectors: A Review of Conceptual, Experimental and Operational Aspects. Int. J. Low-Carbon Technol. 2023, 18, 392–403. [Google Scholar] [CrossRef]
  22. Parrish, A. Virginia Tech’s Fog Harp Harvests Water Even in the Lightest Fog. Virginia Tech News. 16 April 2020. Available online: https://news.vt.edu/articles/2020/04/fogharp_results.html (accessed on 8 August 2025).
  23. Shi, W.; van der Sloot, T.W.; Hart, B.J.; Kennedy, B.S.; Boreyko, J.B. Harps Enable Water Harvesting under Light Fog Conditions. Adv. Sustain. Syst. 2020, 4, 2000040. [Google Scholar] [CrossRef]
  24. Cruzat, D.; Jerez-Hanckes, C. Electrostatic Fog Water Collection. J. Electrostat. 2018, 96, 128–133. [Google Scholar] [CrossRef]
  25. Jiang, Y.; Xu, R.; Liu, S.; Liu, G.; Yan, X. Electrostatic Fog Collection Mechanism and Design of an Electrostatic Fog Collector with Nearly Perfect Fog Collection Efficiency. Chem. Eng. Sci. 2022, 247, 117034. [Google Scholar] [CrossRef]
  26. Zeng, M.J.; Qu, J.G.; Zhang, J.F. Design and Optimization of an Electrostatic Fog Collection System for Water Harvesting: Modeling and Experimental Investigation. Sep. Purif. Technol. 2023, 323, 124422. [Google Scholar] [CrossRef]
  27. Jiang, Y.; Liu, G.; Ekambaram, P.; Yan, X. Lab-Scale Electrostatic Droplet Collection from a Fog Plume with Droplet Evaporation. Appl. Therm. Eng. 2023, 223, 120044. [Google Scholar] [CrossRef]
  28. Damak, M.; Varanasi, K.K. Electrostatically Driven Fog Collection Using Space Charge Injection. Sci. Adv. 2018, 4, eaao5323. [Google Scholar] [CrossRef] [PubMed]
  29. Plasma Channel. Solving Desert Water Shortages Using 20,000 Volts [Video]. YouTube, 2025. Available online: https://www.youtube.com/watch?v=G2brxBRnRH4 (accessed on 8 August 2025).
  30. Smythe, W.R. Static and Dynamic Electricity, 3rd ed.; Rev. Printing; Taylor & Francis: New York, NY, USA, 1989. [Google Scholar]
  31. Griffiths, D.J. Introduction to Electrodynamics, 3rd ed.; Prentice Hall: Upper Saddle River, NJ, USA, 1999. [Google Scholar]
  32. Hai Linh, B.; Bui Thi, K.; Kung, Y.-S. Digital Hardware Realization of Forward and Inverse Kinematics for a Five-Axis Articulated Robot Arm. Math. Probl. Eng. 2015, 2015, 906505. [Google Scholar] [CrossRef]
  33. Jackson, J.D. Classical Electrodynamics, 3rd ed.; John Wiley & Sons: New York, NY, USA, 1999. [Google Scholar]
  34. Chapra, S.C.; Canale, R.P. Numerical Methods for Engineers, 7th ed.; McGraw-Hill Education: New York, NY, USA, 2015. [Google Scholar]
  35. Ginters, E.; Ginters, P.V. Simulation of Electrostatic Field Lines for Different Electrode Configurations in a Fog Collector; Zenodo: Geneva, Switzerland, 2025. [Google Scholar] [CrossRef]
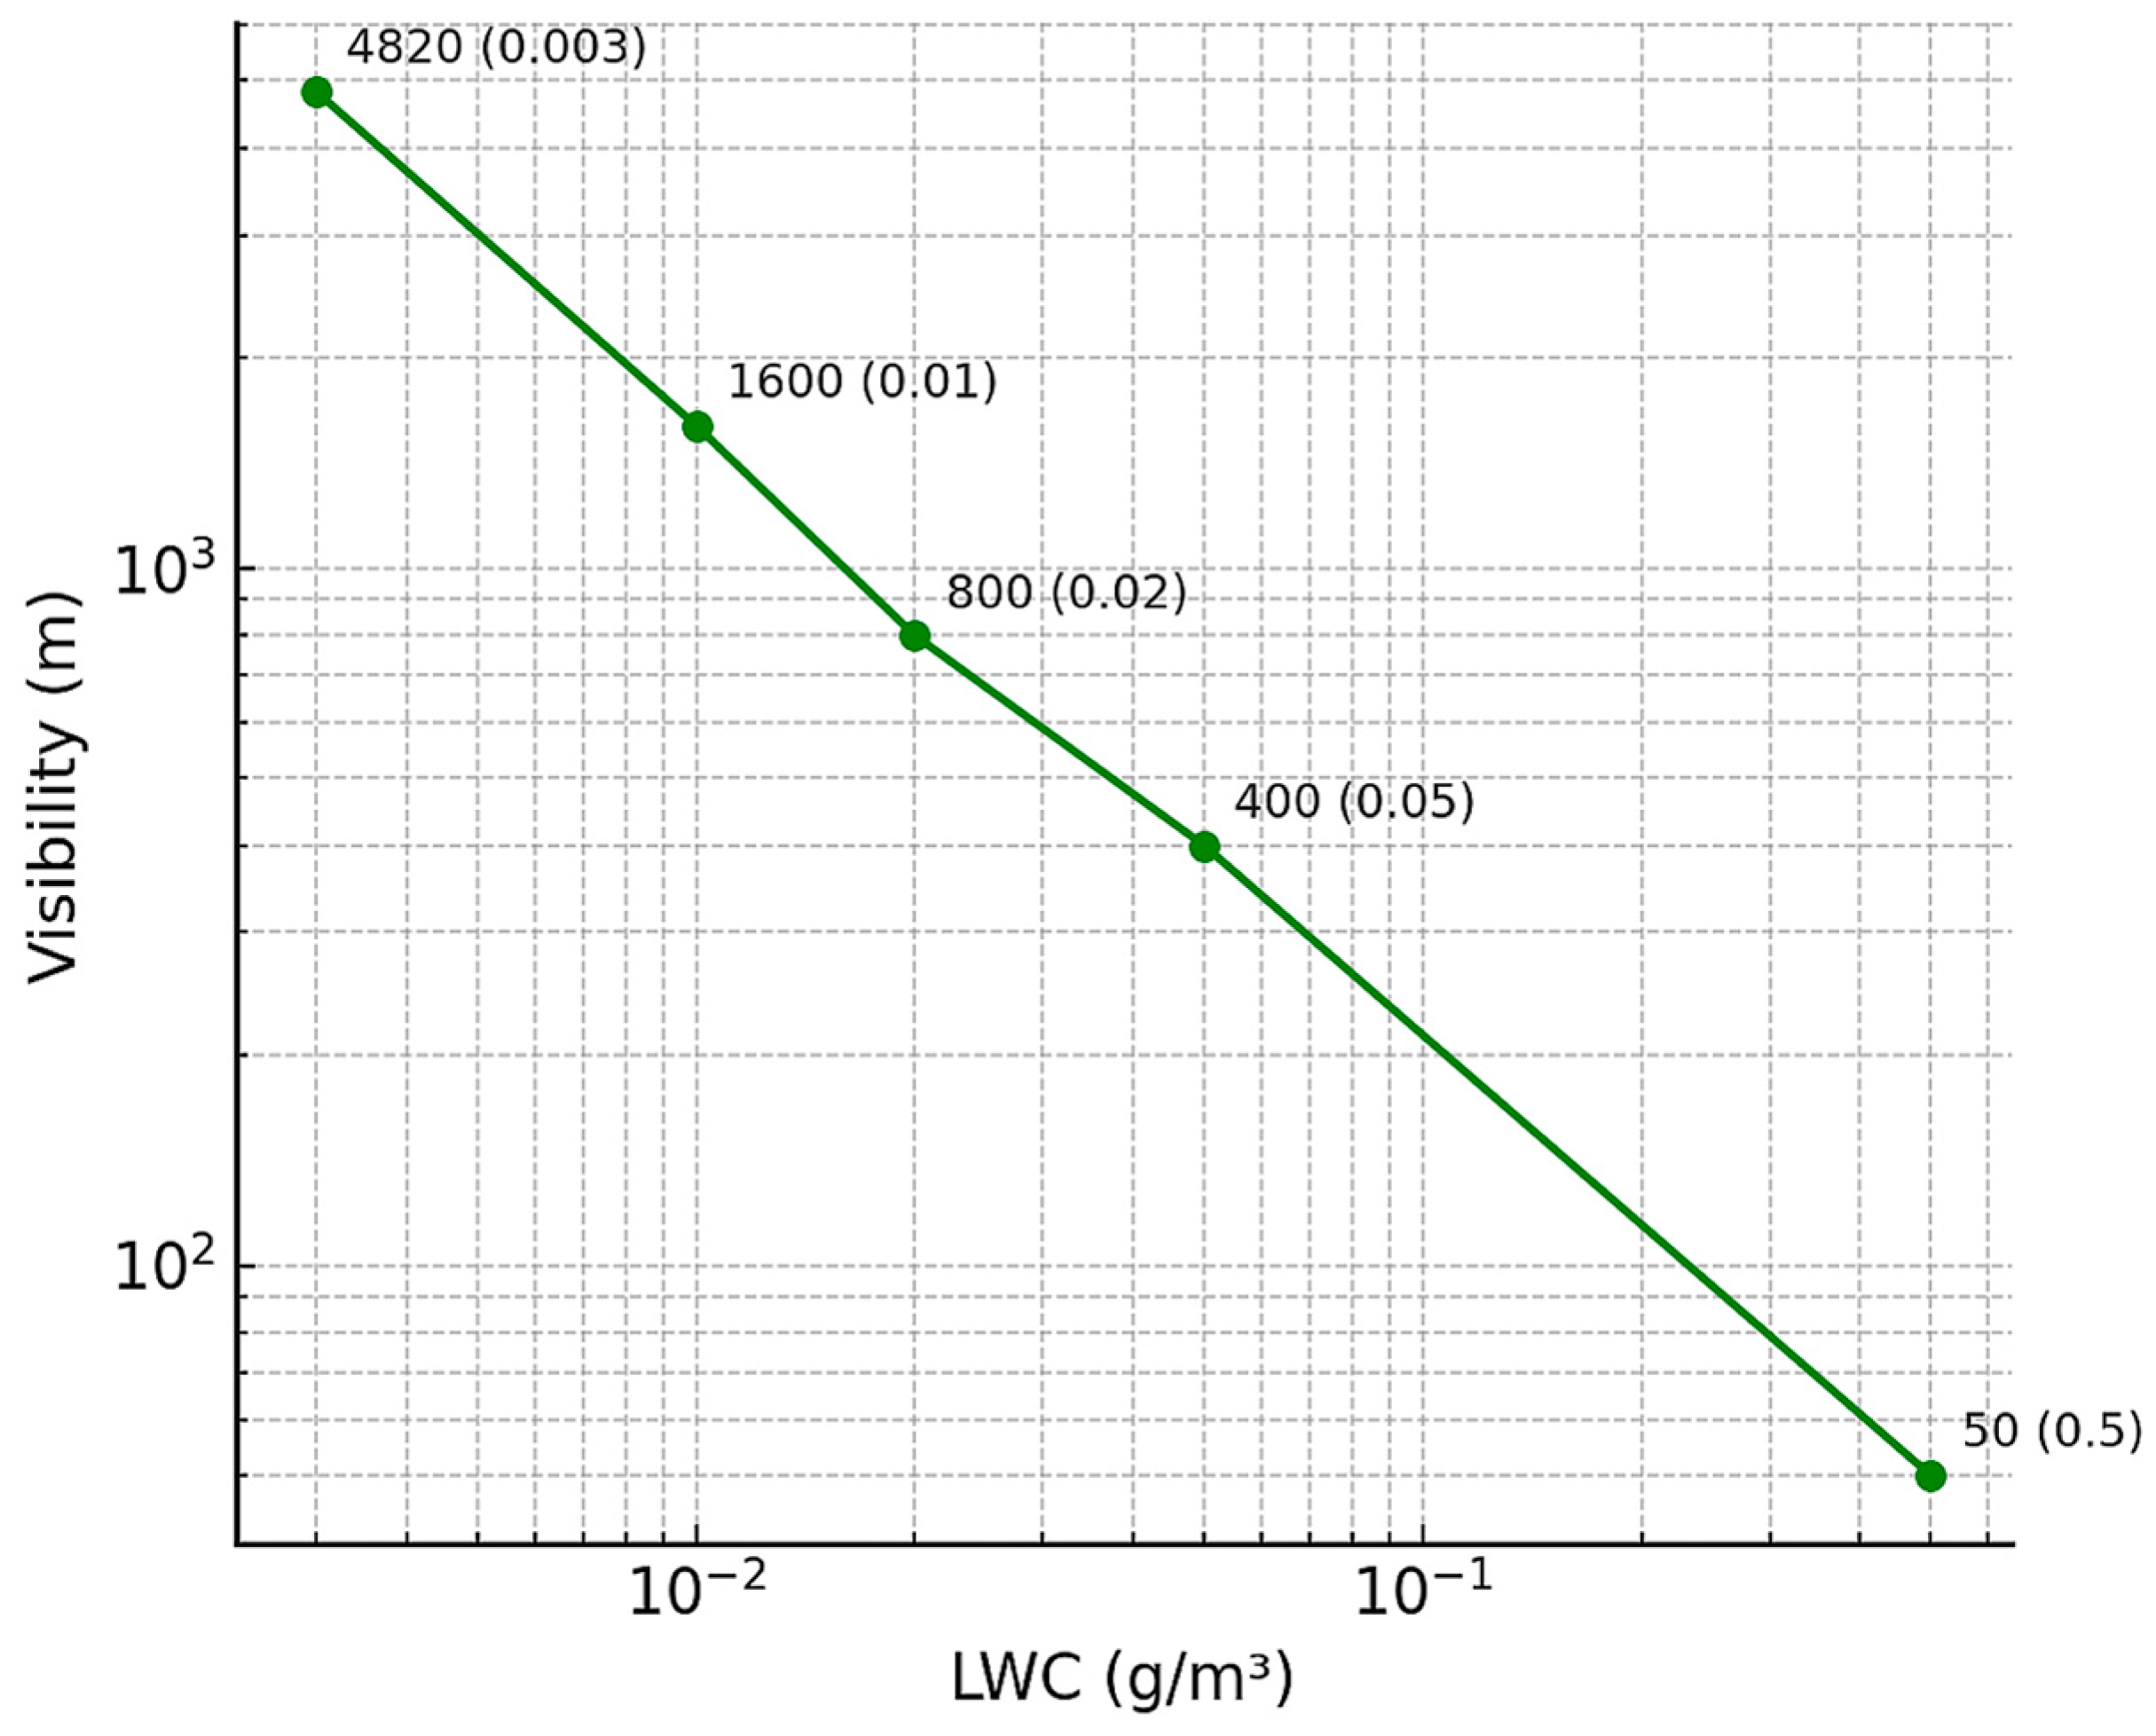
Figure 1. Horizontal visibility as a function of fog water content (log–log scale, with data points annotated).
Symmetry 17 01578 g001
Figure 2. Active fog water collection device with vertical and coaxial mesh collector design.
Symmetry 17 01578 g002
Figure 3. The transformation of the fog harvester configuration from wire-plates to vertical rod electrodes.
Symmetry 17 01578 g003
Figure 4. The multi-channel electrostatic fog collector with multiwire-to-plate electrodes.
Symmetry 17 01578 g004
Figure 5. Structure of the electrostatic fog plume collector.
Symmetry 17 01578 g005
Figure 6. An experimental prototype of a fog water harvester featuring a horizontal wire-type discharge electrode and a mesh-type collector pipe positioned underneath.
Symmetry 17 01578 g006
Figure 7. A vertical cylindrical mesh collector with a central vertical rod-type discharge electrode [35].
Symmetry 17 01578 g007
Figure 8. A collector composed of two vertical rows of rods, with a vertical discharge electrode row placed centrally between the collector rows [35].
Symmetry 17 01578 g008
Figure 9. A horizontal mesh collector in the form of a pipe or halved pipe with horizontal wire-type discharge electrodes positioned above [35].
Symmetry 17 01578 g009
Table 1. Fog density classification.
Fog NameVisibility
(m)
Density
(g/m3)
Haze≥5000<0.003
Mist, thin fog1000–5000<0.02
Moderate fog500–1000<0.05
Thick or dense fog50–500≤0.5
Very dense fog<50>0.5
Table 2. Electrode configurations of fog water active harvesting devices.
Electrode LayoutField DirectionBenefitsDrawbacksAmount of Collected Water
A vertical cylindrical mesh collector with a central vertical rod-type discharge electrode Radial (from the center outward)Simple structure, good symmetry, easy to deploy in the environmentLimited field control, low field line concentration, and obstructed fog flowLow
A collector composed of two or more vertical rows of rods, with a vertical discharge electrode row placed centrally between the collector rows Horizontal (toward the collectors)Field lines are focused between the collectors, the field is efficiently utilized, and fog flow remains unobstructedPotentially sensitive to positioning accuracyHigh
A horizontal mesh collector in the form of a halved pipe, with a horizontal wire-type discharge electrode positioned above Vertical (from top to bottom)Compact designField utilization efficiency is lowModerate
Disclaimer/Publisher’s Note: The statements, opinions and data contained in all publications are solely those of the individual author(s) and contributor(s) and not of MDPI and/or the editor(s). MDPI and/or the editor(s) disclaim responsibility for any injury to people or property resulting from any ideas, methods, instructions or products referred to in the content.