Abstract
This study investigates the asymmetric trade-off between cost and reliability in the optimal sizing of stand-alone Hybrid Renewable Energy Systems (HRESs) composed of photovoltaic panels (PV), wind turbines (WT), battery storage, a diesel generator (DG), and an inverter. The optimization is formulated as a multi-objective problem with Cost of Energy (CoE) and Loss of Power Supply Probability (LPSP) as conflicting objectives, highlighting that those small gains in reliability often require disproportionately higher costs. To ensure practical feasibility, the installation roof area limits both the number of PV panels, wind turbines, and batteries. Two metaheuristic algorithms—NSGA-II and MOPSO—are implemented in a Python-based framework with an Energy Management Strategy (EMS) to simulate operation under real-world load and resource profiles. Results show that MOPSO achieves the lowest CoE (0.159 USD/kWh) with moderate reliability (LPSP = 0.06), while NSGA-II attains a near-perfect reliability (LPSP = 0.0008) at a slightly higher cost (0.179 USD/kWh). Hypervolume (HV) analysis reveals that NSGA-II offers a more diverse Pareto front (HV = 0.04350 vs. 0.04336), demonstrating that explicitly accounting for asymmetric sensitivity between cost and reliability enhances the HRES design and that advanced optimization methods—particularly NSGA-II—can improve decision-making by revealing a wider range of viable trade-offs in complex energy systems.
1. Introduction
The use of renewable energy sources (RESs) has become increasingly popular in a variety of fields, posing a significant alternative to fossil fuels [1]. Electricity can be prohibitively expensive to extend to remote areas where many residents rely on it for daily activities. Power can be provided to isolated communities using mobile systems based on RESs. Solar panels, PVs; wind turbines, WTs; batteries for energy storage; and diesel generators, DGs, are typically included in these mobile systems. These components must be properly sized for the mobile system to be both dependable and cost-effective. In addition, solar and wind power have become increasingly popular for large-scale power generation sources. There is a common disadvantage to wind and solar energy options, which is their unpredictability and dependence on weather patterns.
It is possible to mitigate the challenges posed by wind and solar energy’s variable nature by integrating them both. A hybrid system that combines solar and wind power with battery storage can mitigate fluctuations and significantly reduce energy storage requirements. While this approach may increase the system’s complexity, it makes it more difficult to analyze than single-energy systems.
For effective and economical RES use, an ideal design sizing technique is essential. This strategy maximizes the utilization of solar, wind, and batteries while minimizing investment costs, maintaining the hybrid system’s dependability and efficiency.
For achieving an optimal HRES, researchers have proposed a variety of optimization techniques. To achieve technically and financially optimal HRESs, researchers have proposed several optimization strategies. The best sizing of such systems can be achieved by employing approaches such as the probabilistic approach [2], graphical constructions [3], iterative techniques [4], and artificial intelligence (AI), which guarantees that they satisfy both technical and economic performance requirements.
Traditional techniques include graphical, iterative, probabilistic, analytical, and artificial intelligence methods, are shown in Figure 1. It also demonstrates how simulation tools and hybrid approaches may be used to further improve optimization [5].
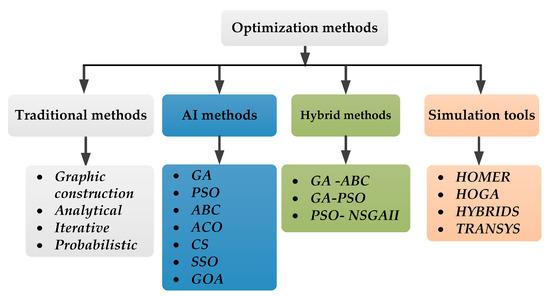
Figure 1.
HRES optimization methods.
For hybrid solar–wind systems, an iterative optimization method based on the LPSP model was suggested to reduce system costs and maintain power reliability by selecting the ideal number of PV modules, WTs, and batteries [6]. Another study iteratively increased the size of WTs, PV modules, batteries, and DGs according to the difference between generated and demanded power to minimize the total configuration cost [7].
Using 30 years of solar radiation and wind speed data, researchers identified the optimal PV array and battery size for a standalone hybrid system in Massachusetts [8]. They also proposed a graphical method based on the monthly averages of solar and wind energy. However, these methods considered only two parameters simultaneously, neglecting factors such as PV slope angle and WT installation height.
A probabilistic convolution-based approach was proposed in [9] to handle resource and load variations, enabling a long-term performance evaluation without longitudinal data for both standalone and grid-connected systems. The analytical method in [10] incorporates the probability of loss, load demand, clearness index, and unit costs of system components. Its reliability and applicability were demonstrated in [11], with the advantages of simple calculation and short computation time [12]. However, it requires long meteorological datasets and presents difficulties in predicting the spatial coefficient [13].
AI techniques such as Genetic Algorithms (GAs), the Artificial Bee Colony, and PSO have been used to solve complex HRES sizing problems, optimizing configurations like PV-WT-DG, hydro-PV, and PV-WT-biomass systems [14]. They offer fast convergence and high accuracy but face challenges like local optima and high computational requirements [15]. While these methods identify feasible system configurations, they are not always cost-effective since minor load rejections could reduce costs [16].
Most optimization methods minimize system costs using probability programming or the linear adjustment of decision variables [17]. This can lead to suboptimal solutions and higher computational efforts. Furthermore, many studies overlook crucial design aspects such as the PV slope angle and WT installation height, which significantly influence energy production and costs [18].
Several HRES sizing approaches have been applied in distributed generation [19]. For example, a self-adapting differential evolution algorithm was used in Yanbu, KSA, to optimize PV, WT, and DG systems considering the cost of electricity and LPSP [20]. PSO was applied in Bouzareah, Algeria, for PV/WT/battery sizing [21], while the Grasshopper optimization algorithm was used in Nigeria for PV/WT/battery/DG systems [22]. HOMER has also been employed for PV, WT, biomass, and batteries with LPSP constraints [23].
In Cameroon, a PV-WT-diesel-fuel cell hybrid system was optimized to meet three load levels, achieving a maximum LPSP of 5% and at least 85% renewable penetration [24]. In Nigeria, wind systems were economically compared with PV and DG networks [25]. In Egypt, a solar-wind-fuel cell hybrid system using hydrogen storage proved to be most cost-effective, with an LCOE of 0.47 USD/kWh [26]. A mobile PV-WT-battery-DG prototype for off-grid electrification has also been successfully tested [27].
Metaheuristic approaches such as GA and MOPSO have been applied for cost and reliability optimization [28]. Other studies explored PV-WT-battery-fuel cell systems for off-grid applications in Istanbul [29], hybrid PV/WT systems for telecommunications in remote areas [30], and NSGA-II for PV/DG hybrid systems with storage [31].
Overall, these methods provide robust frameworks for HRES optimization, addressing multiple objectives to enhance sustainability and reliability for stand-alone applications. A summary of their main advantages and limitations is presented in Table 1, showing that most suffer from issues such as a high data requirement, slow convergence, complexity, risk of local optima, and limited consideration of dependability.

Table 1.
Summary of HRES optimization algorithms.
Most recent works on PV-WT-battery systems emphasize capacity configuration optimization, mainly through classical or heuristic algorithms. However, these studies remain largely theoretical, based on simulations without experimental validation, which raise concerns regarding their accuracy and real-world reliability.
Most of the recent works related to PV-WT-battery systems emphasize optimizing the capacity configuration of the system. Most of the studies are based on classical optimization techniques or heuristic algorithms. However, those studies are mainly theoretical, with simulation results as their conclusions. They are trained on novel deviations that do not yield to computation without experimental validation, and therefore raise questions concerning their accuracy and reliability.
Our case study is based on a real building in France, where renewable energy is a viable solution to minimize dependence on the electrical grid, where electricity tariffs have been increasing at an estimated rate of EUR 0.2516 per kWh in 2025. PV, WTs, and battery banks are modeled as the primary components of the HRES. It then optimizes the system configuration through two metaheuristic algorithms: NSGA-II and MOPSO. The objectives are to minimize the LPSP and the levelized CoE simultaneously. A detailed comparison of the results will help identify the optimal configuration that best satisfies these criteria.
The main contributions of this study are as follows:
- ✓
- Hybrid optimization framework: A novel comparative approach combining NSGA-II and MOPSO is developed and applied to real-world data, improving the practical relevance of the optimization results.
- ✓
- Customized Energy Management Strategy (EMS): An EMS is designed to ensure balanced power distribution among PV, WT, battery storage, and the diesel generator, thereby enhancing system reliability and operational flexibility.
- ✓
- Python-based implementation: The entire modeling and optimization process is implemented in Python 3.13.5 (released 11 June 2025), demonstrating its effectiveness for advanced energy system design and promoting its wider adoption in the research community.
- ✓
- Comprehensive comparative analysis: The performance of NSGA-II and MOPSO is evaluated using CoE, LPSP, hypervolume (HV), and statistical validation (ANOVA), offering deeper insights into algorithm efficiency and robustness.
- ✓
- Practical applicability: The proposed containerized HRES design is portable and easily deployable, making it suitable for rural electrification, military operations, and emergency response in isolated or off-grid areas.
The remainder of this paper is organized as follows: Section 2 introduces the configuration of the HRES and outlines the strategies implemented to ensure its efficient operation. Section 3 presents the mathematical modeling of the HRES components, providing a detailed representation of their behavior and interactions. Section 4 describes the EMS, discussing various control strategies designed to optimize the allocation and utilization of energy resources. Section 5 details the methodology for determining the optimal sizing of system components, aiming to enhance both efficiency and cost-effectiveness. The fundamental ideas and methods of NSGA-II and MOPSO in solving the multi-objective optimization problem employed in this work are described and explained in Section 6. Section 7 presents the results and discusses the key findings, providing a comprehensive analysis of system performance and the implications of the proposed approach. Finally, Section 8 concludes the study by summarizing the main contributions, highlighting critical insights, and outlining potential future research directions.
2. Hybrid Renewable Energy System Setup and Operational Approach
Figure 2 illustrates the HRES conceptual design for stand-alone installations. This innovative system incorporates two primary RESs: a WT and a PV array. It also includes an energy storage unit (battery bank) and a DG as backup power. All components were designed for rooftop mounting, ensuring stability and ease of installation. The WT, PV array, and battery bank are integrated into the system’s DC bus through suitable inverters or converters. The AC bus connects the home’s electrical load to the DG. This rooftop approach offers versatility and easy installation, making it ideal for residential applications. It maximizes energy efficiency and reliability while providing backup power during outages.
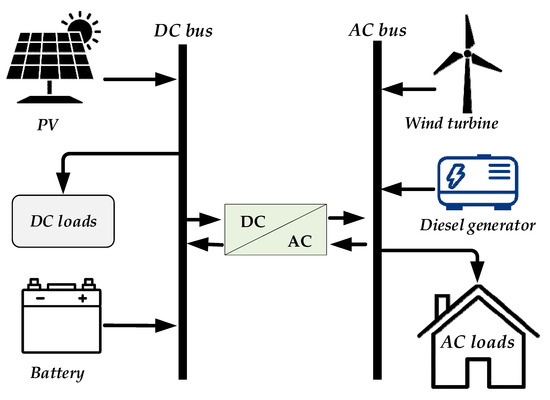
Figure 2.
Hybrid system with PV, WT, battery, and DG configurations.
Any excess output from RESs, such WTs and PV systems, is carefully regulated to fulfill the necessary load demand. The battery pack is charged for later use using excess power over the load demand. The excess power is routed to a replacement load if it continues. On the other hand, the battery pack’s stored energy is smoothly integrated to fill the gap if the generated power is less than the load requirement. Nevertheless, a controlled shutdown of non-essential loads is required to preserve system stability even in the face of brief power supply cutbacks when the load demand surpasses the combined output of renewables and stored energy.
3. System Component Modeling
Below, we outlined the procedure for computing the power output of the WT and PV panels and the governing equations for battery performance. Additionally, we provide equations relevant to the DG and the inverter within this context. Next, we delve into the energy modeling intricacies of the hybrid system.
3.1. Photovoltaic Generator Modeling
The power generated by each PV panel at a given time, denoted as PPV(t), is determined by the following formula [32]:
In this equation, represents the rated power of the PV panel, SR is the solar radiation (W/m2), SRref is the reference solar radiation (typically 1000 W/m2), and NT is the panel temperature coefficient, which is approximately −3.7 × 10⁻³ [33].
The cell temperature TC is calculated as follows:
Here, represents the reference temperature (usually 25 °C), represents the ambient temperature, and corresponds to the normal operating cell temperature [34].
To calculate the total power produced by a PV system, denoted as PPVT(t), you can use Equation (3):
The number of PV panels in the system is represented by NPV in this equation.
Based on solar radiation, cell temperature, and the quantity of PV panels placed, the power output of a PV system may be calculated using these formulas.
3.2. Wind Turbine Modeling
In a WT system, the WT generator begins to produce power when the wind speed surpasses the switch-on value. A steady power output is produced when the wind speed surpasses the WT’s rated speed; when the wind speed surpasses the cut-off value, the wind generator will shut off to safeguard the generator. Equation (4) describes the connection between the wind speed and the WT’s power production [35].
The cut-in speed , nominal speed vr, and cut-off speed vmax depend on the specific characteristics of the WT, with representing its rated power.
3.3. Battery Modeling
The battery plays a crucial role in providing power to the load when the energy generated by the installed RESs is low. The battery’s capacity was carefully planned based on two key factors: the reference Autonomy Day (AD) and the required demand.
where represents the demand energy, stands for the battery tension, and represents battery efficiency, with indicating battery Depth of Discharge (DoD). The AD is defined as the number of days that the battery can meet the required energy demand. When the power generated from RESs surpasses the immediate demand, the excess energy is employed for recharging the battery. Consequently, the calculation for battery power is described by (6):
An inverter with 100% efficiency (ηinv = 1) is a hypothetical situation. This assumption is wholly hypothetical because inverters in the real world typically have efficiency levels between 90% and 98%. According to [35], the equation can be written as follows:
Batteries are constrained by their state of charge (SOC) in practice. To preserve the battery’s lifespan, only a maximum SOC () is charged when renewable generation exceeds demand. The battery does not store any additional excess energy after reaching; it is redirected to E_dump for auxiliary applications such as pumping stations, water heaters, or other energy storage technologies. If the demand exceeds renewable generation, the battery discharges down to a minimum SOC () to avoid a deep discharge. Backup diesel generators are used if the deficit persists after . If renewable generation exactly matches the load (, the battery will neither charge nor discharge
One crucial factor influencing battery performance is the state of charge (SoC(t)), which depends on whether there is an excess or shortfall of generated power from RESs compared to the energy demand. This can be expressed in the following manner [36]:
where δ is the self-battery rate.
Battery performance is intricately tied to several factors, including the availability of the RES, as well as the imposed limitations on charging and discharging and the DoD.
In practice, the battery SoC must adhere to specific constraints, as follows:
3.4. Diesel Generator Modeling
In the proposed stand-alone HRES, a DG serves as a backup power source for situations characterized by unfavorable weather conditions, such as cloudy days or periods of low wind speed. The generators mainly operate in load-following mode, only making up the difference between demand and renewable generation. To avoid inefficiencies and increased wear, the DGs are typically not operated below 40% of their rated power, which corresponds to the minimum effective load threshold. The fuel consumption of the DGs is estimated using the following linear model [37]:
Here, FC(t) represents generator fuel consumption, and the coefficients a = 0.246 and b = 0.08415 represent the specific fuel consumption factors under partial and no-load conditions, respectively. stands for the rated power of DG, and PDiesel(t) represents the output power of the DG during a specific time.
In addition, the model assumes that the start-up and shut-down operations (ramp-up/down) of the generators are instantaneous, although in practice, there may be short delays and temporary inefficiencies. The generators are only used when battery storage and renewable energy are insufficient. This minimizes fuel consumption and operating time, extending service life and reducing operating costs.
4. Energy Management Strategies
An effective energy management approach is essential for stand-alone systems to optimize the power distribution among its various components, as noted in [38]. This strategy plays a crucial role in reducing battery depletion, enhancing the utilization of RESs, and minimizing fuel consumption. A strategy is developed by incorporating meteorological data such as ambient temperature, solar radiation, and wind speed, as well as the characteristics of each component of the system such as PV, WT, batteries, DG, inverters, and loads. Within this approach, specific equations are developed and employed to govern energy management decisions.
In this study, the introduced EMS is based on four distinct operational modes, which are detailed as follows:
Mode 1: If ample energy is generated from PV and WT sources to meet the electrical load requirements, any surplus energy will be directed towards recharging a battery storage system but only if the current SoC is below its maximum capacity SoCmax.
Mode 2: When the energy generated by PV and WT resources exceeds the load demand, and the battery storage bank reaches its maximum SoC (SoC(t) = SoCmax).
Mode 3: When the energy produced by PV and WT resources falls short of meeting the load demand, but the SoC(t) of the battery storage bank remains above the minimum threshold SoCmin, the stored energy within the battery storage bank will be utilized to fulfill the load demand.
Mode 4: When the energy generated by both PV and WT resources falls short of meeting the load demand and the battery storage bank’s SoC(t) is below the minimum (), the DG will be active to supply the load demand and simultaneously recharge the battery storage bank. Furthermore, once the PV and WT resources start generating power again, the DG operation is halted.
The primary flowchart of the proposed EMS is depicted in Figure 3.
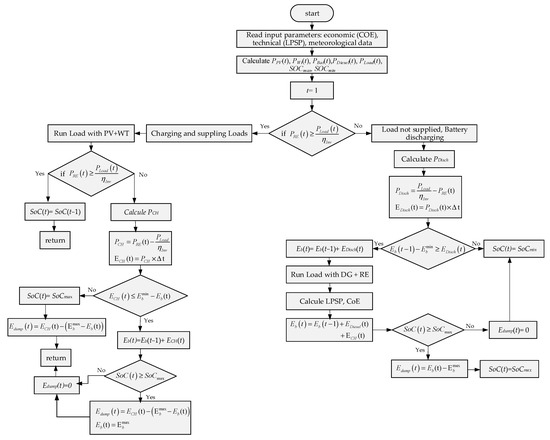
Figure 3.
The proposed EMS procedure.
Although factors such as CO2 emissions, battery cycles, and fuel consumption were not explicitly evaluated in this study as performance indicators, the proposed EMS aims to minimize the use of diesel generators by prioritizing renewable energy sources and battery storage.
5. Optimal Sizing Methodology
This study aims to propose a stand-alone HRES optimal sizing approach based on two criteria. First, reliability was considered using the LPSP criterion. This is a crucial indicator for measuring the stability and availability of our system, thus ensuring a reliable energy supply for stand-alone applications.
Second, the CoE criterion measures economics. This criterion allows us to determine whether our hybrid system is economically viable and make informed decisions regarding its optimization. By considering economic and reliability factors, our goal is to develop an effective and sustainable stand-alone energy solution.
To solve this multi-objective optimization problem, we implement and compare two state-of-the art metaheuristic algorithms: NSGAII and MOPSO. Although both belong to the class of multi-objective evolutionary algorithms, their optimization mechanisms differ significantly: NSGAII is based on elitist non-dominated sorting, while MOPSO is inspired by the behavior of particle swarms in multi-objective search spaces.
The novelty of the approach lies in the comparative analysis: both algorithms are applied to the same real-world dataset and evaluated under the same boundary conditions and performance metrics. This ensures a fair comparison and illustrates how different metaheuristic strategies affect the system performance in terms of CoE, LPSP, and solution diversity.
The entire implementation is developed in Python, which is becoming increasingly important in scientific computing and optimization due to its versatility, open source, and reproducibility. This helps improve the transparency and adaptability of our framework and fills a gap in the literature, as most HRES optimization studies have traditionally been implemented using commercial tools such as MATLAB or HOMER.
By evaluating the results using performance metrics such as HV, quantifying the diversity and quality of the Pareto front, this approach not only identifies the optimal size configuration but also provides valuable insights for future research and algorithm selection in HRES design.
5.1. Reliability Criteria
One important indicator of an HRES’s capacity to supply electricity is its LPSP. LPSP is the leading reliability index for HRES evaluation since it measures the probability that the system will not provide the necessary power. The following formula is typically used to compute the LPSP:
The LPSP values range from 0 to 1 (0% to 100%). All energy requirements are satisfied when the LPSP is zero. In contrast, if the LPSP equals one, the energy demand remains unmet. Accepted values of LPSP are 0.05 (5%) [39].
5.2. Economic Criteria
As the objective function, the CoE is the main emphasis for evaluating stand-alone systems. Minimizing the CoE while maintaining system reliability is the main goal of the suggested optimization problem. The entire Net Present Cost (NPC), which includes investment, operating, maintenance, and replacement costs, is closely related to the CoE. Although RESs frequently require significant initial expenditures, it is standard practice to observe that they usually have cheap operating and maintenance costs because they do not require fuel.
In this study, the costs under consideration are PVs, WTs, batteries, and distributed generation DGs, including investments, replacements, and maintenance and operation (M&O) costs, as stated in the citation [14]:
The concept of NPC encapsulates all expenses associated with a stand-alone system, encompassing capital costs CT, maintenance and operating costs CM&O, CFuel fuel cost, SA salvage value of the components as well as replacement costs CRep. NPC serves as the primary assessment criterion for evaluating the viability of a stand-alone system, as described in [40]. As a result, it offers an expansive perspective on the standalone system’s sustainability and financial performance.
where LPV is the lifetime of PV panels.
5.2.1. Operating and Maintenance Costs
The overall yearly expenditures on M&O establish the operating and maintenance costs for every component of our system. The interest rate and the system lifespan are two examples of the variables that affect these expenses [41]. The following is a representation of this relationship:
represents the combined maintenance and operational costs of RESs such as PV and WT. This value is the sum of (M&O) and (the M&O), denotes the maintenance and operating expenses related to the battery, and represents the M&O for the DG. L represents the annual interest rate at 10%, and τ signifies the system’s expected lifespan of 20 years. These variables are essential factors in calculating the overall operational and maintenance costs of specific systems or technologies.
5.2.2. Replacement Costs
The stand-alone system’s replacement cost is contingent on the replacement of specific installation components, as outlined in [41]:
where represents the replacement cost associated with the battery, signifies the replacement cost of the inverter, and represents the replacement cost of the DG.
5.2.3. Capital Cost
The capital cost of the stand-alone system was calculated by summing up the estimated procurement expenses for each component, as outlined in [7]. This cost calculation includes representing the investment costs associated with PV components, for WT investments costs, for DG investments, and inverter investment expenditures are represented by , whereas battery investment expenditures are represented by . All these factors add up to the total amount of capital needed to build and configure a stand-alone system.
5.3. Cost of Energy
CoE is the overall cost of generating and supplying one unit of electrical energy from a certain energy source, as well as the system during the period of its operation. This measure divides the total amount of electrical energy produced or provided by the system by the initial capital costs, continuing maintenance and operation expenses M&O, and replacement costs, if required. The Cost of Energy (CoE) is vital for evaluating the economic viability and competitiveness of various energy generation methods and technologies.
where CRF stands for the capital recovery factor, which is defined as follows, and EG is the overall amount of electric energy produced or provided by the system:
5.4. Renewable Factor
The percentage of power generated by renewable energy systems (RESs) compared to non-renewable energy sources (such as DGs) is determined by the Renewable Factor (RF) in Hybrid Renewable Energy Systems (HRESs). The expression is based on Equation (22) [33].
The total power generated by RESs is represented by in Equation (22). A system that is entirely dependent on renewable energy generation when the RF reaches 100% is considered an ideal system. If the RF is 0%, it means that the power generated by the diesel generator is equivalent to the power generated by RESs.
5.5. Economic Assumptions and Limitations
Economic considerations in this study are based on the present-day costs of PV panels, battery storage systems, diesel fuel, and energy policies. Despite its realistic depiction of today’s techno-economic performance, this approach does not take into consideration future variations in technology prices, fuel costs, or government incentives such as subsidies, carbon taxes, or regulatory changes. Variations in these factors have a significant impact on the long-term viability of hybrid energy systems. As a result, future research should incorporate scenario-based or probabilistic modeling techniques to improve the robustness and relevance of the proposed optimization framework. This type of analysis could provide decision makers with a more comprehensive analysis of sensitivity and help them better anticipate the economic risks associated with the system over its lifetime.
5.6. Problem Formulation and Constraints
In this analysis, the system is isolated from the grid, and the number of storage batteries , PV panels , and WTs is of paramount importance to ensure that all of the analysis period is covered. The objective of the optimal sizing is to address a complex problem that is defined by two functions:
The first subordinate problem is to minimize the cost of the system, expressed as follows:
The second sub-problem reduces the energy deficit, measured by the LPSP, with
The system’s performance and effectiveness are significantly impacted by several key constraints. The maximum number of components allowed, such as NPV, NWT, and NBat, is subject to these limitations. The availability of surface area for system implementation (Simp) is the most crucial limitation in this work, as we are restricted to a specific rooftop area. The importance of this constraint lies in determining whether energy production can meet the desired satisfaction levels. To achieve our energy production objectives, it is crucial to balance these limitations to ensure a sustainable and reliable energy supply.
The surface implementation constraint has the following mathematical expression:
where
and are the areas occupied by each PV panel and wind turbine.
This formulation ensures that the optimization algorithm respects the spatial limitations while selecting the number of components, thus maintaining feasible and implementable solutions.
6. A Description of Algorithms for Optimization
6.1. NSAG-II Algorithm
The multi-objective optimization algorithm known as the NSGA-II is widely used. The Pareto front, which reflects the best trade-offs between the objectives, is estimated using this approach, which is well-known for its efficiency in solving multi-objective problems [42].
By adding a fast, non-dominated sorting strategy, the suggested method greatly lowers the computational complexity of its predecessor, NSGA. NSGA-II, more importantly, includes a crowding distance mechanism to guarantee diversity among solutions and an elitism mechanism to maintain the best solutions for generations to come. NSGA-II finds a wide range of Pareto-optimal solutions by reaching a balance between exploration and exploitation [43]. The following is a description of the NSGA-II selection process [44]:
- -
- Sort the population into fronts depending on dominance, with each front dominated solely by the previous front. A new fast sorting strategy is employed to reduce the computational difficulty of the NSGA algorithm.
- -
- Determine the crowding distance for each individual at each front. The crowding distance calculates the distance between the individual and his neighbors to estimate the level of crowding in the surrounding area.
- -
- Select the population during the next iteration. This is dependent on two factors: the individual’s rank on any front and the crowding distance.
Figure 4 presents the flowchart of the NSGA-II algorithm.
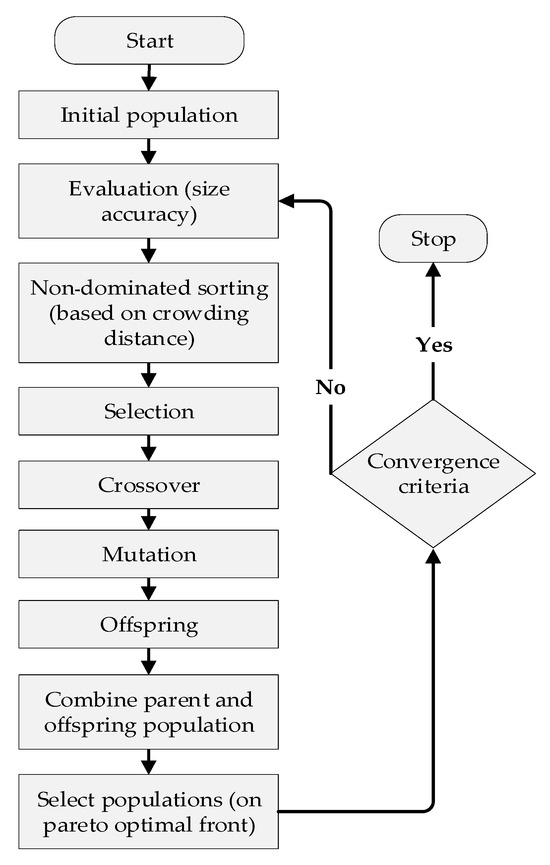
Figure 4.
Flowchart of the NSGA-II algorithm.
6.2. Multi-Objectives Particle Swarm Optimization (MOPSO) Algorithm
MOPSO algorithms are increasingly popular and are renowned for their high efficiency in optimization tasks. The core concept of MOPSO is inspired by the collective behavior observed in nature, particularly the swarming patterns of animals. Examples of such behaviors include the synchronized movement of bird flocks and coordinated swimming in fish schools. This natural phenomenon is harnessed in MOPSO to enable particles, representing potential solutions, to move through the solution space and converge toward optimal or near-optimal solutions by mimicking these social dynamics. There has been some success in its application to solve many complex multi-objective problems that are typically non-linear [45].
In the implementation of MOPSO for optimization tasks, particles are represented as a population where each particle signifies a potential solution. Figure 5 shows a flowchart of the MOPSO algorithm used for optimizing hybrid systems. Within the solution space, each particle updates its current position Xi based on its flying velocity Vi based on past experiences. The mathematical expression for the vector representation of position and velocity concerning the required adjustments can be formulated as follows:
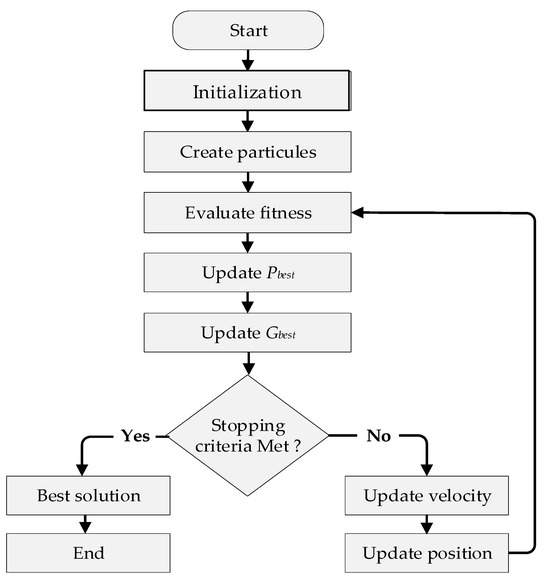
Figure 5.
Flowchart of proposed MOPSO algorithm.
Apply the analytical method to optimize the energy system, demonstrating its feasibility and accuracy:
7. Results and Discussion
This paper proposes a new approach to optimize the design of HRES to ensure a reliable electricity supply by minimizing the LPSP while reducing the levelized CoE. To achieve this balance, advanced optimization algorithms, including NSGA-II and MOPSO, are used to simulate the configuration of PV/WT/batteries. Real hourly electricity consumption data of a residential building in Marseille, France, collected from 1 January 2022 to 31 December 2022, are used to accurately reflect actual load patterns and environmental conditions. To demonstrate the effectiveness of the PV-WT-Batteries, a comparative analysis of two alternative configurations is also performed: WT-battery and PV-battery systems. RESs are increasingly seen as a viable solution to reduce dependence on the grid, especially considering the rising electricity prices, which are expected to reach EUR 0.2516 per kWh in 2025. This paper aims to bridge the gap between theoretical studies and practical implementations and address a common limitation of existing studies: most results are still limited to simulations without experimental verification. Simultaneously, techno-economic characteristics were incorporated into the model’s system costs. These simulations were conducted in Python to determine the optimal configuration that balances cost and reliability.
The case study focuses on a residential building with a peak hourly electricity consumption of 7 kW, while the rest of the hourly load profile varies below this maximum. Recorded environmental conditions include wind speeds ranging from 3 to 18 m/s (Figure 6) and temperatures between 10 °C and 40 °C (Figure 7). Hourly profiles of electrical load, solar irradiation, wind speed, and ambient temperature, all obtained from NASA POWER for meteorological data, are illustrated in Figure 6, Figure 7, Figure 8 and Figure 9, providing insights into system performance under varying conditions. The geographical location of Marseille offers favorable opportunities for integrating renewable energy technologies, potentially reducing reliance on conventional energy sources, and mitigating environmental impacts.
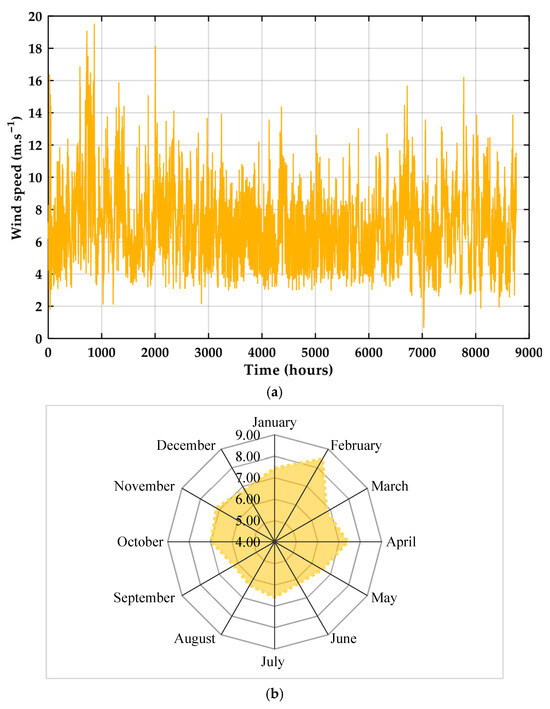
Figure 6.
(a) Annual wind speed (m/s) and (b) monthly average wind speed of the case study.
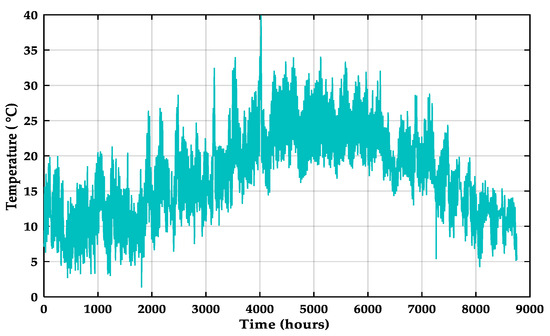
Figure 7.
Evolution of yearly temperature (°C).
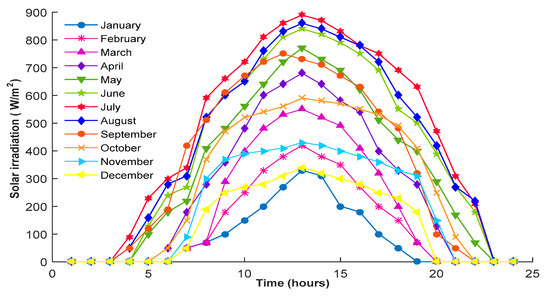
Figure 8.
Monthly solar irradiation.
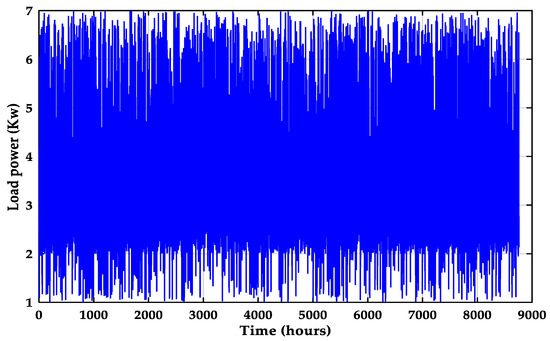
Figure 9.
Hourly electrical load profiles.
Table 2, Table 3, Table 4, Table 5 and Table 6 provide details on the techno-economic data used in this study. This study selected NSGA-II and MOPSO parameter settings carefully based on values commonly reported in the literature and preliminary sensitivity analyses to ensure a good balance between convergence speed and solution diversity. Each algorithm’s configuration is summarized in Table 7. These settings allowed both algorithms to effectively explore the solution space while maintaining computational efficiency, ensuring a fair comparison between NSGA-II and MOPSO in solving the hybrid system optimization problem. The optimization process for the design configuration was limited to 100 iterations. Overall, the data used in this paper is crucial for the comprehensive analysis and optimization of the HRES, enabling the authors to draw meaningful conclusions about its performance and viability for stand-alone applications.

Table 2.
Techno-economic specifications of PV panels.

Table 3.
Techno-economic specifications of WTs.

Table 4.
Techno-economic specifications of batteries.

Table 5.
Techno-economic specifications of the inverter.

Table 6.
Techno-economic specifications of DG.

Table 7.
Algorithm parameter specifications.
Figure 10 shows the change in electricity load over time for four seasons: summer, spring, autumn, and winter. Each subgraph shows the hourly electricity demand for approximately 2200 h (about 3 months) and shows clear seasonal changes. It is worth noting that the peak load is higher in summer and autumn, while the patterns are relatively stable in spring and winter.
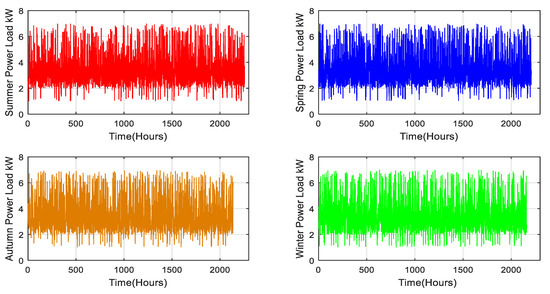
Figure 10.
Seasonal variation in hourly power load profiles.
Figure 11 shows the daily electricity load profile for each season using the first 24 h of the seasonal dataset. This focused view provides insight into short-term fluctuations and typical daily consumption patterns for summer, spring, fall, and winter. The illustrations in each sub-figure illustrate the fluctuations in electricity demand over a day and reveal different seasonal behaviors.
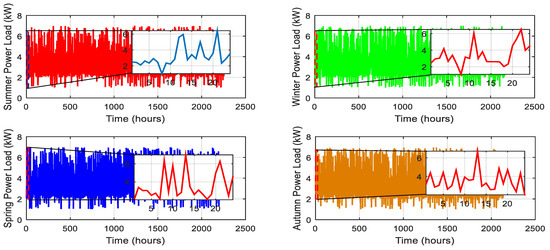
Figure 11.
Daily power load patterns by season.
The daily variations in one panel and one wind turbine’s power generation are depicted in Figure 12.
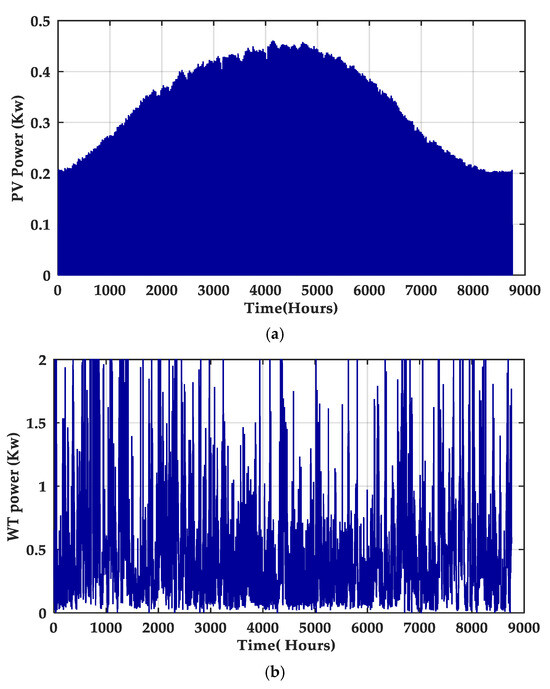
Figure 12.
(a,b) Daily evolution of different power sources.
Figure 13, Figure 14 and Figure 15 illustrate the optimization process and results of the hybrid PV/WT/Battery system obtained with the MOPSO algorithm. Figure 13 shows a 3D plot of LPSP, CoE, and NPC, where each point represents a potential system configuration. The connecting lines trace the swarm’s trajectory during the search process, highlighting how the algorithm explores the solution space and gradually converges toward optimal regions. Figure 14 presents the trade-off between reliability (LPSP) and cost (CoE). It can be observed that improving reliability (i.e., reducing LPSP) generally leads to higher system costs, while lowering the cost tends to compromise reliability. This illustrates the fundamental conflict between the two objectives and underlines the need for a balanced solution depending on the application’s priorities. The swarm’s evolution is depicted with blue lines and cross markers, showing how intermediate solutions progressively approach the Pareto-optimal front. Figure 15 finally displays the Pareto front, which contains the best compromise solutions among the considered objectives.
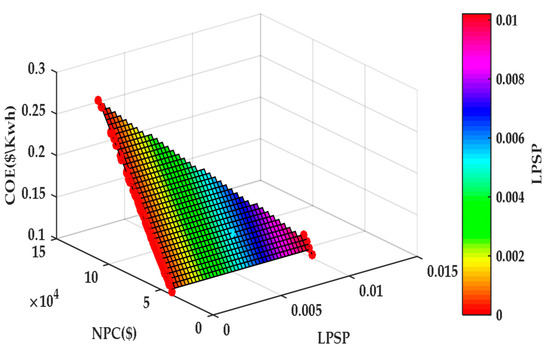
Figure 13.
Visualizing LPSP, CoE, and NPC in a PV/WT/Battery system with MOPSO.
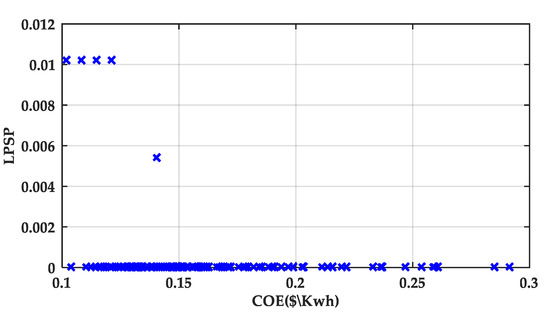
Figure 14.
Correlation between LPSP and CoE with MOPSO.
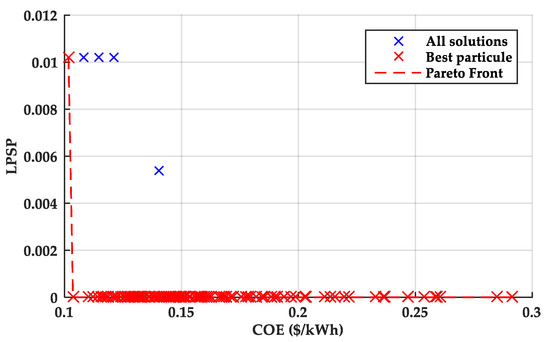
Figure 15.
The Pareto front of the MOPSO algorithm.
The optimal configuration identified with MOPSO is NPV = 38, NWT = 4, and NBat = 8, with an LPSP of 0.07 and a CoE of 0.278 USD/kWh. However, this configuration is not feasible due to surface implementation constraints. Therefore, the second-best configuration NPV = 29, NWT = 1, and NBat = 10 is considered. This configuration has an LPSP of 0.06 and a CoE of 0159 USD/kWh. This result highlights how trade-offs between cost and reliability must be carefully considered: while the first configuration offers a slightly better technical performance, the second one provides a more practical and economically viable solution under the given constraints.
Figure 16, Figure 17 and Figure 18 illustrate the optimization of the hybrid PV/WT/Battery system using the NSGA-II algorithm. Figure 16 presents a scatter plot of CoE versus LPSP, where most solutions cluster near very low LPSP values, indicating highly reliable configurations. However, some solutions exhibit higher LPSP values (up to 0.05), particularly for lower CoE values in the range of 0.1–0.15 USD/kWh. This distribution clearly highlights the trade-off: minimizing the cost often comes at the expense of reduced reliability.
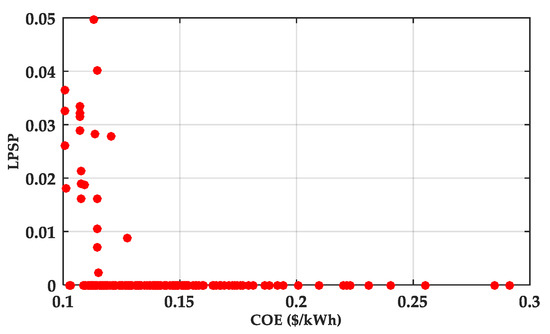
Figure 16.
Correlation between LPSP and CoE using the NSGA-II algorithm.
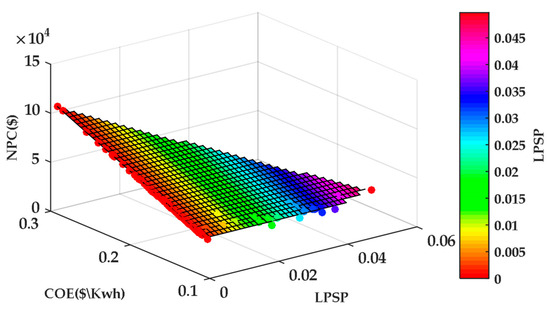
Figure 17.
Evolution of LPSP, CoE, and NPC in a PV/WT/Battery system with NSGA-II.
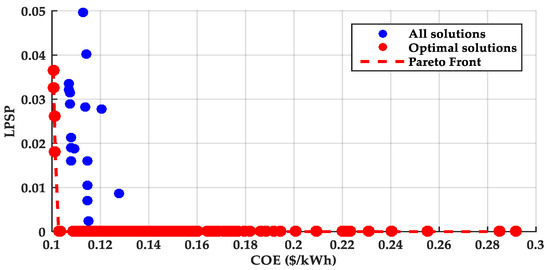
Figure 18.
The Pareto front of LPSP and CoE using the NSGA-II Algorithm.
Figure 17 further explores the interdependencies between CoE, LPSP, and NPC through a 3D surface plot. The surface illustrates how reductions in CoE are generally accompanied by increases in LPSP, while NPC varies between 0 and 1.5 × 10⁵ USD. The color gradient, ranging from red (low LPSP) to blue (high LPSP), provides additional insight into how different configurations balance cost and reliability. This visualization confirms that ensuring very high reliability requires larger system investments, leading to higher NPC and CoE values.
Figure 18 presents the Pareto front derived from the optimization process. The Pareto front (red dashed line) separates the set of non-dominated solutions (red markers) from the full set of feasible solutions (blue markers). This representation illustrates the balance between economic and reliability objectives, showing that each Pareto-optimal configuration corresponds to a different compromise between low cost and high reliability.
The goal is to find the optimal configuration that minimizes both the CoE and LPSP. The optimal configuration identified is NPV = 40, NWT = 2, and NBat = 8, with an LPSP of 0.003 and a CoE of 0.199 USD/kWh. However, this configuration is not feasible due to surface implementation constraints. Therefore, the second-best configuration NPV = 39, NWT = 2, and NBat = 9 is considered. This configuration has an LPSP of 0.0008 and a CoE of 0.179 USD/kWh. As a result of this choice, it is important to consider practical constraints alongside optimization results: the first solution offers technical superiority, whereas the second is more realistic and economically attractive.
Figure 19a,b shows the annual deficits and the annual energy conserved in batteries for various solutions suggested by two optimization algorithms (NSGAII and MOPSO). The energy stored in batteries for each solution is indicated by the colored dots, while the black line shows the annual energy shortfall for specific days. This illustration aids in understanding how the system controls energy storage and responds to annual energy shortages.
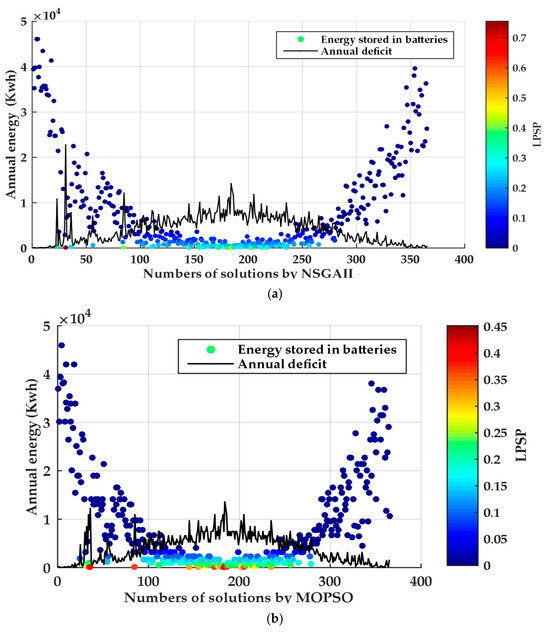
Figure 19.
The annual deficit and energy stored with NSGAII and MOPSO. (a) Annual deficits for various solutions suggested by NSGAII and MOPSO, (b) Annual energy stored in batteries for the same solutions.
The relationship between the three main elements of an HRES’s quantity of PV panels, wind turbines, WT, and batteries is shown in these three-dimensional curves in Figure 20. As the colors represent the LPSP values, the purple surface and scattered spots display several conceivable configurations. The plots show how balancing these three elements is necessary for the best system design to achieve a dependable power source.
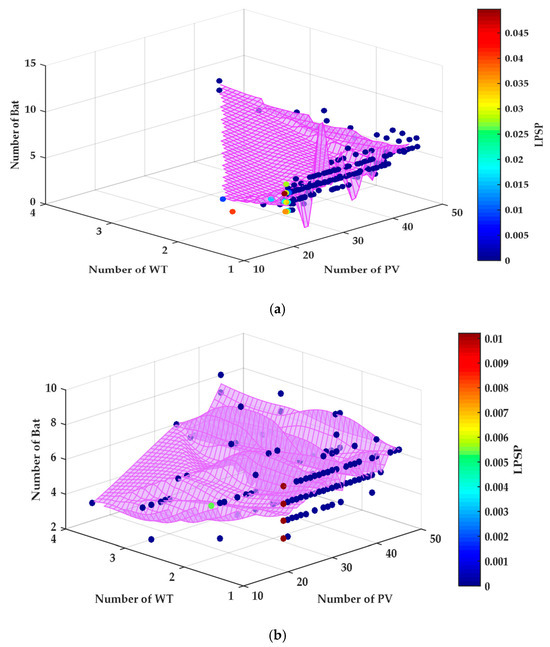
Figure 20.
Numbers of HRES components: (a) NSGAII and (b) MOPSO.
When NSGA-II and MOPSO are compared, significant variations in their optimization performance are shown in Figure 21. The LPSP and CoE trade-offs are successfully explored by NSGA-II, which offers a wide range of optimal solutions, shown in Figure 22. With competitive CoE values and a low LPSP, it finds several options. On the other hand, MOPSO provides very little CoE diversity but produces solutions with an extremely low LPSP. Because NSGA-II balances cost-effectiveness and dependability, it is more effective in multi-objective optimization.
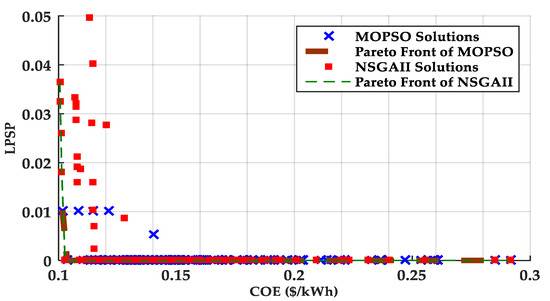
Figure 21.
Comparison between NSGAII and MOPSO.
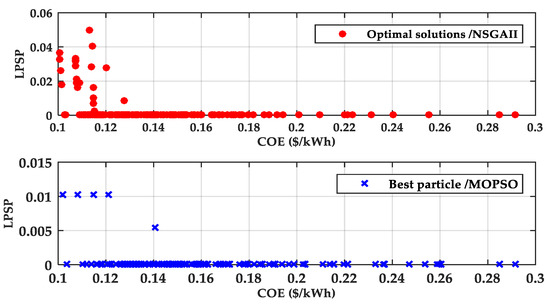
Figure 22.
The optimal solutions with NSGAII and MOPSO.
The objective of this study is to minimize both LPSP and CoE to determine the optimal combination of system components for reliable and cost-effective electricity production. The comparison between NSGA-II and MOPSO is based on their Pareto front approximations and solution distributions:
- ▪
- NSGA-II generates more solutions, covering a broader range of LPSP and CoE values.
- ✓
- MOPSO generates fewer solutions compared to NSGA-II.
- ▪
- The Pareto front of NSGA-II is more widely spread, indicating better diversity and a more extensive exploration of the trade-off between system reliability and economic feasibility.
- ✓
- The Pareto front of MOPSO is more compact, suggesting a limited exploration of the solution space.
- ▪
- NSGA-II appears to offer a more diverse set of optimal solutions, allowing for a more flexible selection of system configurations.
- ✓
- MOPSO’s Pareto front is more restricted.
7.1. Evaluation of NSGAII and MOPSO with Hypervolume Parameter
To find the best algorithm that minimizes both the LPSP and CoE, we will calculate the hypervolume indicator (HV), shown in Figure 23. The hypervolume measures the space dominated by a set of solutions compared to a reference point. The larger the hypervolume, the more efficient the set of solutions.
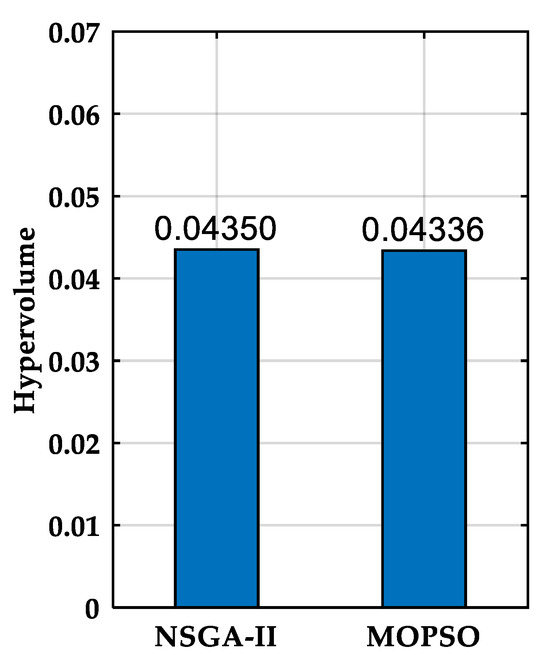
Figure 23.
HV of NSGAII and MOPSO.
HV (NSGA-II) > HV (MOPSO): so, NSGA-II better explores the space of solutions.
7.2. Evaluation of Algorithms with Statistical ANOVA
While the hypervolume indicator is widely employed to evaluate Pareto front quality, it may not suffice for a statistically robust comparison. Given the stochastic nature of NSGA-II and MOPSO, their performance can fluctuate across runs. To account for this variability, each algorithm was executed 10 times under the same conditions, and the resulting LPSP and COE values were examined using a one-way ANOVA test to determine whether the group means differ significantly. The p-value, representing the probability of obtaining the observed results (or more extreme) if the null hypothesis is true, was below 0.05, confirming that the differences between NSGA-II and MOPSO are statistically significant and supporting the robustness of the comparison.
The ANOVA results () confirm that the performance differences between NSGA-II and MOPSO in terms of LPSP and COE are statistically significant, as shown in Table 8.

Table 8.
Statistical performance obtained from the ANOVA test.
Table 9 compares the configurations generated by the NSGA-II and MOPSO algorithms for a PV/WT/Battery system, evaluating the NPV, NWT, and NBat along with the LPSP, CoE, and NPC. Configurations are assessed against the maximum allowable area, and acceptance or rejection is indicated based on whether the area exceeds the limit. Only configurations that meet the area constraint and provide acceptable LPSP, CoE, and NPC values are accepted.

Table 9.
Comparison between results of PSO and NSGA-II.
Based on the results obtained from the two optimization algorithms, MOPSO and NSGA-II, the NSGA-II algorithm outperforms the MOPSO algorithm.
Figure 24 illustrates the power output of each individual component.
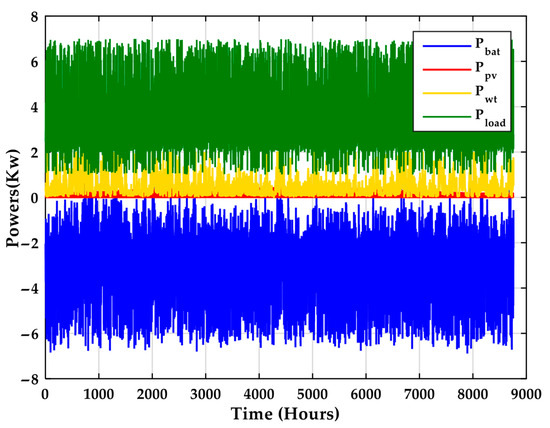
Figure 24.
Annual evolutions of different powers in NSGA-II.
In emergencies or during autonomy days, a DG is used as a supplementary solution. We assume that only a single diesel generator will be utilized, considering the variations in meteorological data and power demand.
Our work can be implemented in real-world applications as a multifunctional container suitable for various sectors, including leisure and tourism, where it can serve as a mobile camping unit or an eco-friendly travel accommodation. In emergency response, it can be used as a rapid deployment shelter or a disaster relief unit. In the healthcare sector, it can function as a mobile clinic, a vaccination unit, or a telemedicine hub. For military and defense purposes, it can be transformed into a portable command center or a field hospital. It can also be used as a food distribution center or refugee shelter for humanitarian purposes. It can be used as a remote learning center or a mobile classroom for training and education.
In the energy and sustainability sector, it can be transformed into a stand-alone power station or a renewable energy hub. Figure 25 illustrates how its adaptability makes it a useful option for a range of situations and purposes.
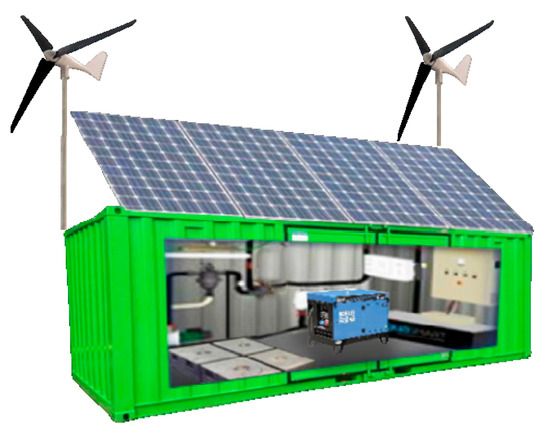
Figure 25.
Real-world application.
The household power consumption and the power contributions from the PV and WT systems for the first 10 days of January are shown in Figure 26. During the first 10 days of January, Figure 27 shows the power contributions from PV, WT, and DG systems, as well as the household power consumption. The DG uses LPSP = 0 to make up for the lack of energy demand due to low irradiation levels.
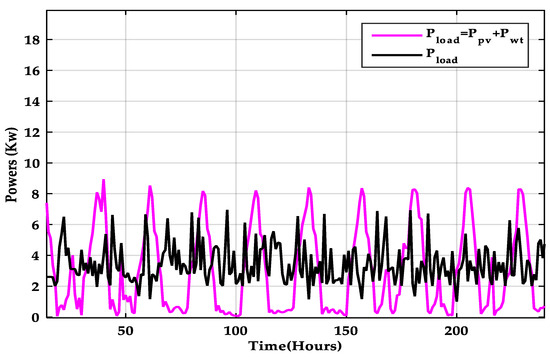
Figure 26.
PV and WT power output during the first ten days of January.
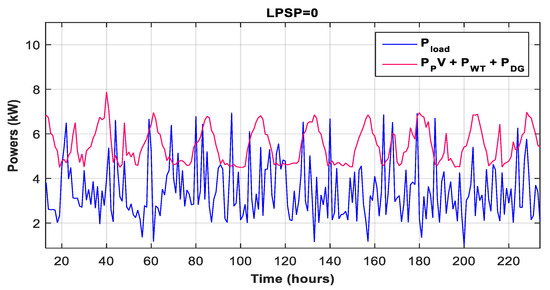
Figure 27.
PV, WT, and DG power output and Pload during first ten days of January.
As seen in Figure 26, the household demand for electricity and PV and WT power contributions during the first ten days of January can be seen as follows:
Figure 27 shows the power contributions from PV, WT, and DG systems, as well as the home power demand throughout the first ten days of January.
8. Conclusions
This paper proposes a general and flexible methodology for the optimal sizing of a standalone HRES constituted by PVs, WTs, batteries, and a DG. Through the use of advanced multi-objective optimization algorithms, NSGAII and MOPSO, the system achieves a balance between minimizing the CoE and ensuring high reliability, as measured by the LPSP.
The findings indicate that good HRES configurations can enhance sustainability and energy reliability. The systems serve the energy demand effectively while minimizing the load shedding risk by obtaining a renewable share for energy greater than 95% and an LPSP lower than 0.05.
Moreover, it is possible to obtain an economic benefit by selling surplus power generated by the hybrid system to the grid, and the cost reduction rate ranges from 1% to 10%. This illustrates the opportunity for financial cooperation between RESs and the grid.
A comparative analysis demonstrates that NSGAII provides a wider and more evenly distributed set of trade-off solutions, attributed to its higher HV (HV = 0.04350) and (HV = 0.04336) for MOPSO. This implies that NSGA-II is a better option for multi-objective optimization in related applications since it can more efficiently explore the solution space. Moreover, to reinforce this conclusion, a one-way ANOVA test was performed on the results (LPSP and COE), and the obtained p-values (<0.05) confirmed that the performance differences between NSGA-II and MOPSO are statistically significant.
Nevertheless, there are several limitations regarding this study. It is assumed that actual load profiles and generation patterns in the interconnection differ from the ones in the optimization problem. Furthermore, the study limits the selection of some technologies (PV, WT, DG, and batteries) by not including new alternatives like hydrogen systems, for instance, or advanced storage.
Future studies should focus on system performance, economic viability, and maintenance to validate the suggested methodology through long-term monitoring and real-world deployment. A complete sensitivity analysis is also suggested to test system resilience and flexibility with respect to uncertain factors, by varying critical parameters, namely fuel prices, solar irradiation, and load shapes. Additionally, alternative topologies (AC, DC, and AC-DC hybrid buses) can be compared to find the optimal designs for targeted applications and environments.
Modeling battery degradation, which is needed for a proper life cycle cost analysis, is a key future work direction. This is to be understood in terms of charge/discharge cycles, temperature influences, Depth of Discharge (DoD), etc. This can be very helpful in prolonging the battery life by enhancing SoC management using AI-based or rule-based dynamic control.
The application of machine learning and deep learning-based techniques has great potential in increasing the prediction accuracy (load and renewable generation), adaptive energy management, and real-time optimization of system operation.
Finally, expanding the scope to include other renewable energy sources (e.g., biomass, hydroelectricity) and implementing HRES in mobile container structures can increase the scalability, flexibility, and deployability of the system, making it suitable for use in residential and commercial areas in remote environments or emergency situations.
Author Contributions
Conceptualization, A.H.S. and L.S.; methodology, A.H.S.; software, A.H.S.; validation, A.H.S., L.S., M.B. and M.S.; formal analysis, A.H.S.; investigation, A.H.S.; resources, A.H.S.; data curation, A.H.S.; writing—original draft preparation, A.H.S.; writing—review and editing, L.S. and M.B.; visualization, M.B.; supervision, L.S. and M.B.; project administration, L.S. All authors have read and agreed to the published version of the manuscript.
Funding
This research received no external funding.
Data Availability Statement
Dataset available on request from the authors.
Conflicts of Interest
The authors declare no conflicts of interest.
Abbreviations
The following abbreviations are used in this manuscript:
| Nomenclature | |
| PPV | The power generated by each PV panel |
| PrPV | The rated power of the PV panel |
| SRref | Solar radiation under reference conditions |
| NT | The panel temperature coefficient (−3.7 × 10⁻³ (1/°C)) |
| TC | The cell temperature |
| Tair | The ambient temperature |
| TNO | The normal operating temperature |
| PPVT | The total power produced by PV |
| NPV | Number of PV panels |
| PWT | Wind turbine output power |
| NWT | Number of wind turbines |
| NBat | Number of batteries |
| Ninv | Number of inverters |
| Vc | Cut-in speed |
| Vr | Nominal speed |
| Vmax | Cut-off speed |
| Pr | Rated wind turbine power |
| v(t) | Wind speed |
| Cb | Capacity of battery |
| EL | The daily energy per day |
| ηinv | Inverter efficiency |
| DoDmax | Maximal battery depth of discharge |
| Pload | Load power |
| PBat | Battery power |
| SoCmax | Maximal state of charge of the battery |
| SoCmin | Minimal state of charge of the battery |
| VBat | Battey tension |
| CM&O | Operation and maintenance costs |
| CRep | Replacement costs |
| CT | Capital cost |
| CFuel | Fuel cost |
| SA | The salvage value of the components |
| CPV | Cos of PV |
| LPV | Lifetime of PV |
| L | The annual interest rate |
| Maintenance cost of PV | |
| Maintenance cost of the battery | |
| Maintenance cost of the inverter | |
| Battery replacement costs | |
| Inverter replacement costs | |
| Diesel replacement costs | |
| PV investment costs | |
| WT investment costs | |
| Diesel investment costs | |
| Battery investment costs | |
| Inverter investment costs | |
| Greek symbols | |
| τ | System lifetime |
| δ | Self-battery rate |
| ηb | Battery efficiency |
| Abbreviation | |
| AD | Autonomy Day |
| AI | Artificial Intelligence |
| CoE | Cost of Energy |
| DG | Diesel Generator |
| DoD | Depth of Discharge |
| EMS | Energy Management Strategies |
| FC | Fuel Consumption |
| GA | Genetic Algorithms |
| HRES | Hybrid Renewable Energy Systems |
| HOMER | Hybrid Optimization of Multiple Energy Resources |
| LPSP | Loss of Power Supply Probability |
| M&O | Maintenance and Operations |
| NPC | Net Present Cost |
| NSGA-II | Non-Dominated Sorting Genetic Algorithm II |
| MOPSO | Multi-Objective Particle Swarm Optimization |
| PV | Photovoltaic |
| RESs | Renewable Energy Sources |
| Simp | System Implementation |
| SoC | State of Charge |
| WTs | Wind Turbines |
| HV | Hypervolume Indicator |
| SR | Solar Radiation |
References
- Al Busaidi, A.S.; Kazem, H.A.; Al-Badi, A.H.; Khan, M.F. A review of optimum sizing of hybrid PV–Wind renewable energy systems in Oman. Renew. Sustain. Energy Rev. 2016, 53, 185–193. [Google Scholar] [CrossRef]
- Berna-Escriche, C.; Álvarez-Piñeiro, L.; Blanco, D.; Rivera, Y. Optimizing Sustainable Energy Transitions in Small Isolated Grids Using Multi-Criteria Approaches. Appl. Sci. 2025, 15, 7644. [Google Scholar] [CrossRef]
- Slama, A.H.; Toumi, S.; Saidi, M.; Saidi, L. HRES systems state of the art: Topologies, sizing approaches, and evaluation criteria. In Proceedings of the 2023 International Conference on Control, Automation and Diagnosis (ICCAD), Rome, Italy, 10–12 May 2023; pp. 1–6. [Google Scholar] [CrossRef]
- Rivera, Y.; Blanco, D.; Bastida-Molina, P.; Berna-Escriche, C. Assessment of a Fully Renewable System for the Total Decarbonization of the Economy with Full Demand Coverage on Islands Connected to a Central Grid: The Balearic Case in 2040. Machines 2023, 11, 782. [Google Scholar] [CrossRef]
- Zhou, W.; Lou, C.; Li, Z.; Lu, L.; Yang, H. Current status of research on optimum sizing of stand-alone hybrid solar–wind power generation systems. Appl. Energy 2010, 87, 380–389. [Google Scholar] [CrossRef]
- Singh, A.; Baredar, P.; Gupta, B. Techno-economic feasibility analysis of hydrogen fuel cell and solar photovoltaic hybrid renewable energy system for academic research building. Energy Convers. Manag. 2017, 145, 398–414. [Google Scholar] [CrossRef]
- Fathy, A. A reliable methodology based on mine blast optimization algorithm for optimal sizing of hybrid PV-wind-FC system for remote area in Egypt. Renew. Energy 2016, 95, 367–380. [Google Scholar] [CrossRef]
- Yi, L.; Li, G.; Chen, K.; Liu, Q.; Liu, J. Optimal scheduling of residential houses with optimal photovoltaic energy utilization strategy using improved multi-objective equilibrium optimizer algorithm. J. Build. Eng. 2022, 59, 105102. [Google Scholar] [CrossRef]
- Tina, G.; Gagliano, S.; Raiti, S. Hybrid solar/wind power system probabilistic modelling for long-term performance assessment. Sol. Energy 2006, 80, 578–588. [Google Scholar] [CrossRef]
- Jakhrani, A.Q.; Othman, A.K.; Rigit, A.R.H.; Samo, S.R.; Kamboh, S.A. A novel analytical model for optimal sizing of standalone photovoltaic systems. Energy 2012, 46, 675–682. [Google Scholar] [CrossRef]
- Razmi, D.; Babayomi, O.; Davari, A.; Rahimi, T.; Miao, Y.; Zhang, Z. Review of Model Predictive Control of Distributed Energy Resources in Microgrids. Symmetry 2022, 14, 1735. [Google Scholar] [CrossRef]
- Kirubakaran, S.; Nagarajan, V.; Dhayapulley, S.C.K.; Soubache, I.D.; Pasupuleti, S.R.; Kumar, A.; Vasudevan, S. Hybrid deep learning-based grid-supportive renewable energy systems for maximizing power generation using optimum sizing. Electr. Power Compon. Syst. 2023, 51, 1597–1611. [Google Scholar] [CrossRef]
- Irakoze, A.; Kim, K.H. Applying machine learning algorithms to group the energy performance of existing buildings by different granularity level of energy data. Int. J. Green Energy 2024, 22, 1650–1665. [Google Scholar] [CrossRef]
- Abdalla, A.N.; Nazir, M.S.; Tao, H.; Cao, S.; Ji, R.; Jiang, M.; Yao, L. Integration of energy storage system and renewable energy sources based on artificial intelligence: An overview. J. Energy Storage 2021, 40, 102811. [Google Scholar] [CrossRef]
- Amara, S.; Toumi, S.; Salah, C.B.; Saidi, A.S. Improvement of techno-economic optimal sizing of a hybrid off-grid micro-grid system. Energy 2021, 233, 121166. [Google Scholar] [CrossRef]
- Saleeb, H.; El-Rifaie, A.M.; Sayed, K.; Accouche, O.; Mohamed, S.A.; Kassem, R. Optimal Sizing and Techno-Economic Feasibility of Hybrid Microgrid. Processes 2025, 13, 1209. [Google Scholar] [CrossRef]
- Vaccari, M.; Mancuso, G.M.; Riccardi, J.; Cantù, M.; Pannocchia, G. A sequential linear programming algorithm for economic optimization of hybrid renewable energy systems. J. Process Control 2019, 74, 189–201. [Google Scholar] [CrossRef]
- Rad, M.A.V.; Toopshekan, A.; Rahdan, P.; Kasaeian, A.; Mahian, O. A comprehensive study of techno-economic and environmental features of different solar tracking systems for residential photovoltaic installations. Renew. Sustain. Energy Rev. 2020, 129, 109923. [Google Scholar] [CrossRef]
- Ruan, P.; Su, Q.; Zhang, L.; Luo, J.; Diao, Y.; Xie, L.; Zheng, H. Optimal Siting and Sizing of Hybrid Energy Storage Systems in High-Penetration Renewable Energy Systems. Energies 2025, 18, 2196. [Google Scholar] [CrossRef]
- Ramli, M.A.; Bouchekara, H.R.E.H.; Alghamdi, A.S. Optimal sizing of PV/wind/diesel hybrid microgrid system using multi-objective self-adaptive differential evolution algorithm. Renew. Energy 2018, 121, 400–411. [Google Scholar] [CrossRef]
- Borhanazad, H.; Mekhilef, S.; Ganapathy, V.G.; Modiri-Delshad, M.; Mirtaheri, A. Optimization of micro-grid system using MOPSO. Renew. Energy 2014, 71, 295–306. [Google Scholar] [CrossRef]
- Bukar, A.L.; Tan, C.W.; Lau, K.Y. Optimal sizing of an autonomous photovoltaic/wind/battery/diesel generator microgrid using grasshopper optimization algorithm. Sol. Energy 2019, 188, 685–696. [Google Scholar] [CrossRef]
- Javed, M.S.; Ma, T. Techno-economic assessment of a hybrid solar-wind-battery system with genetic algorithm. Energy Procedia 2019, 158, 6384–6392. [Google Scholar] [CrossRef]
- Koholé, Y.W.; Ngouleu, C.A.W.; Fohagui, F.C.V.; Tchuen, G. Optimization of an off-grid hybrid photovoltaic/wind/diesel/fuel cell system for residential applications power generation employing evolutionary algorithms. Renew. Energy 2024, 224, 120131. [Google Scholar] [CrossRef]
- Ge, X.; Liu, Z.; Li, K.; Guo, C.; Shen, G.; Wang, Z. Economic Scheduling Strategy for Multi-Energy-Integrated Highway Service Centers Considering Carbon Trading and Critical Peak Pricing Mechanism. Symmetry 2024, 16, 1110. [Google Scholar] [CrossRef]
- Samy, M.M.; Barakat, S.; Ramadan, H.S. Techno-economic analysis for rustic electrification in Egypt using multi-source renewable energy based on PV/wind/FC. Int. J. Hydrog. Energy 2020, 45, 11471–11483. [Google Scholar] [CrossRef]
- Dong, Z.; Zhang, Z.; Li, Z.; Li, X.; Qin, J.; Liang, C.; Han, M.; Yin, Y.; Bai, J.; Wang, C.; et al. A Survey of Battery–Supercapacitor Hybrid Energy Storage Systems: Concept, Topology, Control and Application. Symmetry 2022, 14, 1085. [Google Scholar] [CrossRef]
- Icaza-Alvarez, D.; Borge-Diez, D. Techno-Economic Analysis and Optimization of the Hybrid System for a Research Campus—Case Study Center for Research, Innovation, and Technology Transfer in Cuenca-Ecuador. Energies 2025, 18, 2746. [Google Scholar] [CrossRef]
- Yazici, M.S.; Yavasoglu, H.A.; Eroglu, M. A mobile off-grid platform powered with photovoltaic/wind/battery/fuel cell hybrid power systems. Int. J. Hydrogen Energy 2013, 38, 11639–11645. [Google Scholar] [CrossRef]
- Alaerjan, A.; Jabeur, R.; Ben Chikha, H.; Karray, M.; Ksantini, M. Improvement of Smart Grid Stability Based on Artificial Intelligence with Fusion Methods. Symmetry 2024, 16, 459. [Google Scholar] [CrossRef]
- Saidi, M.; Eighali, S.B.; Li, Z.; Outbib, R.; Le Roux, T.; Cardone, E. Optimal sizing of mobile hybrid off-grid multi-sources installation. In Proceedings of the IECON 2019—45th Annual Conference of the IEEE Industrial Electronics Society, Lisbon, Portugal, 14–17 October 2019; Volume 1, pp. 2434–2439. [Google Scholar] [CrossRef]
- Modarresi Ghazvini, E.; Olamaei, J. The effects of renewable PV/T and fuel cell combined heat and power generation on optimal design of off-grid integrated power system. Electr. Power Compon. Syst. 2022, 50, 1014–1028. [Google Scholar] [CrossRef]
- Keyvandarian, A.; Saif, A.; Pelot, R. Robust Optimal Sizing of a Stand-Alone Hybrid Renewable Energy System Using Machine Learning-Based Uncertainty Sets. Energies 2025, 18, 1130. [Google Scholar] [CrossRef]
- Rivera-Durán, Y.; Berna-Escriche, C.; Córdova-Chávez, Y.; Muñoz-Cobo, J.L. Assessment of a Fully Renewable Generation System with Storage to Cost-Effectively Cover the Electricity Demand of Standalone Grids: The Case of the Canary Archipelago by 2040. Machines 2023, 11, 101. [Google Scholar] [CrossRef]
- Slama, A.H.; Saidi, M.; Saidi, L. Optimal sizing for renewable hybrid energy systems: A review with some applications. In Proceedings of the 2022 IEEE International Conference on Electrical Sciences and Technologies in Maghreb (CISTEM), Algiers, Algeria, 6–8 December 2022; Volume 4, pp. 1–6. [Google Scholar] [CrossRef]
- Wu, M.; Yang, D.; Zhou, B.; Yang, Z.; Liu, T.; Li, L.; Wang, Z.; Hu, K. Adaptive Population NSGA-III with Dual Control Strategy for Flexible Job Shop Scheduling Problem with the Consideration of Energy Consumption and Weight. Machines 2021, 9, 344. [Google Scholar] [CrossRef]
- Elbouchikhi, E.; El Moubarek, A.B.; Abouloifa, A.; El Aroudi, A.; Benbouzid, M. Active disturbance rejection control for four-wire inverters in standalone renewable resources-based microgrid—Islanded microgrids ADRC-based control. ISA Trans. 2025, 156, 290–306. [Google Scholar] [CrossRef]
- Atteya, A.I.; Ali, D.; Sellami, N. Multi-Objective Dynamic System Model for the Optimal Sizing and Real-World Simulation of Grid-Connected Hybrid Photovoltaic-Hydrogen (PV-H2) Energy Systems. Energies 2025, 18, 578. [Google Scholar] [CrossRef]
- Mahmoud, F.S.; Diab, A.A.Z.; Ali, Z.M.; El-Sayed, A.H.M.; Alquthami, T.; Ahmed, M.; Ramadan, H.A. Optimal sizing of smart hybrid renewable energy system using different optimization algorithms. Energy Rep. 2022, 8, 4935–4956. [Google Scholar] [CrossRef]
- Zhao, Y.; Yang, S.; Liu, S.; Zhang, S.; Zhong, Z. Optimal Economic Research of Microgrids Based on Multi-Strategy Integrated Sparrow Search Algorithm under Carbon Emission Constraints. Symmetry 2024, 16, 388. [Google Scholar] [CrossRef]
- Yimen, N.; Tchotang, T.; Kanmogne, A.; Abdelkhalikh Idriss, I.; Musa, B.; Aliyu, A.; Dagbasi, M. Optimal sizing and techno-economic analysis of hybrid renewable energy systems—A case study of a photovoltaic/wind/battery/diesel system in Fanisau, Northern Nigeria. Processes 2020, 8, 1381. [Google Scholar] [CrossRef]
- Vachhani, V.L.; Dabhi, V.K.; Prajapati, H.B. Improving NSGA-II for solving multi objective function optimization problems. In Proceedings of the 2016 International Conference on Computer Communication and Informatics (ICCCI), Coimbatore, India, 4–6 January 2016; pp. 1–6. [Google Scholar] [CrossRef]
- Ren, H.; Lu, Y.; Wu, Q.; Yang, X.; Zhou, A. Multi-objective optimization of a hybrid distributed energy system using NSGA-II algorithm. Front. Energy 2018, 12, 518–528. [Google Scholar] [CrossRef]
- Ghafoor, A.; Aldahmashi, J.; Apsley, J.; Djurović, S.; Ma, X.; Benbouzid, M. Intelligent Integration of Renewable Energy Resources Review: Generation and Grid Level Opportunities and Challenges. Energies 2024, 17, 4399. [Google Scholar] [CrossRef]
- Atteya, A.I.; Ali, D. Benchmarking a Novel Particle Swarm Optimization Dynamic Model Versus HOMER in Optimally Sizing Grid-Integrated Hybrid PV–Hydrogen Energy Systems. Eng 2024, 5, 3239–3258. [Google Scholar] [CrossRef]
Disclaimer/Publisher’s Note: The statements, opinions and data contained in all publications are solely those of the individual author(s) and contributor(s) and not of MDPI and/or the editor(s). MDPI and/or the editor(s) disclaim responsibility for any injury to people or property resulting from any ideas, methods, instructions or products referred to in the content. |
© 2025 by the authors. Licensee MDPI, Basel, Switzerland. This article is an open access article distributed under the terms and conditions of the Creative Commons Attribution (CC BY) license (https://creativecommons.org/licenses/by/4.0/).